Introduction. Disorder of eating behaviour Disorder of embodiment Disorder of identity.

Chapter 3
Chemical Order-Disorder Transformations
82
INTRODUCTION
Order-disorder transformation in binary and ternary alloy systems
is one of the fascinating and extensively studied fields for many years [1-10].
The formations of different ordered phases governed by the thennodynamic
equilibrium conditions and the kinetics of their formation decided by the
atomic diffusion as well as activation energy barriers have been studied by
various researchers. The ordered phases between two metals are known as
intermetallics. The high temperature properties of the intermetallics, like better
strength, corrosion/oxidation resistance are very promising for their wide
applications [ref 6 of chapter 1]. Frequently the disadvantage of the
intermetallics is their low ductility and fracture toughness at low temperatures.
The method of high energy ball milling to produce alloys is found to be
suitable to overcome these drawbacks by refining the grains to smaller sizes,
introducing atomic disorder in the lattice and in some cases stabilizing higher
symmetry structure than the equilibrium relatively lower symmetry structures
[11, ref 43 of chapter 1]. It has also been long known that partially ordered
phases are stronger than those wholly disordered or fully ordered (because at a
certain value of the long-range order parameter, L, superdislocations separate
into unlinked singles). It was shown that the microhardness of mechanically
milled Ni3Al powders exhibited a pronounced sharp maximum corresponding
to L = 0.5 [Ref 65 of chapter 1]. This work suggests that the greater is the
ordering energy; the steeper will be this maximum of strength (or hardness).
Thus, it is of interest to study the mechanical behavior of materials in various
states of partial order. Disordering phenomena of ordered alloys have also been
studied to understand the mechanism of disordering and also to produce the
disordered material that has a higher ductility/formability than the ordered
alloy. The atomic disorder in an intermetallic can be manifested in three
different ways [12]. Firstly, the two atomic species involved can occupy the
83
"wrong" sublattices and this is referred to as anti-site disorder. This introduces
strain into the lattice but maximum upto 3 % [ref 46 of chapter 1]. This type of
disorder was observed in a number of mechanically milled compounds with the
L12 structure, e.g., N13AI, N13S1, Fe^Ge and those with the B2 structure, e.g.,
CoGa and AlRu. Secondly, triple-defects can be generated. In an equiatomic
compound such as CoGa, for example, the transition metal Co atoms can
substitute on the Ga lattice, and this is anti-site disorder. But, the Ga atoms stay
on their own lattices. This leads to the presence of vacancies in the Co lattice to
maintain the stoichiometry. Thus, vacancies on the Co-sublattice in
combination with Co anti-site atoms in a ratio of 2:1 constitute the triple
defects. Third, there could also be redistribution of interstitials wherein the
interstitial atoms in the octahedral sites are transferred to the tetrahedral sites,
e.g., Mn3Sn2, Fe3Ge2. Alloys can be disordered by irradiation [13, 14], rapid
solidification [ref 22 of chapter 1], or heavy plastic deformation through
MM/MA [15]. Large amounts of plastic deformation result in the generation of
a variety of defect structures (dislocations, vacancies, stacking faults, grain
boundaries, etc.) and these destabilize the ordered nature of the lattice leading
to the formation of a disordered (crystalline) or amorphous phase. If the
enthalpy of ordering is high then in some cases alloys tend to become
amorphous after they are chemically disordered [ref 56, 57 of chapter 1, 16,
17]. In some cases such as Al based transition metal alloys [18-25] and
different brass compositions [26, 27] ordered alloys were produced by MA. It
may also be mentioned in passing that all order states (L = 0 to 1) cannot be
accessed by traditional methods of disordering. For example, in equilibrium,
the order parameter for Cu3Au jumps discontinuously from 0.8 to zero at the
critical ordering temperature. But, mechanical milling can be used to obtain
different degrees of order so that the effect of order parameter on structure and
mechanical properties of alloys can be investigated. Ermakov et al. reported the
first observation of disordering of an ordered compound ZnFe2C>4 by MM in
84
1982 [28]. Disordering of Fe^Si by mechanical grinding was reported later [29,
30]. It has been noted that upon milling, the long-range order parameter (L) in
the intermetallic is gradually reduced and, in many cases, the material may
become totally disordered (L = 0), e.g., N13AI [31, ref 65 of chapter 1]- this is a
permanently LI2 ordered intermetallic and sustain it's order structure under
other commonly used disordering process but under severe plastic deformation
disordering of the alloy takes place within a milling time of 8 hours. In other
cases, L is reduced with milling time but does not reach L = 0, i.e., partial order
and partial disorder co-exist, e.g, CuTi [32] and AlRu [ref 64 of chapter 1]. In
other cases, the L value does not decrease at all and is maintained at L = 1; but,
with continued milling the material becomes amorphous, e.g,, CoZr [ref 60 of
chapter 1].
Among the various techniques (e.g. powder X-ray diffraction,
measurement of superconducting transition temperature, specific heats,
magnetic susceptibility, determining coefficient of thermal expansion,
differential scanning calorimetry, etc.) used to study the order-disorder
transformations, Mossbauer spectroscopic technique is very powerful (as we
will see shortly) to determine the short-range order (SRO) parameter with high
accuracy.
There have also been several studies on reordering of disordered phases
[33-36]. For the nanocrystalline disordered alloys we need to consider grain
growth also apart from ordering. It was reported that on heating the milled
powder in a differential scanning calorimeter (DSC), two distinct exothermic
peaks were observed. The transformations that occurred were irreversible. The
low-temperature low-intensity peak is attributed to the re-establishment of
short-range order. This was confirmed by the results obtained from electron
energy loss fine structure studies. The absence of such a peak during reheating
of mechanically milled elemental powders also indirectly confirms this
hypothesis since chemical reordering cannot occur in pure metal powders. The

85
second major peak is associated with the simultaneous evolution of ordering
and grain growth. The apparent activation energy for the transformation is
found to be lower than expected during ordering of a conventional alloy. The
explanation could be that the high density of point defects such as vacancies
and anti-site defects, generated during milling, assist the diffusive processes
and help in achieving reordering easily.
Most of the mechanically milled disordered intermetallics exhibit these
two peaks in their DSC plots, with the difference that the actual temperatures
and peak shapes and heights could be different depending on the nature and
composition of the alloy and milling time. In ternary intermetallics, however, a
third low intensity peak, often overlapping the second major peak, is observed.
Although a clear explanation is not available for this it is thought that this
could be due to annealing out of dislocations, usually not mobile at
temperatures as low as those of the first two peaks.
In this chapter we will discuss the temporal evolution of SRO
parameter in various Fe based binary and quasi and pseudo binary
nanocrystalline alloys from an initial disordered state. The so-called 'kinetic
path' (the path spanned in the space of two order parameters) approach will be
discussed and used. The grain growth behavior in these alloys will also be
discussed. An attempt will be made to correlate ordering, microstructure
formation and grain growth behaviours. In section 3.1 binary Fe-Al, Fe-Ge
alloy systems will be discussed, in section 3.2 pseudo binary Fe-Mn-Ge alloy
system and in section 3.3 quasi binary Fe-Co-X (X = Mo, Ge, W) systems will
be discussed.
3.1 Binary systems
The Fe3X (X= Al, Si, Ge) alloy systems have been intensively
investigated for their ordering behavior both in the microcrystalline [37, ref 27
86
of chapter 2, 38] and nanocrystalline states [39, ref 173 of chapter 1]. The
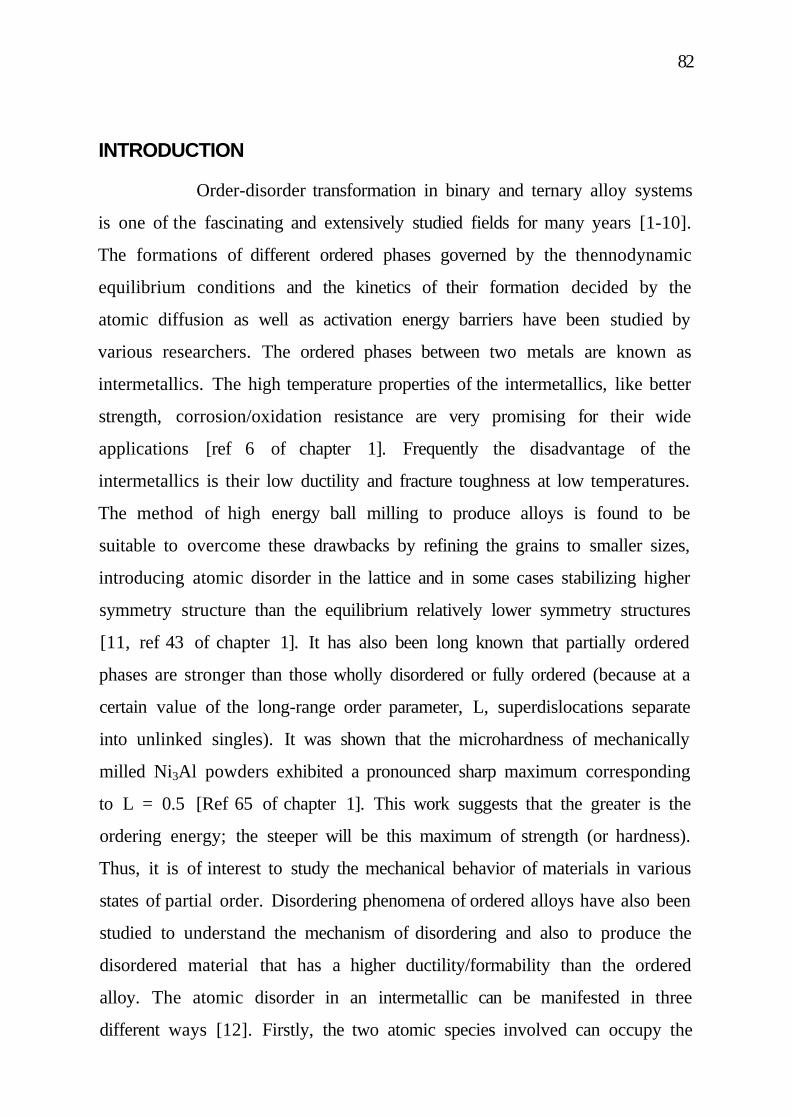
various ordered structures for bcc alloys of A3B stoichiometry have been
enumerated and analyzed by Cahn and his group [40]. Depending on chemical
compositions and signs and strengths of the first and second nearest neighbour
(Inn and 2nn) interactions there are three possible ordered structures (figure
3.1). These structures can be understood by considering a unit cell of lattice
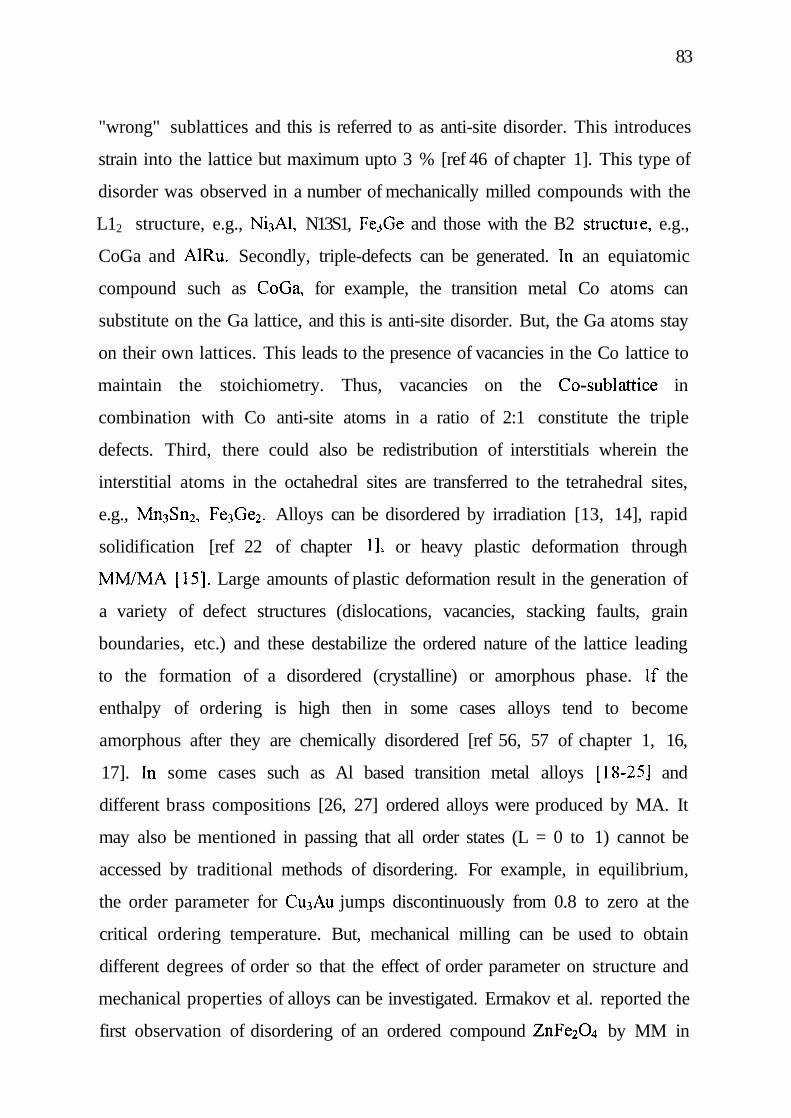
parameter twice than that of the original bcc unit cell. The A and B atoms can
then occupy four possible interpenetrating fee sublattices a, (3, y, and 5 (figure
3.2) in different ways to form these ordered bcc structures which are
designated as B32, B2, and DO3 The disordered bcc phase is labeled as A2.
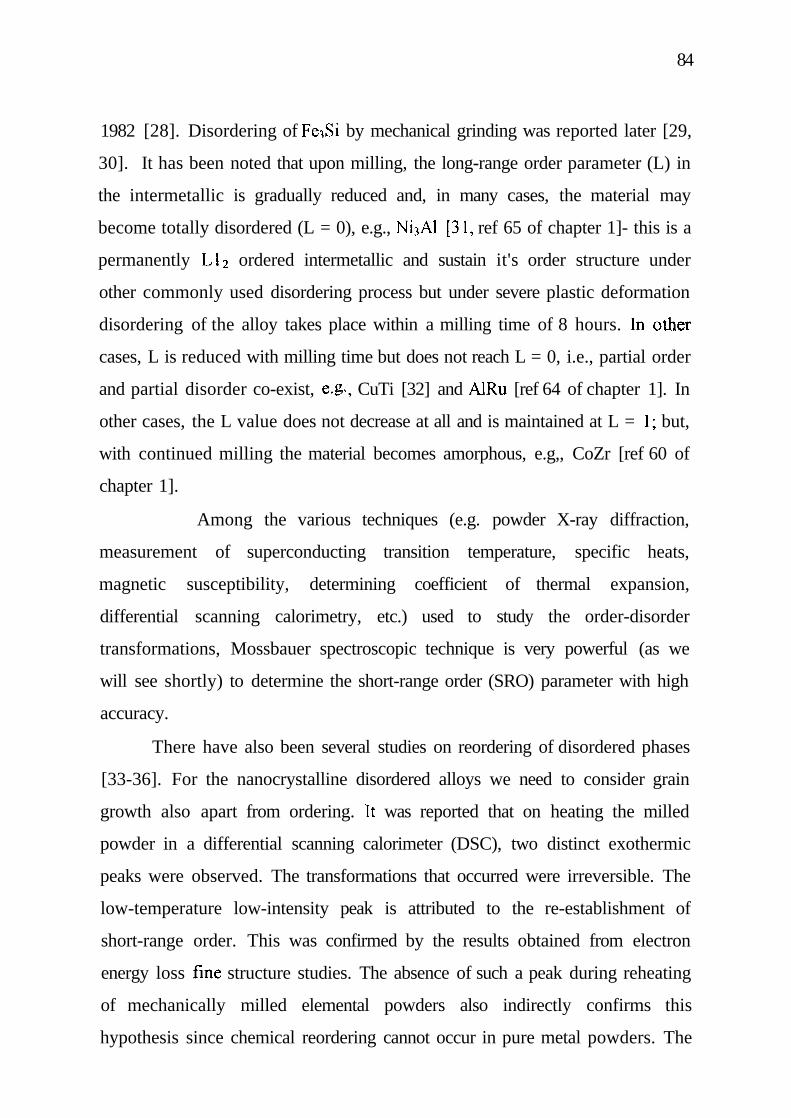
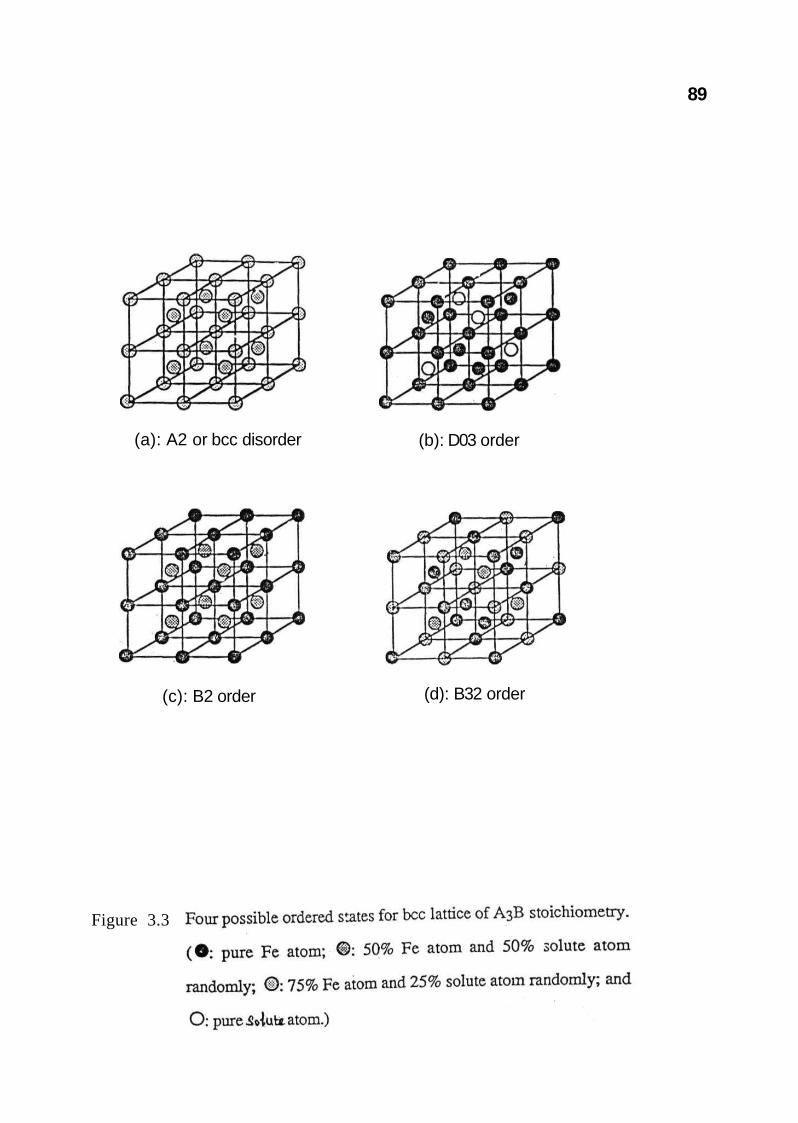
If we consider for example Fe3Al system then in the B32 structure the
adjacent a and y sites are occupied by Fe atoms exclusively and the P and 5
sites are randomly occupied by 50% Fe and 50% Al atoms. For DO3 order Fe
atoms occupy the three sublattices (p, y and 8) whereas Al atoms occupy the
fourth one (a). In case of B2 order two non-adjacent sublattices a and p are
occupied by Fe atoms only whereas the other two y and 5 are randomly
occupied by 50% Fe and 50% Al atoms. These arrangements are shown in
figure 3.3. We can also calculate the probability distributions of solute atom
(Al) occupancy in the 1st nearest neighbour (Inn) shell of solvent atoms (Fe)
for different ordered phases and also of the disordered phase in the following
manner.
In the A2 structure the random distribution of the atoms over the lattice
sites gives rise to a binomial distribution:
PA2(X) = 8 C X (0 .25) X (1-0 .25) ' - X (3.1)
where x = 0, 1, 2, ..., 8 are the number of Inn Al atoms surrounding a given Fe
site.
For the B32 ordered structure, the Al atoms are distributed randomly on
four sites, instead of all 8 sites, in the Inn shell of Fe. The other 4 sites are

87
Figure 3.1 Ground states for bcc binary alloys of the A3B stoichiometry and
with different 1nn and 2nn interatomic interactions, V1 and V2
respectively.
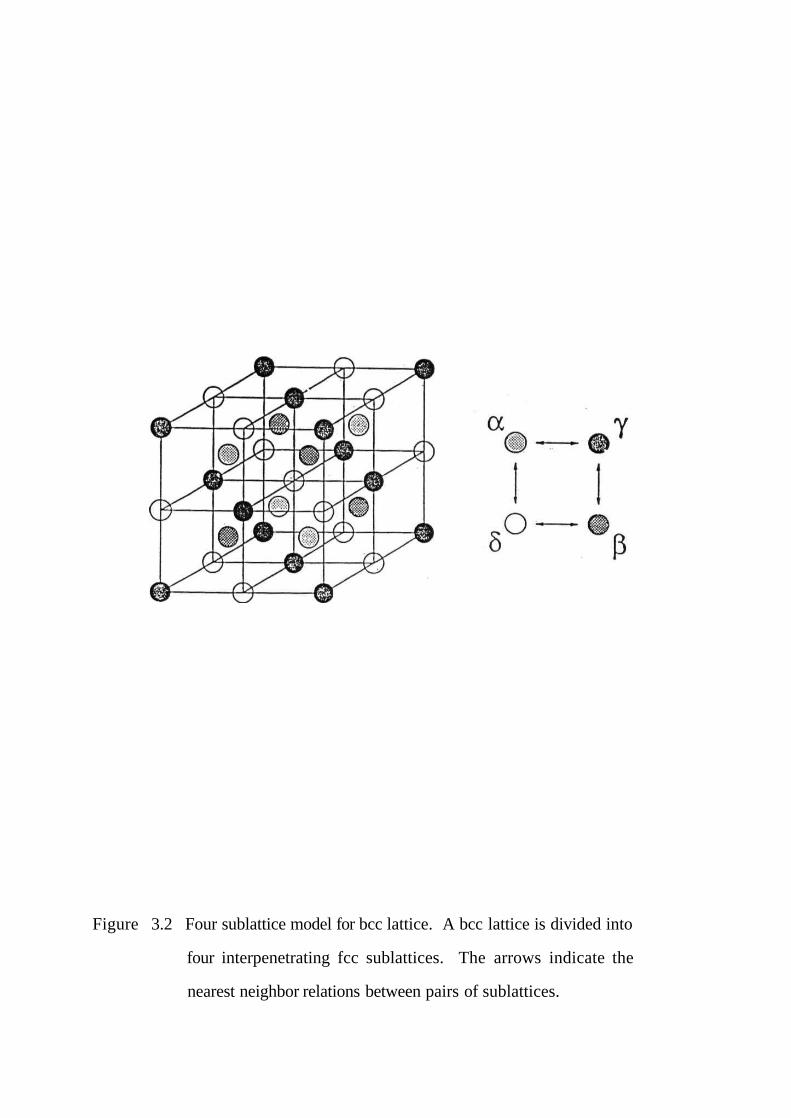
Figure 3.2 Four sublattice model for bcc lattice. A bcc lattice is divided into
four interpenetrating fcc sublattices. The arrows indicate the
nearest neighbor relations between pairs of sublattices.
89
(a): A2 or bcc disorder (b): D03 order
(c): B2 order (d): B32 order
Figure 3.3
90
occupied by other Fe atoms, so the probability distribution for B32 order is still
a binomial distribution but involving only 4 sites of the form:
PB3 2 (X)- 4 C X (0 .5) X (1-0 .5) 4 - X ,X = 0, 1,..,4 (3.2)
In the B2 structure, one third of the Fe atoms (e.g. y site) are surrounded
by 8 Fe atoms and two third of the Fe atoms (e.g. a and (3 sites) are surrounded
by four Fe atoms and four Al atoms distributed randomly giving rise to the
distribution:
PB2 (X) = %(8CX (0.5)x (0.5fx) + K 5(0), x= 0, 1,.., 8. (3.3)
Finally the DO3 order is characterized by the presence of two distinct
near neighbour environments of Fe. One (e.g. Fe atoms at y site), which is
surrounded by 8 Fe atoms, and the other (e.g. Fe atoms at a and (3 sites), which
is surrounded by 4 Fe and 4 Al atoms. The distribution is
Pixa = % 8(4) + 3̂ 5(0) 3.4
The three non-equilibrium sites in the DO3 ordered structure are labeled as
4(a), 4(b), and 8(c) in Wyckoff notation [41]. Ge atoms occupy the 4(a) sites
whereas Fe atoms occupy the 4(b) and 8(c) sites. The 4(b) sites have 8 Fe near
neighbours whereas the 8(c) sites have 4 Fe and 4 Ge near neighbours. This
gives rise to two distinct HMFs for the Fe atom: around 330 kOe for Fe atoms
at 4(b) sites having 8 Fe Inn and around 200 kOe for Fe atom at 8(c) sites
having 4 Fe and 4 Ge Inn [42]. There are twice as many 8(c) sites as 4(b) sites
giving rise to intensity of 200 kOe field to be double of the intensity of the 330
kOe field.
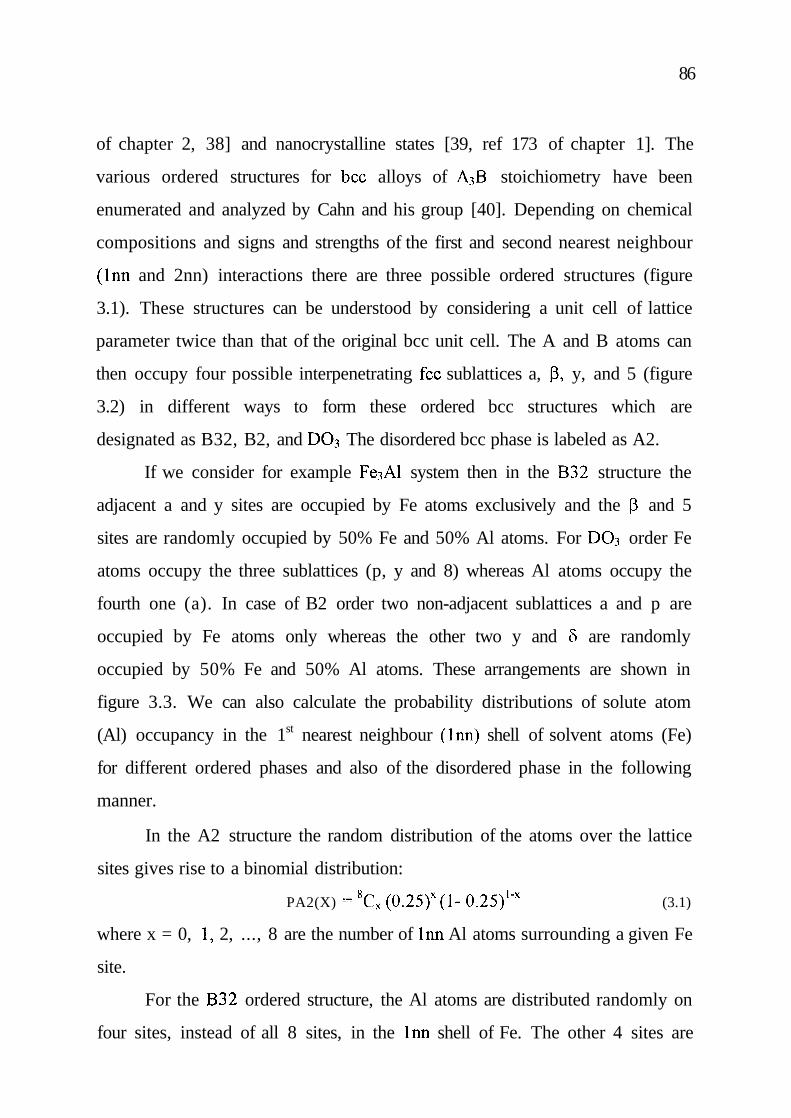
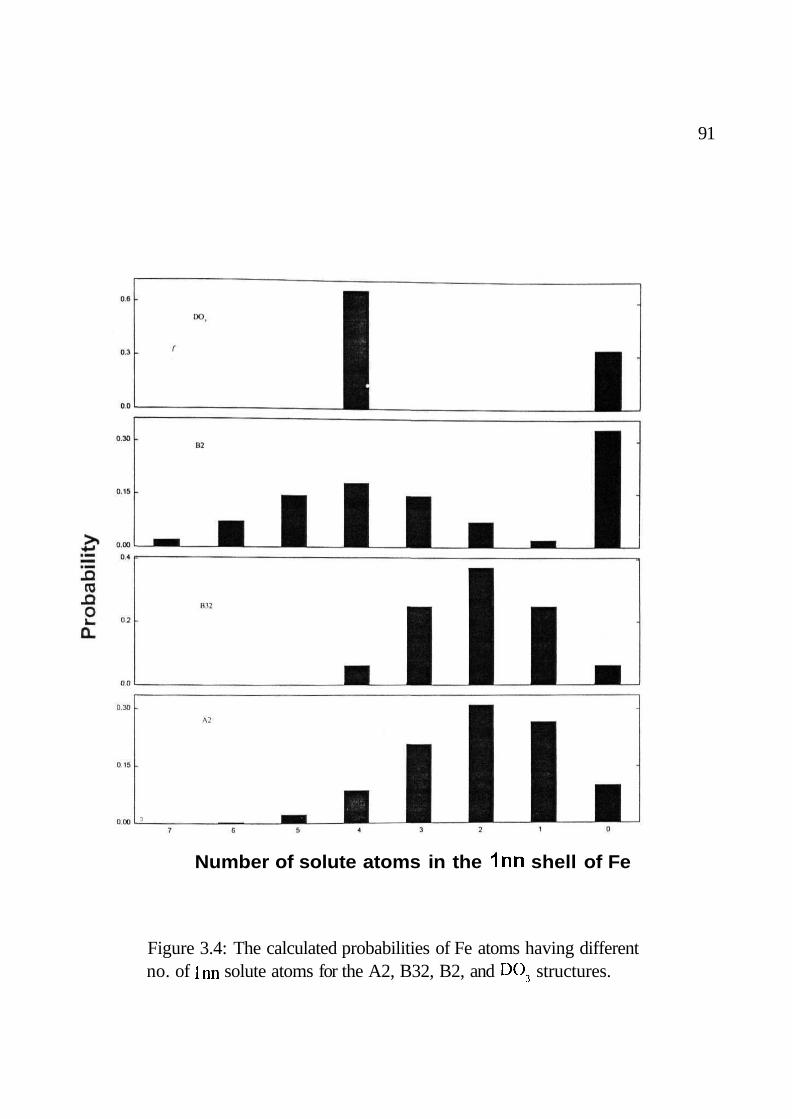
The probability distribution of Al atoms in the first nearest neighbour (Inn)
shell of Fe for these structures is shown in figure 3.4. There is a distinct
probability distribution for each of these ordered structures and the presence of
these structures can be unambiguously observed using a technique such as Fe-
57 Mossbauer spectroscopy, which is sensitive to the local environment around
the Fe atom.
91
Number of solute atoms in the 1nn shell of Fe
Figure 3.4: The calculated probabilities of Fe atoms having differentno. of Inn solute atoms for the A2, B32, B2, and DO3 structures.
92
3.1.1 Fe-Al system
a Introduction
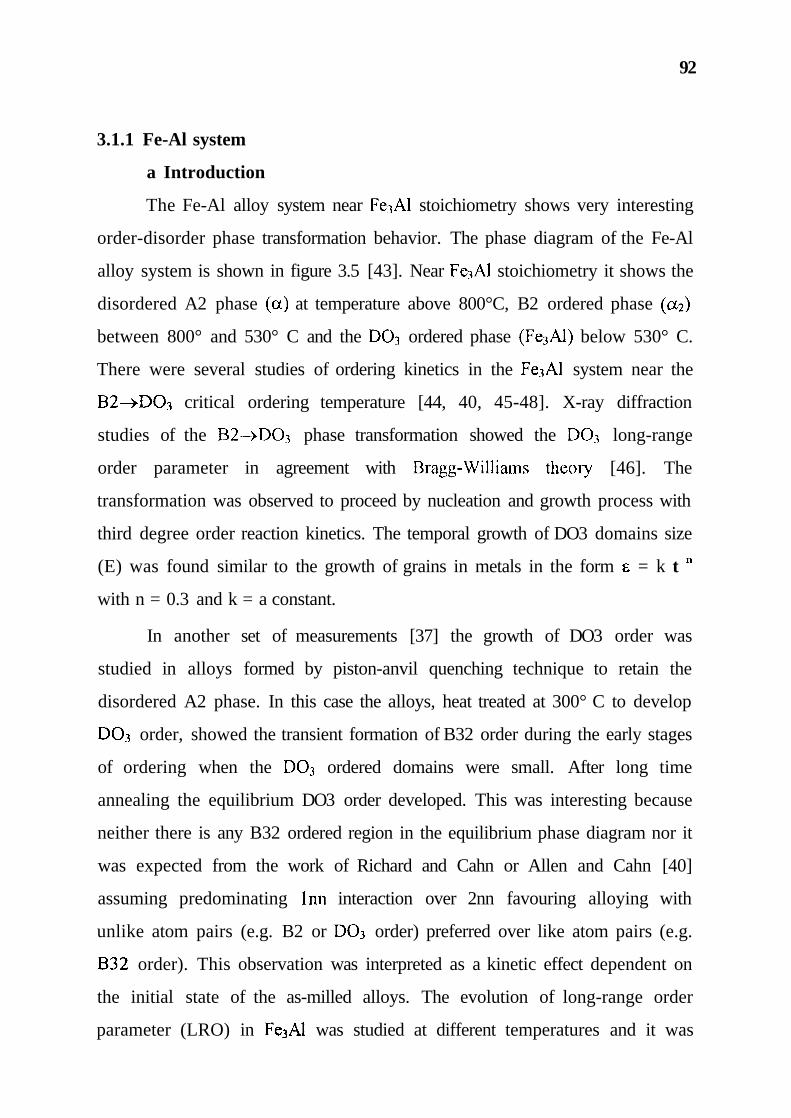
The Fe-Al alloy system near Fe^Al stoichiometry shows very interesting
order-disorder phase transformation behavior. The phase diagram of the Fe-Al
alloy system is shown in figure 3.5 [43]. Near Fe3Al stoichiometry it shows the
disordered A2 phase (a) at temperature above 800°C, B2 ordered phase (CX2)
between 800° and 530° C and the DO3 ordered phase (Fe3Al) below 530° C.
There were several studies of ordering kinetics in the Fe3Al system near the
B2-»DO3 critical ordering temperature [44, 40, 45-48]. X-ray diffraction
studies of the B2—>DO3 phase transformation showed the DO3 long-range
order parameter in agreement with Bragg-Williams theoiy [46]. The
transformation was observed to proceed by nucleation and growth process with
third degree order reaction kinetics. The temporal growth of DO3 domains size
(E) was found similar to the growth of grains in metals in the form 8 = k t "
with n = 0.3 and k = a constant.
In another set of measurements [37] the growth of DO3 order was
studied in alloys formed by piston-anvil quenching technique to retain the
disordered A2 phase. In this case the alloys, heat treated at 300° C to develop
DO3 order, showed the transient formation of B32 order during the early stages
of ordering when the DO3 ordered domains were small. After long time
annealing the equilibrium DO3 order developed. This was interesting because
neither there is any B32 ordered region in the equilibrium phase diagram nor it
was expected from the work of Richard and Cahn or Allen and Cahn [40]
assuming predominating Inn interaction over 2nn favouring alloying with
unlike atom pairs (e.g. B2 or DO3 order) preferred over like atom pairs (e.g.
B32 order). This observation was interpreted as a kinetic effect dependent on
the initial state of the as-milled alloys. The evolution of long-range order
parameter (LRO) in Fe3Al was studied at different temperatures and it was

93
Figure 3.5 Thennodynamic equilibrium phase diagramFor Fe-Al alloy
Phase Composition Structure Prototype(at. % Al)
94
found that the LRO parameters for DO3 order and B2 order developed at
different rates depending on the temperature [49]. This was interpreted with the
help of theoretical model calculations using the kinetic master equation in the
point as well as the pair approximation formalism [49] and by Monte Carlo
simulations [50]. Theoretical calculations for short-range order (SRO)
parameter also showed transient B32 phase formation in agreement with the
above experiments [49]. There was another report of observing B32 order in
Fe-20 at. % Al, [51] but the heat treatment of the sample was not well
controlled.
In the present work we study the ordering transformation behaviour of
nanocrystalline Fe-Al alloys prepared by mechanical alloying in an initial
disordered bcc state far from thennodynamic equilibrium. It is shown that the
presence of small grain sizes and large grain boundary regions has a significant
influence on order-disorder phase transformation. We find that in the
nanophase Fe-Al alloys the development of ordered structures as well as the
ordering kinetics are different as compared to the coarse grained
microcrystalline alloys.
b Experimental
Fe].xAlx (x=0.31 and 0.27) alloys were prepared by direct
mechanical alloying of the elemental Fe (99.99 % + purity, fine gray powder
from Aldrich-Sigma chemicals) and Al (Aluminum shot, 3.2 mm m3N5 from
Ventron-Alfa division) metal powders. Fe contamination from the vial and the
balls was found to be 2-3 atomic % from the chemical analysis of the as-milled
alloy which gave rise to final composition of the as-milled alloys as Feo.72Alo.28
and Fe^Al. The as-milled alloys were subjected to ordering heat treatments at
300° C and 450° C for various periods of times ranging from few tens to few
hundred of hours. Powder XRD and Mossbauer spectroscopic techniques were

95
used to study the grain growth and order disorder phase transformation
behavior of the alloy.
c Results and Discussion
Figure 3.6 shows the X-ray diffraction pattern of the as-milled
Fe3Al alloy. The X-ray spectrum shows the formation of single disordered bcc
phase (A2) alloy. The average grain size estimated from the line width of the
fundamental (110) line was about 10 nm. Similar results were obtained from
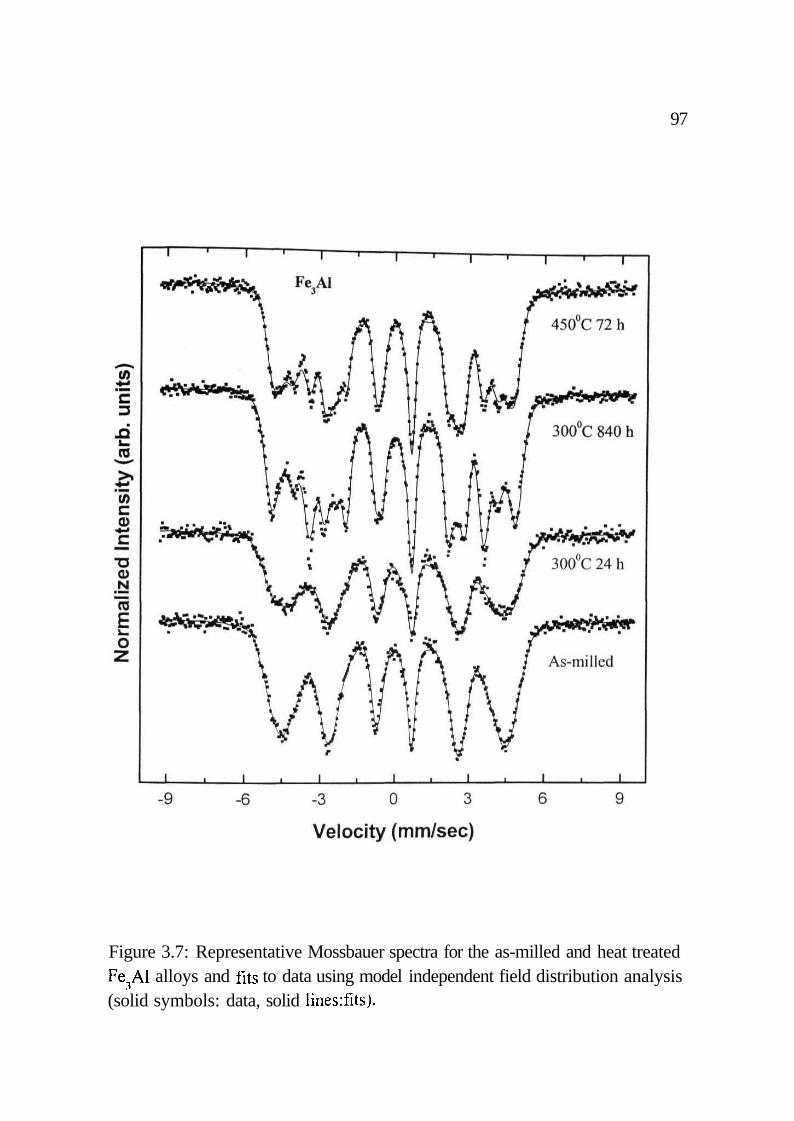
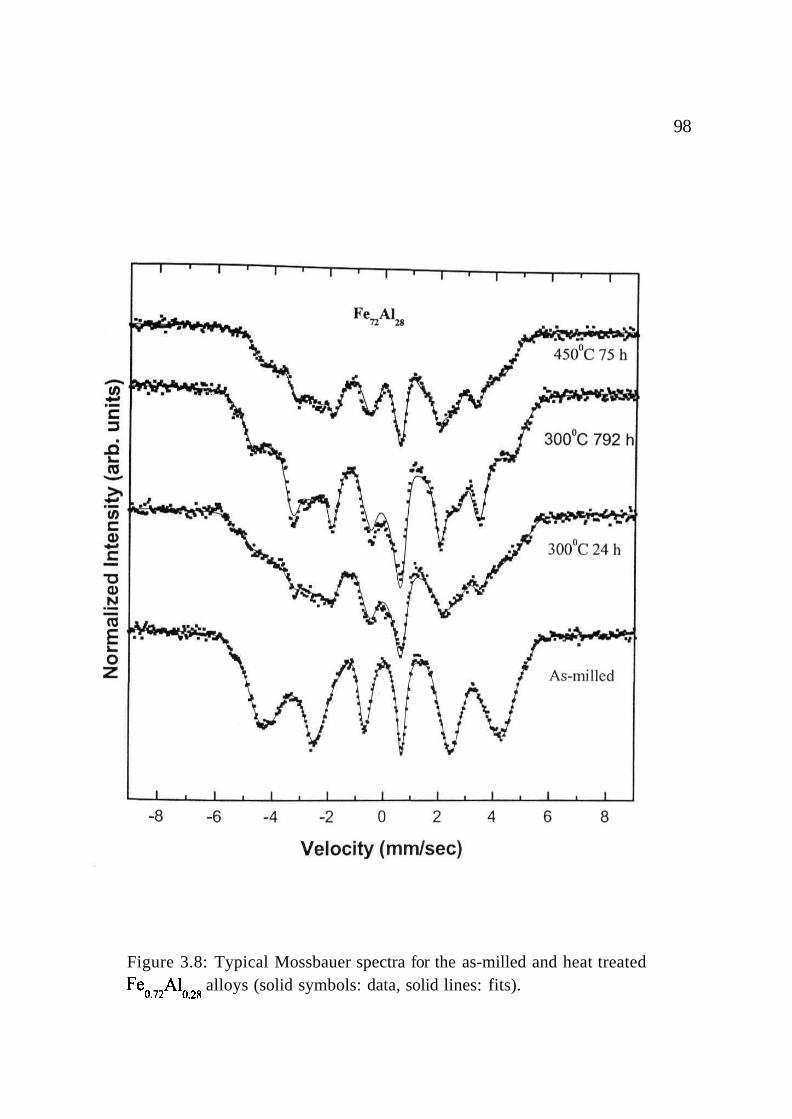
the X-ray study of Feo.72Alo.2s alloy. The Mossbauer spectra of the as-milled
alloys are shown in figures 3.7 and 3.8 respectively for the 25 and 28 at. % Al
alloys. These spectra are in excellent agreement with disordered Fe-Al alloys
prepared by piston-anvil quenching [37]. The HMF distributions of the as-
milled alloys as shown in figures 3.9-3.12 are also in good agreement with
earlier reported results.
The HMF seen by Fe in Fe-X alloys was analyzed [ref 28 of chapter 2]
in terms of the number of first and second neighbour solute atoms (X). The
effect of the more distant neighbours was taken in terms of an average
concentration dependence of all the fields. Ignoring the effect of second
neighbours, which are very small in the Fe-Al system, the fields at Fe were
found to be mainly dependent on the number of first neighbour Al atoms. The
estimated fields for Fe atoms with different number of Al first neighbours are
shown in figure 3.9.
The observed HMF distribution was fitted to a set of Gaussian functions
centered at the field positions corresponding to different Al first neighbours
configurations. The intensities of these Gaussian peaks corresponded very well
to the probabilities of occurrence of these configurations as calculated using
binomial distributions. This unambiguously shows that the initial state of the
as-milled alloys is atomically disordered and the HMF assignments to different
number of Al first nearest neighbour (Inn) are justified.
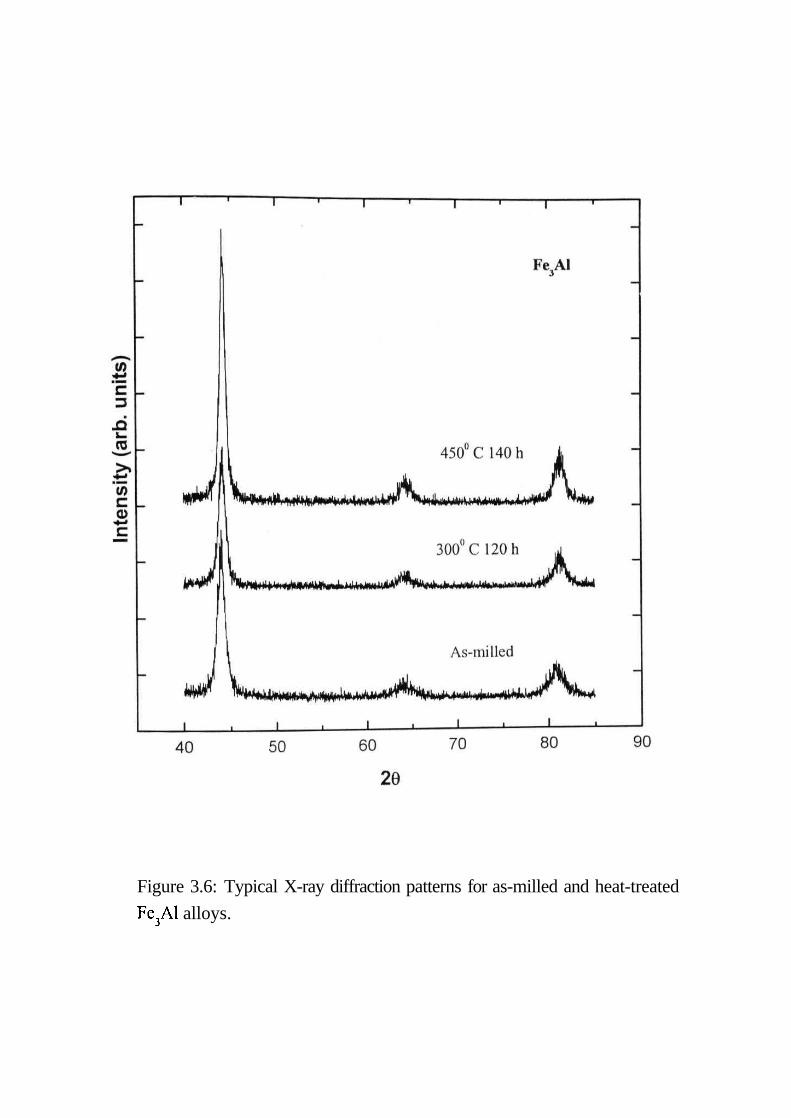
Figure 3.6: Typical X-ray diffraction patterns for as-milled and heat-treated
Fe3Al alloys.
97
Figure 3.7: Representative Mossbauer spectra for the as-milled and heat treatedFe3Al alloys and fits to data using model independent field distribution analysis(solid symbols: data, solid lines:fits).
98
Figure 3.8: Typical Mossbauer spectra for the as-milled and heat treatedFe072Al02g alloys (solid symbols: data, solid lines: fits).
99
n
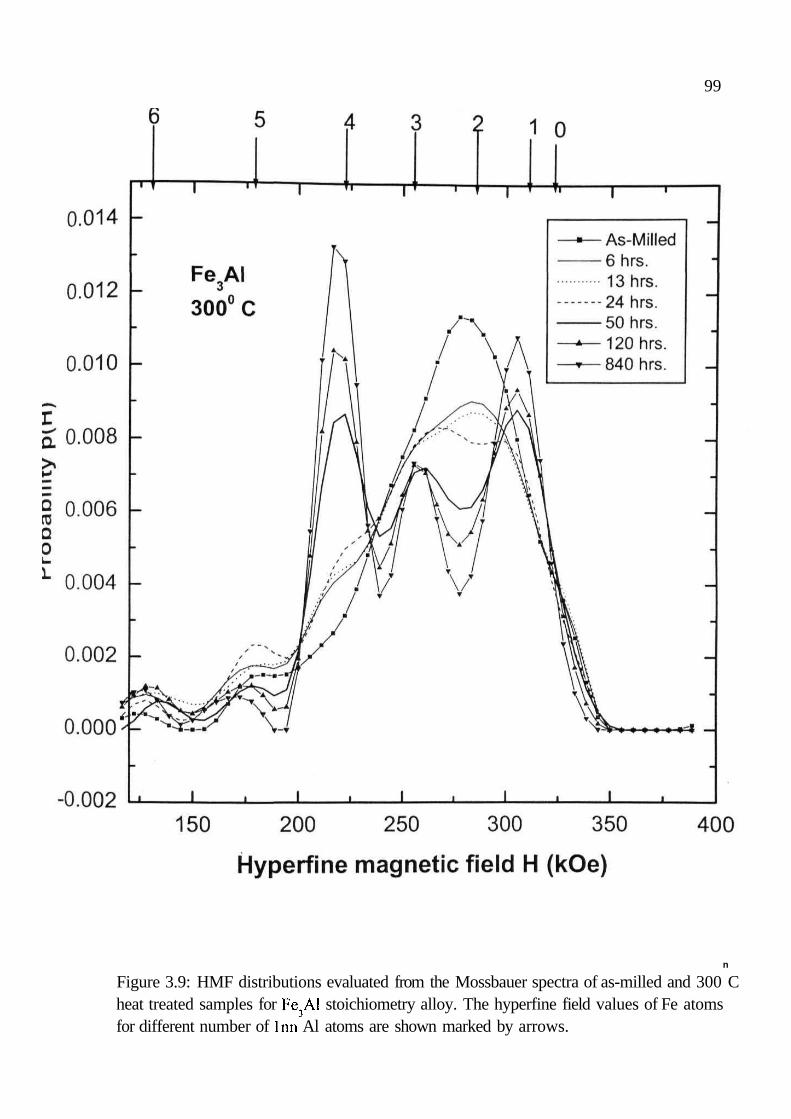
Figure 3.9: HMF distributions evaluated from the Mossbauer spectra of as-milled and 300 Cheat treated samples for Fe3Al stoichiometry alloy. The hyperfine field values of Fe atomsfor different number of Inn Al atoms are shown marked by arrows.
100
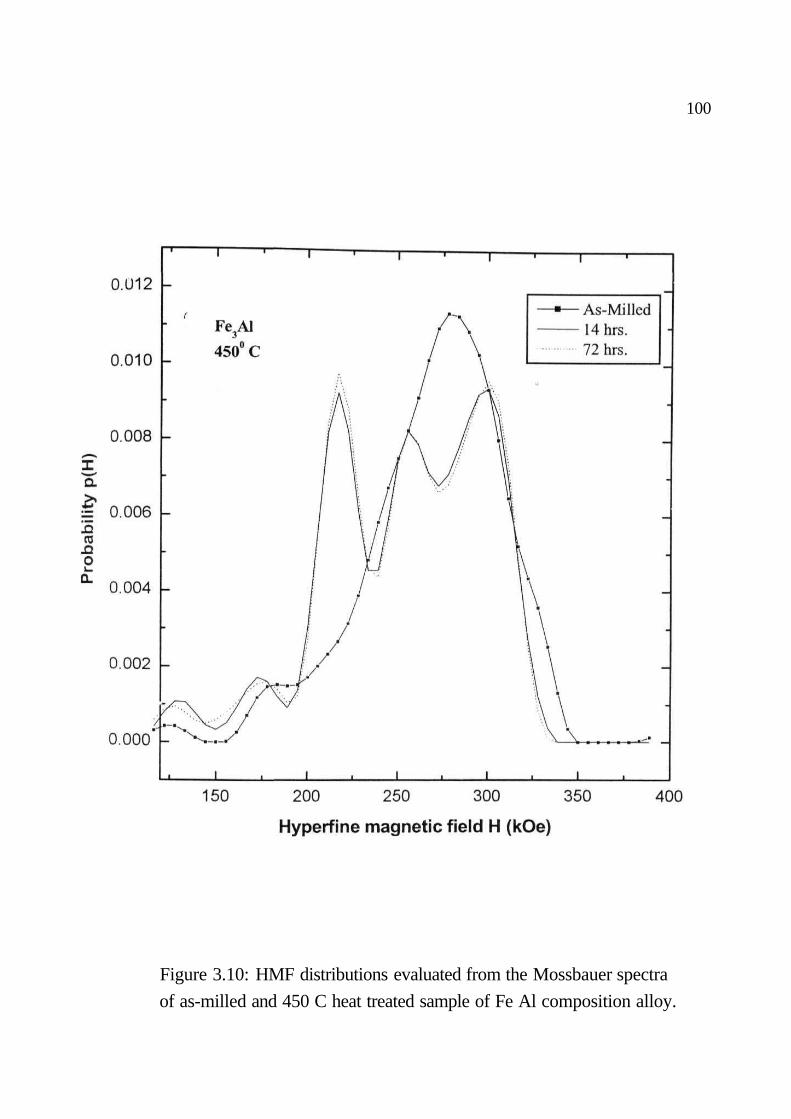
Figure 3.10: HMF distributions evaluated from the Mossbauer spectra
of as-milled and 450 C heat treated sample of Fe Al composition alloy.
101
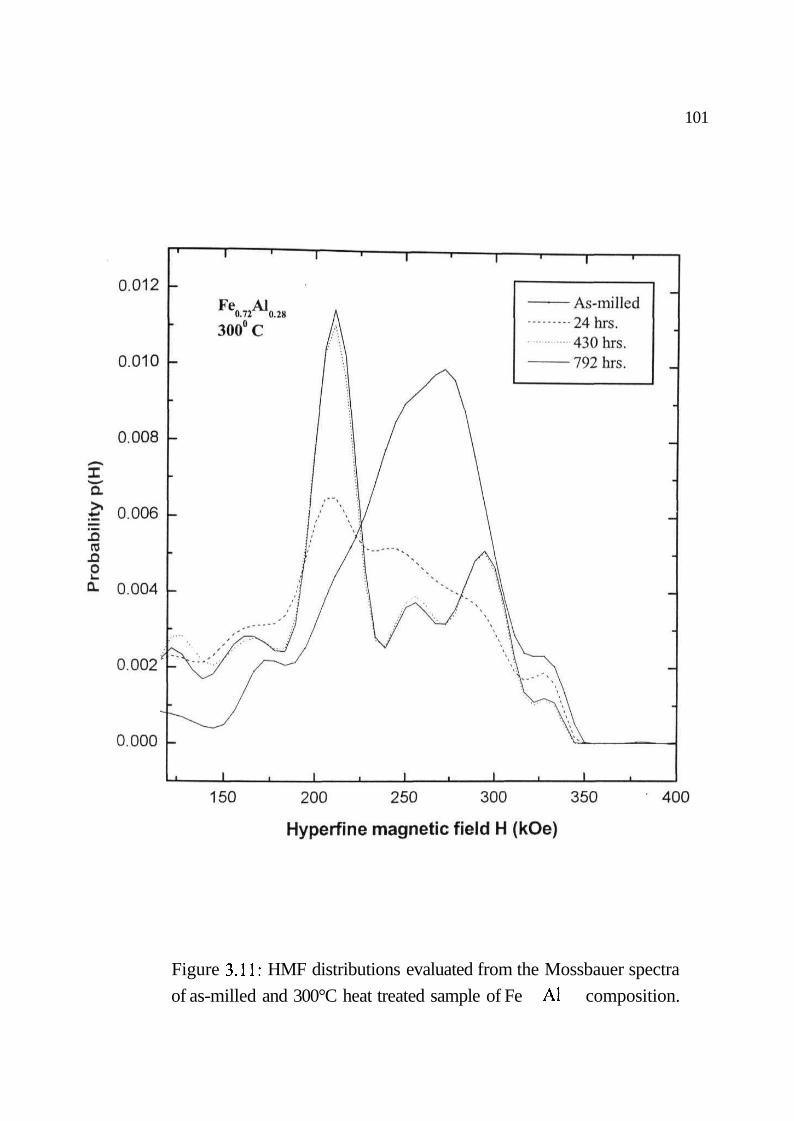
Figure 3.11: HMF distributions evaluated from the Mossbauer spectra
of as-milled and 300°C heat treated sample of Fe Al composition.

102
Figure 3.12: HMF distributions evaluated from the Mossbauer spectra of
as-milled and 450°C heat treated samples of Fe Al composition alloy,
103
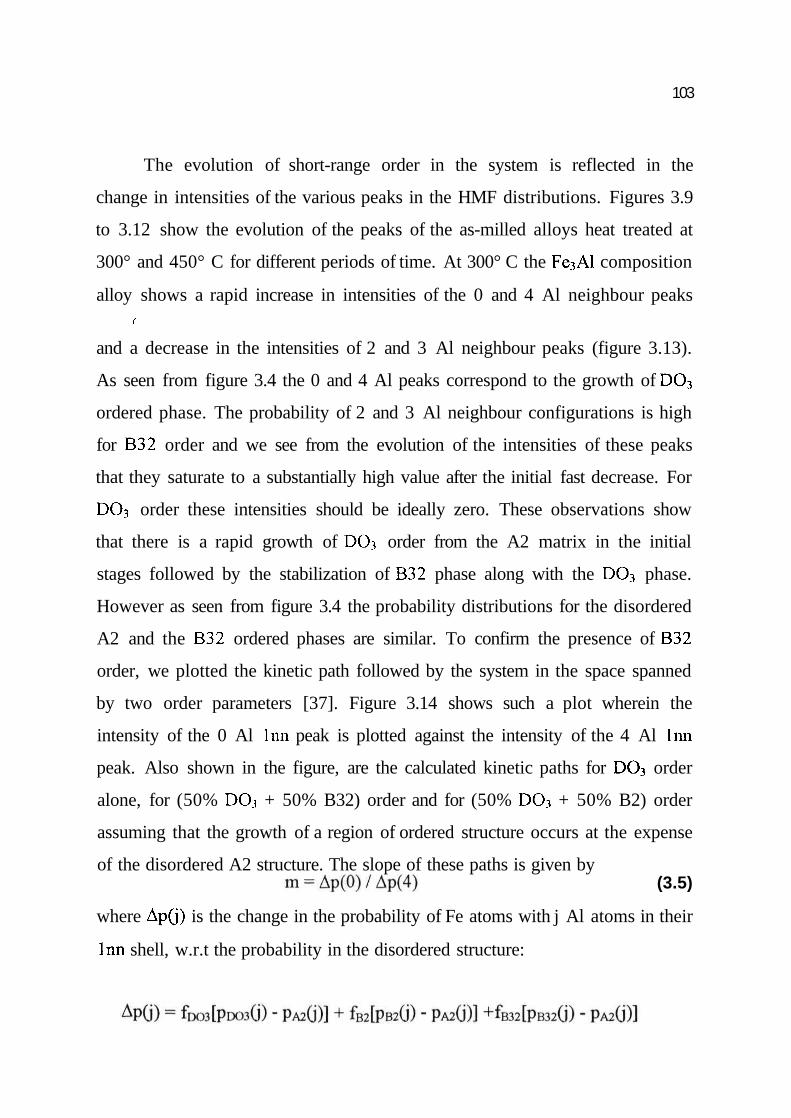
The evolution of short-range order in the system is reflected in the
change in intensities of the various peaks in the HMF distributions. Figures 3.9
to 3.12 show the evolution of the peaks of the as-milled alloys heat treated at
300° and 450° C for different periods of time. At 300° C the Fe3Al composition
alloy shows a rapid increase in intensities of the 0 and 4 Al neighbour peaks(
and a decrease in the intensities of 2 and 3 Al neighbour peaks (figure 3.13).
As seen from figure 3.4 the 0 and 4 Al peaks correspond to the growth of DO3
ordered phase. The probability of 2 and 3 Al neighbour configurations is high
for B32 order and we see from the evolution of the intensities of these peaks
that they saturate to a substantially high value after the initial fast decrease. For
DO3 order these intensities should be ideally zero. These observations show
that there is a rapid growth of DO3 order from the A2 matrix in the initial
stages followed by the stabilization of B32 phase along with the DO3 phase.
However as seen from figure 3.4 the probability distributions for the disordered
A2 and the B32 ordered phases are similar. To confirm the presence of B32
order, we plotted the kinetic path followed by the system in the space spanned
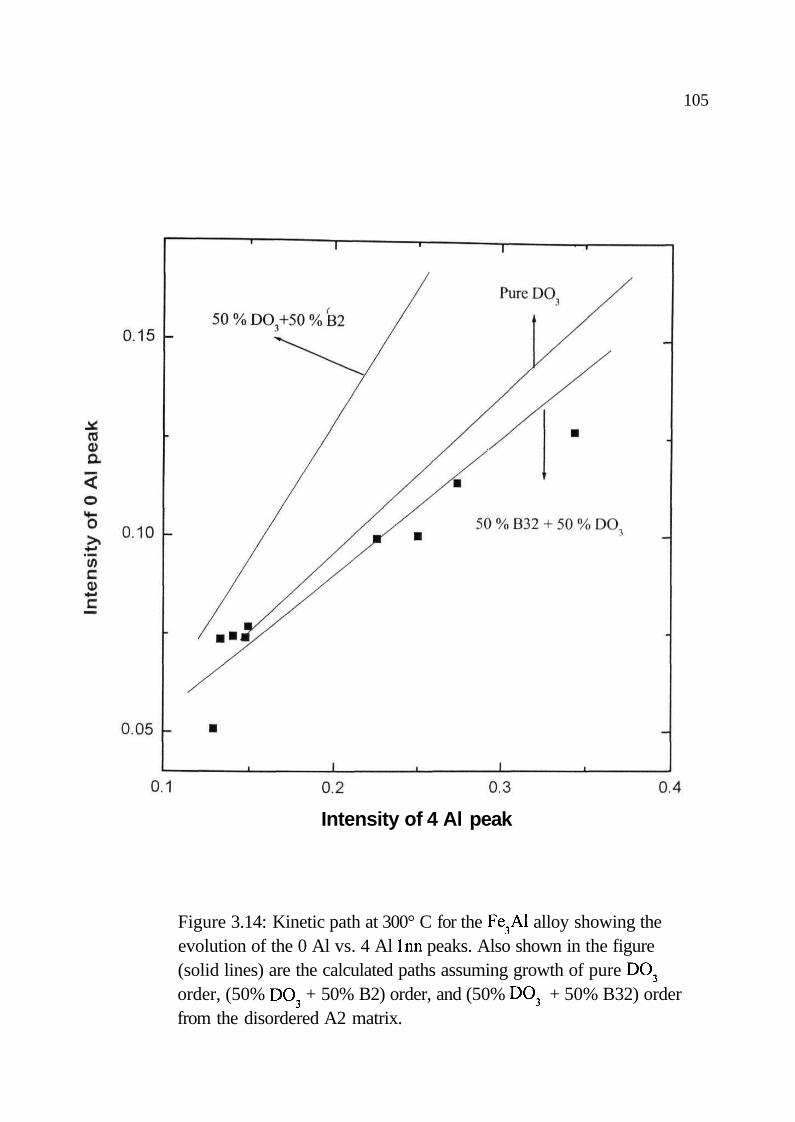
by two order parameters [37]. Figure 3.14 shows such a plot wherein the
intensity of the 0 Al Inn peak is plotted against the intensity of the 4 Al Inn
peak. Also shown in the figure, are the calculated kinetic paths for DO3 order
alone, for (50% DO3 + 50% B32) order and for (50% DO3 + 50% B2) order
assuming that the growth of a region of ordered structure occurs at the expense
of the disordered A2 structure. The slope of these paths is given by
where Ap(j) is the change in the probability of Fe atoms with j Al atoms in their
Inn shell, w.r.t the probability in the disordered structure:
(3.5)

104
1000
Figure 3.13: Temporal evolution of fraction of Fe atoms with 0, 4, and(2+3) first near neighbour Al atoms at 300° C (symbols: experimentalfractions evaluated from the HMF distributions; solid lines: fits to datausing Eq. (3.11).
105
Intensity of 4 Al peak
Figure 3.14: Kinetic path at 300° C for the Fe3Al alloy showing theevolution of the 0 Al vs. 4 Al Inn peaks. Also shown in the figure(solid lines) are the calculated paths assuming growth of pure DO3
order, (50% DO3 + 50% B2) order, and (50% DO3 + 50% B32) orderfrom the disordered A2 matrix.
106
where focw, fe2, and fe32 are the fractions of the three ordered structures that
grow from the disordered A2 structure, and
(3.7)
because PDO3(J), PEECJX PB32O), and p^CJ) are constants, the slope of the kinetic
path depends only on the fractions (f) of these structures.
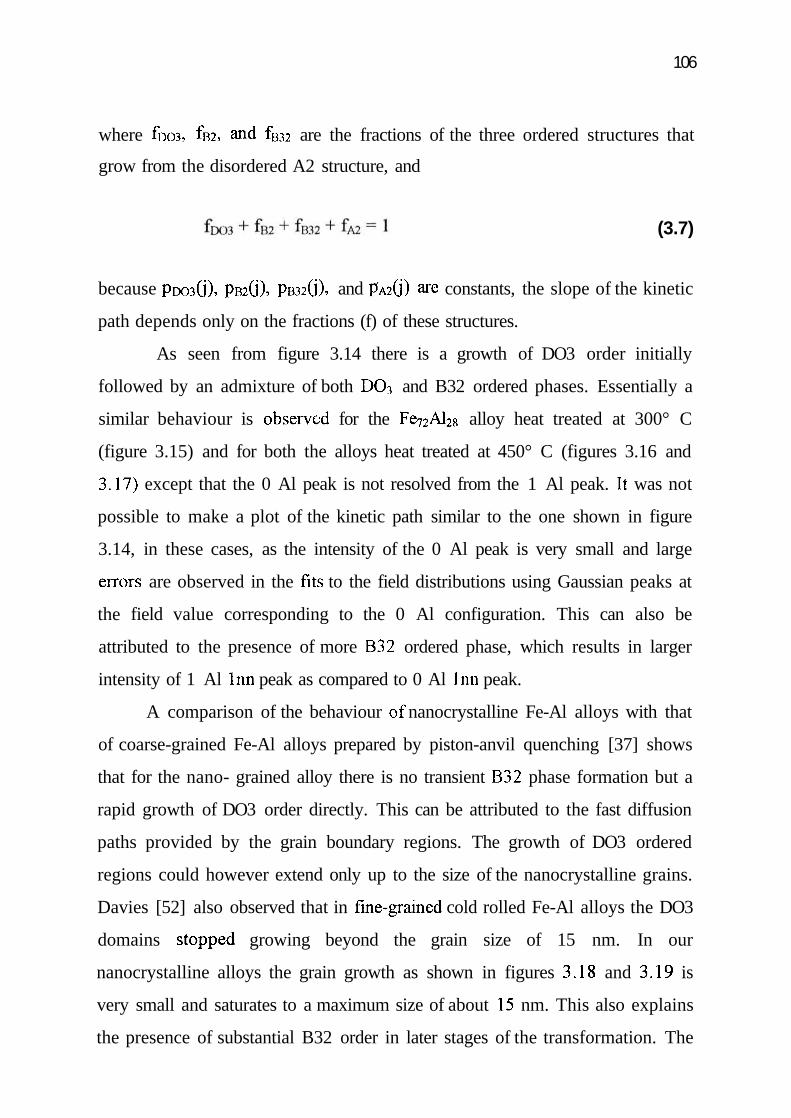
As seen from figure 3.14 there is a growth of DO3 order initially
followed by an admixture of both DO3 and B32 ordered phases. Essentially a
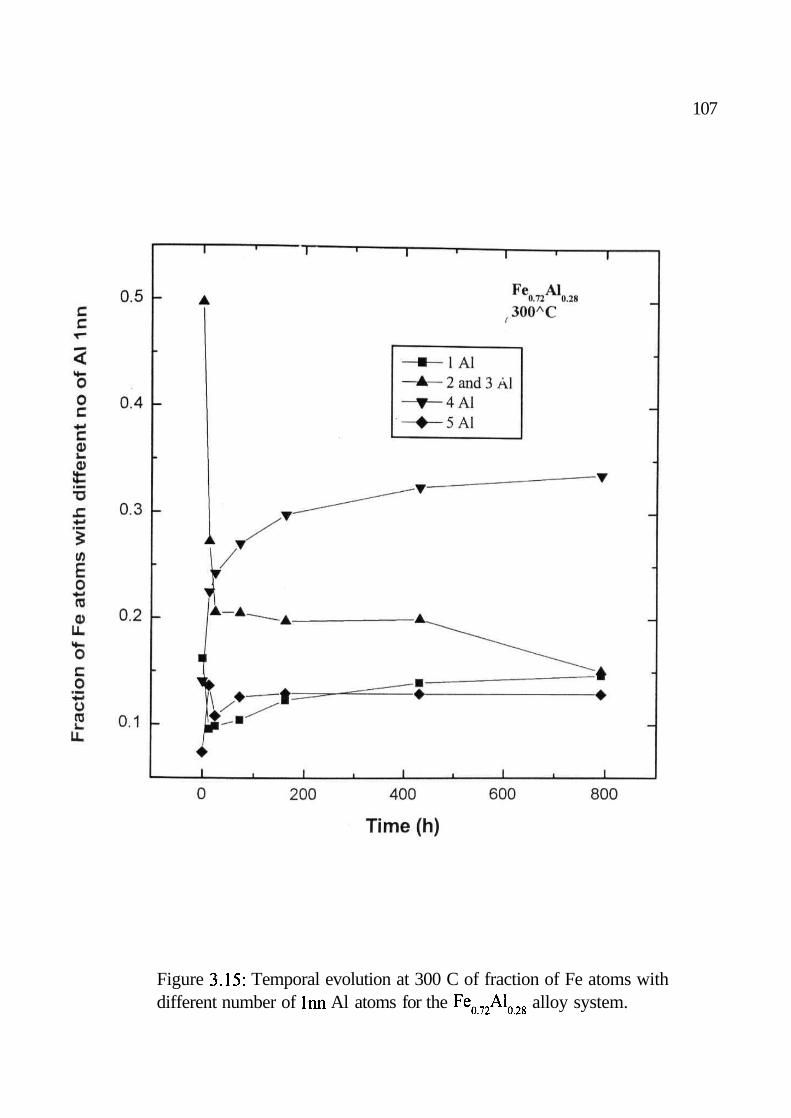
similar behaviour is observed for the Fe72Al28 alloy heat treated at 300° C
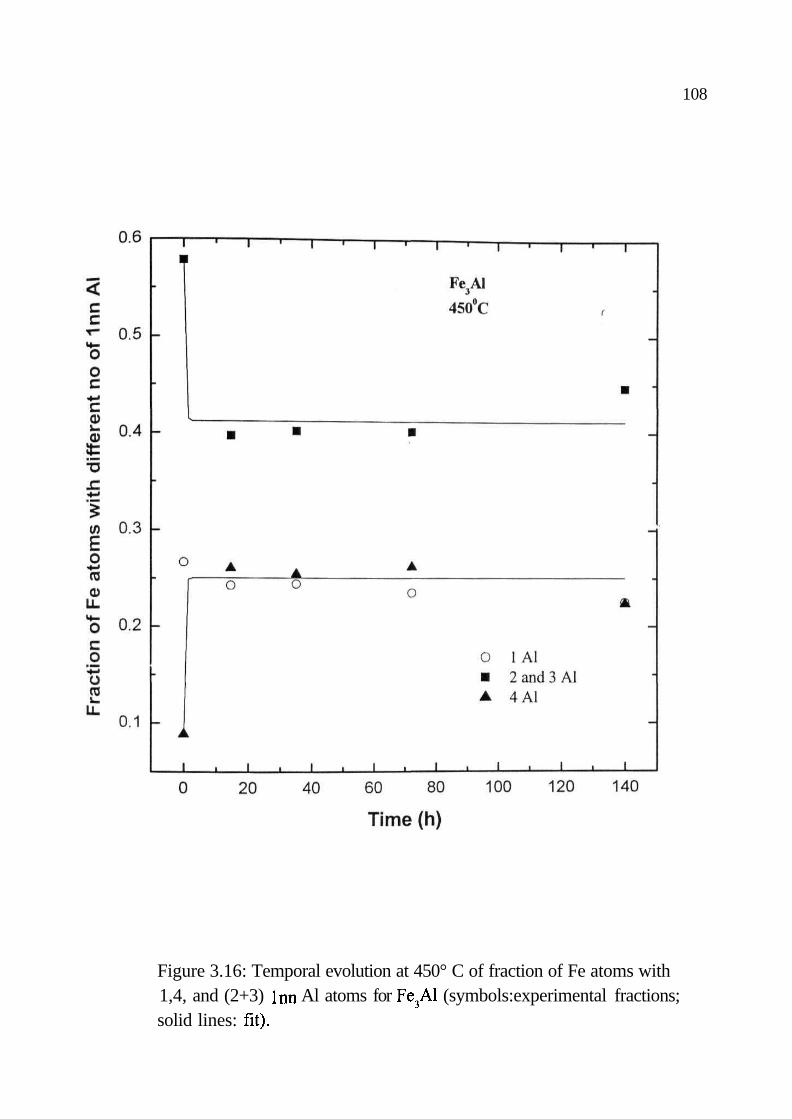
(figure 3.15) and for both the alloys heat treated at 450° C (figures 3.16 and
3.17) except that the 0 Al peak is not resolved from the 1 Al peak. It was not
possible to make a plot of the kinetic path similar to the one shown in figure
3.14, in these cases, as the intensity of the 0 Al peak is very small and large
eiTors are observed in the fits to the field distributions using Gaussian peaks at
the field value corresponding to the 0 Al configuration. This can also be
attributed to the presence of more B32 ordered phase, which results in larger
intensity of 1 Al Inn peak as compared to 0 Al Inn peak.
A comparison of the behaviour of nanocrystalline Fe-Al alloys with that
of coarse-grained Fe-Al alloys prepared by piston-anvil quenching [37] shows
that for the nano- grained alloy there is no transient B32 phase formation but a
rapid growth of DO3 order directly. This can be attributed to the fast diffusion
paths provided by the grain boundary regions. The growth of DO3 ordered
regions could however extend only up to the size of the nanocrystalline grains.
Davies [52] also observed that in fme-grained cold rolled Fe-Al alloys the DO3
domains stopped growing beyond the grain size of 15 nm. In our
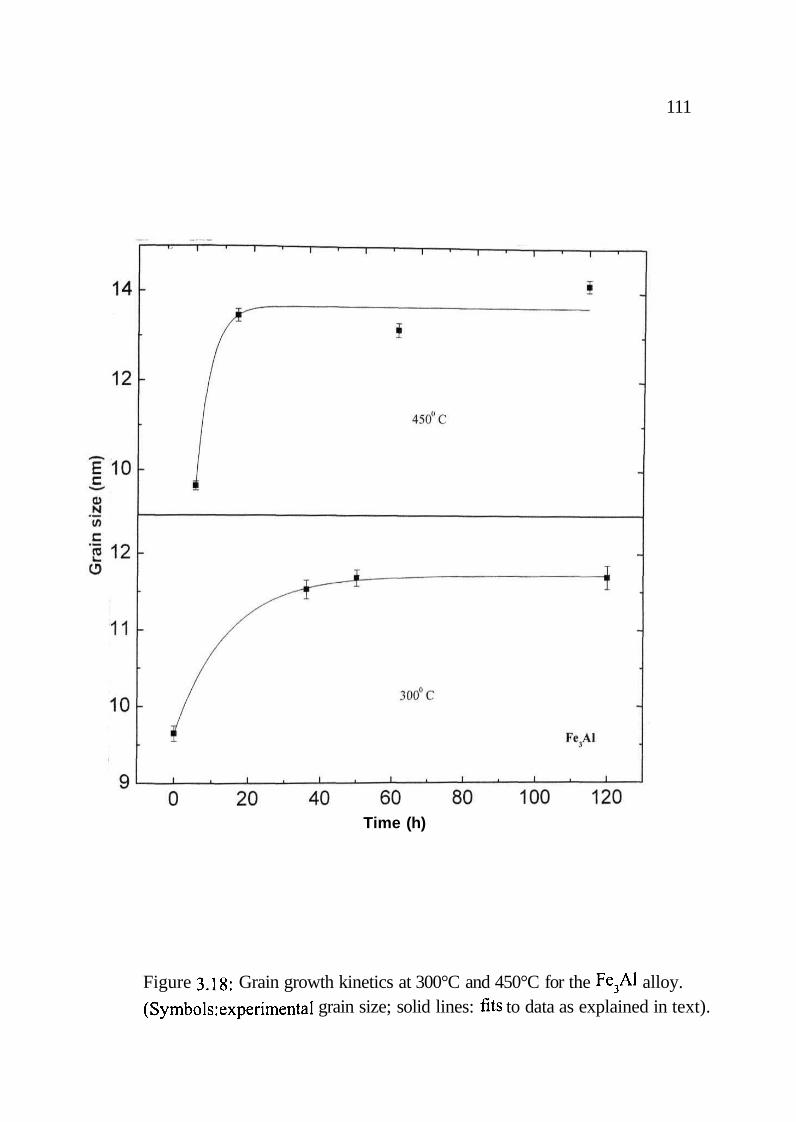
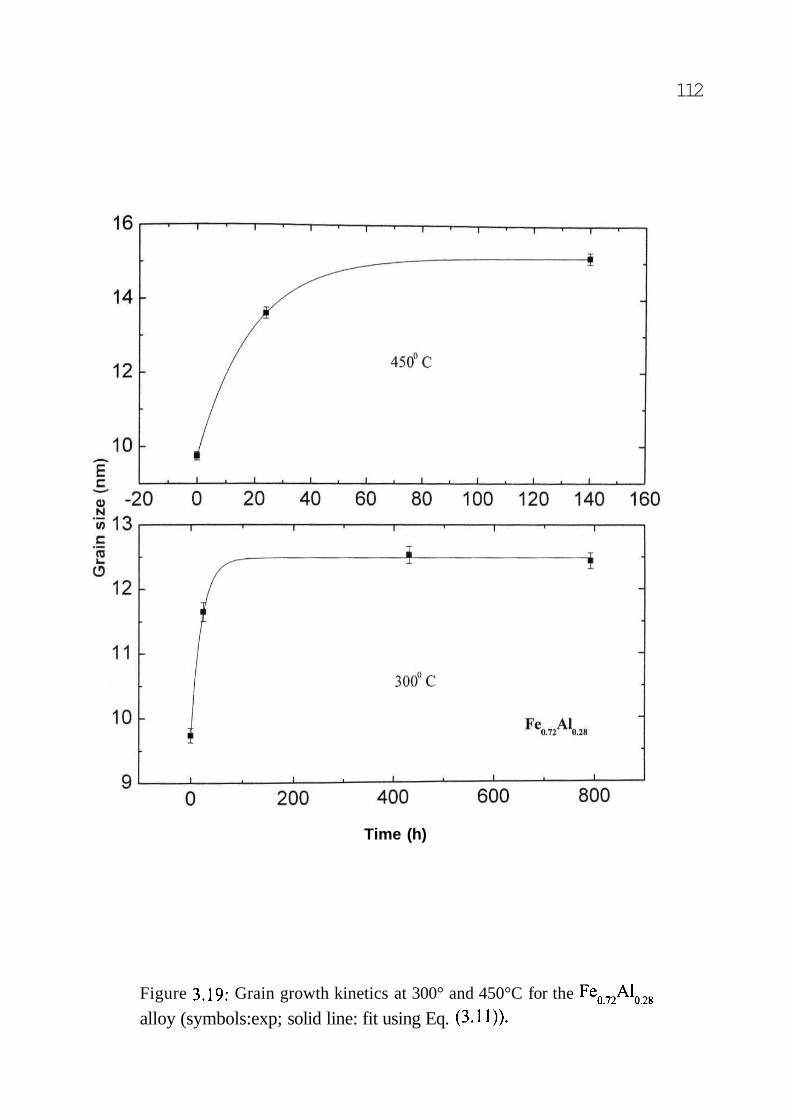
nanocrystalline alloys the grain growth as shown in figures 3.18 and 3.19 is
very small and saturates to a maximum size of about 15 nm. This also explains
the presence of substantial B32 order in later stages of the transformation. The
107
Figure 3.15: Temporal evolution at 300 C of fraction of Fe atoms withdifferent number of Inn Al atoms for the FeQ72Al028 alloy system.
108
Figure 3.16: Temporal evolution at 450° C of fraction of Fe atoms with1,4, and (2+3) Inn Al atoms for Fe3Al (symbols:experimental fractions;solid lines: fit).

109
Time (h)
Figure 3.17: Temporal evolution at 450° C of fraction of Fe atoms withdifferent number of Inn Al atoms for the Fea72Al028 alloy system.

110
B32 ordered regions are possible to arise in the anti-phase domain boundary
(APDB) regions between DO3 ordered domains [ref 194 of chapter 1]. This
was also the explanation given for the transient formation of B32 order
between small DO3 ordered domains (approximately 3 nm) which grew
initially in the coarse grained alloy [37]. In the nanophase alloy the maximum
growth of DO3 domain size is limited by the grain size and the grain boundary
regions also constitutes the B32 ordered APD boundaries for the system.
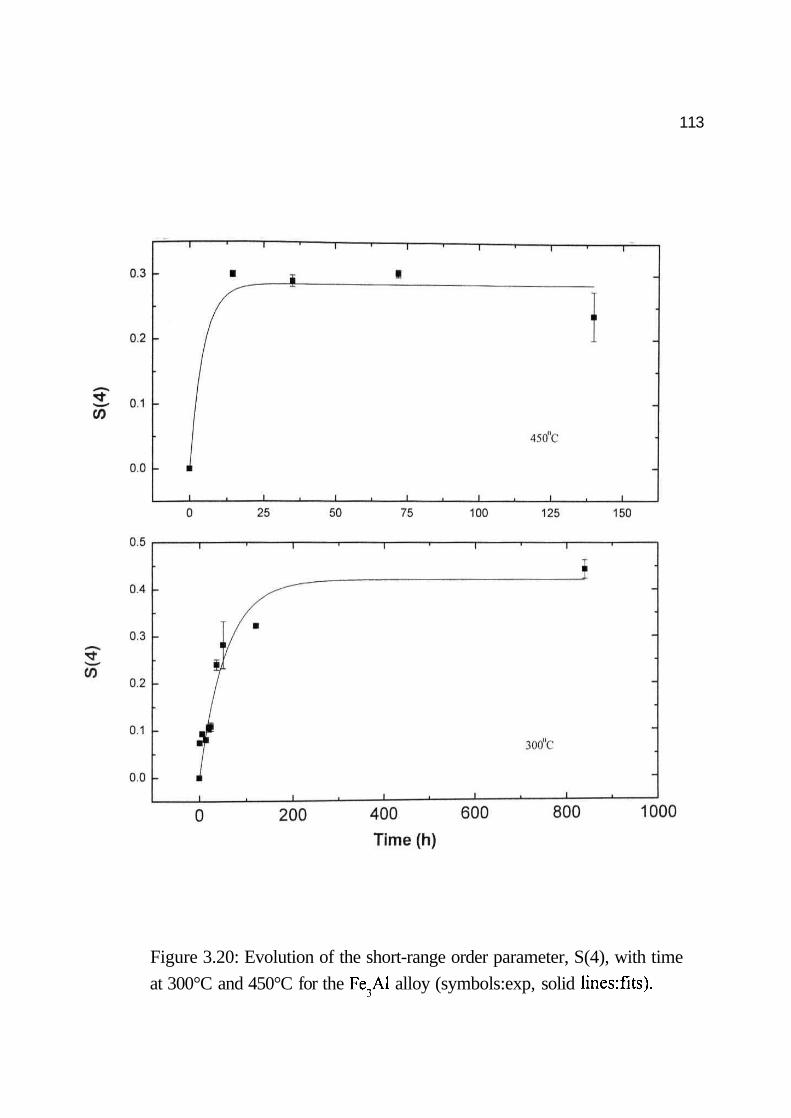
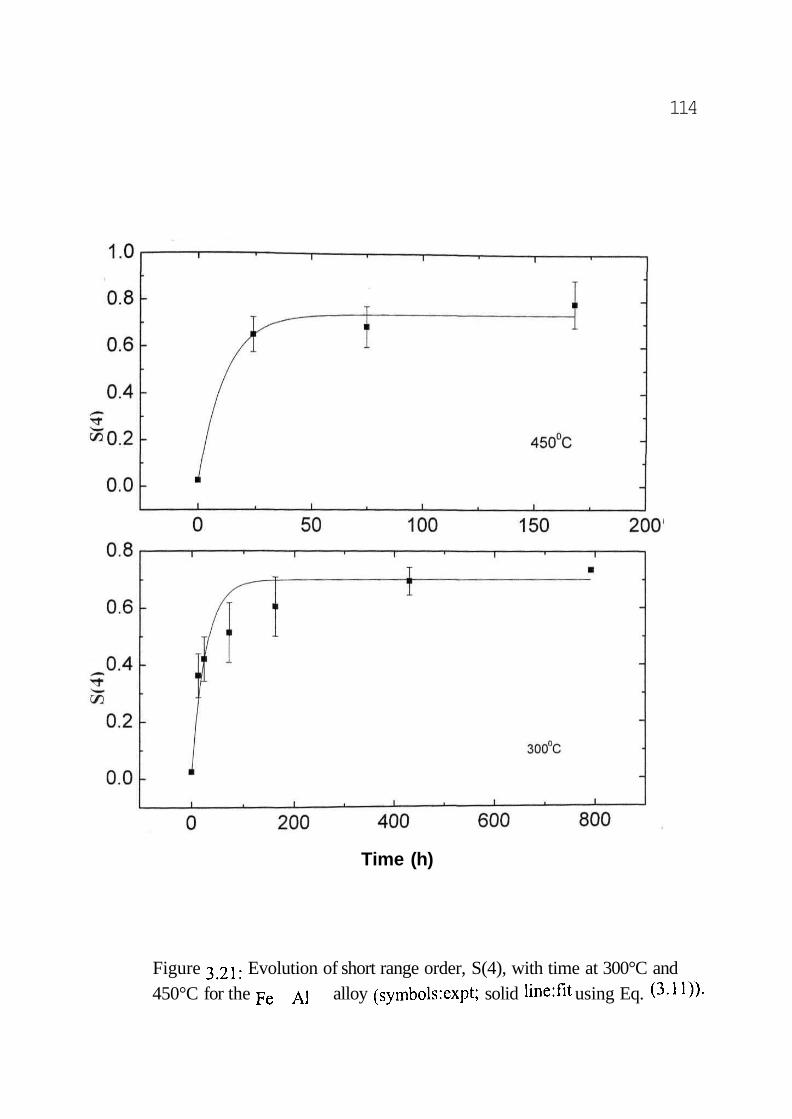
Figures 3.20 and 3.21 show the kinetic evolution of the short range
order parameter, S(4), defined in terms of the intensities p(4) of the 4 Al Inn
peaks, as follows:
where pexpt(4) is the experimentally observed intensity, Pdisord (4) is the intensity
for the disordered alloy calculated from the binomial distribution, prx»(4) is the
intensity for fully ordered alloy. The kinetics of order evolution in an alloy
system can be treated in terms of the model proposed by Khachaturyan [53],
which relates the kinetics of the transformation to the thermodynamics.
According to this model the temporal rate of change of order parameter, r|(t), is
assumed proportional to the sensitivity of the Gibbs free energy change w.r.t
the order parameter:
(3.9)
where L is a mobility factor which depends on the kinetic mechanism of
ordering. Expanding G(r|) in a Taylor series about equilibrium, r\ = r\Cip and
retaining only terms up to second order derivative of G
gets
(3.8)
111
Figure 3.18: Grain growth kinetics at 300°C and 450°C for the Fe3Al alloy.(Symbols.-experimental grain size; solid lines: fits to data as explained in text).
Time (h)
112
alloy (symbols:exp; solid line: fit using Eq. (3.11)).
Time (h)
Figure 3.19: Grain growth kinetics at 300° and 450°C for the Fe072AlQ28
113
Figure 3.20: Evolution of the short-range order parameter, S(4), with time
at 300°C and 450°C for the Fe3Al alloy (symbols:exp, solid linesrfits).
114
Time (h)
Figure 3.21: Evolution of short range order, S(4), with time at 300°C and450°C for the Fe Al alloy (symbols:expt; solid linerfit using Eq. (3.11)).

115
where r|o is the order parameter at time t = o
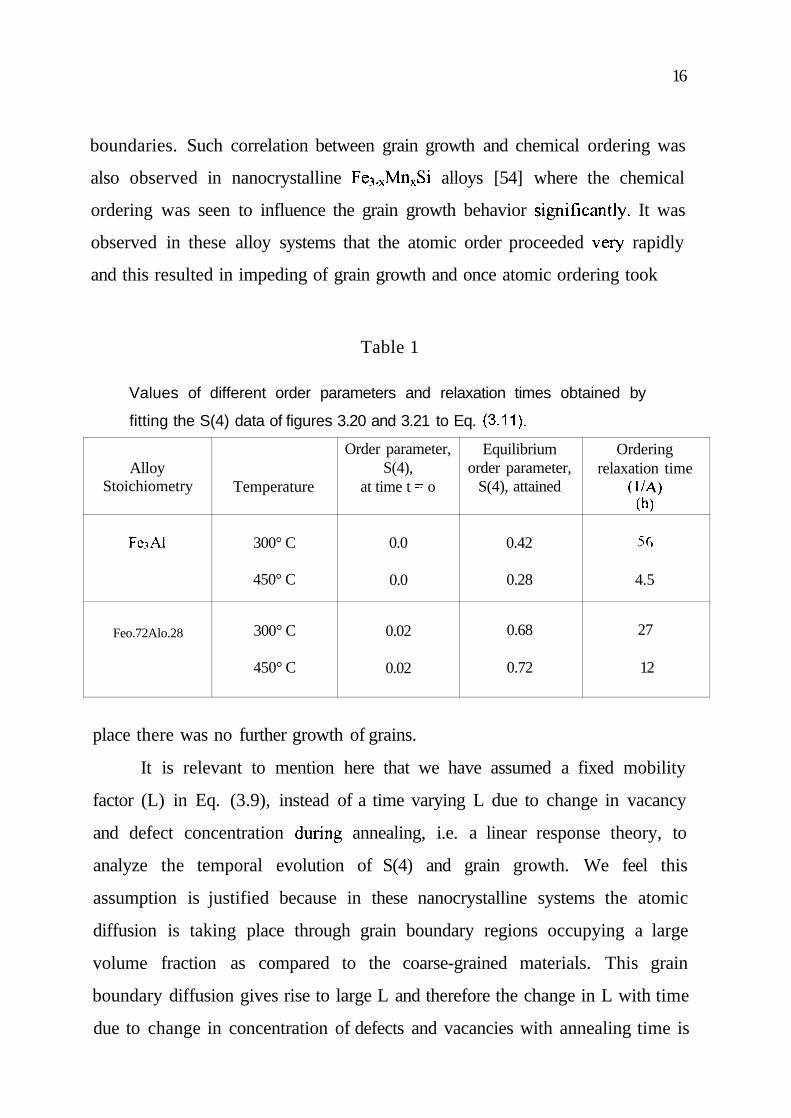
The fits to the S(4) data using this equation (with r\ = S(4)) are also
shown in figures 3.20 and 3.21. The parameters obtained from the fits are
shown in Table 1. As seen from the table the ordering relaxation time (1 /A) is
small at higher temperature as expected. The equilibrium order parameter
reached is seen to be less than unity. This also reflects the presence of residual
B32 order as mentioned earlier. Another important point to note is that in
polycrystalline coarse grained alloys the B2->DC>3 transformation was found to
proceed as a third order reaction [46] whereas our equation to describe the
order evolution corresponds to a first order reaction. This indicates that the
ordering mechanism in the nanocrystalline alloys is different from the coarse
grained alloys due to the presence of extensive grain boundary regions. As
observed in our measurements on kinetics of ordering in nanophase FeCo-X
alloys [in section 3.3] the grain boundary regions provide short circuited
diffusion paths which give rise to faster diffusion relative to coarse grained
- systems.
The kinetics of grain growth as shown in figures 3.18 and 3.19 also do
not follow a conventional curvature driven grain growth mechanism as
observed for bulk systems. Interestingly the grain growth behavior in our
system could also be fitted to equation (3.11) with rj replaced by average grain
size. This is not totally unexpected because the mechanism of grain growth as
well as atomic ordering may be the same viz. diffusion through grain
(3.11)
(3.10)where
The solution of this equation is
16
boundaries. Such correlation between grain growth and chemical ordering was
also observed in nanocrystalline Fe3.xMnxSi alloys [54] where the chemical
ordering was seen to influence the grain growth behavior significantly. It was
observed in these alloy systems that the atomic order proceeded veiy rapidly
and this resulted in impeding of grain growth and once atomic ordering took
Table 1
Values of different order parameters and relaxation times obtained by
fitting the S(4) data of figures 3.20 and 3.21 to Eq. (3.11).
AlloyStoichiometry
Fe3Al
Feo.72Alo.28
Temperature
300° C
450° C
300° C
450° C
Order parameter,S(4),
at time t = o
0.0
0.0
0.02
0.02
Equilibriumorder parameter,
S(4), attained
0.42
0.28
0.68
0.72
Orderingrelaxation time
(I/A)(h)
5G
4.5
27
12
place there was no further growth of grains.
It is relevant to mention here that we have assumed a fixed mobility
factor (L) in Eq. (3.9), instead of a time varying L due to change in vacancy
and defect concentration during annealing, i.e. a linear response theory, to
analyze the temporal evolution of S(4) and grain growth. We feel this
assumption is justified because in these nanocrystalline systems the atomic
diffusion is taking place through grain boundary regions occupying a large
volume fraction as compared to the coarse-grained materials. This grain
boundary diffusion gives rise to large L and therefore the change in L with time
due to change in concentration of defects and vacancies with annealing time is
17
expected to be only a small perturbation and hence this assumption of constant
mobility factor is valid.
In conclusion we observed that the nanophase nature of the Fe^Al alloys
influenced the atomic order evolution as well as the kinetics of the ordering
process very significantly. The observed behaviour was attributed to the nano
size of the grains and the grain boundary regions in these nanocrystalline alloy
systems.
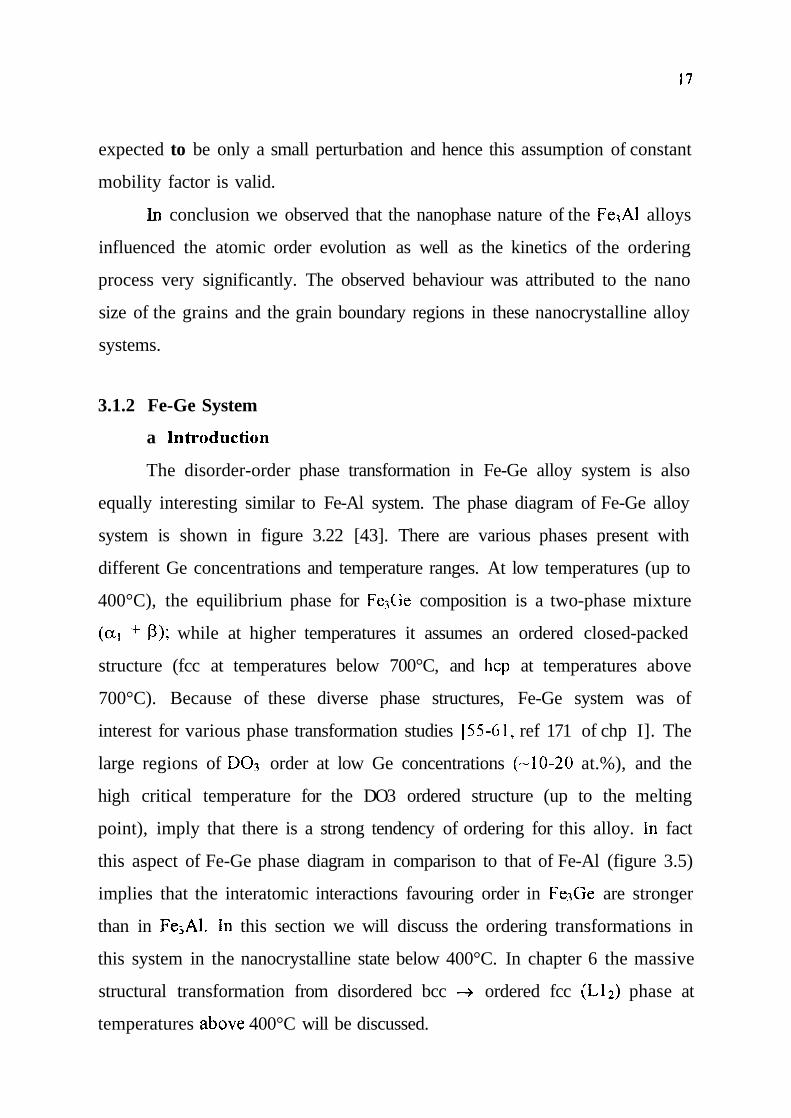
3.1.2 Fe-Ge System
a Introduction
The disorder-order phase transformation in Fe-Ge alloy system is also
equally interesting similar to Fe-Al system. The phase diagram of Fe-Ge alloy
system is shown in figure 3.22 [43]. There are various phases present with
different Ge concentrations and temperature ranges. At low temperatures (up to
400°C), the equilibrium phase for Fe^Ge composition is a two-phase mixture
(ai + P); while at higher temperatures it assumes an ordered closed-packed
structure (fcc at temperatures below 700°C, and hep at temperatures above
700°C). Because of these diverse phase structures, Fe-Ge system was of
interest for various phase transformation studies [55-61, ref 171 of chp I]. The
large regions of DO3 order at low Ge concentrations (-10-20 at.%), and the
high critical temperature for the DO3 ordered structure (up to the melting
point), imply that there is a strong tendency of ordering for this alloy. In fact
this aspect of Fe-Ge phase diagram in comparison to that of Fe-Al (figure 3.5)
implies that the interatomic interactions favouring order in Fe^Ge are stronger
than in FesAl. In this section we will discuss the ordering transformations in
this system in the nanocrystalline state below 400°C. In chapter 6 the massive
structural transformation from disordered bcc ->• ordered fcc (LI2) phase at
temperatures above 400°C will be discussed.

118

119
b Experimental
Fe^Ge* alloys in the composition range 0.17 < x < 0.39 were prepared
by mechanical alloying of elemental Fe and Ge powders of 99.99%+ purity
(Aldrich-Sigma Chemicals). The Fe contamination due to ball milling was
typically about 1 to 2 atomic percent as determined by EDAX and chemical
composition analysis.
c Results and Discussion
Figures 3.23 and 3.24 show the X-Ray diffraction patterns for the as-
milled alloys with compositions close to Fe3Ge, and Feo.83Geo.17 respectively.
All the lines are indexed to disordered bcc (A2) phase. The average grain size
obtained for the samples near Fe^Ge stoichiometry was approximately 6.0 nm,
The grain size of the as milled Feo.g3Geo.17 was found to be approximately 8.3
nm. The Mossbauer spectra of the above as-milled samples are shown in figure
3.25 and the corresponding probability distributions are shown in LHS of
figure 3.26; the calculated probability distributions using equation 3.1 is shown
in the RHS of figure 3.26. Veiy good agreement between these experimental
and calculated probability distributions confirms the formation of the as-milled
alloys in the A2 phase, which is also supported by the XRD results. The field
distributions were in good agreement with those of disordered Fe3Al prepared
by piston and anvil quenching [37], disordered Fe3Si prepared by milling of Fe
and Si [ref 26 of chp 2] and for Fe-22 At. % Ge deposited on quartz substrate
by ion beam sputtering [ref 26 of chp 2]. The formation of only disordered bcc
(&) phase in the as milled alloys for x=0.17 and -0.25 composition, in spite of
the fact that at these compositions either pure DO3 or DO3 + B81 phases should
stabilize according to the phase diagram, therefore implies that ball milling
inhibits the formation of hexagonal ((3) phase and favours only the
development of the bcc structure with anti-site disorder [ref 6 of chp 1]. The
120
Figure 3.23: Representative X-ray diffraction patterns of the as-milled andheat treated samples with ~Fe3Ge composition.

121
29
Figure 3.24: X-ray diffraction patterns recorded using INEL CPS 120 diffractometerfor as-milled and heat treated samples with FeO83Geal7 composition. The formationof the alloy in a phase and the ordering to DO3 order upon heat treatment is evidentfrom the patterns. The presence of superlattice lines are seen (shown seperatelyin the inset). Growth of bcc grains is indicated by the decrease of FWHM of the lines.

122
Velocity (mm/sec)
Figure 3.25: Experimental (symbols) and fitted (lines) Mossbauer spectra of theas-milled Fe-Ge alloys with compositions indicated.

123
Hyperfine magnetic field H (kOe)
Figure 3.26: HMF distributions evaluated from the Mossbauer spectra of figure3.25 are shown in LHS. The corresponding calculated probability distributionsusing Eq. (3.1) are shown in RHS. The analogy between the experimental andthe calculated probability distributions shows the formation of the alloy in a phase.
124
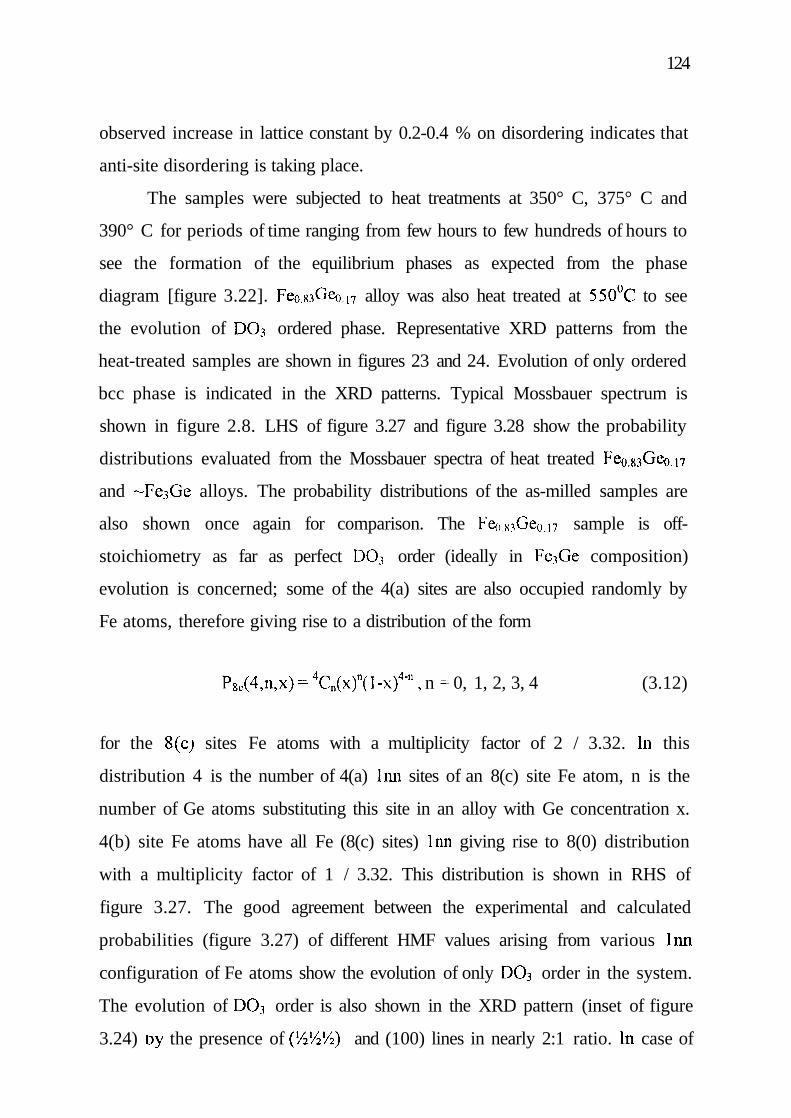
observed increase in lattice constant by 0.2-0.4 % on disordering indicates that
anti-site disordering is taking place.
The samples were subjected to heat treatments at 350° C, 375° C and
390° C for periods of time ranging from few hours to few hundreds of hours to
see the formation of the equilibrium phases as expected from the phase
diagram [figure 3.22]. Feo.83Geo.I7 alloy was also heat treated at 55O°C to see
the evolution of DO3 ordered phase. Representative XRD patterns from the
heat-treated samples are shown in figures 23 and 24. Evolution of only ordered
bcc phase is indicated in the XRD patterns. Typical Mossbauer spectrum is
shown in figure 2.8. LHS of figure 3.27 and figure 3.28 show the probability
distributions evaluated from the Mossbauer spectra of heat treated Feo.83Geo.17
and -Fe.^Ge alloys. The probability distributions of the as-milled samples are
also shown once again for comparison. The Feo.s3Geo.17 sample is off-
stoichiometry as far as perfect DO3 order (ideally in Fe3Ge composition)
evolution is concerned; some of the 4(a) sites are also occupied randomly by
Fe atoms, therefore giving rise to a distribution of the form
P8c(4,n,x) = 4Cn(x)n(l-x)4-n, n = 0, 1, 2, 3, 4 (3.12)
for the 8(cj sites Fe atoms with a multiplicity factor of 2 / 3.32. In this
distribution 4 is the number of 4(a) Inn sites of an 8(c) site Fe atom, n is the
number of Ge atoms substituting this site in an alloy with Ge concentration x.
4(b) site Fe atoms have all Fe (8(c) sites) Inn giving rise to 8(0) distribution
with a multiplicity factor of 1 / 3.32. This distribution is shown in RHS of
figure 3.27. The good agreement between the experimental and calculated
probabilities (figure 3.27) of different HMF values arising from various Inn
configuration of Fe atoms show the evolution of only DO3 order in the system.
The evolution of DO3 order is also shown in the XRD pattern (inset of figure
3.24) oy the presence of ^hx/2x/i) and (100) lines in nearly 2:1 ratio. In case of

125
Hyperfine magnetic field H (kOe)
Figure 3.27: Experimental (line graph) and calculated (bar graph) fielddistributions of as-milled and heat treated samples with Fe083GeQ 1?
composition are shown. The evolution of DO3 order (as discussed in text)is clearly seen by the emergence of peaks in the distribution.
126
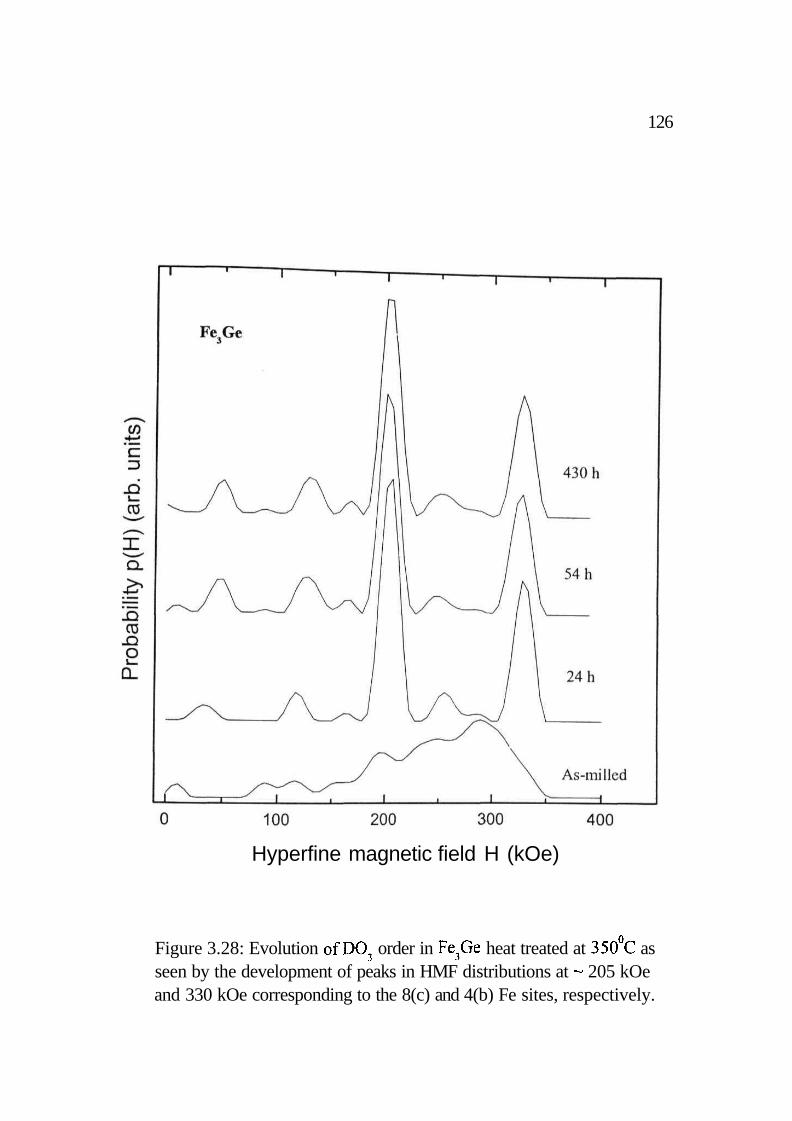
Hyperfine magnetic field H (kOe)
Figure 3.28: Evolution of DO3 order in Fe3Ge heat treated at 350°C asseen by the development of peaks in HMF distributions at ~ 205 kOeand 330 kOe corresponding to the 8(c) and 4(b) Fe sites, respectively.
127
~Fe3Ge alloys the evolution of fields at 330 and 205 kOe (figure 3.28) in the
ratio 1:2 indicate the growth of only DO3 order in the system supported also by
XRX) results. No signature of the p phase was observed although it was
expected. These observations are in good agreement with the work of Gao [37,
ref 24 of chapter 1]. The grain sizes of the Feo.83Geo.17 heat-treated alloys were
estimated to be approximately 18 and 75 nm respectively at 385 and 550°C.
The SRO parameter evolution was -97% and 99% respectively at these two
temperatures. In case of ~Fe3Ge alloys the grain growth and S(4) evolution was
up to around 25 nm and 75% below 400°C. The temporal evolution of grain
size and S(4) near Fe^Ge stoichiometry will be shown in the next section and
compared with the behavior in case of Fe-Mn-Ge alloys. Similar to Fe-Al
system in this system also a first order evolution kinetics was observed.
However there was no intermediate or permanent B2 or B32 order phases
developed in this system as was seen in case of Fe-Al alloys, most probably
because of much stronger ordering interactions in this system due to which
DO3 order is stabilized in the boundary regions also.
P phase (B81 (hep) structure) region in the Fe-Ge phase diagram is
characterized by two different Fe atoms tetrahedrally and octahedrally bonded
with the Ge atoms [figure 6 of reference 61]. The populations of tetra and
octahedrally bonded Fe atoms are in 1:2 ratio. Tetrahedral Fe sites having 4 Ge
Inn give rise to HMF around 200 kOe and octahedral sites surrounded by 6
Inn Ge atoms give rise to HMF at around 120 kOe in the Mossbauer p(I})
distributions ideally with the intensity ratios of these two fields as 1:2. To
check the ordering process in the p phase, an alloy with starting composition of
Feo.6iGeo.39 in the p phase region of the phase diagram was synthesized by
milling of elemental powders. The composition after milling became
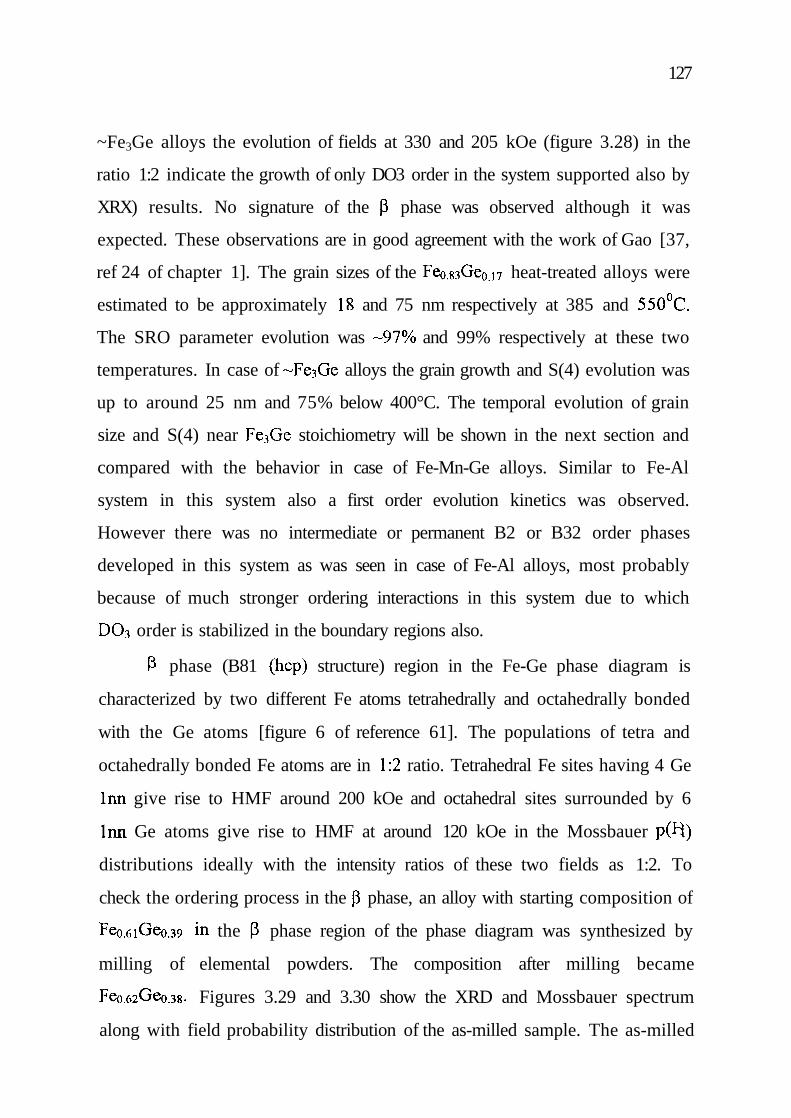
Feo.62Geo.38. Figures 3.29 and 3.30 show the XRD and Mossbauer spectrum
along with field probability distribution of the as-milled sample. The as-milled

128
Figure 3.29: XRD patterns showing the formation of the disordered p phaseFe Ge composition alloy in the as-milled state. The evolution of orderedp phase is seen after heat treatment.
129
Figure 3.30: Mossbauer spectra and HMF distributions for FeQ62Ge03g alloy
composition (p phase) in as milled state and after heat treatment at 350 Cfor 7 days.The evolution of atomic ordering giving rise to Fe atoms withspecific Ge Inn configurations instead of a random configurations of theas-milled alloy is evident from the spectrum as well as field distribution.
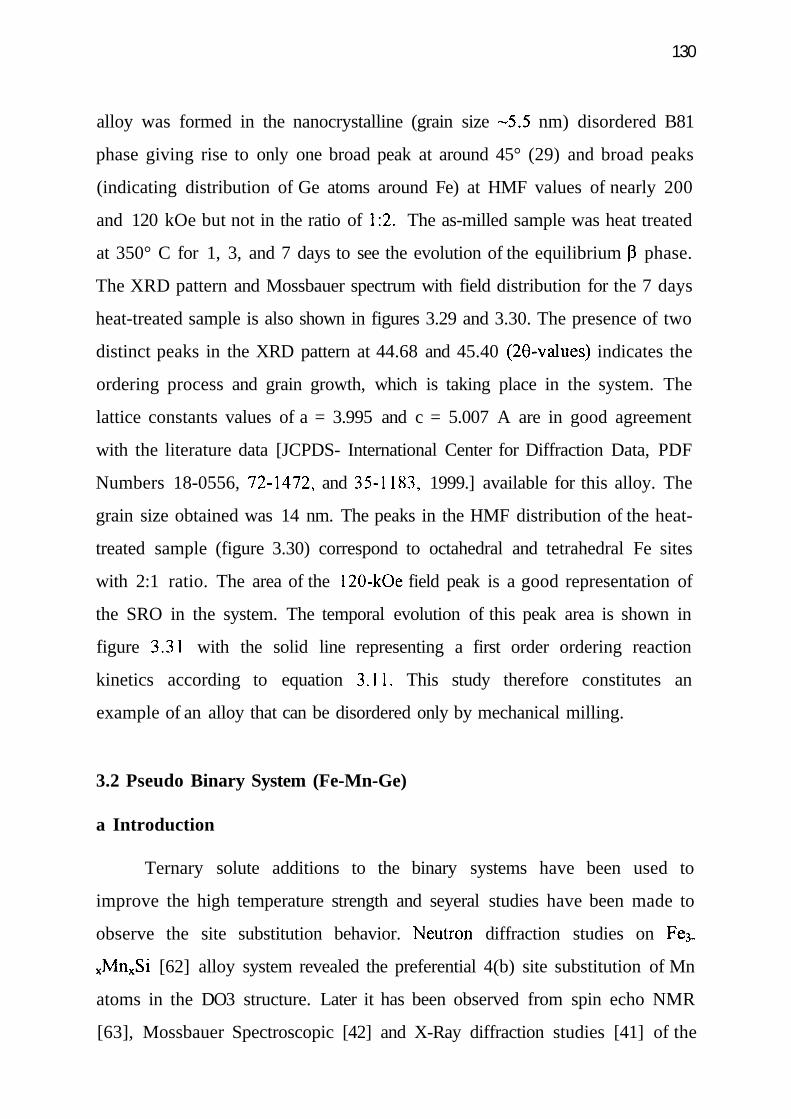
130
alloy was formed in the nanocrystalline (grain size -5.5 nm) disordered B81
phase giving rise to only one broad peak at around 45° (29) and broad peaks
(indicating distribution of Ge atoms around Fe) at HMF values of nearly 200
and 120 kOe but not in the ratio of 1:2. The as-milled sample was heat treated
at 350° C for 1, 3, and 7 days to see the evolution of the equilibrium p phase.
The XRD pattern and Mossbauer spectrum with field distribution for the 7 days
heat-treated sample is also shown in figures 3.29 and 3.30. The presence of two
distinct peaks in the XRD pattern at 44.68 and 45.40 (29-values) indicates the
ordering process and grain growth, which is taking place in the system. The
lattice constants values of a = 3.995 and c = 5.007 A are in good agreement
with the literature data [JCPDS- International Center for Diffraction Data, PDF
Numbers 18-0556, 72-1472, and 35-1183, 1999.] available for this alloy. The
grain size obtained was 14 nm. The peaks in the HMF distribution of the heat-
treated sample (figure 3.30) correspond to octahedral and tetrahedral Fe sites
with 2:1 ratio. The area of the 120-kOe field peak is a good representation of
the SRO in the system. The temporal evolution of this peak area is shown in
figure 3.31 with the solid line representing a first order ordering reaction
kinetics according to equation 3.11. This study therefore constitutes an
example of an alloy that can be disordered only by mechanical milling.
3.2 Pseudo Binary System (Fe-Mn-Ge)
a Introduction
Ternary solute additions to the binary systems have been used to
improve the high temperature strength and seyeral studies have been made to
observe the site substitution behavior. Neutron diffraction studies on Fe3.
xMnxSi [62] alloy system revealed the preferential 4(b) site substitution of Mn
atoms in the DO3 structure. Later it has been observed from spin echo NMR
[63], Mossbauer Spectroscopic [42] and X-Ray diffraction studies [41] of the

131
Time (h)
Figure 3.31: The temporal evolution of the 120-kOe field peak arearepresenting short-range-ordering that is taking place in the system.

132
microcrystalline alloys that solutes to the left of Fe in the periodic table (e.g.
Ti, Mn, W, Nb, and Mo) occupy preferentially the 4(b) sites whereas solutes to
the right of Fe (e.g. Co and Ni) occupy 8(c) sites in the DO3 ordered structure.
However for the nanocrystalline Fe3.xMnxSi system it was found that an
ordering heat treatment to develop DO3 order leads to a segregation of Mn
atoms in the grain boundaries and simultaneously the growth of DO3 grains is
suppressed [54].
In this work we studied the effect of Mn addition to the binary Fe3Ge
alloys to understand the site substitution and chemical ordering behavior in the
nanocrystalline state. It was observed that in nanocrystalline Fe3.xMnxGe alloy
systems for 0.0 < x < 0.75 compositions the Mn atoms get homogeneously
alloyed in the as-milled state but do not substitute in the equilibrium DO3 phase
which forms when the as-milled alloys are heat treated.
b Experimental
Fe3.xMnxGe alloys (0 < x < 0.75) were prepared by mechanical alloying
of elemental Fe (Aldrich Sigma 4N), Ge (Aldrich Sigma 4N) and Mn (Alpha
Ventron m3N7) powders. The Fe contamination estimated was 1-2 at %.
c Results and discussion
Figure 3.32 shows the X-ray diffraction data for the as-milled alloy
samples. The presence of predominantly bcc phase lines in the X-ray pattern
shows the formation of homogenous single-phase bcc alloys (a) for all Mn
concentrations. The additional very low intensity Bragg peaks present in the as-
milled patterns were indexed to trace amount of Iron Manganese Oxide phase
[JCPDS- International Center for Diffraction Data, PDF Number 77-2362,
133
1999]. The average grain sizes obtained for the as-milled alloys were
approximately 6 nm.
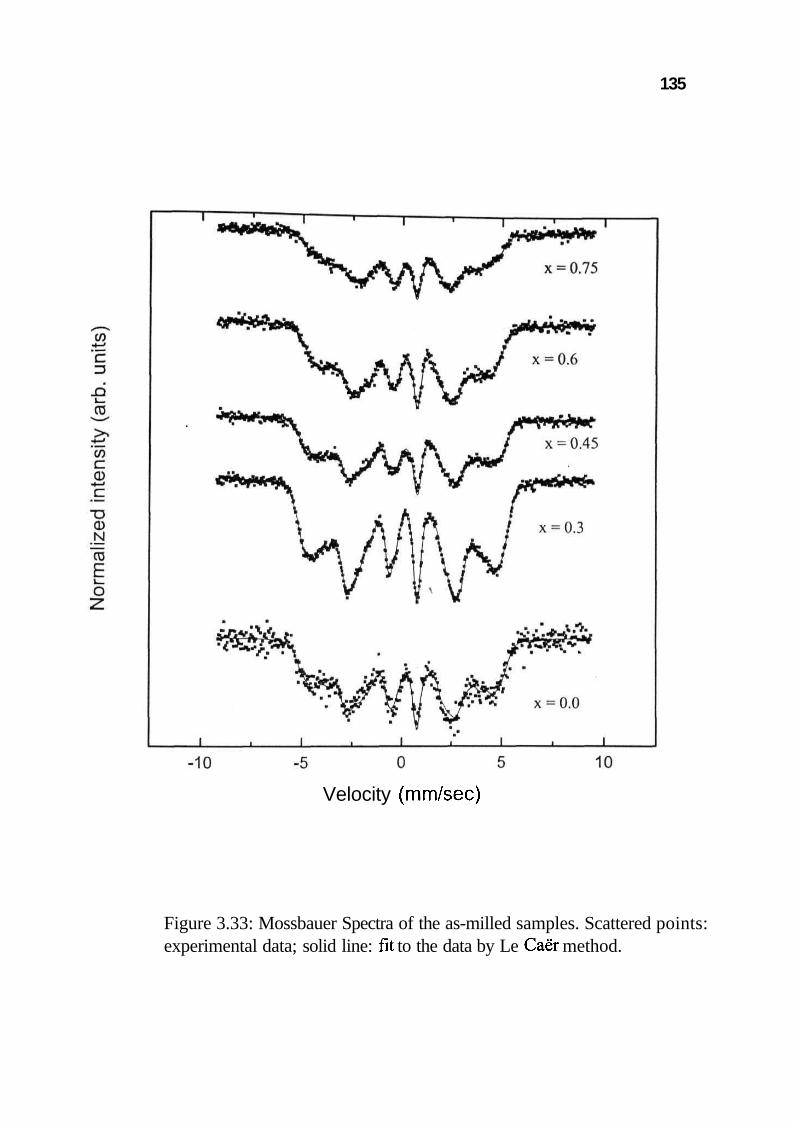
Figure 3.33 shows the Mossbauer Spectra of the as-milled alloys with
different Mn concentrations. The corresponding Hyperfme Magnetic Field
(HMF) distributions obtained by Le Caer analysis are shown in the left hand
side of figure 3.34. In fitting the HMF distributions using Gaussian functions it
was considered that the Inn HMF perturbation caused either by a Ge atom or
by an Mn atom is of equal magnitude of nearly 25 kOe and that caused by the
2nn Ge or Mn atom is negligible in comparison to the Inn [ref 32 of chp 2],
With increase in the concentration (x) in Fe3.xMnxGe the HMF value
corresponding to the maximum probability in the distribution shifts to lower
values relative to Fe.̂ Ge. The probability distributions of the as-milled alloys
for different near neighbour configurations (with 0 to 8 Fe Inn of Fe)
correspond very well with the calculated probabilities (shown in right side of
figure 3.34 as bar graph) using the distribution of equation 3.1 with all the
Constituent atoms substituting randomly at the bcc lattice sites. The HMFs
corresponding to different number of Inn solute configurations to Fe atoms
was in accoidance with the earlier work of Fultz et. al. [ref 26 of chp 2] based
on the additive perturbation model [ref 28 and 32 of chapter 2]. The good
agreement between the experimentally obtained and theoretically calculated
probability distributions shows that Mn enters substitutionally in the disordered
bcc structure (A2) and forms a homogeneous alloy in the as-milled state, which
is also supported by the X-ray data. As it was the case for Fe-Ge alloys the Mn
substituted alloys were also fonned in the disordered bcc a phase although the
equilibrium phase diagram for Fe-Ge (figure 3.22) shows a two-phase region
(DO3 + B81) at this composition and temperature.
The samples were heat treated at 350°C for periods of time ranging from
7 to 24 hours to see the development of the equilibrium order. Figure 3.35
shows the representative X-ray patterns for the 350°C heat-treated samples.

134
Figure 3.32: X-Ray diffraction patterns for the as-milled samples withdifferent Mn concentrations (x).
135
Velocity (mm/sec)
Figure 3.33: Mossbauer Spectra of the as-milled samples. Scattered points:experimental data; solid line: fit to the data by Le Caer method.
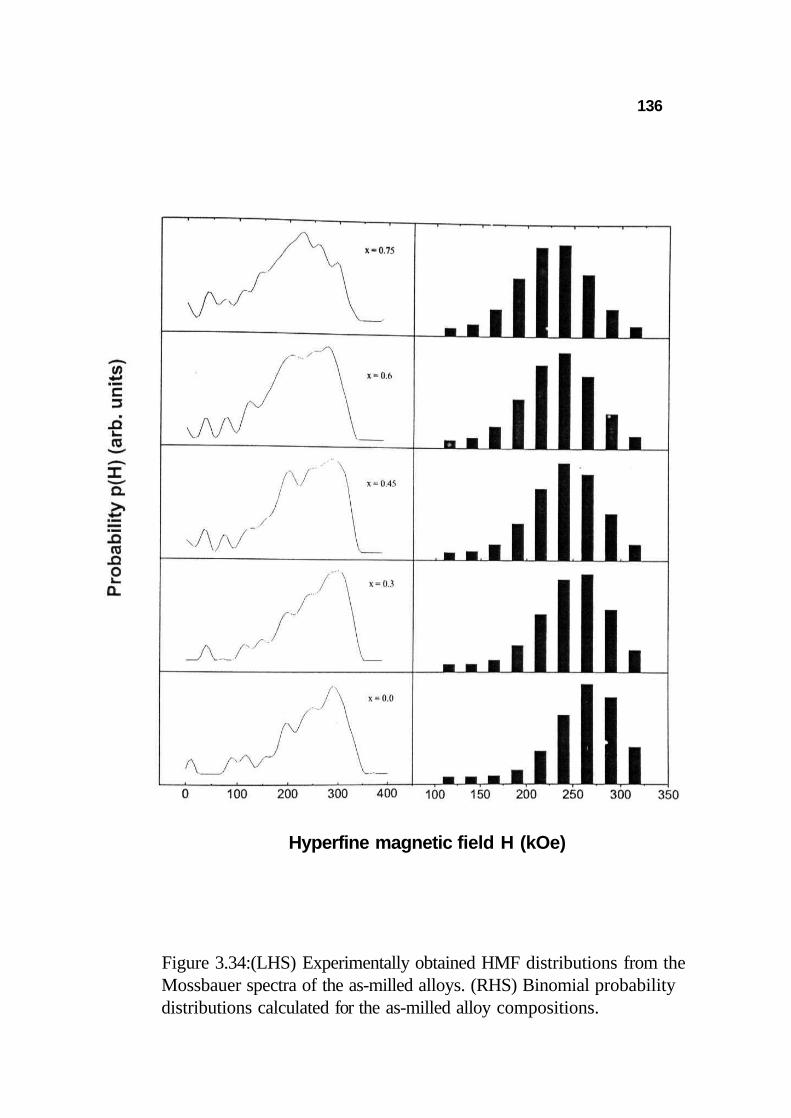
136
Hyperfine magnetic field H (kOe)
Figure 3.34:(LHS) Experimentally obtained HMF distributions from theMossbauer spectra of the as-milled alloys. (RHS) Binomial probabilitydistributions calculated for the as-milled alloy compositions.
137
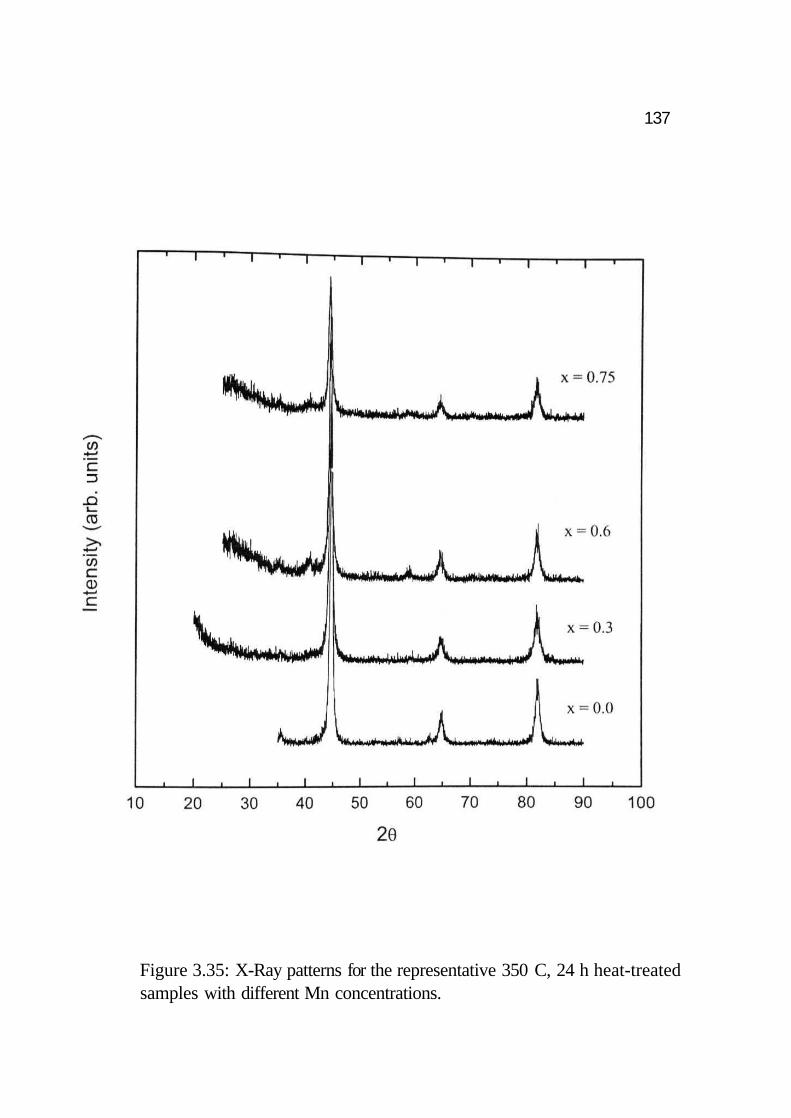
Figure 3.35: X-Ray patterns for the representative 350 C, 24 h heat-treatedsamples with different Mn concentrations.
138
Narrowing of line widths of the bcc phase lines in comparison to the as-milled
patterns shows the grain coarsening and no other lines were present except the
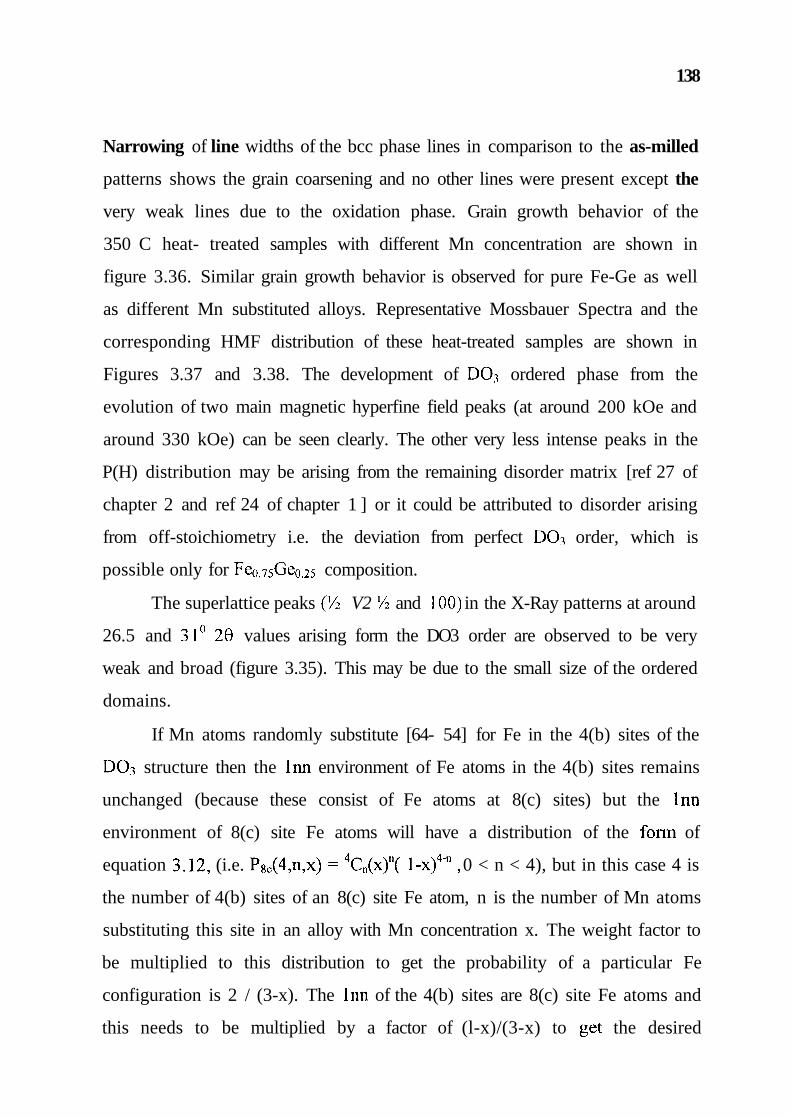
very weak lines due to the oxidation phase. Grain growth behavior of the
350 C heat- treated samples with different Mn concentration are shown in
figure 3.36. Similar grain growth behavior is observed for pure Fe-Ge as well
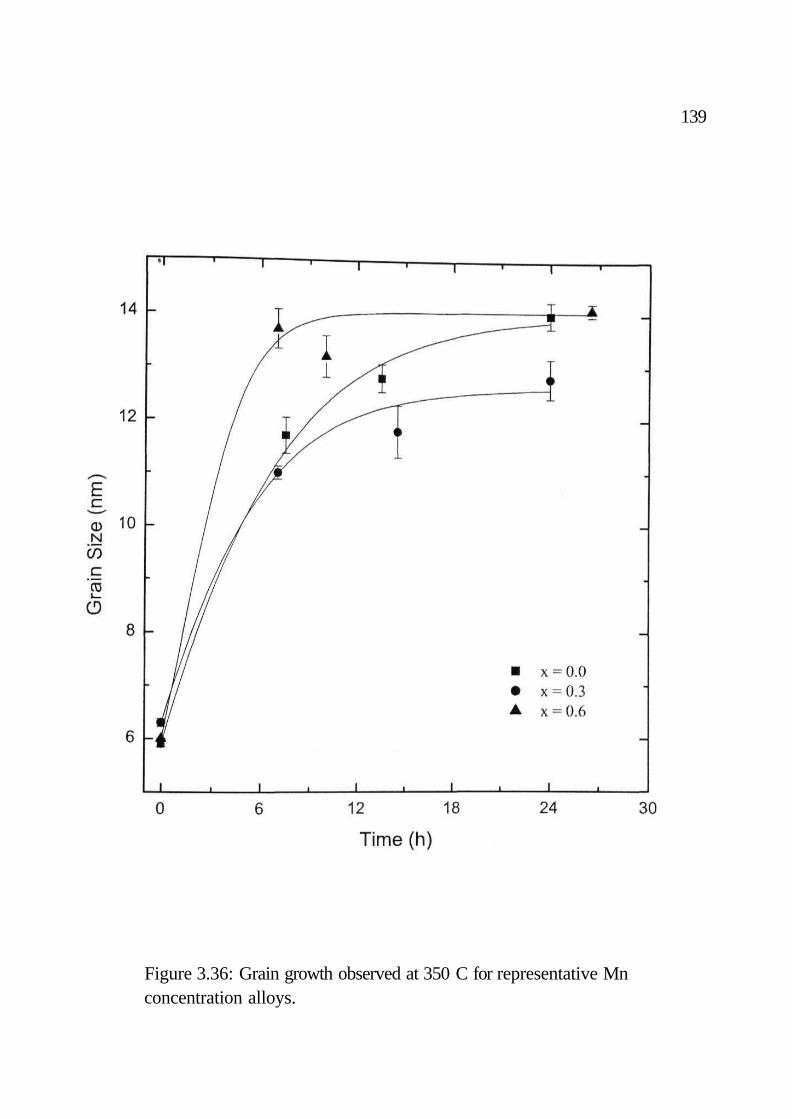
as different Mn substituted alloys. Representative Mossbauer Spectra and the
corresponding HMF distribution of these heat-treated samples are shown in
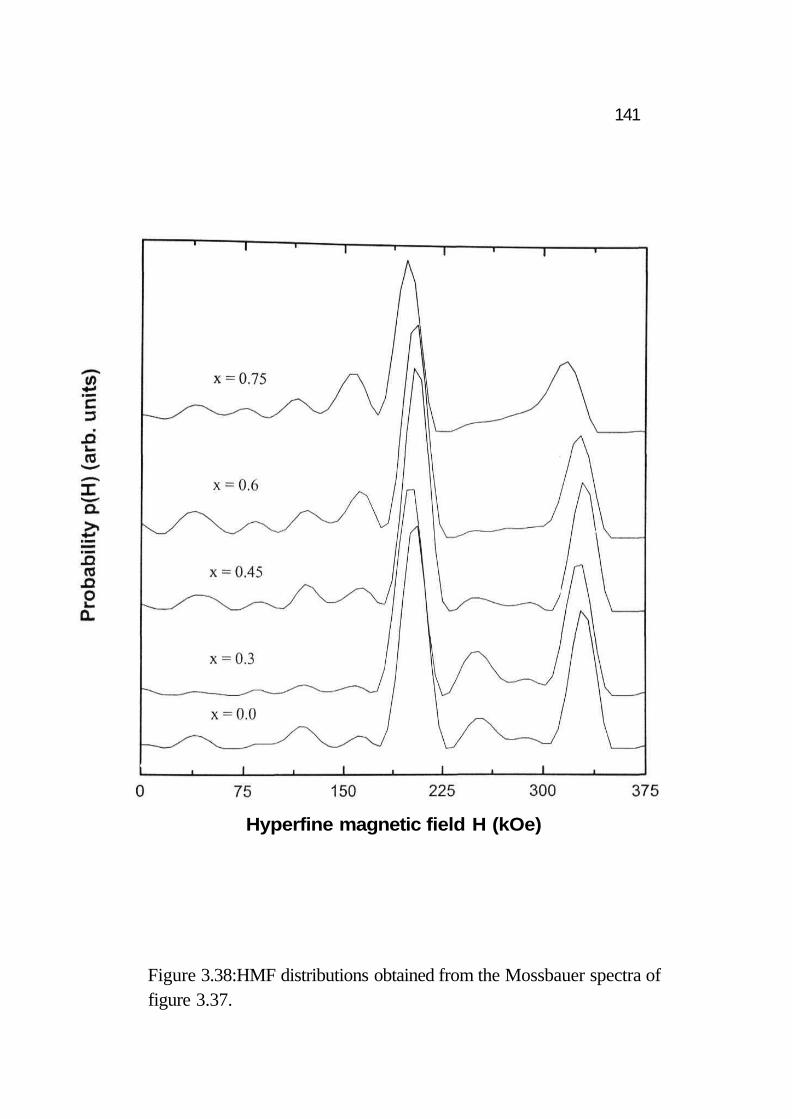
Figures 3.37 and 3.38. The development of DO3 ordered phase from the
evolution of two main magnetic hyperfine field peaks (at around 200 kOe and
around 330 kOe) can be seen clearly. The other very less intense peaks in the
P(H) distribution may be arising from the remaining disorder matrix [ref 27 of
chapter 2 and ref 24 of chapter 1 ] or it could be attributed to disorder arising
from off-stoichiometry i.e. the deviation from perfect DO3 order, which is
possible only for Feo.75Geo.25 composition.
The superlattice peaks QA V2 lA and 100) in the X-Ray patterns at around
26.5 and 31° 2G values arising form the DO3 order are observed to be very
weak and broad (figure 3.35). This may be due to the small size of the ordered
domains.
If Mn atoms randomly substitute [64- 54] for Fe in the 4(b) sites of the
DO3 structure then the Inn environment of Fe atoms in the 4(b) sites remains
unchanged (because these consist of Fe atoms at 8(c) sites) but the Inn
environment of 8(c) site Fe atoms will have a distribution of the fonn of
equation 3.12, (i.e. P8c(4,n,x) = 4Cn(x)n( 1-x)4n, 0 < n < 4), but in this case 4 is
the number of 4(b) sites of an 8(c) site Fe atom, n is the number of Mn atoms
substituting this site in an alloy with Mn concentration x. The weight factor to
be multiplied to this distribution to get the probability of a particular Fe
configuration is 2 / (3-x). The Inn of the 4(b) sites are 8(c) site Fe atoms and
this needs to be multiplied by a factor of (l-x)/(3-x) to get the desired
139
Figure 3.36: Grain growth observed at 350 C for representative Mnconcentration alloys.
140
Velocity (mm/sec)
Figure 3.37: Representative Mossbauer spectra of the 350°C, 24 h heat-treated samples with different Mn concentrations.
141
Hyperfine magnetic field H (kOe)
Figure 3.38:HMF distributions obtained from the Mossbauer spectra offigure 3.37.
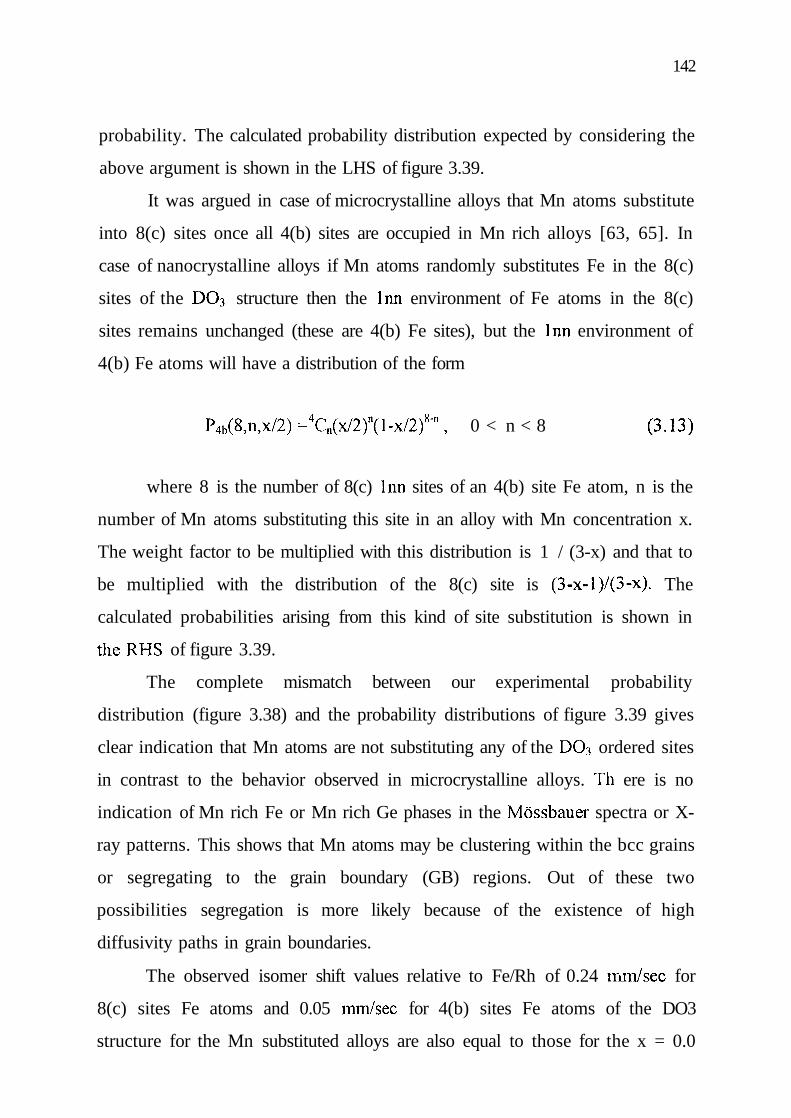
142
probability. The calculated probability distribution expected by considering the
above argument is shown in the LHS of figure 3.39.
It was argued in case of microcrystalline alloys that Mn atoms substitute
into 8(c) sites once all 4(b) sites are occupied in Mn rich alloys [63, 65]. In
case of nanocrystalline alloys if Mn atoms randomly substitutes Fe in the 8(c)
sites of the DO3 structure then the Inn environment of Fe atoms in the 8(c)
sites remains unchanged (these are 4(b) Fe sites), but the Inn environment of
4(b) Fe atoms will have a distribution of the form
P4b(8,n,x/2) - 4Cn(x/2)"(l-x/2)8"n, 0 < n < 8 (3.13)
where 8 is the number of 8(c) Inn sites of an 4(b) site Fe atom, n is the
number of Mn atoms substituting this site in an alloy with Mn concentration x.
The weight factor to be multiplied with this distribution is 1 / (3-x) and that to
be multiplied with the distribution of the 8(c) site is (3-x-l)/(3-x). The
calculated probabilities arising from this kind of site substitution is shown in
the RHS of figure 3.39.
The complete mismatch between our experimental probability
distribution (figure 3.38) and the probability distributions of figure 3.39 gives
clear indication that Mn atoms are not substituting any of the DO3 ordered sites
in contrast to the behavior observed in microcrystalline alloys. Tli ere is no
indication of Mn rich Fe or Mn rich Ge phases in the Mossbauer spectra or X-
ray patterns. This shows that Mn atoms may be clustering within the bcc grains
or segregating to the grain boundary (GB) regions. Out of these two
possibilities segregation is more likely because of the existence of high
diffusivity paths in grain boundaries.
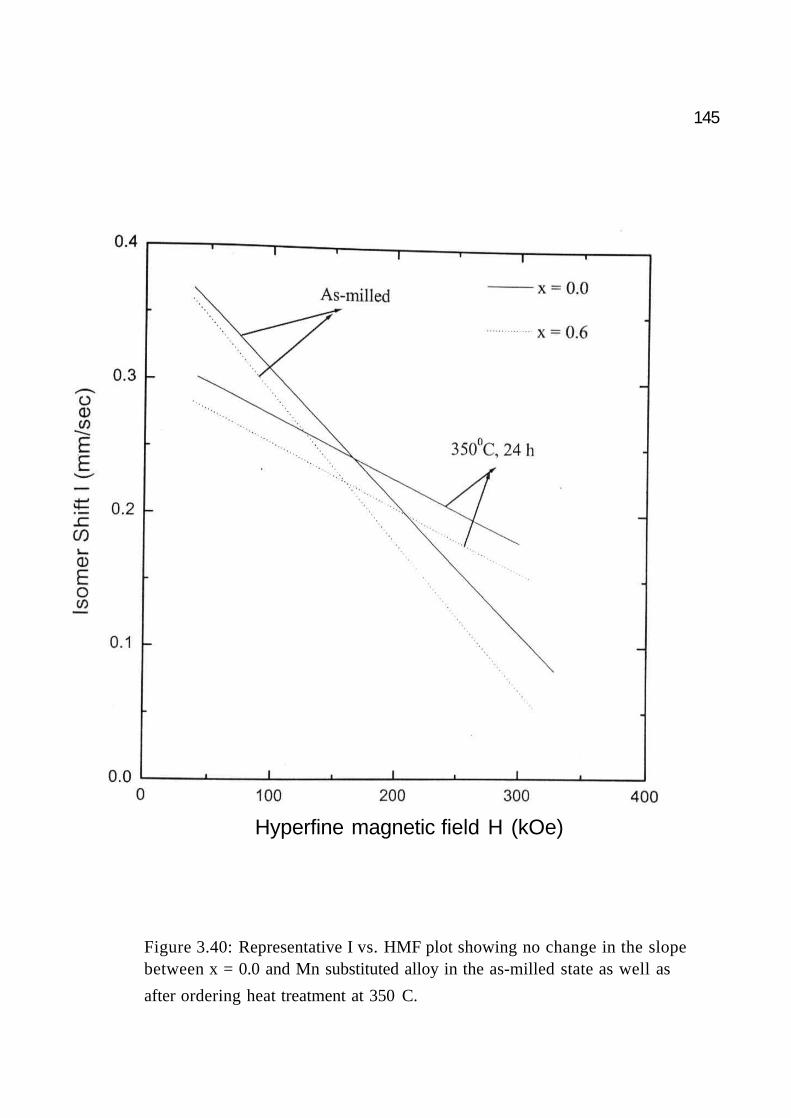
The observed isomer shift values relative to Fe/Rh of 0.24 mm/sec for
8(c) sites Fe atoms and 0.05 mm/sec for 4(b) sites Fe atoms of the DO3
structure for the Mn substituted alloys are also equal to those for the x = 0.0
143
Hyperfine magnetic field H (kOe)
Figure 3.39:Expected HMF distributions assuming Mn atoms substitutingeither 4{b) or 8(c) sites of the DO3 structure.
144
alloy and match very well with the previously reported values of Feo.79Geo.21
alloy system [59]. The ratio of Gaussian areas of Mn substituted alloys for the
8(c) site field and 4(b) site field in the DO3 structure is close to 2:1, which is
expected only for a pure stoichiometric alloy of Fe3Ge composition. This once
again indicates segregation of Mn atoms away from Fe neighborhood. Another
evidence of Mn segregation is the comparison of the Isomer shift vs. HMF
plots, shown in figure 3.40 between the as-milled and heat-treated samples of
the pure and Mn substituted Fe-Ge alloys. The slope of the curves indeed
changes after short range ordering takes place in the alloys but both the curves
are parallel which would not have been the case if Mn atoms substitute into
DO3 sites and hence give rise to a considerable probability for configurations
with different number of Fe Inn than 4 and 0 Fe Inn and a measurable change
in isomer shift.
The short range ordering process was studied by defining the short range
order parameter (S(4)) according to equation 3.8. The value of poco was
assigned to be 0.67 based on the observed intensity ratio of 2:1 for the 8(c)
sites and 4(b) sites peaks. Figure 3.41 shows the kinetic evolution of S(4)
parameter in case of representative samples. This behavior is analogous with
the behavior obtained in case of nanocrystalline Fe-Al alloy system. The
development of the S(4) parameter is similar for the x=0.0, 0.3 and 0.45 alloys
and it is less for the x = 0.6 and 0.75 alloys. Figure 3.42 shows the behavior of
the S(4) with Mn composition after 24 hours heat treatment. This behavior is
expected for a larger deviation from A3B stoichiometry due to Mn segregation.
Figure 3.43 shows the parametric plot between the evolution of grain size and
S(4). It is seen that the growth of the grains and evolution of short-range order
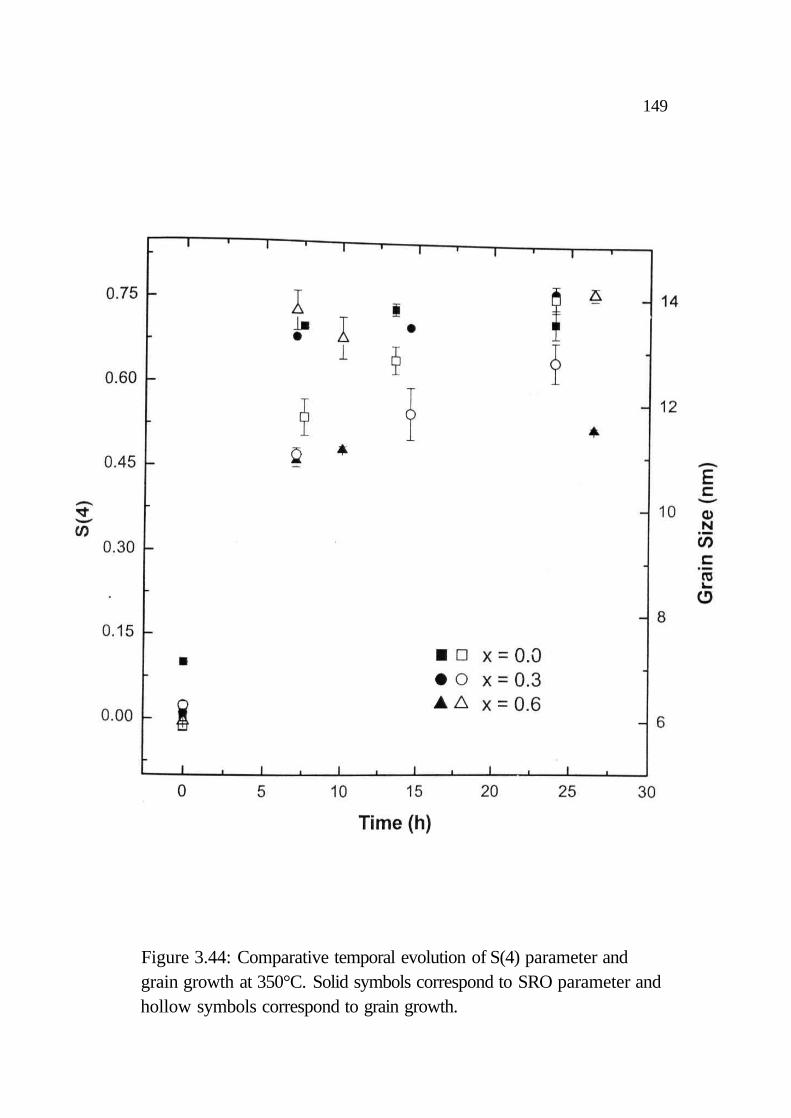
are correlated independent of the alloy compositions. Figure 3.44 shows the
comparative temporal evolution of S(4) parameter and grain growth in the
alloy systems at 350°C. It can be seen that both the processes take place on the
145
Hyperfine magnetic field H (kOe)
Figure 3.40: Representative I vs. HMF plot showing no change in the slopebetween x = 0.0 and Mn substituted alloy in the as-milled state as well as
after ordering heat treatment at 350 C.

146
Time (h)
Figure 3.41: Temporal evolution of the short range order parameter at 350 C.

147
Mn Composition
Figure 3.42: The dependence of short range order parameter on Mn
concentration after 24 h heat treatment at 350°C.

148
Figure 3.43: Parametric plot between grain size and short-range order
parameter at 350 C.
149
Figure 3.44: Comparative temporal evolution of S(4) parameter andgrain growth at 350°C. Solid symbols correspond to SRO parameter andhollow symbols correspond to grain growth.
150
same time scale. This indicates that the underlying mechanism for atom
diffusion is the same for ordering as well as segregation.
In conclusion, it was observed that Mn substitution in the nanocrystalline
Fe-Ge alloy system leads to grain boundary segregation of Mn atoms on
ordering heat treatments of the initially disordered homogeneous as-milled
alloy state. This was in contrast to bulk Fe3X alloys where Mn substitutes at
preferential sites in the DO3 structure up to a large concentration. The
development of DO3 chemical short-range order and grain growth proceed on
the same time scale at 350°C.
3.3 Quasi Binary Systems (FeCo-X, X = 4 at. % Mo, Ge, W)
a Introduction
The kinetic evolution to the chemically ordered equilibrium state of an
ordering alloy from its initial disordered state has been a subject of many
interesting studies but not fully understood [6, 66]. It has been argued that for a
ternary alloy where the state of order is characterized by two order parameters
the alloy may develop various combinations of the order parameters in the
approach to the final equilibrium state [67]. The initial and final states may be
connected by different chains of intermediate states i.e. for a given value of one
order parameter, the other order parameter need not have a unique value. It was
shown using Master Equation formulation that these chains of kinetic evolution
towards the final equilibrium order or 'kinetic paths' were temperature
dependent when the atomic species of the alloy had different activation energy
barrier heights for diffusive jumps or different interatomic interactions.
FeCo phase diagram (figure 3.45) shows a large region of B2 order and a
Mossbauer spectroscopic study on the kinetics of chemical ordering in several
piston-anvil quenched FeCo-X alloys (X = W, Nb, Mo, Cr, Ti, V, and Al)
showed that the kinetics of B2 ordering was slowed down for the 4d and 5d
solutes but the 3p and 3d series elements did not affect the ordering kinetics
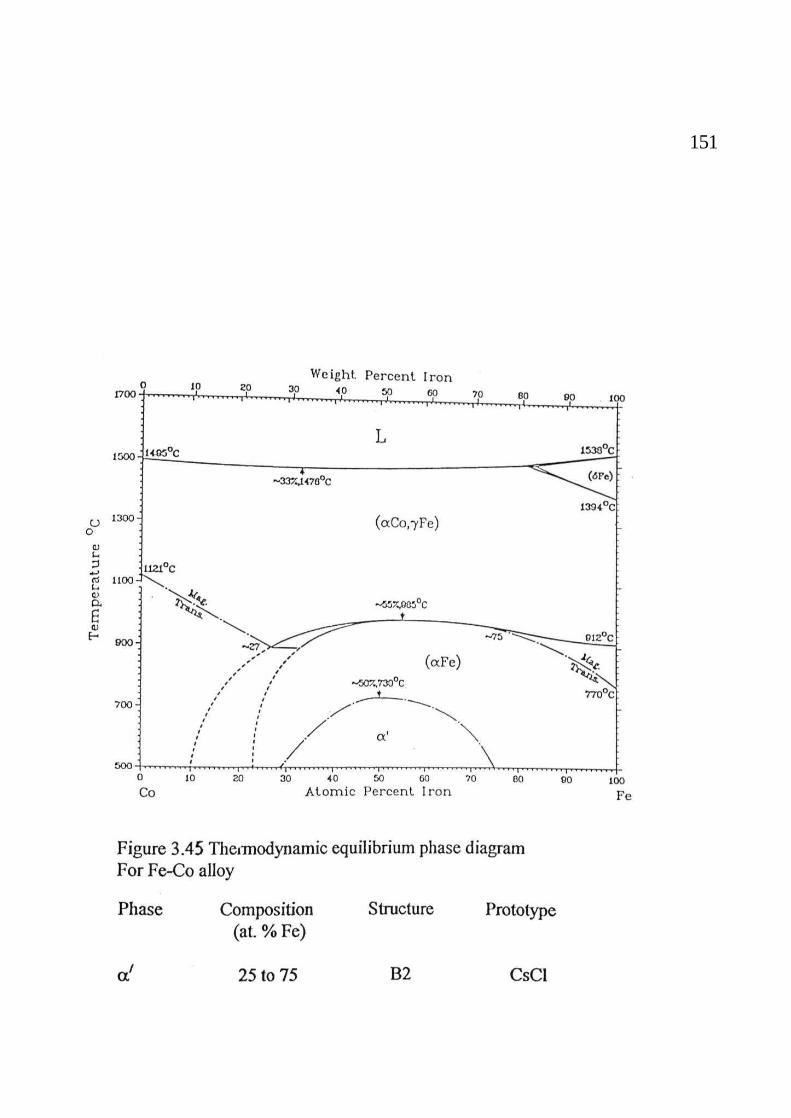
151

152
[68]. This was understood to arise due to the lesser mobility of the W, Nb and
Mo solutes. A more detailed investigation of the FeCo-Mo system was
subsequently carried out to observe differences in kinetic paths of the Warren-
Cowley short-range order parameters ctMo/Fe and occo/Fe at different temperatures
[69]. The kinetic paths at 350°C and 400°C were indeed observed to be
different albeit not as much as predicted from model calculations. The
temperature dependence of kinetic paths was attributed to the high activation
energy barrier for diffusive jump of Mo atoms.
In this section we will discuss our studies on the kinetic behavior of the
FeCo-X alloys prepared in the nanocrystalline state by the process of
mechanical alloying to see the effect of the nanocrystalline nature of the alloys
on the ordering process. The kinetic evolution of B2 order in nanocrystalline
FeCo-X alloys was studied at different temperatures using Mossbauer
spectroscopy and powder XRD techniques. We found that the kinetic paths
were essentially the same at different temperatures. This suggests that the
larger grain boundary regions in these nanocrystalline alloys act as short
circuited diffusion paths and give rise to an increased rate of diffusion for all
the atomic species constituting the alloys [70, ref 194 of chapter 1].
3.3.1 Fe-Co-Mo
a Experimental
FeCo-4 at. % Mo alloys were prepared by direct mechanical milling of
the elemental Fe (99.99% purity, fine gray powder from Aldrich-Sigma
Chemicals), Co (m2N8, spherical -325 mesh, from Alfa Products) and Mo
(m3N±, -200 mesh, from Alfa Products) powders. The sample was initially
milled for 24 hours, but this was not sufficient to produce a completely
disordered alloy. It was in partially ordered state as evident from the area of the
satellite peak in the Mossbauer spectra, being less than mat expected for a
153
random distribution. The milling time was therefore increased to 50 hours to
obtain a completely disordered alloy with the satellite peak area corresponding
to that of a binomial distribution of a random alloy. The as-milled alloys were
formed in single-phase disordered bcc structure as confirmed by the X-ray
diffraction (XRD) pattern. The average grain size obtained from XRD pattern
of the as-milled alloy was about 10 nm. Both the 24 h and 50 h milled samples
were heat treated under argon atmosphere in borosilicate glass ampoules at a
pressure of 0.05 Torr for various periods of time ranging from few minutes to
several hours at 250°, 300°, 350° and 400°C to follow the evolution of B2 order
in these samples. Mossbauer spectra with good statistics were recorded and-the
HMF distributions evaluated from the spectra were fitted to two Gaussian, one
corresponding to the main peak and the other corresponding to the satellite
peak.
b Results and Discussions
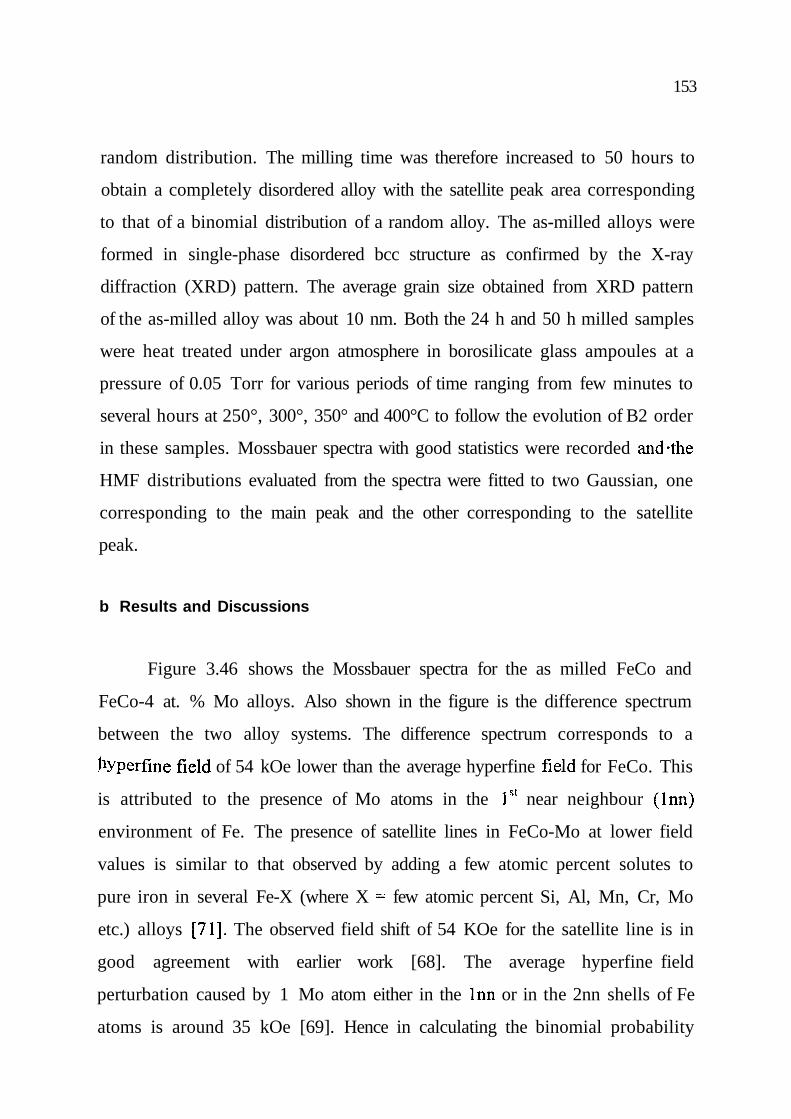
Figure 3.46 shows the Mossbauer spectra for the as milled FeCo and
FeCo-4 at. % Mo alloys. Also shown in the figure is the difference spectrum
between the two alloy systems. The difference spectrum corresponds to a
Jtyperfine field of 54 kOe lower than the average hyperfine field for FeCo. This
is attributed to the presence of Mo atoms in the 1st near neighbour (Inn)
environment of Fe. The presence of satellite lines in FeCo-Mo at lower field
values is similar to that observed by adding a few atomic percent solutes to
pure iron in several Fe-X (where X = few atomic percent Si, Al, Mn, Cr, Mo
etc.) alloys [71]. The observed field shift of 54 KOe for the satellite line is in
good agreement with earlier work [68]. The average hyperfine field
perturbation caused by 1 Mo atom either in the Inn or in the 2nn shells of Fe
atoms is around 35 kOe [69]. Hence in calculating the binomial probability
154
Figure 3.46: Mossbauer spectra for nanocrystalline disordered bcc FeCoand FeCo-4 at. % Mo alloys (symbols: exp, solid lines:fit). The differencespectrum shows that Mo addition to FeCo gives rise to a satellite linecorresponding to a reduced hyperfine field value.

155
distribution for the disordered alloy we considered both the nearest neighbours
and probability distribution of the form
(3.14)
Where c is the concentration of the solute, 8 and 6 are the total possible
number of lsl and 2nd nn, and x and y are the number of solute atoms in these
nn shells.
The experimentally obtained Mo satellite peak area corresponded well to
a random distribution of 1 Mo atom in the first nearest neighbour shell of Fe
and 0 Mo atom in the 2'^ as calculated using x=l and y=0 in the above
binomial distribution, which confirmed the formation of a disordered bcc (a
phase) homogeneous solid solution in the as-milled state.
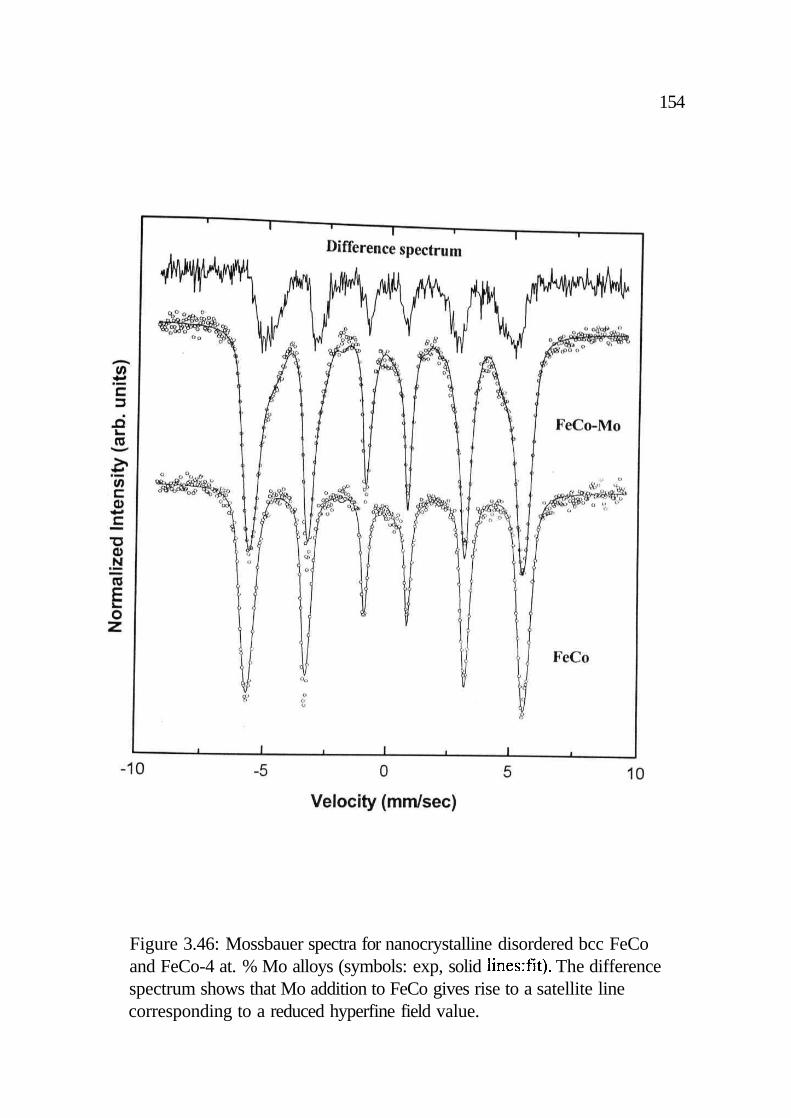
After ordering heat treatments the width of the main peak as well as the
intensity of the satellite peak decrease as shown in Figure 3.47. The area of the
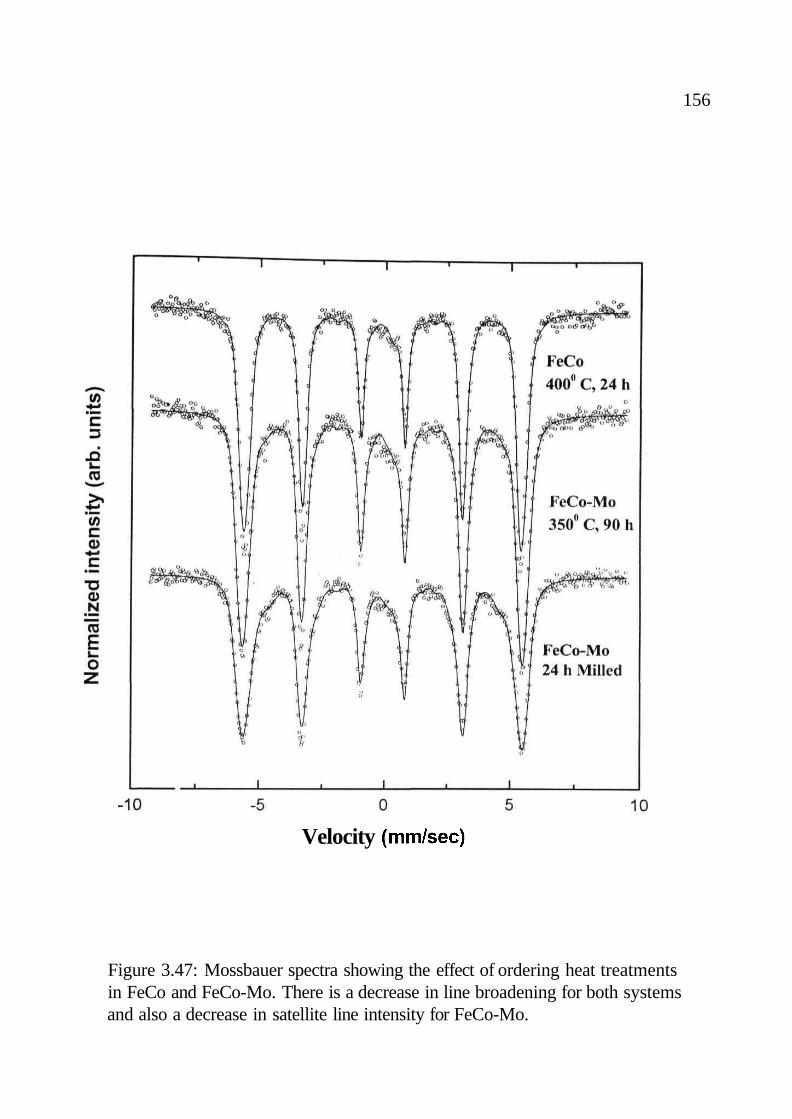
main peak on the other hand increases. The hyperfine magnetic field
distributions evaluated from the Mossbauer spectra are shown in Figure 3.48.
The Mossbauer Spectrum for as milled FeCo sample shows a six line magnetic
hyperfine field split pattern with broadened lines, having outer line width equal
to 0.52 mm/sec as compared to 0.30 mm/sec for natural Fe. The hyperfine
magnetic field is detennined to be 349.4 kOe from the splitting of the outer
lines. Ordering of the alloy by heat treatment at 400° C for 24 hours gave
narrower lines and a hyperfine magnetic field of 343.8 kOe. These results are
in good agreement with earlier reported value for quenched and annealed
samples [72]. This shows Ahat B2 ordering in FeCo decreases the magnetic
hyperfine field at Fe sites relative to the disordered state of the alloy.
From these observations and also from earlier studies of disorder—>B2
order transfonnation in pure FeCo it is known that the width of the hyperfine
distribution decreases with increase in chemical order due to a change in Inn
156
Velocity (mm/sec)
Figure 3.47: Mossbauer spectra showing the effect of ordering heat treatmentsin FeCo and FeCo-Mo. There is a decrease in line broadening for both systemsand also a decrease in satellite line intensity for FeCo-Mo.
157
Hyperfine magnetic field H (kOe)
Figure 3.48: Hyperfine magnetic field distributions evaluated from theMossbauer spectra. The evolution of B2 order is reflected from thedecrease in the widths and increase in the intensities of the main peakas well as from the decrease in the intensity of the satellite peak.
158
environment from a random distribution to that of an ordered arrangement of
all Co neighbours. The width of the main peak is therefore an appropriate
measure of the <Co/Fe> correlation. Similarly as the order develops more and
more configurations correspond to Fe atoms with Co neighbours and the area
of the main peak increases; therefore this area can also be considered as a
measure of the <Co/Fe> correlation.
The area of the satellite peak corresponds to the <Mo/Fe>
correlation. A decrease in Mo satellite area (Figures 3.47 and 3.48) as ordering
takes place, shows that Mo atoms move away from Inn shell of Fe to a Co near
neighbour environment. This is in agreement with the metallic bonding theory
of Miedema [73] according to which Co-Mo bonding is preferred to Fe-Mo
bonding.
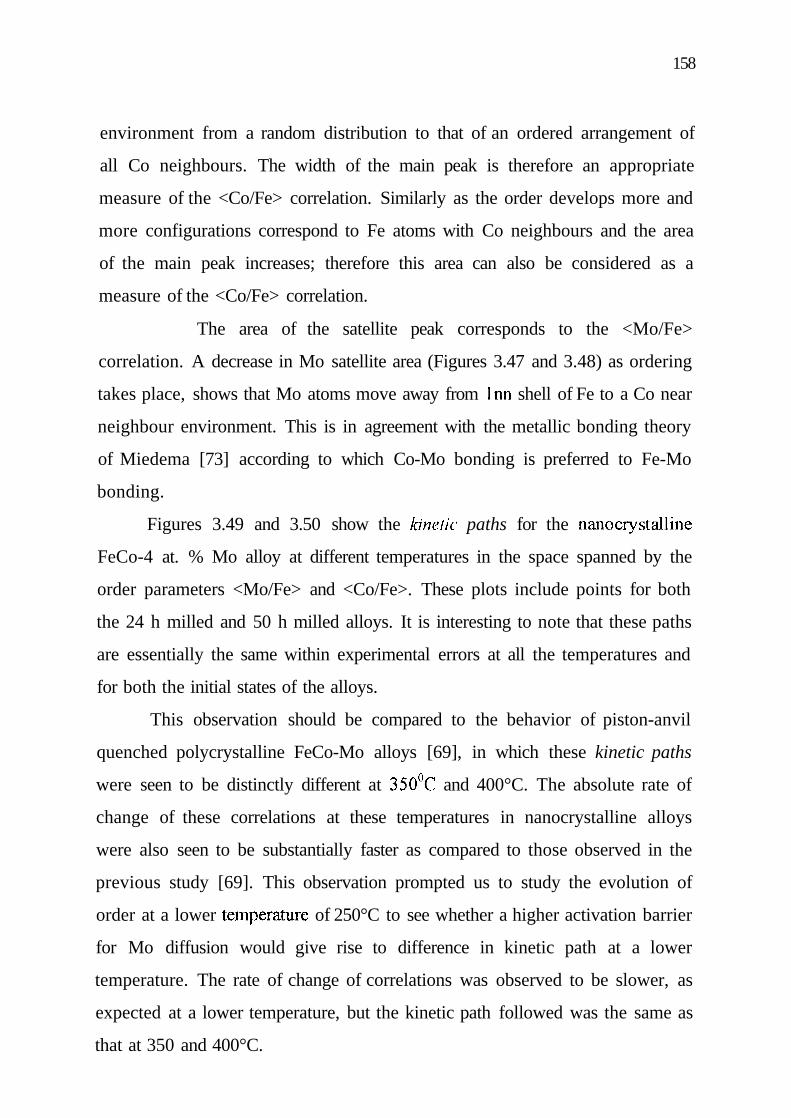
Figures 3.49 and 3.50 show the kinetic paths for the nanociystalline
FeCo-4 at. % Mo alloy at different temperatures in the space spanned by the
order parameters <Mo/Fe> and <Co/Fe>. These plots include points for both
the 24 h milled and 50 h milled alloys. It is interesting to note that these paths
are essentially the same within experimental errors at all the temperatures and
for both the initial states of the alloys.
This observation should be compared to the behavior of piston-anvil
quenched polycrystalline FeCo-Mo alloys [69], in which these kinetic paths
were seen to be distinctly different at 350°C and 400°C. The absolute rate of
change of these correlations at these temperatures in nanocrystalline alloys
were also seen to be substantially faster as compared to those observed in the
previous study [69]. This observation prompted us to study the evolution of
order at a lower temperature of 250°C to see whether a higher activation barrier
for Mo diffusion would give rise to difference in kinetic path at a lower
temperature. The rate of change of correlations was observed to be slower, as
expected at a lower temperature, but the kinetic path followed was the same as
that at 350 and 400°C.

159
Figure 3.49: Kinetic paths for B2 ordering in nanocrystalline FeCo-Moat different temperatures. The <Co/Fe> and <Mo/Fe> correlations aremeasured by the width of the main peak and the intensity of the satellitepeak, respectively.
160
Figure 3.50: An alternative representation of the kinetic paths for B2ordering in tenns of the intensity of the satellite peak and the intensityof the main peak.
Fractional area of the main peak
161
We are therefore convinced that the kinetic path behavior of the
nanocrystalline system is intrinsically related to the nanocrystalline nature of
the ball-milled alloys. The main difference between the macrocrystalline and
nanocrystalline systems is the presence of large volume fraction of grain
boundary regions. These boundary regions provide short-circuited paths for
diffusion of atoms [70, ref 194 of chapter 1]. The activation energy of diffusion
for the different atoms along these short-circuited paths may not be
substantially different and thus give rise to identical kinetic paths for ordering.
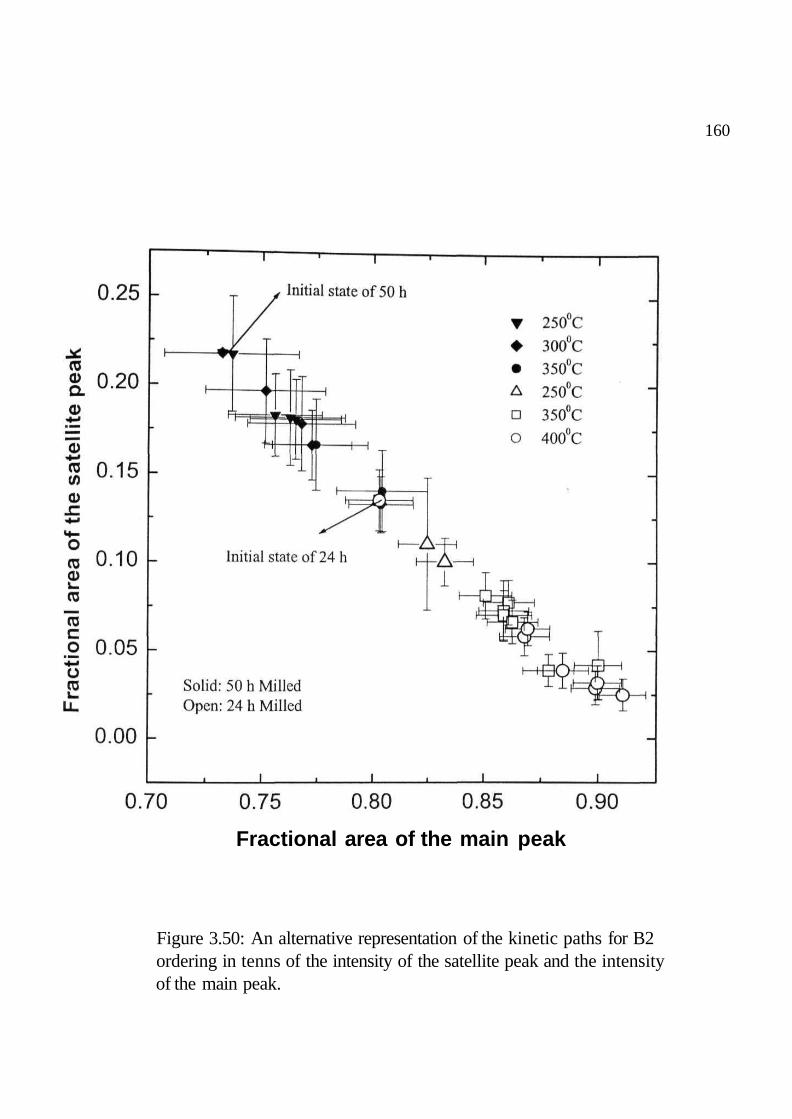
3.3.2 FeCo-Ge System
The evolution of B2 order in a disordered Fe-48 at. % Co- 4 at % Ge
alloy was studied. We followed the kinetics of first neighbour <Fe/Co> and
<Fe/Ge> correlation and obtained the kinetic paths to determine their
temperature dependency. The disordered alloy was prepared by MA and was
subjected to heat treatments at 200, 250, 300, 350 and 400° C under Argon
atmosphere for various periods of times to study the evolution of B2 SRO in
the system. Homogeneous and chemically disordered bcc (a) phase alloy was
produced as a result of MA as shown by the Mossbauer Spectra (figure 3.51)
and the corresponding HMF distributions (figure 3.52) of FeCo and FeCo-Ge
alloys. The presence of the satellite peak for the Fe-48 at. % Co-4 at. % Ge as
milled sample is evident (figures 3.51 and 3.52), which is attributed to the
presence of Ge in the first nn shell of Fe. The field shift between the main peak
d the 1 Ge Inn peak is 24.9 kOe, in good agreement with the field shift of 24
kOe observed in Fe-6 at. % Ge alloy [74]. The HMF distributions were fitted to
two Gaussian, one corresponding to main peak and the other corresponding to
satellite peak. The experimentally obtained Ge satellite peak area corresponded
well to a random distribution of 1 Ge atom in the first nearest neighbour shell
162
Figure 3.51: Mossbauer spectra of the as-milled Fe-Co and FeCo-Ge alloys,showing the presence of satellite line in the Ge containing sample. Mossb-auer spectra of different heat-treated samples of FeCo-Ge alloy showingthe evolution of B2 order in the system.

163
Figure 3.52: HMF distributions of as-milled Fe-Co and FeCo-Ge alloysshowing the formation of the alloy in a phase. The evolution of B2order on ordering heat-treatment accompanied by the depletion of Geatoms from the Inn environment of Fe is seen from the decrease in thesatellite peak area and incraese in the main peak area in the correspondingfield distributions of the heat-treated samples.
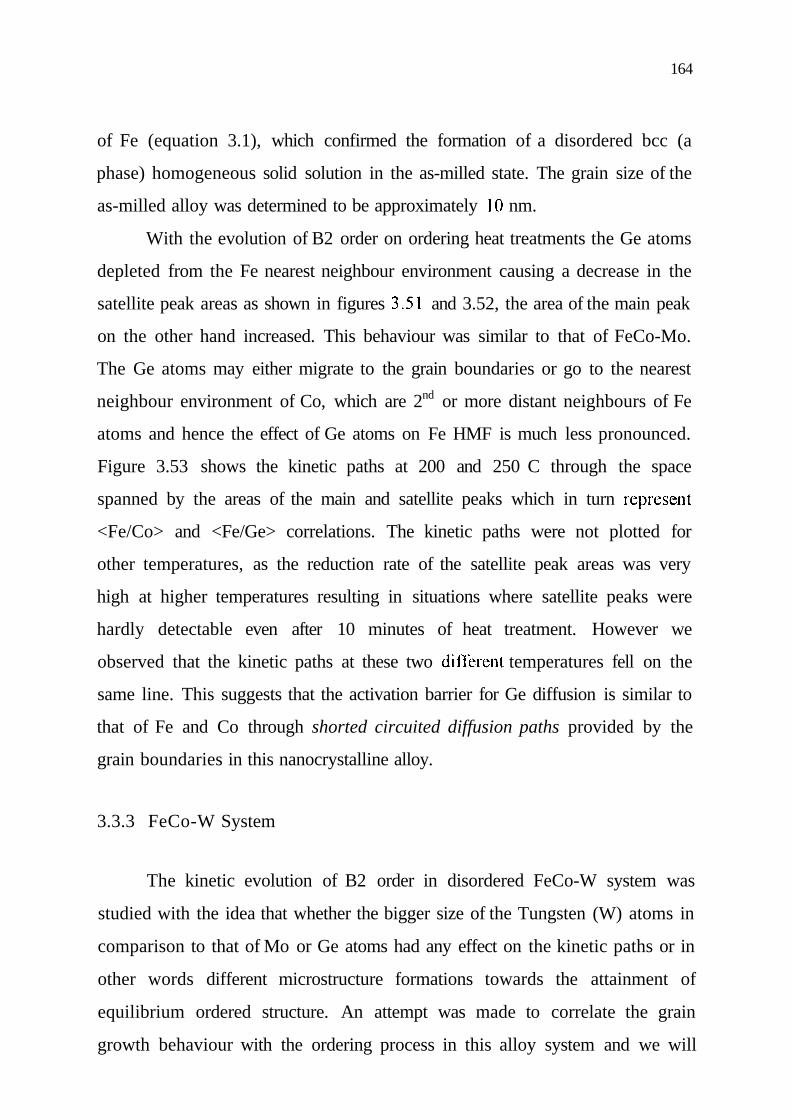
164
of Fe (equation 3.1), which confirmed the formation of a disordered bcc (a
phase) homogeneous solid solution in the as-milled state. The grain size of the
as-milled alloy was determined to be approximately 10 nm.
With the evolution of B2 order on ordering heat treatments the Ge atoms
depleted from the Fe nearest neighbour environment causing a decrease in the
satellite peak areas as shown in figures 3.51 and 3.52, the area of the main peak
on the other hand increased. This behaviour was similar to that of FeCo-Mo.
The Ge atoms may either migrate to the grain boundaries or go to the nearest
neighbour environment of Co, which are 2nd or more distant neighbours of Fe
atoms and hence the effect of Ge atoms on Fe HMF is much less pronounced.
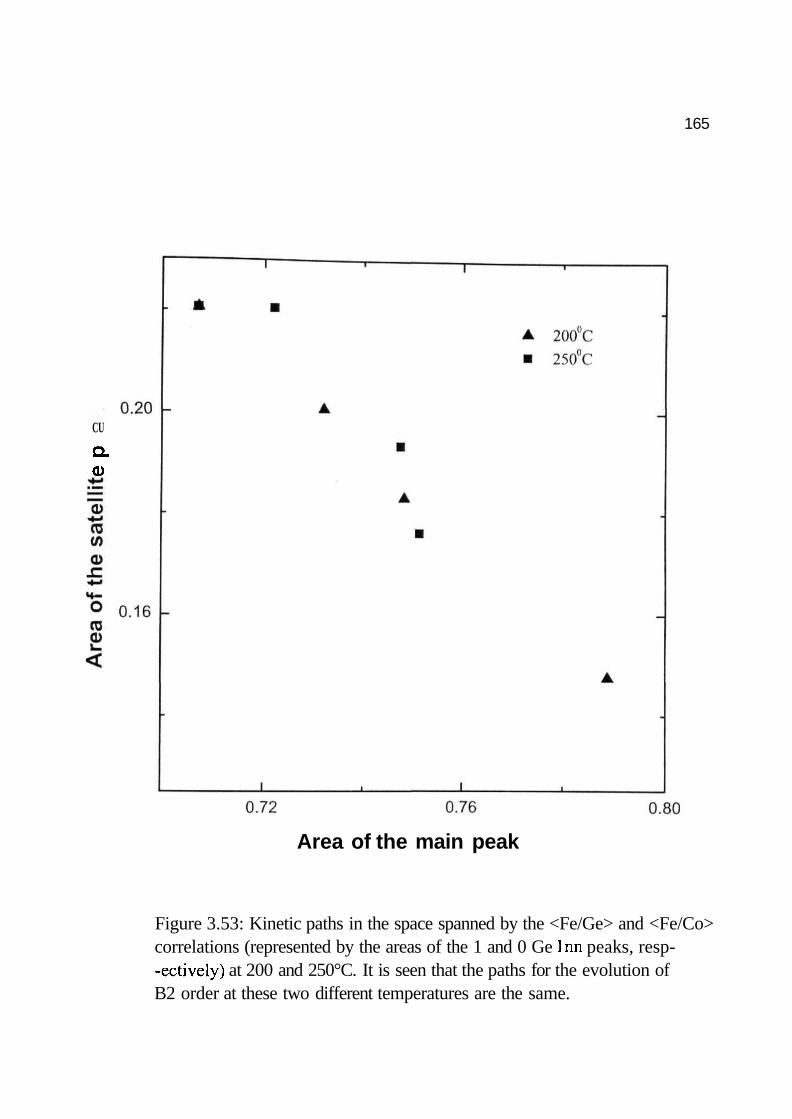
Figure 3.53 shows the kinetic paths at 200 and 250 C through the space
spanned by the areas of the main and satellite peaks which in turn represent
<Fe/Co> and <Fe/Ge> correlations. The kinetic paths were not plotted for
other temperatures, as the reduction rate of the satellite peak areas was very
high at higher temperatures resulting in situations where satellite peaks were
hardly detectable even after 10 minutes of heat treatment. However we
observed that the kinetic paths at these two different temperatures fell on the
same line. This suggests that the activation barrier for Ge diffusion is similar to
that of Fe and Co through shorted circuited diffusion paths provided by the
grain boundaries in this nanocrystalline alloy.
3.3.3 FeCo-W System
The kinetic evolution of B2 order in disordered FeCo-W system was
studied with the idea that whether the bigger size of the Tungsten (W) atoms in
comparison to that of Mo or Ge atoms had any effect on the kinetic paths or in
other words different microstructure formations towards the attainment of
equilibrium ordered structure. An attempt was made to correlate the grain
growth behaviour with the ordering process in this alloy system and we will
165
CU
Q.0
Area of the main peak
Figure 3.53: Kinetic paths in the space spanned by the <Fe/Ge> and <Fe/Co>correlations (represented by the areas of the 1 and 0 Ge Inn peaks, resp-ectively) at 200 and 250°C. It is seen that the paths for the evolution ofB2 order at these two different temperatures are the same.
166
see that the underlying atomic diffusion responsible for grain growth as well as
ordering process is the same.
Powder mixtures satisfying the composition Feo.4sCoo.48Wo.o4 were
subjected to MA. Initially the powder mixture was milled for 24 hours, which
was found not to be sufficient for the homogeneous disordered bcc alloy to
form. The presence of unmixed W lines in the powder XRD pattern was
observed after 24 hours. The unmixed W lines in the X-ray patterns were
indexed according to the JCPDS-1CDD (1999) data of pure W with PDF
numbers 01-1203, 01-1204 and 04-0806. Hence the powder mixture was milled
consecutively up to a total time of 123 hours till the disordered alloy was
formed. XRD patterns and Mossbauer spectra were recorded at each stage of
milling to monitor the formation of the alloy. Figure 3.54 shows the sequence
of XRD patterns for different times of milling. The final composition after
milling for 123 hours was (FeCo)0.97Wo.03 as determined by EDAX
measurement. The Mossbauer spectrum of the final as-milled sample is shown
in figure 3.55; the presence of satellite line due to presence of W atoms in the
nearest neighbour environment of Fe is evident in the spectrum as well as in
the corresponding HMF distribution. The HMF perturbations due to Inn and
2nn W atoms of Fe atoms were found to be around 46 and 25 kOe respectively
from the earlier measurements [ref 32 from chapter 2]. The contributions from
both the nn are substantial and in determining the satellite peak area for the
disordered alloy we need to use equation 3.14. The field shift of around 50 kOe
for the satellite peak (w.r.t to the main peak at around 350 kOe) in our
experimental data is in accordance with the Inn 1 W HMF perturbation. The
field distribution was fitted to two Gaussian, corresponding to main and
satellite peaks respectively, and the experimental area of the satellite peak after
123 hours of milling matched well with the calculated probabilities with x=l
and y=0 and c=0.03 in equation 3.14. The above findings from XRD and
Mossbauer spectroscopic data confirm the formation of the alloy in a

167
26
Figure 3.54: XRD patterns recorded at each stage of milling to monitor theformation of the homogeneous FeCo-W alloy.

168
Figure 3.55: Mossbauer spectra of the as-milled and various heat treatedsamples (symbols:exp; line:fit) show the decrease in the satellite peakintensity and increase in main peak intensity as the B2 order evolvesfrom the disordered matrix. The sequence of the spectra (top-bottom) isaccording to the sequence of the legends.
169
disordered bcc (a) phase after 123 hours of milling. The as-milled grain size
obtained from the line broadening of the X-ray line was around 9.5 nm.
The as-milled alloy was subjected to ordering heat treatments at 250,
300, 350, and 400°C for periods of times ranging from few minutes to few
hours. On ordering heat treatments the W atoms depleted from the Fe nearest
neighbour environment causing a decrease in the satellite peak areas as shown
in the representative Mossbauer spectra and corresponding HMF distributions
in figures 3.55 and 3.56. But there were no extra lines apart from the bcc lines
observed in the X-ray spectra, figure 3.57, which indicates that like Ge and Mo
atoms W atoms also migrated to GB regions or in the nearest neighbour
environment of Co atoms, but no W-Co or pure W phase was precipitated.
Figure 3.58 shows the kinetic paths at different temperatures in the space
spanned by the Gaussian areas, which represents the <Fe/Co> and <Fe/W>
correlations. The kinetic paths are same for all temperatures within
experimental errors or rather they are temperature independent. Figure 3.59
shows another representation of kinetic paths in the space spanned by area of
the satellite peak (<Fe/W> correlations) and width of the main peak (<Fe/Co>
correlations). All the points in this figure lie in the same path independent of
temperature. We, therefore, obtained for this system also same kinetic paths at
all temperature which shows that different sizes and diffusivities of the
constituents atoms does not make any difference on the kinetic paths of
ordering as long as the short circuited diffusion paths for atomic diffusion
through grain boundaries are present in the nano phase.
The nano wing of X-ray lines (figure 3.57) on heat treatment, show
grain growth and the kinetics of grain growth at different temperatures is
shown in figure 3.60 by solid symbols. Hollow symbols in this figure depicts
the kinetics at different temperatures of the main Gaussian peak area which
increases on ordering by W depletion from Fe environment resulting in more
and more Co neighbours of Fe. It can be seen from this figure that the grain

170
Hyperfine magnetic field H (kOe)
Figure 3.56: tJMF distributions showing the depletion of W from Feneighbourhood as ordering proceeds. The legends corrspond to the curvesfrom top to bottom.
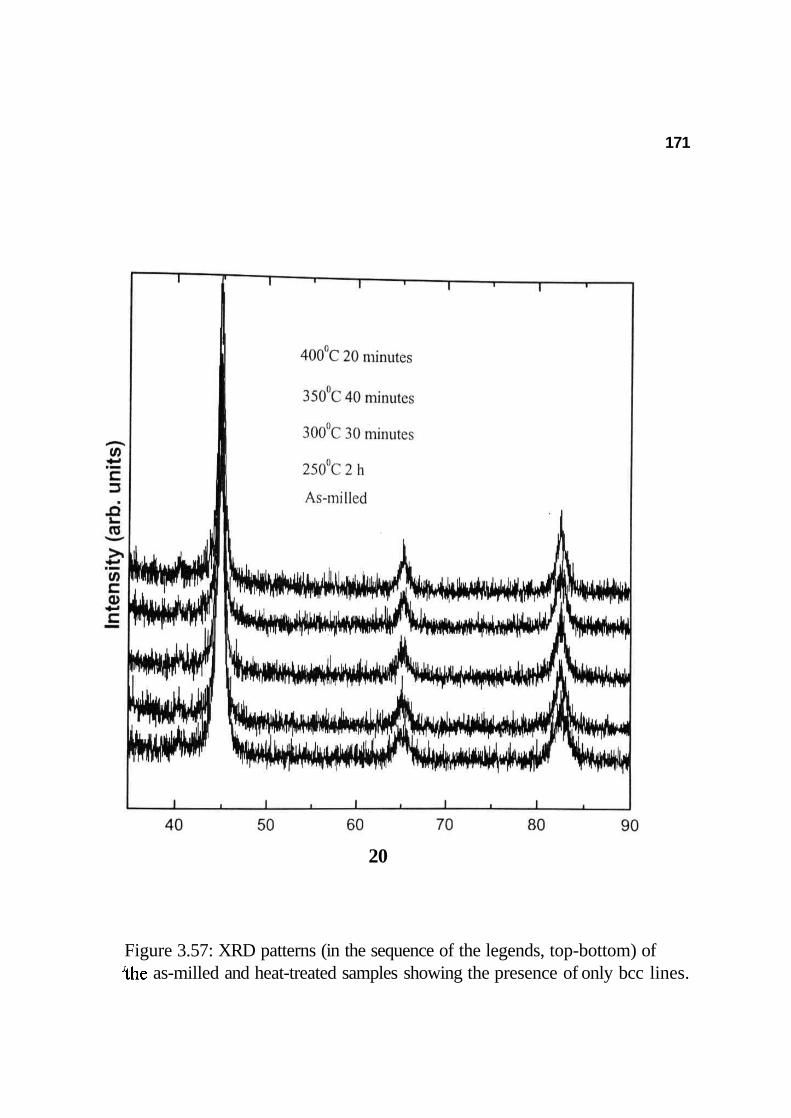
171
20
Figure 3.57: XRD patterns (in the sequence of the legends, top-bottom) of;the as-milled and heat-treated samples showing the presence of only bcc lines.
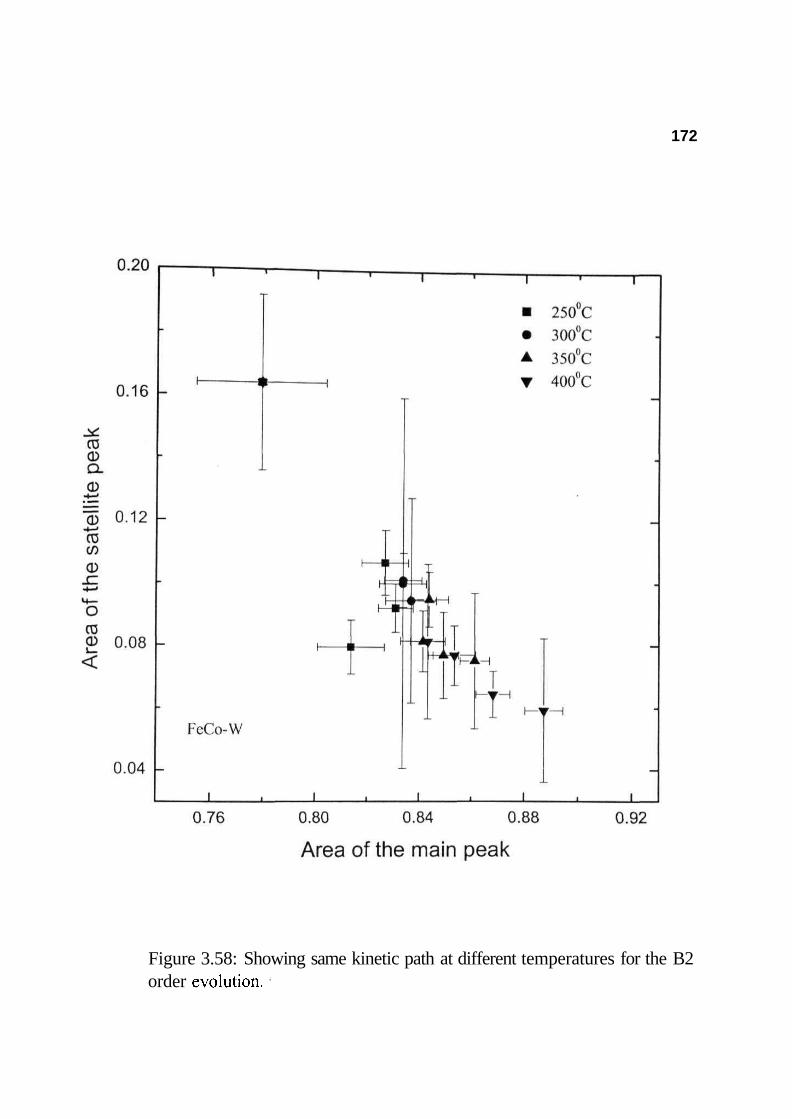
172
Figure 3.58: Showing same kinetic path at different temperatures for the B2order evolution.l
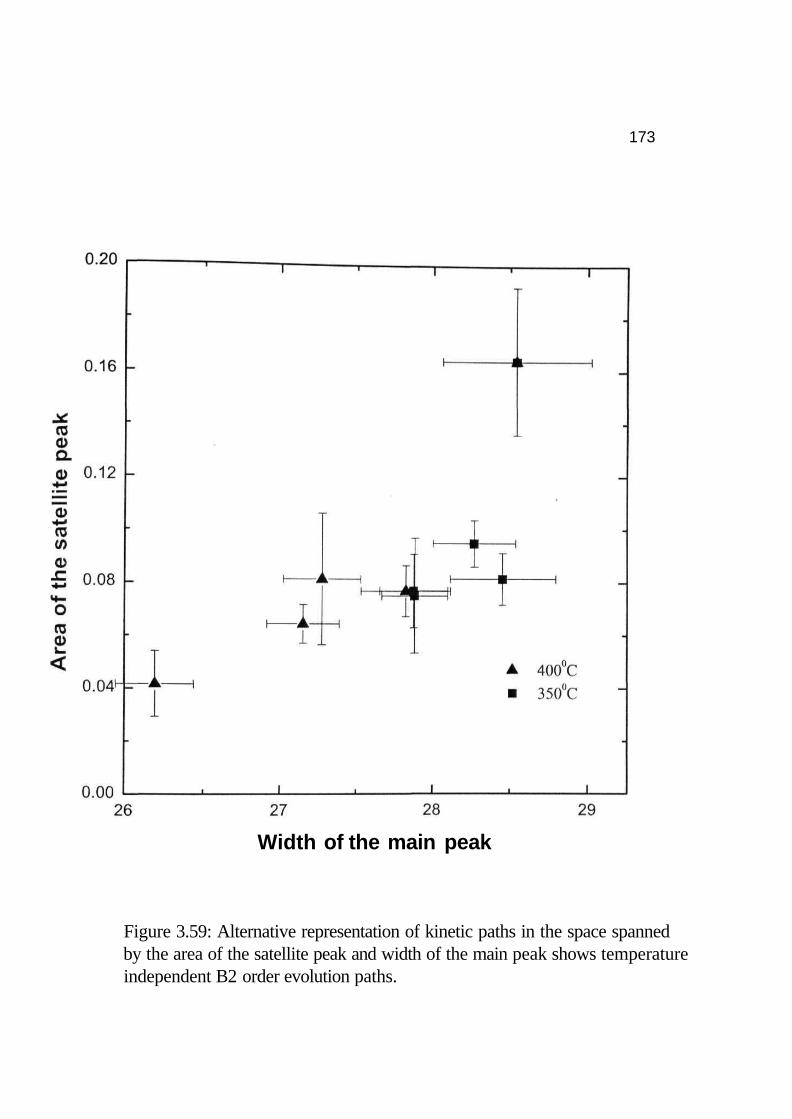
173
Width of the main peak
Figure 3.59: Alternative representation of kinetic paths in the space spannedby the area of the satellite peak and width of the main peak shows temperatureindependent B2 order evolution paths.

174
Figure 3.60: Showing the kinetics of grain growth and ordering at differenttemperatures, for the FeCo-W alloy. Similar kinetics of grain growth andB2 order evolution is seen.
175
growth and ordering kinetics is essentially the same within experimental errors
and they are of first order following equation 3.11. Figure 3.61 shows the
important parametric plots between grain size and width and area of the main
peak and between grain size and area of the satellite peak. The linear
correlation between the grain size and areas of the peaks as well as grain size
and width of the main peak independent of temperature and time indicates that
the underlying driving force for grain growth and ordering is the same and
which is minimization of Gibbs' free energy. The atomic diffusion, which is
the underlying mechanism for these two processes, takes place over the same
time scale. Figure 3.62 shows the temperature (of heat treatment) dependence
of grain growth, main and satellite peak areas, and width of the main peak. It
could be seen from the comparative plot (in the middle) of grain size and area
of the main peak vs. temperature that the temperature dependence of these
parameters are also similar within experimental errors like temporal
dependence.
In conclusion our study of the kinetic evolution of B2 order in
nanocrystalline FeCo-X (X = Mo, Ge, and W) alloys show that the kinetic
paths in the space spanned by the two short range order parameters otco/Fc and
(Xx/Fe (represented by <Co/Fe> and <X/Fe> correlations) were independent of
temperature within experimental errors. Hence the B2 ordering proceeded
along the same path at different temperatures. It may therefore not be possible
to develop new ordered microstructures in the nanocrystalline system by
simple thermal processing at different temperatures as was found possible for
macrocrystalline FeCo-Mo alloys [69], wherein different kinetic paths at
different temperatures were observed. The explanation for this difference in the
kinetic behavior lies in the larger grain boundary volume in the nano-system as
compared to that of microcrystalline alloys, which provide high diffusivity
short circuited paths for all constituent atomic species in the alloy. The

176
activation energy barrier for diffusion of X atoms are comparable to that of the
host Fe and Co atoms, giving rise to development of both order parameters at
the same rate, if we assume that their interaction energies do not vary
substantially.
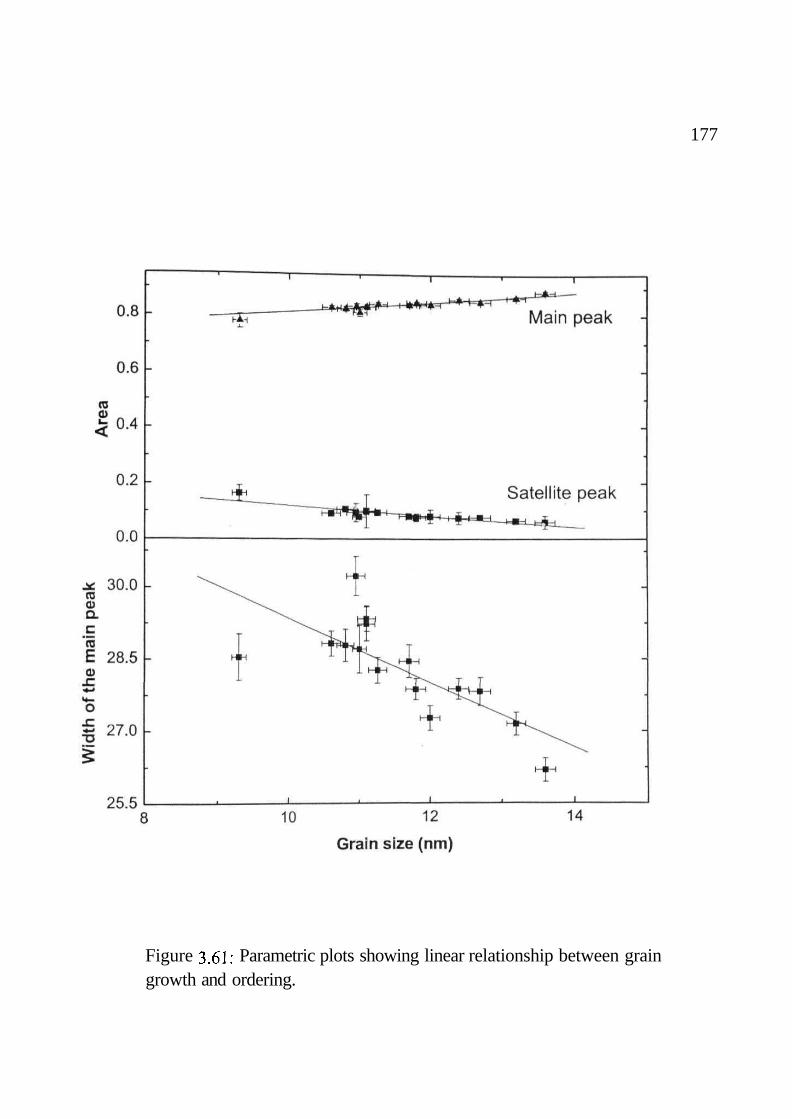
177
Figure 3.61: Parametric plots showing linear relationship between graingrowth and ordering.
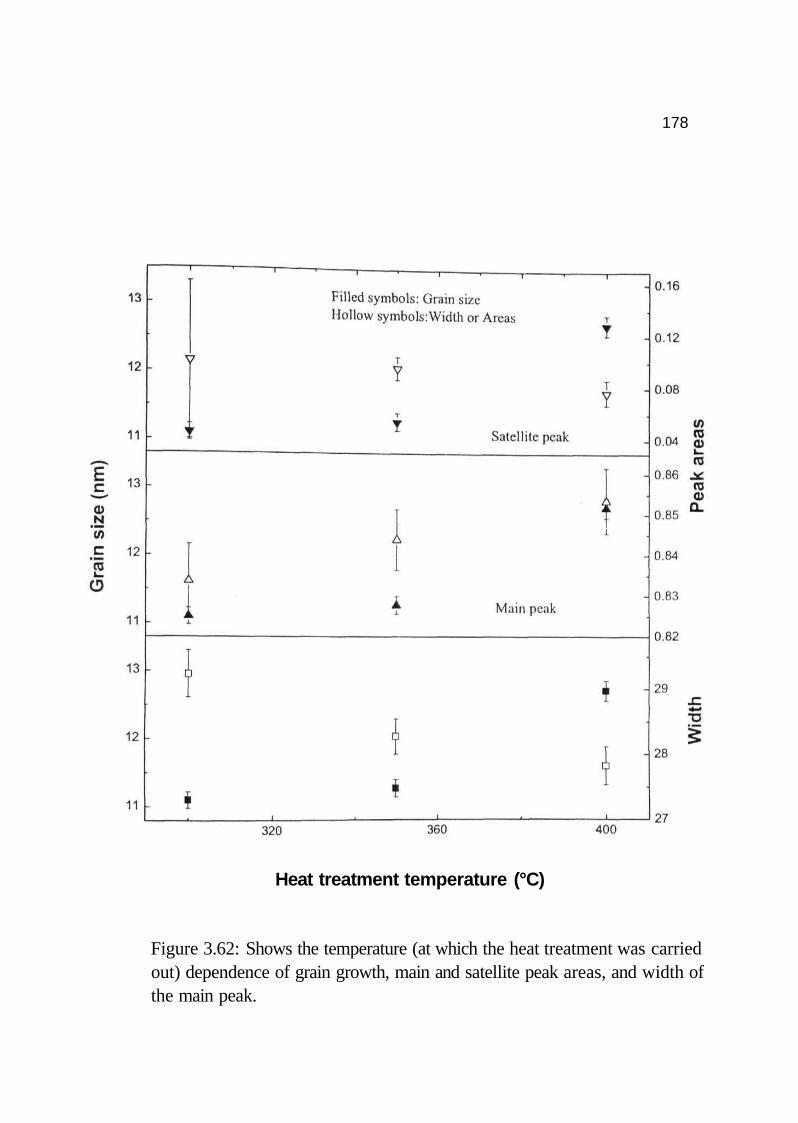
178
Heat treatment temperature (°C)
Figure 3.62: Shows the temperature (at which the heat treatment was carriedout) dependence of grain growth, main and satellite peak areas, and width ofthe main peak.
179
References
[I] A. Lawley, E. A. Vidoz, and R. W. Calm, Acta Metall. 9, 287 (1961).[2] R. Kikuchi, Ann. Phys. 10, 127 (1960); Prog. Theor. Phys. Suppl. 35, 1
(1996).[3] D. W. Clegg and R. A. Buckley, Matal. Sci. 7, 48 (1973).[4] R. W. Cahn, Metals, Materials and Processes 1, 1 (1989).[5] L. Anthony and B. Fultz, in Alloy Phase Stability and Degisn, edited by G.
M. Stocks, D. P. Pope, and A. F. Giamei (Mat. Res. Soc. Symp. Proc,Pittsburgh, PA 1991), Vol. 186, p. 181.
[6] Diffusion in Ordered Alloys, edited by B. Fultz, R. W. Cahn, and D. Gupta(TMS, Chicago, Illinois, 1992).
[7] B. Fultz, J. Mater. Res. 7, 946 (1992).[8] R. W. Calm, in Physics of New Materials- A Status Report, edited by F. E.
Fujita (Springer-Verlag, Berlin, Heidelberg, 1994), p. 179.[9] G. D. Mukherjee, C. Bansal, and A. Chatterjee, Phys. Rev. Lett. 76, 1876
(1996).[10] T. Ziller, G. Le Caer, O. Isnard, P. Cenedese, and B. Fultz, Phys. Rev.
865,024204(2001).II1] C. C. Koch, D. G. Morris, K. Lu, and A. Inoue, MRS Bulletin 24, 54
(1999).[12] H. Bakker, G. F. Zhou, and H. Yang, Prog. Mater. Sci. 39, 159 (1995).[13] K. C. Russel, Prog. Mater. Sci. 28, 229 (1985).[14] B. X. Liu, in Non-Equilibrium Processing of Materials, edited by C.
Suryanarayana (Pergamon, Oxford, 1999), p. 197.[15] N. S. Stolo and R. G. Davies, Prog. Mater. Sci. 13, 77 (1966).[16] R. S. Averback, H. Halin, H. J. Hofler, and J. C. Logas, Appl. Phys. Lett.
57, 1745(1990).[17] H. Chang, H. J. Hofler, C. J. Altstetter, and R. S. Averback, Scripta
Metall. 25, 1161 (1991).[18] D. K. Mukhopadhyay, C. Suryanarayana, and F. H. Froes, Scripta Metall.
Mater. 31,333(1994).[19] W. Li, C. Suryanarayana, and F. H. Froes, in Advances in Powder
Metallurgy and Particulate Materials: Part I, edited by M. A. Phillips andJ. Porter (Metal Powder Industries Federation, Princeton, NJ, 1995), p.145.
[20] C. Suryanarayana, E. Zhou, Z. Peng, and F. H. Froes, Scripta Metall.Mater. 30, 781 (1994).
[21] S. Srinivasan, P. B. Desch, and R. B. Schwarz, Scripta Metall. Mater. 25,2513(1991).

180
[22] R. B. Schwarz, P. B. Desch, and S. Srinivasan, in Mechanical alloying forstructural applications, edited by J. J. deBarbadillo et al. (Materials Park,
OH: ASM International, 1993), p. 227,[23] C. Suryanarayana, W. Li, and F. H. Froes, Scripta Metall. Mater. 31, 1465
(1994).[24] W. Li, C. Suryanarayana, and F. H. Froes, in Synthesis/Processing of
Lightweight Metallic Materials, edited by F. H. Froes, C. Suryanarayana,and C. M. Ward-Close (TMS, Warrendale, PA, 1995), p. 203.
[25] H. Schropf, C. Kuhrt, E. Arzt, and L. Schultz, Scripta Metall. Mater. 30,1569(1994).
[26] B. T. McDermott and C. C. Koch, Scripta Metall. 20, 669 (1986).[27] S. Martelli, G. Mazzone, S. Scaglione, and M. Vittori, J. Less-Common
Metals 145,261 (1988).[28] A. E. Ermakov, E. E. Yurchikov, and E. P. Elsukov, Fiz Tverd Tela 4,
1947(1982).[29] E. P. Elsukov, V. A. Barinov, V. R. Galakhov, E. E. Yurchikov, and A. E.
Ermakov, Phys. Metals and Metallogr. 55, 119 (1983).[30] E. P. Yelseekov, G. N. Konygun, V. A. Barenov, and E. V. Voronini, J.
Phys.:Condens. Matter 4, 75 (1992).[31] S. Gialanella, R. W. Calm, J. Malagelda, S. Surinach, M. D. Baro and A.
R. Yavari, in Kinetics of Ordering Transformations, edited by H. Chenand K. Vasudevan (TMS, Warrendale, 1992), p. 161.
[32] Y. Seki and W. L. Johnson, in Solid State Powder Processing, edited byA. H.Clauer and J. J. deBarbadillo (TMS, Warrendale, PA, 1990), p. 287.
[33] A. R. Yavari, Acta Metall. 41, 1391 (1993).[34] M. D. Baro A, ach S. SurinA,'and J. Malagelada, in Mechanical Alloying
for Structural Applications, edited by J. J. deBarbadillo, et al. (ASMInternational, Materials Park, OH, 1993), p. 343.
[35] F. Cardellini, V. Contini, and G. Mazzone, Scripta Metall. Mater. 32, 641(1995).
[36] S. Gialanella, R. Delorenzo, F. Marino, M. Guella, Intermetallics 3, 1(1995).
[37] Z.Q. Gao and B. Fultz, Phil. Mag. B67, 787 (1993).[38] H. H. Hamdeh, S. A. Oliver, B. Fultz, and Z. Q. Gao, J. Appl. Phys. 74,
5117(1993).[39] Z. Q. Gao and B. Fultz, Nanostructured Materials 2, 231 (1993).[40] M. J. Richards and J. W. Cahn, Acta Metall. 19, 1263 (1971); S. M. Allen
and J. W. Cahn, Ibid. 70, 423 (1972).[41] L. Anthony and B. Fultz, Acta Metall. Mater. 43, 3885-3891 (1995).[42] J. T. T. Kumaran and C. Bansal, Solid State Comm. 69, 779 (1989).[43] Binary alloy phase diagrams, edited by T. B. Massalski (ASM
International, Metals Park, OH, 1990).
181
[44] P. R. Swann, W. R. Duff, and R. M. Fisher, Trans. AIME 245, 851(1969).
[45] H. Okamoto and P. A. Beck, Metall. Trans. 2, 569 (1971).[46] K. Oki, M. Hasaka, T. Eguchi, Trans. Jap. Inst. Met. 14, 8 (1973).
[47] K. Oki, M. Hasaka, and T. Eguchi, Japan J. Appl. Phys. 12, 1522 (1973);Trans. JIM 15, 143(1974).
[48] B. Park, G. B. Stephenson, S. M. Allen, and K. F. Ludwig, Phys. Rev.Lett. 68, 1742(1992).
[49] L. Anthony and B. Fultz, J. Mater. Res. 4, 1132 (1989). Ibid 4, 1140(1989).
[50] L. Anthony and B. Fultz, J. Mater. Res. 9, 348 (1994).[51] W. Schweika, MRS Symposium Proceedings (MRS, Pittsburgh,
Pennsylvania, 1990), Vol. 166, p. 249.[52] R. G. Davies, Trans. Met. Soc. AIME 230, 903 (1964).[53] A. G. Khachaturyan, in Progress in Materials Science, edited by B.
Chalmers, J. W. Christian, and T. Massalski (Pergamon Press, Oxford,1975), vol. 22, p. 1.
[54] C. Bansal, Z. Q. Gao, and B. Fultz, Nanostructured Materials 5, 327(1995).
[55] L. Brossard, G. A. Fatseas, and J. L. Dorman, J. Appl. Phys. 42, 1306(1971).
[56] G. A. Fatseas, Can. J. Phys. 54, 1850 (1976).[57] K. Raviprasad, S. Ranganathan, and K. Chattopadhyay, Scripta Metall.
Mater. 26,467(1992).[58] H. H. Hamdeh, M. R. Al-Hilali, N. S. Dixon, and L. S. Fritz, Phys. Rev.
645,2201 (1992).[59] H. H. Hamdeh, S. A. Oliver, B. Fultz, and Z. Q. Gao, J. Appl. Phys. 74,
5117(1993).[60] H. H. Hamdeh, J. Kramer, B. Fultz, Z. Q. Gao, and S. A. Oliver,
Hyperfine Interaction 94, 2373 (1994).[61] G. F. Zhou and H. Bakker, Materials Transactions:JIM 36, 329 (1995),[62] S. Yoon and J. G. Booth, Phys. Lett. A 48, 381 (1974).[63] T. J. Burch, J. I. Budnick, V. A. Niculescu, K. Raj, and T. Litrenta, Phys.
Rev. B24, 3866(1981).[64] V. Niculeseu, K. Raj, T. J. Burch, and J. I. Budnick, Phys. Rev. B13,
3167(1976).[65] Ferromagnetic Materials, edited by E. D. Wholfarth and K. H. J.
Buschow (North Holland, 1988), Vol. IV.[66] Kinetics of Ordering Transformations in Metals, edited by H. Chen and
V. K. Vasudevan (TMS, Warrendale, 1992).[67] B. Fultz, Acta Metall. 37, 823 (1989).[68] B. Fultz, Hyperfine Int. 41, 607 (1988).
182
[69] B. Fultz, H. H. Hamdeh, and D. H. Pearson, Acta Metall. 37, 2841(1989).
[70] G. E. Murch, in Phase Transformations in Materials, edited by R. W.Calm, P. Haasen, and E. J. Kramer (VCH, Weinheim, 1991), p.90.
[71] M. B. Stems, Phys. Rev. 147, 439 (1966).[72] Ben. DeMayo, Phys. Rev. B24, 6503 (1981).[73] A.R. Miedema, P. F. deChatel, and F. R. deBoer, Physica B. 100, 1
(1980).[74] I. Vincze and A. T. Aldred, Phys. Rev. B9, 3845 (1974).