Chapter 2 Weather and Climate of Portland
18
20 Weather and Climate of Portland Chapter 2 Weather and Climate of Portland Daniel M. Johnson Department of Geography Portland State University The climate of Qregpn has always been 'the subject of discussion, and it is the persistence of predpitation that elicits the most comment, both rational and irrational. A common per- ception is that the state is suited only to salamanders, waterfowl, and cray- fish. In the words of Ken Kesey (1963, p. 5), Oregonians " . .. have lived and worked and logged in the wet so long that they are no longer capable of dis- tinguishing it from the dry." In rebuttal, other Oregonians retort with a certain amount of smugness that the state as a whole receives less annual precipitation than most other states. The average yearly precipitation in the United States is about 29 inches; in Oregon it is only 27 inches, less than states like Pennsyl- vania (42 inches), Michigan (30 inches), and many others. This, of course, is a statistical abstraction, given the contrast between wet western Oregon and dry eastern Oregon as defined by the crest of the Cascade Mountains. Residents also delight in pointing out that Portlands official value for annual precipitation of 37.4 inches is less than New York City (50 inches), Houston (46 inches), Atlanta (48 inches), and many other American cities not known for extremes in climate. However, regardless of the interpretation of the data, the fact is that compared to most of the nation Portland experiences an extremely large number of rainy days (152 per year), of o-vercast skies (ranging from 88 percent cloud cover in December to 42 percent in July), and of reduced solar radiation. Rainfall is of low intensity, but it is the succession of ,Overcast, dreary days in the winter that establishes a reputation that is irrefutable. Richard Maxwell Brown (1980) pre- sented a delightful historical perspective on the subject in an article entitled "Bless the Rain./I Early visitors to the Willamette Valley found the long rainy season to be oppressive, and the image of ince$sant rainfall became a handicap in attempts to attract To counter this view, promoters placed emphasis on the overall climate and in the 1890's developed what Brown called the "ideology of climate," containing the following propositions: 1. Although rainfall is prolific, it falls gently and does not generally inhibit outdoor work and activity. 2. The total amount of yearly rainfall is about average for the United States and only seems excessive because it is distributed over a longer rainy season than elsewhere. 3. Even when the I(1)g fall-to-spring rainy season is taken Into account, there are two notable compensating factors: the warm weather in comparison to the subfreezing temperature and blizzards of the central and eastern United States, and the delightfully dry and sunny but not excessively hot summers. 4. The regularity and dependability of temperature and rain .is, such that -- . in stark contrast to other parts of the country -- crops never fail west of the Cascades. 5. The climate is unexcelled for the
Transcript of Chapter 2 Weather and Climate of Portland

20 Weather and Climate of Portland
Chapter 2
Weather and Climate of Portland Daniel M Johnson
Department of Geography Portland State University
The climate of Qregpn has always been the subject of ~uch discussion and it is the persistence of predpitation that elicits the most comment both rational and irrational A common pershyception is that the state is suited only to salamanders waterfowl and crayshyfish In the words of Ken Kesey (1963 p 5) Oregonians have lived and worked and logged in the wet so long that they are no longer capable of disshytinguishing it from the dry In rebuttal other Oregonians retort with a certain amount of smugness that the state as a whole receives less annual precipitation than most other states The average yearly precipitation in the United States is about 29 inches in Oregon it is only 27 inches less than states like Pennsylshyvania (42 inches) Michigan (30 inches) and many others This of course is a statistical abstraction given the contrast between wet western Oregon and dry eastern Oregon as defined by the crest of the Cascade Mountains Residents also delight in pointing out that Portlands official value for annual precipitation of 374 inches is less than New York City (50 inches) Houston (46 inches) Atlanta (48 inches) and many other American cities not known for extremes in climate However regardless of the interpretation of the data the fact is that compared to most of the nation Portland experiences an extremely large number of rainy days (152 per year) of o-vercast skies (ranging from 88 percent cloud cover in December to 42 percent in July) and of reduced solar radiation
Rainfall is of low intensity but it is the succession of Overcast dreary days in the winter that establishes a reputation that is irrefutable
Richard Maxwell Brown (1980) preshysented a delightful historical perspective on the subject in an article entitled Bless the RainI Early visitors to the Willamette Valley found the long rainy season to be oppressive and the image of ince$sant rainfall became a handicap in attempts to attract se~lers To counter this view promoters placed emphasis on the overall climate and in the 1890s developed what Brown called the ideology of climate containing the following propositions
1 Although rainfall is prolific it falls gently and does not generally inhibit outdoor work and activity
2 The total amount of yearly rainfall is about average for the United States and only seems excessive because it is distributed over a longer rainy season than elsewhere
3 Even when the I(1)g fall-to-spring rainy season is taken Into account there are two notable compensating factors the warm weather in comparison to the subfreezing temperature and blizzards of the central and eastern United States and the delightfully dry and sunny but not excessively hot summers
4 The regularity and dependability of temperature and rain is such that -- in stark contrast to other parts of the country -- crops never fail west of the Cascades
5 The climate is unexcelled for the ~
I
21
personal hea1th of the individual who benefits in terms of comfort and longevity
6 When for comparative purposes the Northwest climate is viewed in a scope beyoJld this country that climate
is most analogous to those of England France and Japan -- all regions inshyHabited by healthy ana progressive peoples -- and is therefore not merely the fipest climate jn the United States but one of the best in the world (Brown 1980 p 27) middot Given this th9roughly optimistic summary it is a wonder that our climate must still be defended To many Portland residents the climate is indeed ideal
To others the lengthy winters are the price one must pay for short idyllic summers For most of us the reality lies somewhere in between
GENERAL CLIMATOLOGY
The climate of Portland -- relatively wet mild winters and clear dry summers -- can be cfassified as a modified west coast marine type relevant statistics are presented in Table 21 A mid-latitude location (45 degree~ North) accounts for seasonal contrasts of temperature and precipitation and the long rainy season is primarily the res1Jlt qf the prevailing westerlies Precipitation is associated With cyclonic storms embedded in the westerly flow of maritiI11e airstreams apd exhibits - a well-defined annual cycle (Figure 21) The annual march of precipitation is representative of conshyQitions common to the entire west coast qf North America (Trewartha 1981 p 298) 1) there is a conspicuous single maximum in the annual profile of preshycipitation which occurs in ilie winter 4) a marked single minimum occl1rs in the summer and 3) the month of maxshyimum precipitation is a function of latitude occurring later with decreasing latifude
Weathet and Climate Of Portlan4=
All three ofthese fearures ate closely associated with the seasonal migration of the North Pacific subtropical high pressure cell and of the jet stream and associated cyclonic storms which flank th~ anticyclone un its nOlthwild side (Figlre 22) The minimum coincides with the summer season when the subshytropical anticyclone extends its inflllence farthest poleward displacing the jet and the major storm tracksto the north The single maximum coincides wi~h the retreat southward of the high and the advance toward lower latitudes of the jet stream and storm belts Approxishymately 88 percent of the ar(nual pr~cipishytation in Portland occurs in the months October through May 9 percent in Jun~ and September while only 3 percent comes in July and August Precipitation is mostly rain with an average of only five days per year that receive measurable snow Seldom do more than 2 - 3 inches of snowfall accumulate and it generally lasts only a day or so The greatest official measurement of snowfali in 24 hours was six inches in January 1950 part of a monthly totC1 o~ 414 inches also a record Snow has been recorded in every month of the year in POltland except July
Although latitude is the dominant control of climate in Portland topography and distance from the Paqfic O~ean also play significant roles Locateltj 65 miles inland the city lies in ~Willamette Valley midway between th~ Coast Range and the higher Cascade Range to the east (Figure 23 The Coast Range is both a buffer protecting Portland from the full impacf Qf Pacific storms and a modifier of Incoming air masses Marine air is ooled as it moveS inland and over theCoast ~nge restilting in more than 150 inehes bf annual precipitatio~ in the mountains west of Portland Therefore air that descendS into the
~
Tabl
~21
Clim
atic
sum
mar
y fo
r Po
rtla
nd
Ore
gon
194
1-19
85
Dat
a ar
e fo
r th
e N
atio
nal
Wea
ther
Ser
vice
sta
tion
loca
ted
six
mile
s no
rth-
nort
heas
t of d
ownt
own
Port
land
on
the
Cpl
umbi
a Ri
ver
Elev
atio
n i~
21
feet
abo
ve s
ea l
ever
Nor
mal
s ar
e ba
sed
on t
he
1951
-198
0 re
cord
ex
trem
es a
re fo
r th
e en
tire
per
iod
of re
cord
(fio
lar
radi
atio
n da
ta a
re fr
om W
este
rn S
UN
19
80
p 1
6 a
ll ~
oth
er d
ata
are
from
NO
AA
19
86)
tD
~
Sol
ar R
adia
tio
n (
BT
UIF
T2-
Day
) T
otal
Ho
rizo
nta
l In
sola
tio
n
Dir
ect
Bea
m N
orm
al I
nci
den
ce
Per
cen
t o
f P
ossi
ble
Su
nsr
un
e P
erce
nto
f M
ean
Clo
pd
Co
yer
T
emp
erat
ure
(Q
egre
es F
)
No
rmal
s
Dai
ly M
axim
um
D
aily
Min
itn
um
-
Mo
nth
ly
Ex
trem
es
Rec
ord
Hig
h
Yea
r
Rec
ord
Lo
w
Yea
r ~ P
reci
pit
atio
n(i
nche
s)
Wat
er E~u
ival
ent
-Nor
ma
Max
imu
m M
on
t4ly
Y
ear
M
inim
um
Mo
nth
ly
Yea
r
Max
imu
m in
24
Ho
urs
Y
eat
S
now
I~e
pel
lets
M
axim
um
Mo
nth
ly
Y
ear
M
axim
um
in
24
Ho
urs
Y
ear
Win
d
Mea
n S~ed (
mp
h)
~revai
g D
irec
tion
An
nu
al
l Ja
n
Feb
M
ar
Ap
r M
ay
Jun
e
Jply
A
ug
S
ept
Oct
N
ov
D
ec
Av
erag
e ~ =
~
310
952
554
1302
89
5 15
83
1308
21
59
166
3 26
03
1773
24
94
2037
31
11
1674
28
25
1217
24
13
724
1746
38
8 11
43
260
698
1067
19
60
n -
27
37
4
7
53
58
55
70
66
61
42
29
22
47
84
83
81
77
72
68
47
52
56
72
82
8
7
72
~ tD
Q
443
33
5
389
504
36
0
432
545
37
4
460
602
40
6
504
669
46
4
56
727
52
2
625
795
55
8
677
786
55
8
672
742
51
1
627
639
44
6
54~
523
38
6
45
5
46
4
354
40
9
620
44
0
530
d
Q a ~ ~
62
70
80
87
100
100
107
107
101
90
73
64
1964
19
84
1947
19
57
1983
19
82
1965
19
81
1944
19
80
1975
19
80
-2
-3
19
29
29
39
43
44
34
26z
13
6
1950
19
50
1955
19
55
1954
19
66
1955
19~
1965
19
71
1985
i
64
62
39
3
6 2
3
21
15
05
11
16
31
52
6
4
374
12
8
95
7
5 4
7
46
41
27
4
5 4
0
80
11
6
111
19~3
1949
19
57
1955
19
45
1~s4
19
83
1968
19
82
1947
19
4 4
196amp
0
1 0
8 1
1 0
5 0
5 T
0
0 T
T
0
4
08
1
4 19
85
26
1964
2
0 19
65
18
1956
1
5 19
82
15
1951
1
8 19
67
11
1970
1
5 19
75
24
19
78
22
19
76
26
197q
2
6
1974
19
82
1943
19
62
1968
19
58
1978
19
77
1982
19
4~
1973
~977
414
13
2
129
T
0
6 T
-
T
0
2
82
15
7
1950
1~
49
1951
19
85
1953
19
81
1949
19
50
1977
19
64
-10
6 3
2
77
T
0
5 T
T
0
2
74
80
19
50
1962
19
51
1985
19
53
1981
19
49
195 9
19
7l
1964
100
9
1
83
74
70
71
76
71
65
6
5
87
9
6
79
ES
E
ES
E
ESE
N
W
NW
N
W
NW
N
W
ES
E
ES
E
ESE
E
SE
E
SE
Weather and Clbnate of Portlartd Z3
Monthly Precip~tation ~ Portland Oregon
8
6 en Q) c o c
-
sect4 o ~~
0 u
Q)
CL2
~O J J r ) I I) gt~ I gt I )) I gt I) i gt gt ) gt I I) ) I
Oct Nov Dec Jon F~b Mar ARr May Jun Jul Aug Sap
Month
Figure 21 Annual ll1aJdl of precipitation Portland fqr the norrna1 moderating influence of the Pacific p~~od 1951-1980 Data ar~ Oceatt FurthermoreJ the Cascade presented according to the Range is an effective barnet to contishyWater Year October through nental air mflsses that form qver the September (from NOAA 1986) interior As a resplt e~treme winter
and summer temperatures that charac- teJjze areas 100 to 2QO miles to the east
Willamette Valley is drier and yields rarely occurjn Portland less pr~cipitation than it would in the The marine influen~e in western absence 9f this topQgraphic bartier In Oregon reduces the ampIitud~ o~ the summer the Cpast Range ~ffectively annual temperature cyc1~ below that qf prevents penetration9f cool marine air continental lpcations Thus the wet into the valley wjnter seas01 is marked by relatiyely
The Cascades provide an even mild temperatures the mean temperature st~per slope for orographic uplift of qf the c9ldest month Janyilry is 389degF the moisture-laden ~esterly winds Th~ Alsotypicaofa marine type of climate crest of th~ ~pg~ varies hom 5tPDO to the diurnal range is sma1lin the winter 10000 fe~t and is a significant eastshy when ciQuciy slsies prevail with a mean west precipitation clivide shielding the daily ma~irpU1lJ in January of laquo3degF interior Columbia Plateau from the and a meanmiddot dally minimum of q35degF
24 Weather atJd Climate of Portland
Figure 22 Generalized air pressure and wind conditions for the eastern Pacific Ocean and western United States January and July depicting dominant seashysonal modes of atmospheric circulation that influence the climate of Portland (Jackson 1985 p49)
SUJnmer produces some of the most pleasant teather itt N6rtl AmeriCa with mild temperatures and very little precipitation In July the warmest month the mean temperature is 677degF with a larger diurnal range than in winter atfributableto cleat skies (daily maximum ~~ 795degP daily mihimam = 5SS0P) Temperatures below OdegF are very rare in Portland T-he lowest- on record is -3OP which occttrred in February 1950 Temperatures above 100degF are also infrequent the maximum of 107degF was recorded in July 1965 Temperatures above 9DoF are -attained every year but seldom persistmiddot for mote than a) -few days Hence a long growing season cbmbirleci with ample moisture supports prosp-erous agricultural- activity in the iural areas surrounding Portland and is an important underlying factogt ih t
POrtlattds reputation as the RoseOty Climatic norin51s or averages Jrepreshy
sent a ~Series of consfantly fltiwanrtg v~Iues of t)e ba~ic clim-aNc el~etrs~ Calenaat yeht 1985 toIrers a goodillilS
tration of the fact -that climate is more than just an -average of lhe el~ments which comprise it (Figure 24) This was ayear in which many new records wer~ established for daily rpaximum ahd minImum temperatures a response to the dominance of continental air masses over tite more moderate marine air Il)asses for extended perJods of ime JUty w~s erne bf the warmest months of the century with a monthly mean of 741degF (normal 677degF) The mean daily temperature on 30 of the 31 days exceedE -the norm and for 11 days the daily maximum w~s above 90degF an unshyusually lOng spell of not weather
Conversely the year began and ended with well below normal winter temperatures January and February were extremely cold due to the anchoring of a high pressure ridge over the Pacific Northwest permitting the influence of a continental air mass with clear Skies Noverrtber 1985 waS the coldest November on record in spite of several Warm days at the beginning of the montft During one 10 day sequence there wete eight days in which the temperature remained constantly below freezing anmiddot unusually proltgtnge_d cold spell for Portland The monthly mean ofJ73degF was 8~bF belOW normal After a few i
relatively b~lmy days H roecem~ there follbwed~~nnotheI teIharkaore-middotsmiddote~
25 w~Cther and Cljplate Qt Portlttnd
rf- 11
I -~ ~~~r~
j $gt -lt- bull
~--~ ~------ ~ -~ ~ -
~ )i-i~ ~ltati ~ gt~~~~~ ~-
A ~~~-- ~d 4 Y- ~
Figure 23 Regional getting of Portland illustlating the major topogshyraEhic controls o~ climate Drawing is noJ to scale
quence of cold weather exten~g to th~ end of the month Forturtately thearea was released from this icy grip onmiddot New Years Day 1986 with the arrival of a marine- air mass that raisedmiddot the tempershyature to a high of 51degF
EXTREME METEOROLOGICAL EVENTS
The Portland area indeed tRe entire P~cific Northwest is generally immune rom t1)e effects of severe storms which so oftel create havoc in other parts of
bull the world For example the combination
of climatic controls ismiddot not ~onducive to the formation of hurricanes and tornadoes From 1953 to 1976 only 23 tornadoes were reported in Oregon and 24 in Washington and most- of these were ea~t of the- Casades These numbers pale in comparison tQ the 1326 tor nadoes reported in Oklahoma chJritlg the same period (Ahrens 1985 p A06) ~vere thunderstorms while cPqlmon eqst of the Cascades are alampo rqre in the Willamette Valley Air mass thqRqershysforms require vigoJous eonveq1ve uplift in a humid atmosphere a situation unshycOJnmon in Portland where the warm sunpy summer~daysthat would promot~ (0nvective activity are-also day~ in which a dq air mass dominates tQe region likewise forced lifting along a frontal boundary is rarely rapid enough to
26
0
~ 00shy100 050
Eshy cI 020I0 -u 010
U ~ 005 rl 002 a 001 0 000
Weather add Qlirlialemiddot of Portland
Daily Data CELSIUS 105 -----------------------------------------------------~ 40
E= (j
rl Ia z J cI
~ a I
a Crl 0 rn 2 cI
cIrl QE- o
cI e
100 t5 go
85 80
75 70
65 60
55
50
45 40
35
30 25
20
15
10
36
32
28
20
16
12
JAN FEB MAR APR MAY JUN JUL AUG SEP OCT NOV DEC 300Z 200 ----__------_shy
10 2030 10 2026 10 20 30 10 20 30 10 20 30 10 2030 10 20 30 1020 30 10 20 30 1020 30 10 20 30 10 20 30
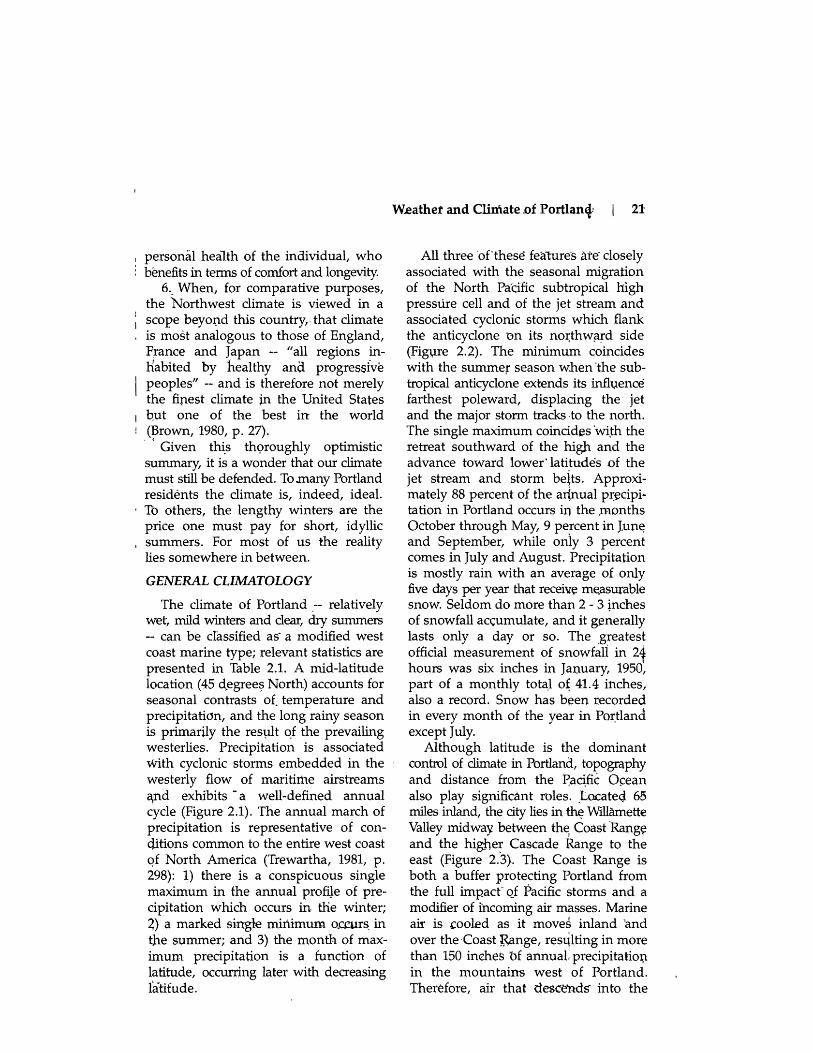
Figure 24 Annual march of daily tempshy recorded along the west coast (Luciaerature and precipitation in 1963 Lynott and Cameron 1966) InPortland for Calendar Year
1985 Data are for National many places new records of extreme Weather Service station winds were esfablished and damage was (NOAA 1986 p 1) in the millions of dollars Contrary to
popular reports in the press this was spawn thunderstorms The National not a hurricane or tropical storm but a Weather Service reports an average of mid-latitude cyclonic storm unusual for only 71 thunderstorms per year in its severity and its early season occurshyPortland the majority occurring from rence Wmd gusts ltgtn Mount Hebo in April to August(NOAA 1986) the northern Oregon Coast Range at
EXtreme me~orological events in the 3000 feet elevation were estimated at Portlapd area are -generally restricted to 170miles-per-hour In downtown Portland two types -- 1) mid-latitude cyclones gusts of 116 miles-per-hour were which ontJccasion are very severe and recorded at the Morrison Street Bridge 2 winds and precipitation influencedmiddot by exceeding any -previous records- for the the Columbia RivermiddotGorg~ In the minds metropolitan area (Harper 1962) of 1nost long-time reside1lts of northwest The storm of November 13 1981 Oregon the single most frightening was a siltrilar event that liowled up the meteorological event of this century was Oregon coast~ generated by an intense the falllOus Columhus Day StOInl of low pressure cell Ninety mile-per-hour October 12 1962i one of the middotmost winds floOding and widespread Cievasshy-vigorous and destructIve of its type ever tation in Brookings and Coos Bay were
27
reportedr from the south ana central Coast It swept into Itortland shortly after midnight with hurricane-fotce
winds that ripped roofs from buildings and tore a supertartket from irs Swan Island middotlJlooring Power lines- and radio towers Were toppled middottrees uprooted
~ motor Romes crumpled and aircraft upended Throughout Oregon the storm took 11 lives and caused $33 milshylion in -damage (Cody 1985 p7)
Infrequent severe stormsof this type highlight the difficulty of weather foreshycasting in Portland and the Pacific Northwest Despite major technological advances that have made weather Freshy
diction a science instead of a mysterious
attentpt at outguessing the gods meteorologists claim that the Northshywest remains one of the trickier regions in the country to forecast (Read 1983) A primary reason middotis the paucity of sur face observations over the Pacific Ocean Forecasters thus louk to satellite photoshygraphs for middotinformation These give imshymediate- data on the higher levels of the atmosphere but only limited surshyface information can be obtained from them Furthermore satellite photos are not detailed -enough for local forecasts which are so often confounded by the complex influences of local topography
Another sourcemiddot of headaches and sleepleas nights for local forecasters
and a Gompelling example of the influshyence of topography On climate both on the local and regional scale is the Columbia River Gorge This remarkable transverse valley is a topographic feature of unparalleled natural grandeur sculpshytured by the Columbia River (Figure 23) It offers a low-elevation passage through the Cascades thus permittingmiddot a transhysition from the marine type climate of western Oregon to the continental type of the interior Lynott 1966) In reshysponse to prevailing regional pressure
Weather and Cliifta~ of Portland
gradiehts the majority of air mdVement through the Gorge is from the west tp east allowing marine air to modify temperatures east (jf the Cascades in both summer and winter
The Gorge has been described as a giant wind funnel Westerly winds can become quite strong and are often
observed as far east as Pendleton Howshyever it is the less frequent but normally more violent east winds induced by a reversal of the regional pressure gradient that are of particular concern to Portland These may occur at any time of the year but are most common in the winter when a cold-core anticyclone located over the ~terior blocks stGrm movement through the Pacific Northwest Polar air nocturnally cools and deepens east of the Cascades in the Columbia and Snake River Basins forming a large pool of cold air The Cascade Mountains form a natural barrier that traps this cold air mass and the only escape is through the Columbia River Gorge the Frazier River Valley in British Columbia and to a lesser extent the low passes in the Cascades (Baker and Hewson 1978)
Occasionally cold air in the Great Plains spills over the Rockies in to the interior basins and intensifies this east wind surge It is a synoptic pattern that typically persists for several days and has been known to last for several weeks sustaining strong easterly flQw through the Gorge into the Portland metropolitan area (Cameuroron and Carpenter 1936) For this reason Portland is generally windier and colder than nearby cities to the north and south The record low temperature of -3degF recorded in February 1950 was due to the influence of these easterly winds Freezing rain is ariother hazard that area residents are exposed to because of proximity to the Gorge If high pressure to the east coincides with a fall of air
28 Weathet andClimate of Fortland
ressutt along the coast as a frontal ~steI11 approa~sr the regional pressure ~adient is increased and the flow of east winds through the Gorge accelerated A shallow layer of cold air clings to the suriaGe and tempelatur~slt remain very colq In Portland As the moisture-laden au hom the Pacific moves inlandmiddot it rides Aloft Ovet this cpldJayer acombination of events that produces freezing rC)in or as it is commonly termed in Portlpnd a I silver thaw II One such-event occurred In early January 1979 as the fimiddotrst rains from an approaching Pacific storm fell into a frigid surface layer and cOpted aU fiurfaces with clear ice Electric power cOlllmunications transportation and all normal work lloutine broke dowfi in most of Portland most dramatically in the eastern part of the dty near the west end of the Gorge (becker 1979)
In this kind of synoptic situation all kinds of precipitation can occur in northwest Otegon depending on the temperature balance as controlled by eievation distance fromJ the sea and proximity to the Gorge It is a uniquei and devastating mix of topography and climate that makes the beautiful Columbia River Highway paradoxically the most ~cherous stretch of highway in the country While other regions in the country experience ice storms the topography ensures that the Columbia River Gorge and those areas exposed at either end of it will be subjected to more onslaughts than most Several years may go by without such an event but it may also occur with alarming frequency in the space of a few years Within the metropolitan area itself the severity of such stotIns and the pattern of minimum temperatures due to the Gorge winds WillYary dramatically While the east side Pi town may be buffeted by cold Gorge winds and freezing ram the
Tualatin Valley to the lee of the West Hills may be relatively balmy East wind events in the summer caUse a dIfferent SOt of problem importing high temperashytures and low hutniqiljes to northwest Oregon and southwest Washington At these times r~idents oflbe area watch for the return o(more mQderate marine air anq forest manag~s take special preshycautions against forest fires Most of the historically great forest fires in Oregon and Washington notably the great Tillamook Bum of the 1930s were driven by hot middotdry east winds (Johnson and Dart 1981)
SPATIAL PAITERNS
The unique setting and the complex topography within the Portland metroshypolitan ruea generates a fascinating mosaic of miGrOclimates patterns of climatic elements that are as complex as those for any metropolitan area ill the country Precipitation patterns are well documented thanks -to data collected from the Portland Mesoscale Precipitation Network a network managed by the Bonneville Power Administration and operational since the late 1960s Winter storms traverse the area on prevailing west to southwest winds distributing precipitation in a pattern highly corshyrelated with topography The spatial distribution is essentially repeatable from storm to storm thro-pghout the rainy season This topographic control is apparent in the pattern of annual precipitation yenet not all valleys are equally dry nor are similar elevations in the hills equally wet (Figure 25)
The least surpdsing aspect of the annual pattern is the west to east preshycipitation gradient a steady decrease down the east slope of the Coast Range and a steady increase up the west slope of the Cascade JoothillsElevated areas within the valley eg the Chehalem
29 Weather and Oimateof P-ortlantl
FiglJre 25 Average annual pt~cipitation in inches for the Portland metropolitan area (1968shy1982) Relatively wetter and drier areas are marked (Wantz et aI 1983 p 13)
Mountains ~southwest of the city and the West Hills which flank downtown r~ceive greater amounts of 54 inches per year Immediately downwind of the Chehalem Mountains lies the Tualatin Valley where ~he IS-year average rainshy
fall is as little as 38 incl1es ina large area between j3eaverton and Hillsboro This valley may be the driest area in northwest Oregon The other dry area has been recognized for years because the Portland National Weather Service Office lies at its euro~stern edge This is a long narrow rain shadow alonsect the Columbia River lying to the lee of the West Hills The IS-year average rainfall at the Portland National WeatHer Service Office is 387 inches (compared te 374 inches the climatic ~ormal
30 Weather and Climate of Portland
from Takle--21) It would be dlfficult to shyfinq a mor~ unrepresentative 10catioP for the citys official precipitation measurements (Wantz et aI 1983~
Tne West Hills rise more than 1000 feet above the surrounding lowlands and receive over 47 inches of orographishycally enhanced precipitation 25 percent more than the adjacent Tualatin Valley The increased amounts of precipitation in the West Hills are significant to local residents in the winter when monthly mean temperatures at the 1000 foot level average 5degF lower than at the Nationa Weather S~rvice Office Anshynual snowfall Jhere averages aboUt 24 inches nearly fhree times the average ir the lower valley areas Residents of the West Hills a~ occasionally surprised by a six ipch snowfan that severely hampers travel across the steeper terrain while suburbanflreas at lower elevations nearby may have no snow whatever
Temperature data from this mesoscale network are afairly recent addition and are collected at a smaller number of stations The major control on the spatial pattern of temperatme in the metropolitan area is elevation Jhus outlying areas are cooler than is the city center adshyjacent to the Wlllamette River However due to the combined influences of land use cold air drainage and proxinilty to the Columbia River Gorge a consistent temperature-elevation relationship does not exist Low-lying areas frequently haveltexceptionally cold nights and east side locations tend to be colder thanmiddot at similar elevations on the west side
The interaCtion of temperaturei atmospherilt moisture and topography dictates the patternof fog in the metr)shypolitan area a climatic element for which few data exist The National Weather Service reports an average- of 336 days-per year during which heavy fog restricts visibility to 14 mile or less
(NOAA i986) But such Ji5oinf) data dp Jlot tell the real story of the spatial patterns of fog in an area where the topography is so varied The National Weather Service Office is located in east Portland on the Columbia River adshyjacent to the Portland InternationaLAirshyport It is a site well-exposed tQ easterly Columtna Gorge winds which effectively dissipate fog that may persist in other parts of the metropolitan area Th~refore data from this stAtion are not represenshytative Happily the 10cati6n of the airshyport is suCh that it is not subject to frequent closures due to fog and reduced visibility a problem of greater magshynitude at other cities til the Pacific Northwest for exampfe Medford in southerl1 Oregon and Sea-Tac Airport in Seattle
The combination Of cold afr drainage and high moisture content in river valleys makes them susceptible to radiation fog which occurs frequently when regshyional high pressure dominates the area a common occurrence at any time of the year At times the low-Iy~ng areas are completely shrouded while the hills remain bathed in sunlight Ra4i4iltlon fogs tend to form upward from the grouXd as the night progresses and are usually deepest around sunrise A shallow layer-middotwin usually dissipate or burn off by afternoon Advection fog is more of a winter season phenomenon formed when relatively warm moist air moves over colder surfaces It is enlaJ1ced lgty upslope air flow so the higher elevations in Portland are more likely to be fogged in
Another significant environmental element directly related tothe complex interaction between climate and topogshyraphy is air pollution Unfortunately the combination of these controls in Portland precludes the efficien~ dispersal or pollutants The valley setting with
31
mountains on eithet side inhibits horiZ6ntat dispersion especlcdly in the summer when winds are light -ana generally from the north Pollutants cannot escape vertieally when mixirig is reduced oy inversions that exist under the intluence of high pressure a sItuation common in all seasons Ih fact throughout the valleys of western Oregon there is a higher frequency of inyersiors than in inost places in the country In Portland the averag~ height of the mixed layer is 3000 feet artd about 10 percent of the time the mixing height is below 1500 feet well below the crests of the flanking mountains (DEQ 1986) Thu there is a h~avy build-up of pollution with a corresshyponding reduction in visibility This is both a public health issue and an aesthetic one Many area residents gauge air quality by their ability to view two of the regions volcanic landmarks -- Mount Hood 60 miles to the east of downtown and MQunt sf Helens middotan equal di~tance to the north Stagnant air trapped under an inversion becomes increasingly polluted until the weather changes to bring in a strong regional flow that permits vertical andor horizontal mixing
CLIMATE IN THE PAST
One aspect of the temporal variability of climate is the annual cycle another is the variability over longer time scales Unfortunately observations of temperature and p~pitation in- Portland have been recorded for barely more than a century For the longer period prior to the advent of instrumental records in the 19th century the climate of Portland can be discussed only in general terms of the climate history of the Pacific Northwest A coarse outline for climate of the last 25000 years in the Pacific Northwest has begun to
W~ather 3nd Clitnate 0pound Portland
em~rge thanks to the work or several investigators rnost recently He1ISser (1983) and Barnosky middot(1984) In these studies paleoecologic data have been used to inferpret precipitation and tempeiature for the late Pleistocene and early Holocene ana they have shown tnatthe region has experienced a great rang~ in climatic conditions variatiohs in temperature and precipitation that certainly exceed -anything notedin the past few centuries
For the past 1OOOyears the accuracy and number of paleoclimatic indicators is greatly inereasmiddoted Three such indishycators yielding a wealth of information about~cimate throughout the American West are tree rIngs lake level fluctuations and the movements of mountain glaciers No information specific to the Portland metropolitan area is available but the broad-scale studies are spiced with interesting implications Perh~ps the most significant finding is that th~ climate of the mid-20th century is anomalous when viewed in afl historical context Bradley (1976) for example noted thCllt warm-moist conditions prevalent in the 19~n-1970 period have not occurred since the 14th century Furthermore there is a growing body of evidence that for the globe as a whole the extreme inter-annual variability of climate since about 1970 is more in keeping with climatic behavior over the past several centuries the middle decades of the 20th century were unusuar because
bf low interannuaf variability Extreme events in the 1970s such as severe winters in the central and eastern United States and drought in the west have certainly done nothing to refute this finding (Diazand Quayle 1978 Shelton 1977)
NevertJ1eless it i~ only for the period of insttumental observatiQns that precise statements can be made about the climatic history of Portland Data collection
32 Weatter iUld Climate of Portland
Gommenced in 1871 at a downtown stiltiqul which Qecame the qfficjal U S W~ather Bureau station when that agency was ~stablshed iI) 1892 Service cqntin1led -uninterrupted untJl 1973 Cojncident -with tfle closure of thi~ station was the Flddition of th~ dOVltown KGWshyXV st~tion to the cooperative c1imashyt910gic~1 netwOJ~ T~us a I1early homoshygeneous record Qpound tempera~ure and preshycipitatipn is available sinc~ 1871
These data can be analyzed iJ1 the context of c1im~Je variabil~ty for the northern hemisphere and for the Pacific Northwest MEln annual temperature
in Pottland sh~ws a steady increase fnnIl 1872 through the mid-1940s (Figure 26) Studies of instrumen~JiI records from throllghout the north~m hemisph~e qpcument the mucnqiscusse9 ge1eral wqqni1)g trend fro~ about ~85oto th~ 1940s (Mitchell 1961 1963) attributabJe in part to increaseq levels of carbon dilt~xide in theatmosple~e Af~er~abput 1940 there was a reversal of this trend and general cooling into the 1970B pri~arily at midqle Jld high latitudes (Jones WigleY1 and Kelly 1982) Caus~s of tNs coopng episltgtde are likely multiple including solar variab~lity (Willett 1974
Mean Annual Temperature Portland pregon
90
o J C c laquo
50
c g 475 ~
o o o 0) co
o 0)
N 0)
Figure 26 Time series of mean annual t~l1per~ture Portland 1872shy1985 Data are from downshytown station through 1972 and Portland KGW-TV beginshyniI)g in 1973
o o o It) rD co 0) 0) 0)
Year
33 W~atherandlClimate of-Portland
Agee 1980) and vQ1canic activity (Oliver Pacific Northwest is due to fluctuations 1976) However temperatur~ an~ Rre- in the jet stream ie changes in location cipitation anomalies on a regional basis cJfmean ridges and troughs in the windshydo not necessarily reflect the hemispheric flow in the middle and upper troposshytrend For example much of the western phere The location and intensity of half of the United States experienced a these features appears to be qitiltally slight warming while the rest of the influenced by sea-surface temperatUle nation experienced the cooling docushy anomalies and investigations for tlje mented for the northern hemisphere North Pacific and the Nqrth Atlantic as a whole (Wahl and Lawson 1970) Oceans have demonstrated interactions
In Portland there IS no cle~lr evidence with the atmospheric circulation on a of eithe~ progress~ve_ warming or cooling near-hemispheric scale (Namias 1969) since the 1940s However the analysiamp Far example at extepsive relatively of temperature ~chqnges 9ver time is w~rm pool of surface water in the northshycomplicated bymany fadors not the centrat Pacific in the winter of 1971-72 least of which is the irtfluence qf contributed to a northward displacement human activity Due to cha~nges in the of the westerly jet stream together with heat bclIance associated with urbanization a compensating southward displacement ci ties tend to be warmer than the over the western United States bringing surrounding countryside Likewise the in cold air (Figure 28) This pattern growth cSt a large city like Portland may contrasts vHh that of the 1960s when acco~nt for warmjng noted during the Ianomalous cold sea surface temperatures first half of the century persisted in the Central Pacific with
Precipitation data are less sensitive warmer water to the west leading to to the effects of urbanization (Figure frequent storm development in the 27) The decade of the 1870s and the intervening zone of strong temperature early 1880s were extremely wet in gradients The associated lpper airflow Water Year 1883 Portland received an produced a ridge- ot -high pressure over incredible 718 inches of precipitation th~ American West with warm winters Annual amounts declined steadity in California and the Pacific Northwest through the 1920s and early 1930s a (Barry and Cho~ley 1982) time of widespread drought in North The most famous drought of the America and then increased steadily American West in recent memory was through the J960s The decade of the that of 1976-77 For much of the Pacific 1970s i~ marked by extreme year-toshy Nortnwest this was tHe driest Winter year -vaTiability a finding conslsteRf on record (Bates 1978) Portiand forshywith the global climate as diseuroussed example reteived 276 inches at the above downfown station 65 percent of the
long-term middotnormal Namias (1978)CLIMATE OF
demonstrafed the cause linked to seashyTHE FltTURE surface temperatures In the autumh of
Althbughr it is impossible to forecast 1976 to February 1977 Warmer water future climate With any confidence and a strong middotupperair ridge persiSfed scientists have- rapidly ihcreased their near the1west-(oast (Zooler waters and understanding of short-term anomalies a persistent trough were locatedmiddot toWard iii ternperatute and precipitation Yearshy the central Pacific In other words it to-year variability of climate -in the was a more extreme example of the
34 Weatherand Climate of Portland
Water-Year Precipitation Portland Oregon
Water Year
Figure 27 Time series of annual preshycipit~tion Portland 1872 1985 Data -are from downshytown statiort through 1972 and- PortlandmiddotltGW-TV beginshyning in 1973 Annual totals are for the Waler Year (October through September)
situation presented in Figure 28 for the 1960s
In recentyears the conc~pt of atmQsshypheric teleconnections as related to sea- surface temperature patterns has taken on a new djmension with recognitiol of the o~ean-jtmosphere phenomenon called EI Nino-SouthEirl1 Oscillation (ENSO) which occurs in the equatorial 1acific Ocean fENSO s id~ntified as a w~~kening In -the- norllal gradient between high pressure c~I)tered in the central pacific pff the coast of South
America and low pressure in the Indian Ocean n~ar Austrqlia (RasIJlusson 1985) Recent research has clearly demonshystrated that there are world-wide effects deried fro~middot an ENSO event A deltrea~ in the pressure gradient results in disshyplacement 0pound the nornlally occurring weather systems in the mktdle latitudes and is termed the Pacific North American (PNA) Teleconnection The shift in nQrmal circulation n the eastern north Pacific and over the contishynental United States has been observed to result in associated shifts in stOrm tracks and temperature patternsmiddotmiddottough atld Fritts (1985) showed that during an ENSO event precipitation particularly in the winfer tends to pe less than normal over the Pacific Northwest due tp a sOlthem displa~ment of the usuql storm track In addition temperatures
35 Weather andmiddot-Climate of Portland
Figure 2SshyI
Generalized relationships beshytween ocean-surface tempershyatures jet stream tracks and land temperatures over the North PaCific and North
AmeIicq during average winter conditions jn the 19605 and th~ winter of 1971-72 (I~rry and Chorley 1982 pp 192-193)
36 Weather and Cilimafeof Portland
tend to be warmer than normal over the Pacific Northwest
Only a few years ago distant events such as a warming in the equatorial oceans would have appeared to hold little relevance tor the weather and climate of Portland Although these atmospheric
tel~connections are not yet adequately defined for reliable monthly and seasoruil forecasting it is a field in which knowshyledge is accumulating rapidJy Yetin spite of advances in our understanding of climate - in its controlling mechanisIlamp and in its natural variability -- the ideology of climate for POrtland and the Pacific Nortltwest is still relevant Rainfall in Portland is indeed prolific but the mild winters and the pleasant summers blend with a beautiful and accessible physical and cultural envishyronment to enhance l lifestyle valued by local resrdents
REFERENCES
Agee E M 1980 Presert climatic cooling and a proposed causative mechanism Bulletin American Meteorological Society Vo1611356-1367
Ahrens C D 19amp5 Meteorology Today An Introduction to Weather Climate and the Environment St Paul MN West Publishing Co 523 pp
Baker R W and Hewson E W 1978 Wind power potential in the Pacific Northwest Journal of Applied Meteorplogy Vo1171814-1826
Barnosky C V 1984 Late Pleistocene and ~arly Holocene environmental hisshytory of s9uthwesterp Washington State USA Canadian Journal of the Earth Sciences Vo121619-629
Barry R G and Chorley ~ J 1982 UAtmosphere Weather and Climate (Fourth edition) London Methuen amp Co Ltd 407 pp
Bates EM 1978 Precipitation distribution in Oregon prJbabtiity of dry years National Weather Digest VoL317-26
Btadley R 5 1976 Precipitation History ~of the Rocky Mountain States Boulder CO Westview Press 324 pp
Brown R M 1980 Bless the Rain Oreshygon Magazine VollO25-28
Cameron D C and Carpenter A B 1936 Destructive easterly gales in the Columbia River Gorge December 1935 Monthly Weather Review Vol64264-267
Cody R 1985 Why cant they get it right Northwest Magazine July 286-11
Decker F W 1Q79 Otegons silver thaw Weathefwjse Vo13276-78
DEQ (Department of Environmental Quality) 1986 Annual Report State of Oregon
Diaz H E and Quayle R G 1978 liThe 1976-77 winter in the contiguous United States ih comparison with past records Monthly Weather Review Vol1061393shy1421
Harper B P 1962 Report on October 12 windstorm Unpublished paper Bonneville Power Administration Portland OR 18 pp
Heusser C J 1983 Vegetational history of the northwestern United States including Alaska Chap 13 in Late Quaternary Environments of the United States Vo11 Edited by S C Porter Minneapolis MN University of Mirtnesota Press
Jackson P L 1985 Climate pp 48-57 in Atlas of the Pacific Northwest (7th edition) Corvallis OR Oregon State University Pr~ss
Johnson q M and Dart J 0 1982 Variability ofmiddot Precipitation in the Pacific Northwest Spatial and Temporal Characteristics WRRI-77 Corvallis OR Water Resources Research Institute 182 pp
Jones P D Wigley T L M and Kelley P M 1982 Variations in surface air temperatures Part 1 Nor~hern hemisshyph~re) 1881-1980 Monthly Weather Review Volll059-70
Kesey K 1963 Sometimes a Great Notion New York Viking Press 599 pp
Lough J M and Fritts H C 1985 liThe Southern Oscillation and tree rings 1600- 1961 Journal of Climate and Applied Meteorology Vo124952-966
Lucia E 1963 The Big Bjorv the Story of the Pacific Northwests Columbus Day Storm News-Times publishing Co Portland OR 64 pp
Lynott R E 1966 Weather and climate - Of the Columbia River Gorge Northwest
Science Vol40129-132 Lynott R and cameron O P 1966
Detailed analysis of the 1962 Columbus
37
Day windstorm Monthly Weather Review Vol94 lOS-117
Mitchell J M 1961 Reltent s~Ctlar changes of global temperature Annals New York Academy of Science middotVol~S23S-2S0
___ 1963 Worldwide pattern of secitlar temperature change In Changesmiddotin Climate Arid Zone Research XX Paris UNESCO
Namias J 1969 IJSeasonal interactions beshytween the North Pacific Ocean and the atmosphere during the 1960s Monthly Weather Review Vo197173-192
___ 1978 Multiple causes of the North American abnormal winter 1976shy1977 Monthly Weather Review VoL106279-29S
NOAA (National Oceanic and Atmospheric Administration) 1986 Local Climatological Data Annual Summary 1985 Portland Oregon Asheville NC 8 pp
Oliver R C 1976 On the response of hemispheric mean teuromperature to stratospheric dust An empirical approach Journal of Applied Meteorology Vo11S933-9S0
Rasmusson E M 1985 El Nino and varishyations in climate American Scientist Vol 73168-177
Read R 1983 Northwest weather often fouls forecasters The Oregonian November 23 1983 p A6
Shelton M L 1977 The 1976 and 1977 drought ih California extent and severity Weatherwise Vo130139-153
Trewartha G T 1981 The Earths Problem Climates (2nd edition) Madison WI Univ~rsity of Wiscqnsin Press 298 pp
Wahl E W and Lawson T L 1970 The climate of the mid-nineteenth century United States compared to the current normals Monthly Weather Review Vol98387-401
Wantz J W Ferris C M and Larsen N S 1983~ Pifteen-year average precipitaion patterns as revealed by the Portland Oregon mesoscale precipitation netshywork Unpublished paper Bonneville Power Administration Portland OR 13 pp
Weather and ~limate of Portland
Western SUN 1980 Oregon Solar and lWeather Information WSUN 11 Portland ORSI pp
Willett H C 1974 Recent statistical evishydE1nce in support of the predictive signifishycance of splar-climatic cycles Monthly Weather Review Vol102679-686
I
21
personal hea1th of the individual who benefits in terms of comfort and longevity
6 When for comparative purposes the Northwest climate is viewed in a scope beyoJld this country that climate
is most analogous to those of England France and Japan -- all regions inshyHabited by healthy ana progressive peoples -- and is therefore not merely the fipest climate jn the United States but one of the best in the world (Brown 1980 p 27) middot Given this th9roughly optimistic summary it is a wonder that our climate must still be defended To many Portland residents the climate is indeed ideal
To others the lengthy winters are the price one must pay for short idyllic summers For most of us the reality lies somewhere in between
GENERAL CLIMATOLOGY
The climate of Portland -- relatively wet mild winters and clear dry summers -- can be cfassified as a modified west coast marine type relevant statistics are presented in Table 21 A mid-latitude location (45 degree~ North) accounts for seasonal contrasts of temperature and precipitation and the long rainy season is primarily the res1Jlt qf the prevailing westerlies Precipitation is associated With cyclonic storms embedded in the westerly flow of maritiI11e airstreams apd exhibits - a well-defined annual cycle (Figure 21) The annual march of precipitation is representative of conshyQitions common to the entire west coast qf North America (Trewartha 1981 p 298) 1) there is a conspicuous single maximum in the annual profile of preshycipitation which occurs in ilie winter 4) a marked single minimum occl1rs in the summer and 3) the month of maxshyimum precipitation is a function of latitude occurring later with decreasing latifude
Weathet and Climate Of Portlan4=
All three ofthese fearures ate closely associated with the seasonal migration of the North Pacific subtropical high pressure cell and of the jet stream and associated cyclonic storms which flank th~ anticyclone un its nOlthwild side (Figlre 22) The minimum coincides with the summer season when the subshytropical anticyclone extends its inflllence farthest poleward displacing the jet and the major storm tracksto the north The single maximum coincides wi~h the retreat southward of the high and the advance toward lower latitudes of the jet stream and storm belts Approxishymately 88 percent of the ar(nual pr~cipishytation in Portland occurs in the months October through May 9 percent in Jun~ and September while only 3 percent comes in July and August Precipitation is mostly rain with an average of only five days per year that receive measurable snow Seldom do more than 2 - 3 inches of snowfall accumulate and it generally lasts only a day or so The greatest official measurement of snowfali in 24 hours was six inches in January 1950 part of a monthly totC1 o~ 414 inches also a record Snow has been recorded in every month of the year in POltland except July
Although latitude is the dominant control of climate in Portland topography and distance from the Paqfic O~ean also play significant roles Locateltj 65 miles inland the city lies in ~Willamette Valley midway between th~ Coast Range and the higher Cascade Range to the east (Figure 23 The Coast Range is both a buffer protecting Portland from the full impacf Qf Pacific storms and a modifier of Incoming air masses Marine air is ooled as it moveS inland and over theCoast ~nge restilting in more than 150 inehes bf annual precipitatio~ in the mountains west of Portland Therefore air that descendS into the
~
Tabl
~21
Clim
atic
sum
mar
y fo
r Po
rtla
nd
Ore
gon
194
1-19
85
Dat
a ar
e fo
r th
e N
atio
nal
Wea
ther
Ser
vice
sta
tion
loca
ted
six
mile
s no
rth-
nort
heas
t of d
ownt
own
Port
land
on
the
Cpl
umbi
a Ri
ver
Elev
atio
n i~
21
feet
abo
ve s
ea l
ever
Nor
mal
s ar
e ba
sed
on t
he
1951
-198
0 re
cord
ex
trem
es a
re fo
r th
e en
tire
per
iod
of re
cord
(fio
lar
radi
atio
n da
ta a
re fr
om W
este
rn S
UN
19
80
p 1
6 a
ll ~
oth
er d
ata
are
from
NO
AA
19
86)
tD
~
Sol
ar R
adia
tio
n (
BT
UIF
T2-
Day
) T
otal
Ho
rizo
nta
l In
sola
tio
n
Dir
ect
Bea
m N
orm
al I
nci
den
ce
Per
cen
t o
f P
ossi
ble
Su
nsr
un
e P
erce
nto
f M
ean
Clo
pd
Co
yer
T
emp
erat
ure
(Q
egre
es F
)
No
rmal
s
Dai
ly M
axim
um
D
aily
Min
itn
um
-
Mo
nth
ly
Ex
trem
es
Rec
ord
Hig
h
Yea
r
Rec
ord
Lo
w
Yea
r ~ P
reci
pit
atio
n(i
nche
s)
Wat
er E~u
ival
ent
-Nor
ma
Max
imu
m M
on
t4ly
Y
ear
M
inim
um
Mo
nth
ly
Yea
r
Max
imu
m in
24
Ho
urs
Y
eat
S
now
I~e
pel
lets
M
axim
um
Mo
nth
ly
Y
ear
M
axim
um
in
24
Ho
urs
Y
ear
Win
d
Mea
n S~ed (
mp
h)
~revai
g D
irec
tion
An
nu
al
l Ja
n
Feb
M
ar
Ap
r M
ay
Jun
e
Jply
A
ug
S
ept
Oct
N
ov
D
ec
Av
erag
e ~ =
~
310
952
554
1302
89
5 15
83
1308
21
59
166
3 26
03
1773
24
94
2037
31
11
1674
28
25
1217
24
13
724
1746
38
8 11
43
260
698
1067
19
60
n -
27
37
4
7
53
58
55
70
66
61
42
29
22
47
84
83
81
77
72
68
47
52
56
72
82
8
7
72
~ tD
Q
443
33
5
389
504
36
0
432
545
37
4
460
602
40
6
504
669
46
4
56
727
52
2
625
795
55
8
677
786
55
8
672
742
51
1
627
639
44
6
54~
523
38
6
45
5
46
4
354
40
9
620
44
0
530
d
Q a ~ ~
62
70
80
87
100
100
107
107
101
90
73
64
1964
19
84
1947
19
57
1983
19
82
1965
19
81
1944
19
80
1975
19
80
-2
-3
19
29
29
39
43
44
34
26z
13
6
1950
19
50
1955
19
55
1954
19
66
1955
19~
1965
19
71
1985
i
64
62
39
3
6 2
3
21
15
05
11
16
31
52
6
4
374
12
8
95
7
5 4
7
46
41
27
4
5 4
0
80
11
6
111
19~3
1949
19
57
1955
19
45
1~s4
19
83
1968
19
82
1947
19
4 4
196amp
0
1 0
8 1
1 0
5 0
5 T
0
0 T
T
0
4
08
1
4 19
85
26
1964
2
0 19
65
18
1956
1
5 19
82
15
1951
1
8 19
67
11
1970
1
5 19
75
24
19
78
22
19
76
26
197q
2
6
1974
19
82
1943
19
62
1968
19
58
1978
19
77
1982
19
4~
1973
~977
414
13
2
129
T
0
6 T
-
T
0
2
82
15
7
1950
1~
49
1951
19
85
1953
19
81
1949
19
50
1977
19
64
-10
6 3
2
77
T
0
5 T
T
0
2
74
80
19
50
1962
19
51
1985
19
53
1981
19
49
195 9
19
7l
1964
100
9
1
83
74
70
71
76
71
65
6
5
87
9
6
79
ES
E
ES
E
ESE
N
W
NW
N
W
NW
N
W
ES
E
ES
E
ESE
E
SE
E
SE
Weather and Clbnate of Portlartd Z3
Monthly Precip~tation ~ Portland Oregon
8
6 en Q) c o c
-
sect4 o ~~
0 u
Q)
CL2
~O J J r ) I I) gt~ I gt I )) I gt I) i gt gt ) gt I I) ) I
Oct Nov Dec Jon F~b Mar ARr May Jun Jul Aug Sap
Month
Figure 21 Annual ll1aJdl of precipitation Portland fqr the norrna1 moderating influence of the Pacific p~~od 1951-1980 Data ar~ Oceatt FurthermoreJ the Cascade presented according to the Range is an effective barnet to contishyWater Year October through nental air mflsses that form qver the September (from NOAA 1986) interior As a resplt e~treme winter
and summer temperatures that charac- teJjze areas 100 to 2QO miles to the east
Willamette Valley is drier and yields rarely occurjn Portland less pr~cipitation than it would in the The marine influen~e in western absence 9f this topQgraphic bartier In Oregon reduces the ampIitud~ o~ the summer the Cpast Range ~ffectively annual temperature cyc1~ below that qf prevents penetration9f cool marine air continental lpcations Thus the wet into the valley wjnter seas01 is marked by relatiyely
The Cascades provide an even mild temperatures the mean temperature st~per slope for orographic uplift of qf the c9ldest month Janyilry is 389degF the moisture-laden ~esterly winds Th~ Alsotypicaofa marine type of climate crest of th~ ~pg~ varies hom 5tPDO to the diurnal range is sma1lin the winter 10000 fe~t and is a significant eastshy when ciQuciy slsies prevail with a mean west precipitation clivide shielding the daily ma~irpU1lJ in January of laquo3degF interior Columbia Plateau from the and a meanmiddot dally minimum of q35degF
24 Weather atJd Climate of Portland
Figure 22 Generalized air pressure and wind conditions for the eastern Pacific Ocean and western United States January and July depicting dominant seashysonal modes of atmospheric circulation that influence the climate of Portland (Jackson 1985 p49)
SUJnmer produces some of the most pleasant teather itt N6rtl AmeriCa with mild temperatures and very little precipitation In July the warmest month the mean temperature is 677degF with a larger diurnal range than in winter atfributableto cleat skies (daily maximum ~~ 795degP daily mihimam = 5SS0P) Temperatures below OdegF are very rare in Portland T-he lowest- on record is -3OP which occttrred in February 1950 Temperatures above 100degF are also infrequent the maximum of 107degF was recorded in July 1965 Temperatures above 9DoF are -attained every year but seldom persistmiddot for mote than a) -few days Hence a long growing season cbmbirleci with ample moisture supports prosp-erous agricultural- activity in the iural areas surrounding Portland and is an important underlying factogt ih t
POrtlattds reputation as the RoseOty Climatic norin51s or averages Jrepreshy
sent a ~Series of consfantly fltiwanrtg v~Iues of t)e ba~ic clim-aNc el~etrs~ Calenaat yeht 1985 toIrers a goodillilS
tration of the fact -that climate is more than just an -average of lhe el~ments which comprise it (Figure 24) This was ayear in which many new records wer~ established for daily rpaximum ahd minImum temperatures a response to the dominance of continental air masses over tite more moderate marine air Il)asses for extended perJods of ime JUty w~s erne bf the warmest months of the century with a monthly mean of 741degF (normal 677degF) The mean daily temperature on 30 of the 31 days exceedE -the norm and for 11 days the daily maximum w~s above 90degF an unshyusually lOng spell of not weather
Conversely the year began and ended with well below normal winter temperatures January and February were extremely cold due to the anchoring of a high pressure ridge over the Pacific Northwest permitting the influence of a continental air mass with clear Skies Noverrtber 1985 waS the coldest November on record in spite of several Warm days at the beginning of the montft During one 10 day sequence there wete eight days in which the temperature remained constantly below freezing anmiddot unusually proltgtnge_d cold spell for Portland The monthly mean ofJ73degF was 8~bF belOW normal After a few i
relatively b~lmy days H roecem~ there follbwed~~nnotheI teIharkaore-middotsmiddote~
25 w~Cther and Cljplate Qt Portlttnd
rf- 11
I -~ ~~~r~
j $gt -lt- bull
~--~ ~------ ~ -~ ~ -
~ )i-i~ ~ltati ~ gt~~~~~ ~-
A ~~~-- ~d 4 Y- ~
Figure 23 Regional getting of Portland illustlating the major topogshyraEhic controls o~ climate Drawing is noJ to scale
quence of cold weather exten~g to th~ end of the month Forturtately thearea was released from this icy grip onmiddot New Years Day 1986 with the arrival of a marine- air mass that raisedmiddot the tempershyature to a high of 51degF
EXTREME METEOROLOGICAL EVENTS
The Portland area indeed tRe entire P~cific Northwest is generally immune rom t1)e effects of severe storms which so oftel create havoc in other parts of
bull the world For example the combination
of climatic controls ismiddot not ~onducive to the formation of hurricanes and tornadoes From 1953 to 1976 only 23 tornadoes were reported in Oregon and 24 in Washington and most- of these were ea~t of the- Casades These numbers pale in comparison tQ the 1326 tor nadoes reported in Oklahoma chJritlg the same period (Ahrens 1985 p A06) ~vere thunderstorms while cPqlmon eqst of the Cascades are alampo rqre in the Willamette Valley Air mass thqRqershysforms require vigoJous eonveq1ve uplift in a humid atmosphere a situation unshycOJnmon in Portland where the warm sunpy summer~daysthat would promot~ (0nvective activity are-also day~ in which a dq air mass dominates tQe region likewise forced lifting along a frontal boundary is rarely rapid enough to
26
0
~ 00shy100 050
Eshy cI 020I0 -u 010
U ~ 005 rl 002 a 001 0 000
Weather add Qlirlialemiddot of Portland
Daily Data CELSIUS 105 -----------------------------------------------------~ 40
E= (j
rl Ia z J cI
~ a I
a Crl 0 rn 2 cI
cIrl QE- o
cI e
100 t5 go
85 80
75 70
65 60
55
50
45 40
35
30 25
20
15
10
36
32
28
20
16
12
JAN FEB MAR APR MAY JUN JUL AUG SEP OCT NOV DEC 300Z 200 ----__------_shy
10 2030 10 2026 10 20 30 10 20 30 10 20 30 10 2030 10 20 30 1020 30 10 20 30 1020 30 10 20 30 10 20 30
Figure 24 Annual march of daily tempshy recorded along the west coast (Luciaerature and precipitation in 1963 Lynott and Cameron 1966) InPortland for Calendar Year
1985 Data are for National many places new records of extreme Weather Service station winds were esfablished and damage was (NOAA 1986 p 1) in the millions of dollars Contrary to
popular reports in the press this was spawn thunderstorms The National not a hurricane or tropical storm but a Weather Service reports an average of mid-latitude cyclonic storm unusual for only 71 thunderstorms per year in its severity and its early season occurshyPortland the majority occurring from rence Wmd gusts ltgtn Mount Hebo in April to August(NOAA 1986) the northern Oregon Coast Range at
EXtreme me~orological events in the 3000 feet elevation were estimated at Portlapd area are -generally restricted to 170miles-per-hour In downtown Portland two types -- 1) mid-latitude cyclones gusts of 116 miles-per-hour were which ontJccasion are very severe and recorded at the Morrison Street Bridge 2 winds and precipitation influencedmiddot by exceeding any -previous records- for the the Columbia RivermiddotGorg~ In the minds metropolitan area (Harper 1962) of 1nost long-time reside1lts of northwest The storm of November 13 1981 Oregon the single most frightening was a siltrilar event that liowled up the meteorological event of this century was Oregon coast~ generated by an intense the falllOus Columhus Day StOInl of low pressure cell Ninety mile-per-hour October 12 1962i one of the middotmost winds floOding and widespread Cievasshy-vigorous and destructIve of its type ever tation in Brookings and Coos Bay were
27
reportedr from the south ana central Coast It swept into Itortland shortly after midnight with hurricane-fotce
winds that ripped roofs from buildings and tore a supertartket from irs Swan Island middotlJlooring Power lines- and radio towers Were toppled middottrees uprooted
~ motor Romes crumpled and aircraft upended Throughout Oregon the storm took 11 lives and caused $33 milshylion in -damage (Cody 1985 p7)
Infrequent severe stormsof this type highlight the difficulty of weather foreshycasting in Portland and the Pacific Northwest Despite major technological advances that have made weather Freshy
diction a science instead of a mysterious
attentpt at outguessing the gods meteorologists claim that the Northshywest remains one of the trickier regions in the country to forecast (Read 1983) A primary reason middotis the paucity of sur face observations over the Pacific Ocean Forecasters thus louk to satellite photoshygraphs for middotinformation These give imshymediate- data on the higher levels of the atmosphere but only limited surshyface information can be obtained from them Furthermore satellite photos are not detailed -enough for local forecasts which are so often confounded by the complex influences of local topography
Another sourcemiddot of headaches and sleepleas nights for local forecasters
and a Gompelling example of the influshyence of topography On climate both on the local and regional scale is the Columbia River Gorge This remarkable transverse valley is a topographic feature of unparalleled natural grandeur sculpshytured by the Columbia River (Figure 23) It offers a low-elevation passage through the Cascades thus permittingmiddot a transhysition from the marine type climate of western Oregon to the continental type of the interior Lynott 1966) In reshysponse to prevailing regional pressure
Weather and Cliifta~ of Portland
gradiehts the majority of air mdVement through the Gorge is from the west tp east allowing marine air to modify temperatures east (jf the Cascades in both summer and winter
The Gorge has been described as a giant wind funnel Westerly winds can become quite strong and are often
observed as far east as Pendleton Howshyever it is the less frequent but normally more violent east winds induced by a reversal of the regional pressure gradient that are of particular concern to Portland These may occur at any time of the year but are most common in the winter when a cold-core anticyclone located over the ~terior blocks stGrm movement through the Pacific Northwest Polar air nocturnally cools and deepens east of the Cascades in the Columbia and Snake River Basins forming a large pool of cold air The Cascade Mountains form a natural barrier that traps this cold air mass and the only escape is through the Columbia River Gorge the Frazier River Valley in British Columbia and to a lesser extent the low passes in the Cascades (Baker and Hewson 1978)
Occasionally cold air in the Great Plains spills over the Rockies in to the interior basins and intensifies this east wind surge It is a synoptic pattern that typically persists for several days and has been known to last for several weeks sustaining strong easterly flQw through the Gorge into the Portland metropolitan area (Cameuroron and Carpenter 1936) For this reason Portland is generally windier and colder than nearby cities to the north and south The record low temperature of -3degF recorded in February 1950 was due to the influence of these easterly winds Freezing rain is ariother hazard that area residents are exposed to because of proximity to the Gorge If high pressure to the east coincides with a fall of air
28 Weathet andClimate of Fortland
ressutt along the coast as a frontal ~steI11 approa~sr the regional pressure ~adient is increased and the flow of east winds through the Gorge accelerated A shallow layer of cold air clings to the suriaGe and tempelatur~slt remain very colq In Portland As the moisture-laden au hom the Pacific moves inlandmiddot it rides Aloft Ovet this cpldJayer acombination of events that produces freezing rC)in or as it is commonly termed in Portlpnd a I silver thaw II One such-event occurred In early January 1979 as the fimiddotrst rains from an approaching Pacific storm fell into a frigid surface layer and cOpted aU fiurfaces with clear ice Electric power cOlllmunications transportation and all normal work lloutine broke dowfi in most of Portland most dramatically in the eastern part of the dty near the west end of the Gorge (becker 1979)
In this kind of synoptic situation all kinds of precipitation can occur in northwest Otegon depending on the temperature balance as controlled by eievation distance fromJ the sea and proximity to the Gorge It is a uniquei and devastating mix of topography and climate that makes the beautiful Columbia River Highway paradoxically the most ~cherous stretch of highway in the country While other regions in the country experience ice storms the topography ensures that the Columbia River Gorge and those areas exposed at either end of it will be subjected to more onslaughts than most Several years may go by without such an event but it may also occur with alarming frequency in the space of a few years Within the metropolitan area itself the severity of such stotIns and the pattern of minimum temperatures due to the Gorge winds WillYary dramatically While the east side Pi town may be buffeted by cold Gorge winds and freezing ram the
Tualatin Valley to the lee of the West Hills may be relatively balmy East wind events in the summer caUse a dIfferent SOt of problem importing high temperashytures and low hutniqiljes to northwest Oregon and southwest Washington At these times r~idents oflbe area watch for the return o(more mQderate marine air anq forest manag~s take special preshycautions against forest fires Most of the historically great forest fires in Oregon and Washington notably the great Tillamook Bum of the 1930s were driven by hot middotdry east winds (Johnson and Dart 1981)
SPATIAL PAITERNS
The unique setting and the complex topography within the Portland metroshypolitan ruea generates a fascinating mosaic of miGrOclimates patterns of climatic elements that are as complex as those for any metropolitan area ill the country Precipitation patterns are well documented thanks -to data collected from the Portland Mesoscale Precipitation Network a network managed by the Bonneville Power Administration and operational since the late 1960s Winter storms traverse the area on prevailing west to southwest winds distributing precipitation in a pattern highly corshyrelated with topography The spatial distribution is essentially repeatable from storm to storm thro-pghout the rainy season This topographic control is apparent in the pattern of annual precipitation yenet not all valleys are equally dry nor are similar elevations in the hills equally wet (Figure 25)
The least surpdsing aspect of the annual pattern is the west to east preshycipitation gradient a steady decrease down the east slope of the Coast Range and a steady increase up the west slope of the Cascade JoothillsElevated areas within the valley eg the Chehalem
29 Weather and Oimateof P-ortlantl
FiglJre 25 Average annual pt~cipitation in inches for the Portland metropolitan area (1968shy1982) Relatively wetter and drier areas are marked (Wantz et aI 1983 p 13)
Mountains ~southwest of the city and the West Hills which flank downtown r~ceive greater amounts of 54 inches per year Immediately downwind of the Chehalem Mountains lies the Tualatin Valley where ~he IS-year average rainshy
fall is as little as 38 incl1es ina large area between j3eaverton and Hillsboro This valley may be the driest area in northwest Oregon The other dry area has been recognized for years because the Portland National Weather Service Office lies at its euro~stern edge This is a long narrow rain shadow alonsect the Columbia River lying to the lee of the West Hills The IS-year average rainfall at the Portland National WeatHer Service Office is 387 inches (compared te 374 inches the climatic ~ormal
30 Weather and Climate of Portland
from Takle--21) It would be dlfficult to shyfinq a mor~ unrepresentative 10catioP for the citys official precipitation measurements (Wantz et aI 1983~
Tne West Hills rise more than 1000 feet above the surrounding lowlands and receive over 47 inches of orographishycally enhanced precipitation 25 percent more than the adjacent Tualatin Valley The increased amounts of precipitation in the West Hills are significant to local residents in the winter when monthly mean temperatures at the 1000 foot level average 5degF lower than at the Nationa Weather S~rvice Office Anshynual snowfall Jhere averages aboUt 24 inches nearly fhree times the average ir the lower valley areas Residents of the West Hills a~ occasionally surprised by a six ipch snowfan that severely hampers travel across the steeper terrain while suburbanflreas at lower elevations nearby may have no snow whatever
Temperature data from this mesoscale network are afairly recent addition and are collected at a smaller number of stations The major control on the spatial pattern of temperatme in the metropolitan area is elevation Jhus outlying areas are cooler than is the city center adshyjacent to the Wlllamette River However due to the combined influences of land use cold air drainage and proxinilty to the Columbia River Gorge a consistent temperature-elevation relationship does not exist Low-lying areas frequently haveltexceptionally cold nights and east side locations tend to be colder thanmiddot at similar elevations on the west side
The interaCtion of temperaturei atmospherilt moisture and topography dictates the patternof fog in the metr)shypolitan area a climatic element for which few data exist The National Weather Service reports an average- of 336 days-per year during which heavy fog restricts visibility to 14 mile or less
(NOAA i986) But such Ji5oinf) data dp Jlot tell the real story of the spatial patterns of fog in an area where the topography is so varied The National Weather Service Office is located in east Portland on the Columbia River adshyjacent to the Portland InternationaLAirshyport It is a site well-exposed tQ easterly Columtna Gorge winds which effectively dissipate fog that may persist in other parts of the metropolitan area Th~refore data from this stAtion are not represenshytative Happily the 10cati6n of the airshyport is suCh that it is not subject to frequent closures due to fog and reduced visibility a problem of greater magshynitude at other cities til the Pacific Northwest for exampfe Medford in southerl1 Oregon and Sea-Tac Airport in Seattle
The combination Of cold afr drainage and high moisture content in river valleys makes them susceptible to radiation fog which occurs frequently when regshyional high pressure dominates the area a common occurrence at any time of the year At times the low-Iy~ng areas are completely shrouded while the hills remain bathed in sunlight Ra4i4iltlon fogs tend to form upward from the grouXd as the night progresses and are usually deepest around sunrise A shallow layer-middotwin usually dissipate or burn off by afternoon Advection fog is more of a winter season phenomenon formed when relatively warm moist air moves over colder surfaces It is enlaJ1ced lgty upslope air flow so the higher elevations in Portland are more likely to be fogged in
Another significant environmental element directly related tothe complex interaction between climate and topogshyraphy is air pollution Unfortunately the combination of these controls in Portland precludes the efficien~ dispersal or pollutants The valley setting with
31
mountains on eithet side inhibits horiZ6ntat dispersion especlcdly in the summer when winds are light -ana generally from the north Pollutants cannot escape vertieally when mixirig is reduced oy inversions that exist under the intluence of high pressure a sItuation common in all seasons Ih fact throughout the valleys of western Oregon there is a higher frequency of inyersiors than in inost places in the country In Portland the averag~ height of the mixed layer is 3000 feet artd about 10 percent of the time the mixing height is below 1500 feet well below the crests of the flanking mountains (DEQ 1986) Thu there is a h~avy build-up of pollution with a corresshyponding reduction in visibility This is both a public health issue and an aesthetic one Many area residents gauge air quality by their ability to view two of the regions volcanic landmarks -- Mount Hood 60 miles to the east of downtown and MQunt sf Helens middotan equal di~tance to the north Stagnant air trapped under an inversion becomes increasingly polluted until the weather changes to bring in a strong regional flow that permits vertical andor horizontal mixing
CLIMATE IN THE PAST
One aspect of the temporal variability of climate is the annual cycle another is the variability over longer time scales Unfortunately observations of temperature and p~pitation in- Portland have been recorded for barely more than a century For the longer period prior to the advent of instrumental records in the 19th century the climate of Portland can be discussed only in general terms of the climate history of the Pacific Northwest A coarse outline for climate of the last 25000 years in the Pacific Northwest has begun to
W~ather 3nd Clitnate 0pound Portland
em~rge thanks to the work or several investigators rnost recently He1ISser (1983) and Barnosky middot(1984) In these studies paleoecologic data have been used to inferpret precipitation and tempeiature for the late Pleistocene and early Holocene ana they have shown tnatthe region has experienced a great rang~ in climatic conditions variatiohs in temperature and precipitation that certainly exceed -anything notedin the past few centuries
For the past 1OOOyears the accuracy and number of paleoclimatic indicators is greatly inereasmiddoted Three such indishycators yielding a wealth of information about~cimate throughout the American West are tree rIngs lake level fluctuations and the movements of mountain glaciers No information specific to the Portland metropolitan area is available but the broad-scale studies are spiced with interesting implications Perh~ps the most significant finding is that th~ climate of the mid-20th century is anomalous when viewed in afl historical context Bradley (1976) for example noted thCllt warm-moist conditions prevalent in the 19~n-1970 period have not occurred since the 14th century Furthermore there is a growing body of evidence that for the globe as a whole the extreme inter-annual variability of climate since about 1970 is more in keeping with climatic behavior over the past several centuries the middle decades of the 20th century were unusuar because
bf low interannuaf variability Extreme events in the 1970s such as severe winters in the central and eastern United States and drought in the west have certainly done nothing to refute this finding (Diazand Quayle 1978 Shelton 1977)
NevertJ1eless it i~ only for the period of insttumental observatiQns that precise statements can be made about the climatic history of Portland Data collection
32 Weatter iUld Climate of Portland
Gommenced in 1871 at a downtown stiltiqul which Qecame the qfficjal U S W~ather Bureau station when that agency was ~stablshed iI) 1892 Service cqntin1led -uninterrupted untJl 1973 Cojncident -with tfle closure of thi~ station was the Flddition of th~ dOVltown KGWshyXV st~tion to the cooperative c1imashyt910gic~1 netwOJ~ T~us a I1early homoshygeneous record Qpound tempera~ure and preshycipitatipn is available sinc~ 1871
These data can be analyzed iJ1 the context of c1im~Je variabil~ty for the northern hemisphere and for the Pacific Northwest MEln annual temperature
in Pottland sh~ws a steady increase fnnIl 1872 through the mid-1940s (Figure 26) Studies of instrumen~JiI records from throllghout the north~m hemisph~e qpcument the mucnqiscusse9 ge1eral wqqni1)g trend fro~ about ~85oto th~ 1940s (Mitchell 1961 1963) attributabJe in part to increaseq levels of carbon dilt~xide in theatmosple~e Af~er~abput 1940 there was a reversal of this trend and general cooling into the 1970B pri~arily at midqle Jld high latitudes (Jones WigleY1 and Kelly 1982) Caus~s of tNs coopng episltgtde are likely multiple including solar variab~lity (Willett 1974
Mean Annual Temperature Portland pregon
90
o J C c laquo
50
c g 475 ~
o o o 0) co
o 0)
N 0)
Figure 26 Time series of mean annual t~l1per~ture Portland 1872shy1985 Data are from downshytown station through 1972 and Portland KGW-TV beginshyniI)g in 1973
o o o It) rD co 0) 0) 0)
Year
33 W~atherandlClimate of-Portland
Agee 1980) and vQ1canic activity (Oliver Pacific Northwest is due to fluctuations 1976) However temperatur~ an~ Rre- in the jet stream ie changes in location cipitation anomalies on a regional basis cJfmean ridges and troughs in the windshydo not necessarily reflect the hemispheric flow in the middle and upper troposshytrend For example much of the western phere The location and intensity of half of the United States experienced a these features appears to be qitiltally slight warming while the rest of the influenced by sea-surface temperatUle nation experienced the cooling docushy anomalies and investigations for tlje mented for the northern hemisphere North Pacific and the Nqrth Atlantic as a whole (Wahl and Lawson 1970) Oceans have demonstrated interactions
In Portland there IS no cle~lr evidence with the atmospheric circulation on a of eithe~ progress~ve_ warming or cooling near-hemispheric scale (Namias 1969) since the 1940s However the analysiamp Far example at extepsive relatively of temperature ~chqnges 9ver time is w~rm pool of surface water in the northshycomplicated bymany fadors not the centrat Pacific in the winter of 1971-72 least of which is the irtfluence qf contributed to a northward displacement human activity Due to cha~nges in the of the westerly jet stream together with heat bclIance associated with urbanization a compensating southward displacement ci ties tend to be warmer than the over the western United States bringing surrounding countryside Likewise the in cold air (Figure 28) This pattern growth cSt a large city like Portland may contrasts vHh that of the 1960s when acco~nt for warmjng noted during the Ianomalous cold sea surface temperatures first half of the century persisted in the Central Pacific with
Precipitation data are less sensitive warmer water to the west leading to to the effects of urbanization (Figure frequent storm development in the 27) The decade of the 1870s and the intervening zone of strong temperature early 1880s were extremely wet in gradients The associated lpper airflow Water Year 1883 Portland received an produced a ridge- ot -high pressure over incredible 718 inches of precipitation th~ American West with warm winters Annual amounts declined steadity in California and the Pacific Northwest through the 1920s and early 1930s a (Barry and Cho~ley 1982) time of widespread drought in North The most famous drought of the America and then increased steadily American West in recent memory was through the J960s The decade of the that of 1976-77 For much of the Pacific 1970s i~ marked by extreme year-toshy Nortnwest this was tHe driest Winter year -vaTiability a finding conslsteRf on record (Bates 1978) Portiand forshywith the global climate as diseuroussed example reteived 276 inches at the above downfown station 65 percent of the
long-term middotnormal Namias (1978)CLIMATE OF
demonstrafed the cause linked to seashyTHE FltTURE surface temperatures In the autumh of
Althbughr it is impossible to forecast 1976 to February 1977 Warmer water future climate With any confidence and a strong middotupperair ridge persiSfed scientists have- rapidly ihcreased their near the1west-(oast (Zooler waters and understanding of short-term anomalies a persistent trough were locatedmiddot toWard iii ternperatute and precipitation Yearshy the central Pacific In other words it to-year variability of climate -in the was a more extreme example of the
34 Weatherand Climate of Portland
Water-Year Precipitation Portland Oregon
Water Year
Figure 27 Time series of annual preshycipit~tion Portland 1872 1985 Data -are from downshytown statiort through 1972 and- PortlandmiddotltGW-TV beginshyning in 1973 Annual totals are for the Waler Year (October through September)
situation presented in Figure 28 for the 1960s
In recentyears the conc~pt of atmQsshypheric teleconnections as related to sea- surface temperature patterns has taken on a new djmension with recognitiol of the o~ean-jtmosphere phenomenon called EI Nino-SouthEirl1 Oscillation (ENSO) which occurs in the equatorial 1acific Ocean fENSO s id~ntified as a w~~kening In -the- norllal gradient between high pressure c~I)tered in the central pacific pff the coast of South
America and low pressure in the Indian Ocean n~ar Austrqlia (RasIJlusson 1985) Recent research has clearly demonshystrated that there are world-wide effects deried fro~middot an ENSO event A deltrea~ in the pressure gradient results in disshyplacement 0pound the nornlally occurring weather systems in the mktdle latitudes and is termed the Pacific North American (PNA) Teleconnection The shift in nQrmal circulation n the eastern north Pacific and over the contishynental United States has been observed to result in associated shifts in stOrm tracks and temperature patternsmiddotmiddottough atld Fritts (1985) showed that during an ENSO event precipitation particularly in the winfer tends to pe less than normal over the Pacific Northwest due tp a sOlthem displa~ment of the usuql storm track In addition temperatures
35 Weather andmiddot-Climate of Portland
Figure 2SshyI
Generalized relationships beshytween ocean-surface tempershyatures jet stream tracks and land temperatures over the North PaCific and North
AmeIicq during average winter conditions jn the 19605 and th~ winter of 1971-72 (I~rry and Chorley 1982 pp 192-193)
36 Weather and Cilimafeof Portland
tend to be warmer than normal over the Pacific Northwest
Only a few years ago distant events such as a warming in the equatorial oceans would have appeared to hold little relevance tor the weather and climate of Portland Although these atmospheric
tel~connections are not yet adequately defined for reliable monthly and seasoruil forecasting it is a field in which knowshyledge is accumulating rapidJy Yetin spite of advances in our understanding of climate - in its controlling mechanisIlamp and in its natural variability -- the ideology of climate for POrtland and the Pacific Nortltwest is still relevant Rainfall in Portland is indeed prolific but the mild winters and the pleasant summers blend with a beautiful and accessible physical and cultural envishyronment to enhance l lifestyle valued by local resrdents
REFERENCES
Agee E M 1980 Presert climatic cooling and a proposed causative mechanism Bulletin American Meteorological Society Vo1611356-1367
Ahrens C D 19amp5 Meteorology Today An Introduction to Weather Climate and the Environment St Paul MN West Publishing Co 523 pp
Baker R W and Hewson E W 1978 Wind power potential in the Pacific Northwest Journal of Applied Meteorplogy Vo1171814-1826
Barnosky C V 1984 Late Pleistocene and ~arly Holocene environmental hisshytory of s9uthwesterp Washington State USA Canadian Journal of the Earth Sciences Vo121619-629
Barry R G and Chorley ~ J 1982 UAtmosphere Weather and Climate (Fourth edition) London Methuen amp Co Ltd 407 pp
Bates EM 1978 Precipitation distribution in Oregon prJbabtiity of dry years National Weather Digest VoL317-26
Btadley R 5 1976 Precipitation History ~of the Rocky Mountain States Boulder CO Westview Press 324 pp
Brown R M 1980 Bless the Rain Oreshygon Magazine VollO25-28
Cameron D C and Carpenter A B 1936 Destructive easterly gales in the Columbia River Gorge December 1935 Monthly Weather Review Vol64264-267
Cody R 1985 Why cant they get it right Northwest Magazine July 286-11
Decker F W 1Q79 Otegons silver thaw Weathefwjse Vo13276-78
DEQ (Department of Environmental Quality) 1986 Annual Report State of Oregon
Diaz H E and Quayle R G 1978 liThe 1976-77 winter in the contiguous United States ih comparison with past records Monthly Weather Review Vol1061393shy1421
Harper B P 1962 Report on October 12 windstorm Unpublished paper Bonneville Power Administration Portland OR 18 pp
Heusser C J 1983 Vegetational history of the northwestern United States including Alaska Chap 13 in Late Quaternary Environments of the United States Vo11 Edited by S C Porter Minneapolis MN University of Mirtnesota Press
Jackson P L 1985 Climate pp 48-57 in Atlas of the Pacific Northwest (7th edition) Corvallis OR Oregon State University Pr~ss
Johnson q M and Dart J 0 1982 Variability ofmiddot Precipitation in the Pacific Northwest Spatial and Temporal Characteristics WRRI-77 Corvallis OR Water Resources Research Institute 182 pp
Jones P D Wigley T L M and Kelley P M 1982 Variations in surface air temperatures Part 1 Nor~hern hemisshyph~re) 1881-1980 Monthly Weather Review Volll059-70
Kesey K 1963 Sometimes a Great Notion New York Viking Press 599 pp
Lough J M and Fritts H C 1985 liThe Southern Oscillation and tree rings 1600- 1961 Journal of Climate and Applied Meteorology Vo124952-966
Lucia E 1963 The Big Bjorv the Story of the Pacific Northwests Columbus Day Storm News-Times publishing Co Portland OR 64 pp
Lynott R E 1966 Weather and climate - Of the Columbia River Gorge Northwest
Science Vol40129-132 Lynott R and cameron O P 1966
Detailed analysis of the 1962 Columbus
37
Day windstorm Monthly Weather Review Vol94 lOS-117
Mitchell J M 1961 Reltent s~Ctlar changes of global temperature Annals New York Academy of Science middotVol~S23S-2S0
___ 1963 Worldwide pattern of secitlar temperature change In Changesmiddotin Climate Arid Zone Research XX Paris UNESCO
Namias J 1969 IJSeasonal interactions beshytween the North Pacific Ocean and the atmosphere during the 1960s Monthly Weather Review Vo197173-192
___ 1978 Multiple causes of the North American abnormal winter 1976shy1977 Monthly Weather Review VoL106279-29S
NOAA (National Oceanic and Atmospheric Administration) 1986 Local Climatological Data Annual Summary 1985 Portland Oregon Asheville NC 8 pp
Oliver R C 1976 On the response of hemispheric mean teuromperature to stratospheric dust An empirical approach Journal of Applied Meteorology Vo11S933-9S0
Rasmusson E M 1985 El Nino and varishyations in climate American Scientist Vol 73168-177
Read R 1983 Northwest weather often fouls forecasters The Oregonian November 23 1983 p A6
Shelton M L 1977 The 1976 and 1977 drought ih California extent and severity Weatherwise Vo130139-153
Trewartha G T 1981 The Earths Problem Climates (2nd edition) Madison WI Univ~rsity of Wiscqnsin Press 298 pp
Wahl E W and Lawson T L 1970 The climate of the mid-nineteenth century United States compared to the current normals Monthly Weather Review Vol98387-401
Wantz J W Ferris C M and Larsen N S 1983~ Pifteen-year average precipitaion patterns as revealed by the Portland Oregon mesoscale precipitation netshywork Unpublished paper Bonneville Power Administration Portland OR 13 pp
Weather and ~limate of Portland
Western SUN 1980 Oregon Solar and lWeather Information WSUN 11 Portland ORSI pp
Willett H C 1974 Recent statistical evishydE1nce in support of the predictive signifishycance of splar-climatic cycles Monthly Weather Review Vol102679-686

~
Tabl
~21
Clim
atic
sum
mar
y fo
r Po
rtla
nd
Ore
gon
194
1-19
85
Dat
a ar
e fo
r th
e N
atio
nal
Wea
ther
Ser
vice
sta
tion
loca
ted
six
mile
s no
rth-
nort
heas
t of d
ownt
own
Port
land
on
the
Cpl
umbi
a Ri
ver
Elev
atio
n i~
21
feet
abo
ve s
ea l
ever
Nor
mal
s ar
e ba
sed
on t
he
1951
-198
0 re
cord
ex
trem
es a
re fo
r th
e en
tire
per
iod
of re
cord
(fio
lar
radi
atio
n da
ta a
re fr
om W
este
rn S
UN
19
80
p 1
6 a
ll ~
oth
er d
ata
are
from
NO
AA
19
86)
tD
~
Sol
ar R
adia
tio
n (
BT
UIF
T2-
Day
) T
otal
Ho
rizo
nta
l In
sola
tio
n
Dir
ect
Bea
m N
orm
al I
nci
den
ce
Per
cen
t o
f P
ossi
ble
Su
nsr
un
e P
erce
nto
f M
ean
Clo
pd
Co
yer
T
emp
erat
ure
(Q
egre
es F
)
No
rmal
s
Dai
ly M
axim
um
D
aily
Min
itn
um
-
Mo
nth
ly
Ex
trem
es
Rec
ord
Hig
h
Yea
r
Rec
ord
Lo
w
Yea
r ~ P
reci
pit
atio
n(i
nche
s)
Wat
er E~u
ival
ent
-Nor
ma
Max
imu
m M
on
t4ly
Y
ear
M
inim
um
Mo
nth
ly
Yea
r
Max
imu
m in
24
Ho
urs
Y
eat
S
now
I~e
pel
lets
M
axim
um
Mo
nth
ly
Y
ear
M
axim
um
in
24
Ho
urs
Y
ear
Win
d
Mea
n S~ed (
mp
h)
~revai
g D
irec
tion
An
nu
al
l Ja
n
Feb
M
ar
Ap
r M
ay
Jun
e
Jply
A
ug
S
ept
Oct
N
ov
D
ec
Av
erag
e ~ =
~
310
952
554
1302
89
5 15
83
1308
21
59
166
3 26
03
1773
24
94
2037
31
11
1674
28
25
1217
24
13
724
1746
38
8 11
43
260
698
1067
19
60
n -
27
37
4
7
53
58
55
70
66
61
42
29
22
47
84
83
81
77
72
68
47
52
56
72
82
8
7
72
~ tD
Q
443
33
5
389
504
36
0
432
545
37
4
460
602
40
6
504
669
46
4
56
727
52
2
625
795
55
8
677
786
55
8
672
742
51
1
627
639
44
6
54~
523
38
6
45
5
46
4
354
40
9
620
44
0
530
d
Q a ~ ~
62
70
80
87
100
100
107
107
101
90
73
64
1964
19
84
1947
19
57
1983
19
82
1965
19
81
1944
19
80
1975
19
80
-2
-3
19
29
29
39
43
44
34
26z
13
6
1950
19
50
1955
19
55
1954
19
66
1955
19~
1965
19
71
1985
i
64
62
39
3
6 2
3
21
15
05
11
16
31
52
6
4
374
12
8
95
7
5 4
7
46
41
27
4
5 4
0
80
11
6
111
19~3
1949
19
57
1955
19
45
1~s4
19
83
1968
19
82
1947
19
4 4
196amp
0
1 0
8 1
1 0
5 0
5 T
0
0 T
T
0
4
08
1
4 19
85
26
1964
2
0 19
65
18
1956
1
5 19
82
15
1951
1
8 19
67
11
1970
1
5 19
75
24
19
78
22
19
76
26
197q
2
6
1974
19
82
1943
19
62
1968
19
58
1978
19
77
1982
19
4~
1973
~977
414
13
2
129
T
0
6 T
-
T
0
2
82
15
7
1950
1~
49
1951
19
85
1953
19
81
1949
19
50
1977
19
64
-10
6 3
2
77
T
0
5 T
T
0
2
74
80
19
50
1962
19
51
1985
19
53
1981
19
49
195 9
19
7l
1964
100
9
1
83
74
70
71
76
71
65
6
5
87
9
6
79
ES
E
ES
E
ESE
N
W
NW
N
W
NW
N
W
ES
E
ES
E
ESE
E
SE
E
SE
Weather and Clbnate of Portlartd Z3
Monthly Precip~tation ~ Portland Oregon
8
6 en Q) c o c
-
sect4 o ~~
0 u
Q)
CL2
~O J J r ) I I) gt~ I gt I )) I gt I) i gt gt ) gt I I) ) I
Oct Nov Dec Jon F~b Mar ARr May Jun Jul Aug Sap
Month
Figure 21 Annual ll1aJdl of precipitation Portland fqr the norrna1 moderating influence of the Pacific p~~od 1951-1980 Data ar~ Oceatt FurthermoreJ the Cascade presented according to the Range is an effective barnet to contishyWater Year October through nental air mflsses that form qver the September (from NOAA 1986) interior As a resplt e~treme winter
and summer temperatures that charac- teJjze areas 100 to 2QO miles to the east
Willamette Valley is drier and yields rarely occurjn Portland less pr~cipitation than it would in the The marine influen~e in western absence 9f this topQgraphic bartier In Oregon reduces the ampIitud~ o~ the summer the Cpast Range ~ffectively annual temperature cyc1~ below that qf prevents penetration9f cool marine air continental lpcations Thus the wet into the valley wjnter seas01 is marked by relatiyely
The Cascades provide an even mild temperatures the mean temperature st~per slope for orographic uplift of qf the c9ldest month Janyilry is 389degF the moisture-laden ~esterly winds Th~ Alsotypicaofa marine type of climate crest of th~ ~pg~ varies hom 5tPDO to the diurnal range is sma1lin the winter 10000 fe~t and is a significant eastshy when ciQuciy slsies prevail with a mean west precipitation clivide shielding the daily ma~irpU1lJ in January of laquo3degF interior Columbia Plateau from the and a meanmiddot dally minimum of q35degF
24 Weather atJd Climate of Portland
Figure 22 Generalized air pressure and wind conditions for the eastern Pacific Ocean and western United States January and July depicting dominant seashysonal modes of atmospheric circulation that influence the climate of Portland (Jackson 1985 p49)
SUJnmer produces some of the most pleasant teather itt N6rtl AmeriCa with mild temperatures and very little precipitation In July the warmest month the mean temperature is 677degF with a larger diurnal range than in winter atfributableto cleat skies (daily maximum ~~ 795degP daily mihimam = 5SS0P) Temperatures below OdegF are very rare in Portland T-he lowest- on record is -3OP which occttrred in February 1950 Temperatures above 100degF are also infrequent the maximum of 107degF was recorded in July 1965 Temperatures above 9DoF are -attained every year but seldom persistmiddot for mote than a) -few days Hence a long growing season cbmbirleci with ample moisture supports prosp-erous agricultural- activity in the iural areas surrounding Portland and is an important underlying factogt ih t
POrtlattds reputation as the RoseOty Climatic norin51s or averages Jrepreshy
sent a ~Series of consfantly fltiwanrtg v~Iues of t)e ba~ic clim-aNc el~etrs~ Calenaat yeht 1985 toIrers a goodillilS
tration of the fact -that climate is more than just an -average of lhe el~ments which comprise it (Figure 24) This was ayear in which many new records wer~ established for daily rpaximum ahd minImum temperatures a response to the dominance of continental air masses over tite more moderate marine air Il)asses for extended perJods of ime JUty w~s erne bf the warmest months of the century with a monthly mean of 741degF (normal 677degF) The mean daily temperature on 30 of the 31 days exceedE -the norm and for 11 days the daily maximum w~s above 90degF an unshyusually lOng spell of not weather
Conversely the year began and ended with well below normal winter temperatures January and February were extremely cold due to the anchoring of a high pressure ridge over the Pacific Northwest permitting the influence of a continental air mass with clear Skies Noverrtber 1985 waS the coldest November on record in spite of several Warm days at the beginning of the montft During one 10 day sequence there wete eight days in which the temperature remained constantly below freezing anmiddot unusually proltgtnge_d cold spell for Portland The monthly mean ofJ73degF was 8~bF belOW normal After a few i
relatively b~lmy days H roecem~ there follbwed~~nnotheI teIharkaore-middotsmiddote~
25 w~Cther and Cljplate Qt Portlttnd
rf- 11
I -~ ~~~r~
j $gt -lt- bull
~--~ ~------ ~ -~ ~ -
~ )i-i~ ~ltati ~ gt~~~~~ ~-
A ~~~-- ~d 4 Y- ~
Figure 23 Regional getting of Portland illustlating the major topogshyraEhic controls o~ climate Drawing is noJ to scale
quence of cold weather exten~g to th~ end of the month Forturtately thearea was released from this icy grip onmiddot New Years Day 1986 with the arrival of a marine- air mass that raisedmiddot the tempershyature to a high of 51degF
EXTREME METEOROLOGICAL EVENTS
The Portland area indeed tRe entire P~cific Northwest is generally immune rom t1)e effects of severe storms which so oftel create havoc in other parts of
bull the world For example the combination
of climatic controls ismiddot not ~onducive to the formation of hurricanes and tornadoes From 1953 to 1976 only 23 tornadoes were reported in Oregon and 24 in Washington and most- of these were ea~t of the- Casades These numbers pale in comparison tQ the 1326 tor nadoes reported in Oklahoma chJritlg the same period (Ahrens 1985 p A06) ~vere thunderstorms while cPqlmon eqst of the Cascades are alampo rqre in the Willamette Valley Air mass thqRqershysforms require vigoJous eonveq1ve uplift in a humid atmosphere a situation unshycOJnmon in Portland where the warm sunpy summer~daysthat would promot~ (0nvective activity are-also day~ in which a dq air mass dominates tQe region likewise forced lifting along a frontal boundary is rarely rapid enough to
26
0
~ 00shy100 050
Eshy cI 020I0 -u 010
U ~ 005 rl 002 a 001 0 000
Weather add Qlirlialemiddot of Portland
Daily Data CELSIUS 105 -----------------------------------------------------~ 40
E= (j
rl Ia z J cI
~ a I
a Crl 0 rn 2 cI
cIrl QE- o
cI e
100 t5 go
85 80
75 70
65 60
55
50
45 40
35
30 25
20
15
10
36
32
28
20
16
12
JAN FEB MAR APR MAY JUN JUL AUG SEP OCT NOV DEC 300Z 200 ----__------_shy
10 2030 10 2026 10 20 30 10 20 30 10 20 30 10 2030 10 20 30 1020 30 10 20 30 1020 30 10 20 30 10 20 30
Figure 24 Annual march of daily tempshy recorded along the west coast (Luciaerature and precipitation in 1963 Lynott and Cameron 1966) InPortland for Calendar Year
1985 Data are for National many places new records of extreme Weather Service station winds were esfablished and damage was (NOAA 1986 p 1) in the millions of dollars Contrary to
popular reports in the press this was spawn thunderstorms The National not a hurricane or tropical storm but a Weather Service reports an average of mid-latitude cyclonic storm unusual for only 71 thunderstorms per year in its severity and its early season occurshyPortland the majority occurring from rence Wmd gusts ltgtn Mount Hebo in April to August(NOAA 1986) the northern Oregon Coast Range at
EXtreme me~orological events in the 3000 feet elevation were estimated at Portlapd area are -generally restricted to 170miles-per-hour In downtown Portland two types -- 1) mid-latitude cyclones gusts of 116 miles-per-hour were which ontJccasion are very severe and recorded at the Morrison Street Bridge 2 winds and precipitation influencedmiddot by exceeding any -previous records- for the the Columbia RivermiddotGorg~ In the minds metropolitan area (Harper 1962) of 1nost long-time reside1lts of northwest The storm of November 13 1981 Oregon the single most frightening was a siltrilar event that liowled up the meteorological event of this century was Oregon coast~ generated by an intense the falllOus Columhus Day StOInl of low pressure cell Ninety mile-per-hour October 12 1962i one of the middotmost winds floOding and widespread Cievasshy-vigorous and destructIve of its type ever tation in Brookings and Coos Bay were
27
reportedr from the south ana central Coast It swept into Itortland shortly after midnight with hurricane-fotce
winds that ripped roofs from buildings and tore a supertartket from irs Swan Island middotlJlooring Power lines- and radio towers Were toppled middottrees uprooted
~ motor Romes crumpled and aircraft upended Throughout Oregon the storm took 11 lives and caused $33 milshylion in -damage (Cody 1985 p7)
Infrequent severe stormsof this type highlight the difficulty of weather foreshycasting in Portland and the Pacific Northwest Despite major technological advances that have made weather Freshy
diction a science instead of a mysterious
attentpt at outguessing the gods meteorologists claim that the Northshywest remains one of the trickier regions in the country to forecast (Read 1983) A primary reason middotis the paucity of sur face observations over the Pacific Ocean Forecasters thus louk to satellite photoshygraphs for middotinformation These give imshymediate- data on the higher levels of the atmosphere but only limited surshyface information can be obtained from them Furthermore satellite photos are not detailed -enough for local forecasts which are so often confounded by the complex influences of local topography
Another sourcemiddot of headaches and sleepleas nights for local forecasters
and a Gompelling example of the influshyence of topography On climate both on the local and regional scale is the Columbia River Gorge This remarkable transverse valley is a topographic feature of unparalleled natural grandeur sculpshytured by the Columbia River (Figure 23) It offers a low-elevation passage through the Cascades thus permittingmiddot a transhysition from the marine type climate of western Oregon to the continental type of the interior Lynott 1966) In reshysponse to prevailing regional pressure
Weather and Cliifta~ of Portland
gradiehts the majority of air mdVement through the Gorge is from the west tp east allowing marine air to modify temperatures east (jf the Cascades in both summer and winter
The Gorge has been described as a giant wind funnel Westerly winds can become quite strong and are often
observed as far east as Pendleton Howshyever it is the less frequent but normally more violent east winds induced by a reversal of the regional pressure gradient that are of particular concern to Portland These may occur at any time of the year but are most common in the winter when a cold-core anticyclone located over the ~terior blocks stGrm movement through the Pacific Northwest Polar air nocturnally cools and deepens east of the Cascades in the Columbia and Snake River Basins forming a large pool of cold air The Cascade Mountains form a natural barrier that traps this cold air mass and the only escape is through the Columbia River Gorge the Frazier River Valley in British Columbia and to a lesser extent the low passes in the Cascades (Baker and Hewson 1978)
Occasionally cold air in the Great Plains spills over the Rockies in to the interior basins and intensifies this east wind surge It is a synoptic pattern that typically persists for several days and has been known to last for several weeks sustaining strong easterly flQw through the Gorge into the Portland metropolitan area (Cameuroron and Carpenter 1936) For this reason Portland is generally windier and colder than nearby cities to the north and south The record low temperature of -3degF recorded in February 1950 was due to the influence of these easterly winds Freezing rain is ariother hazard that area residents are exposed to because of proximity to the Gorge If high pressure to the east coincides with a fall of air
28 Weathet andClimate of Fortland
ressutt along the coast as a frontal ~steI11 approa~sr the regional pressure ~adient is increased and the flow of east winds through the Gorge accelerated A shallow layer of cold air clings to the suriaGe and tempelatur~slt remain very colq In Portland As the moisture-laden au hom the Pacific moves inlandmiddot it rides Aloft Ovet this cpldJayer acombination of events that produces freezing rC)in or as it is commonly termed in Portlpnd a I silver thaw II One such-event occurred In early January 1979 as the fimiddotrst rains from an approaching Pacific storm fell into a frigid surface layer and cOpted aU fiurfaces with clear ice Electric power cOlllmunications transportation and all normal work lloutine broke dowfi in most of Portland most dramatically in the eastern part of the dty near the west end of the Gorge (becker 1979)
In this kind of synoptic situation all kinds of precipitation can occur in northwest Otegon depending on the temperature balance as controlled by eievation distance fromJ the sea and proximity to the Gorge It is a uniquei and devastating mix of topography and climate that makes the beautiful Columbia River Highway paradoxically the most ~cherous stretch of highway in the country While other regions in the country experience ice storms the topography ensures that the Columbia River Gorge and those areas exposed at either end of it will be subjected to more onslaughts than most Several years may go by without such an event but it may also occur with alarming frequency in the space of a few years Within the metropolitan area itself the severity of such stotIns and the pattern of minimum temperatures due to the Gorge winds WillYary dramatically While the east side Pi town may be buffeted by cold Gorge winds and freezing ram the
Tualatin Valley to the lee of the West Hills may be relatively balmy East wind events in the summer caUse a dIfferent SOt of problem importing high temperashytures and low hutniqiljes to northwest Oregon and southwest Washington At these times r~idents oflbe area watch for the return o(more mQderate marine air anq forest manag~s take special preshycautions against forest fires Most of the historically great forest fires in Oregon and Washington notably the great Tillamook Bum of the 1930s were driven by hot middotdry east winds (Johnson and Dart 1981)
SPATIAL PAITERNS
The unique setting and the complex topography within the Portland metroshypolitan ruea generates a fascinating mosaic of miGrOclimates patterns of climatic elements that are as complex as those for any metropolitan area ill the country Precipitation patterns are well documented thanks -to data collected from the Portland Mesoscale Precipitation Network a network managed by the Bonneville Power Administration and operational since the late 1960s Winter storms traverse the area on prevailing west to southwest winds distributing precipitation in a pattern highly corshyrelated with topography The spatial distribution is essentially repeatable from storm to storm thro-pghout the rainy season This topographic control is apparent in the pattern of annual precipitation yenet not all valleys are equally dry nor are similar elevations in the hills equally wet (Figure 25)
The least surpdsing aspect of the annual pattern is the west to east preshycipitation gradient a steady decrease down the east slope of the Coast Range and a steady increase up the west slope of the Cascade JoothillsElevated areas within the valley eg the Chehalem
29 Weather and Oimateof P-ortlantl
FiglJre 25 Average annual pt~cipitation in inches for the Portland metropolitan area (1968shy1982) Relatively wetter and drier areas are marked (Wantz et aI 1983 p 13)
Mountains ~southwest of the city and the West Hills which flank downtown r~ceive greater amounts of 54 inches per year Immediately downwind of the Chehalem Mountains lies the Tualatin Valley where ~he IS-year average rainshy
fall is as little as 38 incl1es ina large area between j3eaverton and Hillsboro This valley may be the driest area in northwest Oregon The other dry area has been recognized for years because the Portland National Weather Service Office lies at its euro~stern edge This is a long narrow rain shadow alonsect the Columbia River lying to the lee of the West Hills The IS-year average rainfall at the Portland National WeatHer Service Office is 387 inches (compared te 374 inches the climatic ~ormal
30 Weather and Climate of Portland
from Takle--21) It would be dlfficult to shyfinq a mor~ unrepresentative 10catioP for the citys official precipitation measurements (Wantz et aI 1983~
Tne West Hills rise more than 1000 feet above the surrounding lowlands and receive over 47 inches of orographishycally enhanced precipitation 25 percent more than the adjacent Tualatin Valley The increased amounts of precipitation in the West Hills are significant to local residents in the winter when monthly mean temperatures at the 1000 foot level average 5degF lower than at the Nationa Weather S~rvice Office Anshynual snowfall Jhere averages aboUt 24 inches nearly fhree times the average ir the lower valley areas Residents of the West Hills a~ occasionally surprised by a six ipch snowfan that severely hampers travel across the steeper terrain while suburbanflreas at lower elevations nearby may have no snow whatever
Temperature data from this mesoscale network are afairly recent addition and are collected at a smaller number of stations The major control on the spatial pattern of temperatme in the metropolitan area is elevation Jhus outlying areas are cooler than is the city center adshyjacent to the Wlllamette River However due to the combined influences of land use cold air drainage and proxinilty to the Columbia River Gorge a consistent temperature-elevation relationship does not exist Low-lying areas frequently haveltexceptionally cold nights and east side locations tend to be colder thanmiddot at similar elevations on the west side
The interaCtion of temperaturei atmospherilt moisture and topography dictates the patternof fog in the metr)shypolitan area a climatic element for which few data exist The National Weather Service reports an average- of 336 days-per year during which heavy fog restricts visibility to 14 mile or less
(NOAA i986) But such Ji5oinf) data dp Jlot tell the real story of the spatial patterns of fog in an area where the topography is so varied The National Weather Service Office is located in east Portland on the Columbia River adshyjacent to the Portland InternationaLAirshyport It is a site well-exposed tQ easterly Columtna Gorge winds which effectively dissipate fog that may persist in other parts of the metropolitan area Th~refore data from this stAtion are not represenshytative Happily the 10cati6n of the airshyport is suCh that it is not subject to frequent closures due to fog and reduced visibility a problem of greater magshynitude at other cities til the Pacific Northwest for exampfe Medford in southerl1 Oregon and Sea-Tac Airport in Seattle
The combination Of cold afr drainage and high moisture content in river valleys makes them susceptible to radiation fog which occurs frequently when regshyional high pressure dominates the area a common occurrence at any time of the year At times the low-Iy~ng areas are completely shrouded while the hills remain bathed in sunlight Ra4i4iltlon fogs tend to form upward from the grouXd as the night progresses and are usually deepest around sunrise A shallow layer-middotwin usually dissipate or burn off by afternoon Advection fog is more of a winter season phenomenon formed when relatively warm moist air moves over colder surfaces It is enlaJ1ced lgty upslope air flow so the higher elevations in Portland are more likely to be fogged in
Another significant environmental element directly related tothe complex interaction between climate and topogshyraphy is air pollution Unfortunately the combination of these controls in Portland precludes the efficien~ dispersal or pollutants The valley setting with
31
mountains on eithet side inhibits horiZ6ntat dispersion especlcdly in the summer when winds are light -ana generally from the north Pollutants cannot escape vertieally when mixirig is reduced oy inversions that exist under the intluence of high pressure a sItuation common in all seasons Ih fact throughout the valleys of western Oregon there is a higher frequency of inyersiors than in inost places in the country In Portland the averag~ height of the mixed layer is 3000 feet artd about 10 percent of the time the mixing height is below 1500 feet well below the crests of the flanking mountains (DEQ 1986) Thu there is a h~avy build-up of pollution with a corresshyponding reduction in visibility This is both a public health issue and an aesthetic one Many area residents gauge air quality by their ability to view two of the regions volcanic landmarks -- Mount Hood 60 miles to the east of downtown and MQunt sf Helens middotan equal di~tance to the north Stagnant air trapped under an inversion becomes increasingly polluted until the weather changes to bring in a strong regional flow that permits vertical andor horizontal mixing
CLIMATE IN THE PAST
One aspect of the temporal variability of climate is the annual cycle another is the variability over longer time scales Unfortunately observations of temperature and p~pitation in- Portland have been recorded for barely more than a century For the longer period prior to the advent of instrumental records in the 19th century the climate of Portland can be discussed only in general terms of the climate history of the Pacific Northwest A coarse outline for climate of the last 25000 years in the Pacific Northwest has begun to
W~ather 3nd Clitnate 0pound Portland
em~rge thanks to the work or several investigators rnost recently He1ISser (1983) and Barnosky middot(1984) In these studies paleoecologic data have been used to inferpret precipitation and tempeiature for the late Pleistocene and early Holocene ana they have shown tnatthe region has experienced a great rang~ in climatic conditions variatiohs in temperature and precipitation that certainly exceed -anything notedin the past few centuries
For the past 1OOOyears the accuracy and number of paleoclimatic indicators is greatly inereasmiddoted Three such indishycators yielding a wealth of information about~cimate throughout the American West are tree rIngs lake level fluctuations and the movements of mountain glaciers No information specific to the Portland metropolitan area is available but the broad-scale studies are spiced with interesting implications Perh~ps the most significant finding is that th~ climate of the mid-20th century is anomalous when viewed in afl historical context Bradley (1976) for example noted thCllt warm-moist conditions prevalent in the 19~n-1970 period have not occurred since the 14th century Furthermore there is a growing body of evidence that for the globe as a whole the extreme inter-annual variability of climate since about 1970 is more in keeping with climatic behavior over the past several centuries the middle decades of the 20th century were unusuar because
bf low interannuaf variability Extreme events in the 1970s such as severe winters in the central and eastern United States and drought in the west have certainly done nothing to refute this finding (Diazand Quayle 1978 Shelton 1977)
NevertJ1eless it i~ only for the period of insttumental observatiQns that precise statements can be made about the climatic history of Portland Data collection
32 Weatter iUld Climate of Portland
Gommenced in 1871 at a downtown stiltiqul which Qecame the qfficjal U S W~ather Bureau station when that agency was ~stablshed iI) 1892 Service cqntin1led -uninterrupted untJl 1973 Cojncident -with tfle closure of thi~ station was the Flddition of th~ dOVltown KGWshyXV st~tion to the cooperative c1imashyt910gic~1 netwOJ~ T~us a I1early homoshygeneous record Qpound tempera~ure and preshycipitatipn is available sinc~ 1871
These data can be analyzed iJ1 the context of c1im~Je variabil~ty for the northern hemisphere and for the Pacific Northwest MEln annual temperature
in Pottland sh~ws a steady increase fnnIl 1872 through the mid-1940s (Figure 26) Studies of instrumen~JiI records from throllghout the north~m hemisph~e qpcument the mucnqiscusse9 ge1eral wqqni1)g trend fro~ about ~85oto th~ 1940s (Mitchell 1961 1963) attributabJe in part to increaseq levels of carbon dilt~xide in theatmosple~e Af~er~abput 1940 there was a reversal of this trend and general cooling into the 1970B pri~arily at midqle Jld high latitudes (Jones WigleY1 and Kelly 1982) Caus~s of tNs coopng episltgtde are likely multiple including solar variab~lity (Willett 1974
Mean Annual Temperature Portland pregon
90
o J C c laquo
50
c g 475 ~
o o o 0) co
o 0)
N 0)
Figure 26 Time series of mean annual t~l1per~ture Portland 1872shy1985 Data are from downshytown station through 1972 and Portland KGW-TV beginshyniI)g in 1973
o o o It) rD co 0) 0) 0)
Year
33 W~atherandlClimate of-Portland
Agee 1980) and vQ1canic activity (Oliver Pacific Northwest is due to fluctuations 1976) However temperatur~ an~ Rre- in the jet stream ie changes in location cipitation anomalies on a regional basis cJfmean ridges and troughs in the windshydo not necessarily reflect the hemispheric flow in the middle and upper troposshytrend For example much of the western phere The location and intensity of half of the United States experienced a these features appears to be qitiltally slight warming while the rest of the influenced by sea-surface temperatUle nation experienced the cooling docushy anomalies and investigations for tlje mented for the northern hemisphere North Pacific and the Nqrth Atlantic as a whole (Wahl and Lawson 1970) Oceans have demonstrated interactions
In Portland there IS no cle~lr evidence with the atmospheric circulation on a of eithe~ progress~ve_ warming or cooling near-hemispheric scale (Namias 1969) since the 1940s However the analysiamp Far example at extepsive relatively of temperature ~chqnges 9ver time is w~rm pool of surface water in the northshycomplicated bymany fadors not the centrat Pacific in the winter of 1971-72 least of which is the irtfluence qf contributed to a northward displacement human activity Due to cha~nges in the of the westerly jet stream together with heat bclIance associated with urbanization a compensating southward displacement ci ties tend to be warmer than the over the western United States bringing surrounding countryside Likewise the in cold air (Figure 28) This pattern growth cSt a large city like Portland may contrasts vHh that of the 1960s when acco~nt for warmjng noted during the Ianomalous cold sea surface temperatures first half of the century persisted in the Central Pacific with
Precipitation data are less sensitive warmer water to the west leading to to the effects of urbanization (Figure frequent storm development in the 27) The decade of the 1870s and the intervening zone of strong temperature early 1880s were extremely wet in gradients The associated lpper airflow Water Year 1883 Portland received an produced a ridge- ot -high pressure over incredible 718 inches of precipitation th~ American West with warm winters Annual amounts declined steadity in California and the Pacific Northwest through the 1920s and early 1930s a (Barry and Cho~ley 1982) time of widespread drought in North The most famous drought of the America and then increased steadily American West in recent memory was through the J960s The decade of the that of 1976-77 For much of the Pacific 1970s i~ marked by extreme year-toshy Nortnwest this was tHe driest Winter year -vaTiability a finding conslsteRf on record (Bates 1978) Portiand forshywith the global climate as diseuroussed example reteived 276 inches at the above downfown station 65 percent of the
long-term middotnormal Namias (1978)CLIMATE OF
demonstrafed the cause linked to seashyTHE FltTURE surface temperatures In the autumh of
Althbughr it is impossible to forecast 1976 to February 1977 Warmer water future climate With any confidence and a strong middotupperair ridge persiSfed scientists have- rapidly ihcreased their near the1west-(oast (Zooler waters and understanding of short-term anomalies a persistent trough were locatedmiddot toWard iii ternperatute and precipitation Yearshy the central Pacific In other words it to-year variability of climate -in the was a more extreme example of the
34 Weatherand Climate of Portland
Water-Year Precipitation Portland Oregon
Water Year
Figure 27 Time series of annual preshycipit~tion Portland 1872 1985 Data -are from downshytown statiort through 1972 and- PortlandmiddotltGW-TV beginshyning in 1973 Annual totals are for the Waler Year (October through September)
situation presented in Figure 28 for the 1960s
In recentyears the conc~pt of atmQsshypheric teleconnections as related to sea- surface temperature patterns has taken on a new djmension with recognitiol of the o~ean-jtmosphere phenomenon called EI Nino-SouthEirl1 Oscillation (ENSO) which occurs in the equatorial 1acific Ocean fENSO s id~ntified as a w~~kening In -the- norllal gradient between high pressure c~I)tered in the central pacific pff the coast of South
America and low pressure in the Indian Ocean n~ar Austrqlia (RasIJlusson 1985) Recent research has clearly demonshystrated that there are world-wide effects deried fro~middot an ENSO event A deltrea~ in the pressure gradient results in disshyplacement 0pound the nornlally occurring weather systems in the mktdle latitudes and is termed the Pacific North American (PNA) Teleconnection The shift in nQrmal circulation n the eastern north Pacific and over the contishynental United States has been observed to result in associated shifts in stOrm tracks and temperature patternsmiddotmiddottough atld Fritts (1985) showed that during an ENSO event precipitation particularly in the winfer tends to pe less than normal over the Pacific Northwest due tp a sOlthem displa~ment of the usuql storm track In addition temperatures
35 Weather andmiddot-Climate of Portland
Figure 2SshyI
Generalized relationships beshytween ocean-surface tempershyatures jet stream tracks and land temperatures over the North PaCific and North
AmeIicq during average winter conditions jn the 19605 and th~ winter of 1971-72 (I~rry and Chorley 1982 pp 192-193)
36 Weather and Cilimafeof Portland
tend to be warmer than normal over the Pacific Northwest
Only a few years ago distant events such as a warming in the equatorial oceans would have appeared to hold little relevance tor the weather and climate of Portland Although these atmospheric
tel~connections are not yet adequately defined for reliable monthly and seasoruil forecasting it is a field in which knowshyledge is accumulating rapidJy Yetin spite of advances in our understanding of climate - in its controlling mechanisIlamp and in its natural variability -- the ideology of climate for POrtland and the Pacific Nortltwest is still relevant Rainfall in Portland is indeed prolific but the mild winters and the pleasant summers blend with a beautiful and accessible physical and cultural envishyronment to enhance l lifestyle valued by local resrdents
REFERENCES
Agee E M 1980 Presert climatic cooling and a proposed causative mechanism Bulletin American Meteorological Society Vo1611356-1367
Ahrens C D 19amp5 Meteorology Today An Introduction to Weather Climate and the Environment St Paul MN West Publishing Co 523 pp
Baker R W and Hewson E W 1978 Wind power potential in the Pacific Northwest Journal of Applied Meteorplogy Vo1171814-1826
Barnosky C V 1984 Late Pleistocene and ~arly Holocene environmental hisshytory of s9uthwesterp Washington State USA Canadian Journal of the Earth Sciences Vo121619-629
Barry R G and Chorley ~ J 1982 UAtmosphere Weather and Climate (Fourth edition) London Methuen amp Co Ltd 407 pp
Bates EM 1978 Precipitation distribution in Oregon prJbabtiity of dry years National Weather Digest VoL317-26
Btadley R 5 1976 Precipitation History ~of the Rocky Mountain States Boulder CO Westview Press 324 pp
Brown R M 1980 Bless the Rain Oreshygon Magazine VollO25-28
Cameron D C and Carpenter A B 1936 Destructive easterly gales in the Columbia River Gorge December 1935 Monthly Weather Review Vol64264-267
Cody R 1985 Why cant they get it right Northwest Magazine July 286-11
Decker F W 1Q79 Otegons silver thaw Weathefwjse Vo13276-78
DEQ (Department of Environmental Quality) 1986 Annual Report State of Oregon
Diaz H E and Quayle R G 1978 liThe 1976-77 winter in the contiguous United States ih comparison with past records Monthly Weather Review Vol1061393shy1421
Harper B P 1962 Report on October 12 windstorm Unpublished paper Bonneville Power Administration Portland OR 18 pp
Heusser C J 1983 Vegetational history of the northwestern United States including Alaska Chap 13 in Late Quaternary Environments of the United States Vo11 Edited by S C Porter Minneapolis MN University of Mirtnesota Press
Jackson P L 1985 Climate pp 48-57 in Atlas of the Pacific Northwest (7th edition) Corvallis OR Oregon State University Pr~ss
Johnson q M and Dart J 0 1982 Variability ofmiddot Precipitation in the Pacific Northwest Spatial and Temporal Characteristics WRRI-77 Corvallis OR Water Resources Research Institute 182 pp
Jones P D Wigley T L M and Kelley P M 1982 Variations in surface air temperatures Part 1 Nor~hern hemisshyph~re) 1881-1980 Monthly Weather Review Volll059-70
Kesey K 1963 Sometimes a Great Notion New York Viking Press 599 pp
Lough J M and Fritts H C 1985 liThe Southern Oscillation and tree rings 1600- 1961 Journal of Climate and Applied Meteorology Vo124952-966
Lucia E 1963 The Big Bjorv the Story of the Pacific Northwests Columbus Day Storm News-Times publishing Co Portland OR 64 pp
Lynott R E 1966 Weather and climate - Of the Columbia River Gorge Northwest
Science Vol40129-132 Lynott R and cameron O P 1966
Detailed analysis of the 1962 Columbus
37
Day windstorm Monthly Weather Review Vol94 lOS-117
Mitchell J M 1961 Reltent s~Ctlar changes of global temperature Annals New York Academy of Science middotVol~S23S-2S0
___ 1963 Worldwide pattern of secitlar temperature change In Changesmiddotin Climate Arid Zone Research XX Paris UNESCO
Namias J 1969 IJSeasonal interactions beshytween the North Pacific Ocean and the atmosphere during the 1960s Monthly Weather Review Vo197173-192
___ 1978 Multiple causes of the North American abnormal winter 1976shy1977 Monthly Weather Review VoL106279-29S
NOAA (National Oceanic and Atmospheric Administration) 1986 Local Climatological Data Annual Summary 1985 Portland Oregon Asheville NC 8 pp
Oliver R C 1976 On the response of hemispheric mean teuromperature to stratospheric dust An empirical approach Journal of Applied Meteorology Vo11S933-9S0
Rasmusson E M 1985 El Nino and varishyations in climate American Scientist Vol 73168-177
Read R 1983 Northwest weather often fouls forecasters The Oregonian November 23 1983 p A6
Shelton M L 1977 The 1976 and 1977 drought ih California extent and severity Weatherwise Vo130139-153
Trewartha G T 1981 The Earths Problem Climates (2nd edition) Madison WI Univ~rsity of Wiscqnsin Press 298 pp
Wahl E W and Lawson T L 1970 The climate of the mid-nineteenth century United States compared to the current normals Monthly Weather Review Vol98387-401
Wantz J W Ferris C M and Larsen N S 1983~ Pifteen-year average precipitaion patterns as revealed by the Portland Oregon mesoscale precipitation netshywork Unpublished paper Bonneville Power Administration Portland OR 13 pp
Weather and ~limate of Portland
Western SUN 1980 Oregon Solar and lWeather Information WSUN 11 Portland ORSI pp
Willett H C 1974 Recent statistical evishydE1nce in support of the predictive signifishycance of splar-climatic cycles Monthly Weather Review Vol102679-686
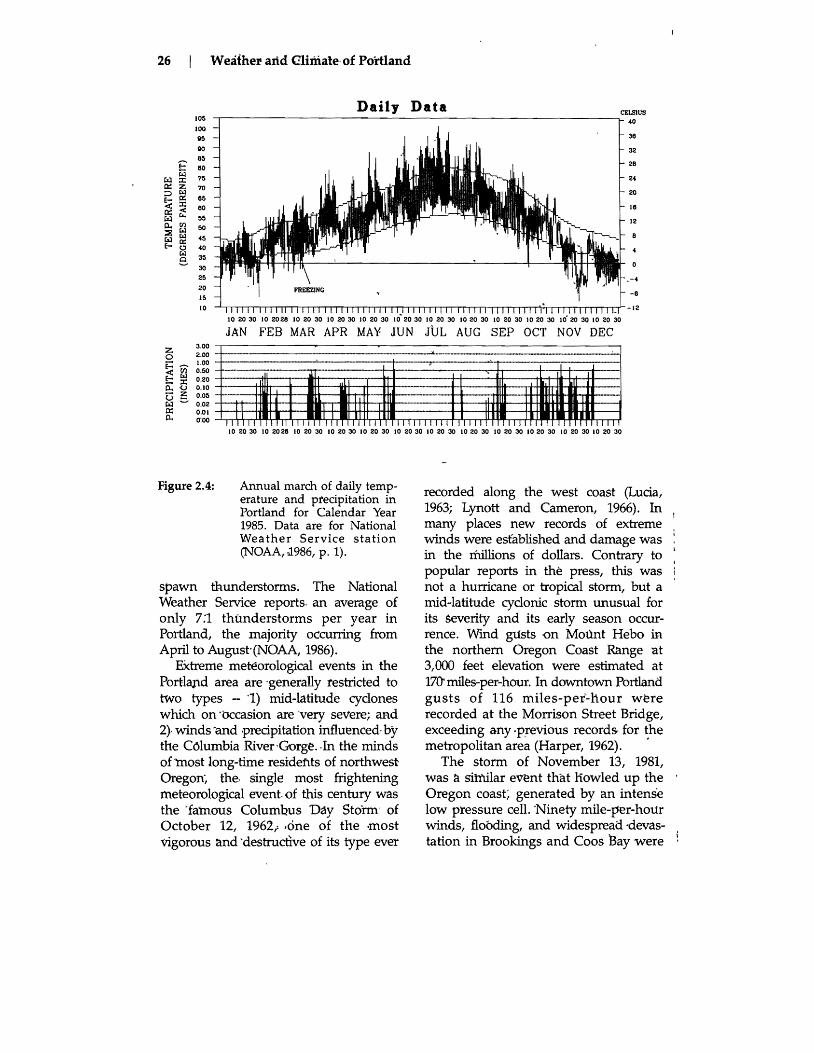