CHAPTER 2 SEDIMENTOLOGY & STRATIGRAPHY...SEDIMENTOLOGY AND STRATIGRAPHY Figure 2.7: Sedimentation...
8
CHAPTER 2 SEDIMENTOLOGY & STRATIGRAPHY
Transcript of CHAPTER 2 SEDIMENTOLOGY & STRATIGRAPHY...SEDIMENTOLOGY AND STRATIGRAPHY Figure 2.7: Sedimentation...

CHAPTER 2
SEDIMENTOLOGY & STRATIGRAPHY

Seismic Reconstruction, Thermal and Maturity Modeling of the Nova Scotia – Northern Morocco Conjugate Margins - 2019
SEDIMENTOLOGY AND STRATIGRAPHY
INTRODUCTION
Objectives
The objective of Chapter 2 is to update the stratigraphic framework of the Moroccan shelf in order to refinepotential links with the Nova Scotia (Canada) margin.
Results of the study are:• An update of the stratigraphic chart linked to and adapted with the Nova Scotia margin. This chart isbased on regional published literature and the current study (PL.2-3);• An update of the correlation panel of Transect 2 from DSDP-415 to AGM-1 wells (PL. 2-4), which havebeen chosen as representative of the deep offshore to platform sedimentary transition,• Creation of 4 burial history diagrams based on wells DSDP-416, AGM-1, AMBER-1 and FA-1 (Transect2) (PL. 2-5).
Well Database and Methodology
The well database consists of 9 key wells (Table 1) distributed offshore northern Morocco from the shelf todeep water (Figure 1). These wells are used to refine the lithostratigraphy and sequence stratigraphy ofthe area.
• Well lithology and petrophysics
No petrophysical interpretations were performed for this project. Only initial log data have been used andall wells presented good log sets. Lithologies have been interpreted from cuttings.
• Biostratigraphy in wells
Detailed biostratigraphic analyses were performed on a total of 10 wells; see Weston (2019) for moreinformation.
• Well correlation
One correlation panel is here used to create a better understanding of the Moroccan margin. This transectis based on Transect 2 and includes four wells from DSDP-415 to AGM-1. This work served as input forthe geophysical interpretation of the key horizons and the basin modelling.
Introduction PL. 2.1
Table 2.1: Selected wells for the stratigraphic framework study: 8 key wells used in the transects and 5 wells for regional understanding.
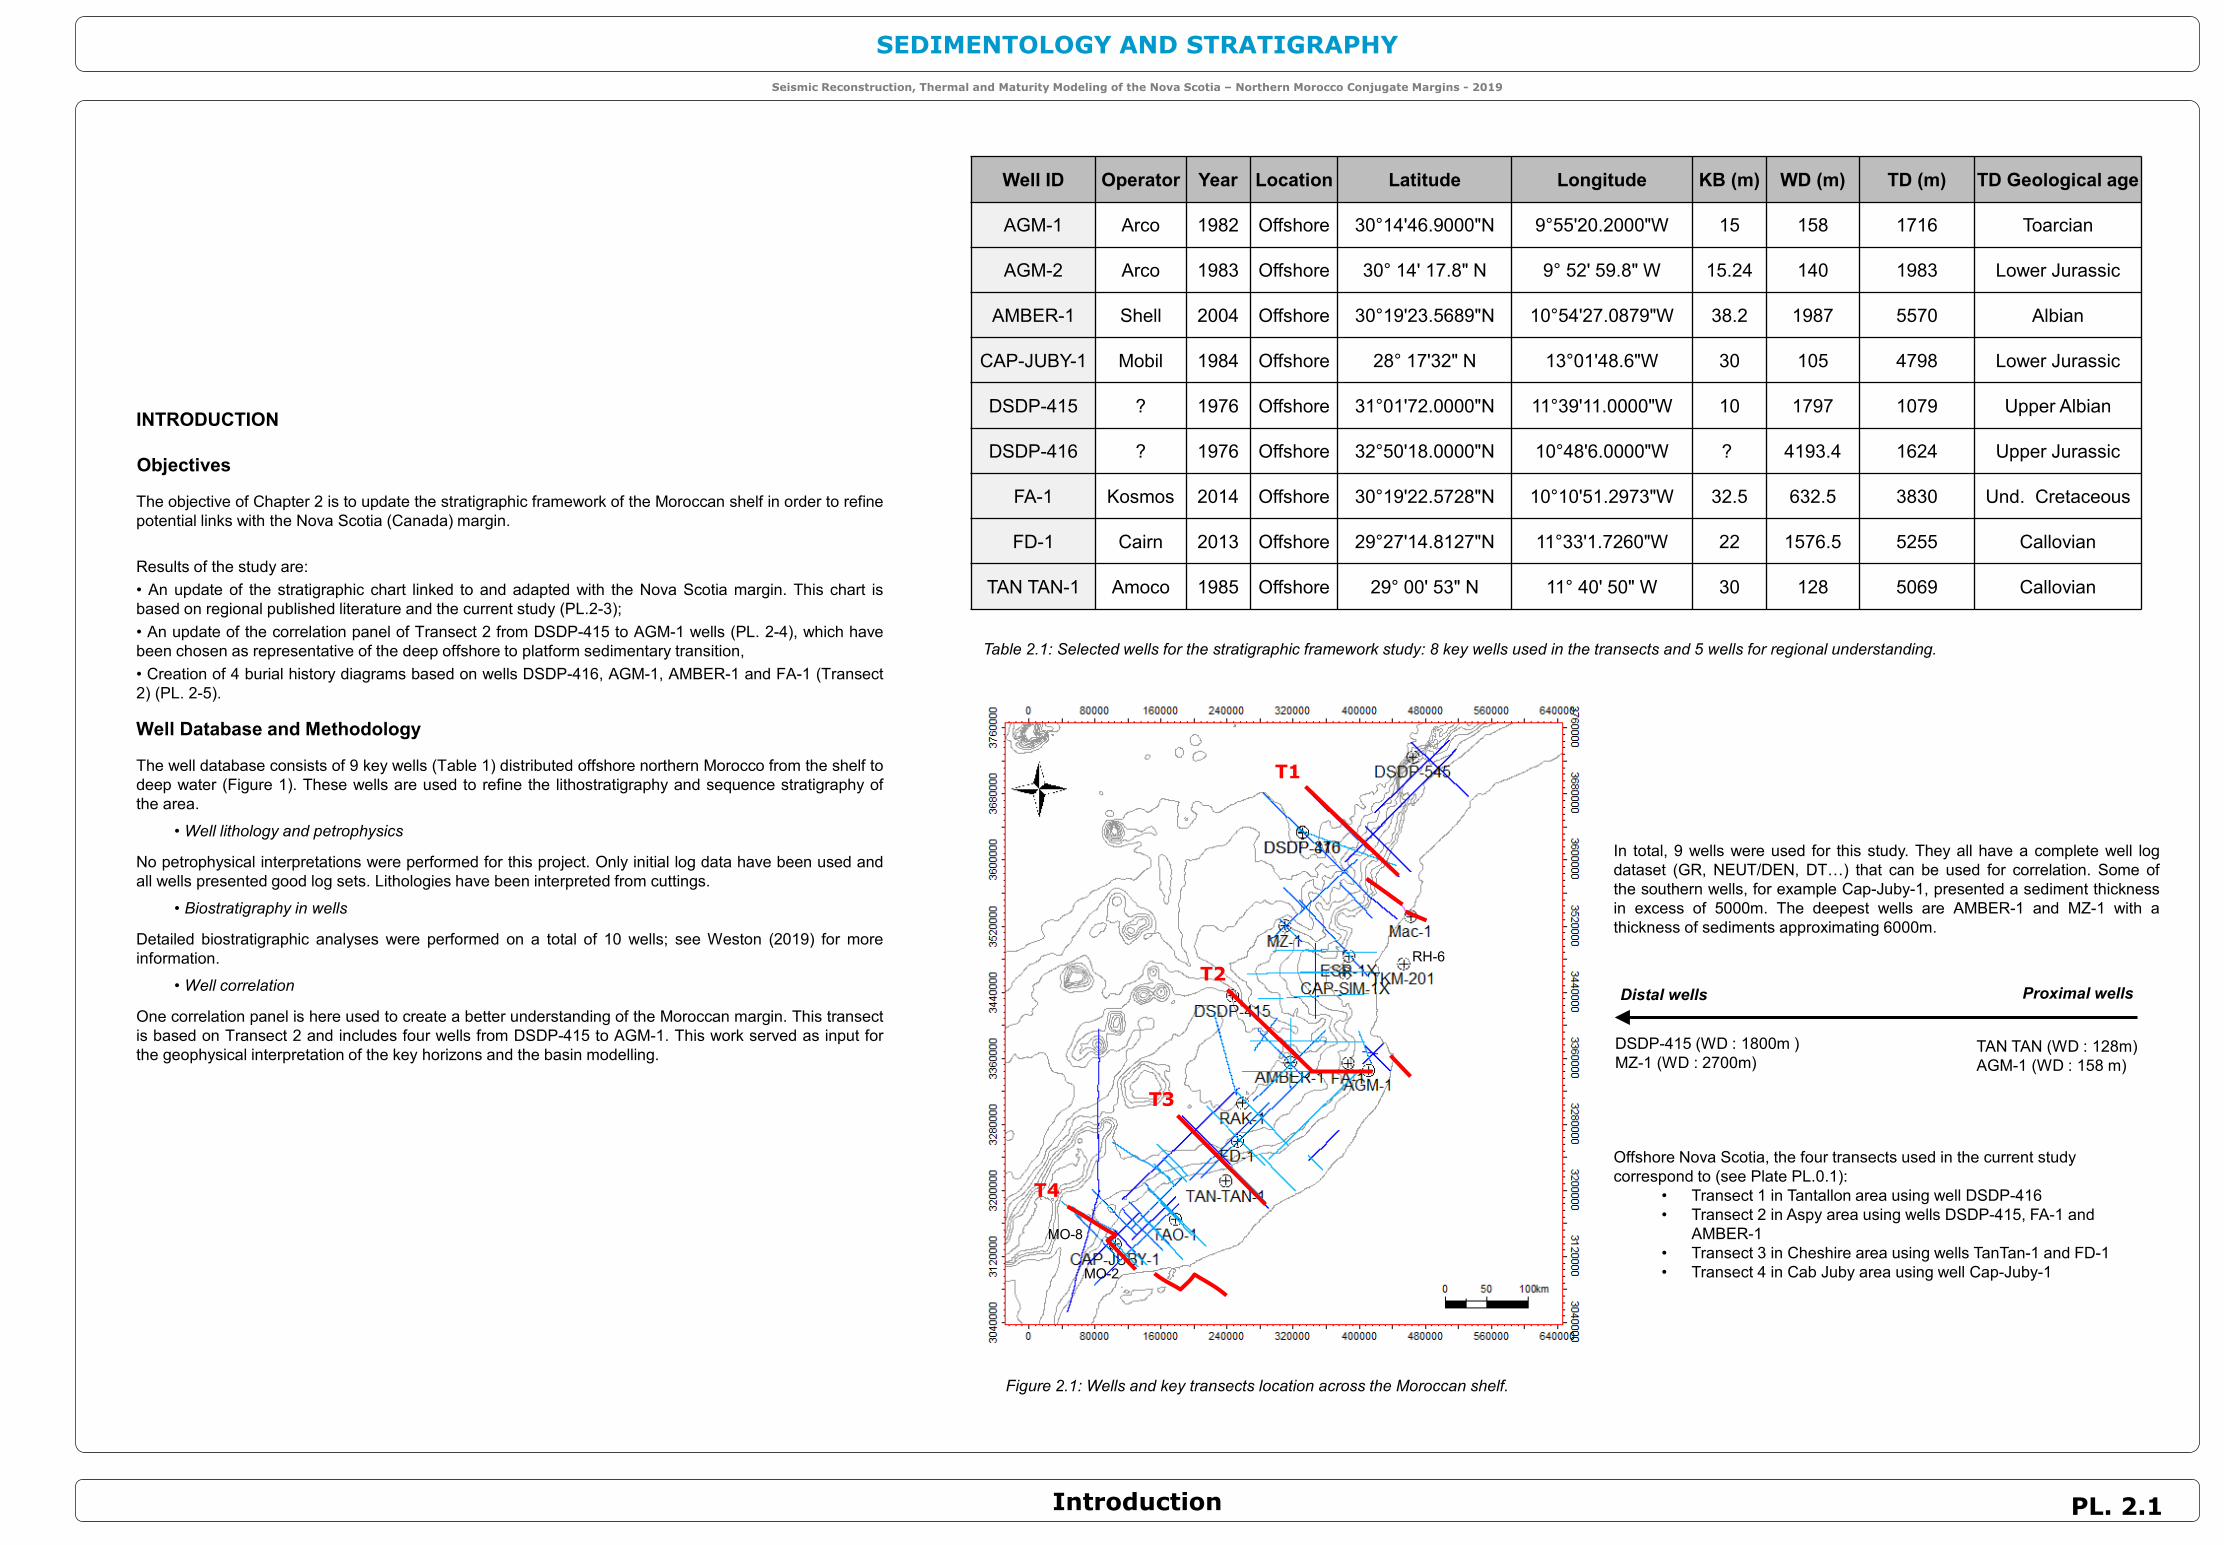
Figure 2.1: Wells and key transects location across the Moroccan shelf.
MO-8
MO-2
RH-6
T1
T2
T3
T4
In total, 9 wells were used for this study. They all have a complete well logdataset (GR, NEUT/DEN, DT…) that can be used for correlation. Some ofthe southern wells, for example Cap-Juby-1, presented a sediment thicknessin excess of 5000m. The deepest wells are AMBER-1 and MZ-1 with athickness of sediments approximating 6000m.
Offshore Nova Scotia, the four transects used in the current study correspond to (see Plate PL.0.1):
• Transect 1 in Tantallon area using well DSDP-416• Transect 2 in Aspy area using wells DSDP-415, FA-1 and
AMBER-1• Transect 3 in Cheshire area using wells TanTan-1 and FD-1• Transect 4 in Cab Juby area using well Cap-Juby-1
Proximal wellsDistal wells
DSDP-415 (WD : 1800m )MZ-1 (WD : 2700m)
TAN TAN (WD : 128m)AGM-1 (WD : 158 m)
Well ID Operator Year Location Latitude Longitude KB (m) WD (m) TD (m) TD Geological age
AGM-1 Arco 1982 Offshore 30°14'46.9000"N 9°55'20.2000"W 15 158 1716 Toarcian
AGM-2 Arco 1983 Offshore 30° 14' 17.8" N 9° 52' 59.8" W 15.24 140 1983 Lower Jurassic
AMBER-1 Shell 2004 Offshore 30°19'23.5689"N 10°54'27.0879"W 38.2 1987 5570 Albian
CAP-JUBY-1 Mobil 1984 Offshore 28° 17'32" N 13°01'48.6"W 30 105 4798 Lower Jurassic
DSDP-415 ? 1976 Offshore 31°01'72.0000"N 11°39'11.0000"W 10 1797 1079 Upper Albian
DSDP-416 ? 1976 Offshore 32°50'18.0000"N 10°48'6.0000"W ? 4193.4 1624 Upper Jurassic
FA-1 Kosmos 2014 Offshore 30°19'22.5728"N 10°10'51.2973"W 32.5 632.5 3830 Und. Cretaceous
FD-1 Cairn 2013 Offshore 29°27'14.8127"N 11°33'1.7260"W 22 1576.5 5255 Callovian
TAN TAN-1 Amoco 1985 Offshore 29° 00' 53" N 11° 40' 50" W 30 128 5069 Callovian

Seismic Reconstruction, Thermal and Maturity Modeling of the Nova Scotia – Northern Morocco Conjugate Margins - 2019
SEDIMENTOLOGY AND STRATIGRAPHY
Regional framework Nova Scotia - Moroccan MarginPL. 2.2
CANADA - NOVA SCOTIA (Figure 2.2A)
The Canadian margin is much wider than the Moroccan margin, with a very thickoverall sedimentary sequence, about twice as thick as the Moroccan margin. The totalsedimentary thickness can reach 18 km above the syn-rift basins.
The syn-rift formation is defined by a dominance of landward dipping faults. The saltbasin is restricted to the deep-water basin showing relatively advanced saltstructures, such as diapirs.
Another striking feature is the presence of a thick (up to 4.5 km) and laterallyextensive (occurring for more than 15,000 km2) Middle to Upper Jurassic package ofsediments, which sole out onto the regional salt detachment (Tari et al., 2013).
MOROCCO - NORTHERN MOROCCAN MARGIN (Figure 2.2B)
The conjugate Moroccan margin has a very thin syn- and post-rift cover.
The regional transect of the Moroccan margin over the Tafelney Plateau shows awider salt basin compared to Nova Scotia. Whereas there are relatively simple saltdiapirs existing onshore, the salt tectonic styles become gradually more advancedgoing offshore. Several salt diapirs were described from the area outboard of thePlateau on the abyssal plain. Based on their expression on the present-day seafloor,some of these salt diapirs are still active (Tari et al., 2013).
Figure 2.2: Regional cross section interpreted across (A) the La Have Platform of offshore Nova Scotia and(B) the Tafelney Plateau. Vertical exaggeration is about fivefold at 4 km/s velocity. (from Tari et al., 2013)
A
B
A
B
Location map (from Tari et al., 2013)

Seismic Reconstruction, Thermal and Maturity Modeling of the Nova Scotia – Northern Morocco Conjugate Margins - 2019
SEDIMENTOLOGY AND STRATIGRAPHY
Upper Salt (Lias)
Jurassic
Lower Salt (Triassic)
Triassic SandstonesBasement
Basement
MAC-1
Comparative Stratigraphic Chart PL. 2.3
Regional Geology and Stratigraphic Framework Overview
Figure 2.3: Modified Stratigraphic Chart incorporating all sedimentary and geological eventsas well as interpreted seismic horizons and global sea level.
CONJUGATE ATLANTIC BASINS - NOVA SCOTIA & MOROCCAN MARGIN
Both syn-rift sequences are dominated by continental clastics, salt and some basalt intercalations (200Ma) (Figure 2.3). The age of the breakup unconformity appears to be late Lias on both margins. Liassediments are observed on the Moroccan margin (Figure 2.4) underneath the breakup unconformity,while the existence of Lias sediment is still under debate along the Canadian margin. Both margins seethe preservation of a widespread Jurassic carbonate platform that was drowned by Early Cretaceoussuccession.
One of the most important differences is the overall amount of siliciclastics delivered across the paleo-shelves of these margins (Figure 2.3). Several major deltas developed on the Canadian margin fromMiddle Jurassic and extending throughout most of the Cretaceous, whereas, the last major pulse ofsiliciclastic sedimentation was produced only by the Neocomian Tan-Tan fan delta system in theMoroccan basin. Finally, there was a very important phase of Late Tertiary volcanism on the Moroccanmargin (Canary Islands), and in the north in ultradeep water (Tari et al., 2013).
Ten seismic horizons have been interpreted on both margins for this project in order to understand andcompare the evolution and filling of the basins between Nova Scotia - Canada and the conjugatenorthern Morocco margin.
The horizons are :- T23- T50- BTU (only observed along Moroccan margin) - K94- K101- K130- J145- J163- J183- T200 (Top Autochthonous salt)
Breakup Unc.
Breakup Unc.
Figure 2.4: A) Onshore seismic linethrough well MAC-1 and B) onshoreseismic line located East to the T1termination. Both lines are courtesyof ONHYM. See the map forlocation of the seismic lines (blueand red circles, respectively).
A
B
TERTIARY
CRETACEOUS
JURASSIC
A
B

Seismic Reconstruction, Thermal and Maturity Modeling of the Nova Scotia – Northern Morocco Conjugate Margins - 2019
SEDIMENTOLOGY AND STRATIGRAPHY
Correlation Panel - Transect 2PL. 2.4
This correlation panel illustrates the dip transition between the oceanic and the continental crust across a wide salt basin (Figure 2.5 and 2.6). It uses 4 wells:DSDP-415, AMBER-1, FA-1 and AGM-1 from proximal to distal position. The pile of sediments (interpretation of ages based on biostratigraphic data)accumulated and preserved within the salt basin (see well AMBER-1) is much thicker compared to the surrounding wells. This is particularly well illustrated forthe Tertiary succession.
J163
Figure 2.6: Well correlationpanel on the Moroccanmargin from distal to proximalwells.
Figure 2.5: Wells and key transectlocation across the Moroccan shelf forthe correlation.
T5T23T29T34T50T56T66K94K101K130J145J151J163J174J183
TERTIARY
CRETACEOUS
JURASSIC

Seismic Reconstruction, Thermal and Maturity Modeling of the Nova Scotia – Northern Morocco Conjugate Margins - 2019
SEDIMENTOLOGY AND STRATIGRAPHY
Figure 2.7: Sedimentation rate diagram
Figure 2.8: Burial history diagrams from Jurassic to Tertiary for 4 wells : A) Agm-1, B) Fa-1, C) Amber-1, and D) DSDP-415 respectively from proximal to distal location.
Burial History Diagrams PL. 2.5
As seen along the correlation panel of PL. 2-4, the burial history varies greatly fromproximal to distal location along the Moroccan margin (Figure 2.6). Well AMBER-1(Figure 2.6.C) demonstrates the maximum burial, in relation with a highsedimentation rate (green dots in Figure 2.7). The three other wells shown here arecharacterized by a more comparable sedimentation rate (wells DSDP-415, FA-1 andAGM-1 in Figure 2.7). AGM-1 and DSDP-415 have similar burial history while FA-1demonstrates significant burial during Jurassic time.
A. AGM-1 (continental crust) B. FA-1 (continental crust)
C. AMBER-1 (salt basin) D. DSDP-415 (oceanic crust)