Chapter 2: Heterogeneities in macroparasite infections: patterns and processes · 2002-03-14 · 1...
48
1 Chapter 2: Heterogeneities in macroparasite infections: patterns and processes 1 K. Wilson, O.N. Bjørnstad, A.P. Dobson, S. Merler, G. Poglayen, S.E. Randolph, A.F. Read and A. Skorping. Animals vary markedly in the number of parasites they harbour - most have just a few, but some have many. In this chapter, we ask why there is so much variation between individuals, how do we quantify this variation and what are the consequences of these heterogeneities for the dynamics of the host- parasite interaction? 2.1 Background Exhaustive empirical surveys have shown that, almost without exception, macroparasites (parasitic helminths and arthropods) are aggregated across their host populations, with most individuals harbouring low numbers of parasites, but a few individuals playing host to many (Shaw and Dobson 1995). Heterogeneities such as these are generated by variation between individuals in their exposure to parasite infective stages and by differences in their susceptibility once an infectious agent has been encountered. Experimental studies have shown that the extent of spatial aggregation in the infective stage distribution is reflected in the level of parasite aggregation across hosts (Keymer and Anderson 1979). Moreover, in the absence of any heterogeneity in exposure, even small differences in susceptibility between hosts can rapidly produce non-random, aggregated distributions of parasites (Anderson and May 1978). What is unclear at present, is the relative significance of these different mechanisms, and the importance of interactions between mechanisms in accentuating individual differences in parasite loads. Mathematical models that examine these problems rapidly become intractable (Grenfell et al. 1995), while experimental studies and computer simulations also become rather complex. Some of the variation in parasite loads we observe is predictable. For example, in mammals and some other taxa, males tend to be more heavily infected than females, perhaps due to differences in immune function (Poulin 1996a, Schalk and Forbes 1997, McCurdy et al. 1998). Parasite loads tend to increase with age and may plateau in older animals, though if acquired immunity is important (or there is parasite-induced host mortality) then they may ultimately decline again, so reducing the degree of parasite aggregation. Genetic differences in susceptibility to infection may also be important, though their extent and direction are much more difficult to predict. Other factors that may contribute to the observed heterogeneities in worm burdens are the condition of the host (which may be a function of parasite load), host behaviour, parasite genetics and seasonality. Comparative studies of aggregation suggest that the infection process and the habitat of the host may make significant contributions to the between-species pattern of aggregation (Shaw and Dobson 1995, Shaw et al. 1998). Heterogeneities in parasite loads have many implications for epidemiological studies. One of the most important concerns the accurate determination of infection intensity – if there is a high degree of variability in the numbers of parasites per host, then a large number of hosts needs to be examined in order to obtain an accurate picture of parasite abundance in the host population. Parasite aggregation also presents some analytical problems as most standard methods of statistical analysis perform best when working with normal distributions – the skew in the parasite distribution means that either the 1 Pages 6-44 in P. J. Hudson, A. Rizzoli, B.T. Grenfell, H. Heesterbeek and A. P. Dobson, editors. The Ecology of Wildlife Diseases
-
Upload
truongthuan -
Category
Documents
-
view
216 -
download
0
Transcript of Chapter 2: Heterogeneities in macroparasite infections: patterns and processes · 2002-03-14 · 1...

1
Chapter 2: Heterogeneities in macroparasite infections: patterns and processes1
K. Wilson, O.N. Bjørnstad, A.P. Dobson, S. Merler, G. Poglayen, S.E. Randolph, A.F. Read and A. Skorping.
Animals vary markedly in the number of parasites they harbour - most have just a few, but some have many. In this chapter, we ask why there is so much variation between individuals, how do we quantify this variation and what are the consequences of these heterogeneities for the dynamics of the host-parasite interaction?
2.1 Background
Exhaustive empirical surveys have shown that, almost without exception, macroparasites (parasitic helminths and arthropods) are aggregated across their host populations, with most individuals harbouring low numbers of parasites, but a few individuals playing host to many (Shaw and Dobson 1995). Heterogeneities such as these are generated by variation between individuals in their exposure to parasite infective stages and by differences in their susceptibility once an infectious agent has been encountered. Experimental studies have shown that the extent of spatial aggregation in the infective stage distribution is reflected in the level of parasite aggregation across hosts (Keymer and Anderson 1979). Moreover, in the absence of any heterogeneity in exposure, even small differences in susceptibility between hosts can rapidly produce non-random, aggregated distributions of parasites (Anderson and May 1978). What is unclear at present, is the relative significance of these different mechanisms, and the importance of interactions between mechanisms in accentuating individual differences in parasite loads. Mathematical models that examine these problems rapidly become intractable (Grenfell et al. 1995), while experimental studies and computer simulations also become rather complex.
Some of the variation in parasite loads we observe is predictable. For example, in mammals and some other taxa, males tend to be more heavily infected than females, perhaps due to differences in immune function (Poulin 1996a, Schalk and Forbes 1997, McCurdy et al. 1998). Parasite loads tend to increase with age and may plateau in older animals, though if acquired immunity is important (or there is parasite-induced host mortality) then they may ultimately decline again, so reducing the degree of parasite aggregation. Genetic differences in susceptibility to infection may also be important, though their extent and direction are much more difficult to predict. Other factors that may contribute to the observed heterogeneities in worm burdens are the condition of the host (which may be a function of parasite load), host behaviour, parasite genetics and seasonality. Comparative studies of aggregation suggest that the infection process and the habitat of the host may make significant contributions to the between-species pattern of aggregation (Shaw and Dobson 1995, Shaw et al. 1998).
Heterogeneities in parasite loads have many implications for epidemiological studies. One of the most important concerns the accurate determination of infection intensity – if there is a high degree of variability in the numbers of parasites per host, then a large number of hosts needs to be examined in order to obtain an accurate picture of parasite abundance in the host population. Parasite aggregation also presents some analytical problems as most standard methods of statistical analysis perform best when working with normal distributions – the skew in the parasite distribution means that either the
1 Pages 6-44 in P. J. Hudson, A. Rizzoli, B.T. Grenfell, H. Heesterbeek and A. P. Dobson, editors. The Ecology of Wildlife Diseases

2
Figure 2.1. Observed parasite frequency distributions for four host-parasite interactions (after Shaw et al. 1998).In all cases, the bars represent the observed frequency distributions and the points are the fit of the negativebinomial distribution. (a) host = perch Perca fluviatilis, parasite = tapeworm Triaenophorus nodulosus; (b)reindeer Rangifer tarandus, warble fly Hypoderma tarandi; (c) common starling Sturnus vulgaris, nematodePorrocaecum ensicaudatum; (d) pond frog Rana nigromaculata, nematode Spiroxys japonica (For referencesources see Shaw et al. 1998).
parasite data have to be transformed prior to analysis, or special statistical methods, such as generalized linear modelling, must be employed (Wilson and Grenfell 1997).
Finally, parasite aggregation has important implications for the population and evolutionary dynamics of the parasite and its host (Anderson and May 1978) (May and Anderson 1978) (Poulin 1993a). In macroparasites, host mortality and morbidity tends to be dose-dependent and so has most effect on individuals in the so-called ‘tail’ of the parasite distribution. The proportion of hosts in this susceptible tail will be relatively larger when parasites are randomly distributed across hosts (and the variance of the distribution is low), than when the distribution is highly skewed (and the variance is high). As a consequence, parasites are likely to be relatively more important as both a selection pressure (Poulin 1993a) and a regulatory influence (Anderson and May 1978, May and Anderson 1978) in the former case than in the latter. Thus, a central theme of macroparasite studies over the years has been the development of a theoretical and empirical understanding of the stabilising role of aggregation in the population dynamics of parasitic helminths and their hosts (Anderson and May 1978, Anderson and May 1982b).
In this chapter we provide a review of recent developments in studies of parasite aggregation, and highlight gaps in our current knowledge. We focus on empirical studies that provide new insights and theoretical developments that may provide new techniques for assessing the relative role played by different forms of heterogeneities in different host-parasite systems. We also draw on some classic empirical studies, especially where more recent studies are lacking. We begin by defining what is meant by an aggregated distribution, how best this can be quantified, and the pitfalls associated with measuring parasitism rates in wild animal populations. The majority of the chapter, however, focuses on the key heterogeneities in the host, parasite and environment that promote heterogeneities in the distribution of parasites per host. We discuss the patterns that are observed, the mechanisms generating them and their implications for parasite epidemiology. Throughout we emphasize the gaps in our current knowledge and identify areas for future research.

3
2.2 An introduction to parasite aggregation
Parasites are invariably aggregated across the host population, with the majority of the parasite population concentrated into a minority of the host population (Fig. 2.1) (Shaw and Dobson 1995, Shaw et al. 1998). In human communities, for example, generally less than 20% of individuals harbour 80% of the helminth parasite population. Thus, a relatively small number of individuals in the ‘tail’ of the parasite distribution are responsible for most parasite transmission and play an important role in the persistence of the parasite (Anderson and May 1985) (Woolhouse et al. 1997).
In statistical terms, an aggregated distribution is one in which the variance/mean ratio of parasite numbers per host is significantly greater than one. There has been much debate about how best to quantify the degree of aggregation and a number of related indices have been adopted (see Box 2.1).
However, regardless of which index of aggregation is used, comparing indices between sub-classes of hosts is generally problematic because they tend to covary with both the mean number of parasites per host and with the number of hosts sampled (see Box 2. 2). Gregory and Woolhouse (1993) compared a number of these indices of aggregation and found that the corrected moment estimate of k (from the negative binomial distribution) varied least with mean parasite load and sample size, and this is now the index of aggregation most commonly used by epidemiologists. Not only are the vast majority of parasite datasets best described by the negative binomial distribution (Anderson and May 1978, May and Anderson 1978) (Shaw and Dobson 1995), but its exponent k (an inverse measure of aggregation) is used to capture parasite overdispersion in the basic Anderson and May models (see Chapter 3). Hence this becomes the most appropriate parameter for empirical estimation. Box 2.3 discusses the statistical mechanisms that might generate negative binomial parasite distributions.
Box 2.1. Measures of aggregation
If the parasite population was distributed randomly amongst hosts, the variance (s2) of the parasite distribution would be approximately equal to its mean (m), i.e. Random distribution: s2 = m (1)
For an aggregated distribution, the variance is greater than the mean, i.e.
Aggregated distribution: s2 > m (2)
Thus, we can quantify the degree of aggregation simply as the ratio of the variance to the mean:
Variance-to-mean ratio = s2/m (3)
You will notice that this ratio varies from zero (when parasites are uniformly distributed amongst hosts), through unity (for a truly random distribution of parasites), to a number equal to the total number of parasites (for a maximally aggregated distribution).
Deviation from a random distribution can be tested by multiplying the variance-to-mean ratio by the number of hosts sampled (n) minus 1. This ‘index of dispersion’ (ID) is then compared to the Chi-square distribution with n-1 degrees of freedom (see (Elliot 1977)):
Index of dispersion, ID = s2(n-1)/m (4)
A related index of aggregation is obtained by dividing the variance-to-mean ratio (or simply the standard deviation, s), by the sample mean. This is often referred to as the ‘standardized variance’ (SV):
Standardized variance, SV = s2/m2 = s/m (5)
The standardized variance is often expressed as a percentage, simply by multiplying by 100, in which case it is then referred to as the ‘coefficient of variation’ (CV)
Coefficient of variation, CV = s(100)/m (6)
A more general approach to the variance-mean relationship is given by an equation which has come to be known as ‘Taylor’s Power Law’ (Taylor and Taylor 1977):
Taylor’s Power Law: s2 = a + mb (7)
which can be re-arranged to:
log(s2) = log(a) + b.log(m) (8)
4
Here, aggregation is measured by the parameter b (parameter a depends mainly on the size of the sampling unit); b varies continuously from zero for a uniform distribution to infinity for a highly aggregated distribution (b = 1 for a random distribution). Taylor’s Power Law cannot be used to quantify the degree of aggregation present in a single sample. However, it is useful when a collection of parasite samples is available from a number of different locations, populations or species (Shaw and Dobson 1995). In this instance, log variance is plotted against log mean and the parameters a and b are estimated by the intercept (a) and the regression coefficient (b) of the regression line (see Fig. 2.2). A slope of unity (b = 1) implies a random or Poisson distribution of parasite counts. For most parasite datasets, the slope lies between 1 and 2 (average b = 1.55) (Shaw and Dobson 1995), consistent with a negative binomial distribution (see Box 2.3). The negative binomial distribution is defined as follows (Fisher 1941) (Bliss and Fisher 1953):
Negative binomial distribution: s2 = m + m2/k (9)
60 80 100 120 140
020
4060
8010
012
0
Poisson (k>20)
Parasite load
Fre
quen
cy
0 100 200 300 400
050
100
150
200
250
Negative binomial (k=5)
Parasite load
Fre
quen
cy
0 200 400 600 800
010
020
030
0
Negative binomial (k=1)
Parasite load
Fre
quen
cy
'random' 'aggregated' 'highly aggregated'
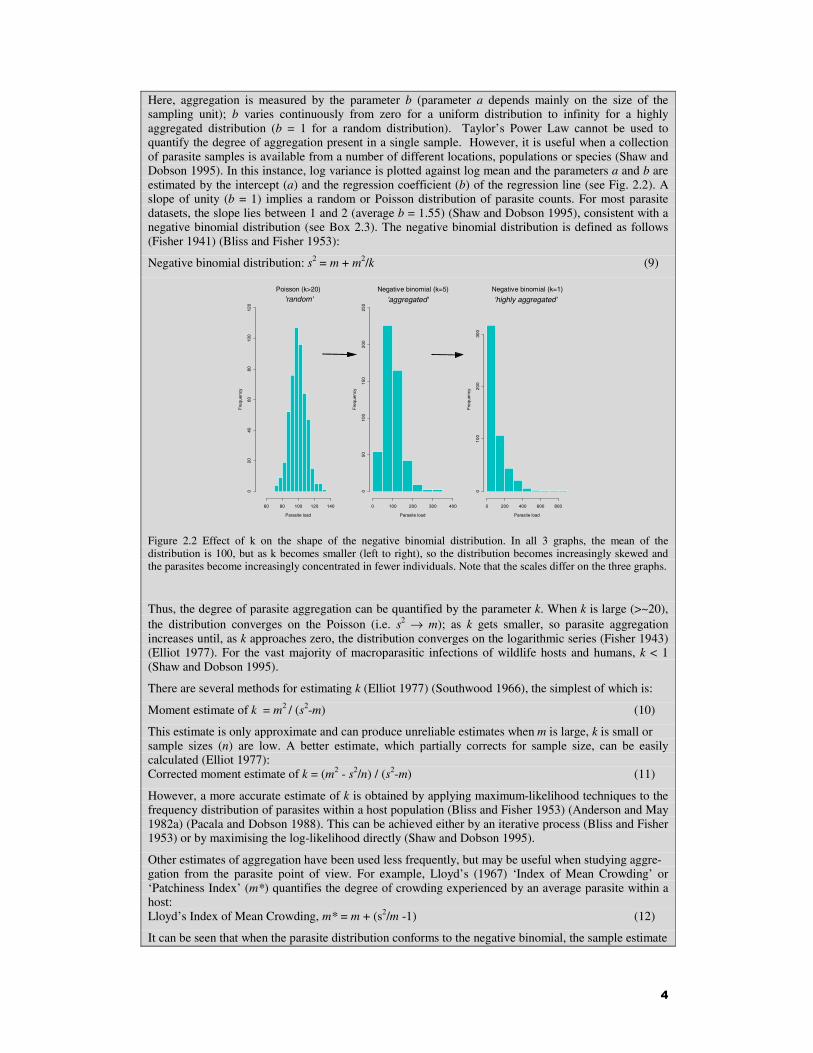
Figure 2.2 Effect of k on the shape of the negative binomial distribution. In all 3 graphs, the mean of the distribution is 100, but as k becomes smaller (left to right), so the distribution becomes increasingly skewed and the parasites become increasingly concentrated in fewer individuals. Note that the scales differ on the three graphs.
Thus, the degree of parasite aggregation can be quantified by the parameter k. When k is large (>~20), the distribution converges on the Poisson (i.e. s2 → m); as k gets smaller, so parasite aggregation increases until, as k approaches zero, the distribution converges on the logarithmic series (Fisher 1943) (Elliot 1977). For the vast majority of macroparasitic infections of wildlife hosts and humans, k < 1 (Shaw and Dobson 1995).
There are several methods for estimating k (Elliot 1977) (Southwood 1966), the simplest of which is:
Moment estimate of k = m2 / (s2-m) (10)
This estimate is only approximate and can produce unreliable estimates when m is large, k is small or sample sizes (n) are low. A better estimate, which partially corrects for sample size, can be easily calculated (Elliot 1977): Corrected moment estimate of k = (m2 - s2/n) / (s2-m) (11)
However, a more accurate estimate of k is obtained by applying maximum-likelihood techniques to the frequency distribution of parasites within a host population (Bliss and Fisher 1953) (Anderson and May 1982a) (Pacala and Dobson 1988). This can be achieved either by an iterative process (Bliss and Fisher 1953) or by maximising the log-likelihood directly (Shaw and Dobson 1995).
Other estimates of aggregation have been used less frequently, but may be useful when studying aggre- gation from the parasite point of view. For example, Lloyd’s (1967) ‘Index of Mean Crowding’ or ‘Patchiness Index’ (m*) quantifies the degree of crowding experienced by an average parasite within a host: Lloyd’s Index of Mean Crowding, m* = m + (s2/m -1) (12)
It can be seen that when the parasite distribution conforms to the negative binomial, the sample estimate

5
of mean crowding is equal to m(1 + 1/k) (Elliot 1977). A more recent index of parasite crowding is the ‘Index of Discrepancy’, D (Poulin 1993b), which quantifies aggregation as the discrepancy between the observed parasite distribution and the hypothetical distribution in which all hosts are used equally and all parasites are in sub-populations (infrapopulations) of the same size
n i
Poulin’s Index of Discrepancy, D = 1 - 2 Σ {Σxj} / xn(n+1) (13)
I=1 j=1
where x is the number of parasites in host j (after hosts are ranked from least to most heavily infected) and n is the number of hosts in the sample. The Index of Discrepancy measures the relative departure of the observed distribution from a uniform distribution. Thus, D may range from zero (no aggregation) to unity (when aggregation is at its theoretical limit and all parasites are in one host), and these constrained limits potentially make it easier to compare aggregation across datasets that vary in their prevalence or mean parasite load.
The two indexes of aggregation most commonly employed are s2/m (variance-to-mean ratio) and k (of the negative binomial). Unfortunately, the relationship between these two indices is not simple (see Fig. 2.3). Scott (1987a) has argued that the variance-to-mean ratio is a better measure of the degree of aggregation (i.e. the length of the ‘tail’), whereas k provides more information about the spread of data around the mean. Thus, she suggests that s2/m should be used when the number of uninfected hosts (i.e. the zero class) is large, and the latter when the zero class is small. Since k is not independent of the mean, she also suggests that s2/m be used in preference to k when comparing parasite distribution patterns across populations differing in their prevalence or abundance of infection, and when studying the dynamics of aggregation.
1 2 3 4 5
1/k
0.0
0.5
1.0
1.5
Log
(var
ianc
e-to
-mea
n ra
tio)
Prevalence = 50%
Prevalence = 30%
Prevalence = 20%
Prevalence = 40%
Figure 2.3. The relationship between variance-to-mean ratio and k of the negative binomial. Each line represents the function log10(s2/m) = (1/k)*log10(N/f0), where N is the total sample size and f0 is the number in the zero class of the distribution (Bliss and Fisher 1953) (Pennycuick 1971).
Box 2.2. Sample size biases: a simulation study
A simulation study by Gregory and Woolhouse (1993) illustrates the biases that may be introduced to sample estimates of average parasitism rates and indices of aggregation. When sample sizes are small, estimates of the arithmetic mean parasite load are consistently underestimated (Fig. 2.4a). The geometric mean burden (not shown) and the prevalence (Fig. 2.4b) are not biased in this way, but their accuracies are severely compromized (as measured by their 90% confidence intervals). All indices of aggregation, including the variance-to-mean ratio (Fig. 2.4c), moment estimate of k (not shown) and corrected moment estimate of k (Fig. 2.4d) tend to underestimate the degree of aggregation when too few hosts are sampled (see main text).

6
10 100 1000Sam ple s ize (log sca le)
15
30
Mea
n
True M ean
(a)
10 100 1000Sam ple s ize (log scale)
70
90
Pre
vale
nce
True Prevalence
(b)
10 100 1000Sam ple s ize (log sca le)
0
40
80
Var
ianc
e-M
ean
Rat
io
T rue Variance-M eanRatio
(c)
10 100 1000Sam ple s ize (log sca le)
0.5
1.0
Cor
rect
ed m
omen
t k
T rue k
(d)
Figure 2.4 Simulation results showing the effect of sample size on estimates of (a) mean parasite load, (b) prevalence, (c) variance-to-mean ratio and (d) corrected moment estimate of k of the negative binomial (Gregory and Woolhouse 1993). The solid circles represent the results of the simulations, the solid lines represent the 90% confidence intervals, and the dashed line represents the ‘true’ relationship between sample size and parameter values. For all of these figures, the population mean and k for the simulations were 20 and 0.4, respectively.
In field studies, sample sizes are frequently small, especially for individuals in the oldest age classes. As a consequence, sample estimates of aggregation may decrease with host age purely due to sample size biases (Fig. 2.5a). One might imagine that this problem could be resolved by combining parasite data from animals of similar age, so that each new age-class would have approximately equal numbers of hosts. However, this is not the case - combining age-classes in this way may result in artifactual increases in the estimate of parasite aggregation (Fig. 2.5b).
1 2 3 4 5 6 7 8
Age c lass
0.3
0.4
0.5
0.6
0.7
Mom
ent e
stim
ate
of k
T rue k
(e )
1 2-3 4-8
Age c lass
0.30
0.35
0.40
0.45
0.50
T rue k
(f)
Figure 2.5. Simulation results showing the influence of sample size on age-dependent estimates of parasite aggregation, as measured by the moment estimate of the negative binomial k (open symbols) and corrected moment estimate of k (closed symbols) (Gregory and Woolhouse 1993). In both simulations, the sample sizes for age classes 1-8 were: 100, 60, 40, 30, 25, 20, 15 and 10, respectively and the means were 5, 20, 40, 50, 50, 40, 20 and 5, respectively. In (a) data are grouped into age classes of equal period, but unequal sample sizes; in (b) data are grouped into age classes of unequal period, but equal sample sizes. The dashed line represents the ‘true’ relationship between age class and k.

7
Box 2.3 The negative binomial distribution as a birth-death process
A universal trait of populations is that temporal variability increases with mean abundance, µ. The way the variance rises with the mean can therefore provide insights into the nature of population growth. The way the variance depends on the mean is called the variance function in statistics (McCullagh 1983). In its simplest form, the demographic stochasticity that arises from birth and death processes is related to Poisson variability (through the sum of binomial events) (Bartlett 1956). In the simple density-independent death process, the number of individuals will be Poisson distributed, so that the variance, V(µ), is proportional to the mean: V(µ) = cµ. If we also include a birth-process, the number of individuals will follow a negative binomial distribution (e.g. Kendall et al. 1949). A negative binomial process has a variance function that rises more rapidly with the mean than the Poisson, but more slowly than proportional to the squared mean V(µ) = µ + µ2/k (Box 2.1) (Anderson and Gordon 1982). In contrast, stochastic population growth, in a fluctuating environment, leads to a Gamma (Dennis and Patil 1984) or log-normally (Engen and Lande 1996) distributed number of individuals. Here the variance is proportional to the squared mean. For more complicated patterns of population growth (e.g., with spatial or behavioural responses) the variance may rise even faster with the mean, an insight that led Taylor (1961) to propose his famous ‘Power Law’ (see Box 2.1).
The log-variance versus log-mean plot is the most well known diagnostic to elucidate this relationship (Taylor et al. 1983) (see Fig. 2.1). Poisson distributed numbers will have a slope of unity on such a plot, and lognormal or Gamma distributed numbers will have a slope of two. In the case of negative binomial data, the slope is predicted to be non-constant: close to unity for small means and close to two for large means. Whether a change in slope is visible on a log-log plot will depend on the range in means observed and whether the clumping parameter (k) depends on the mean. Unfortunately, since the axes are so compressed, non-linearities in log-log plots can often be difficult to discern (Tokeshi 1995).
A complementary tool to the log-variance vs log-mean plot is to estimate the variance function directly (McCullagh 1983, Ruppert et al. 1997). The error in the estimate of the variance is Chi-square distributed, so that a generalized linear model (see Box 2.5) with a log-link and a ‘quasi-Gamma’ error can be used to estimate the relationship. A non-parametric regression may be used to explore the variance-mean relationship without assuming a priori functional forms.
2.2.1 A comparative analysis of parasite aggregation
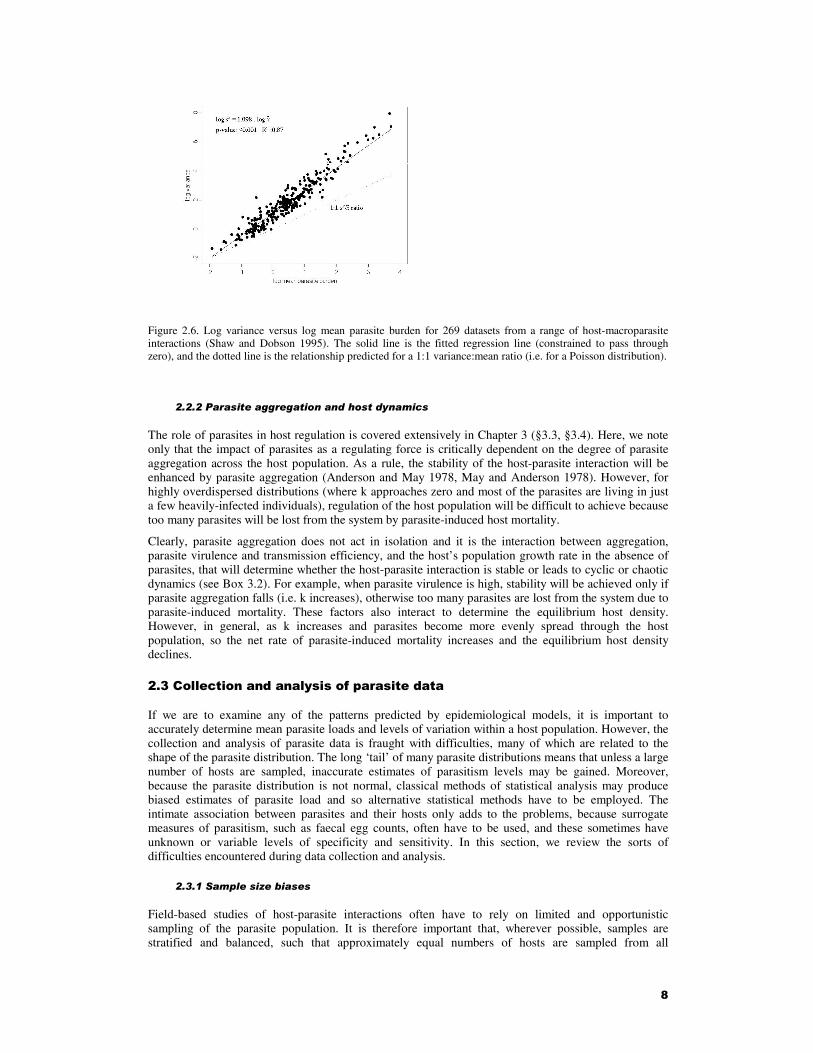
Shaw and Dobson (1995) examined previously published datasets from over 250 wildlife populations and attempted to determine which ecological and epidemiological processes generated variation across species in patterns of parasite aggregation and abundance. They found that there was a tight linear relationship between log-variance and log-mean (Fig. 2.6). Moreover the slope of the regression was significantly greater than 1 (b = 1.55 + 0.037 S.D., n = 269), indicating that the parasite distribution was overdispersed (this compares with b = 1.45 + 0.39 for free-living animal populations (Taylor and Taylor 1977). The small degree of spread in the parasite data (r2 = 0.87) is surprising and suggests that regardless of the infection process, mean parasite burden is the main determinant of the variance in parasite burden between hosts. Shaw and Dobson suggest that this is because of evolutionary constraints on the degree of aggregation. They argue that natural selection will lead to parasites with intermediate levels of pathogenicity and aggregation, because highly pathogenic parasites will generate high levels of parasite-induced mortality and hence lower parasite loads, a high degree of aggregation and reduced mating opportunities and hence reduced fecundity (in microparasites, this is equivalent to the trade-off between transmission and virulence (Shaw and Dobson 1995).
Shaw and Dobson (1995) found that 13% of the variation in log-variance was unexplained by log-mean burden. However, much of this could be explained by the nature of the infection process. For example, trichostrongylids and other parasites that enter their hosts passively tended to exhibit relatively higher levels of aggregation, whereas dipteran (e.g. Hypoderma) infections of large mammals tended to exhibit relatively lower levels of aggregation. Whilst these trends are interesting and can identify potentially important processes generating variation in parasite loads between hosts, they are purely correlational and it is clear that an experimental approach is required if we are to unravel the relative importance of potential mechanisms.
8
Figure 2.6. Log variance versus log mean parasite burden for 269 datasets from a range of host-macroparasite interactions (Shaw and Dobson 1995). The solid line is the fitted regression line (constrained to pass through zero), and the dotted line is the relationship predicted for a 1:1 variance:mean ratio (i.e. for a Poisson distribution).
2.2.2 Parasite aggregation and host dynamics
The role of parasites in host regulation is covered extensively in Chapter 3 (§3.3, §3.4). Here, we note only that the impact of parasites as a regulating force is critically dependent on the degree of parasite aggregation across the host population. As a rule, the stability of the host-parasite interaction will be enhanced by parasite aggregation (Anderson and May 1978, May and Anderson 1978). However, for highly overdispersed distributions (where k approaches zero and most of the parasites are living in just a few heavily-infected individuals), regulation of the host population will be difficult to achieve because too many parasites will be lost from the system by parasite-induced host mortality.
Clearly, parasite aggregation does not act in isolation and it is the interaction between aggregation, parasite virulence and transmission efficiency, and the host’s population growth rate in the absence of parasites, that will determine whether the host-parasite interaction is stable or leads to cyclic or chaotic dynamics (see Box 3.2). For example, when parasite virulence is high, stability will be achieved only if parasite aggregation falls (i.e. k increases), otherwise too many parasites are lost from the system due to parasite-induced mortality. These factors also interact to determine the equilibrium host density. However, in general, as k increases and parasites become more evenly spread through the host population, so the net rate of parasite-induced mortality increases and the equilibrium host density declines.
2.3 Collection and analysis of parasite data
If we are to examine any of the patterns predicted by epidemiological models, it is important to accurately determine mean parasite loads and levels of variation within a host population. However, the collection and analysis of parasite data is fraught with difficulties, many of which are related to the shape of the parasite distribution. The long ‘tail’ of many parasite distributions means that unless a large number of hosts are sampled, inaccurate estimates of parasitism levels may be gained. Moreover, because the parasite distribution is not normal, classical methods of statistical analysis may produce biased estimates of parasite load and so alternative statistical methods have to be employed. The intimate association between parasites and their hosts only adds to the problems, because surrogate measures of parasitism, such as faecal egg counts, often have to be used, and these sometimes have unknown or variable levels of specificity and sensitivity. In this section, we review the sorts of difficulties encountered during data collection and analysis.
2.3.1 Sample size biases
Field-based studies of host-parasite interactions often have to rely on limited and opportunistic sampling of the parasite population. It is therefore important that, wherever possible, samples are stratified and balanced, such that approximately equal numbers of hosts are sampled from all
9
appropriate demographic groups (age classes, sexes, reproductive states, etc.) and sampling units (years, population densities, locations, etc.). The reason for this is that when only a small number of hosts are sampled the probability of detecting the most heavily infected individuals in the population is low. Thus, when sample sizes are small there is a real danger of underestimating both the mean parasite burden and the degree of parasite aggregation (Box 2.2). However, this problem is minimized when aggregation is quantified using the corrected moment estimate of k (Box 2.1) or a maximum-likelihood estimate of k (Pacala and Dobson 1988, Gregory and Woolhouse 1993). The prevalence and geometric mean parasite loads are not biased by small sample sizes. However, the confidence intervals associated with both of these measures are inflated and so large sample sizes are always recommended. If the parasite population is highly over-dispersed, large sample sizes are even more important.
A consequence of the reliance of population estimates on sample size is that if sampling is not stratified correctly in relation to host demography, artefactual patterns in mean parasite burden and aggregation may result (Pacala and Dobson 1988, Gregory and Woolhouse 1993). For example, sample sizes often decline with host age due to mortality and so if sampling effort is not directed at obtaining equal numbers of hosts in all age classes, then it might appear that average parasite loads decline in old animals and that parasite aggregation declines with age, purely due to sampling biases (Box 2.2).
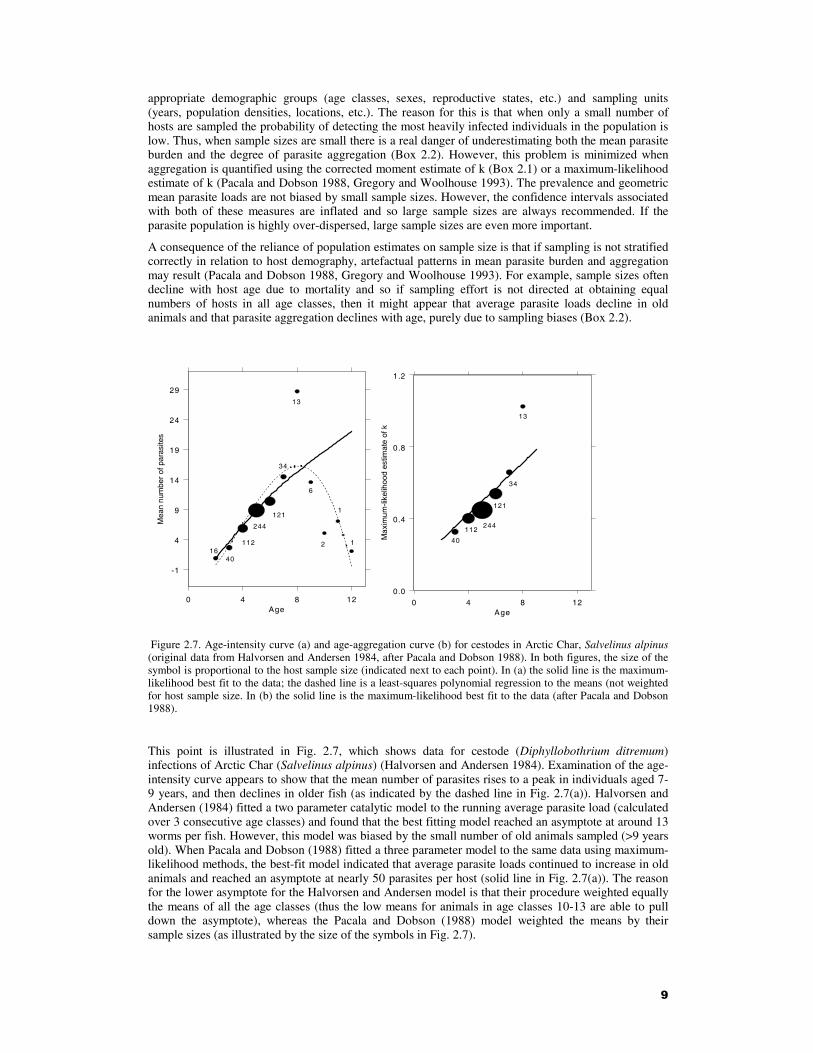
Figure 2.7. Age-intensity curve (a) and age-aggregation curve (b) for cestodes in Arctic Char, Salvelinus alpinus (original data from Halvorsen and Andersen 1984, after Pacala and Dobson 1988). In both figures, the size of the symbol is proportional to the host sample size (indicated next to each point). In (a) the solid line is the maximum-likelihood best fit to the data; the dashed line is a least-squares polynomial regression to the means (not weighted for host sample size. In (b) the solid line is the maximum-likelihood best fit to the data (after Pacala and Dobson 1988).
This point is illustrated in Fig. 2.7, which shows data for cestode (Diphyllobothrium ditremum) infections of Arctic Char (Salvelinus alpinus) (Halvorsen and Andersen 1984). Examination of the age-intensity curve appears to show that the mean number of parasites rises to a peak in individuals aged 7-9 years, and then declines in older fish (as indicated by the dashed line in Fig. 2.7(a)). Halvorsen and Andersen (1984) fitted a two parameter catalytic model to the running average parasite load (calculated over 3 consecutive age classes) and found that the best fitting model reached an asymptote at around 13 worms per fish. However, this model was biased by the small number of old animals sampled (>9 years old). When Pacala and Dobson (1988) fitted a three parameter model to the same data using maximum-likelihood methods, the best-fit model indicated that average parasite loads continued to increase in old animals and reached an asymptote at nearly 50 parasites per host (solid line in Fig. 2.7(a)). The reason for the lower asymptote for the Halvorsen and Andersen model is that their procedure weighted equally the means of all the age classes (thus the low means for animals in age classes 10-13 are able to pull down the asymptote), whereas the Pacala and Dobson (1988) model weighted the means by their sample sizes (as illustrated by the size of the symbols in Fig. 2.7).
0 4 8 12Age
-1
4
9
14
19
24
29
Mea
n nu
mbe
r of
par
asite
s
16112
121
34
13
6
2 1
0 4 8 12Age
0.0
0.4
0.8
1.2M
axim
um-li
kelih
ood
estim
ate
of k
40
112244
121
34
13
40
244
1
10
There is also a peak in the age profile of the variance-to-mean ratio, but this too appears to be due to sampling artefacts (Pacala and Dobson 1988). Robust evidence for a monotonic increase in aggregation with age was provided when the relationship between k (of the negative binomial) and age was modelled by a linear function fitted by maximum-likelihood (Fig. 2.7(b)).
2.3.2 Biased sampling
Much of the parasite data published in veterinary journals is collected opportunistically and comes from road kills, beach strandings, harvested animals or animals found dead (Keith et al. 1985). All of these data are potentially biased samples of the true host population since parasitized animals are more or less susceptible to the sampling process than non-parasitized (or lightly parasitized) individuals. This may simply be due to the fact that the selection process avoids or selects animals with overt signs of parasitism. For example, vets primarily treat sick and diseased animals and hunters may target either the healthiest or the weakest looking animals in the population, which are likely to have unrepresentative parasite loads. Alternatively, there is evidence that parasites may manipulate the behaviour of their hosts in such a way as to maximize their rates of transmission (Moore 1984) (Poulin 1994a, 2000). For parasites in intermediate hosts, such behavioural alterations (such as reduced speed of locomotion) (Zohar and Rau 1986) would result in the host becoming more susceptible to predation (by top predators, hunters or cars), whereas for parasites present in their definitive or only host, alterations (such as host castration) would tend to reduce predation risk at the expense of reproductive activities (Dobson 1988a).
Even apparently bias-free sampling methods may select an unrepresentative section of the host population. For example, rodents are known to vary in their degree of trap-shyness and trap-happiness (Courchamp et al. 2000) and it is likely that this will be influenced by their parasitological status. Similarly, parasitized birds or fish may be more or less likely to be caught in sampling nets. These sorts of biases are much less easy to quantify than those alluded to earlier, however it is obviously important to appreciate that such biases may exist when designing sampling programs.
Other potential biases are associated with the counting of parasites, where the smaller life stages may be easily missed (Smith and Grenfell 1994). These effects are compounded in studies that use indirect measures of parasitism (such as faecal eggs counts), where there is the additional uncertainly of the exact nature of their relationship with parasite load (see below).
2.3.3 Specificity and sensitivity of indirect measures of parasitism
For most wildlife diseases, we are not in a position to make an absolute count of the number of parasites harboured by a particular host or population of hosts. Thus, we usually have to resort to inferences from coprological or haematological samples. Such methods include faecal egg counts (density of parasite eggs in the faeces), seroepidemiological measures (ELISA-based methods that quantify the responses of various antibodies, such as IgA, to immunogenic parasite antigens) and coproantigen detection (ELISA-based methods that quantify the amount of non-immunogenic parasite excretory/secretory antigens voided in the host’s faeces) (Hyde 1990) (Johnson et al. 1996) (Malgor et al. 1997) (Nonaka et al. 1998). However, these estimates will often provide biased, or at least inaccurate, measures of parasitism. For example, faecal egg counts will be useless as a surrogate measure of worm burden if worm fecundity is subject to severe density dependent constraints. Similarly, the coproantigen detection methods will be useless if the assay fails to meet the required level of specificity. It is therefore important to determine the extent of any biases and misclassifications on a case by case basis before employing a particular technique on a large scale. Although most studies fail to do this, it is now clear that these may be substantial, particularly in coprological estimates of prevalence (Box 2.4).
Box 2.4 Sensitivity and specificity of indirect parasitological estimates
Two kinds of misclassification affect any indirect measure of parasitism: infected subjects appearing uninfected (false negatives) and uninfected individuals appearing infected (false positives). Lets define A = number of true positive, B = number of false positive, C = number of false negative, D = number of true negative so the total recorded infected is A+C and the total recorded uninfected is B+D and N=A+B+C+D is the whole population.
11
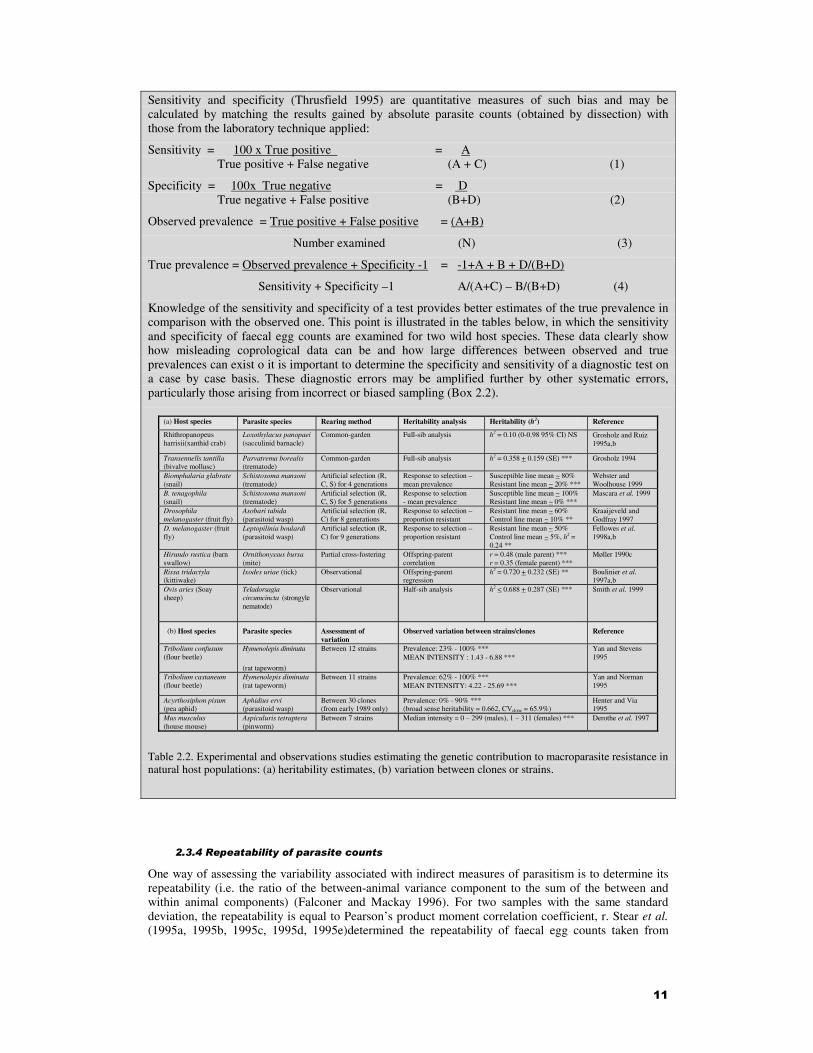
Sensitivity and specificity (Thrusfield 1995) are quantitative measures of such bias and may be calculated by matching the results gained by absolute parasite counts (obtained by dissection) with those from the laboratory technique applied:
Sensitivity = 100 x True positive = A True positive + False negative (A + C) (1)
Specificity = 100x True negative = D True negative + False positive (B+D) (2)
Observed prevalence = True positive + False positive = (A+B)
Number examined (N) (3)
True prevalence = Observed prevalence + Specificity -1 = -1+A + B + D/(B+D)
Sensitivity + Specificity –1 A/(A+C) – B/(B+D) (4)
Knowledge of the sensitivity and specificity of a test provides better estimates of the true prevalence in comparison with the observed one. This point is illustrated in the tables below, in which the sensitivity and specificity of faecal egg counts are examined for two wild host species. These data clearly show how misleading coprological data can be and how large differences between observed and true prevalences can exist o it is important to determine the specificity and sensitivity of a diagnostic test on a case by case basis. These diagnostic errors may be amplified further by other systematic errors, particularly those arising from incorrect or biased sampling (Box 2.2).
(a) Host species Parasite species Rearing method Heritability analysis Heritability (h2) Reference
Rhithropanopeus harrisii(xanthid crab)
Loxothylacus panopaei (sacculinid barnacle)
Common-garden Full-sib analysis h2 = 0.10 (0-0.98 95% CI) NS Grosholz and Ruiz 1995a,b
Transennells tantilla (bivalve mollusc)
Parvatrema borealis (trematode)
Common-garden Full-sib analysis h2 = 0.358 + 0.159 (SE) ***
Grosholz 1994
Biomphalaria glabrate (snail)
Schistosoma mansoni (trematode)
Artificial selection (R, C, S) for 4 generations
Response to selection – mean prevalence
Susceptible line mean ~ 80% Resistant line mean ~ 20% ***
Webster and Woolhouse 1999
B. tenagophila (snail)
Schistosoma mansoni (trematode)
Artificial selection (R, C, S) for 5 generations
Response to selection - mean prevalence
Susceptible line mean ~ 100% Resistant line mean ~ 0% ***
Mascara et al. 1999
Drosophila melanogaster (fruit fly)
Asobari tabida (parasitoid wasp)
Artificial selection (R, C) for 8 generations
Response to selection – proportion resistant
Resistant line mean ~ 60% Control line mean ~ 10% **
Kraaijeveld and Godfray 1997
D. melanogaster (fruit fly)
Leptopilinia boulardi (parasitoid wasp)
Artificial selection (R, C) for 9 generations
Response to selection – proportion resistant
Resistant line mean ~ 50% Control line mean ~ 5%, h2 = 0.24 **
Fellowes et al. 1998a,b
Hirundo rustica (barn swallow)
Ornithonyssus bursa (mite)
Partial cross-fostering Offspring-parent correlation
r = 0.48 (male parent) *** r = 0.35 (female parent) ***
Møller 1990c
Rissa tridactyla (kittiwake)
Ixodes uriae (tick) Observational Offspring-parent regression
h2 = 0.720 + 0.232 (SE) **
Boulinier et al. 1997a,b
Ovis aries (Soay sheep)
Teladorsagia circumcincta (strongyle nematode)
Observational Half-sib analysis h2 < 0.688 + 0.287 (SE) ***
Smith et al. 1999
(b) Host species Parasite species Assessment of variation
Observed variation between strains/clones Reference
Tribolium confusum (flour beetle)
Hymenolepis diminuta
(rat tapeworm)
Between 12 strains Prevalence: 23% - 100% *** MEAN INTENSITY : 1.43 - 6.88 ***
Yan and Stevens 1995
Tribolium castaneum (flour beetle)
Hymenolepis diminuta (rat tapeworm)
Between 11 strains Prevalence: 62% - 100% *** MEAN INTENSITY: 4.22 - 25.69 ***
Yan and Norman 1995
Acyrthosiphon pisum (pea aphid)
Aphidius ervi (parasitoid wasp)
Between 30 clones (from early 1989 only)
Prevalence: 0% - 90% *** (broad sense heritability = 0.662, CVclone = 65.9%)
Henter and Via 1995
Mus musculus (house mouse)
Aspiculuris tetraptera (pinworm)
Between 7 strains Median intensity = 0 – 299 (males), 1 – 311 (females) *** Derothe et al. 1997
Table 2.2. Experimental and observations studies estimating the genetic contribution to macroparasite resistance in natural host populations: (a) heritability estimates, (b) variation between clones or strains.
2.3.4 Repeatability of parasite counts
One way of assessing the variability associated with indirect measures of parasitism is to determine its repeatability (i.e. the ratio of the between-animal variance component to the sum of the between and within animal components) (Falconer and Mackay 1996). For two samples with the same standard deviation, the repeatability is equal to Pearson’s product moment correlation coefficient, r. Stear et al. (1995a, 1995b, 1995c, 1995d, 1995e)determined the repeatability of faecal egg counts taken from

12
domestic sheep infected with the nematode Teladorsagia circumcincta and found that the repeatability of duplicate egg counts was extremely high, 0.92 - in other words, 92% of the variation in egg counts could be explained by differences between individuals. This result indicates that the actual counting process was very accurate. However, the repeatability of samples collected 2-3 days apart was not as high, averaging around 0.75. This indicates that individuals vary in their faecal egg production from one day to the next and that multiple samples over several days may be required to accurately determine heterogeneities in parasite loads. Over a longer time scale, the repeatabilities continued to decline, which probably reflects variability in the worm burdens of the animals over time. Again, most studies of wildlife populations do not determine the repeatability of their parasitological measure (but see Gulland 1991b, Hudson and Dobson 1995). If this is low, then significant heterogeneities are likely to be obscured.
2.3.5 Statistical methods for quantifying parasite heterogeneities
As indicated earlier, parasite distributions are often empirically best described by the negative binomial. This can result in a problem for parasitologists wishing to describe their hard-earned data, because most classical statistical methods, such as linear regression and analysis of variance, are based on the assumption of a normal (or Gaussian) distribution. Traditionally, logarithmic transformation has been applied to such data, in an attempt to normalize the distribution. However, this transformation often fails, particularly when the distribution is highly aggregated or the mean parasite load is low (Fig. 2.8) (Wilson and Grenfell 1997).
Figure 2.8. Effect of log-transformation on the distribution of parasite data (Wilson and Grenfell 1997). The top row of figures shows the frequency histograms for typical parasite data (1000 random samples taken from a negative binomial distribution with population mean equal to 100 and population k equal to 1.0, 0.5, 0.1 and 0.05, left to right). The bottom row shows how these same data look after log10-transformation (after first adding 1 to prevent zeros). Although the transformed distributions look approximately normal for low levels of aggregation (k>0.5), Kolmogorov-Smirnov tests for goodness-of-fit to the normal distribution indicate that the transformation always fails to normalize the data (P<0.001).
So, which method should parasitologists and ecologists use to analyse their parasite data? As the study of wildlife diseases has become increasingly quantitative, and computers have become faster and more powerful, the number of statistical techniques available for analysing parasite data has grown, and new methods are being developed and refined all of the time. Two of the methods currently being used in the parasitology literature are generalized linear modelling and tree-based modelling (see Box 2.5).
0 2 0 0 4 0 0 6 0 0 8 0 0P a r a s ite lo a d
0
2 0 0
4 0 0
k = 1 . 0
0 2 0 0 4 0 0 6 0 0 8 0 0P a r a s ite lo a d
0
2 0 0
4 0 0
k = 0 . 5
0 2 0 0 4 0 0 6 0 0 8 0 0P a r a s it e lo a d
0
4 0 0
8 0 0
k = 0 .1
0 2 0 0 4 0 0 6 0 0 8 0 0P a r a s it e lo a d
0
4 0 0
8 0 0
k = 0 . 0 5
0 .0 1 .0 2 .0 3 .0 4 .0L o g 1 0 ( P a r a s it e lo a d + 1 )
0
1 5 0
3 0 0
k = 1 . 0
0 .0 1 .0 2 . 0 3 .0 4 . 0L o g 1 0 ( P a r a s i te lo a d + 1 )
0
1 0 0
2 0 0
k = 0 . 5
0 .0 1 .0 2 .0 3 . 0 4 .0L o g 1 0 ( P a r a s i te lo a d + 1 )
0
3 0 0
6 0 0
k = 0 .1
0 . 0 1 .0 2 .0 3 . 0 4 .0L o g 1 0 ( P a r a s i te lo a d + 1 )
0
3 0 0
6 0 0
k = 0 . 0 5

13
Box 2.5 - Generalized linear modeling and tree-based modeling
Generalized linear modeling: Generalized linear models, or GLMs, offer a powerful alternative to logarithmic transformation and conventional parametric methods (Aitkin et al. 1989) (Crawley 1993). GLMs are generalizations of classical linear models and allow the underlying statistical distribution of the data to be explicitly described. So, instead of assuming that the parasite data are normally distributed, they assume that they follow the Poisson or negative binomial distributions, as appropriate. As a result, the fit of a GLM is often better than the equivalent conventional linear models, even after the data have been log-transformed (Wilson et al. 1996, Wilson and Grenfell 1997). However, this will not always be the case, because negative binomial distributions do not necessarily ‘add up’ when combined (Grafen and Woolhouse 1993). In other words, if the distribution of parasites in each sub-class of host (age, sex, genotype etc) is correctly described by the negative binomial distribution, the overall (aggregated) distribution will be described by the negative binomial only if each sub-class has an identical mean (Dietz 1982) (Pacala and Dobson 1988). Thus, when there is a high degree of sub-structuring in the data and component distributions differ markedly in there degree of skew (as measured by k), the estimated value of k for the aggregated dataset will fit none of the component distributions accurately and can sometimes lead to a badly fitting model.
In addition, if the data are sub-structured and the component distributions have different means but the same k, then the estimate of this ‘common k’ is always larger than the k estimated by lumping all of the data together (Shaw and Dobson 1995), i.e. combining sub-sets of data tends to exaggerate the degree of parasite aggregation (Hudson and Dobson 1995). Thus, wherever possible, maximum-likelihood estimates of the ‘common k’ should be used to describe the degree of aggregation within a host-parasite system (Shaw and Dobson 1995).
Tree-based modelling: A graphical alternative to GLMs, which is only just beginning to be employed by parasitologists and ecologists (Shaw and Dobson 1995) (Merler et al. 1996), is the use of tree-based models (Breiman et al. 1984). These are models that allow the structure of the data to be studied, by defining nodes, which divide the data into successive clusters with similar characteristics. The hierarchical nature of tree-based models allows the automatic selection of the most important predictor variables and, because the method is appropriate for both continuous and categorical data, it is very flexible and can be used for both classification and regression problems. Compared to linear models, tree-based models have the advantage that they are easier to interpret when the predictors are a mixture of numeric variables and factors, they handle missing data better, and they are better able to capture non-additive behaviour and multiplicative interactions. However, assessing the relative fit of different tree-based models is sometimes difficult.
Bagging (Breiman 1996) is a procedure that allows the tree-based models to be improved in terms of generalization error, i.e. prediction using novel data (Merler et al. 1996). The bagging consists of generating a sequence of predictors, each of which is generated by producing multiple versions of the learning set by bootstrap resampling (Efron and Tibshirani 1986). The method then approximates the predictor by averaging over the bootstrapped data sets, so reducing the component of the generalization error due to the variability of the data relative to when a single predictor is used (Geman et al. 1992).
A case study of tree models with bagging. In this example, the bagging procedure is used to examine the factors important in generating heterogeneities in the number of Ascaridia compar worms found in rock partridges (Alectoris graeca saxitalis) in the Trentino region of northern Italy (see § 3.6 for further details of the system). The dependent variable used in this analysis was the number of adult worms per bird (mean parasite burden + SD = 2.66 + 6.77), which was found to conform to the negative binomial distribution (k = 0.16; χ2
5 = 4.25, P>0.5). Predictor variables tested for inclusion in the model included host data (such as sex, age and weight) and environmental data (such as mean rainfall) (Cattadori et al. 1999).
The bagging procedure indicated that the relative dryness or wetness of the habitat was the most important factor affecting the parasite distribution - in dry habitats; the mean parasite burden was higher (mean of logged data = 1.0) than in the wet (mean = 0.44). The model highlighted sex as the next most important factor affecting worm burden, with the mean parasite load being higher for females than males (means = 1.19 for females and 0.76 for males, in dry regions; c.f. Box 2.7). Finally, the young birds were more heavily infected than the adults, and in the wet regions adult males were completely parasite free. The figure shows a graphical tree representation of the bagging model.

14
Figure 2.9 A graphical tree representation of a bagging model for the analysis of parasite loads from Rock partridge in Trentino, Italy. The mean of the log-transformed distribution is indicated for each partition of the predictor variable space.
2.4 Observed heterogeneities in parasite loads
In this section, we assess variation in parasitism rates associated with heterogeneities in the host population (including host genetics, age, sex, behaviour and body condition), in the parasite population and in extrinsic factors. In each case, we aim to identify the general patterns observed, the mechanisms generating those patterns and their epidemiological consequences.
2.4.1 Host age
What are the observed age-infection patterns? Important epidemiological information, such as rates of parasite transmission and mortality, can often be obtained by analysing patterns of age-prevalence and age-intensity (Anderson and May 1991) (Hudson and Dobson 1995). In the simplest case (referred to as Type I by Hudson and Dobson 1995), in which there is no vertical transmission and no reproduction within the host, parasites are acquired from the environment over time and mean intensities increase with host age (Fig. 2.10). If the rates of parasite acquisition and parasite mortality are constant, then the average number of parasites per host will increase towards an asymptote determined by the balance between these two rates (Type II). A number of empirical studies have reported age-intensity curves which either show a continual increase in parasite load or a gradual levelling-off of parasite burden with age (Hudson and Dobson 1995). For other host-parasite interactions, the age-intensity curve is convex (Type III). In other words, rather than rising to an asymptote, parasite loads decline after an initial increase.
These different epidemiological patterns are highly specific to the host-parasite interaction under study, and may vary between populations. For example, Quinnell et al. (1992) studied infections of the nematode Heligmosomum polygyrus in the woodmouse Apodemus sylvaticus in an outdoor enclosure in Oxford, England. They observed that mean parasite intensity increased asymptotically with host age (Type II), whereas Gregory et al. (1992), studying a wild population of woodmice in Northern Ireland, found that mean intensity exhibited a convex (Type III) age-intensity profile. A similar difference was observed in red grouse infested with the tick Ixodes ricinus (Hudson 1992). On grouse moors where Louping ill virus (Box 7.5) was prevalent, the intensity of infection increased with chick age (up to 25 days), whereas on moors where Louping ill was absent, tick intensities peaked when the chicks were 8-14 days old and subsequently declined.
What are the mechanisms generating convexity in age-intensity curves? There are a number of mechanisms that might account for convex age-intensity curves. These include parasite-induced host mortality, acquired immunity, age-related changes in predisposition to infection (e.g. due to the development of resistance mechanisms that are unrelated to previous exposure to parasites), age-

15
dependent changes in exposure to parasites (e.g. due to behavioural shifts or seasonality), and age-related probabilities of accurately determining parasite loads (e.g. if older animals produce more faeces than younger ones then a decline in faecal egg counts with age could be due to an increasing dilution of parasite eggs).
0 2 4 6 8 10
Age (arbitrrary scale)
0.0
0.2
0.4
0.6
0.8
1.0
Type I
Par
asite
load
(ar
bitr
ary
scal
e)
Type II
Type III
Figure 2.10. Hypothetical age-intensity curves, illustrating three general patterns – Type I (dotted line), Type II (dashed line) and Type III (solid line).
Distinguishing between the different mechanisms causing convexity in age-intensity or age-prevalence curves can be difficult, particularly when reliable data on age, mortality rates and body weights are not available. This problem is exacerbated when parasite sampling is limited to a single time point (i.e. data come from a horizontal cross-sectional survey), because variation in exposure rate due to seasonal or yearly variation in the force of infection may distort the age-infection profile. Even when all of this information can be obtained and longitudinal surveys can be conducted, some of the potential mechanisms can be difficult to disentangle without experimental infections or the removal of parasites through treatment.
Is acquired immunity an important source of variation in wild host populations? Acquired immunity develops in response to accumulated experience of infection and acts to decrease parasite establishment, survival, reproduction and/or maturation. Although acquired immunity is believed to be an important factor causing convexity in the age-intensity curves for macroparasite infections of humans, domesticated ruminants and laboratory animals (Anderson and Crombie 1984) (Anderson and May 1985) (Crombie and Anderson 1985) (Lloyd and Soulsby 1987) (Dobson et al. 1990) (Anderson and May 1991), there have been few clear demonstrations of acquired immunity in wildlife populations (but see Quinnell et al. 1992). At present, it is unclear whether this is because protective immunity does not generally develop or if sampling methods are just too crude to detect it. Even for interactions where effective immune responses may be observed under controlled laboratory conditions, acquired immunity may be difficult to detect in the field and may have little epidemiological significance if most of the hosts die before its impact is felt.
Is acquired immunity important in wildlife populations and Can we learn anything from variation in age-infection profiles? In theory, the answer to both of these questions is yes. Theory suggests that if acquired immunity is important then it should result in a negative correlation between peak levels of infection and the age at which the peak occurs - a phenomenon known as the ‘peak shift’ (see Box 2.6 and Anderson and May 1985) (Woolhouse 1998). Peak shift has now been demonstrated in a number of helminth infections of humans and in laboratory studies, but convincing evidence is still lacking for natural wildlife infections, due largely to logistical and statistical problems (see Box 2.6). However, these difficulties should not put us off trying to determine whether predictable patterns of age-prevalence occur across wild host populations.

16
Box 2.6. Peak shift
Acquired immunity develops in response to the accumulated experience of parasite antigens. Thus, in populations where transmission rates are high, the level of parasitic infection will rise rapidly and this will be followed by a rapid increase in the level of acquired immunity. As a result, parasite loads will peak at an early age and subsequently decline at a fast rate due to protective responses. In contrast, in populations where parasite transmission rates are low, parasite loads (and acquired immunity) will increase at a slower rate and the age at peak infection will be later (Anderson and May 1985). This will result in a negative correlation between peak levels of infection and the age at which the peak occurs - a phenomenon known as the ‘peak shift’ (see Fig. 2.11a) (Anderson and May 1985) (Woolhouse 1998).
0 5 10 15 20A ge, a (years)
0 .0
0 .1
0 .2
0 .3
0 .4
Pre
vale
nce,
P(a
)
II
III
IV
V
(a)
10 11 12 13 14 15A ge at peak p reva lence (years )
0 .5
0 .6
0 .7
0 .8
0 .9
1 .0
Pea
k pr
eval
ence
(b )rs = -0 .44, P<0.01 (one-ta iled)
I
Figure 2.11 Predicted and observed relationship between the prevalence of parasite infection and age in populations subject to different transmission rates. (a) Predictions based on a two-stage catalytic model where the model is given by: P(a) = λ/(λ-ν).(exp(-νa) - exp(-λa)) where P(a) is the prevalence of infection at age a, λ is the rate of infection (which, in this instance, takes the values 0.4, 0.2, 0.1, 0.05 and 0.025 for solid curves I-V, respectively), and ν is the rate at which infected individuals recover and become immune (set to ν = 0.5 in this instance, meaning that protective immunity develops after a mean of two years). Peak prevalences for the different values of λ are indicated by the solid circles joined together by the broken curve, which illustrates the predicted ‘peak shift’ with age. (b) Observed relationship between peak prevalence of infection and age at which the peak occurs for Schistosoma haemotobium infections of children from 17 schools in the Zimbabwe highveld (Woolhouse 1991).
Peak shift has now been demonstrated in a number of helminth infections of humans (Fig. 2.11b) (Woolhouse 1991) (Fulford et al. 1992) (Mutapi et al. 1997), and in several experimental infections of laboratory mice (Crombie and Anderson 1985) (Berding et al. 1986). However, evidence for peak shift in natural wildlife infections is lacking (but see Muller-Graf et al. 1997). The main problem is often the logistical difficulties of collecting parasite data from a range of populations and accurately assessing the host age-structure. There may also be difficulties in statistically identifying the peak of such curves. Finally, even after patterns consistent with peak shift have been conclusively demonstrated, it may be difficult to exclude alternative interpretations, such as age-related differences in exposure to parasites or innate resistance (Gryseels 1994) (Woolhouse 1998).
2.4.2 Host sex
Is there a sex-bias in infection levels in wild animal populations? Epidemiologists have long recognized that males of vertebrate species, including humans, tend to exhibit higher rates of parasitism and disease than females (Alexander and Stimson 1988) (Bundy 1988) (Zuk 1990). Moreover, a number of meta-analyses have provided quantitative support for this assertion across a range of host and parasite taxa (see Box 2.7). Although these results appear reasonably robust, they are generated by data of highly variable quality, collected from a range of different sources. Therefore, if we are to understand the significance of such results, there is a pressing need for well-designed, well-controlled experiments that address the following questions. First, are the observed biases genuine or do they reflect sampling or other artefacts (see Box 2.3)? Second, do the patterns of bias vary across host and parasite taxa, as comparative studies suggest (Box 2.7)? Third, if such patterns exist are they due to

17
ecological differences between the sexes (e.g. in their behaviour, diet etc) or physiological differences (e.g. in the geometry of their immune system)? Finally, what are the epidemiological consequences of sex differences in parasitism rates?
What are the mechanisms generating sex-biases in parasitism rates? There are a number of biological mechanisms potentially capable of generating sex biases in parasitism rates (Zuk and McKean 1996). Often these causes are divided into ecological and physiological mechanisms. Ecological mechanisms include sex differences in behaviour, diet composition and body size. For example, the male-bias in parasitism by the monogenean Pseudodiplorchis americanus observed in spadefoot toads (Scaphiopus couchii) is almost certainly due to differences in the reproductive behaviour of males and females. Whilst males spend long periods of time immersed in ephemeral pools exposed to the infective stages of the parasite, females visit the infected areas only briefly in order to lay their eggs (Tinsley 1989). Sex differences in diet are also likely to account for sex-biases in helminth infections of the marten, Martes amricana (Poole et al. 1983), and in cestode infections of dace, Leuciscus leuciscus (Kennedy 1969).
Body size may also contribute to sex differences. In mammals, males are generally larger than females and there is good evidence that parasite load correlates with host size in a number of systems (Arneberg et al. 1998a), perhaps because large animals ingest more infective stages or offer them (or their vectors) larger targets. In birds of prey, females are often significantly larger than their mates and hence if this mechanism is important we might expect to find a reversal of the sex bias in parasitism. Significantly, a recent comparative analysis of blood parasitism rates in birds found no evidence for an effect of sexual size dimorphism on either the prevalence or intensity of infection (McCurdy et al. 1998).
Sex biases may also result from physiological differences between the sexes. For example, in vertebrates, there are often large sex differences in the levels of a number of steroid hormones, including testosterone, progesterone and oestrogens. All of these hormones are known to have direct or indirect effects on components of the immune system and/or on parasite growth and development (Grossman 1985) (Harder et al. 1992a) (Hillgarth and Wingfield 1997). Testosterone depresses both cell-mediated and humoral immune responses, and has been invoked by some authors as a mediator of trade-offs between the development of sexually-selected traits and susceptibility to parasitism in males (see Box 2.8). Oestrogens, on the other hand, are believed to enhance humoral immunity while inhibiting cell-mediated responses. The production of stress hormones (e.g. corticosteroids), and the interaction between these hormones and the immune response, may also differ between the sexes (Klein et al. 1997, Klein 2000).
Box 2. 7 Sex-biases in parasitism rates: observed patterns
A number of recent comparative analyses have examined patterns of sex-bias in parasitism rates in wild host (and laboratory) populations (Poulin 1996a) (Schalk and Forbes 1997) (McCurdy et al. 1998). In his analysis of 85 studies of free-ranging host populations published over the last 30 years Poulin (1996a) found that male mammals and birds had significantly higher parasite prevalences than females and in mammals this relationship was true for parasite intensity also. However, there were no such relationships in other host taxa, including fish, amphibians and reptiles. When these data were further divided by parasite taxon (see figure below), male-biases were small, but highly significant for nematodes infections of birds (prevalence only) and mammals (prevalence and intensity), but there were no robust trends for the other parasite types. In fact, the intensity of cestode infections was higher in female birds than in males (though sample sizes were small).
Schalk and Forbes (1997) examined the sex differential in parasitism rates of mammals for a different dataset, in which both field and laboratory studies were included. They observed a similar bias towards males and, when they split their dataset by parasite taxon, found significant male-biases for arthropod and protozoan parasite loads but not for helminth burdens. Interestingly, they also found that sex-biases observed in experimental studies (in which hosts were artificially infected) were much stronger than those detected in field studies (in which hosts were naturally infected), suggesting that the main differences may lie in the host immune responses rather than the infection processes (Box 2.8). Thus, quantitative support of sex biases in parasitism rates remains inconclusive and there is a pressing need for more experimental evidence.

18
AcanDig
MonCest
NemAcan
DigCest
NemAcan
DigCest
Nem
Host and parasite taxa
-50
-40
-30
-20
-10
0
10
Mea
n di
ffere
nce
+/-
SE
(a) Prevalence
*
**
Fish Birds Mammals
Male biased
Female biased
11 4 12 15 8 38 15 30 14 20 74
AcanDig
MonCest
NemAcan
DigCest
NemAcan
DigCest
Nem
Host and parasite taxa
-1.0
-0.5
0.0
0.5
Mea
n di
ffere
nce
+/-
SE
(b) Intensity
*
*
Fish Birds Mammals
Male biased
12 8 2 6 4 32 6 21 3 56
Female biased
23
444
2 4
Figure 2.12 Mean difference in (a) prevalence and (b) intensity of parasitic infection between the sexes for three host taxa (Poulin 1996a). The solid symbols represent the mean difference (females minus males, weighted by a correction factor for sample size) and the lines are approximate standard errors. The asterisks indicate significant sex-biases. The numbers at the bottom of the figure are the number of comparisons made. Abbreviations: Acan = acanthocephalans, Dig = digeneans, Mon = monogeneans, Cest = cestodes, Nem = nematodes.
All Helm Arth Prot All Expt All RodentHelm Arth All Field
Data set
0.0
0.5
1.0
1.5
2.0
Effect size
Full Data set Parsed Data set
145
113
26
6
48
7
4112
13
24 14
9
All Expt Field Juvs
*
All
* * * * * * * * *
Figure 2.13 Mean effect sizes and 95% confidence intervals for sex-biases in parasitism rates in a selection of mammals (Schalk and Forbes 1997). The solid symbols represent the mean effect size (a scale-free estimate of the average difference between the two sexes) and the lines represent the 95% confidence intervals. Significant male biases are present when the lower confidence interval fails to intercept zero and are indicated by the asterisks. The numbers above the bars are the sample sizes. Abbreviations: Helm = helminths, Arth = arthropods, Prot = protozoa, Expt = experimental studies, Field = field studies, Juvs = juveniles (all other data are for adults).
19
Box 2.8 Immunocompetence handicap hypothesis
Immunocompetence is a measure of the ability of an organism to minimize the fitness costs of an infection via any means, after controlling for previous exposure to appropriate antigens (Owens and Wilson 1999) (see § 9.3.2).
In 1982, Bill Hamilton and Marlene Zuk proposed a role for parasitism in the evolution of sexually selected traits, such as colourful plumage and elaborate courtship displays (Hamilton and Zuk 1982). They suggested that these male traits had evolved to signal to females the bearer’s good health and ability to resist the detrimental effects of parasitism. As a result, a female choosing a male with bright plumage and an elaborate courtship display would tend to acquire ‘good genes’ for parasite resistance for her future offspring. Since its formulation, numerous field workers have tested this controversial hypothesis with mixed success (Read 1990) (Clayton 1991) (John 1997) (Hamilton and Poulin 1997) although some authors believe the hypothesis may not be testable (Read 1990).
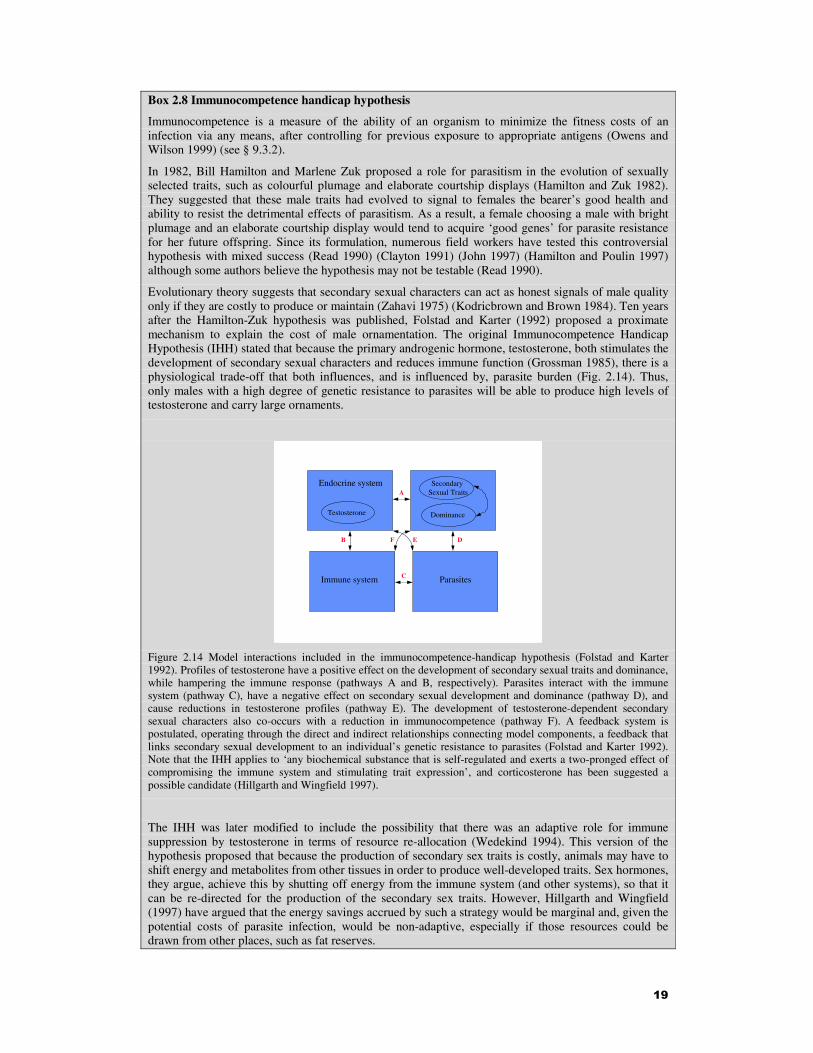
Evolutionary theory suggests that secondary sexual characters can act as honest signals of male quality only if they are costly to produce or maintain (Zahavi 1975) (Kodricbrown and Brown 1984). Ten years after the Hamilton-Zuk hypothesis was published, Folstad and Karter (1992) proposed a proximate mechanism to explain the cost of male ornamentation. The original Immunocompetence Handicap Hypothesis (IHH) stated that because the primary androgenic hormone, testosterone, both stimulates the development of secondary sexual characters and reduces immune function (Grossman 1985), there is a physiological trade-off that both influences, and is influenced by, parasite burden (Fig. 2.14). Thus, only males with a high degree of genetic resistance to parasites will be able to produce high levels of testosterone and carry large ornaments.
Endocrine system
Immune system Parasites
Testosterone
Secondary Sexual Traits
Dominance
B
A
F E D
C
Figure 2.14 Model interactions included in the immunocompetence-handicap hypothesis (Folstad and Karter 1992). Profiles of testosterone have a positive effect on the development of secondary sexual traits and dominance, while hampering the immune response (pathways A and B, respectively). Parasites interact with the immune system (pathway C), have a negative effect on secondary sexual development and dominance (pathway D), and cause reductions in testosterone profiles (pathway E). The development of testosterone-dependent secondary sexual characters also co-occurs with a reduction in immunocompetence (pathway F). A feedback system is postulated, operating through the direct and indirect relationships connecting model components, a feedback that links secondary sexual development to an individual’s genetic resistance to parasites (Folstad and Karter 1992). Note that the IHH applies to ‘any biochemical substance that is self-regulated and exerts a two-pronged effect of compromising the immune system and stimulating trait expression’, and corticosterone has been suggested a possible candidate (Hillgarth and Wingfield 1997).
The IHH was later modified to include the possibility that there was an adaptive role for immune suppression by testosterone in terms of resource re-allocation (Wedekind 1994). This version of the hypothesis proposed that because the production of secondary sex traits is costly, animals may have to shift energy and metabolites from other tissues in order to produce well-developed traits. Sex hormones, they argue, achieve this by shutting off energy from the immune system (and other systems), so that it can be re-directed for the production of the secondary sex traits. However, Hillgarth and Wingfield (1997) have argued that the energy savings accrued by such a strategy would be marginal and, given the potential costs of parasite infection, would be non-adaptive, especially if those resources could be drawn from other places, such as fat reserves.

20
A number of tests of the IHH have now been published, though most of these are purely correlative and so are potentially confounded (Hillgarth and Wingfield 1997). Some studies have manipulated testosterone levels and examined the consequences for parasitism and immune function (Saino et al. 1995) (Hasselquist et al. 1999). However, there have been very few studies that have examined the possibility that there is a trade-off between sexual ornamentation and immunocompetence. One example is a recent study by Verhulst et al. (1999), who examined the evidence for a trade-off in selected lines of domestic fowl (Gallus domesticus). It is well established that comb size is important in both inter- and intra-sexual selection in chickens and its expression is testosterone-dependent. So, Verhulst and colleagues examined how comb size varied in males after 15 generations of divergent selection acting on primary antibody response to immunization with sheep red blood cells. There was a strong response to selection, with antibody titres varying significantly between all three selected lines (Fig. 2.15(a) below). This was associated with a similar difference between the selected lines in their responsiveness to a variety of other antigens, including Escherichia coli, Newcastle Disease Virus, Bronchitis Virus and Bursal Disease Virus, as well as with mortality following infection with Marek’s Disease (suggesting that selection was operating on a significant component of the bird’s humoural immune system). As predicted by the IHH, selection for enhanced immunocompetence, led to a reduction in both the degree of sexual ornamentation (comb size, Fig. 2.15(b)) and testosterone production (Fig. 2.15(c)). In other words, there appears to be genetic trade-offs between immune function and sexual ornamentation and between immune function and testosterone production.
Although consistent with the IHH, even this study has its problems. For example, recent experimental evidence has called into question the immunosuppressive properties of testosterone in birds (Hasselquist et al. 1999). Together with the fact that there is only one replicate of each selected line, this means that conclusions reached must remain tentative until further studies are conducted.
L C H
Selection L ine
0
4
8
12
16
Log
(ant
ibod
y tit
re)
+/-
SE
L C H
S election L ine
10
14
18
22
Com
b si
ze (
cm2)
+/-
SE
(a)
L C H
Selection L ine
0
1
2
3
4
Tes
tost
eron
e tit
re (
ng/m
l) +
/- S
E
(b) (c)
Figure 2.15 Response to selection in chicken lines divergently selected on response to sheep erythrocytes (after Verhulst et al. 1999). (a) log2 antibody titre to the challenge of sheep red blood cells, (b) comb size (cm2) and (c) testosterone titre (ng/ml). In all figures, L = low line, C = control line and H = high line.
In addition, there is evidence that the energetic costs of pregnancy and maternal care (Festa-Bianchet 1989a), plus the immunosuppressive effects of some hormones produced during parturition and lactation, may increase the susceptibility of females to parasites at some times of year (Dobson and Meagher 1996). This may reverse any male bias observed outside the breeding season. Interestingly, a recent comparative study found that infections of Haemoproteus (a protozoan) were more common in breeding female birds than breeding males (McCurdy et al. 1998), even after controlling for phylogenetic effects.
Even if sex biases exist, and are relevant, determining the relative importance of the different mechanisms capable of generating them may prove extremely difficult, due to the fact that many of the ecological and physiological factors covary. Disentangling the relative importance of these factors will be possible only through careful experimentation in which each of the potential mechanisms is manipulated and/or controlled in turn. For example, useful insights may be obtained by examining sex differences in invertebrates, which do not produce sex steroids yet may exhibit male biases in susceptibility to parasitism (Wedekind and Jakobsen 1998). Valuable information may gleaned from comparative analyses involving species or populations which buck the general trends (Clutton-Brock et al. 1991). For example, it would be interesting to compare the patterns observed in related polyandrous

21
and polygynous species that occupy similar habitats (e.g. a comparison of phalarope and sandpiper species in high latitude habitats). Although such comparisons have yet to be made, recent studies with Peromyscus mice and Microtus voles indicate that the situation may be far more complicated than had previously been envisaged (Box 2.9).
What are epidemiological consequences of sex-biased parasitism? The sex biases detected in comparative analyses are usually rather small (<5%) and it has been suggested that even if they do exist they will generally have little impact on host evolution or parasite epidemiology. However, Poulin (1996a, 1996b) has argued that an increase of even a few parasites could be biologically meaningful. The epidemiological implications of sex-biased parasitism has rarely been discussed in the literature (but see Brabin 1992a, 1992b, 1992c). If increased susceptibility to parasites during pregnancy results in parasite-induced reductions in fecundity relative to impact on survival, then this may destabilize the host-parasite interaction (see Chapter 3). The increased parasitism of males may, in part, explain the widespread observation of male-biased mortality, particularly in polygynous species of mammals and birds (Promislow 1992, Promislow et al. 1992) (see Box 2.11). Parasite-induced male-biased mortality would tend to stabilize the host-parasite interaction, except in species where males provide significant parental care or where males feed females during the breeding season. In this instance, parasite-induced male mortality or morbidity may be destabilising if it results in reduced offspring production.
Klein and Nelson (Klein and Nelson 1997) examined sex-differences in cell-mediated immunity in two species of Peromyscus mice. Contrary to expectation, they found no sex difference in cell-based immunity in the polygamous species (P. maniculatus), but they did in the monogamous species (P. californicus). This was despite the fact that the polygamous species had higher levels of testosterone, which is known to be immunosuppressive in mammals. These results are contrary to predictions based on the immunocompetence handicap hypothesis (Box 2.8). Subsequent studies on Microtus voles produced equally equivocal results and highlighted the importance of controlling for social factors when examining sex differences in immunity (Klein and Nelson 1997, 1998, 1999). We are clearly a long way from determining the mechanistic basis for sex biases in parasitism.
Box 2.9 Sex differences in immune function
Any number of different mechanisms could produce sex biases in parasitism rates. Recent attention has focussed on trying to determine whether these biases could be generated by sex differences in immune function. Measuring ‘immunocompetence’ (Box 2.8) is fraught with difficulties and a range of different measures have been used by workers in the field (Norris and Evans 2000). In a comparative analysis, utilising information from more than one hundred species of birds, Møller et al. (1998a, 1998b, 1998c, 1998d) assayed immune function by measuring the relative size of the Bursa Fabricius (which produces antibodies in juvenile birds) and the spleen (which produces lymphocytes in juveniles and adults). They predicted that if sex biases in parasitism rates were due to sex differences in immune defence, then one would observe that the more susceptible sex (i.e. males) would have smaller immune defence organs. As predicted, they found that whilst there was no sex difference in the size of the bursa, males had significantly smaller spleens than females (Fig. 2.16(a)). Moreover, this sex difference was more pronounced in adults than in juveniles (35% difference in adults, 7% difference in juveniles), which is consistent with predictions based on sexual selection theory (Fig. 2.16(b)). However, there are a number of difficulties with this study. For example, it is not clear whether there is a simple relationship between organ size and immune function, or even between immune function and disease susceptibility. Also, the health status of these birds was unknown, so it is possible that in this cross-section of birds, males had smaller spleens simply because they were healthier than females. As with many studies examining immune function in the field, the results are potentially confounded by the animals’ previous exposure to pathogens and their current infection status (Owens and Wilson 1999).
This issue has been examined in captive reared birds where the immune function, as measured by the number of circulating leucocytes per unit volume of blood were compared (Bennett et al. unpublished). As predicted, they found that in healthy animals, males had significantly lower numbers of heterophils, lymphocytes, monocytes, eosinophils and basophils than females, and in some species females had more than twice as many circulating lymphocytes per unit volume as males (though the average difference was 5%). Thus, the higher parasitism rates generally found in males may be due to their lower concentrations of blood cells. However, Bennett et al. (unpublished) found that this trend was reversed in sick animals, with males producing significantly higher levels of all five types of leucocytes

22
-1 .0 0 .0 1 .0R e s id u a l m a le -fe m a le s p le e n m a s s (g )
0
1 0
2 0
3 0
Fre
quen
cy
m e a n
-0 .0 9 4 g
(a )
Y o un g m a le s A d u lt m a le s Y o u ng fe m a le sA d u lt fem a les
A g e -se x ca te g o ry
0 .0
0 .1
0 .2
0 .3
Spl
een
mas
s (g
) +
/- S
E
* **
* * *n s
n s
(b )
Figure 2.16. Sex differences in spleen size in 125 species of birds (Møller et al. 1998a). (a) Frequency distribution of sex differences in mass of spleen (after accounting for body mass differences), mean difference indicated by the arrow, is significantly different from zero (P<0.001, n = 125). (b) Age-dependent spleen mass of male and female birds; values are means + standard error for 25 species; *** P<0.001, ns not significant.
(by between 13% and 34%, depending on cell type). If robust, this result refutes the idea that males have lower blood cell counts simply because they are ‘unable’ to mount an immune response, and suggests that there may be a cost to healthy animals of maintaining high levels of circulating leucocytes. Moreover, that this cost is relatively higher for males than females. Again, these results are undermined by a lack of knowledge of the animals’ previous infection history.
2.4.3 Host body condition
Host responses to parasites are of two general kinds, those that are directed against specific parasites, and more general ones affecting a number of different parasite species. We know very little about the relative importance of these two types of responses. What we do know is that hosts vary in a number of different characters (e.g. age, sex, reproductive status and intensities of a number of various parasite species) and that this variation often affects host body condition. Non-specific host responses, such as fever or production of macrophages, are likely to be costly, but the cost will vary inversely with host condition. Body condition is also likely to affect the hosts’ ability to compensate for damage inflicted by parasites, such as repairing tissues or replacing critical nutrients. Hosts in poor condition are therefore in a difficult bind; they have few resources available to spend on defence, but they cannot afford not to invest in them because parasites may induce more severe disease.
This situation should affect the distribution of the whole range of parasites within a host population. If differences in host body condition are of importance in generating observed infection patterns in wildlife, we may therefore expect intensities of different parasite species to covary. One way this can be studied is to sample a host population within a limited period of time and at a single location, count parasite numbers, and rank the host individuals with respect to intensities of different parasites. If general host responses matter, we would expect a significant agreement in the ranking of host individuals by different parasites. Indeed, this is what is observed in willow ptarmigan (Holmstad and Skorping 1998) and similar patterns have been observed in domestic (Stear et al. 1998) and Soay sheep (Wilson 1994). However, a lack of covariation has been observed in some other studies (Haukisalmi and Henttonen 1993) (Nilssen et al. 1998). Caution needs to be exercised in interpreting these observations, however, because they could also be generated by extrinsic factors, such as covariation in exposure levels. For example, wet or humid areas might be good for both the free-living infective stages of nematode parasites and the juvenile stages of insect vectors of blood parasites, leading to some individuals having high levels of both gastrointestinal nematodes and blood microparasites, independent of heterogeneities in body condition.
Hamilton and Zuk (1982) reasoned that if parasites and pathogens affect host body condition, then females could use a male’s condition as a cue to his ability to resist disease-causing agents. They further postulated that because the parasites would be under selection to avoid host defences, a co-evolutionary arms race would develop between the parasite and its host, and hence host body condition might reflect
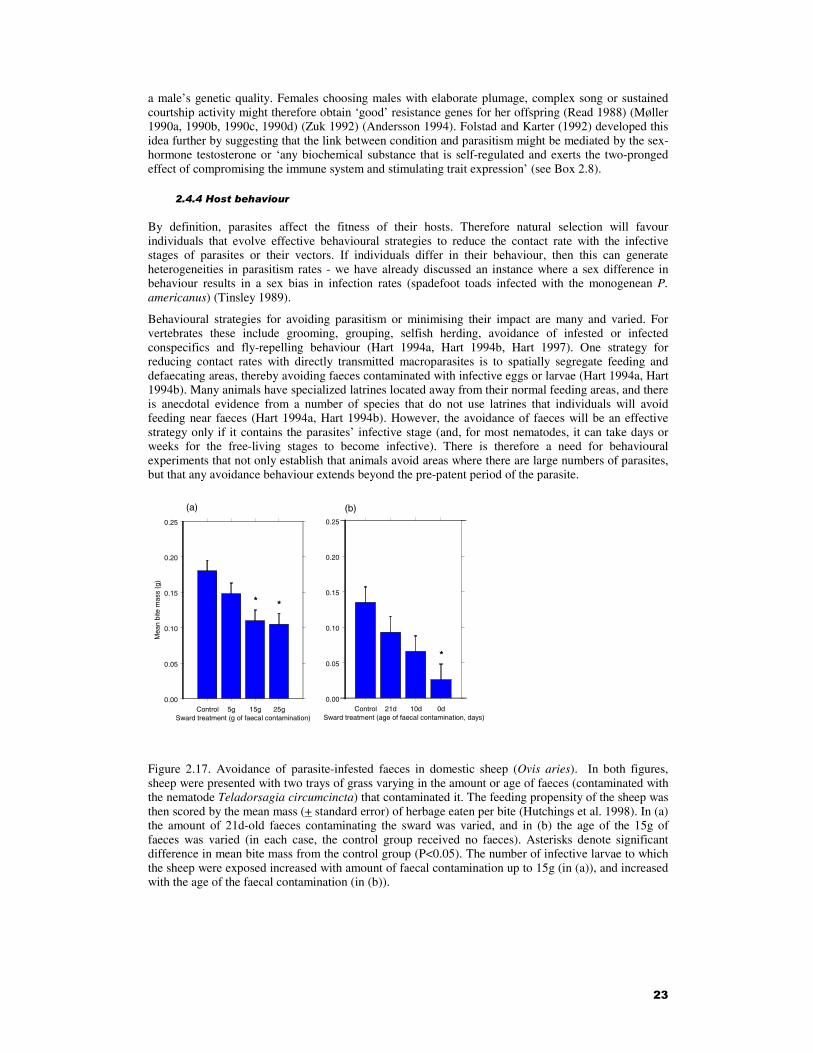
23
a male’s genetic quality. Females choosing males with elaborate plumage, complex song or sustained courtship activity might therefore obtain ‘good’ resistance genes for her offspring (Read 1988) (Møller 1990a, 1990b, 1990c, 1990d) (Zuk 1992) (Andersson 1994). Folstad and Karter (1992) developed this idea further by suggesting that the link between condition and parasitism might be mediated by the sex-hormone testosterone or ‘any biochemical substance that is self-regulated and exerts the two-pronged effect of compromising the immune system and stimulating trait expression’ (see Box 2.8).
2.4.4 Host behaviour
By definition, parasites affect the fitness of their hosts. Therefore natural selection will favour individuals that evolve effective behavioural strategies to reduce the contact rate with the infective stages of parasites or their vectors. If individuals differ in their behaviour, then this can generate heterogeneities in parasitism rates - we have already discussed an instance where a sex difference in behaviour results in a sex bias in infection rates (spadefoot toads infected with the monogenean P. americanus) (Tinsley 1989).
Behavioural strategies for avoiding parasitism or minimising their impact are many and varied. For vertebrates these include grooming, grouping, selfish herding, avoidance of infested or infected conspecifics and fly-repelling behaviour (Hart 1994a, Hart 1994b, Hart 1997). One strategy for reducing contact rates with directly transmitted macroparasites is to spatially segregate feeding and defaecating areas, thereby avoiding faeces contaminated with infective eggs or larvae (Hart 1994a, Hart 1994b). Many animals have specialized latrines located away from their normal feeding areas, and there is anecdotal evidence from a number of species that do not use latrines that individuals will avoid feeding near faeces (Hart 1994a, Hart 1994b). However, the avoidance of faeces will be an effective strategy only if it contains the parasites’ infective stage (and, for most nematodes, it can take days or weeks for the free-living stages to become infective). There is therefore a need for behavioural experiments that not only establish that animals avoid areas where there are large numbers of parasites, but that any avoidance behaviour extends beyond the pre-patent period of the parasite.
Control 5g 15g 25gSward treatment (g of faecal contamination)
0.00
0.05
0.10
0.15
0.20
0.25
Mea
n bi
te m
ass
(g)
*
(a)
Control 21d 10d 0dSward treatment (age of faecal contamination, days)
0.00
0.05
0.10
0.15
0.20
0.25
*
(b)
*
Figure 2.17. Avoidance of parasite-infested faeces in domestic sheep (Ovis aries). In both figures, sheep were presented with two trays of grass varying in the amount or age of faeces (contaminated with the nematode Teladorsagia circumcincta) that contaminated it. The feeding propensity of the sheep was then scored by the mean mass (+ standard error) of herbage eaten per bite (Hutchings et al. 1998). In (a) the amount of 21d-old faeces contaminating the sward was varied, and in (b) the age of the 15g of faeces was varied (in each case, the control group received no faeces). Asterisks denote significant difference in mean bite mass from the control group (P<0.05). The number of infective larvae to which the sheep were exposed increased with amount of faecal contamination up to 15g (in (a)), and increased with the age of the faecal contamination (in (b)).

24
0 1 2 3 4 5P a r a s i t e lo a d c l a s s
0 . 0
0 . 2
0 . 4
0 . 6
0 . 8
1 . 0
Pro
port
ion
( a ) E a s t e r n m ig r a t o r y p o p u la t i o n
0 1 2 3 4 5P a r a s i t e l o a d c la s s
0 . 0
0 . 1
0 . 2
0 . 3
0 . 4
0 . 5
( b ) W e s t e r n m i g r a t o r y p o p u l a t i o n
0 1 2 3 4 5P a r a s i t e lo a d c l a s s
0 . 0
0 . 1
0 . 2
0 . 3
0 . 4
0 . 5
( c ) F l o r i d a r e s i d e n t p o p u la t i o n
Figure 2.18. Frequency distributions of parasite loads in three North American populations of Monarch butterfly (Danaus plexippus) (Altizer et al. 2000). The parasite is the protozoan Ophryocystis elektroscirrha. (a) The Eastern migratory population is from Sierra Chincua, Mexico; (b) the western migratory population from Pismo Beach, California, and (c) the southern Florida population from Miami. Spore load classes are 0 = no spores, 1 = 1 spore, 2 = 2-20 spores, 3 = 21-100 spores, 5 = >1000 spores.
Hutchings et al. (1998, 1999a, 1999b, 1999c) have recently examined this problem in domestic sheep exposed to grass swards contaminated with faeces infested with the nematode Teladorsagia circumcincta. They found that the sheep’s avoidance of faeces increased with the amount of faeces present on the sward (Fig. 2.17(a)), but decreased with its age (Fig. 2.17(b)). Thus, although the sheep avoided contaminated swards, fresh faeces (which provide little risk of infection) presented the strongest stimulus for sward rejection. This may be because of a temporal decline in the strength of the cues used in faecal avoidance (e.g. olfactory stimuli), or may reflect a change in the relative costs and benefits of feeding on swards contaminated with faeces. The costs being associated with the risk of parasitism and the benefits being those associated with feeding on a sward fertilized by a rich nitrogen source (faeces).
Parasitism by T. circumcincta altered this behaviour further. Parasitized sheep fed at a reduced rate compared with non-infected animals and showed greater avoidance of contaminated swards (Hutchings et al. 1998, Hutchings et al. 1999a, Hutchings et al. 1999b, Hutchings et al. 1999c). Other factors shown to influence feeding behaviour were the sheep’s immune status (animals with previous experience of T. circumcincta showed less aversion to contaminated swards) and their nutritional status (animals on a reduced diet were more likely to risk infection if this resulted in them feeding on a sward with a high nitrogen content (Hutchings et al. 1999a, Hutchings et al. 1999b, Hutchings et al. 1999c).
As indicated above, parasitized animals may alter their behaviour so as to reduce their risk of further infection or to minimize the impact of a current infection, via processes such as behavioural fever (Monagas and Gatten 1983) (Florez-Duquet et al. 1998) (Karban 1998), cold-temperature exploitation (Muller and Schmidhempel 1993) and anorexia (Kyriazakis et al. 1998). These responses to parasitism would tend to lead to a reduction in parasite heterogeneities over time. Alternatively, parasitized animals may change their behaviour in a way that leads to an increase in their risk of further infection. This may be because the host is forced by nutritional (or other) demands imposed by their parasites to forage in areas where there is an increased risk of further infection, or because of behavioural manipulation by the parasites themselves (Moore and Gotelli 1990) (Poulin 1994a, Poulin et al. 1994b, Poulin 1994c) (Thompson and Kavaliers 1994) (Moore and Gotelli 1996). Both of these processes would tend to accentuate heterogeneities by a process of positive feedback (§2.4.7) and could destabilize the host-parasite interaction (Dobson 1988a).
Behavioural strategies to reduce parasitism rates may extend to much greater spatial scales than those outlined above. For example, Folstad et al. (1991) showed that intensities of warble fly (Hypoderma tarandi) larvae in reindeer herds in northern Norway declined with increasing post-calving migration distance. Thus, by migrating out of calving areas, where there are high densities of

25
the parasite’s infective stages (adult flies), the reindeer reduce their level of infection; between-herd heterogeneities in infection levels may therefore be the direct result of behavioural differences between them.
Similar patterns have recently been reported by Altizer et al. (2000) working on infections of the protozoan Ophryocystis elektroscirrha in North American populations of the Monarch butterfly Danaus plexippus. They found that average spore loads were highest in a resident (non-migratory) population of Monarchs in Florida (70% heavily infected - spore classes 4 and 5), intermediate in moderately migratory populations in the western North America (30% heavily infected) and lowest in highly migratory eastern populations (less than 2% heavily infected) (see Fig. 2.18).
Consistent with the idea that migration allows the insects to escape parasitism in space and time, Altizer and colleagues also found that in western population of Monarchs, average spore loads declined as the distance between the summer breeding area and the nearest over-wintering site increased. However, alternative mechanisms generating these patterns are also possible (Altizer et al. 2000). For example, they could be due to parasite-induced host mortality during migration or to differences between sites in environmental conditions. A further possibility is that they are due to genetic differences between populations in parasite infectivity and host resistance. Altizer (Altizer 1998) found that individuals from highly migratory populations in the west were significantly less resistant to protozoan infections than the more sedentary eastern populations, and that western populations were associated with more virulent parasites.
2.4.5 Host genetics
How much genetic variation is there in susceptibility to parasitism? There is a now wealth of information on the importance of host genetics in host-parasite interactions in crop plants (Burdon 1991) (Kolmer 1996), in domestic and laboratory animals (Wakelin and Blackwell 1988) (Kloosterman et al. 1992) (Stear and Murray 1994, Stear and Wakelin 1998) and in human populations (Williams-Blangero and Vandeberg 1998, Williams-Blangero et al. 1999b). There are many fewer good examples of genetic variation in disease resistance in natural host populations, and most of those come from plant-pathogen interactions (Jarosz and Burdon 1990) (Burdon 1991) (Thompson and Burdon 1992) (Kolmer 1996) (Yu et al. 1998) (Glinski and Jarosz 2000). There is therefore a pressing need for more studies involving macroparasite infections of wild animals, particularly vertebrates (see Table 2.2).
One of the reasons for the lack of data from vertebrates is the difficulty of obtaining unbiased estimates of the genetic contribution to variation in parasite loads (Sorci et al. 1997). This is due partly to the problem of distinguishing between genetic and non-genetic maternal effects in the field. One way round this problem may be to use cross-fostering experiments, in which hosts are taken out of their maternal (and paternal) environment and an assessment made of the genetic components of resistance in a neutral setting. Other powerful techniques (such as selection experiments) require the study animal to be brought into a laboratory setting, which may provide unreliable estimates of the genetic contributions to disease resistance by virtue of the fact that the non-genetic (environmental) component of variance has changed (though recent studies indicate a strong correlation between field and laboratory estimates of heritability) (Weigensberg and Roff 1996).
There are several different levels at which the genetic contribution to parasite resistance can be examined. The heritability of a trait is the ratio of the additive genetic variation to the total phenotypic variation, and is a measure of the amount of genetic variation available to selection. Heritabilities provide an aggregate measure of the effects of all of the genes involved in parasite resistance, but tell us nothing about the specific genes involved. Due to the size of the host genome, identifying resistance genes is a difficult job and has rarely been attempted for diseases in wild animal populations, in marked contrast to the flurry of genome-mapping activity devoted to domestic and laboratory animals. By extrapolation from studies of macroparasitic infections of domestic animals (Schwaiger et al. 1995) (Buitkamp et al. 1996) (Stear and Wakelin 1998), the search for resistance genes is likely to focus on regions within and around the major histocompatability complex or MHC (Siva-Jothy and Skarstein 1998), part of the genome involved in antigen presentation to the vertebrate immune system (Apanius et al. 1997).
Another level at which genetics might impinge on parasite resistance is in terms of the overall level of genetic variation. Inbreeding depression is the decline in fitness attributable to the loss of genetic heterozygosity (Crnokrak and Roff 1999). By exposing recessive alleles for susceptibility to parasites in homozygous individuals, inbreeding might result in a reduction in parasite resistance.
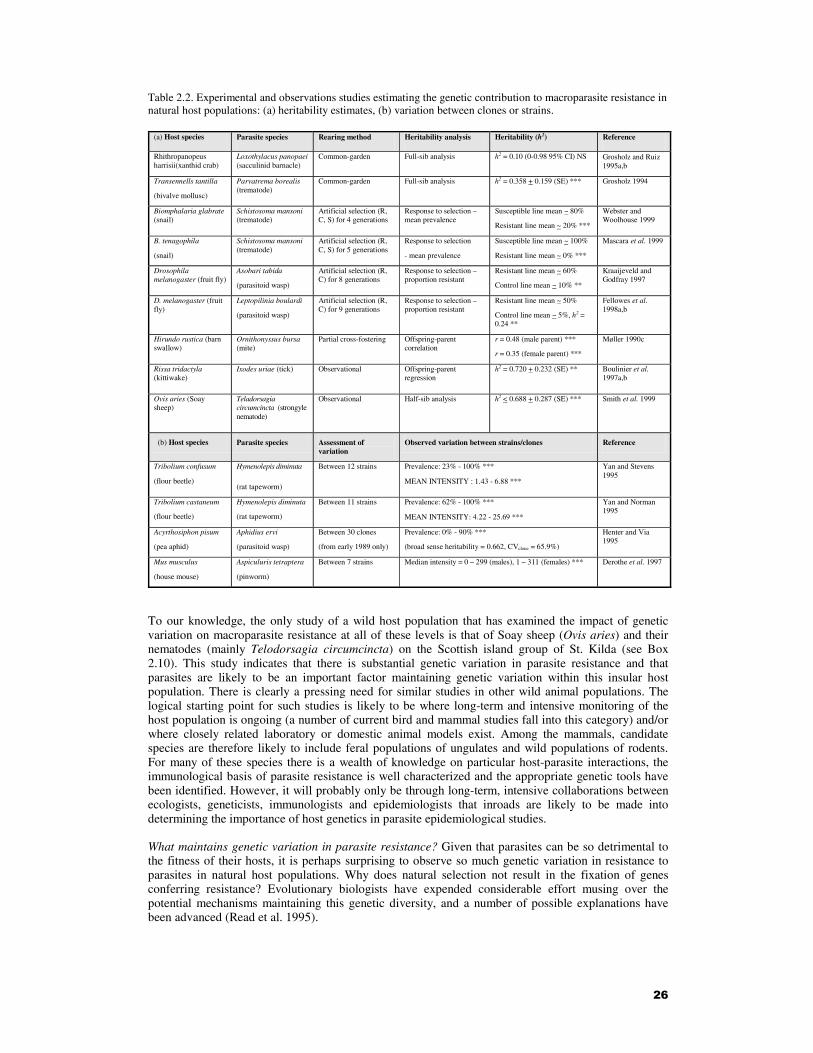
26
Table 2.2. Experimental and observations studies estimating the genetic contribution to macroparasite resistance in natural host populations: (a) heritability estimates, (b) variation between clones or strains.
(a) Host species Parasite species Rearing method Heritability analysis Heritability (h2) Reference
Rhithropanopeus harrisii(xanthid crab)
Loxothylacus panopaei (sacculinid barnacle)
Common-garden Full-sib analysis h2 = 0.10 (0-0.98 95% CI) NS Grosholz and Ruiz 1995a,b
Transennells tantilla
(bivalve mollusc)
Parvatrema borealis (trematode)
Common-garden Full-sib analysis h2 = 0.358 + 0.159 (SE) ***
Grosholz 1994
Biomphalaria glabrate (snail)
Schistosoma mansoni (trematode)
Artificial selection (R, C, S) for 4 generations
Response to selection – mean prevalence
Susceptible line mean ~ 80%
Resistant line mean ~ 20% ***
Webster and Woolhouse 1999
B. tenagophila
(snail)
Schistosoma mansoni (trematode)
Artificial selection (R, C, S) for 5 generations
Response to selection
- mean prevalence
Susceptible line mean ~ 100%
Resistant line mean ~ 0% ***
Mascara et al. 1999
Drosophila melanogaster (fruit fly)
Asobari tabida
(parasitoid wasp)
Artificial selection (R, C) for 8 generations
Response to selection – proportion resistant
Resistant line mean ~ 60%
Control line mean ~ 10% **
Kraaijeveld and Godfray 1997
D. melanogaster (fruit fly)
Leptopilinia boulardi
(parasitoid wasp)
Artificial selection (R, C) for 9 generations
Response to selection – proportion resistant
Resistant line mean ~ 50%
Control line mean ~ 5%, h2 = 0.24 **
Fellowes et al. 1998a,b
Hirundo rustica (barn swallow)
Ornithonyssus bursa (mite)
Partial cross-fostering Offspring-parent correlation
r = 0.48 (male parent) ***
r = 0.35 (female parent) ***
Møller 1990c
Rissa tridactyla (kittiwake)
Ixodes uriae (tick) Observational Offspring-parent regression
h2 = 0.720 + 0.232 (SE) **
Boulinier et al. 1997a,b
Ovis aries (Soay sheep)
Teladorsagia circumcincta (strongyle nematode)
Observational Half-sib analysis h2 < 0.688 + 0.287 (SE) ***
Smith et al. 1999
(b) Host species Parasite species Assessment of variation
Observed variation between strains/clones Reference
Tribolium confusum
(flour beetle)
Hymenolepis diminuta
(rat tapeworm)
Between 12 strains Prevalence: 23% - 100% ***
MEAN INTENSITY : 1.43 - 6.88 ***
Yan and Stevens 1995
Tribolium castaneum
(flour beetle)
Hymenolepis diminuta
(rat tapeworm)
Between 11 strains Prevalence: 62% - 100% ***
MEAN INTENSITY: 4.22 - 25.69 ***
Yan and Norman 1995
Acyrthosiphon pisum
(pea aphid)
Aphidius ervi
(parasitoid wasp)
Between 30 clones
(from early 1989 only)
Prevalence: 0% - 90% ***
(broad sense heritability = 0.662, CVclone = 65.9%)
Henter and Via 1995
Mus musculus
(house mouse)
Aspiculuris tetraptera
(pinworm)
Between 7 strains Median intensity = 0 – 299 (males), 1 – 311 (females) *** Derothe et al. 1997
To our knowledge, the only study of a wild host population that has examined the impact of genetic variation on macroparasite resistance at all of these levels is that of Soay sheep (Ovis aries) and their nematodes (mainly Telodorsagia circumcincta) on the Scottish island group of St. Kilda (see Box 2.10). This study indicates that there is substantial genetic variation in parasite resistance and that parasites are likely to be an important factor maintaining genetic variation within this insular host population. There is clearly a pressing need for similar studies in other wild animal populations. The logical starting point for such studies is likely to be where long-term and intensive monitoring of the host population is ongoing (a number of current bird and mammal studies fall into this category) and/or where closely related laboratory or domestic animal models exist. Among the mammals, candidate species are therefore likely to include feral populations of ungulates and wild populations of rodents. For many of these species there is a wealth of knowledge on particular host-parasite interactions, the immunological basis of parasite resistance is well characterized and the appropriate genetic tools have been identified. However, it will probably only be through long-term, intensive collaborations between ecologists, geneticists, immunologists and epidemiologists that inroads are likely to be made into determining the importance of host genetics in parasite epidemiological studies.
What maintains genetic variation in parasite resistance? Given that parasites can be so detrimental to the fitness of their hosts, it is perhaps surprising to observe so much genetic variation in resistance to parasites in natural host populations. Why does natural selection not result in the fixation of genes conferring resistance? Evolutionary biologists have expended considerable effort musing over the potential mechanisms maintaining this genetic diversity, and a number of possible explanations have been advanced (Read et al. 1995).

27
Figure 2.19. Encapsulation response and competitive ability of Drosophila melanogaster (Kraaijeveld and Godfray 1997). (a) The frequency of encapsulation in flies belonging to the control (open symbols) and selected (solid symbols) lines. The figure shows means and standard errors of the four selected and control lines. (b) The competitive ability of experimental flies in the two lines relative to a tester strain.
One possibility is that genetic diversity is maintained by trade-offs between the fitness costs associated with resistance and those associated with parasitism (May and Anderson 1983). However, convincing evidence for such ‘costs of resistance’ in animal host population has been lacking until relatively recently. One of the best examples illustrating a cost of resistance is a recent study by Kraaijveld and Godfray (1997). They found that the fruit fly Drosophila melanogaster exhibited considerable genetic variation in resistance to attack by the braconid parasitoid wasp Asobara tabida (Fig. 2.19). Selected lines rapidly increased their cellular encapsulation response from 5% at the start of the experiment to greater than 50% after 5 generations of selection. However, after examining various life-history and other traits in the selected and control lines, the only apparent cost of resistance was a decline in the competitive ability of larvae in the selected lines when food was in limited supply.
Box 2.10 Soay sheep on St. Kilda
A feral population of Soay sheep has lived unmanaged on the St. Kildan archipelago, Outer Hebrides, Scotland for at least 1000 years. Historically, the population was restricted to the small island of Soay (99 ha), but in 1932, 107 sheep were moved to the much larger island of Hirta (638 ha). This population now comprises 700-2000 animals, and is characterized by periodic mass mortalities when up to 70% of the population may die overwinter (Fig. 2.20a) (Clutton-Brock et al. 1991) (Grenfell et al. 1992a, Grenfell et al. 1998).
Although the proximate cause of death during these population crashes is protein-energy malnutrition (Gulland 1992), parasites have been implicated as a contributory factor (Gulland 1992) (Gulland and Fox 1992, Gulland et al. 1993) (Paterson et al. 1998) (Coltman et al. 1999a). Since 1985, approximately 95% of individuals born in the Village Bay study area have been individually tagged and genetically sampled (Clutton-Brock et al. 1991, Clutton-Brock et al. 1997), and parasite loads have been estimated since 1988. Thus, it has been possible to both analyse genetic variation in resistance to parasites (Gulland et al. 1993) (Paterson et al. 1998) (Coltman et al. 1999a) (Box 2.11) and to generate longitudinal profiles of parasitism by following individuals throughout their life (Boyd 1999).
Although the population plays host to twenty different species of macroparasite (Gulland 1992), the parasite that has the biggest impact on the sheep is the directly transmitted nematode Teladorsagia circumcincta (formally referred to as Ostertagia). T. circumcincta is also the most numerous of the

28
trichostrongylids and each individual can harbour up to 20-30,000 of these small (7 - 12 mm) ‘brown stomach-worms’ (Gulland 1992).
1950 1960 1970 1980 1990 2000
Year
500
1000
1500
2000
Log
(num
ber
of s
heep
on
Hirt
a)
Figure 2.20 Population dynamics of Soay sheep on Hirta, St. Kilda (Grenfell et al. 1998).
Figure 2.21. Life cycle of Teladorsagia circumcincta in Soay sheep. L1-L5 are the first-fifth larval stages.
Symptoms of infection include poor weight gain or weight loss, loss of appetite and diarrhoea, and heavy infections can result in the sheep’s death (Holmes 1985). On the mainland, farmers regularly dose their domestic sheep with anthelmintics, specifically to control this economically important parasite.
The dioecious adult worms live in the abomasum of the sheep where they mate and produce eggs that are voided in the faeces. It is the density of these eggs in the faeces that is regularly used on St. Kilda to measure parasitism rates (‘faecal egg count’ is strongly correlated with worm burden) (Grenfell et al. 1995) (Boyd 1999) (Braisher 1999). On the pasture, the eggs may hatch within as little as 24 hours, but they can survive on the pasture for several months prior to hatching, depending on environmental conditions. The emerging larva moults twice before becoming the infective third stage, which the sheep ingest whilst feeding. Following ingestion, the L3 larvae migrate to the abomasum (fourth stomach) and enter the gastric glands, where they stay until they have completed two further moults and become mature adult worms. Eggs may appear in the faeces just three weeks following infection. However, larvae may become arrested at the early L4 stage for up to 3 months in a process known as ‘hypobiosis’.
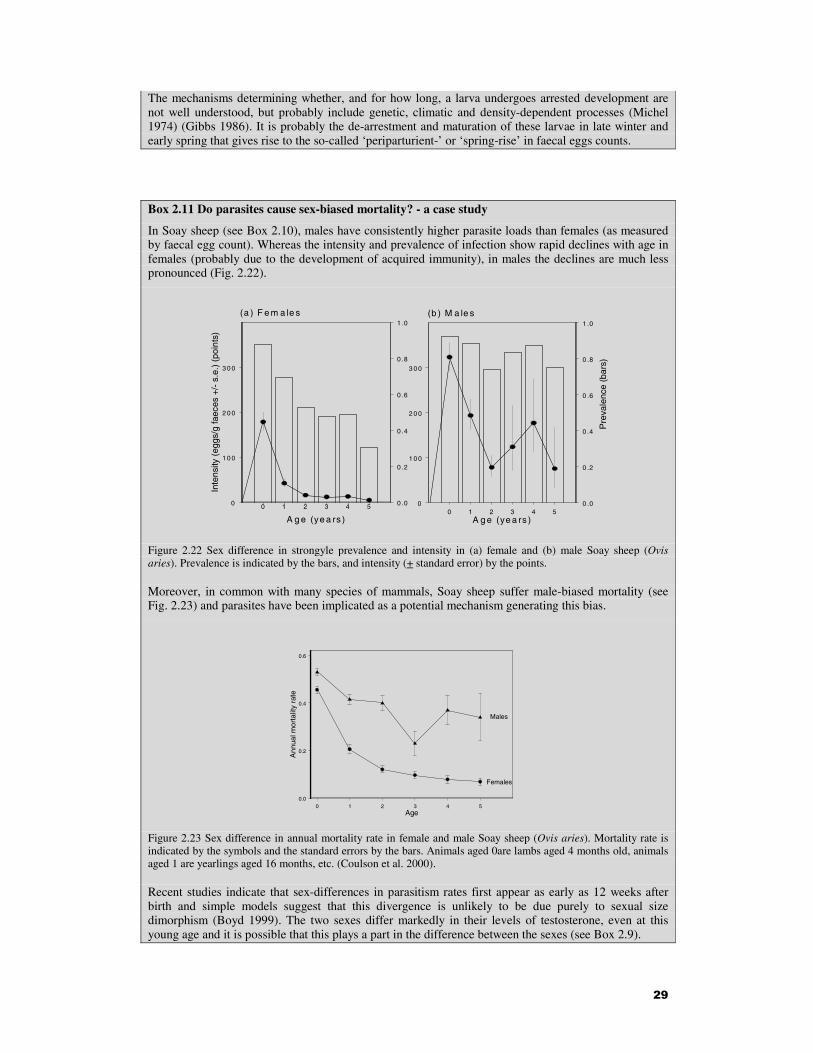
29
The mechanisms determining whether, and for how long, a larva undergoes arrested development are not well understood, but probably include genetic, climatic and density-dependent processes (Michel 1974) (Gibbs 1986). It is probably the de-arrestment and maturation of these larvae in late winter and early spring that gives rise to the so-called ‘periparturient-’ or ‘spring-rise’ in faecal eggs counts.
Box 2.11 Do parasites cause sex-biased mortality? - a case study
In Soay sheep (see Box 2.10), males have consistently higher parasite loads than females (as measured by faecal egg count). Whereas the intensity and prevalence of infection show rapid declines with age in females (probably due to the development of acquired immunity), in males the declines are much less pronounced (Fig. 2.22).
0 1 2 3 4 5
A g e (ye a rs )
0
1 0 0
2 0 0
3 0 0
Inte
nsity
(eg
gs/g
faec
es +
/- s
.e.)
(po
ints
)
0 .0
0 .2
0 .4
0 .6
0 .8
1 .0
(a ) F e m a le s
0 1 2 3 4 5A g e (ye a rs )
0
1 0 0
2 0 0
3 0 0
0 .0
0 .2
0 .4
0 .6
0 .8
1 .0
Pre
vale
nce
(bar
s)
(b ) M a le s
Figure 2.22 Sex difference in strongyle prevalence and intensity in (a) female and (b) male Soay sheep (Ovis aries). Prevalence is indicated by the bars, and intensity (+ standard error) by the points.
Moreover, in common with many species of mammals, Soay sheep suffer male-biased mortality (see Fig. 2.23) and parasites have been implicated as a potential mechanism generating this bias.
0 1 2 3 4 5Age
0.0
0.2
0.4
0.6
Ann
ual m
orta
lity
rate
Females
Males
Figure 2.23 Sex difference in annual mortality rate in female and male Soay sheep (Ovis aries). Mortality rate is indicated by the symbols and the standard errors by the bars. Animals aged 0are lambs aged 4 months old, animals aged 1 are yearlings aged 16 months, etc. (Coulson et al. 2000).
Recent studies indicate that sex-differences in parasitism rates first appear as early as 12 weeks after birth and simple models suggest that this divergence is unlikely to be due purely to sexual size dimorphism (Boyd 1999). The two sexes differ markedly in their levels of testosterone, even at this young age and it is possible that this plays a part in the difference between the sexes (see Box 2.9).

30
Observational data such as these can highlight potential relationships between sex and parasitism and between parasitism and mortality. However, the only clear way to be sure of a causal relationship is to perform an experiment in which the parasites are chemically removed with anthelmintics. Short-term drenching experiments, which remove the current worm burden but allow immediate reinfection, indicate that males regain their parasites at a much faster rate than females, suggesting that males are predisposed to high infection levels. More importantly, when parasites were removed for a longer period of time (i.e. several months) using anthelmintic boluses, the male-biased mortality observed in the control group was obviated in the treated group (Gulland et al. 1993). In fact, whereas parasite removal reduced the overwinter mortality of yearling females by less than 20%, in yearling males none of the 18 treated animals dying compared with nearly 50% of the 17 untreated males (see Chapter 3). Thus, not only do the two sexes appear to develop different levels of acquired immunity to their parasites but, in yearling males at least, parasites appear to be a much more important mortality factor.
Similar findings were reported during a recent epidemic of Mycoplasma gallisepticum in a population of house fiches, Carpodacus mexicanus, in which disease-induced mortality resulted in a significant decline in the the sex ratio from 1.08-1.44 males per female to 0.72 (Nolan et al. 1998). Interestingly, it was the males with the reddest plumage that survived the epidemic best, suggesting that plumage brightness might serve as an honest signal of disease resistance (see Box 2.8).
In terms of the epidemiological consequences of male-biases in parasitism rates, it appears that although male Soays are producing substantially more parasite infective stages than females (arithmetic mean + SD faecal egg count: adult males = 414 + 382, adult females = 138 + 235), the male-biased mortality means that these individuals constitute a relatively small proportion of the adult population (5-40%) (Pemberton et al. 1996). Thus, the male contribution to parasite transmission may be much less than that of females, despite the higher egg production from males.
Box 12 - The impact of host genetics on parasite distributions - a case study
A significant heritable component to faecal egg counts has recently been demonstrated in Soay sheep on St. Kilda (Box 2.10), using both offspring-parent regression and sib-analysis (Smith et al. 1999) (Table 2.2). This result supports earlier studies, which showed that parasitism rates were associated with specific alleles at a number of protein loci, most notably the diallelic adenosine deaminase (Ada) locus (Gulland et al. 1993) (Smith 1996). Gulland et al.(1993) found that individuals that were heterozygous at the Ada locus (FS) tended to have relatively lower parasitism rates in summer (females) or autumn (males), and that homozygous FF females had relatively higher faecal egg counts during the peri-parturient rise in spring. Consistent with the idea that Ada allele frequencies are maintained in the sheep population by parasite-mediated selection, overwinter mortality during population crashes was found to be highest for FF animals and lowest for FS animals.
H e te ro zyg o s ity q u a rtile
1 2 3 4
Fitt
ed F
EC
(eg
gs/g
)
1 0 0
2 0 0
3 0 0
4 0 0
5 0 0
6 0 0
7 0 0
5 6
6 2
5 9
6 1
4 4 3 5 4 3
3 8
Figure 2.24 Effect of inbreeding depression on faecal egg counts in Soay sheep. Open symbols are the August faecal egg counts (+ SE) from the best fitting model for high density years; closed symbols are the fitted values for low density years (after Coltman et al. 1999b). The numbers next to the symbols indicates sample sizes. Heterozygosity is divided into quartiles - the 25% of individuals with the lowest heterozygosity scores (i.e. highest level of inbreeding) are in heterozygosity quartile 1.
Subsequent analyses have determined associations between parasitism and genotype at a number of microsatellite loci, the most interesting of which are located within the MHC (Paterson et al. 1998).
31
Paterson and colleagues found that specific MHC alleles were associated with either low survivorship rates and high parasitism rates, or vice versa. For example, at the ‘OLADRB’ locus, lambs with the ‘257’ allele had both low parasite resistance and low over-winter survival, whereas yearlings with the ‘263’ allele had both high parasite resistance and high survival. This study is consistent with the proposition that parasites play an important role in the maintenance of MHC diversity in this population.
At a broader genetic level, recent work by Coltman et al. (1999b) suggests that inbreeding depression may have a direct impact on parasite resistance. Across a range of microsatellite loci spread throughout the Soay sheep genome, individuals with low levels of heterozygosity not only had higher faecal egg counts (see Fig.2.24), but also suffered higher over-winter mortality. Further, they observed that in sheep cleared of their parasites by anthelmintic treatment, over-winter mortality was independent of heterozygosity, providing experimental evidence for a role of parasites in selection against inbred sheep. Thus, parasite-mediated selection against inbreeding provides a mechanism retarding the loss of genetic variation in this population. There is clearly a need for similar studies to be undertaken on other naturally-regulated host populations.
Similar experiments with the eucoilid wasp Leptopilina boulardi demonstrated a similarly rapid response to selection (from <1% encapsulation at the start of selection to 40-50% after 5 generations) and the narrow-sense heritability of the trait was estimated to be 0.24 (Fellowes et al. 1999a, 1999b). Interestingly, in this study it also appears that increased resistance to parasitism is achieved by D. melanogaster only by sacrificing its competitive ability when food is in short supply, though the mechanism determining this trade-off remains unclear. Another result common to both studies is that the proportion of individuals encapsulating the two parasitoids never exceeded 60%, despite repeated episodes of selection. This suggests that there is an upper limit to the effectiveness of the fruit flies defence, though again the reason for this is unclear at present.
Despite the apparent similarity between these two selection experiments, it appears that they were selecting for different types of resistance. Fellowes et al. (1999a, 1999b, 1999c) found that lines that had been selected for resistance to L. boulardi, showed a large correlated increase in resistance to Leptopilina heterotama and A. tabida, whereas lines selected for resistance to A. tabida showed little consistent cross-resistance to either of the Leptopilinia species. This suggests that the attributes being selected for in the L. boulardi experiment were of general utility in resisting other parasitoids, whereas those selected for in the A. tabida experiment were more specific to that particular host-parasite interaction. Fellowes et al. (1999a, 1999b, 1999c) discuss the potential importance of these different types of response for community structuring.
Other recent studies with invertebrates (snails, mosquitoes and moths) have demonstrated that resistance may be traded-off against egg production, egg viability, larval competitive ability, adult body mass and/or adult lifespan (Fuxa 1989a, 1989b) (Boots and Begon 1993) (Yan et al. 1997) (Fuxa et al. 1998) (Webster and Woolhouse 1999). There remains a lack of good evidence for trade-offs associated with parasite resistance in wild vertebrate hosts. However, a study with a captive population of domestic fowl (Gallus domesticus) suggests that there may be genetic trade-offs between the acquired and innate arms of the avian immune system (Norris and Evans 2000). Siegel and Gross (1980) used artificial selection to produce genetic lines that exhibited high (HA) or low (LA) antibody titres when immunized with sheep red blood cells. They subsequently found that HA birds were significantly less effective at controlling bacterial infections than LA birds (Gross et al. 1980). As bacterial infections are generally controlled by heterophils and other phagocytosing cells (Roitt et al. 1998), these results suggest that selection for enhancement of a component of the acquired immune system (antibody production) could lead to a reduction in the efficacy of a component of the innate immune system (phagocytes).
Another mechanism capable of maintaining genetic variation in parasite resistance is a co-evolutionary arms race between the host and its parasites, in which each party is continually responding and counter-responding to selection pressures imposed by the other (Stenseth and Maynard Smith 1984). This process is sometimes referred to as the Red Queen after the character in Lewis Carroll’s ‘Through the Looking Glass’ who needed to run constantly in order to stay in the same place (Van Valen 1973) (Lythgoe and Read 1998). Despite considerable theoretical activity in the past 25 years, there has been little direct empirical support for the hypothesis from wild populations. However, in a recent series of papers, Mark Dybdahl and Curtis Lively provide the best evidence yet supporting the Red Queen hypothesis (Dybdahl and Lively 1995a, 1995b, 1998) (Lively and Dybdahl 2000). Over a five-year
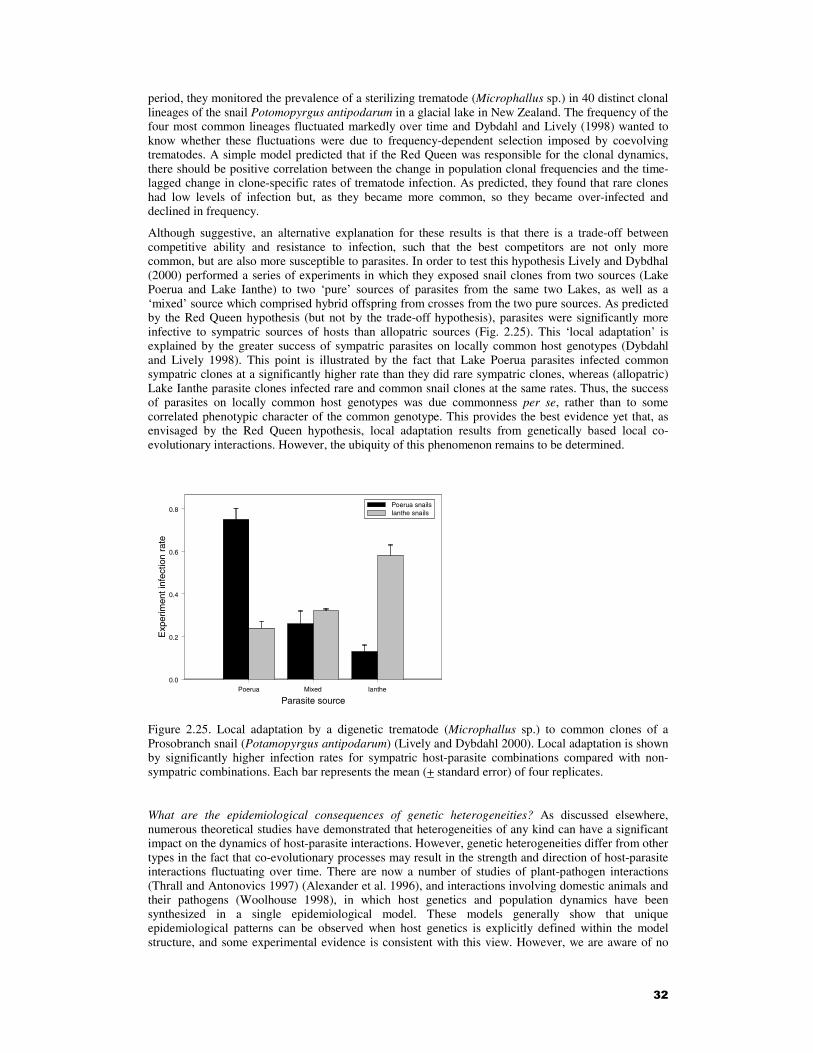
32
period, they monitored the prevalence of a sterilizing trematode (Microphallus sp.) in 40 distinct clonal lineages of the snail Potomopyrgus antipodarum in a glacial lake in New Zealand. The frequency of the four most common lineages fluctuated markedly over time and Dybdahl and Lively (1998) wanted to know whether these fluctuations were due to frequency-dependent selection imposed by coevolving trematodes. A simple model predicted that if the Red Queen was responsible for the clonal dynamics, there should be positive correlation between the change in population clonal frequencies and the time-lagged change in clone-specific rates of trematode infection. As predicted, they found that rare clones had low levels of infection but, as they became more common, so they became over-infected and declined in frequency.
Although suggestive, an alternative explanation for these results is that there is a trade-off between competitive ability and resistance to infection, such that the best competitors are not only more common, but are also more susceptible to parasites. In order to test this hypothesis Lively and Dybdhal (2000) performed a series of experiments in which they exposed snail clones from two sources (Lake Poerua and Lake Ianthe) to two ‘pure’ sources of parasites from the same two Lakes, as well as a ‘mixed’ source which comprised hybrid offspring from crosses from the two pure sources. As predicted by the Red Queen hypothesis (but not by the trade-off hypothesis), parasites were significantly more infective to sympatric sources of hosts than allopatric sources (Fig. 2.25). This ‘local adaptation’ is explained by the greater success of sympatric parasites on locally common host genotypes (Dybdahl and Lively 1998). This point is illustrated by the fact that Lake Poerua parasites infected common sympatric clones at a significantly higher rate than they did rare sympatric clones, whereas (allopatric) Lake Ianthe parasite clones infected rare and common snail clones at the same rates. Thus, the success of parasites on locally common host genotypes was due commonness per se, rather than to some correlated phenotypic character of the common genotype. This provides the best evidence yet that, as envisaged by the Red Queen hypothesis, local adaptation results from genetically based local co-evolutionary interactions. However, the ubiquity of this phenomenon remains to be determined.
Poerua Mixed Ianthe
Parasite source
0.0
0.2
0.4
0.6
0.8
Exp
erim
ent i
nfec
tion
rate
Poerua snailsIanthe snails
Figure 2.25. Local adaptation by a digenetic trematode (Microphallus sp.) to common clones of a Prosobranch snail (Potamopyrgus antipodarum) (Lively and Dybdahl 2000). Local adaptation is shown by significantly higher infection rates for sympatric host-parasite combinations compared with non-sympatric combinations. Each bar represents the mean (+ standard error) of four replicates.
What are the epidemiological consequences of genetic heterogeneities? As discussed elsewhere, numerous theoretical studies have demonstrated that heterogeneities of any kind can have a significant impact on the dynamics of host-parasite interactions. However, genetic heterogeneities differ from other types in the fact that co-evolutionary processes may result in the strength and direction of host-parasite interactions fluctuating over time. There are now a number of studies of plant-pathogen interactions (Thrall and Antonovics 1997) (Alexander et al. 1996), and interactions involving domestic animals and their pathogens (Woolhouse 1998), in which host genetics and population dynamics have been synthesized in a single epidemiological model. These models generally show that unique epidemiological patterns can be observed when host genetics is explicitly defined within the model structure, and some experimental evidence is consistent with this view. However, we are aware of no

33
equivalent studies of natural host-macroparasite interactions and there is certainly scope for such studies to be conducted.
2.4.6 Parasite genetics
There has been remarkably little work conducted on the importance of parasite heterogeneities in epidemiology, though in principal all of the heterogeneities previously considered for the host population apply equally well to the parasites themselves. In this section, we consider only genetic heterogeneities, the relevance of which is only just beginning to be realized. There is obviously a need for such studies to be extended to other forms of parasite heterogeneity.
How much genetic diversity is observed in parasite populations? A number of studies on parasites of humans and domestic animals have quantified the degree of genetic variation within and between macroparasite populations (Blouin et al. 1992, Blouin et al. 1995) (Anderson et al. 1993a, Anderson et al. 1993b, Anderson et al. 1993c) (Anderson and Jaenike 1997) (Anderson et al. 1998). These studies indicate that for many parasites, the within-population genetic diversity is extremely high (up to 10 times greater than for species in other taxa) (Blouin 1992a, 1992b). Several recent studies of wild populations of host have observed similar levels of diversity. For example, Braisher (1999) studied populations of the nematode Teladorsagia circumcincta from two feral populations of Soay sheep living on the islands of St. Kilda and Lundy and found that there was just as much genetic diversity within populations of worms as there was between them. This sort of pattern is usually interpreted as indicating that the parasite has a very large effective population size (thousands of worms per host). However, there is also some evidence to suggest that DNA evolves faster in nematodes than in other taxa (Okimoto et al. 1994) (Blouin et al. 1995), and this may contribute to the high genetic diversity.
Not all parasites have large effective population sizes and high levels of genetic diversity, however. For example, whereas trichostrongylids occur in their thousands, Ascaris worm populations of humans and pigs rarely exceed a few dozen per host. Anderson and colleagues (Anderson et al. 1993a, Anderson et al. 1993b, Anderson et al. 1993c, Anderson and Jaenike 1997) studied Ascaris in Guatamala and elsewhere and found clear sub-structuring of the population at several different levels. For example, in one survey they found that 65% of nuclear genetic variation was found within host populations, 18% was accounted for by host species, while the remaining 17% was explained by geographical variation within host-associated populations. Despite the potential importance of parasite genetics to both evolutionary biology and epidemiology, we are only just beginning to examine geographical patterns of variation in natural populations. In particular, there are only a handful of studies that have attempted to map parasite genetic structure onto host genetic structure (but see Mulvey et al. 1991, Dybdahl and Lively 1996). For example, Davies et al. (1999) studied the population genetic structures of the freshwater snail Bulinus globosus and its trematode parasite Schistosoma haematobium from 8 river sites in Zimbabwe. They found that for the snail, genetic distance between populations was best correlated with proximity along rivers, whereas for the schistosome, genetic distance was better correlated with absolute geographical separation.
What can parasite heterogeneity tell us about the transmission process? Genetic heterogeneities in worm populations can provide important insights into the transmission processes operating in wildlife host communities. For example, when a parasite is found in more than one sympatric host species, genetic studies can be used to determine whether a single transmission cycle is involved or if each host species is infected only by parasites derived from conspecifics (Anderson et al. 1993a, Anderson et al. 1993b, Anderson et al. 1993c). This can have important consequences for chemical intervention strategies. Similarly, clustering of related parasites within hosts may indicate that there is a similar clustering of related infective stages in the environment or that parasite establishment is genotype-dependent (Anderson et al. 1995a, Anderson et al. 1995b). If hosts are being infected by their own parasites (or those of their relatives), this could have important consequences for the evolution of parasite virulence. Parasites transmitted between close relatives can be expected to evolve lower virulence than parasites transmitted between non-related hosts (May and Anderson 1983) (Ewald 1983, 1993) (Clayton and Tompkins 1994) (Herre 1995).
What are the epidemiological consequences of parasite genetic heterogeneity? There is a substantial literature on the importance of host genetic heterogeneity in determining the outcome of helminth infections, but relatively little attention has been paid to the question of whether worm genetic diversity plays a role in immune evasion and parasite transmission. This is despite the very obvious importance of genetics in immune evasion by microparasites (e.g. influenza, malaria, dengue etc). One reason for

34
the lack of interest is that the degree of antigenic polymorphism appears to be much lower in helminths than in most microparasites. However, since the antigens involved in protective immunity against helminths are largely unknown, levels of polymorphism in immunogenic loci may be uninformative.
Direct tests of the specificity of acquired protection involve experimentally immunising hosts with particular strains or genotypes and then challenging with the same (homologous) or different (heterologous) parasites. Few such experiments have been performed within helminth species (tests of cross-species protection are much more common). Those tests that have been performed have typically involved poor experimental design, work with sublines of highly inbred lab strains, and non-natural hosts (Read and Viney 1996). As things stand at the moment, there is probably as much evidence that worm genetics matters as there is that it does not. Some of the best evidence that it does matter comes from the seminal work of Derek Wakelin and colleagues’ on infections of the nematode Trichinella spiralis in laboratory mice, which undoubtedly shows that protective responses are stronger against homologous genotypes (Bolasfernandez and Wakelin 1992) (Goyal and Wakelin 1993a) (Wakelin and Goyal 1996). However, the systematics of T. spiralis isolates remains in doubt and it is possible that the differences actually lie between incipient species, rather than within them. Work by the same group on infections of the nematode Trichuris muris in mice show similar patterns and are likely to be less confounded by phylogenetic problems (Bellaby et al. 1995, Bellaby et al. 1996). Evidence from other species remains mixed; in the fluke Schistosoma japonicum, for example, homologous immunity against different geographic isolates has been found in some cases, but not others. Perhaps the most extensive series of experiments has been conducted with the nematode Strongyloides ratti in rats, using isofemale lines (Viney 1999a, Viney 1999b). Carter and Wilson (1989), working with two distinct isolates, found that homologous protection was stronger than that elicited by the heterologous line and she was able to replicate this effect with passive serum transfer. However, in an extensive series of experiments, Read et al. (unpublished) were unable to find any repeatable evidence that protective immunity was stronger against the immunising genotype. Thus, at present we simply do not know whether genetic heterogeneity in the worm population is important in immune evasion (though it is likely that its will differ between host-parasite interactions).
This situation contrasts substantially with that in microparasites such as malaria, where there is little doubt that immune responses are at least in part genotype specific, with previously unseen genotypes having a growth advantage in semi-immune hosts (Brown 1999). This can have very interesting consequences for transmission. In experiments with the rodent malaria Plasmodium chabaudi, Taylor and Read (1997) found that mixed clone infections were more infectious to mosquitoes even though total parasite densities were no higher. Monoclonal antibody analyses of blood stage parasites, and PCR analyses of parasites in mosquitoes demonstrated that this was most likely a consequence of genotype-specific immunity against the numerically dominant clones within the infection (Taylor and Read 1998, Taylor et al. 1998a, Taylor et al. 1998b, Taylor et al. 1998c, Taylor et al. 1998d). This should produce very interesting epidemiological dynamics: high rates of transmission will result in more mixed clone infections. In turn, this will generate more infectious hosts. It is unclear what the consequences of this will be when intervention strategies reduce transmission (a disproportionate drop in transmission?), or transmission rates are increased as a consequence of climatic change (a disproportionate rise in transmission?). Clearly, there is a need for some population level modelling of this phenomenon.
2.4.7. External heterogeneities
In this section, we consider heterogeneities that do not fall neatly into those which are attributes of the host or parasite. These include the spatial distribution of the parasite’s infective stages in the environment, seasonal variation in infection levels and heterogeneities generated by the parasites themselves.
Spatial distribution of external stages: The rate of acquisition of new infections often increases with the frequency of contact between the host and infective stages (Fig. 2.26). Thus, if there is spatial variation in the density of infective stages in the environment, and different hosts utilize different parts of their environment, then this will often lead to heterogeneities in parasite intensities across the population of hosts.

35
0 2000 4000 6000
Parasite eggs per unit area
0
5
10
15
20
Mea
n pa
rasi
te in
tens
ity p
er b
eetle
Figure 2.26. The influence of the mean density of tapeworm (Hymenolepis diminuta) eggs on the mean intensity of infections within the flour beetle (Tribolium confusum) (Keymer and Anderson 1979). The bars represent the 95% confidence intervals. The line is a log-function fitted by eye. The effect of variation in the density of eggs on infection rate is illustrated in Fig. 2.27.
0 1 0 0 0 2 0 0 0 3 0 0 0
V a r ia n c e :m e a n ra t io o f e g g s p e r u n it a re a
0
2
4
6
Var
ianc
e:m
ean
ratio
of n
umbe
r of
par
asite
s pe
r be
etle
0
1
2
3
k of
num
ber
of p
aras
ites
per
host
0 1 0 0 0 2 0 0 0 3 0 0 0V a r ia n c e :m e a n ra t io o f e g g s p e r u n it a re a
0
2
4
6
8
Mea
n nu
mbe
r of
par
asite
s pe
r ho
st (
+/-
95%
CI)
( a ) (b )
Figure 2.27. The influence of the spatial distribution of tapeworm (H. diminuta) eggs on (a) the mean intensity and (b) distribution of infections within flour beetles (T. confusum) (Keymer and Anderson 1979). In (a) the bars represent the 95% confidence intervals. In (b), the distribution of infections is indicated by the s2/m ratio (red circles) and by k of the negative binomial (blue triangles). The red line is a log-function fitted by eye and the blue line is a power function fitted by eye. The effect of mean density of eggs on infection rate is illustrated in Fig. 2.26.
A particularly elegant set of experiments by Anne Keymer and Roy Anderson illustrates the role of the spatial distribution of infective stages in creating heterogeneity in the distribution of parasitic stages (Keymer and Anderson 1979). In these experiments, uninfected flour beetles (Tribolium confusum) were introduced into experimental arenas that contained the infective stages (eggs) of the tapeworm Hymenolepis diminuta. In each arena, the overall density of eggs was kept constant (at about 15 eggs/cm2), but their spatial distribution was varied from approximately uniform (s2/m ~ 0) to highly aggregated (s2/m = 2700). After a fixed period of exposure (3h), the beetle hosts were removed from the experimental arena and their subsequent infections examined. Although the spatial distribution of the infective stages did not appear to have a significant effect on the subsequent intensity of infection (Fig. 2.27(a)), it did have a marked impact and on the statistical distribution of parasites in the host population (Fig. 2.27(b)). In all cases, the parasite distribution within the host population was overdispersed, even when the spatial distribution of the infective stages was approximately uniform (s2/m ~ 0). This illustrates the potential of behavioural or immunological differences to generate aggregated parasite distributions. Moreover, as the distribution of eggs in the environment became

36
increasingly aggregated (s2/m increased), so too did the distribution of parasites in the host population (i.e. s2/m increased and k decreased; Fig. 2.27(b)). Interestingly, the degree of aggregation in the host population tended to an upper asymptote as the distribution of eggs became increasingly aggregated. This indicates that spatial heterogeneity in the infective stage distribution accentuates any behavioural or immunological differences between hosts.
This experiment is central to our understanding of the processes that determine heterogeneity in parasitic helminths, and it desperately needs to be replicated for other systems. In particular, it needs to be replicated in a system where the genetic (and perhaps the age) structure of the host population can also be controlled and manipulated.
Seasonality: Temporal variation in parasite loads appears to be common, particularly in highly seasonal aquatic systems (Shaw and Dobson 1995). For example, numbers of the copepod Lepeophtheirus pectoralis infesting plaice (Pleuronectus platessa) is highly seasonal (Boxshall 1974) and Shaw et al. (1998) found that all three measures of parasitism (the arithmetic mean number of parasites per host, the prevalence of infection and the negative binomial k of the distribution) were at their lowest in late spring (mean <1, prevalence <20%, k <1) and peaked in early autumn (mean >4, prevalence >90%, k >9; Fig. 2.28).
Figure 2.28. Temporal variation in the distribution of copepod infections in plaice (Shaw et al. 1998). The data represent the arithmetic mean burden (…◊…), prevalence of infection (…*…) and k of the negative binomial (… …) for fish caught in 1972 (Boxshall 1974).
Scott (1987a) examined temporal changes in the pattern of aggregation of the monogenean parasite Gyrodactylus turnbulli in free-running laboratory populations of the guppy Poecilia reticulata. Under conditions of regular immigration of uninfected guppies, the parasite undergoes recurrent epidemic cycles in the host population. She found that during the increasing phase of the epidemic cycle, there was an increase in the degree of parasite aggregation, presumably because of direct reproduction of the parasite on the surface of the host. As the peak prevalence and intensity were approached, the parasites became less aggregated, with the lowest degree of aggregation occurring during the declining phase of the cycle, presumably due to a density-dependent death rate of infected hosts and/or a density-dependent reduction in parasite survival and reproduction on hosts that recover from infection. Thus, in all replicates of her experiment, there was a positive correlation between the mean intensity of infection and the degree of parasite aggregation, as measured by the variance-to-mean ratio. Interestingly, when she measured the degree of aggregation by the negative binomial k, aggregation appeared to decline with increasing parasite burden (i.e. k increased with parasite load). The reason for this discrepancy is that s2/m and k measure different aspects of parasite aggregation – s2/m is most sensitive to the length of the tail of the distribution, whereas k is most sensitive the overall shape of the distribution. Thus, Scott (1987a) has cautioned against using k to measure seasonal variation in parasite aggregation when the mean or prevalence of infection vary seasonally (Box 2.1). Note that in the plaice-copepod example

37
described above, both s2/m and k indicate similar patterns in parasite aggregation (D.J. Shaw pers. comm.).
Seasonal variation in parasite aggregation can be generated by variation in both host physiology (e.g. immune function) and host exposure to parasite infective stages. The latter is often due to the fact that the development and/or mortality rate of the free-living parasite stages (or their intermediate hosts) are temperature-dependent or sensitive to seasonal variation in humidity. Seasonal variation in exposure to parasites may also be driven by host-related factors. For example, on St. Kilda (Box 2.10), the density of infective strongyle larvae on the pasture exhibits two seasonal peaks - one in late spring (May), associated with the development of eggs voided by immuno-compromised peri-parturient Soay ewes and a second in mid-summer (August), associated with the development of eggs produced by immunologically-naive lambs (Gulland and Fox 1992). The magnitude of this latter peak is dependent on the number of lambs produced in that year, but is also dependent on the prevailing climatic conditions. Whatever the mechanism generating seasonal variation in exposure to parasites, the end result is that any parasite sampling regime which lumps together data from individuals exposed to different seasonal regimes is likely to generate spurious estimates of parasite aggregation.
Heterogeneities generated by the parasites themselves: Not only are parasite loads heterogeneous, but the parasites themselves may cause these heterogeneities to become accentuated over time, by a process of positive feedback. Under such circumstances, deterministic or stochastic processes determine initial parasite loads, and these then become polarised as the parasites increase their host’s susceptibility or exposure to further parasites (§2.4.3). This process has been investigated experimentally by Hoodless et al. (1998) working on tick infections of free-ranging pheasants (Box 2.13).
Under normal circumstances, natural variation within populations in some intrinsic factor, such as testosterone levels, may determine entry into one or other of two polarised positive feedback loops. In the pheasants, it seems likely that individuals with high testosterone levels establish their territories before questing ticks have reached their seasonal high abundance. Thus, although high levels of this hormone are usually associated with low immunocompetence (Folstad and Karter 1992) (Box 2.8), in this instance it is associated with lower parasite loads by reducing exposure rates. In this respect, pheasants contrast with rodents, in which high testosterone levels are associated with large home range size and high tick infestation levels on woodmice Apodemus sylvaticus (Randolph 1975, 1977), and with increased locomotory activity and reduced immunological resistance to tick feeding in bank voles Clethrionomys glareolus (Hughes 1998). The effect, however, is similar: one fraction of the host population, whether non-territorial cock pheasants or sexually active male rodents, feeds the majority of the tick population, thereby presumably supporting the majority of tick-borne parasite transmission. The importance of parasite-induced heterogeneities has probably been underestimated, but may be a powerful (non-genetic) factor reinforcing individual differences in parasitism rates.
Box 2.13 Heterogeneities generated by positive feedback - a case study
Hoodless et al. (1998) uncovered the possibility that parasites might themselves cause heterogeneities, which become accentuated over time, by a process of positive feedback. They did this using free-living pheasants (Phasianus colchicus) living in two woodlands in Dorset. They treated half the pheasants with long-lasting acaricide to reduce their tick infestations, and then monitored the pheasant’s behaviour and parasite loads. Cock pheasants are territorial, setting up harems that they guard in small areas. The mating success of cocks depends on the brightness of their plumage and especially their wattles, the red fleshy swellings around the eyes. Reducing tick infestations on pheasants tended to improve wattle inflation and colour. The brighter the wattles, the better the cocks attracted hens (Fig. 2.29). Cocks without harems ranged more widely within woods than those with harems, whose small territories were usually on edges of fields. As a result, birds already carrying high tick burdens are likely to have a higher rate of contact with ticks questing in woodlands and therefore pick up even more ticks. Varying levels of tick infestation thus appear to introduce significant heterogeneity in the ranging behaviour of cock pheasants, which might in turn exacerbate the observed aggregated distributions of ticks amongst these hosts.

38
0.0
0.5
1.0
1.5
2.0
2.5
3.0
3.5
Mea
n no
. fem
ales
1.00 1.33 1.67 2.00 2.33 2.67 3.00
Mean wattle score
Figure 2.29. Mean harem size related to mean wattle score in male pheasants. Wattles were scored as follows: 1 = no wattle inflation; 2 = partial inflation; 3 = full inflation. Control birds = light bars; acaricide-treated birds = dark bars. Acaricide-treated females showed improved survival, higher nest survival rate and greater chick hatch rate. Male survival was not improved by acaricide treatment, perhaps because mate guarding by territorial males incurs an increased predation risk.
The additional significance of these observations is that these macroparasites, the ticks, are also vectors of microparasites, Lyme disease spirochaetes (see Box 7.2), so the impact of ticks on their hosts also determines the transmission dynamics of the Lyme spirochaetes. It is the non-territorial fraction of the pheasant population therefore that is likely to contribute most to maintaining natural cycles of Lyme disease in these habitats.
2.5 Synthesis
Developing a complete understanding of the processes that produce heterogeneity in distribution of macroparasites in their host populations continues to be a central research area in parasite ecology. In this chapter, we have outlined our current understanding of this area. We conclude by suggesting some key research problems for the future. These can be divided into theoretical developments and empirical or experimental problems. Although we have a fairly complete understanding of the role that these heterogeneities play in determining the dynamics of host-parasite systems, there are still a number of unsolved problems in determining the relative importance of the different processes that determine observed degrees of aggregation. Central among these are genetic variability among hosts in their susceptibility to infection, spatial heterogeneity in the distribution of infective stages and seasonal and diurnal variation in the risk of exposure. It is unlikely that the relative importance of these sources of heterogeneity will be the same in all systems. Yet, we still think it would be most instructive to examine their relative roles under controlled experimental conditions for two or three different well-studied systems. While comparative approaches have been useful in indicating the importance of other heterogeneities (Shaw and Dobson 1995, Shaw et al. 1998), there are simply no useful sources of comparative data for these major sources of heterogeneity. It may be possible to obtain some insight into their relative importance by some fairly detailed computer simulations, but in the absence of more experimental (or empirical) information, this may prove little more than a therapeutic exercise.
In a similar vein, purely analytical approaches to this problem have used moment-closure techniques to produce some new insights (Grenfell et al. 1995). These approaches have been particularly important in emphasizing the role of differences in host exposure in creating heterogeneities in immunological response to infection. Yet, the degree of parasite aggregation produced by these models is still significantly different from those observed in empirical systems. This is to be expected, as the degree of model complexity becomes totally unwieldy if it also has to consider genetic differences in immunological competence, spatial differences in the distribution and survival of infective stages and dynamic interactions between these. The upside of all of these shortcomings in our current understanding of the processes determining heterogeneity in host-parasite systems is that attempting to understand them in any one experimental system will produce new insights into the dynamics of host-parasite systems that will be useful for a range of other systems.

39
References
Aitkin, M., D. Anderson, B. Francis, and J. Hinde. 1989. Statistical Modelling in GLIM. Oxford University Press, Oxford.
Alexander, H. M., P. H. Thrall, J. Antonovics, A. M. Jarosz, and P. V. Oudemans. 1996. Population dynamics and genetics of plant disease: A case study of anther-smut disease. Ecology 77:990-996.
Alexander, J., and W. H. Stimson. 1988. Sex Hormones and the course of parasitic infection. Parasitology Today 4:189-193.
Altizer, S. M. 1998. Ecological and evolutionary interactions between Monarch butterflies and the protozoan parasite, Ophryocystis elektroscirrha. PhD. University of Minnesota, Minnesota.
Altizer, S. M., K. S. Oberhauser, and L. P. Brower. 2000. Associations between host migration and the prevalence of a protozoan parasite in natural populations of adult monarch butterflies. Ecological Entomology 25:125-139.
Anderson, R. M., and J. A. Crombie. 1984. Experimental studies of age-prevalence curves for Schistosoma mansoni infections in populations of Biomphalaria galbrata. Parasitology 89:79-105.
Anderson, R. M., and D. M. Gordon. 1982. Processes influencing the distribution of parasite numbers within host populations with special emphasis on parasite-induced host mortalities. Parasitology 85:373-398.
Anderson, R. M., and R. M. May. 1978. Regulation and stability of host-parasite population interactions. I. Regulatory processes. Journal of Animal Ecology 47:219-247.
Anderson, R. M., and R. M. May. 1982a. Coevolution of hosts and parasites. Parasitology 85:411-426.
Anderson, R. M., and R. M. May, editors. 1982b. Population biology of infectious diseases. Springer Verlag, Berlin.
Anderson, R. M., and R. M. May. 1985. Age-related changes in the rate of disease transmission: implications for the design of vaccination programmes. Journal of Hygiene (Cambridge) 94:365-436.
Anderson, R. M., and R. M. May. 1991. Infectious disease of humans: dynamics and control. Oxford University Press, Oxford.
Anderson, T. J. C., M. S. Blouin, and R. N. Beech. 1998. Population biology of parasitic nematodes: applications of genetic markers. Pages 219-283 in Advances in Parasitology.
Anderson, T. J. C., and J. Jaenike. 1997. Host specificity, evolutionary relationships and macrogeographic differentiation among Ascaris populations from humans and pigs. Parasitology 115:325-342.
Anderson, T. J. C., R. Komuniecki, P. Komuniecki, and J. Jaenike. 1993c. Are mitochondria inherited paternally in Ascaris. Journal of Cellular Biochemistry:113-113.
Anderson, T. J. C., R. Komuniecki, P. R. Komuniecki, and J. Jaenike. 1995a. Are mitochondria inherited paternally in Ascaris. International Journal For Parasitology 25:1001-1004.
Anderson, T. J. C., M. E. Romeroabal, and J. Jaenike. 1993a. Genetic-structure and epidemiology of Ascaris populations - patterns of host affiliation in guatemala. Parasitology 107:319-334.
Anderson, T. J. C., M. E. Romeroabal, and J. Jaenike. 1995b. Mitochondrial-DNA and Ascaris microepidemiology - the composition of parasite populations from individual hosts, families and villages. Parasitology 110:221-229.
Anderson, T. J. C., C. A. Zizza, G. M. Leche, M. E. Scott, and N. W. Solomons. 1993b. The distribution of intestinal helminth infections in a rural village in guatemala. Memorias Do Instituto Oswaldo Cruz 88:53-65.
Andersson, M. 1994. Sexual selection. Princeton University Press, Princeton, New Jersey.
Apanius, V., D. Penn, P. R. Slev, L. R. Ruff, and W. K. Potts. 1997. The nature of selection on the major histocompatibility complex. Critical Reviews in Immunology 17:179-224.
Arneberg, P., A. Skorping, and A. F. Read. 1998a. Parasite abundance, body size, life histories and the energetic equivalence rule. American Naturalist 151:497-513.
Bartlett, M. S. 1956. Deterministic and stochastic models for recurrent epidemics. Pages 81-109 in J. Neyman, editor. Proceeding of the third Berkely symposium on mathematical statistics and probability. University of California Press, Berkeley.
Bellaby, T., K. Robinson, and D. Wakelin. 1996. Induction of differential T-helper-cell responses in mice infected with variants of the parasitic nematode Trichuris muris. Infection and Immunity 64:791-795.
Bellaby, T., K. Robinson, D. Wakelin, and J. M. Behnke. 1995. Isolates of Trichuris muris vary in their ability to elicit protective immune-responses to infection in mice. Parasitology 111:353-357.
Berding, C., A. E. Keymer, J. D. Murray, and A. F. G. Slater. 1986. The population-dynamics of acquired-immunity to helminth infection. Journal of Theoretical Biology 122:459-471.

40
Bliss, C. I., and R. A. Fisher. 1953. Fitting the negative binomial distribution to biological data. Biometrics 9:176-199.
Blouin, M. S. 1992a. Genetic correlations among morphometric traits and rates of growth and differentiation in the green tree frog, hyla-cinerea. Evolution 46:735-744.
Blouin, M. S. 1992b. Comparing bivariate reaction norms among species - time and size at metamorphosis in 3 species of hyla (anura, hylidae). Oecologia 90:288-293.
Blouin, M. S., J. B. Dame, C. A. Tarrant, and C. H. Courtney. 1992. Unusual population-genetics of a parasitic nematode - mtDna variation within and among populations. Evolution 46:470-476.
Blouin, M. S., C. A. Yowell, C. H. Courtney, and J. B. Dame. 1995. Host movement and the genetic-structure of populations of parasitic nematodes. Genetics 141:1007-1014.
Bolasfernandez, F., and D. Wakelin. 1992. Immunization against geographical isolates of Trichinella spiralis in mice. International Journal For Parasitology 22:773-781.
Boots, M., and M. Begon. 1993. Trade-offs with resistance to a granulosis-virus in the indian meal moth, examined by a laboratory evolution experiment. Functional Ecology 7:528-534.
Boxshall, G. A. 1974. The population dynamics of Lepeophtheirus pectoralis (Muller): dispersion pattern. Parasitology 69:373-390.
Boyd, H. E. G. 1999. Early development of parasitism in Soay sheep. Ph. D. University of Cambridge, Cambridge.
Brabin, L. 1992a. The epidemiologic significance of chagas-disease in women. Memorias Do Instituto Oswaldo Cruz 87:73-79.
Brabin, L. 1992b. Women and reproductive morbidity - (viewpoints of a workshop on strategies to prevent pelvic inflammatory disease) - introduction. Annals of Tropical Medicine and Parasitology 86:R5-R6.
Brabin, L. 1992c. Prevention of pid - a challenge for the health-service. Annals of Tropical Medicine and Parasitology 86:25-33.
Braisher, T. L. 1999. Genetic variation in trichostrongylid parasites of the Soay sheep of St. Kilda. Ph. D. University of Cambridge, Cambridge.
Breiman, L. 1996. Bagging predictors. Machine Learning 24:123-140.
Breiman, L., J. Friedman, R. Olshen, and C. Stone. 1984. Classification and Regression Trees. Wadsworth & Brookes/Cole, Pacifica Grove, CA.
Brown, S. P. 1999. Cooperation and conflict in host-manipulating parasites. Proceedings of the Royal Society of London Series B-Biological Sciences 266:1899-1904.
Buitkamp, J., P. Filmether, M. J. Stear, and J. T. Epplen. 1996. Class I and class II major histocompatibility complex alleles are associated with faecal egg counts following natural, predominantly Ostertagia circumcincta infection. Parasitology Research 82:693-696.
Bundy, D. A. P. 1988. Gender-dependant patterns of infection and disease. Parasitology Today 4:186-189.
Burdon, J. J. 1991. Fungal pathogens as selective forces in plant-populations and communities. Australian Journal of Ecology 16:423-432.
Carter, K. C., and P. A. G. Wilson. 1989. The course of infection in rats given small primary doses of Strongyloides ratti and Strongyloides venezuelensis. Journal of Helminthology 63:107-114.
Cattadori, I. M., P. J. Hudson, S. Merler, and A. Rizzoli 1999. Synchrony, scale and temporal dynamics of rock partridge (Alectoris graeca saxatilis) populations in the dolomites. Journal of Animal Ecology 68:540-549.
Clayton, D. H. 1991. The influence of parasites on host sexual selection. Parasitology Today 7:329-334.
Clayton, D. H., and D. M. Tompkins. 1994. Ectoparasite virulence is linked to mode of transmission. Proceedings of the Royal Society of London Series B-Biological Sciences 256:211-217.
Clutton-Brock, T. H., A. W. Illius, K. Wilson, B. T. Grenfell, A. D. C. MacColl, and S. D. Albon. 1997. Stability and instability in ungulate populations: an empirical analysis. American Naturalist 149:195-219.
Clutton-Brock, T. H., O. F. Price, S. D. Albon, and P. A. Jewell. 1991. Persistent instability and population regulation in soay sheep. Journal of Animal Ecology 60:593-608.
Coltman, D. W., D. R. Bancroft, A. Robertson, J. A. Smith, T. H. Clutton-Brock, and J. M. Pemberton. 1999b. Male reproductive success in a promiscuous mammal: behavioural estimates compared with genetic paternity. Molecular Ecology 8:1199-1209.
Coltman, D. W., J. G. Pilkington, J. A. Smith, and J. M. Pemberton. 1999a. Parasite-mediated selection against inbred Soay sheep in a free-living, island population. Evolution 53:1259-1267.
Coulson, T., E. J. Milner-Gulland, and T. Clutton-Brock. 2000. The relative roles of density and climatic variation on population dynamics and fecundity rates in three contrasting ungulate species. Proceedings of the Royal Society of London Series B-Biological Sciences 267:1771-1779.
Courchamp, F., L. Say, and D. Pontier. 2000. Detection, identification, and correction of a bias in an epidemiological study. Journal of Wildlife Diseases 36:71-78.
Crawley, M. J. 1993. GLIM for ecologists. Blackwell Scientific Publications, London.
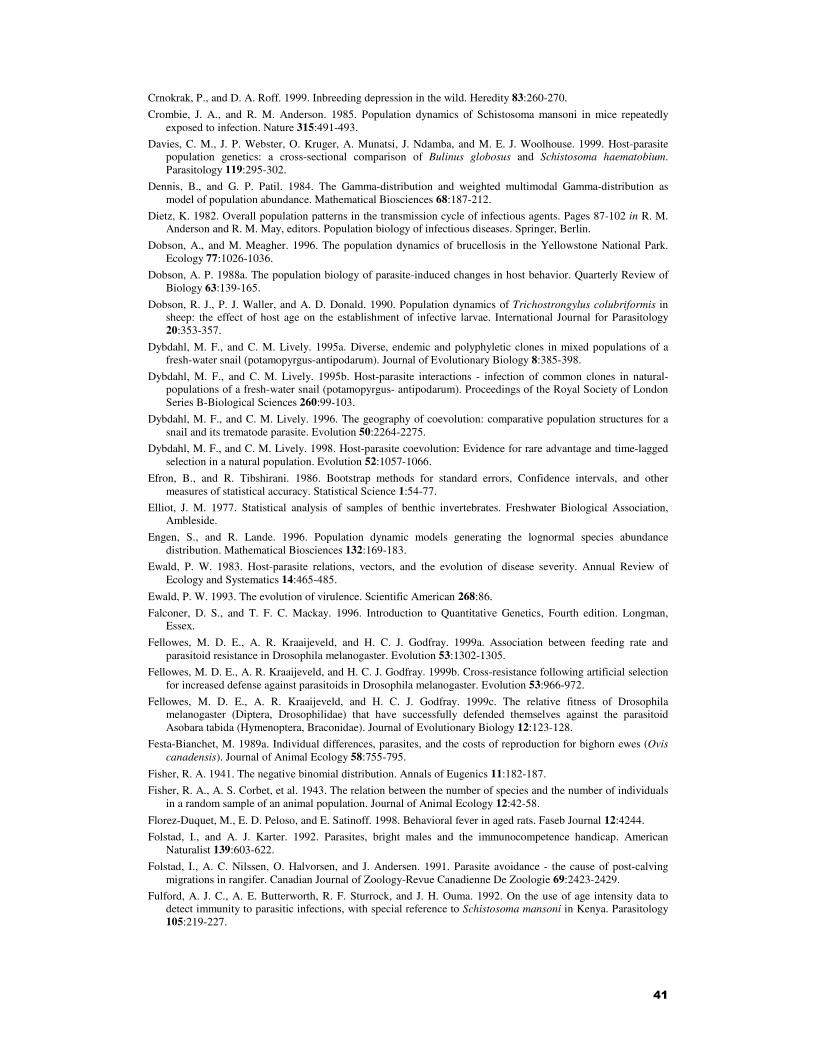
41
Crnokrak, P., and D. A. Roff. 1999. Inbreeding depression in the wild. Heredity 83:260-270.
Crombie, J. A., and R. M. Anderson. 1985. Population dynamics of Schistosoma mansoni in mice repeatedly exposed to infection. Nature 315:491-493.
Davies, C. M., J. P. Webster, O. Kruger, A. Munatsi, J. Ndamba, and M. E. J. Woolhouse. 1999. Host-parasite population genetics: a cross-sectional comparison of Bulinus globosus and Schistosoma haematobium. Parasitology 119:295-302.
Dennis, B., and G. P. Patil. 1984. The Gamma-distribution and weighted multimodal Gamma-distribution as model of population abundance. Mathematical Biosciences 68:187-212.
Dietz, K. 1982. Overall population patterns in the transmission cycle of infectious agents. Pages 87-102 in R. M. Anderson and R. M. May, editors. Population biology of infectious diseases. Springer, Berlin.
Dobson, A., and M. Meagher. 1996. The population dynamics of brucellosis in the Yellowstone National Park. Ecology 77:1026-1036.
Dobson, A. P. 1988a. The population biology of parasite-induced changes in host behavior. Quarterly Review of Biology 63:139-165.
Dobson, R. J., P. J. Waller, and A. D. Donald. 1990. Population dynamics of Trichostrongylus colubriformis in sheep: the effect of host age on the establishment of infective larvae. International Journal for Parasitology 20:353-357.
Dybdahl, M. F., and C. M. Lively. 1995a. Diverse, endemic and polyphyletic clones in mixed populations of a fresh-water snail (potamopyrgus-antipodarum). Journal of Evolutionary Biology 8:385-398.
Dybdahl, M. F., and C. M. Lively. 1995b. Host-parasite interactions - infection of common clones in natural-populations of a fresh-water snail (potamopyrgus- antipodarum). Proceedings of the Royal Society of London Series B-Biological Sciences 260:99-103.
Dybdahl, M. F., and C. M. Lively. 1996. The geography of coevolution: comparative population structures for a snail and its trematode parasite. Evolution 50:2264-2275.
Dybdahl, M. F., and C. M. Lively. 1998. Host-parasite coevolution: Evidence for rare advantage and time-lagged selection in a natural population. Evolution 52:1057-1066.
Efron, B., and R. Tibshirani. 1986. Bootstrap methods for standard errors, Confidence intervals, and other measures of statistical accuracy. Statistical Science 1:54-77.
Elliot, J. M. 1977. Statistical analysis of samples of benthic invertebrates. Freshwater Biological Association, Ambleside.
Engen, S., and R. Lande. 1996. Population dynamic models generating the lognormal species abundance distribution. Mathematical Biosciences 132:169-183.
Ewald, P. W. 1983. Host-parasite relations, vectors, and the evolution of disease severity. Annual Review of Ecology and Systematics 14:465-485.
Ewald, P. W. 1993. The evolution of virulence. Scientific American 268:86.
Falconer, D. S., and T. F. C. Mackay. 1996. Introduction to Quantitative Genetics, Fourth edition. Longman, Essex.
Fellowes, M. D. E., A. R. Kraaijeveld, and H. C. J. Godfray. 1999a. Association between feeding rate and parasitoid resistance in Drosophila melanogaster. Evolution 53:1302-1305.
Fellowes, M. D. E., A. R. Kraaijeveld, and H. C. J. Godfray. 1999b. Cross-resistance following artificial selection for increased defense against parasitoids in Drosophila melanogaster. Evolution 53:966-972.
Fellowes, M. D. E., A. R. Kraaijeveld, and H. C. J. Godfray. 1999c. The relative fitness of Drosophila melanogaster (Diptera, Drosophilidae) that have successfully defended themselves against the parasitoid Asobara tabida (Hymenoptera, Braconidae). Journal of Evolutionary Biology 12:123-128.
Festa-Bianchet, M. 1989a. Individual differences, parasites, and the costs of reproduction for bighorn ewes (Ovis canadensis). Journal of Animal Ecology 58:755-795.
Fisher, R. A. 1941. The negative binomial distribution. Annals of Eugenics 11:182-187.
Fisher, R. A., A. S. Corbet, et al. 1943. The relation between the number of species and the number of individuals in a random sample of an animal population. Journal of Animal Ecology 12:42-58.
Florez-Duquet, M., E. D. Peloso, and E. Satinoff. 1998. Behavioral fever in aged rats. Faseb Journal 12:4244.
Folstad, I., and A. J. Karter. 1992. Parasites, bright males and the immunocompetence handicap. American Naturalist 139:603-622.
Folstad, I., A. C. Nilssen, O. Halvorsen, and J. Andersen. 1991. Parasite avoidance - the cause of post-calving migrations in rangifer. Canadian Journal of Zoology-Revue Canadienne De Zoologie 69:2423-2429.
Fulford, A. J. C., A. E. Butterworth, R. F. Sturrock, and J. H. Ouma. 1992. On the use of age intensity data to detect immunity to parasitic infections, with special reference to Schistosoma mansoni in Kenya. Parasitology 105:219-227.

42
Fuxa, J. A., J. R. Fuxa, and A. R. Richter. 1998. Host-insect survival time and disintegration in relation to population density and dispersion of recombinant and wild-type nucleopolyhedroviruses. Biological Control 12:143-150.
Fuxa, J. R. 1989a. Importance of epizootiology to biological-control of insects with viruses. Memorias Do Instituto Oswaldo Cruz 84:81-88.
Fuxa, J. R. 1989b. Seasonal occurrence of spodoptera-frugiperda larvae on certain host plants in louisiana. Journal of Entomological Science 24:277-289.
Geman, S., E. Bienenstock, and R. Doursat. 1992. Neural networks and the bias variance dilemma. Neural Computation 4:1-58.
Gibbs, H. C. 1986. Hypobiosis in parasitic nematodes - an update. Advances in Parasitology 25:129-174.
Glinski, Z., and J. Jarosz. 2000. Disease resistance mechanisms of vascular plants. Medycyna Weterynaryjna 56:567-570.
Goyal, P. K., and D. Wakelin. 1993a. Influence of variation in host strain and parasite isolate on inflammatory and antibody-responses to trichinella-spiralis in mice. Parasitology 106:371-378.
Grafen, A., and M. E. J. Woolhouse. 1993. Does the negative binomial distribution add up? Parasitology Today 9:475-477.
Gregory, R. D., and M. E. J. Woolhouse. 1993. Quantification of parasite aggregation - a simulation study. Acta Tropica 54:131-139.
Grenfell, B. T., O. F. Price, S. D. Albon, and T. H. Cluttonbrock. 1992a. Overcompensation and population-cycles in an ungulate. Nature 355:823-826.
Grenfell, B. T., K. Wilson, B. F. Finkenstadt, T. N. Coulson, S. Murray, S. D. Albon, J. M. Pemberton, T. H. CluttonBrock, and M. J. Crawley. 1998. Noise and determinism in synchronized sheep dynamics. Nature 394:674-677.
Grenfell, B. T., K. Wilson, V. S. Isham, H. E. G. Boyd, and K. Dietz. 1995. Modelling patterns of parasite aggregation in natural populations: Trichostrongylid nematode-ruminant interactions as a case study. Parasitology 111:S135-S151.
Gross, W. G., P. B. Siegel, W. Hall, C. H. Domersmuth, and R. T. DuBoise. 1980. Production and persistence of antibodies in chickens to sheep erythrocytes. 2. resistance to infectious disease. Poultry Science 59:205-210.
Grossman, C. J. 1985. Interactions between the gonadal-steroids and the immune system. Science 227:257-261.
Gryseels, B. 1994. Human resistance to schistosome infection: age or experience? Parasitology Today 10:380-384.
Gulland, F. M. D. 1991b. Nematodirus species on St.Kilda. Veterinary Record 128:576-576.
Gulland, F. M. D. 1992. The role of nematode parasites in soay sheep (Ovis aries L.) mortality during a population crash. Parasitology 105:493-503.
Gulland, F. M. D., S. D. Albon, J. M. Pemberton, P. R. Moorcroft, and T. H. Cluttonbrock. 1993. Parasite-associated polymorphism in a cyclic ungulate population. Proceedings of the Royal Society of London Series B-Biological Sciences 254:7-13.
Gulland, F. M. D., and M. Fox. 1992. Epidemiology of nematode infections of Soay sheep(Ovis aries L.) on St. Kilda. Parasitology 105:481-492.
Halvorsen, O., and K. Andersen. 1984. The ecological interaction between arctic charr, Salvelinus alpinus (L.) and the plerocercoid stage of Diphyllobothrium ditremum. Journal of Fish Biology 25:305-316.
Hamilton, W. D., and M. Zuk. 1982. Heritable true fitness and bright birds: a role for parasites? Science 218:384-387.
Hamilton, W. J., and R. Poulin. 1997. The Hamilton and Zuk hypothesis revisited: a meta-analytical approach. Behaviour 134:299-320.
Harder, A., F. Wunderlich, and P. Marinovski. 1992a. Effects of testosterone on Heterakis spumosa infections in mice. Parasitology 105:335-342.
Hart, B. L. 1994a. Behavioral defense against parasites - interaction with parasite invasiveness. Parasitology 109:S139-S151.
Hart, B. L. 1997. Behavioural defence. Pages 59-77 in D. H. Clayton and J. Moore, editors. Host-Parasite Evolution: General Principles and Avian Models. Oxford University Press, Oxford.
Hart, R. C. 1994b. Equiproportional temperature-duration responses and thermal influences on distribution and species switching in the copepods metadiaptomus-meridianus and tropodiaptomus- spectabilis. Hydrobiologia 272:163-183.
Hasselquist, D., J. A. Marsh, P. W. Sherman, and J. C. Wingfield. 1999. Is avian humoral immunocompetence suppressed by testosterone? Behavioral Ecology and Sociobiology 45:167-175.
Haukisalmi, V., and H. Henttonen. 1993. Coexistence in helminths of the bank vole Clethrionomys glareolus: 1. Patterns of co-occurrence. Journal of Animal Ecology 62:221-229.

43
Herre, E. A. 1995. Factors affecting the evolution of virulence: nematode parasites of fig wasps as a case study. Parasitology 111:S179-S191.
Hillgarth, N., and J. C. Wingfield. 1997. Parasite-mediated sexual selection: endocrine aspects. Pages 78-104 in D. K. Clayton and J. Moore, editors. Host-parasite evolution: general principles and avian models. Oxford University Press, Oxford.
Holmes, P. H. 1985. Pathogenesis of trichostrongylosis. Veterinary Parasitology 18:89-101.
Hoodless, A. N., K. Kurtenbach, P. A. Nuttall, and S. E. Randolph. 1998. Ticks reduce pheasant fitness, with consequences for the transmission of Lyme disease spirochaetes. Proceedings of the Royal Society, Series B (submitted).
Hudson, P. J., and A. P. Dobson. 1995. Macroparasites: observed patterns. Pages 144-176 in B. T. Grenfell and A. P. Dobson, editors. Ecology of Infectious Diseases in Natural Populations. Cambridge University Press, Cambridge.
Hughes, V. L. 1998. The effect of testosterone on parasitic infections in rodents, with respect to disease transmission by ticks. D. Phil. Oxford University, Oxford.
Hutchings, M. R., I. J. Gordon, E. Robertson, I. Kyriazakis, and F. Jackson. 1999b. Species composition of sheep diets when grazing grass/clover swards: the effect of parasitic status and level of feeding motivation. Proceedings of the Nutrition Society 58:157A-157A.
Hutchings, M. R., I. Kyriazakis, D. H. Anderson, I. J. Gordon, and R. L. Coop. 1998. Behavioural strategies used by parasitized and non-parasitized sheep to avoid ingestion of gastro-intestinal nematodes associated with faeces. Animal Science 67:97-106.
Hutchings, M. R., I. Kyriazakis, D. H. Anderson, I. J. Gordon, and F. Jackson. 1999a. Grazing trade-offs between forage intake and faecal avoidance in sheep: the effect of sward height, parasitic status and level of feeding motivation. Proceedings of the Nutrition Society 58:157A-157A.
Hutchings, M. R., I. Kyriazakis, I. J. Gordon, and F. Jackson. 1999c. Trade-offs between nutrient intake and faecal avoidance in herbivore foraging decisions: the effect of animal parasitic status, level of feeding motivation and sward nitrogen content. Journal of Animal Ecology 68:310-323.
Hyde, J. E. 1990. Molecular Parasitology. Open University Press, Milton Keynes.
Jarosz, A. M., and J. J. Burdon. 1990. Predominance of a single major gene for resistance to phakopsora-pachyrhizi in a population of glycine-argyrea. Heredity 64:347-353.
John, J. L. 1997. The Hamilton-Zuk theory and initial test: an examination of some parasitological criticisms. International Journal For Parasitology 27:1269-1288.
Johnson, M. J., J. M. Behnke, and G. C. Coles. 1996. Detection of gastrointestinal nematodes by a coproantigen capture ELISA. Research in Veterinary Science 60:7-12.
Karban, R. 1998. Caterpillar basking behavior and nonlethal parasitism by tachinid flies. Journal of Insect Behavior 11:713-723.
Keith, L. B., J. R. Cary, T. M. Yuill, and I. M. Keith. 1985. Prevalence of helminths in a cyclic snowshoe hare population. Journal of Wildlife Diseases 21:233-253.
Kennedy, C. R. 1969. Seasonal incidence and development of the cestode Caryophyllaeus laticeps (Pallas) in the River Avon. Parasitology 59:783-794.
Keymer, A. E., and R. M. Anderson. 1979. The dynamics of infection of Tribolium confusum by Hymenolepis diminuta: the influence of infective-stage density and spatial distribution. Parasitology 79:195-207.
Klein, S. L. 2000. The effects of hormones on sex differences in infection: from genes to behavior. Neuroscience and Biobehavioral Reviews 24:627-638.
Klein, S. L., J. E. Hairston, A. C. DeVries, and R. J. Nelson. 1997. Social environment and steroid hormones affect species and sex differences in immune function among voles. Hormones and Behavior 32:30-39.
Klein, S. L., and R. J. Nelson. 1997. Sex differences in immunocompetence differ between two Peromyscus species. American Journal of Physiology-Regulatory Integrative and Comparative Physiology 42:R655-R660.
Klein, S. L., and R. J. Nelson. 1998. Sex and species differences in cell-mediated immune responses in voles. Canadian Journal of Zoology-Revue Canadienne De Zoologie 76:1394-1398.
Klein, S. L., and R. J. Nelson. 1999. Influence of social factors on immune function and reproduction. Reviews of Reproduction 4:168-178.
Kloosterman, A., H. K. Parmentier, and H. W. Ploeger. 1992. Breeding cattle and sheep for resistance to gastrointestinal nematodes. Parasitology Today 8:330-335.
Kodricbrown, A., and J. H. Brown. 1984. Truth in advertising - the kinds of traits favored by sexual selection. American Naturalist 124:309-323.
Kolmer, J. A. 1996. Genetics of resistance to wheat leaf rust. Annual Review of Phytopathology 34:435-455.
Kraaijeveld, A. R., and H. C. J. Godfray. 1997. Trade-off between parasitoid resistance and larval competitive ability in Drosophila melanogaster. Nature 389:278-280.

44
Kyriazakis, I., B. J. Tolkamp, and M. R. Hutchings. 1998. Towards a functional explanation for the occurrence of anorexia during parasitic infections. Animal Behaviour 56:265-274.
Lively, C. M., and M. F. Dybdahl. 2000. Parasite adaptation to locally common host genotypes. Nature 405:679-681.
Lloyd, M. 1967. Mean crowding. U 36:1-30.
Lloyd, S., and E. J. L. Soulsby. 1987. Immunobiology of gastrointestinal nematodes of ruminants. Pages 1-41 in E. J. L. Soulsby, editor. Immune Responses in Parasitic Infections: Immunology, Immunopathology and Immunoprophylaxis. CRC Press, Boca Raton, Florida.
Lythgoe, K. A., and A. F. Read. 1998. Catching the Red Queen? The advice of the rose. Trends in Ecology & Evolution 13:473-474.
Malgor, R., N. Nonaka, I. Basmadjian, H. Sakai, B. Carambula, Y. Oku, C. Carmona, and M. Kamiya. 1997. Coproantigen detection in dogs experimentally and naturally infected with Echinococcus granulosus by a monoclonal antibody- based enzyme-linked immunosorbent assay. International Journal For Parasitology 27:1605-1612.
May, R. M., and R. M. Anderson. 1978. Regulation and stability of host-parasite population interactions. II. Destabilising processes. Journal of Animal Ecology 47:249-267.
May, R. M., and R. M. Anderson. 1983. Epidemiology and genetics in the coevolution of parasites and hosts. Proceedings of the Royal Society of London Series B-Biological Sciences 219:281-313.
McCullagh, P. 1983. Quasi-likelihood functions. Annals of Statistics 11:59-67.
McCurdy, D. G., D. Shutler, A. Mullie, and M. R. Forbes. 1998. Sex-biased parasitism of avian hosts: relations to blood parasite taxon and mating system. Oikos 82:303-312.
Merler, S., C. Furlanello, C. Chemini, and G. Nicolini. 1996. Classification tree methods for analysis of mesoscale distribution of Ixodes ricinus (Acari: Ixodidae) in Trentino, Italian Alps. Journal of Medical Entomology 33:888-893.
Michel, J. F. 1974. Arrested development of nematodes and some related phenomena. Advances in Parasitology 12:279-343.
Møller, A. P. 1990a. Changes in the size of avian breeding territories in relation to the nesting cycle. Animal Behaviour 40:1070-1079.
Møller, A. P. 1990b. Fluctuating asymmetry in male sexual ornaments may reliably reveal male quality. Animal Behaviour 40:1185-1187.
Møller, A. P. 1990c. Parasites and sexual selection - current status of the hamilton and zuk hypothesis. Journal of Evolutionary Biology 3:319-328.
Møller, A. P. 1990d. Sexual-behavior is related to badge size in the house sparrow Passer domesticus. Behavioral Ecology and Sociobiology 27:23-29.
Møller, A. P., A. Barbosa, J. J. Cuervo, F. de Lope, S. Merino, and N. Saino. 1998c. Sexual selection and tail streamers in the barn swallow. Proceedings of the Royal Society of London Series B-Biological Sciences 265:409-414.
Møller, A. P., R. Dufva, and J. Erritzoe. 1998a. Host immune function and sexual selection in birds. Journal of Evolutionary Biology 11:703-719.
Møller, A. P., N. Saino, G. Taramino, P. Galeotti, and S. Ferrario. 1998d. Paternity and multiple signaling: effects of a secondary sexual character and song on paternity in the barn swallow. American Naturalist 151:236-242.
Møller, A. P., G. Sorci, and J. Erritzoe. 1998b. Sexual dimorphism in immune defense. American Naturalist 152:605-619.
Monagas, W. R., and R. E. Gatten. 1983. Behavioral fever in the turtles Terrapene carolina and Chrysemys picta. Journal of Thermal Biology 8:285-288.
Moore, J. 1984. Altered behavioral-responses in intermediate hosts - an acanthocephalan parasite strategy. American Naturalist 123:572-577.
Moore, J., and N. J. Gotelli. 1990. A phylogenetic perspective on the evolution of altered host behaviours. in C. J. Barnard and J. M. Behnke, editors. Parasitism and Host Behaviour. Taylor & Francis, London.
Moore, J., and N. J. Gotelli. 1996. Evolutionary patterns of altered behavior and susceptibility in parasitized hosts. Evolution 50:807-819.
Muller, C. B., and P. Schmidhempel. 1993. Exploitation of cold temperature as defense against parasitoids in bumblebees. Nature 363:65-67.
Muller-Graf, C. D. M., D. A. Collins, C. Packer, and M. E. J. Woolhouse. 1997. Schistosoma mansoni infection in a natural population of olive baboons (Papio cynocephalus anubis) in Gombe Stream National Park, Tanzania. Parasitology 115:621-627.
Mulvey, M., J. M. Aho, C. Lydeard, P. L. Leberg, and M. H. Smith. 1991. Comparative population genetic-structure of a parasite (Fascioloides magna) and its definitive host. Evolution 45:1628-1640.

45
Mutapi, F., P. D. Ndhlovu, P. Hagan, and M. E. J. Woolhouse. 1997. A comparison of humoral responses to Schistosoma haematobium in areas with low and high levels of infection. Parasite Immunology 19:255-263.
Nilssen, A. C., R. E. Haugerud, and I. Folstad. 1998. No interspecific covariation in intensities of macroparasites of reindeer, Rangifer tarandus (L.). Parasitology 117:273-281.
Nolan, P. M., G. E. Hill, and A. M. Stoehr. 1998. Sex, size, and plumage redness predict house finch survival in an epidemic. Proceedings of the Royal Society of London Series B-Biological Sciences 265:961-965.
Nonaka, N., H. Tsukada, N. Abe, Y. Oku, and M. Kamiya. 1998. Monitoring of Echinococcus multilocularis infection in red foxes in Shiretoko, Japan, by coproantigen detection. Parasitology 117:193-200.
Norris, K., and M. R. Evans. 2000. Ecological immunology: life history trade-offs and immune defense in birds. Behavioral Ecology 11:19-26.
Okimoto, R., J. L. Macfarlane, and D. R. Wolstenholme. 1994. The mitochondrial ribosomal-rna genes of the nematodes caenorhabditis-elegans and ascaris-suum - consensus secondary- structure models and conserved nucleotide sets for phylogenetic analysis. Journal of Molecular Evolution 39:598-613.
Owens, I. P. F., and K. Wilson. 1999. Immunocompetence: a neglected life history trait or conspicuous red herring? Trends in Ecology & Evolution 14:170-172.
Pacala, S. W., and A. P. Dobson. 1988. The relation between the number of parasites host and host age: population dynamic causes and maximum likelihood estimation. Parasitology 96:197-210.
Paterson, S., K. Wilson, and J. M. Pemberton. 1998. Major histocompatibility complex variation associated with juvenile survival and parasite resistance in a large unmanaged ungulate population (Ovis aries L.). Proceedings of the National Academy of Sciences of the United States of America 95:3714-3719.
Pemberton, J. M., J. A. Smith, T. N. Coulson, T. C. Marshall, J. Slate, S. Paterson, S. D. Albon, and T. H. CluttonBrock. 1996. The maintenance of genetic polymorphism in small island populations: large mammals in the Hebrides. Philosophical Transactions of the Royal Society of London Series B-Biological Sciences 351:745-752.
Pennycuick, L. 1971. Frequency distributions of parasites in a population of three-spined sticklebacks, Gasterosteus aculeatus L., with particular reference to the negative binomial distribution. Parasitology 63:389-406.
Poole, B. C., K. Chadee, and T. A. Dick. 1983. Helminth parasites of pine marten, Martes americana (Turton), from Manitoba, Canada. Journal of Wildlife Diseases 19:10-13.
Poulin, R. 1993a. The disparity between observed and uniform distributions - a new look at parasite aggregation. International Journal For Parasitology 23:937-944.
Poulin, R. 1993b. Age-dependent effects of parasites on antipredator responses in 2 new-zealand fresh-water fish. Oecologia 96:431-438.
Poulin, R. 1994a. The evolution of parasite manipulation of host behavior - a theoretical-analysis. Parasitology 109:S109-S118.
Poulin, R. 1994c. Mate choice decisions by parasitized female upland bullies, Gobiomorphus breviceps. Proceedings of the Royal Society of London Series B-Biological Sciences 256:183-187.
Poulin, R. 1996a. Sexual inequalities in helminth infections: a cost of being male? American Naturalist 147:287-295.
Poulin, R. 1996b. Sexual size dimorphism and transition to parasitism in copepods. Evolution 50:2520-2523.
Poulin, R. 2000. Manipulation of host behaviour by parasites: a weakening paradigm? Proceedings of the Royal Society of London Series B-Biological Sciences 267:787-792.
Poulin, R., J. Brodeur, and J. Moore. 1994b. Parasite manipulation of host behavior - should hosts always lose. Oikos 70:479-484.
Promislow, D. E. L. 1992. Costs of sexual selection in natural populations of mammals. Proceedings of the Royal Society of London, Series B- Biological Science 247.
Promislow, D. E. L., R. Montgomerie, and T. E. Martin. 1992. Mortality costs of sexual dimorphism in birds. Proceedings of the Royal Society of London, Series B- Biological Science 250:143-150.
Quinnell, R. J., C. Dye, and J. J. Shaw. 1992. Host preferences of the phlebotomine sandfly lutzomyia- longipalpis in amazonian brazil. Medical and Veterinary Entomology 6:195-200.
Randolph, S. E. 1975. Patterns of distribution of the tick Ixodes trianguliceps Birula on its hosts. Journal of Animal Ecology 44:451-474.
Randolph, S. E. 1977. Changing spatial relationships in a population of Apodemus sylvaticus with the onset of breeding. Journal of Animal Ecology 46:653-676.
Read, A. F. 1988. Sexual selection and the role of parasites. Trends in Ecology & Evolution 3:97-102.
Read, A. F. 1990. Parasites and the evolution of host sexual behaviour. Pages 117-157 in C. J. Barnard and J. M. Behnke, editors. Parasitism and Host Behaviour. Taylor & Francis, London.
46
Read, A. F., S. d. Albon, J. Antonovics, V. Apanius, G. Dwyer, R. D. Holt, O. Judson, C. M. Lively, A. Martin-Lof, A. R. McLean, J. A. J. Metz, P. Schmid-Hempel, P. H. Thrall, S. Via, and K. Wilson. 1995. Genetics and evolution of infectious diseases in natural populations. Pages 450-477 in B. T. Grenfell and A. P. Dobson, editors. Ecology of infectious diseases in natural populations. Cambridge University Press, Cambridge.
Read, A. F., and M. E. Viney. 1996. Helminth immunogenetics : why bother. Parasitology Today 12:337-343.
Roitt, I., J. Brostoff, and D. Male. 1998. Immunology, 5th edition. Mosby, London.
Ruppert, D., M. P. Wand, U. Holst, and O. Hössjer. 1997. Local polynomial variance-function estimation. Technometrics 39:262-273.
Saino, N., A. P. Møller, and A. M. Bolzern. 1995. Testosterone effects on the immune system and parasite infestations in the barn swallow (Hirundo rustica): an experimental test of the immunocompetence hypothesis. Behavioral Ecology 6:397-404.
Schalk, G., and M. R. Forbes. 1997. Male biases in parasitism of mammals: effects of study type, host age, and parasite taxon. Oikos 78:67-74.
Schwaiger, F. W., D. Gostomski, M. J. Stear, J. L. Duncan, Q. A. McKellar, J. T. Epplen, and J. Buitkamp. 1995. An ovine major histocompatibility complex drb1 allele is associated with low fecal egg counts following natural, predominantly ostertagia-circumcincta infection. International Journal For Parasitology 25:815-822.
Scott, M. E. 1987a. Temporal changes in aggregation: a laboratory study. Parasitology 94:583-595.
Shaw, D. J., and A. P. Dobson. 1995. Patterns of macroparasite abundance and aggregation in wildlife populations: a quantitative review. Parasitology 111:S 111-S 133.
Shaw, D. J., B. T. Grenfell, and A. P. Dobson. 1998. Patterns of macroparasite aggregation in wildlife host populations. Parasitology 117:597-610.
Siegel, P. B., and W. B. Gross. 1980. Production and persistence of antibodies in chickens to sheep erythrocytes. 1. directional selection. Poultry Science 59:1-5.
Siva-Jothy, M. T., and F. Skarstein. 1998. Towards a functional understanding of "good genes". Ecology Letters 1:178-185.
Smith, G., and B. T. Grenfell. 1994. Modelling of parasite populations: gastrointestinal nematode models. Veterinary Parasitology 54:127-143.
Smith, J. A. 1996. Polymorphism, parasites and fitness in Soay sheep. University of Cambridge, Cambridge.
Smith, J. A., K. Wilson, J. G. Pilkington, and J. M. Pemberton. 1999. Heritable variation in resistance to gastro-intestinal nematodes in an unmanaged mammal population. Proceedings of the Royal Society of London Series B-Biological Sciences 266:1283-1290.
Sorci, G., A. P. Møller, and T. Boulinier. 1997. Genetics of host-parasite interactions. Trends in Ecology & Evolution 12:196-200.
Southwood, T. R. E. 1966. Ecological methods. Chapman & Hall, London.
Stear, M. J., K. Bairden, S. C. Bishop, J. L. Duncan, S. K. Karimi, Q. A. McKellar, and M. Murray. 1995d. Different patterns of fecal egg output following infection of scottish blackface lambs with ostertagia-circumcincta. Veterinary Parasitology 59:29-38.
Stear, M. J., K. Bairden, S. C. Bishop, G. Gettinby, Q. A. McKellar, M. Park, S. Strain, and D. S. Wallace. 1998. The processes influencing the distribution of parasitic nematodes among naturally infected lambs. Parasitology 117:165-171.
Stear, M. J., K. Bairden, J. L. Duncan, G. Gettinby, Q. A. McKellar, M. Murray, and D. S. Wallace. 1995b. The distribution of fecal nematode egg counts in scottish- blackface lambs following natural, predominantly ostertagia- circumcincta infection. Parasitology 110:573-581.
Stear, M. J., K. Bairden, J. L. Duncan, and M. Murray. 1995e. A comparison of the responses to repeated experimental infections with haemonchus-contortus among scottish blackface lambs. Veterinary Parasitology 60:69-81.
Stear, M. J., S. C. Bishop, M. Doligalska, J. L. Duncan, P. H. Holmes, J. Irvine, L. McCririe, Q. A. McKellar, E. Sinski, and M. Murray. 1995c. Regulation of egg production, worm burden, worm length and worm fecundity by host responses in sheep infected with Ostertagia circumcincta. Parasite Immunology 17:643-652.
Stear, M. J., S. C. Bishop, J. L. Duncan, Q. A. McKellar, and M. Murray. 1995a. The repeatability of fecal egg counts, peripheral eosinophil counts, and plasma pepsinogen concentrations during deliberate infections with Ostertagia circumcincta. International Journal For Parasitology 25:375-380.
Stear, M. J., and M. Murray. 1994. Genetic-resistance to parasitic disease - particularly of resistance in ruminants to gastrointestinal nematodes. Veterinary Parasitology 54:161-176.
Stear, M. J., and D. Wakelin. 1998. Genetic resistance to parasitic infection. Revue Scientifique Et Technique De L Office International Des Epizooties 17:143-153.
Stenseth, N. C., and J. Maynard Smith. 1984. Coevolution in ecosystems - red queen evolution or stasis. Evolution 38:870-880.

47
Taylor, A. J., C. B. Muller, and H. C. J. Godfray. 1998d. Effect of aphid predators on oviposition behavior of aphid parasitoids. Journal of Insect Behavior 11:297-302.
Taylor, D. R., A. M. Jarosz, R. E. Lenski, and D. W. Fulbright. 1998a. The acquisition of hypovirulence in host-pathogen systems with three trophic levels. The American Naturalist 151:343-355.
Taylor, L. H., M. J. Mackinnon, and A. F. Read. 1998c. Virulence of mixed-clone and single-clone infections of the rodent malaria Plasmodium chabaudi. Evolution 52:583-591.
Taylor, L. H., and A. F. Read. 1997. Why so few transmission stages? Reproductive restraint by malaria parasites. Parasitology Today 13:135-140.
Taylor, L. H., and A. F. Read. 1998. Determinants of transmission success of individual clones from mixed-clone infections of the rodent malaria parasite, Plasmodium chabaudi. International Journal For Parasitology 28:719-725.
Taylor, L. R. 1961. Aggregation, variance and the mean. Nature 189:732-735.
Taylor, L. R., and R. A. J. Taylor. 1977. Aggregation, migration and population dynamics. Nature 265:415-421.
Taylor, L. R., R. A. J. Taylor, I. P. Woiwod, and J. N. Perry. 1983. Behavioral dynamics. Nature 303:801-804.
Taylor, M. I., G. F. Turner, R. L. Robinson, and J. R. Stauffer. 1998b. Sexual selection, parasites and bower height skew in a bower- building cichlid fish. Animal Behaviour 56:379-384.
Thompson, J. N., and J. J. Burdon. 1992. Gene-for-gene coevolution between plants and parasites. Nature 360:121-125.
Thompson, S. N., and M. Kavaliers. 1994. Physiological bases for parasite-induced alterations of host behavior. Parasitology 109:S119-S138.
Thrall, P., and J. Antonovics. 1997. Polymorphism in sexual vs nonsexual disease transmission. Proceedings of the Royal Society of London Series B: Biological Science 264:581-587.
Tinsley, R. C. 1989. The effects of host sex on transmission success. Parasitology Today 5:190-195.
Tokeshi, M. 1995. On the mathematical basis of variance-mean power relationship. Researches on population ecology 37:43-48.
Van Valen, L. 1973. A new evolutionary law. Evolutionary Theory 1:1-30.
Verhulst, S., S. J. Dieleman, and H. K. Parmentier. 1999. A trade-off between immunocompetence and sexual ornamentation in domestic fowl. Pages 4478-4481 in Proceedings of the National Academy of Science of the USA.
Viney, M. 1999b. Long live the weeds. Natural History 108:104.
Viney, M. E. 1999a. Exploiting the life cycle of Strongyloides ratti. Parasitology Today 15:231-235.
Wakelin, D., and J. Blackwell. 1988. The genetics of resistance to bacterial and parasitic infection. Taylor & Francis, London.
Wakelin, D., and P. K. Goyal. 1996. Trichinella isolates: parasite variability and host responses. International Journal For Parasitology 26:471-481.
Webster, J. P., and M. E. J. Woolhouse. 1999. Cost of resistance: relationship between reduced fertility and increased resistance in a snail-schistosome host-parasite system. Proceedings of the Royal Society of London Series B-Biological Sciences 266:391-396.
Wedekind, C. 1994. Handicaps not obligatory in sexual selection for resistance genes. Journal of Theoretical Biology 170:57-62.
Wedekind, C., and P. J. Jakobsen. 1998. Male-biased susceptibility to helminth infection: an experimental test with a copepod. Oikos 81:458-462.
Weigensberg, I., and D. A. Roff. 1996. Natural heritabilities: can they be reliably estimated in the laboratory? Evolution 50:2149-2157.
Williams-Blangero, S., and J. L. Vandeberg. 1998. Finding the genes that determine susceptibility to parasitic diseases: combining anthropology and genetic epidemiology. American Journal of Human Biology 10:163.
Williams-Blangero, S., J. L. Vandeberg, J. Blangero, and A. R. L. Teixeira. 1999b. Genetic epidemiological approaches to understanding the determinants of susceptibility to Chagas' disease in rural Brazil. American Journal of Physical Anthropology:278-278.
Wilson, K. 1994. Analysis of worm and egg counts from the 1992 crash. Unpublished Report University of Cambridge.
Wilson, K., and B. T. Grenfell. 1997. Generalised linear modelling for parasitologists. Parasitology Today 13:33-38.
Wilson, K., B. T. Grenfell, and D. J. Shaw. 1996. Analysis of aggregated parasite distributions: a comparison of methods. Functional Ecology 10:592-601.
Woolhouse, M. E. J. 1991. On the application of mathematical-models of schistosome transmission dynamics .1. natural transmission. Acta Tropica 49:241-270.

48
Woolhouse, M. E. J. 1998. Patterns in parasite epidemiology: The peak shift. Parasitology Today 14:428-434.
Woolhouse, M. E. J., C. Dye, J. F. Etard, T. Smith, J. D. Charlwood, G. P. Garnett, P. Hagan, J. L. K. Hii, P. D. Ndhlovu, R. J. Quinnell, C. H. Watts, S. K. Chandiwana, and R. M. Anderson. 1997. Heterogeneities in the transmission of infectious agents: implications for the design of control programs. Proceedings of the National Academy of Sciences of the United States of America 94:338-342.
Yan, G., D. W. Severson, and B. M. Christensen. 1997. Costs and benefits of mosquito refractoriness to malaria parasites: Implications for genetic variability of mosquitoes and genetic control of malaria. Evolution 51:441-450.
Yu, I. C., J. Parker, and A. F. Bent. 1998. Gene-for-gene disease resistance without the hypersensitive response in Arabidopsis dnd1 mutant. Proceedings of the National Academy of Sciences of the United States of America 95:7819-7824.
Zahavi, A. 1975. Mate selection - a selection for handicap. Journal of Theoretical Biology 53:205-214.
Zohar, A. S., and M. E. Rau. 1986. The role of muscle larvae of Trichinella spiralis in the behavioral alterations of the mouse host. Journal of Parasitology 72:464-466.
Zuk, M. 1990. Reproductive strategies and disease susceptibility: an evolutionary viewpoint. Parasitology Today 6:231-233.
Zuk, M. 1992. The role of parasites in sexual selection - current evidence and future-directions. Advances in the Study of Behavior 21:39-68.
Zuk, M., and K. A. McKean. 1996. Sex differences in parasite infections: patterns and processes. International Journal For Parasitology 26:1009-1023.