Chapter 18 - Midwest · Draft for Public Comment Chapter 18 – Midwest (V. 11 Jan 2013) DRAFT FOR...
38
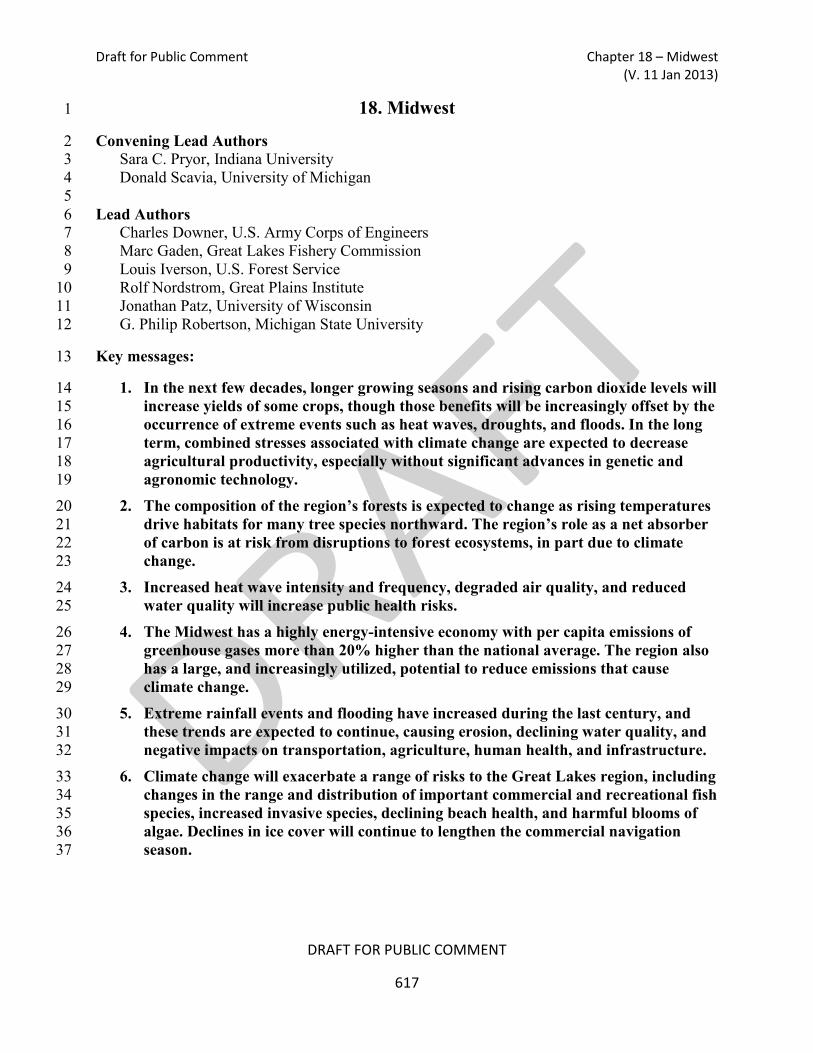
Draft for Public Comment Chapter 18 – Midwest (V. 11 Jan 2013) DRAFT FOR PUBLIC COMMENT 617 18. Midwest 1 Convening Lead Authors 2 Sara C. Pryor, Indiana University 3 Donald Scavia, University of Michigan 4 5 Lead Authors 6 Charles Downer, U.S. Army Corps of Engineers 7 Marc Gaden, Great Lakes Fishery Commission 8 Louis Iverson, U.S. Forest Service 9 Rolf Nordstrom, Great Plains Institute 10 Jonathan Patz, University of Wisconsin 11 G. Philip Robertson, Michigan State University 12 Key messages: 13 1. In the next few decades, longer growing seasons and rising carbon dioxide levels will 14 increase yields of some crops, though those benefits will be increasingly offset by the 15 occurrence of extreme events such as heat waves, droughts, and floods. In the long 16 term, combined stresses associated with climate change are expected to decrease 17 agricultural productivity, especially without significant advances in genetic and 18 agronomic technology. 19 2. The composition of the region’s forests is expected to change as rising temperatures 20 drive habitats for many tree species northward. The region’s role as a net absorber 21 of carbon is at risk from disruptions to forest ecosystems, in part due to climate 22 change. 23 3. Increased heat wave intensity and frequency, degraded air quality, and reduced 24 water quality will increase public health risks. 25 4. The Midwest has a highly energy-intensive economy with per capita emissions of 26 greenhouse gases more than 20% higher than the national average. The region also 27 has a large, and increasingly utilized, potential to reduce emissions that cause 28 climate change. 29 5. Extreme rainfall events and flooding have increased during the last century, and 30 these trends are expected to continue, causing erosion, declining water quality, and 31 negative impacts on transportation, agriculture, human health, and infrastructure. 32 6. Climate change will exacerbate a range of risks to the Great Lakes region, including 33 changes in the range and distribution of important commercial and recreational fish 34 species, increased invasive species, declining beach health, and harmful blooms of 35 algae. Declines in ice cover will continue to lengthen the commercial navigation 36 season. 37
Transcript of Chapter 18 - Midwest · Draft for Public Comment Chapter 18 – Midwest (V. 11 Jan 2013) DRAFT FOR...
Draft for Public Comment Chapter 18 – Midwest (V. 11 Jan 2013)
DRAFT FOR PUBLIC COMMENT
617
18. Midwest 1
Convening Lead Authors 2 Sara C. Pryor, Indiana University 3 Donald Scavia, University of Michigan 4
5 Lead Authors 6
Charles Downer, U.S. Army Corps of Engineers 7 Marc Gaden, Great Lakes Fishery Commission 8 Louis Iverson, U.S. Forest Service 9 Rolf Nordstrom, Great Plains Institute 10 Jonathan Patz, University of Wisconsin 11 G. Philip Robertson, Michigan State University 12
Key messages: 13
1. In the next few decades, longer growing seasons and rising carbon dioxide levels will 14 increase yields of some crops, though those benefits will be increasingly offset by the 15 occurrence of extreme events such as heat waves, droughts, and floods. In the long 16 term, combined stresses associated with climate change are expected to decrease 17 agricultural productivity, especially without significant advances in genetic and 18 agronomic technology. 19
2. The composition of the region’s forests is expected to change as rising temperatures 20 drive habitats for many tree species northward. The region’s role as a net absorber 21 of carbon is at risk from disruptions to forest ecosystems, in part due to climate 22 change. 23
3. Increased heat wave intensity and frequency, degraded air quality, and reduced 24 water quality will increase public health risks. 25
4. The Midwest has a highly energy-intensive economy with per capita emissions of 26 greenhouse gases more than 20% higher than the national average. The region also 27 has a large, and increasingly utilized, potential to reduce emissions that cause 28 climate change. 29
5. Extreme rainfall events and flooding have increased during the last century, and 30 these trends are expected to continue, causing erosion, declining water quality, and 31 negative impacts on transportation, agriculture, human health, and infrastructure. 32
6. Climate change will exacerbate a range of risks to the Great Lakes region, including 33 changes in the range and distribution of important commercial and recreational fish 34 species, increased invasive species, declining beach health, and harmful blooms of 35 algae. Declines in ice cover will continue to lengthen the commercial navigation 36 season. 37

Draft for Public Comment Chapter 18 – Midwest (V. 11 Jan 2013)
DRAFT FOR PUBLIC COMMENT
618
Introduction 1 The Midwest has a population of over 61million people (about 20% of the national total) and 2 generates a regional gross domestic product of over 26 trillion dollars (about 19% of the national 3 total) (Pryor and Barthelmie 2012). The Midwest is home to expansive agricultural lands, forests 4 in the north, the Great Lakes, substantial industrial activity, and some of America’s great cities, 5 including eight of the nation’s 50 most populous cities. Each has been impacted by shifts in 6 population, socioeconomic changes, air and water pollution, and landscape evolution, and each 7 exhibits vulnerability to both climate variability and climate change. 8
In general, climate change will tend to amplify existing risks from climate to people, ecosystems, 9 and infrastructure in the Midwest. Direct effects of increased heat stress, flooding, drought, and 10 late spring freezes on natural and managed ecosystems may be altered by changes in pests and 11 disease prevalence, increased competition from non-native or opportunistic native species, 12 ecosystem disturbances, land-use change, landscape fragmentation, atmospheric pollutants, and 13 economic shocks such as crop failures or reduced yields due to extreme weather events. These 14 added stresses, when taken collectively, are projected to alter the ecosystem and socioeconomic 15 patterns and processes in ways that most people in the region would consider detrimental. 16
Climate change may also augment or intensify other stresses on vegetation encountered in urban 17 environments, including increased atmospheric pollution, heat island effects, salt damage, a 18 highly variable water cycle, and frequent exposure to new pests and diseases. Much of the 19 region’s fisheries, recreation, tourism, and commerce depend on the Great Lakes and expansive 20 northern forests, which already face pollution and invasive species pressure – pressures 21 exacerbated by climate change. Most of the region’s population lives in urban environments, 22 with aging infrastructure, that are particularly vulnerable to climate-related flooding and life-23 threatening heat waves. Some cities within the region are already engaged in the process of 24 capacity building or are actively building resilience to the threats posed by climate change. 25 Although the region’s highly energy-intensive economy emits a disproportionately large amount 26 of gases responsible for warming the climate (also called greenhouse or heat-trapping gases), it 27 also has a large, and increasingly realized, potential to reduce them. 28
The rate of warming in the Midwest has markedly accelerated over the past few decades. 29 Between 1900 and 2010, the average Midwest air temperature increased by more than 1°F. 30 However, between 1950 and 2010, the average temperature increased twice as quickly, and 31 between 1980 and 2010 it increased three times as quickly (Pryor and Barthelmie 2012). 32 Warming has been more rapid at night and during winter. These trends are consistent with the 33 projected effects of increased concentrations of heat-trapping gases, and the spatial variability of 34 trends is also influenced by land-use changes and increased use of irrigation (Pan et al. 2009; 35 Pryor and Barthelmie 2012). The amount of future warming will depend on changes in the 36 atmospheric concentration of heat-trapping gases. Projections for regionally averaged 37 temperature increases by the middle of the century (2046-2065) relative to 1979-2000 are 38 approximately 3.8°F for a scenario with substantial emissions reductions (B1), and 4.9°F for the 39 current high emissions trend scenario (A2). The projections for the end of the century (2081-40 2100) are approximately 5.6°F for the low emission scenario, and 8.5°F for the high emission 41 scenario (Pryor et al. in press). 42

Draft for Public Comment Chapter 18 – Midwest (V. 11 Jan 2013)
DRAFT FOR PUBLIC COMMENT
619
1 Figure 18.1: Temperatures are Rising in the Midwest 2
Caption: Annual average temperatures across the Midwest show a trend towards 3 increasing temperature. The trend calculated over the period 1895-2010 is equal to an 4 increase of 1.5°F. (Figure and data from NOAA NCDC / CICS-NC) 5
In 2011, 11 of the 14 U.S. weather-related disasters with damages of more than $1 billion 6 affected the Midwest (http://www.noaa.gov/extreme2011/). Several types of extreme weather 7 events have already increased in frequency or intensity due to climate change and further 8 increases are projected (Rahmstorf and Coumou 2011). 9
Impacts to Agriculture 10
In the next few decades, longer growing seasons and rising carbon dioxide levels will 11 increase yields of some crops, though those benefits will be increasingly offset by the 12 occurrence of extreme events such as heat waves, droughts, and floods. In the long-term, 13 combined stresses associated with climate change are expected to decrease agricultural 14 productivity, especially without significant advances in genetic and agronomic technology. 15 Agriculture dominates Midwest land use, with more than two-thirds of land designated as 16 farmland (Pryor et al. in press). The region accounts for about 65% of U.S. corn and soybean 17 production (ERS 2012), mostly from non-irrigated lands (Pryor and Barthelmie 2012). Corn and 18 soybeans constitute 85% of Midwest crop receipts, with high value crops such as fruits and 19 vegetables making up most of the remainder (National Agricultural Statistics Service 2012). 20
Draft for Public Comment Chapter 18 – Midwest (V. 11 Jan 2013)
DRAFT FOR PUBLIC COMMENT
620
Corn and soybean yields increased markedly over the last century largely due to technological 1 innovation, but are still vulnerable to year-to-year variations in weather conditions (Niyogi and 2 Mishra 2012). 3
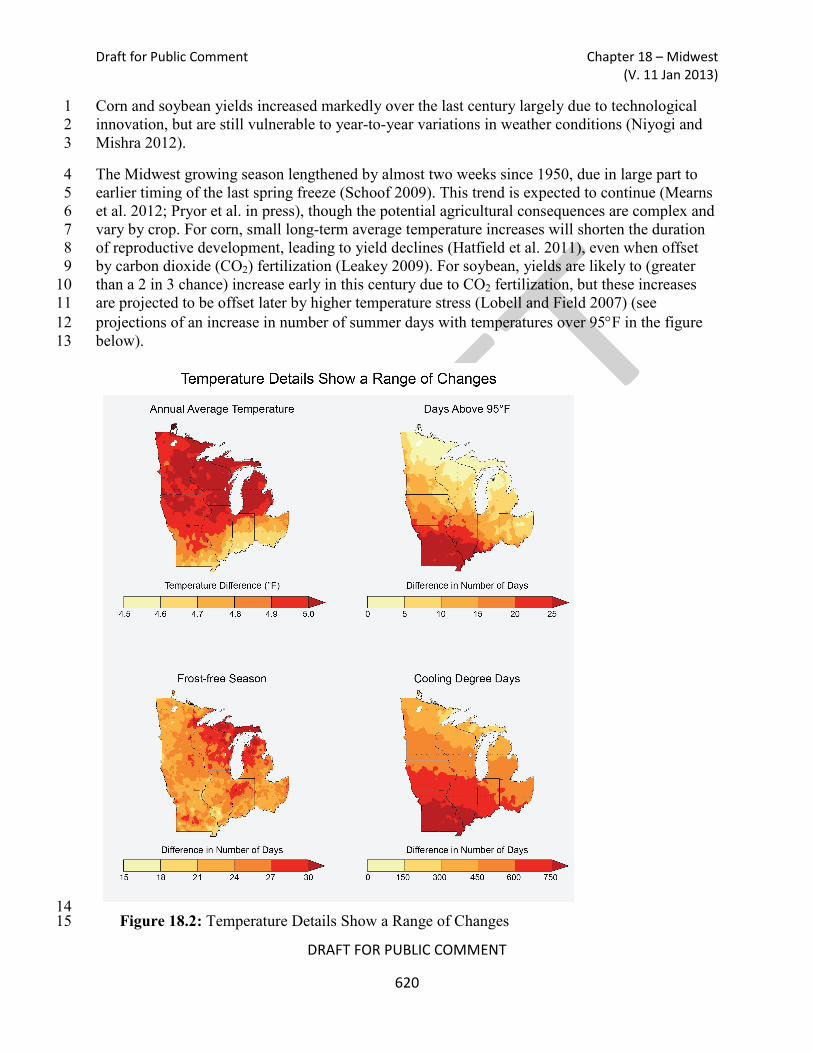
The Midwest growing season lengthened by almost two weeks since 1950, due in large part to 4 earlier timing of the last spring freeze (Schoof 2009). This trend is expected to continue (Mearns 5 et al. 2012; Pryor et al. in press), though the potential agricultural consequences are complex and 6 vary by crop. For corn, small long-term average temperature increases will shorten the duration 7 of reproductive development, leading to yield declines (Hatfield et al. 2011), even when offset 8 by carbon dioxide (CO2) fertilization (Leakey 2009). For soybean, yields are likely to (greater 9 than a 2 in 3 chance) increase early in this century due to CO2 fertilization, but these increases 10 are projected to be offset later by higher temperature stress (Lobell and Field 2007) (see 11 projections of an increase in number of summer days with temperatures over 95°F in the figure 12 below). 13
14 Figure 18.2: Temperature Details Show a Range of Changes 15

Draft for Public Comment Chapter 18 – Midwest (V. 11 Jan 2013)
DRAFT FOR PUBLIC COMMENT
621
Caption: Increasing annual average temperatures (top left) by the mid-century (2041-1 2070) as compared to the 1971-2000 period tell only part of the climate change story. 2 Maps also show projected increases in the number of the hottest days (days over 95°F, 3 top right), longer growing seasons (bottom left), and an increase in cooling degree days 4 (bottom right), which generally leads to an increase in energy use for air conditioning. 5 Projections are from Global Climate Models that assume emissions of heat-trapping 6 gases continue to rise (A2 scenario). (Figure source: NOAA NCDC / CICS-NC. Data 7 from CMIP3 Daily Multi-model Mean.) 8
Extreme weather events will influence future crop yields more than changes in average 9 temperature or annual precipitation. High temperatures during early spring, for example, can 10 decimate fruit crop production when early heat causes premature bud break that exposes flowers 11 to later cold injury (Winkler et al. 2012), as happened in 2002, and again in 2012, to Michigan’s 12 $60 million tart cherry crop. Springtime cold air outbreaks are projected to continue to occur 13 throughout this century (Vavrus et al. 2006). As a result, any increased productivity of some 14 crops due to higher temperatures, longer growing seasons, and elevated CO2 concentrations 15 could be offset by increased freeze damage (Gu et al. 2008). Heat waves during pollination of 16 field crops such as corn and soybean also reduce yields (Hatfield et al. 2011). Wetter springs 17 may reduce crop yields and profits (Rosenzweig et al. 2002), especially if growers are forced to 18 switch to late-planted, shorter-season varieties. 19
Agriculture is responsible for about 8% of U.S. heat-trapping gas emissions (U.S. Environmental 20 Protection Agency 2012) and there is tremendous potential for farming practices to reduce 21 emissions or store more carbon in soil (Council for Agricultural Science and Technology 2011). 22 Although large-scale agriculture in the Midwest historically led to decreased carbon in soils, 23 higher crop residue inputs and adoption of different soil management techniques have reversed 24 this trend. Other techniques, such as planting cover crops and no-till soil management, can 25 further increase CO2 uptake and reduce energy use (Gelfand et al. 2010; Pan et al. 2012). 26 Methane released from animals and their wastes can be reduced by altered diets and methane 27 capture systems, and nitrous oxide production can be reduced by judicious fertilizer use 28 (Robertson et al. 2012) and improved waste handling (Council for Agricultural Science and 29 Technology 2011). In addition, if biofuel crops are grown sustainably (Robertson et al. 2008), 30 they offer emission reduction opportunities by substituting for fossil fuel-based energy (Ch. 10: 31 Water, Energy, and Land Use). 32
Draft for Public Comment Chapter 18 – Midwest (V. 11 Jan 2013)
DRAFT FOR PUBLIC COMMENT
622
1
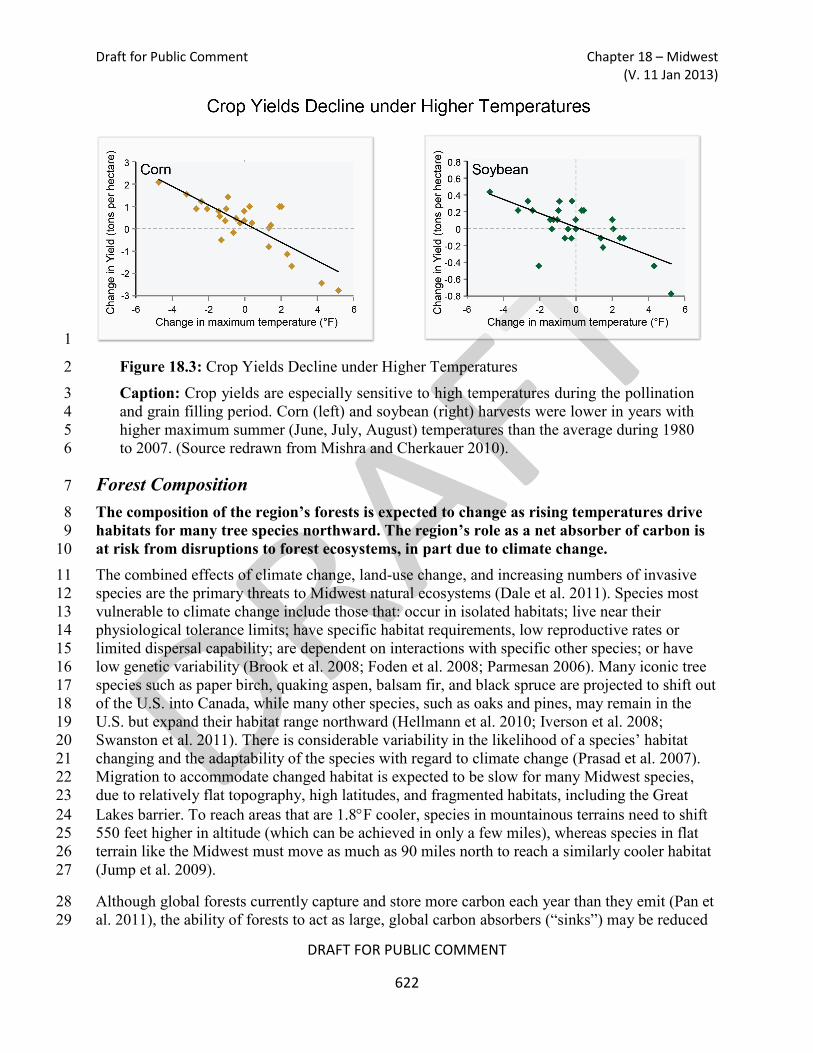
Figure 18.3: Crop Yields Decline under Higher Temperatures 2
Caption: Crop yields are especially sensitive to high temperatures during the pollination 3 and grain filling period. Corn (left) and soybean (right) harvests were lower in years with 4 higher maximum summer (June, July, August) temperatures than the average during 1980 5 to 2007. (Source redrawn from Mishra and Cherkauer 2010). 6
Forest Composition 7
The composition of the region’s forests is expected to change as rising temperatures drive 8 habitats for many tree species northward. The region’s role as a net absorber of carbon is 9 at risk from disruptions to forest ecosystems, in part due to climate change. 10 The combined effects of climate change, land-use change, and increasing numbers of invasive 11 species are the primary threats to Midwest natural ecosystems (Dale et al. 2011). Species most 12 vulnerable to climate change include those that: occur in isolated habitats; live near their 13 physiological tolerance limits; have specific habitat requirements, low reproductive rates or 14 limited dispersal capability; are dependent on interactions with specific other species; or have 15 low genetic variability (Brook et al. 2008; Foden et al. 2008; Parmesan 2006). Many iconic tree 16 species such as paper birch, quaking aspen, balsam fir, and black spruce are projected to shift out 17 of the U.S. into Canada, while many other species, such as oaks and pines, may remain in the 18 U.S. but expand their habitat range northward (Hellmann et al. 2010; Iverson et al. 2008; 19 Swanston et al. 2011). There is considerable variability in the likelihood of a species’ habitat 20 changing and the adaptability of the species with regard to climate change (Prasad et al. 2007). 21 Migration to accommodate changed habitat is expected to be slow for many Midwest species, 22 due to relatively flat topography, high latitudes, and fragmented habitats, including the Great 23 Lakes barrier. To reach areas that are 1.8°F cooler, species in mountainous terrains need to shift 24 550 feet higher in altitude (which can be achieved in only a few miles), whereas species in flat 25 terrain like the Midwest must move as much as 90 miles north to reach a similarly cooler habitat 26 (Jump et al. 2009). 27
Although global forests currently capture and store more carbon each year than they emit (Pan et 28 al. 2011), the ability of forests to act as large, global carbon absorbers (“sinks”) may be reduced 29
Draft for Public Comment Chapter 18 – Midwest (V. 11 Jan 2013)
DRAFT FOR PUBLIC COMMENT
623
by projected increased disturbances from insect outbreaks (Bradley et al. 2010), forest fire (Liu 1 et al. 2010), and drought (Allen et al. 2010), leading to increases in tree mortality and carbon 2 emissions. Though large uncertainties exist, some regions may even shift from being a carbon 3 sink to a source (Birdsey et al. 2006; Reich 2011). However, Midwest forests are more resilient 4 to forest carbon losses than most Western forests because of relatively high moisture availability, 5 greater nitrogen deposition (which tends to act as a fertilizer), and lower wildfire risk (Birdsey et 6 al. 2006; Reich 2011; Williams et al. 2012). 7
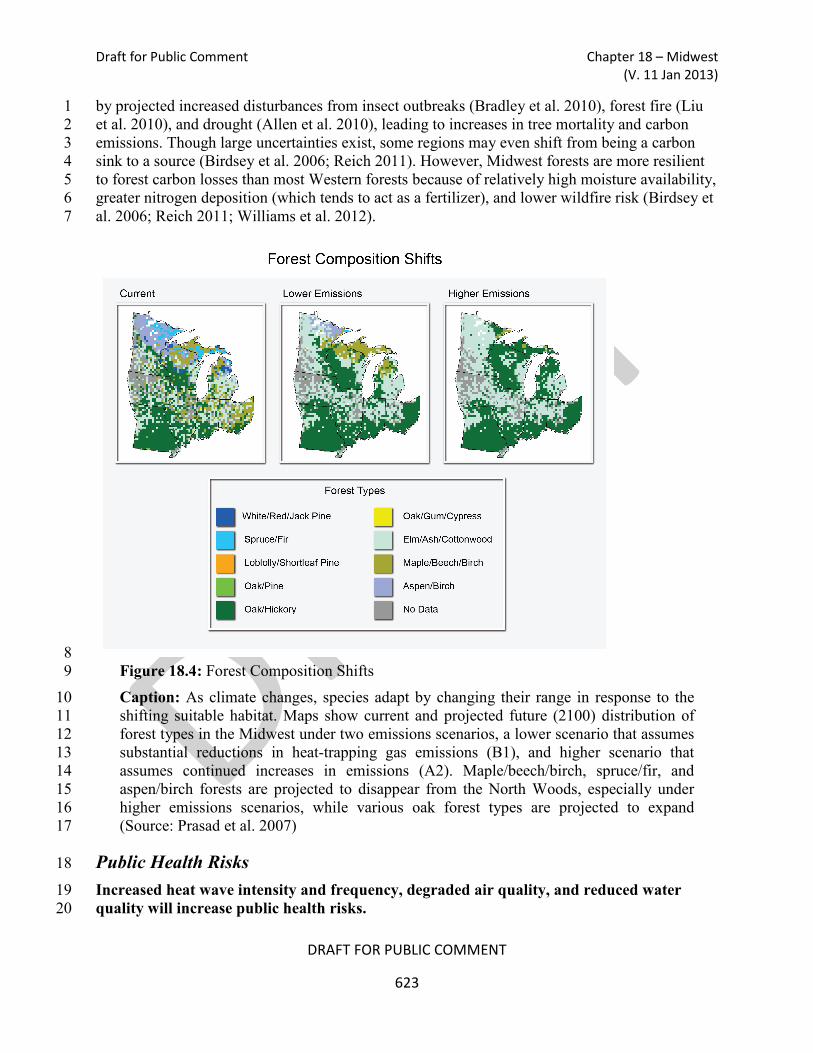
8 Figure 18.4: Forest Composition Shifts 9
Caption: As climate changes, species adapt by changing their range in response to the 10 shifting suitable habitat. Maps show current and projected future (2100) distribution of 11 forest types in the Midwest under two emissions scenarios, a lower scenario that assumes 12 substantial reductions in heat-trapping gas emissions (B1), and higher scenario that 13 assumes continued increases in emissions (A2). Maple/beech/birch, spruce/fir, and 14 aspen/birch forests are projected to disappear from the North Woods, especially under 15 higher emissions scenarios, while various oak forest types are projected to expand 16 (Source: Prasad et al. 2007) 17
Public Health Risks 18
Increased heat wave intensity and frequency, degraded air quality, and reduced water 19 quality will increase public health risks. 20

Draft for Public Comment Chapter 18 – Midwest (V. 11 Jan 2013)
DRAFT FOR PUBLIC COMMENT
624
The Midwest has experienced major heat waves and their frequency has increased over the last 1 six decades (Perera et al. 2012). For the U.S., mortality increases 4% during heat waves 2 compared with non-heat wave days (Anderson and Bell 2011). During July 2011, 132 million 3 people across the U.S. were under a heat alert – and on July 20 the majority of the Midwest 4 experienced temperatures in excess of 100°F. Heat stress is projected to increase as a result of 5 both increased summer temperatures and humidity (Schoof 2012). One study projected an 6 increase of between 166 and 2,217 excess deaths per year from heat wave-related mortality in 7 Chicago alone by 2081-2100, depending on the climate model (Peng et al. 2011). Heat response 8 plans and early warning systems save lives, and from 1975-2004 mortality rates per heat event 9 have declined (Sheridan et al. 2009), however, many municipalities lack such plans (Weisskopf 10 et al. 2002). 11
12
Figure 18.5: Projected Increases in Heat-Related Deaths 13
Caption: Chart shows observed heat-related deaths in Chicago during the 1995, 1999, 14 and 2006 heat waves, and average projected increases in heat-related deaths for Chicago 15 in 2081-2100 from 7 different climate models, assuming significant reductions in 16 emissions of the gases that cause global warming (left bar) and if emissions continue to 17 increase (right bar). (Source: Peng et al. 2011). Differences in the duration, intensity and 18 spatial extent of the historical heat-waves (Palecki et al. 2001) explain some of the 19 differences in the number of deaths caused as does increased mitigation efforts. 20
B1
A2
1995
1999
2006 0
200
400
600
800
1000
1200
1400
Num
ber o
f Dea
ths
Projected Increases in Heat-Related Deaths

Draft for Public Comment Chapter 18 – Midwest (V. 11 Jan 2013)
DRAFT FOR PUBLIC COMMENT
625
More than 20 million people within the Midwest currently experience air quality that fails to 1 meet national ambient air quality standards (Pryor and Barthelmie 2012). This exposure to 2 degraded air quality due to human-induced emissions (Holloway et al. 2008) and increased 3 pollen season duration (Ziska et al. 2011) is projected to be amplified under higher temperatures 4 (Jacob and Winner 2009), and thus increase the human health effects from heat waves. However, 5 policy options exist that could reduce emissions of both heat-trapping gases and other air 6 pollutants, yielding benefits for human health and fitness. Increased temperatures could also 7 increase the vulnerability of the Midwestern population to diseases carried by insects and rodents 8 (Ashley and Meentemeyer 2004; Ogden et al. 2004; Ward et al. 2004). 9
Box 1: Alternative Transportation Options Create Multiple Benefits 10 The transportation sector produces one-third of U.S. greenhouse gas emissions, and automobile 11 exhaust also contains precursors to fine particulate matter (PM2.5) and ground-level ozone (O3), 12 which pose threats to public health. Adopting a low carbon transportation system with fewer 13 automobiles, therefore, could have immediate health “co-benefits” of both reducing climate 14 change and improving human health via both improved air quality and physical fitness. The 15 maps below projects health benefits if automobile trips shorter than 5 miles round-trip were 16 removed for the 11 largest metropolitan areas in the Midwest: saving 1,295 lives and $8 billion 17 in health care costs per year for the upper Midwest region alone (assumes 50% of the short trips 18 are by bicycle, saves $5 billion otherwise) Grabow et al. (2012). 19
20
Figure 18.6: Reducing Emissions, Improving Health 21
Caption: Annual reduction in the number of premature deaths (left) and annual reduction 22 in the number of acute respiratory symptoms (right) due to reductions in particulate 23 matter and ozone caused by reducing automobile exhaust. In both maps, positive values 24 indicate a reduction in deaths or cases, negative value on right graph indicates an increase 25 in cases of acute respiratory symptoms (Source: Grabow et al. 2012) 26
-- end box -- 27

Draft for Public Comment Chapter 18 – Midwest (V. 11 Jan 2013)
DRAFT FOR PUBLIC COMMENT
626
Energy-Intensive Economy 1
The Midwest has a highly energy-intensive economy with per capita emissions of 2 greenhouse gases more than 20% higher than the national average. The region also has a 3 large, and increasingly utilized, potential to reduce emissions that cause climate change. 4 The Midwest is a major exporter of electricity to other U.S. regions, and has a highly energy-5 intensive economy. Energy use per dollar of GDP is approximately 20% above the national 6 average, and per capita greenhouse gas emissions are 22% higher than the national average 7 (Pryor and Barthelmie 2012). The range in seasonal air temperature makes energy demand for 8 both heating and cooling comparatively high, with the highest demand for winter heating. The 9 demand for heating in major Midwestern cities is typically five- to seven- times that for cooling 10 (Pryor and Barthelmie 2012), although this is expected to shift as a result of longer summers, 11 more frequent heat waves, and higher humidity, leading to an increase in the number of cooling 12 degree days. This increased demand for cooling by the middle of this century is projected to 13 exceed 10 gigawatts (equivalent to at least five large conventional power plants), requiring more 14 than $6 billion in infrastructure investments (Gotham et al. 2012). Further, approximately 95% of 15 the electrical generating infrastructure in the Midwest is susceptible to decreased efficiency 16 under higher temperatures (Gotham et al. 2012). 17
A 2009 National Academy of Sciences study concluded that burning fossil fuels leads to 18 damages of more than $120 billion a year due primarily to increased health care costs (see 19 “Alternative Transportation Options Create Multiple Benefits” above) (NRC 2010). Addressing 20 these issues and climate change presents the Midwest’s energy sector with a number of 21 challenges, in part because of its current reliance on coal-based electricity (Pryor and Barthelmie 22 2012) and an aging, less reliable grid (Amin 2012) that will require significant reinvestment even 23 without additional adaptations to climate change (Midwest Independent Transmission System 24 Operator 2011). 25
Compared to other regions, the Midwest has huge potential to produce energy from zero- and 26 low-carbon sources, given its vast wind, solar, and biomass resources. More than one-quarter of 27 national installed wind energy capacity, one-third of biodiesel capacity, and over two-thirds of 28 ethanol production is within the Midwest (Pryor and Barthelmie 2012) (See also Ch. 4: Energy 29 Supply and Use, and Ch. 10: Water, Energy, and Land Use). Progress is hampered by prices that 30 are distorted through a mix of direct and indirect subsidies and unaccounted-for costs (Sovacool 31 2009). The region also has potential for capturing and storing (or beneficially reusing) CO2 32 produced when using the region’s fossil resources (coal, oil, and gas). 33

Draft for Public Comment Chapter 18 – Midwest (V. 11 Jan 2013)
DRAFT FOR PUBLIC COMMENT
627
Increased Rainfall and Flooding 1
Extreme rainfall events and flooding have increased during the last century, and these 2 trends are expected to continue, causing erosion, declining water quality, and negative 3 impacts on transportation, agriculture, human health, and infrastructure. 4 Precipitation in the Midwest is greatest in the east, declining towards the west. Precipitation 5 occurs about once every seven days in the western part of the region and once every three days in 6 the southeastern part (Pryor et al. 2009a), with up to 40% of annual precipitation being 7 concentrated into only 10 days (Pryor et al. 2009a). Generally, annual precipitation increased 8 during the past century (by up to 20% in some locations), with much of the increase driven by 9 intensification of the heaviest rainfalls (Pryor et al. 2009a; Pryor et al. 2009b; Villarini et al. 10 2011). This tendency towards more intense precipitation events is projected to continue in the 11 future (Schoof et al. 2010). 12
Model projections for precipitation changes are less certain than those for temperature (Kunkel et 13 al. 2012). Projections of average annual precipitation by late this century under a high emissions 14 scenario (A2) range from little change to greater than 10% increases in the north, and from 15 greater than 10% decreases to greater than 10% increases in the south (Kunkel et al. 2012; Ch. 2: 16 Our Changing Climate; Key Message 5). 17

Draft for Public Comment Chapter 18 – Midwest (V. 11 Jan 2013)
DRAFT FOR PUBLIC COMMENT
628
1
Figure 18.7: When it rains, it… 2
Caption: Precipitation patterns affect many aspects of life, from agriculture to urban 3 storm drains. These maps show projected changes based on Global Climate Model output 4 for the middle of the current century (2041-2070) relative to the end of the last century 5 (1971-2000) across the Midwest. Top left: the changes in total annual average 6 precipitation. Across the entire Midwest, the total amount of water from rainfall and 7 snowfall is projected to increase. Top right: increase in the number of days with very 8 heavy precipitation (top 2% of all rainfalls). Bottom left: shows increases in the amount 9 of rain falling in the wettest 5-day period. Both indicate that heavy precipitation events 10 will increase in intensity in the future across the Midwest. Bottom right: change in the 11 average number of days with less than one-tenth of an inch of precipitation. An increase 12 in this variable has been used to indicate an increase in the chance of drought in the 13

Draft for Public Comment Chapter 18 – Midwest (V. 11 Jan 2013)
DRAFT FOR PUBLIC COMMENT
629
future. (Figure source: NOAA NCDC / CICS-NC. Data from CMIP3 Daily Multi-model 1 Mean.) 2
Flooding carries major human and economic consequences through inundating urban and 3 agricultural land, but also by disrupting navigation in the region’s roads, rivers, and reservoirs. 4 For example, the 2008 flooding in the Midwest caused 24 deaths, $15 billion of losses via 5 reduced agricultural yields, and closure of key transportation routes (Pryor and Barthelmie 6 2012). Water infrastructure for flood control, navigation, and other purposes is susceptible to 7 climate change and other forces because the designs are based upon historical patterns of 8 precipitation and streamflow that no longer hold. 9
Snowfall varies across the region, comprising less than 10% of total precipitation in the south, to 10 more than half in the north, with as much as 2 inches of water available in the snow pack at the 11 beginning of spring melt in the northern reaches (Baun 2005). When this amount of snowmelt is 12 combined with heavy rainfall, the resulting flooding can be widespread and catastrophic (see 13 “Cedar Rapids” below). While recent history indicates that these types of events are becoming 14 more frequent, and perhaps more severe, both observed records and climate models project less 15 snow in the southern portions of the region and greater lake effect snow, making overall regional 16 impacts difficult to assess. Large-scale flooding can also occur due to extreme precipitation in 17 the absence of snowmelt (for example, Rush Creek and the Root River, MN in August 2007 and 18 multiple rivers in southern Minnesota in September 2010) (Ellison et al. 2011). These warm 19 season events are projected to increase in magnitude. Such events tend to be more regional and 20 less likely to cover as large an area, in part because soil water storage capacity is typically much 21 greater during the summer. 22
Box: Cedar Rapids: Tale of Vulnerability and Response 23 Cedar Rapids, Des Moines, Iowa City, and Ames, Iowa have all suffered multi-million-dollar 24 losses from floods since 1993. In June 2008, a record flood event exceeded the once-in-500-year 25 flood level by more than 5 feet, causing $5 to $6 billion in damages from flooding, or more than 26 $40,000 per resident of the city of Cedar Rapids (Budikova et al. 2010). The flood inundated 27 much of the downtown, damaging more than 4,000 structures, including 80% of governmental 28 offices, and displacing 25,000 people (Mutel 2010). The record flood at Cedar Rapids was the 29 result of low reservoir capacity and extreme rainfall falling on soil already saturated from 30 unusually wet conditions. Rainfalls were similar to what occurred in 1993 (8 inches over a two 31 week period) that overwhelmed a flood control system designed largely for a once-in-100-yr 32 flood event. Such events are consistent with observations and projections of most models 33 indicating wetter springs and more intense precipitation events. With the help of more than $3 34 billion in funding from the federal and state government, Cedar Rapids is recovering and has 35 taken significant steps to reduce future flood damage, with buyouts of more than 1,000 36 properties, and numerous buildings adopting flood protection measures. 37
-- end box -- 38
Draft for Public Comment Chapter 18 – Midwest (V. 11 Jan 2013)
DRAFT FOR PUBLIC COMMENT
630
Changing land use and the expansion of urban areas are reducing infiltration of water into the 1 soil and increasing surface runoff. These changes exacerbate impacts caused by increased 2 precipitation intensity. Many major Midwest cities are served by combined storm and sewage 3 drainage systems. As impervious surfaces (such as asphalt) increase and extreme precipitation 4 events intensify, combined sewer overflow has degraded water quality (Patz et al. 2008). The 5 EPA estimates there are more than 800 billion gallons of untreated combined sewage released 6 into the nation’s waters annually (McLellan et al. 2007). The Great Lakes provide drinking water 7 to more than 40 million people and are home to more than 500 beaches (Patz et al. 2008), and 8 have been subject to recent sewage overflows. For example, stormwater across the city of 9 Milwaukee recently showed high human fecal pathogen levels at all 45 outflow locations, 10 signifying widespread sewage contamination (Sauer et al. 2011). One study estimated that 11 increased storm events will lead to an increase of up to 120% in combined sewer overflows into 12 Lake Michigan by 2100 under a scenario of very high emissions (A1F1)(Patz et al. 2008), 13 leading to additional human health issues and beach closures. Municipalities may be forced to 14 invest in new infrastructure to protect human health and the lakes, and local communities could 15 face tourism losses from fouled near-shore regions. 16
Increased precipitation intensity also increases erosion, damaging ecosystems and increasing 17 delivery of sediment and subsequent loss of reservoir storage capacity. Increased storm-induced 18 agricultural runoff and rising water temperatures have increased non-point source pollution 19 problems in recent years (Mishra et al. 2010). This has led to increased phosphorus and nitrogen 20 loadings contributing to more and prolonged occurrences of low-oxygen “dead zones” and to 21 harmful, lengthy, and dense algae growth within the Great Lakes and other Midwestern water 22 bodies (Reutter et al. 2011). (Such zones and their causes are also discussed in Ch. 25: Coastal 23 Zone, Ch. 18: Biogeochemical Cycles, and Ch. 3: Water Resources, which has a key message on 24 water quality). Watershed planning can be used to alleviate water quantity and quality problems 25 due to changing climate and land use. 26
While there was no apparent change in drought duration in the Midwest over the past century 27 (Dai 2010), the average number of days without precipitation is projected to increase in the 28 future. This could lead to agricultural drought and suppressed crop yields (Niyogi and Mishra 29 2012) (See also Ch. 4: Energy Supply and Use, and Ch. 10: Water, Energy, and Land Use). This 30 would increase thermoelectric power plant cooling water temperatures and decrease cooling 31 efficiency and plant capacity because of the a need to avoid discharging excessively warm water 32 (Gotham et al. 2012). 33
Increased Risks to the Great Lakes 34
Climate change will exacerbate a range of risks to the Great Lakes region, including 35 changes in the range and distribution of important commercial and recreational fish 36 species, increased invasive species, declining beach health, and harmful blooms of algae. 37 Declines in ice cover will continue to lengthen the commercial navigation season. 38 The Great Lakes, North America’s largest freshwater feature, have recently recorded higher 39 water temperatures and less ice cover as a result of changes in regional climate. Summer surface 40 water temperatures in Lakes Huron and Ontario increased 5.2°F and 2.7°F, respectively, between 41 1968 and 2002 (Dobiesz and Lester 2009), with smaller increases in Lake Erie (Dobiesz and 42

Draft for Public Comment Chapter 18 – Midwest (V. 11 Jan 2013)
DRAFT FOR PUBLIC COMMENT
631
Lester 2009; Lofgren and Gronewold 2012). Due to the reduction in ice cover, the temperature of 1 surface waters in Lake Superior during the summer increased 4.5°F, twice the rate of increase in 2 air temperature (Austin and Colman 2007). By 2050 and 2100, these surface temperatures are 3 projected to rise by as much as 7.0°F and 12.1°F, respectively (Mackey 2012; Trumpickas et al. 4 2009). Higher temperatures, increases in precipitation, and lengthened growing seasons favor 5 production of blue-green and toxic algae that can harm fish, water quality, habitat, aesthetics 6 (Ficke et al. 2007; Mackey 2012; Reutter et al. 2011), and potentially heighten the impact of 7 invasive species already present (Bronte et al. 2003; Rahel et al. 2008). 8
Increased winter air temperatures led to decreased Great Lakes ice cover by 71% between 1973 9 and 2010. Less ice, coupled with more frequent and intense storms (as indicated by some 10 analyses of historical wind speeds, (Pryor et al. 2009c), leaves shores vulnerable to erosion and 11 flooding and could harm property and fish habitat (Ferris 2009; Mackey 2012; Wuebbles et al. 12 2010). However, reduced ice cover also has the potential to lengthen the shipping season 13 (Millerd 2011). The navigation season has increased by an average of 8 days since 1994, and the 14 Welland Canal in the St. Lawrence River remained open nearly two weeks longer. Increased 15 shipping days benefit commerce but could also increase shoreline scouring and bring in more 16 invasive species (Hellmann et al. 2008; Millerd 2011; Smith et al. 2012). 17
18

Draft for Public Comment Chapter 18 – Midwest (V. 11 Jan 2013)
DRAFT FOR PUBLIC COMMENT
632
Figure 18.8: Ice Cover in the Great Lakes is Declining 1
Caption: From the 1970s to the present, the average annual percentage of the Great 2 Lakes covered with ice has declined (Upper Panel). Winter of 2008-2009 (lower left) was 3 characterized by near-normal air temperatures over the Great Lakes, while 2011-2012 4 (lower right) was characterized by air temperature of approximately 5.4°F (3°C) warmer 5 than the historical average. Photos contrast extensive vs. minimal ice cover on Lake Erie. 6 (Source: Wang et al. 2012. Images are from NASA MODIS satellite imagery processed 7 by SSEC, University of Wisconsin and obtained from the CoastWatch Great Lakes 8 Program). 9
Changes in lake levels can also influence the amount of cargo that can be carried. On average, a 10 1000-foot ship sinks into the water by one inch per 270 tons of cargo (Sousounis and Bisanz 11 2000); thus if a ship is currently draft-limited, any lowering of lake levels will result in a 12 proportional reduction in the amount of cargo that ships can transport to the Great Lakes ports. 13 However, current estimates of lake level changes are uncertain, even for continued increases in 14 global greenhouse gas emissions (A2 scenario). New model projections indicate only a slight 15 decrease or even a small rise in levels (Angel and Kunkel 2010), in contrast to earlier models 16 (Hayhoe et al. 2010) that projected much lower levels because they overstressed water loss due 17 to evapotranspiration from the land within the Great Lakes drainage basin (Lofgren et al. 2011; 18 Milly and Dunne 2011; UGLSB 2012). 19

Draft for Public Comment Chapter 18 – Midwest (V. 11 Jan 2013)
DRAFT FOR PUBLIC COMMENT
633
Traceable Accounts 1
Chapter 18: Midwest 2
Key Message Process: The assessment process for the Midwest Region began with a workshop was that was held 3 July 25, 2011 in Ann Arbor, MI with 10 participants discussing the scope and authors for a foundational Technical 4 Input Report (TIR) report entitled “Midwest Technical Input Report” (Winkler et al. 2012). The report, which 5 consisted of nearly 240 pages of text organized into 13 chapters, was assembled by 23 authors representing 6 governmental agencies, NGOs, tribes, and other entities. 7
The chapter author team engaged in multiple technical discussions via teleconferences that permitted a careful 8 review of the foundational TIR (Winkler et al. 2012) and of approximately 45 additional technical inputs provided 9 by the public, as well as the other published literature, and professional judgment. The Chapter Author Team 10 convened teleconferences and exchange extensive emails to define the scope of the chapter for their expert 11 deliberation of input materials, and to generate the chapter text and figures. Each expert drafted key messages, initial 12 text and figure drafts and traceable account forms that pertained to their individual fields of excellence. These 13 materials were then extensively discussed by the Author team and were approved by the Chapter team members. 14
Key message #1/6 In the next few decades, longer growing seasons and rising carbon dioxide levels will increase yields of some crops, though those benefits will be increasingly offset by the occurrence of extreme events such as heat waves, droughts, and floods. In the long-term, combined stresses associated with climate change are expected to decrease agricultural productivity especially without significant advances in genetic and agronomic technology.
Description of evidence base
The key message and supporting text summarizes extensive evidence documented in the Technical Input (Winkler et al. 2012). Technical Input reports on a wide range of topics were also received and reviewed as part of the Federal Register Notice solicitation for public input.
Evidence for altered growing seasons across the U.S. are discussed in Chapter 2 (Our Changing Climate, Key Message 4) and its Traceable Accounts. Specific details for the Midwest are detailed in the NCA Climate Trends and Outlooks (Kunkel et al. 2012) with its references. Evidence for longer growing seasons in the Midwest is based on regional temperature records and incontrovertible, as is evidence for increasing carbon dioxide concentrations.
USDA data tables provide evidence for the importance of the 8 Midwest states for US agricultural production. Evidence for the effect of future elevated carbon dioxide concentrations on crop yields is based on scores of greenhouse and field experiments that show a strong fertilization response for C3 plants such as soybeans and wheat and a positive but not as strong a response for C4 plants such as corn. The negative effects of extreme weather events on crop yield are based on observational data, evidence from field experiments, and quantitative modeling: early spring heat waves followed by normal frost events has been shown to decimate Midwest fruit crops; heat waves during flowering, pollination, and grain filling has been shown to significantly reduce corn and wheat yields; more variable and intense spring rainfall has delayed spring planting in some years and can be expected to increase erosion and runoff; and floods have led to crop losses.
New information and remaining uncertainties
Key issues (uncertainties) are a) the rate at which grain yield improvements will continue to occur, which could help to offset the overall negative effect of extreme events at least for grain crops (though not for individual farmers), and b) the degree to which genetic improvements could make some future crops more tolerant of extreme events such as drought and heat stress. Additional uncertainties are c) the degree to which accelerated soil carbon loss will occur as a result of warmer

Draft for Public Comment Chapter 18 – Midwest (V. 11 Jan 2013)
DRAFT FOR PUBLIC COMMENT
634
winters and the resulting effects on soil fertility and soil water availability, and d) the potential for increased pest and disease pressure as southern pests such as soybean rust move northward and existing pests better survive milder Midwest winters.
Assessment of confidence based on evidence
Since nearly all studies published to date in the peer-reviewed literature agree that Midwest crops benefit from CO2 fertilization and some benefit from a longer growing season, there is very high confidence in this component of the key message.
Studies also agree that full benefits will be offset partly or fully by more frequent heat waves, early spring thaws followed by freezing temperatures, more variable and intense rainfall events, and floods. Again, very high confidence in this aspect.
There is less certainty (high) about pest effects and about the potential for genetic improvements to significantly mitigate the risk of crop loss.
1 CONFIDENCE LEVEL
Very High High Medium Low Strong evidence (established
theory, multiple sources, consistent results, well
documented and accepted methods, etc.), high consensus
Moderate evidence (several sources, some consistency,
methods vary and/or documentation limited, etc.),
medium consensus
Suggestive evidence (a few sources, limited consistency, models incomplete, methods emerging, etc.), competing
schools of thought
Inconclusive evidence (limited sources, extrapolations,
inconsistent findings, poor documentation and/or methods not tested, etc.), disagreement
or lack of opinions among experts
2

Draft for Public Comment Chapter 18 – Midwest (V. 11 Jan 2013)
DRAFT FOR PUBLIC COMMENT
635
Chapter 18: Midwest 1
Key Message Process: See Key Message #1. 2
3
4
Key Message #2/6 The composition of the region’s forests is expected to change as rising temperatures drive habitats for many tree species northward. The region’s role as a net absorber of carbon is at risk from disruptions to forest ecosystems, in part due to climate change
Description of evidence
The key message and supporting text summarizes extensive evidence documented in the Technical Input (Winkler et al. 2012). Technical Input reports on a wide range of topics were also received and reviewed as part of the Federal Register Notice solicitation for public input.
Evidence for increased temperatures and altered growing seasons across the U.S. are discussed in Chapter 2 (Our Changing Climate, Key Messages 3 and 4) and its Traceable Accounts. Specific details for the Midwest are detailed in the NCA Climate Trends and Outlooks (Kunkel et al. 2012) with its references. Evidence that species have been shifting northward or ascending in altitude has been mounting for numerous species, though less so for long-lived trees. Nearly all studies to date published in the peer-reviewed literature agree that many of the boreal species of the north will eventually retreat northward. The question is when. Multiple models and paleoecological evidence show these trends have occurred in the past and are very likely to continue in the future.
The forests of the Eastern United States (including the Midwest) have been accumulating large quantities of carbon over the past century, but evidence shows this trend is slowing in recent decades. There is a large amount of forest inventory data supporting the gradual decline in carbon accumulation throughout the East, as well as increasing disturbances/disturbance agents that are reducing overall net productivity in many of the forests.
New information and remaining uncertainties
A key issue (uncertainty) is the rate of change of habitats and for organisms adapting or moving as habitats move. Key questions are: How much will the habitats change (what scenarios and model predictions will be most correct)? As primary habitats move north, which species will be able to keep up with changing habitats on their own or with human intervention through assisted migration, management of migration corridors, or construction or maintenance of refugia within their current landscapes?
Viable avenues to improving the information base are determining which climate models exhibit the best ability to reproduce the historical and potential future change in habitats, and determining how, how fast, and how far various species can move or adapt.
Assessment of confidence based on evidence
There is very high confidence in this key message.

Draft for Public Comment Chapter 18 – Midwest (V. 11 Jan 2013)
DRAFT FOR PUBLIC COMMENT
636
CONFIDENCE LEVEL Very High High Medium Low
Strong evidence (established theory, multiple sources, consistent results, well
documented and accepted methods, etc.), high consensus
Moderate evidence (several sources, some consistency,
methods vary and/or documentation limited, etc.),
medium consensus
Suggestive evidence (a few sources, limited consistency, models incomplete, methods emerging, etc.), competing
schools of thought
Inconclusive evidence (limited sources, extrapolations,
inconsistent findings, poor documentation and/or methods not tested, etc.), disagreement
or lack of opinions among experts
1

Draft for Public Comment Chapter 18 – Midwest (V. 11 Jan 2013)
DRAFT FOR PUBLIC COMMENT
637
Chapter 18: Midwest 1
Key Message Process: See Key Message #1. 2
Key Message #3/6 Increased heat wave intensity and frequency, degraded air quality, and reduced water quality will increase public health risks
Description of evidence
The key message and supporting text summarizes extensive evidence documented in the Technical Input (Winkler et al. 2012). Technical Input reports on a wide range of topics were also received and reviewed as part of the Federal Register Notice solicitation for public input.
Evidence for extreme weather such as heat waves across the U.S. are discussed in Chapter 2 (Our Changing Climate, Key Message 7) and its Traceable Accounts. Specific details for the Midwest are detailed in the NCA Climate Trends and Outlooks (Kunkel et al. 2012) with its references. Pryor (2012) also contains chapters detailing the most current evidence for the region.
Heat waves: The occurrence of heat waves in the recent past has been well-documented (Pryor and Barthelmie 2012; Schoof 2012; Winkler et al. 2012), as have health outcomes (particularly with regards to mortality). Projections of thermal regimes indicate increased frequency of periods with high air temperatures (and high apparent temperatures). These projections are relatively robust and consistent between studies.
Air quality: In the region containing North Dakota, South Dakota, Nebraska, Kansas, Minnesota, Iowa, Missouri, Wisconsin, Illinois, Michigan, Indiana and Ohio in 2008 over 26 million people lived in counties that failed the National Ambient Air Quality Standards (NAAQS) for PM2.5 and over 24 million lived in counties that failed the NAAQS for O3. Since not all counties have air quality measurement stations in place, these data must be considered a lower bound on the actual number of counties that violate the NAAQS. Further given that the NAAQS were designed principally with the goal of protecting human health failure of these standards implies a significant fraction of the population live in counties characterized by air quality that is harmful to human health. While only relatively few studies have sought to make detailed air quality projections for the future, those that have generally indicate declining air quality (see caveats below).
Water quality: The EPA estimates that roughly 3.2 trillion liters of combined sewer overflow (CSO) wastewater is discharged annually into our nation’s surface waters. Sewer overflows leading to discharge of untreated as a result of unanticipated precipitation events represent a major threat to human health. While not all urban areas within the Midwest have combined sewers (designed to capture both sanitary sewage and storm-water) for delivery to wastewater treatment plants, many are (e.g. Chicago and Milwaukee), and such systems are vulnerable to CSO during extreme precipitation events. Presuming that these historical tendencies towards intensification of extreme precipitation events does not reverse into the future (and the majority of studies imply only intensification of extreme events) it appears that sewer overflow will continue to constitute a significant current health threat and a critical source of climate change vulnerability for major urban areas within the Midwest.
New information and remaining uncertainties
Key issues (uncertainties) are:
Human health outcomes are contingent on a large number of non-climate variables. For example, morbidity and mortality outcomes of extreme heat are strongly determined by i) housing stock and access to air-conditioning in residences, ii)

Draft for Public Comment Chapter 18 – Midwest (V. 11 Jan 2013)
DRAFT FOR PUBLIC COMMENT
638
existence and efficacy of heat wave warning and response plans (for example, foreign language-appropriate communications and transit plans to public cooling centers, especially for the elderly), iii) co-stressors (for example, air pollution). Further heat-stress is dictated by apparent temperature (which is a function of both air temperature and humidity). Urban heat islands tend to exacerbate elevated temperatures and are largely determined by urban land-use and anthropogenic heat emissions. Urban heat island reduction plans (for example, planted green roofs) represent one ongoing intervention. Nevertheless, the occurrence of extreme heat indices will increase under all climate scenarios, thus in the absence of policies to reduce heat-related illness/death, these impacts will increase in the future.
Air quality is a complex function not only of physical meteorology but emissions of air pollutants and precursor species. However, since most chemical reactions are enhanced by warmer temperatures, as are many air pollutant emissions, warmer temperatures will lead to worsening of air quality.
Combined Sewage Outflow is a major threat to water quality in some Midwestern cities now. The tendency towards increased magnitude of extreme rain events (documented in the historical record and projected to continue in downscaling analyses) will cause an increased risk of waterborne disease outbreaks in the absence of infrastructure overhaul. However, mitigation actions are available, and the changing structure of cities (for example, reducing impervious surfaces) may offset the impact of the changing climate.
Assessment of confidence based on evidence
In the absence of concerted efforts to reduce the threats posed by extreme heat, degraded air quality and degraded water quality, climate change will increase the health risks associated with these phenomena. However, these projections are contingent on underlying assumptions regarding socio-economic conditions and demographic trends in the region. Confidence is therefore high regarding this key message.
1 CONFIDENCE LEVEL
Very High High Medium Low Strong evidence (established
theory, multiple sources, consistent results, well
documented and accepted methods, etc.), high consensus
Moderate evidence (several sources, some consistency,
methods vary and/or documentation limited, etc.),
medium consensus
Suggestive evidence (a few sources, limited consistency, models incomplete, methods emerging, etc.), competing
schools of thought
Inconclusive evidence (limited sources, extrapolations,
inconsistent findings, poor documentation and/or methods not tested, etc.), disagreement
or lack of opinions among experts
2

Draft for Public Comment Chapter 18 – Midwest (V. 11 Jan 2013)
DRAFT FOR PUBLIC COMMENT
639
Chapter 18: Midwest 1
Key Message Process: See Key Message #1. 2
Key Message #4/6 The Midwest has a highly energy-intensive economy with per capita emissions of heat-trapping gases more than 20% higher than the national average. The region also has a large, and increasingly utilized, potential to reduce emissions that cause climate change.
Description of evidence
The Midwest’s disproportionately large reliance on coal for electricity generation and the energy intensity of its agricultural and manufacturing sectors are all well documented in both government and industry records, as is its contribution to greenhouse gases. The region’s potential for zero- and lower-carbon energy production is also well documented by government and private assessments. Official and regular reporting by state agencies and non-governmental organizations demonstrates the Midwest’s progress toward a decarbonized energy mix. The evidence is also very strong that the Midwest is steady decarbonizing its electricity generation through a combination of new state-level policies (e.g., energy efficiency and renewable energy standards) and will continue to do so in response low natural gas prices, falling prices for renewable electricity (e.g., wind and solar), greater market demand for lower-carbon energy from consumers and new EPA regulations governing new power plants.
New information and remaining uncertainties
Four key issues (uncertainties) are: 1) the net effect of emerging EPA regulations on the future energy mix of the Midwest. Assessments to date suggest a significant number of coal plants will be closed or repowered with lower-carbon natural gas; and even for coal plants that are currently thought of as “must run” (to maintain the electric grid’s reliability) may be able to be replaced in some circumstances with the right combination of energy efficiency, new transmission lines, demand response and distributed generation. 2) A second key uncertainty is whether or not natural gas prices will remain at their historically low levels. Since there are really only five options for meeting electricity demand—energy efficiency, renewables, coal, nuclear and natural gas—the replacement of coal with natural gas for electricity production will have a significant impact on greenhouse gas emissions in the region. 3) A third key issue is the uncertain future for federal policies that have spurred renewable energy development to date, such as the Production Tax Credit for wind. While prices for both wind and solar continue to fall, the potential loss of tax credits may dampen additional market penetration of these technologies. 4) A fourth and final uncertainty is the net effect of climate change on energy demand, and the cost of meeting that new demand profile. Research to date suggests the potential for a significant swing from the historically larger demand for heating in the winter to more demand in the summer instead due to warmer, more humid climate.
Assessment of confidence based on evidence
There is no dispute about the energy intensity of the Midwestern economy, nor its disproportionately large contribution of greenhouse gas emissions. Similarly, there is broad agreement about the Midwest’s potential for—and progress toward—lower-carbon electricity production. There is therefore very high confidence in this statement.
3 4 5

Draft for Public Comment Chapter 18 – Midwest (V. 11 Jan 2013)
DRAFT FOR PUBLIC COMMENT
640
1 CONFIDENCE LEVEL
Very High High Medium Low Strong evidence (established
theory, multiple sources, consistent results, well
documented and accepted methods, etc.), high consensus
Moderate evidence (several sources, some consistency,
methods vary and/or documentation limited, etc.),
medium consensus
Suggestive evidence (a few sources, limited consistency, models incomplete, methods emerging, etc.), competing
schools of thought
Inconclusive evidence (limited sources, extrapolations,
inconsistent findings, poor documentation and/or methods not tested, etc.), disagreement
or lack of opinions among experts
2

Draft for Public Comment Chapter 18 – Midwest (V. 11 Jan 2013)
DRAFT FOR PUBLIC COMMENT
641
Chapter 18: Midwest 1
Key Message Process: See Key Message #1. 2
Key Message #5/6 Extreme rainfall events and flooding have increased during the last century, and these trends are expected to continue, causing erosion, declining water quality, and negative impacts on transportation, agriculture, human health, and infrastructure.
Description of evidence
The key message and supporting text summarizes extensive evidence documented in the Technical Input (Winkler et al. 2012). Technical Input reports on a wide range of topics were also received and reviewed as part of the Federal Register Notice solicitation for public input. Evidence for extreme weather and increased precipitation across the U.S. are discussed in Chapter 2 (Our Changing Climate, Key Messages 5,6,7) and its Traceable Accounts. Specific details for the Midwest are detailed in the NCA Climate Trends and Outlooks (Kunkel et al. 2012) with its references. Pryor (2012) also contains chapters detailing the most current evidence for the region. There is compelling evidence that annual total precipitation has been increasing in the region, with wetter winter and springs, dryer summers, an increase in extreme precipitation events, and changes in snowfall patterns. These observations are consistent with climate model projections. Both the observed trends and climate models suggest these trends will increase in the future. Recent records also indicate evidence of a number of high impact flood events in the region. Heavy precipitation events cause increased kinetic energy of surface water and thus increase erosion. Heavy precipitation events in the historical records have been shown to be associated with discharge of partially (or untreated) sewage due to the volumes of water overwhelming combined sewage and overflow systems. Climate downscaling projections tend to indicate an increase in the frequency and duration of extreme events (both heavy precipitation and meteorological drought) in the future.
New information and remaining uncertainties
Precipitation is much less readily measured or modeled than air temperature. Thus both historical tendencies and projections for precipitation are inherently less certain than for temperature. Most RCMs still have a positive bias in precipitation frequency but a negative bias in terms of precipitation amount in extreme events. Flood records are very heterogeneous and there is some ambiguity about the degree to which flooding is a result of atmospheric conditions (e.g. flooding is not solely the result of incident precipitation but is also a complex function of the antecedent conditions, soil moisture and landscape infiltration). A key issue is the future distribution of snowfall. Records indicate that snowfall is decreasing in the southern parts of the region, along with increasing lake effect snow. Climate models predict this trend to increase. There is insufficient knowledge about how this change in snowfall patterns will affect flooding and associated problems. This is most likely to affect the really large spring floods that typically cause the worst flooding in the region. In addition, recent data and climate predictions indicate dryer summer conditions, which could tend to offset the effects of higher intensity summer storms by providing increases storage in the soils. The relative effects of these offsetting trends needs to be assessed. Hydrologic modeling that includes the effects of both the increase in extreme events, changing snow patterns, and shifts in the rainfall patterns is needed to determine the future flooding risks.

Draft for Public Comment Chapter 18 – Midwest (V. 11 Jan 2013)
DRAFT FOR PUBLIC COMMENT
642
Adaptation measures to reduce soil erosion and CSO events are available and could be widely adopted.
Assessment of confidence based on evidence
There have been improvements in agreement between observed precipitation patterns and model simulations. Also an increase in extreme precipitation events is consistent with first-order reasoning and increased atmospheric water burdens due to increased air temperature. Recent data suggest an increase in flooding in the region but there is uncertainty about how the changing snow patterns will affect flood events in the future. Thus there is high confidence in the increase in increased rainfall and extreme precipitation events.
1 CONFIDENCE LEVEL
Very High High Medium Low Strong evidence (established
theory, multiple sources, consistent results, well
documented and accepted methods, etc.), high consensus
Moderate evidence (several sources, some consistency,
methods vary and/or documentation limited, etc.),
medium consensus
Suggestive evidence (a few sources, limited consistency, models incomplete, methods emerging, etc.), competing
schools of thought
Inconclusive evidence (limited sources, extrapolations,
inconsistent findings, poor documentation and/or methods not tested, etc.), disagreement
or lack of opinions among experts
2
3 4

Draft for Public Comment Chapter 18 – Midwest (V. 11 Jan 2013)
DRAFT FOR PUBLIC COMMENT
643
Chapter 18: Midwest 1
Key Message Process: See Key Message #1. 2
Key Message #6/6 Climate change will exacerbate a range of risks to the Great Lakes region, including changes in the range and distribution of important commercial and recreational fish species, increased invasive species, declining beach health, and harmful blooms of algae. Declines in ice cover will continue to lengthen the commercial navigation season.
Description of evidence
The key message and supporting text summarizes extensive evidence documented in the Technical Input (Winkler et al. 2012). Technical Input reports on a wide range of topics were also received and reviewed as part of the Federal Register Notice solicitation for public input.
Evidence for changes in ice cover due to increased temperatures across the U.S. are discussed in Chapter 2 (Our Changing Climate, Key Message 10) and its Traceable Accounts. Specific details for the Midwest are detailed in the NCA Climate Trends and Outlooks (Kunkel et al. 2012) with its references. Pryor (2012) also contains chapters detailing the most current evidence for the region.
Altered fish communities: Warmer lakes and streams will certainly provide more habitat for warm water species as conditions in northern reaches of the basin become more suitable for warm water fish and vacated by cool and cold water species. However, habitat for cold-water fish, though not expected to disappear, will shrink substantially, though it could also expand in some areas, such as Lake Superior. The effects of climate change on expanding the range of all types of fish is dependent on the availability of forage fish, as higher temperatures also necessitate greater food intake.
Increased abundances of invasive species: As climate change alters water temperatures, habitat, and fish communities, conditions that once were barriers to alien species become conduits for establishment and spread. This migration will alter drastically the fish communities of the Great Lakes basin. Climate change will likely also heighten the impact of invasive species already present in the Great Lakes basin. Warmer winter conditions, for instance, have the potential to benefit alewife, round gobies, ruffe, sea lamprey, rainbow smelt, and other non-native species, species that have spread rapidly throughout the basin and have already inflicted significant ecological and economic harm.
Increased precipitation, evaporation, and extreme events: Scientists widely predict an increase in precipitation in the Great Lakes region during the winter, spring, and fall, though much of this increase will occur as extreme weather. The increase in precipitation may be offset by more evaporation in the winter due to reduced ice cover, and more evaporation and evapotranspiration in the summer from heat, though such summer evaporation may not be as significant as previously projected. Extreme events—like intense heat waves, unusually mild winters, severe storms, and lack of ice cover on lakes that normally freeze over—are expected to occur with greater frequency. Both high- and low-flow days in streams are expected to increase 22% and 15%, respectively, by 2100.
Declining beach health and harmful algal blooms: Extreme events increase runoff, adding sediments, pollutants, and nutrients to the Great Lakes. The Midwest has experienced rising trends in precipitation and runoff. Agricultural runoff, in combination with increased water temperatures, has caused considerable non-point source pollution problems in recent years, with increased phosphorus and nitrogen loadings from farms contributing to more and prolonged occurrences of anoxic
Draft for Public Comment Chapter 18 – Midwest (V. 11 Jan 2013)
DRAFT FOR PUBLIC COMMENT
644
“dead zones” and harmful, lengthy, and dense algae growth. Stormwater runoff that overloads urban sewer systems during extreme events adds to increased levels of toxic substances, sewage, and bacteria in the Great Lakes, affecting water quality, beach health, and human well-being. Increased storm events caused by climate change will lead to an increase in combined sewer overflows.
Decreased ice cover: Increasingly clement winters have shortened the time between when a lake freezes and when it thaws. Scientists have documented a relatively constant decrease in Great Lakes ice cover since the 1970s, particularly for lakes Superior, Michigan, Huron, and Ontario. The loss of ice cover on the Great Lakes has both ecological and economic implications. Ice serves to protect shorelines and habitat from storms and wave power. Less ice—coupled with more frequent and intense storms—leaves shores vulnerable to erosion and flooding and could harm property and fish habitat.
Water levels: The methods of linking climate models to hydrologic models used as the basis for the 2009 NCA that predicted a significant drop in Great Lakes levels by the end of the century have been significantly improved by fully coupling the hydrologic cycle between land, lake, and atmosphere (Lofgren et al. 2011). Without that interaction, (Hayhoe et al. 2010) concluded for continued increases in global emissions (SRES A2 scenario) that increases in winter evaporation from less ice cover and summer evaporation and evapotranspiration from warmer air temperatures would negate increases in precipitation. A recent comprehensive assessment (UGLSB), however, has concluded that with a continuation of current rising emissions trends (A2), the lakes will experience a slight decrease or even a rise in water levels, as the earlier studies tended to overstress the amount of evapotranspiration expected to occur. Although the range of potential future lake levels remains large and includes the earlier projected declining lake levels, scientists project an increase in precipitation in the Great Lakes region (most likely in the form of extreme events), which will contribute to maintenance of or an increase in Great Lakes water levels. However, water level changes are not predicted to be uniform throughout the basin.
Shipping: Ice cover is expected to decrease dramatically by the end of the century, possibly lengthening the shipping season and, thus, facilitating more shipping activity. Although current science suggests water levels in the Great Lakes will likely fall slightly or might even rise over the short run, with even a small drop, climate change could make the costs of shipping increase substantially. For instance, for every inch of draft a 1000-foot ship gives up, its capacity is reduced by 270 tons. Lightened loads today already add about $200,000 in costs to each voyage.
New information and remaining uncertainties
Key issues (uncertainties) are:
Water levels are influenced by the amount of evaporation from decreased ice cover and warmer air temperatures and evapotranspiration from warmer air temperatures, compared to potential increases in inflow from more precipitation. Uncertainties about Great Lakes water levels are high, though most models suggest that the decrease in ice cover will lead to slightly lower water levels, beyond natural fluctuations.
While the spread of invasive species into the system is near-certain (given the rate of introductions over the previous 50 years) without major policy and regulatory changes, the changes in Great Lakes fish communities are based on extrapolation of known fishery responses to expected changing conditions in the basin. Moreover, many variables beyond water temperature and condition affect fisheries, not the least of which is the availability of forage fish. Higher water temperatures

Draft for Public Comment Chapter 18 – Midwest (V. 11 Jan 2013)
DRAFT FOR PUBLIC COMMENT
645
necessitate greater food intake, yet the forage base is changing rapidly in many parts of the Great Lakes basin, thus making the projected impact of climate change on fisheries difficult to discern with very high certainty.
Assessment of confidence based on evidence
Peer reviewed literature about the effects of climate change are in broad agreement that air and surface water temperatures are rising and will continue to do so, that ice cover is declining steadily, and that precipitation and extreme events are on the rise. These changes have well-documented effects on large lake ecosystems, such as effects on algal production, stratification, beach health, and fisheries. Key uncertainties exist about Great Lakes water levels and the impact of climate change on fisheries. Given the evidence and remaining uncertainties, there is very high confidence in this key message, except high confidence for lake levels changing.
1 CONFIDENCE LEVEL
Very High High Medium Low Strong evidence (established
theory, multiple sources, consistent results, well
documented and accepted methods, etc.), high consensus
Moderate evidence (several sources, some consistency,
methods vary and/or documentation limited, etc.),
medium consensus
Suggestive evidence (a few sources, limited consistency, models incomplete, methods emerging, etc.), competing
schools of thought
Inconclusive evidence (limited sources, extrapolations,
inconsistent findings, poor documentation and/or methods not tested, etc.), disagreement
or lack of opinions among experts
2
3 4

Draft for Public Comment Chapter 18 – Midwest (V. 11 Jan 2013)
DRAFT FOR PUBLIC COMMENT
646
References 1 Allen, C., A. Macaladyb, H. Chenchounic, D. Bachelet, N. McDowell, M. Vennetier, T. 2 Kitzberger, A. Rigling, D. Breshear, E. Hoggi, P. Gonzalezk, R. Fensham, Z. Zhangm, J. 3 Castron, N. Demidavao, J.-H. Lim, G. Allard, S. Running, A. Semerci, and N. Cobb, 2010: A 4 global overview of drought and heat-induced tree mortality reveals emerging climate change 5 risks for forests. Forest Ecology and Management, 259, 660-684 6
Amin, M., cited 2012: U.S. Electrical Grid Gets Less Reliable as Outages Increase and R&D 7 Decreases. [Available online at http://tli.umn.edu/blog/security-technology/u-s-electrical-grid-8 gets-less-reliable-as-outages-increase-and-rd-decreases/] 9
Anderson, G.B. and M.L. Bell, 2011: Heat waves in the United States: mortality risk during heat 10 waves and effect modification by heat wave characteristics in 43 US communities. 11 Environmental Health Perspectives, 119, 210-218 12
Angel, J.R. and K.E. Kunkel, 2010: The response of Great Lakes water levels to future climate 13 scenarios with an emphasis on Lake Michigan-Huron. Journal of Great Lakes Research, 36, 51-14 58 15
Ashley, S.T. and V. Meentemeyer, 2004: Climatic analysis of Lyme disease in the United States. 16 Climate Research, 27, 177-187 doi: 10.3354/cr027177 17
Austin, J.A. and S.M. Colman, 2007: Lake Superior summer water temperatures are increasing 18 more rapidly than regional air temperatures: A positive ice-albedo feedback. Geophys. Res. Lett., 19 34, L06604 doi: 10.1029/2006gl029021, [Available online at 20 http://dx.doi.org/10.1029/2006GL029021] 21
Baun, S.D., cited 2012: Frequency Mapping of Maximum Water Equivalent of March Snow 22 Cover over Minnesota and the Eastern Dakotas, NWS CR Tech Memo CR-113, 28. [Available 23 online at http://www.crh.noaa.gov/crh/?n=tm-113] 24
Birdsey, R., K. Pregitzer, and A. Lucier, 2006: Forest carbon management in the United States: 25 1600–2100. Journal of Environmental Quality, 35, 461–1469 26
Bradley, B., D. Wilcove, and M. Oppenheimer, 2010: Climate change increases risk of plant 27 invasion in the Eastern United States. Biological Invasions, 12, 1855-1872 28
Bronte, C.R., M.P. Ebener, D.R. Schreiner, D.S. DeVault, M.M. Petzold, D.A. Jensen, C. 29 Richards, and S.J. Lozano, 2003: Fish community change in Lake Superior, 1970–2000. 30 Canadian Journal of Fisheries and Aquatic Sciences, 60, 1552-1574 doi: 10.1139/f03-136 31
Brook, B.W., N.S. Sodhi, and C.J.A. Bradshaw, 2008: Synergies among extinction drivers under 32 global change. Trends in Ecology & Evolution, 23, 453-460 33
Budikova, D., J. Coleman, S. Strope, and A. Austin, 2010: Hydroclimatology of the 2008 34 Midwest floods. Water resources research, 46, W12524 35
36

Draft for Public Comment Chapter 18 – Midwest (V. 11 Jan 2013)
DRAFT FOR PUBLIC COMMENT
647
Council for Agricultural Science and Technology, 2011: Carbon sequestration and greenhouse 1 gas fluxes in agriculture: challenges and opportunities, Task Force Report No.142. [Available 2 online at http://www.cast-3 science.org/file.cfm/media/news/CAST_TF_Report_142_Interpretive_Sum_EFA290A703478.p4 df] 5
Dai, A., 2010: Drought under global warming: A review. Wiley Interdisciplinary Reviews: 6 Climate Change, 2, 45-65 7
Dale, V.H., R.A. Efroymson, and K.L. Kline, 2011: The land use–climate change–energy nexus. 8 Landscape Ecology, 26, 755–773 9
Dobiesz, N.E. and N.P. Lester, 2009: Changes in mid-summer water temperature and clarity 10 across the Great Lakes between 1968 and 2002. Journal of Great Lakes Research, 35, 371-384 11 doi: 10.1016/j.jglr.2009.05.002, [Available online at <Go to ISI>://000269845700007] 12
Ellison, C.A., C.A. Sanocki, D.L. Lorenz, G.B. Mitton, and G.A. Kruse, 2011: Floods of 13 September 2010 in Southern Minnesota, U.S. Geological Survey Scientific Investigations Report 14 2011-5045, 37 pp 15
ERS, cited 2012: Data sets. State fact sheets. U.S. Department of Agriculture, Economic 16 Research Service. [Available online at http://www.ers.usda.gov/StateFacts/] 17
Ferris, G., cited 2009: State of the Great Lakes 2009. Climate change: Ice duration on the Great 18 Lakes. Environment Canada and United States Environmental Protection Agency. [Available 19 online at http://www.epa.gov/solec/sogl2009/] 20
Ficke, A.D., C.A. Myrick, and L.J. Hansen, 2007: Potential impacts of global climate change on 21 freshwater fisheries. Reviews in Fish Biology and Fisheries, 17, 581-613 doi: 10.1007/s11160-22 007-9059-5 23
Foden, W., G. Mace, J.-C. Vié, A. Angulo, S. Butchart, L. DeVantier, H. Dublin, A. Gutsche, S. 24 Stuart, and E. Turak, 2008: Species susceptibility to climate change impacts. The 2008 Review of 25 The IUCN Red List of Threatened Species, J.-C. Vié, C. Hilton-Taylor, and S. N. Stuart, Eds., 26 IUCN 27
Gelfand, I., S.S. Snapp, and G.P. Robertson, 2010: Energy efficiency of conventional, organic, 28 and alternative cropping systems for food and fuel at a site in the U.S. Midwest. Environmental 29 Science and Technology, 44, 4006-4011 30
Gotham, D., J.R. Angel, and S.C. Pryor, 2012: Vulnerability of the electricity and water sectors 31 to climate change in the Midwest. Climate Change in the Midwest: Impacts, Risks, Vulnerability 32 and Adaptation, S. C. Pryor, Ed., To be published by Indiana University Press (October 2012). 33 ISBN: 978-0-253-00692-0 34
Grabow, M.L., S.N. Spak, T. Holloway, B. Stone, Jr., A.C. Mednick, and J.A. Patz, 2012: Air 35 Quality and Exercise-Related Health Benefits from Reduced Car Travel in the Midwestern 36

Draft for Public Comment Chapter 18 – Midwest (V. 11 Jan 2013)
DRAFT FOR PUBLIC COMMENT
648
United States. Environmental Health Perspectives, 120, 68-76 doi: 10.1289/ehp.1103440, 1 [Available online at <Go to ISI>://WOS:000299650400028] 2
Gu, L., P.J. Hanson, W. Mac Post, D.P. Kaiser, B. Yang, R. Nemani, S.G. Pallardy, and T. 3 Meyers, 2008: The 2007 eastern US spring freezes: Increased cold damage in a warming world? 4 BioScience, 58, 253-262 doi: 10.1641/b580311, [Available online at <Go to 5 ISI>://WOS:000254070700011] 6
Hatfield, J.L., K.J. Boote, B.A. Kimball, L.H. Ziska, R.C. Izaurralde, D. Ort, A.M. Thomson, 7 and D. Wolfe, 2011: Climate Impacts on Agriculture: Implications for Crop Production. 8 Agronomy Journal, 103, 351-370 doi: DOI 10.2134/agronj2010.0303, [Available online at <Go 9 to ISI>://000288829000007] 10
Hayhoe, K., J. VanDorn, T. Croley III, N. Schlegal, and D. Wuebbles, 2010: Regional Climate 11 Change Projections for Chicago and the U.S. Great Lakes. Journal of Great Lakes Research, 36, 12 7-21 13
Hellmann, J.J., J.E. Byers, B.G. Bierwagen, and J.S. Dukes, 2008: Five Potential Consequences 14 of Climate Change for Invasive Species. Conservation Biology, 22, 534-543 doi: 15 10.1111/j.1523-1739.2008.00951.x 16
Hellmann, J.J., K.J. Nadelhoffer, L.R. Iverson, L. Ziska, S.N. Matthews, P. Myers, A.M. Prasad, 17 and M.P. Peters, 2010: Climate Change Impacts on Terrestrial Ecosystems in the Chicago 18 Region. Great Lakes Research, 36, 74-85, [Available online at 19 http://www.ushrl.saa.ars.usda.gov/research/publications/publications.htm?seq_no_115=238766] 20
Holloway, T., S.N. Spak, D. Barker, M. Bretl, C. Moberg, K. Hayhoe, J. Van Dorn, and D. 21 Wuebbles, 2008: Change in ozone air pollution over Chicago associated with global climate 22 change. Journal of Geophysical Research-Atmospheres, 113 doi: D22306 23 10.1029/2007jd009775, [Available online at <Go to ISI>://WOS:000261245000001] 24
Iverson, L.R., A.M. Prasad, S.N. Matthews, and M. Peters, 2008: Estimating potential habitat for 25 134 eastern US tree species under six climate scenarios. Forest Ecology and Management, 254, 26 390-406, [Available online at http://www.treesearch.fs.fed.us/pubs/13412 ] 27
Jacob, D.J. and D.A. Winner, 2009: Effect of climate change on air quality. Atmospheric 28 Environment, 43, 51-63 doi: 10.1016/j.atmosenv.2008.09.051, [Available online at <Go to 29 ISI>://WOS:000262147400007] 30
Jump, A.S., C. Matyas, and J. Penuelas, 2009: The altitude-for-latitude disparity in the range 31 retractions of woody species. Trends in Ecology & Evolution, 24, 694-701 doi: 32 10.1016/j.tree.2009.06.007, [Available online at <Go to ISI>://WOS:000272278000008] 33
Kunkel, K.E., L.E. Stevens, S.E. Stevens, E. Janssen, S. Hilberg, M. Timlin, L. Stoecker, and N. 34 Westcott, 2012: Climate of the Midwest U.S. Prepared for the use of chapter authors of the 2013 35 National Climate Assessment Report 36
Draft for Public Comment Chapter 18 – Midwest (V. 11 Jan 2013)
DRAFT FOR PUBLIC COMMENT
649
Leakey, A.D.B., 2009: Rising atmospheric carbon dioxide concentration and the future of C-4 1 crops for food and fuel. Proceedings of the Royal Society B-Biological Sciences, 276, 2333-2343 2 doi: 10.1098/rspb.2008.1517, [Available online at <Go to ISI>://WOS:000266990700001] 3
Liu, Y., J. Stanturf, and S. Goodrick, 2010: Trends in global wildfire potential in a changing 4 climate. Forest Ecology and Management, 259, 685-697 doi: 10.1016/j.foreco.2009.09.002, 5 [Available online at <Go to ISI>://WOS:000275014400003 6
Lobell, D.B. and C.B. Field, 2007: Global scale climate - crop yield relationships and the 7 impacts of recent warming. Environmental Research Letters, 2 doi: 014002 10.1088/1748-8 9326/2/1/014002, [Available online at <Go to ISI>://WOS:000253652700004] 9
Lofgren, B. and A. Gronewold, 2012: Draft white paper-Midwest region, water resources sector. 10 Midwest technical input report: Prepared for the US National Climate Assessment, J. Winkler, 11 J. Andresen, and J. Hatfield, Eds. 12
Lofgren, B.M., T.S. Hunter, and J. Wilbarger, 2011: Effects of using air temperature as a proxy 13 for potential evapotranspiration in climate change scenarios of Great Lakes basin hydrology. 14 Journal of Great Lakes Research, 37, 744-752 15
Mackey, S., 2012: Great Lakes nearshore and coastal systems. Midwest technical input report: 16 Prepared for the US National Climate Assessment, J. Winkler, J. Andresen, and J. Hatfield, Eds. 17
McLellan, S.L., E.J. Hollis, M.M. Depas, M. Van Dyke, J. Harris, and C.O. Scopel, 2007: 18 Distribution and fate of Escherichia coli in Lake Michigan following contamination with urban 19 stormwater and combined sewer overflows. Journal of Great Lakes Research, 33, 566-580, 20 [Available online at <Go to ISI>://WOS:000250365400005] 21
Mearns, L.O., R. Arritt, S. Biner, M. Bukovsky, S. Stain, and NARCCAP team 2012: The North 22 American Regional Climate Change Assessment Program: Overview of Phase I Results. 23 Bulletin of the American Meteorological Society, In press 24
Midwest Independent Transmission System Operator, cited 2011: MISO transmission expansion 25 plan 2011. [Available online at 26 https://www.midwestiso.org/Library/Repository/Study/MTEP/MTEP11/MTEP11DraftReport.pd27 f] 28
Millerd, F., 2011: The Potential Impact of Climate Change on Great Lakes International 29 Shipping. Climatic Change, 104, 629-652 30
Milly, P.C.D. and K.A. Dunne, 2011: On the Hydrologic Adjustment of Climate-Model 31 Projections: The Potential Pitfall of Potential Evapotranspiration. Earth Interactions, 15, 1-14 32 doi: 10.1175/2010ei363.1 33
Mishra, V. and K.A. Cherkauer, 2010: Retrospective droughts in the crop growing season: 34 Implications to corn and soybean yield in the Midwestern United States. Agricultural and Forest 35 Meteorology, 150, 1030-1045 36

Draft for Public Comment Chapter 18 – Midwest (V. 11 Jan 2013)
DRAFT FOR PUBLIC COMMENT
650
Mishra, V., K.A. Cherkauer, and S. Shukla, 2010: Assessment of drought due to historic climate 1 variability and projected future climate change in the midwestern United States. Journal of 2 Hydrometeorology, 11, 46-68 3
Mutel, C.F., 2010: A Watershed Year: Anatomy of the Iowa floods of 2008. University of Iowa 4 Press. 284 pp 5
National Agricultural Statistics Service, 2012: Crop production annual summary. [Available 6 online at http://usda.mannlib.cornell.edu/MannUsda/viewDocumentInfo.do?documentID=1047] 7
Niyogi, D. and V. Mishra, 2012: Climate - Agriculture Vulnerability Assessment for the 8 Midwestern United States. Chapter 5. Climate Change in the Midwest: Impacts, Risks, 9 Vulnerability and Adaptation, S. C. Pryor, Ed., To be published by Indiana University Press 10 (October 2012). ISBN: 978-0-253-00692-0 11
NRC, 2010: Hidden Costs of Energy: Unpriced Consequences of Energy Production and Use. 12 Vol. ISBN: 978-0-309-14640-1, National Research Council: Committee on Health, 13 Environmental, and Other External Costs and Benefits of Energy Production and Consumption, 14 506 pp. 15
Ogden, N.H., L.R. Lindsay, G. Beauchamp, D. Charron, A. Maarouf, C.J. O'Callaghan, D. 16 Waltner-Toews, and I.K. Barker, 2004: Investigation of relationships between temperature and 17 developmental rates of tick Ixodes scapularis (Acari : Ixodidae) in the laboratory and field. 18 Journal of Medical Entomology, 41, 622-633 doi: 10.1603/0022-2585-41.4.622, [Available 19 online at <Go to ISI>://WOS:000222901800013] 20
Palecki, M.A., S.A. Changnon, and K.E. Kunkel, 2001: The Nature and Impacts of the July 1999 21 Heat Wave in the Midwestern United States: Learning from the Lessons of 1995. Bulletin of the 22 American Meteorological Society, 82, 1353-1368 23
Pan, Y., R.A. Birdsey, J. Fang, R. Houghton, P.E. Kauppi, W.A. Kurz, O.L. Phillips, A. 24 Shvidenko, S.L. Lewis, J.G. Canadell, P. Ciais, R.B. Jackson, S.W. Pacala, A.D. McGuire, S. 25 Piao, A. Rautiainen, S. Sitch, and D. Hayes, 2011: A large and persistent carbon sink in the 26 world's forests. Science, 333, 988-993 doi: 10.1126/science.1201609, [Available online at 27 http://www.ncbi.nlm.nih.gov/pubmed/21764754] 28
Pan, Z.T., D. Andrade, and N. Gosselin, 2012: Vulnerability of soil carbon reservoirs in the 29 Midwest to climate change. Climate Change in the Midwest: Impacts, Risks, Vulnerability and 30 Adaptation, S. C. Pryor, Ed., To be published by Indiana University Press (October 2012). ISBN: 31 978-0-253-00692-0 32
Pan, Z.T., M. Segal, X. Li, and B. Zib, 2009: Global climate change impact on the Midwestern 33 USA - A summer cooling trend. Understanding Climate Change:Climate variability, 34 predictability and change in the Midwestern United States, S. C. Pryor, Ed., Indiana University 35 Press, 29-41 36
Parmesan, C., 2006: Ecological and evolutionary responses to recent climate change. Annual 37 Review of Ecology Evolution and Systematics, 37, 637-669 38

Draft for Public Comment Chapter 18 – Midwest (V. 11 Jan 2013)
DRAFT FOR PUBLIC COMMENT
651
Patz, J.A., S.J. Vavrus, C.K. Uejio, and S.L. McLellan, 2008: Climate Change and Waterborne 1 Disease Risk in the Great Lakes Region of the US. American Journal of Preventive Medicine, 2 35, 451-458 doi: 10.1016/j.amepre.2008.08.026, [Available online at <Go to 3 ISI>://000260396600009] 4
Peng, R.D., J.F. Bobb, C. Tebaldi, L. McDaniel, M.L. Bell, and F. Dominici, 2011: Toward a 5 Quantitative Estimate of Future Heat Wave Mortality under Global Climate Change. 6 Environmental Health Perspectives, 119, 701-706 doi: 10.1289/ehp.1002430, [Available online 7 at <Go to ISI>://WOS:000290089800038] 8
Perera, E.M., T. Sanford, J.L. White-Newsome, L.S. Kalkstein, J.K. Vanos, and K. Weir, cited 9 2012: Heat in the Heartland: 60 years of warming in the Midwest. Union of Concerned 10 Scientists. [Available online at 11 http://usda.mannlib.cornell.edu/MannUsda/viewDocumentInfo.do?documentID=1047] 12
Prasad, A., L. Iverson, S. Matthews, and M. Peters, cited 2007: A climate change atlas for 134 13 forest tree species of the eastern United States [database]. [Available online at 14 http://www.nrs.fs.fed.us/atlas/tree] 15
Pryor, S.C., 2012: Climate Change in the Midwest: Impacts, Risks, Vulnerability and Adaptation. 16 To be published October 2012. Indiana University Press. 17
Pryor, S.C. and R.J. Barthelmie, 2012: The Midwestern USA: Socio-economic context and 18 physical climate. Chapter 2. Climate Change in the Midwest: Impacts, Risks, Vulnerability and 19 Adaptation, S. C. Pryor, Ed., To be published by Indiana University Press (October 2012). ISBN: 20 978-0-253-00682-0 21
Pryor, S.C., K.E. Kunkel, and J.T. Schoof, 2009a: Did precipitation regimes change during the 22 twentieth century? . Understanding Climate Change: Climate variability, predictability and 23 change in the Midwestern United States, Indiana University Press, 100-112 24
Pryor, S.C., J.A. Howe, and K.E. Kunkel, 2009b: How spatially coherent and statistically robust 25 are temporal changes in extreme precipitation in the contiguous USA? International Journal of 26 Climatology, 29, 31-45 doi: 10.1002/joc.1696, [Available online at <Go to 27 ISI>://WOS:000262387000004] 28
Pryor, S.C., R.J. Barthelmie, and J.T. Schoof, in press: High-resolution projections of climate 29 impacts for the Midwestern USA. Climate Research doi: 10.3354/cr01143 30
Pryor, S.C., R.J. Barthelmie, D.T. Young, E.S. Takle, R.W. Arritt, D. Flory, W.J. Gutowski, A. 31 Nunes, and J. Roads, 2009: Wind speed trends over the contiguous United States. Journal of 32 Geophysical Research, 114,D14105, 10.1029/2008JD011416 doi: 10.1029/2008jd011416, 33 [Available online at <Go to ISI>://WOS:000268351600004] 34
Rahel, F.J., B. Bierwagen, and Y. Taniguchi, 2008: Managing Aquatic Species of Conservation 35 Concern in the Face of Climate Change and Invasive Species. Conservation Biology, 22, 551-36 561 doi: 10.1111/j.1523-1739.2008.00953.x 37

Draft for Public Comment Chapter 18 – Midwest (V. 11 Jan 2013)
DRAFT FOR PUBLIC COMMENT
652
Rahmstorf, S. and D. Coumou, 2011: Increase of extreme events in a warming world. 1 Proceedings of the National Academy of Sciences of the United States of America, 108, 17905-2 17909 doi: 10.1073/pnas.1101766108, [Available online at <Go to 3 ISI>://WOS:000296373400015] 4
Reich, P.B., 2011: Taking stock of forest carbon. Nature Climate Change, 1, 346–347 5
Reutter, J.M., J. Ciborowski, J. DePinto, D. Bade, D. Baker, T.B. Bridgeman, D.A. Culver, S. 6 Davis, E. Dayton, D. Kane, R.W. Mullen, and C.M. Pennuto, 2011: Lake Erie nutrient loading 7 and harmful algal blooms: Research findings and management implications. Final report of the 8 Lake Erie Millennium Network synthesis team 9
Robertson, G.P., T.W. Bruulsema, R. Gehl, D. Kanter, D.L. Mauzerall, A. Rotz, and C. 10 Williams, 2012: Climate-nitrogen interactions in agriculture. Biogeochemistry, In press 11
Robertson, G.P., V.H. Dale, O.C. Doering, S.P. Hamburg, J.M. Melillo, M.M. Wander, W.J. 12 Parton, P.R. Adler, J.N. Barney, R.M. Cruse, C.S. Duke, P.M. Fearnside, R.F. Follett, H.K. 13 Gibbs, J. Goldemberg, D.J. Miadenoff, D. Ojima, M.W. Palmer, A. Sharpley, L. Wallace, K.C. 14 Weathers, J.A. Wiens, and W.W. Wilhelm, 2008: Sustainable biofuels redux. Science, 322, 49 15
Rosenzweig, C., F.N. Tubiello, R. Goldberg, E. Mills, and J. Bloomfield, 2002: Increased crop 16 damage in the US from excess precipitation under climate change. Global Environmental 17 Change, 12, 197-202 18
Sauer, E.P., J.L. VandeWalle, M.J. Bootsma, and S.L. McLellan, 2011: Detection of the human 19 specific Bacteroides genetic marker provides evidence of widespread sewage contamination of 20 stormwater in the urban environment. Water Research, 45, 4081-4091 doi: 21 10.1016/j.watres.2011.04.049, [Available online at <Go to ISI>://WOS:000293116400002] 22
Schoof, J.T., 2009: Historical and projected changes in the length of the frost-free season. 23 Understanding climate change: Climate variability, predictability and change in the Midwestern 24 United States, S. C. Pryor, Ed., Indiana University Press, 42-54 25
——, 2012: Historical and projected changes in human heat stress in the Midwestern United 26 States. Climate Change in the Midwest: Impacts, Risks, Vulnerability and Adaptation, S. C. 27 Pryor, Ed., To be published by Indiana University Press (October 2012). ISBN: 978-0-253-28 00682-0 29
Schoof, J.T., S.C. Pryor, and J. Suprenant, 2010: Development of daily precipitation projections 30 for the United States based on probabilistic downscaling. Journal of Geophysical Research, 115, 31 doi:10.1029/2009JD013030 32
Sheridan, S.C., A.J. Kalkstein, and L.S. Kalkstein, 2009: Trends in Heat-related Mortality in the 33 United States, 1975-2004. Natural Hazards, 145-160 doi: DOI 10.1007/s11069-008-9327-2 34
Smith, A.L., N. Hewitt, N. Klenk, D.R. Bazely, N. Yan, S. Wood, I. Henriques, J.I. MacLellan, 35 and C. Lipsig-Mummé, 2012: Effects of climate change on the distribution of invasive alien 36

Draft for Public Comment Chapter 18 – Midwest (V. 11 Jan 2013)
DRAFT FOR PUBLIC COMMENT
653
species in Canada: a knowledge synthesis of range change projections in a warming world. 1 Environmental Reviews, 20, 1-16 doi: 10.1139/a11-020 2
Sousounis, P. and J.M. Bisanz, Eds., 2000: Preparing for a changing climate: Great Lakes: A 3 summary by the Great Lakes Regional Assessment Group for the U.S. Global Change Research 4 Program. University of Michigan, Atmospheric, Oceanic and Space Sciences Department. 5
Sovacool, B.K., 2009: Rejecting renewables: The socio-technical impediments to renewable 6 electricity in the United States. Energy Policy, 37, 4500-4513 7
Swanston, C., M. Janowiak, L. Iverson, L. Parker, D. Mladenoff, L. Brandt, P. Butler, M. St. 8 Pierre, A.M. Prasad, S. Matthews, M. Peters, and D. Higgins, 2011: Ecosystem vulnerability 9 assessment and synthesis: a report from the Climate Change Response Framework Project in 10 northern Wisconsin., 142 pp 11
Trumpickas, J., B.J. Shuter, and C.K. Minns, 2009: Forecasting impacts of climate change on 12 Great Lakes surface water temperatures. Journal of Great Lakes Research, 35, 454-463 doi: 13 10.1016/j.jglr.2009.04.005 14
U.S. Environmental Protection Agency, cited 2012: Inventory of U.S. greenhouse gas emissions 15 and sinks: 1990-2010. EPA [Available online at 16 http://epa.gov/climatechange/emissions/usinventoryreport.html] 17
UGLSB, 2012: Lake Superior regulation: Addressing uncertainty in upper Great Lakes water 18 levels. Final report to the International Joint Commission: Summary of findings and 19 recommendations 20
Vavrus, S., J.E. Walsh, W.L. Chapman, and D. Portis, 2006: The behavior of extreme cold air 21 outbreaks under greenhouse warming. International Journal of Climatology, 26, 1133-1147 doi: 22 10.1002/joc.1301, [Available online at <Go to ISI>://WOS:000239029600001] 23
Villarini, G., J.A. Smith, M.L. Baeck, R. Vitolo, D.B. Stephenson, and W.F. Krajewski, 2011: 24 On the frequency of heavy rainfall for the Midwest of the United States. Journal of Hydrology, 25 400, 103-120 26
Wang, J., X. Bai, H. Hu, A. Clites, M. Colton, and B. Lofgren, 2012: Temporal and Spatial 27 Variability of Great Lakes Ice Cover, 1973-2010*. Journal of Climate, 25, 1318-1329 28
Ward, M.P., M. Levy, H.L. Thacker, M. Ash, S.K.L. Norman, G.E. Moore, and P.W. Webb, 29 2004: Investigation of an outbreak of encephalomyelitis caused by West Nile virus in 136 horses. 30 Javma-Journal of the American Veterinary Medical Association, 225, 84-89 doi: 31 10.2460/javma.2004.225.84, [Available online at <Go to ISI>://WOS:000222278500037] 32
Weisskopf, M.G., H.A. Anderson, S. Foldy, L.P. Hanrahan, K. Blair, T.J. Torok, and P.D. 33 Rumm, 2002: Heat wave morbidity and mortality, Milwaukee, Wis, 1999 vs 1995: An improved 34 response? American Journal of Public Health, 92, 830-833, [Available online at <Go to 35 ISI>://000175222200037] 36

Draft for Public Comment Chapter 18 – Midwest (V. 11 Jan 2013)
DRAFT FOR PUBLIC COMMENT
654
Williams, C.A., G.J. Collatz, J. Masek, and S.N. Goward, 2012: Carbon consequences of forest 1 disturbance and recovery across the conterminous United States. Global Biogeochem. Cycles, 26, 2 GB1005 doi: 10.1029/2010gb003947, [Available online at 3 http://dx.doi.org/10.1029/2010GB003947] 4
Winkler, J.A., J. Andresen, J. Bisanz, G. Guentchev, J. Nugent, K. Primsopa, N. Rothwell, C. 5 Zavalloni, J. Clark, H.K. Min, A. Pollyea, and H. Prawiranta, 2012: Michigan's Tart Cherry 6 Industry: Vulnerability to Climate Variability and Change. Chapter 8. Climate Change in the 7 Midwest: Impacts, Risks, Vulnerability and Adaptation, S. C. Pryor, Ed., To be published by 8 Indiana University Press (October 2012). ISBN: 978-0-253-00692-0 9
Wuebbles, D.J., K. Hayhoe, and J. Parzen, 2010: Introduction: Assessing the effects of climate 10 change on Chicago and the Great Lakes. Journal of Great Lakes Research, 36, 1-6 doi: 11 10.1016/j.jglr.2009.09.009 12
Ziska, L., K. Knowlton, C. Rogers, D. Dalan, N. Tierney, M.A. Elder, W. Filley, J. Shropshire, 13 L.B. Ford, C. Hedberg, P. Fleetwood, K.T. Hovanky, T. Kavanaugh, G. Fulford, R.F. Vrtis, J.A. 14 Patz, J. Portnoy, F. Coates, L. Bielory, and D. Frenz, 2011: Recent warming by latitude 15 associated with increased length of ragweed pollen season in central North America. 16 Proceedings of the National Academy of Sciences of the United States of America, 108, 4248-17 4251 doi: 10.1073/pnas.1014107108, [Available online at <Go to ISI>://000288120400079] 18
19