Public Comment Draft
44
Public Comment Draft California’s Historical Fire Activity before Modern Fire Suppression Prepared by the California Air Resources Board November 2021
Transcript of Public Comment Draft

Public Comment DraftCalifornia’s Historical Fire Activity before Modern Fire Suppression
Prepared by the California Air Resources BoardNovember 2021
i
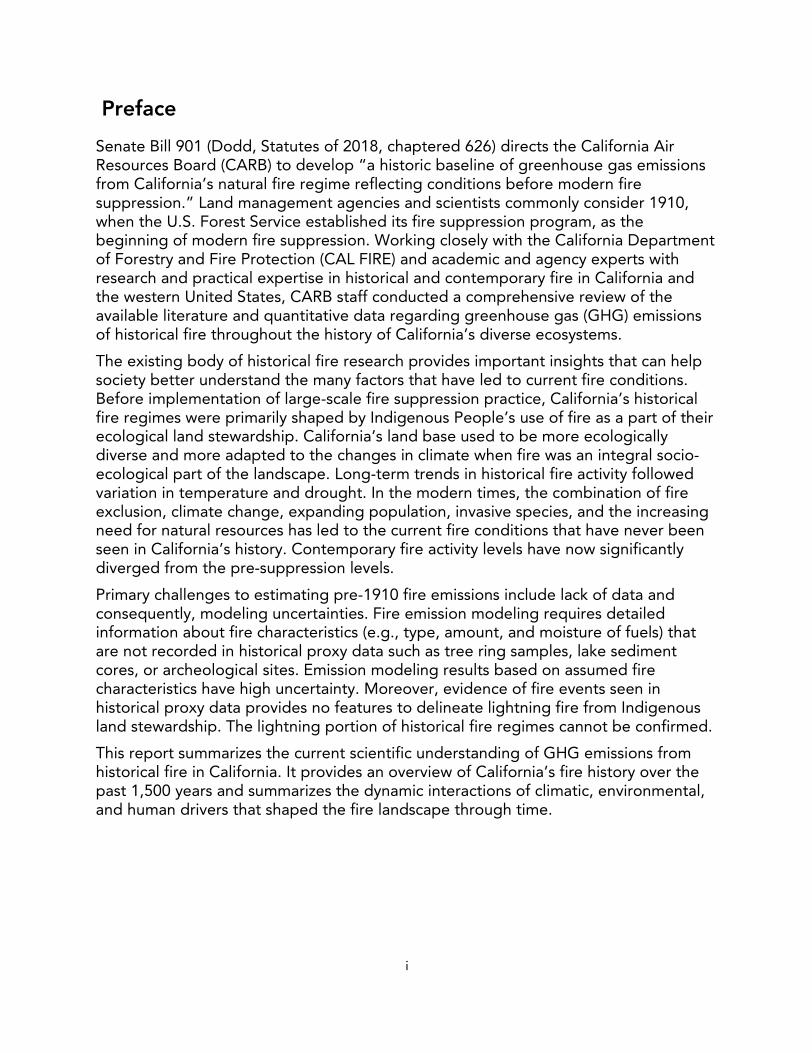
Preface
Senate Bill 901 (Dodd, Statutes of 2018, chaptered 626) directs the California Air Resources Board (CARB) to develop “a historic baseline of greenhouse gas emissions from California’s natural fire regime reflecting conditions before modern fire suppression.” Land management agencies and scientists commonly consider 1910, when the U.S. Forest Service established its fire suppression program, as the beginning of modern fire suppression. Working closely with the California Department of Forestry and Fire Protection (CAL FIRE) and academic and agency experts with research and practical expertise in historical and contemporary fire in California and the western United States, CARB staff conducted a comprehensive review of the available literature and quantitative data regarding greenhouse gas (GHG) emissions of historical fire throughout the history of California’s diverse ecosystems.
The existing body of historical fire research provides important insights that can help society better understand the many factors that have led to current fire conditions. Before implementation of large-scale fire suppression practice, California’s historical fire regimes were primarily shaped by Indigenous People’s use of fire as a part of their ecological land stewardship. California’s land base used to be more ecologically diverse and more adapted to the changes in climate when fire was an integral socio-ecological part of the landscape. Long-term trends in historical fire activity followed variation in temperature and drought. In the modern times, the combination of fire exclusion, climate change, expanding population, invasive species, and the increasing need for natural resources has led to the current fire conditions that have never been seen in California’s history. Contemporary fire activity levels have now significantly diverged from the pre-suppression levels.
Primary challenges to estimating pre-1910 fire emissions include lack of data and consequently, modeling uncertainties. Fire emission modeling requires detailed information about fire characteristics (e.g., type, amount, and moisture of fuels) that are not recorded in historical proxy data such as tree ring samples, lake sediment cores, or archeological sites. Emission modeling results based on assumed fire characteristics have high uncertainty. Moreover, evidence of fire events seen in historical proxy data provides no features to delineate lightning fire from Indigenous land stewardship. The lightning portion of historical fire regimes cannot be confirmed.
This report summarizes the current scientific understanding of GHG emissions from historical fire in California. It provides an overview of California’s fire history over the past 1,500 years and summarizes the dynamic interactions of climatic, environmental, and human drivers that shaped the fire landscape through time.

ii
Acknowledgment
CARB staff would like to thank all of the scientists who have contributed to understanding of California’s fire history. Additionally, CARB staff would like to thank the following academic and agency experts for spending their time and sharing their insights in the preparation of this report. CARB staff could not have completed this task without their guidance. The science advisors are:
· Alan Taylor, Ph.D. –Pennsylvania State University· Donald Falk, Ph.D. –University of Arizona· Don Hankins, Ph.D. –California State University, Chico· Frank Lake, Ph.D. –United States Forest Service, Pacific Southwest Research
Station· Glen MacDonald, Ph.D. –University of California, Los Angeles· Jennifer Marlon, Ph.D. –Yale University· Scott Stephens, Ph.D. –University of California, Berkeley

iii
Executive Summary
This report summarizes the current scientific understanding of GHG emissions from historical fire in California. Section 4 of Senate Bill (SB) 901 - Wildfires (Dodd, statutes of 2018, chaptered 626), codified at Section 38535 of the California Health & Safety Code (H&SC), directs the California Air Resources Board (CARB) to work in consultation with the California Department of Forestry and Fire Protection (CAL FIRE) and academic and agency experts to develop “a historic baseline of greenhouse gas emissions from California’s natural fire regime reflecting conditions before modern fire suppression.” In the preparation of this report, CARB staff has worked closely with the staff of CAL FIRE, and academic and agency experts with research and practical expertise in historical and contemporary fire in California and the western United States. This report provides an overview of California’s fire history over the past 1,500 years and summarizes the dynamics of interactions of climatic, environmental, and human drivers that shaped the fire landscape of the time.
Fundamentals of Fire on the Landscape
Available proxy data on historical fire go back for tens of thousands of years. These proxy data indicate that fire has always been a part of California ecosystems [1]. Fire is a natural process that is part of the Earth’s carbon cycle. It provides critical ecosystem services that sustain the life cycle of plant communities that in turn, support humans and animals globally. The natural ecosystem and socio-cultural functions of burning include stimulating seed germination, replenishing soil nutrients, removing biomass, reduce competition among trees and maintain open stand structure, reducing the fuels that feed more severe fires, and maintaining ecosystem and habitat diversity.
Factors that Influence Fire Characteristics and Emissions
Fire on the landscape is a complex dynamic process that is influenced by many environmental and cultural-societal drivers that have been changing continually through time. Climate has significant influences on wildland fires and emissions. Higher temperatures increase the length of both growing and fire seasons, which then increase fuels, decrease fuel moisture, and increase the likelihood of sustained fire ignitions, all of which contribute to a higher potential for burning. Additionally, long-term changes in temperature alter vegetation cover, shifting the composition of plant communities, and converting forests to non-forest land types [2]. Annual variability in timing and magnitude of precipitation, including periods of drought, impact the health of trees, the combustibility of fuels and the likelihood of fire. The distribution, timing and types of ignition sources play important roles in the dynamics of fire over large regions. Historical ignition sources include lightning strikes, Indigenous cultural burning, and other sources.

Review of Data Regarding Historical Fire Emissions
In order to model fire emissions, area burned, percent of canopy consumed, emission factors, vegetation type, fuel quantity, fuel moisture, and fire behavior at the time of burn are needed as model inputs. Records in this detail are not available for historical burning. Instead, staff reviewed analyses of burn scars in tree rings, charcoal in lake sediment cores, and oral histories as the basis for understanding what historical fire emissions might have been before modern fire suppression. Insufficient data exists to derive a statewide California-specific time series of historical fire over that last several hundred years. Staff also consulted academic and agency experts in this review. Burn scars in trees can provide historical fire frequency and information about individual fires; and if tree scar samples are available over a region, information about fire extent in different years can be estimated. Measuring the amount of charcoal and carbon-dating pollens in lake sediment cores can provide estimates of relative fire activity levels going back tens and thousands of years. Combining various burn scars and sediment cores can provide insights into local fire regimes. Archeology, ethnographic, and oral histories information give valuable information on how Indigenous peoples use fire to steward the land and how their cultural burning practices have changed through time. These proxy data are specific for their location and for certain time periods. Some areas that are fire-prone have no burn scars or lake sediment charcoal data. Several data elements needed for fire emission modeling are not recorded by these proxy data, such as fuel load and moisture.
Estimation of Historical Fire Emissions
To date, there is one study, Stephens et al. (2007) [3], that estimated historical fire emissions in California, and this study focused on the Little Ice Age (1450-1850), which was almost 2 degrees Celsius colder than today. Stephens et al. estimated historical burned acreage per year using a combination of available burn scar data as proxies for fire frequencies for forested lands, information derived from oral histories and expert opinion for non-forested lands, and a vegetation map representing the early 1900’s. To calculate the emission estimates, Stephens et al. made several significant assumptions regarding the fire model inputs: (1) current fire models can represent fire behavior in the Little Ice Age, (2) the lightest fuel loads and the driest fuels conditions that are currently programmed into the model are assumed, (3) vegetation in California did not change between 1450 and 1900, and (4) every acre in California had an equal probability of burning.
Their results suggest that 4.5 to 12 million acres burned per year during the Little Ice Age. As a comparison, California’s 2000–2020 average burned acreage is 0.79 million acres per year (range: 0.09–4.1 million acres). They estimated that 34–90 million metric tons (MMT) of CO2 were emitted each year. In comparison, 2000–2020 emissions range from 1 to 107 MMT CO2 annually, for an annual average of 19 MMT CO2 (TABLE E-1).
iv

v
TABLE E-1: SUMMARY OF STEPHENS ET AL. ESTIMATES AND CONTEMPORARY WILDFIRE
Area burned per year and CO2 emissions estimated by Stephens et al. (2007) for the Little Ice Age are presented alongside contemporary burn acreage and emissions estimates for 2000–2020 [4]. The number in parenthesis indicates the year with the highest value among years 2000–2020.
Using the various assumptions described above, this study estimates an overall average emission factor of 7.5 metric tons of CO2 per acre, whereas currently California fires average about 24 metric tons of CO2 per acre, approximately three times more emissions per acre than in the Stephens et al. (2007) estimates. Fire suppression over the last century has led to an accumulation of fuels that results in more fuels and higher potential emissions per acre. Combustion of this higher fuel load leads to potentially more intense fires and more emissions per acre burned than the estimates for the Little Ice Age indicate even in the absence of climate changes.
Fire History of California
Native American’s Use of Fire on Natural ResourcesSince time immemorial, Indigenous People of California have used and continue to use fire to steward the land to encourage a variety of outcomes [5]. Using Indigenous knowledge, Indigenous cultural burning is typically associated with fires of varying intensities that alter the frequency, seasonality and specificity of fire regimes designed to elicit the ecological, societal, and cultural outcomes that are specific to that time and place [5, 6, 7, 8]. Throughout history, cultural burning has shaped large portions of California [7]. Areas around indigenous settlements, resource collection areas, hunting grounds, and travel routes have been under the care of Indigenous People throughout history [7]. Indigenous fire regimes evolved with the conditions of the time [9] as Native practitioners adapted their methods to changes in climate, vegetation, and the boundary of their territories, as well as changes in their cultural practices. As the environmental and climate conditions of California have continuously changed through time, so has cultural burning and Tribal adaptive practices.
Climate Impacts on FireClimate influences fire in a number of different ways. Temperature impacts the length of the fire and growing seasons, which alters the time in which fires can burn and the amount of available fuels. Annual variability in precipitation and droughts (as well as the dynamic feedback between them) impact the production and moisture of the
Statewide Annual VariableStephens et al.
2007 Estimates for the Little Ice Age
Highestin 2000-2020
Average of2000-2020
Area burned (Million acres) 4.5-12 4.1 (2020) 0.79CO2 fire emissions (MMT CO2) 34-90 106.7 (2020) 19

vi
fuels, which affect the amount of fuel and its combustibility. Climate influences occurrence of lightning [10] and wind [11], and other weather factors that influence the potential distribution and frequency of lightning ignitions and fire behavior. Throughout California, vegetative communities evolve with changes in climate; and as a result, fire behavior, the use of fire by people, and the emissions associated with burning also change in response to those vegetation and climate changes. Climate also influences how people interact with the environment. For example, during periods of intense historical drought, Indigenous Peoples often reduced travel and trade because of a lack of surface water to support long-distance travel [12]. This reduction in movement may have affected their broader landscape burning practices [7].
1500-Year Fire HistoryData for fire activity throughout the western United States show that fire is variable. Aggregating data over large areas reveals correlating patterns of fire following the overall trends of temperature and also the cyclical nature of droughts [13, 14]. FIGURE
E-1 presents relative fire activity measured from 69 lake sediment core samplelocations in the western United States, shown alongside historical drought level in thewestern United States and historical temperature in the Northern Hemisphere. InFIGURE E-1, the gray band is a composite of relative fire activity levels from all 69samples. The wider the band, the more variability in fire activity exist among thesamples. Before the 20th century, there was a coherent range of fire activity levels thatfollowed climate variability. Since the beginning of the 20th century, relative fire activitylevels have diverged significantly from the historical range. By the later part of the 20th
century, some sample locations experienced almost no fire, while others experiencedextremely high fire activity. Fire activity and climate decoupled after IndigenousPeople populations were decimated by disease, dislocation, mistreatment, and state-sanctioned violence brought upon by European-American settlers, and they wereprevented from using fire for land stewardship. The large-scale coordinated firesuppression practices that began in 1910 have excluded fire from California landscape.Unlike the time in history before European-American settlement, when the IndigenousPeople’s way of life was integrated with fire serving many socio-ecological functionson the landscape, currently fire exclusion practices in the western U.S. and large areasof California have led to an increase in fuel accumulation on the landscape, which hasresulted in higher risk of more severe fires and associated emissions [13, 15].

vii
FIGURE E-1: HISTORICAL FIRE ACTIVITY, TEMPERATURE, AND DROUGHT IN THE WESTERN UNITED STATES FROM 500 COMMON ERA (CE) TO 2000 CE
The gray band is a composite of relative fire activity measured from 69 lake sediment core sample locations in the western United States (the map on the right). The width of the gray band indicates the range of variability in fire activity through time and space. The thicker the line, the more variable fire activity is across the west. In the modern era, the gray band is wider than any other times because some of the sampled locations experienced almost no fire, while others experienced extremely high fire activity. This widening of the gray band indicates a significantly greater variability of fire activity across the landscape. Values are normalized by dividing each curve by their respective maximum values. This is done to show all three curves on the same line. Four eras are highlighted: Medieval Warm Period, Indigenous population increase, the Little Ice Age, and Euro-American westward expansion. These data are taken and modified from Marlon et al (2012). Note: 2020 temperature would be at approximately 1.2 on this normalized graph [16]. The blue and purple circles on the map indicate the locations of sediment cores and the green triangles indicate burn scars used to derive the grey band in the graph.
Summary
Historical fire research provides important insights that can help society better understand the many factors that have led to current fire conditions. Before large-scale fire suppression began in the early 20th century, fire was a frequent and extensive feature of California’s landscapes. In modern times, the combination of fire exclusion, climate change, ever expanding human population, and the increasing need for natural resources that led to the current fire conditions has never been seen in California’s history [17, 18, 19]. Contemporary fire activity levels have diverged significantly from pre-suppression levels as a result of the accumulation of vegetation fuels brought about by modern fire suppression, increased drought and higher temperatures driven by climate change, and increasing human pressure on the landscape. Comparisons between historical and contemporary fire activity and emissions should be done with an understanding that the combination of climatic, ecological, and societal conditions that created the current fire landscape has never existed in California’s past.

viii
The current average global temperature is the highest that the Earth has seen in approximately 100,000 years [17]. California’s 2020 fire season marked the highest annual burn acreage in recorded history, more than double that from 2018, the next highest year. As the Earth’s climate continues to warm, wildfire is expected to become more widespread, severe, and extreme [20, 21]. It is therefore critical to continue reducing the human contribution to climate change by reducing fossil fuel combustion emissions. Historical data have shown that, when fire was able to occur without widespread suppression, California’s land base was more ecologically diverse and more adapted to the Earth’s climate variability and fire effects were less severe [22]. Opportunities exist to reintegrate Indigenous People’s knowledge into prescribed burning and land management practices, along with a variety of other forest management practices, as part of ongoing efforts to make California’s Natural and Working Lands more resilient to climate change, fire, and other disturbances.

Contents
Public Comment Draft ..................................................................................................... i
California’s Historical Fire Activity before Modern Fire Suppression ............................. i
Preface ............................................................................................................................. i
Acknowledgment ............................................................................................................ ii
Executive Summary .........................................................................................................iii
Fundamentals of Fire on the Landscape .....................................................................iii
Factors that Influence Fire Characteristics and Emissions ...........................................iii
Review of Data Regarding Historical Fire Emissions ...................................................iv
Estimation of Historical Fire Emissions ........................................................................iv
Fire History of California .............................................................................................. v
Native American’s Use of Fire on Natural Resources .............................................. v
Climate Impacts on Fire ........................................................................................... v
1500-Year Fire History .............................................................................................vi
Summary ..................................................................................................................... vii
Contents ........................................................................................................................ ix
1. Introduction ............................................................................................................. 1
1.1 Background ........................................................................................................... 1
1.2 Ecosystem Functions of Fire in California Landscapes .......................................... 2
Seed Germination .................................................................................................... 2
Soil Replenishment .................................................................................................. 2
Clearing Vegetation Fuel ......................................................................................... 2
Promote New Plant Growth ..................................................................................... 3
Maintain Ecosystem Diversity .................................................................................. 3
1.3 Fire as a Part of the Earth’s Carbon Cycle ............................................................. 3
1.4 Factors that Influence Fire Characteristics and Emissions ..................................... 3
2. Review of Data Regarding Historical Fire Emissions ................................................ 4
2.1 Proxy Data on Historical Fire ................................................................................. 5
Tree Rings ................................................................................................................ 6
Sediment Cores ....................................................................................................... 7
Oral Histories and Ethnography .............................................................................. 7

Other Proxies ........................................................................................................... 8
Spatial Coverage of Available Proxy Data ............................................................... 9
2.2 Data Gaps for Historical Fire Emission Modeling .................................................. 9
2.3 Estimation of Historical Fire Emissions ................................................................ 11
3. Fire History of California ........................................................................................ 12
3.1 Native American’s Use of Fire on Natural Resources .......................................... 12
3.2 Climate Impacts on Fire....................................................................................... 13
3.3 Fire, Humans, and Environment through Time.................................................... 14
Year 500 to Year 1000 ........................................................................................... 15
Medieval Warm Period .......................................................................................... 16
Native American Population Increase .................................................................... 16
Little Ice Age .......................................................................................................... 16
European-American Westward Expansion............................................................. 16
Modern Fire Exclusion ........................................................................................... 18
3.4 Diversity in Historical Fire Regime by Region...................................................... 19
4. Discussion: Putting the Past into Context ............................................................. 20
5. Summary ................................................................................................................ 22
California’s ecosystems are diverse and ever-changing ............................................ 22
Fire exclusion has led to a divergence of fire from climate ....................................... 22
Estimating historical fire emissions is challenging due to lack of data ...................... 23
Source of ignition cannot be distinguished with historical data ............................... 23
Climate change exacerbates fire ............................................................................... 23
References .................................................................................................................... 24
Appendix ...................................................................................................................... 33
1
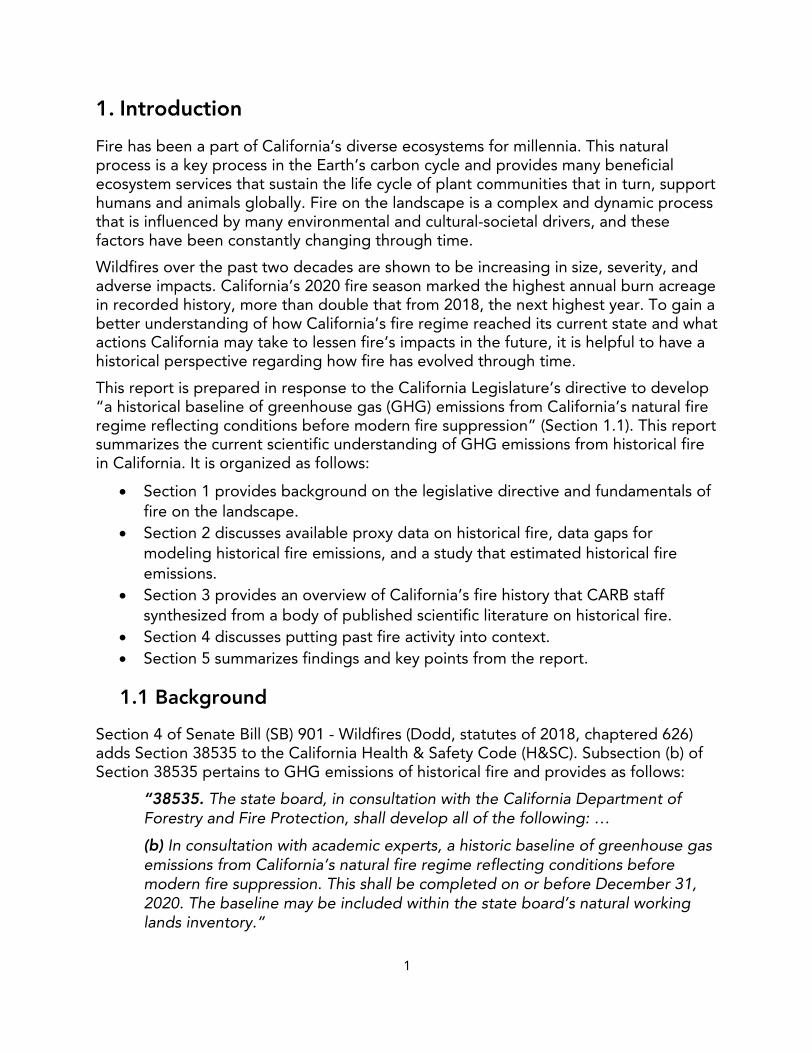
1. Introduction
Fire has been a part of California’s diverse ecosystems for millennia. This natural process is a key process in the Earth’s carbon cycle and provides many beneficial ecosystem services that sustain the life cycle of plant communities that in turn, support humans and animals globally. Fire on the landscape is a complex and dynamic process that is influenced by many environmental and cultural-societal drivers, and these factors have been constantly changing through time.
Wildfires over the past two decades are shown to be increasing in size, severity, and adverse impacts. California’s 2020 fire season marked the highest annual burn acreage in recorded history, more than double that from 2018, the next highest year. To gain a better understanding of how California’s fire regime reached its current state and what actions California may take to lessen fire’s impacts in the future, it is helpful to have a historical perspective regarding how fire has evolved through time.
This report is prepared in response to the California Legislature’s directive to develop “a historical baseline of greenhouse gas (GHG) emissions from California’s natural fire regime reflecting conditions before modern fire suppression” (Section 1.1). This report summarizes the current scientific understanding of GHG emissions from historical fire in California. It is organized as follows:
· Section 1 provides background on the legislative directive and fundamentals offire on the landscape.
· Section 2 discusses available proxy data on historical fire, data gaps formodeling historical fire emissions, and a study that estimated historical fireemissions.
· Section 3 provides an overview of California’s fire history that CARB staffsynthesized from a body of published scientific literature on historical fire.
· Section 4 discusses putting past fire activity into context.· Section 5 summarizes findings and key points from the report.
1.1 Background
Section 4 of Senate Bill (SB) 901 - Wildfires (Dodd, statutes of 2018, chaptered 626) adds Section 38535 to the California Health & Safety Code (H&SC). Subsection (b) of Section 38535 pertains to GHG emissions of historical fire and provides as follows:
“38535. The state board, in consultation with the California Department of Forestry and Fire Protection, shall develop all of the following: …
(b) In consultation with academic experts, a historic baseline of greenhouse gasemissions from California’s natural fire regime reflecting conditions beforemodern fire suppression. This shall be completed on or before December 31,2020. The baseline may be included within the state board’s natural workinglands inventory.”

2
As directed by SB 901, the staff of the California Air Resources Board (CARB) has worked closely with the California Department of Forestry and Fire Protection (CAL FIRE) and academic and agency experts with research and practical expertise in historical and contemporary fire in California and the western United States. This report responds to the H&SC Section 38535(b) directive by summarizing the current scientific understanding of GHG emissions from historical fire in California.
1.2 Ecosystem Functions of Fire in California Landscapes
Fire is a natural process in forests and other natural lands. Available proxy data on historical fire go back for tens of thousands of years and indicate that fire has always been a part of California ecosystems [1]. Several natural ecosystem processes rely on fire to support the life cycle of plant and animal communities through stimulating seed germination, replenishing soil nutrients, promoting new plant growth, reducing competition among trees and maintaining open stand structure, reducing the fuels that feed more severe fires, and maintaining ecosystem and habitat diversity. These ecosystem functions of fire are described below.
Seed GerminationSeeds in certain types of serotinous cones and seed pods in trees and shrubs are released during fire events. These plant species have resin sealing the seeds inside their casing. When introduced to high temperatures from fires, the resin melts and releases the seeds. Such trees in California include Coulter Pine, Knobcone Pine, Sargent Cypress, Monterey Pine, and Giant Sequoia [23, 24]. Forests and other natural lands that include plants with serotinous cones and seed pods need fire to maintain these species without additional human intervention.
Soil ReplenishmentLow to moderate intensity fires help to replenish soils by releasing various nutrients that would otherwise be stored in live and dead plant biomass. Nutrients that are transferred from biomass to soils by fire includes nitrogen, phosphorus, magnesium, and calcium. Wildfire can combust biomass that contains these nutrients, releasing them into the soil and allowing them to be utilized by other plants, animals, or micro-organisms. Fire also exposes mineral soil that is optimal substrate for establishment of many dominant tree species.
Clearing Vegetation FuelThe fuels that feed fires come from ecosystem biomass, both live and dead. Fires modify the quantity, spatial continuity, and characteristics of fuels within ecosystems. By burning fuels, fires help to change the behavior of future fires and decreases the likelihood of large, high severity fires. For millennia, humans have and continue to utilize fire to reduce fuels through cultural burning and prescribed burning to achieve desired outcomes.

3
Promote New Plant GrowthDead wood provides many beneficial attributes to forests, such as providing micro-habitat for seedlings, fungi, and insects. However, down dead wood can fuel wildfires, hinder the establishment of certain types of plants, and affect timber productivity [25]. Fires help keep deadwood from completely covering the forest floor, thus allowing space for new plants to grow and decreasing the likelihood of high intensity fires that are more likely to occur with large amounts of deadwood [26].
Maintain Ecosystem DiversityThe overall density of trees and biomass within a forest has many effects on ecosystem processes. The density of trees and biomass influence wildlife habitat, carbon stocks, and water consumption by vegetation. Fires help to maintain plant species diversity and create spatial diversity within ecosystems by opening gaps in closed canopies, thinning out young densely populated stands, and diversifying forest structures across the landscape. This mix of dense and open forest stands and shrublands across a landscape are necessary to accommodate the large variety of ecosystem services that both humans and nature need from these systems [27] and affect the distribution and severity of future fire on the landscape.
1.3 Fire as a Part of the Earth’s Carbon Cycle
The Earth’s carbon cycle transfers carbon between land, oceans, and the atmosphere, and in turn, facilitates the life cycle of all living things globally. Fire is a component of the Earth’s natural carbon cycle. Fire, plant respiration, and decomposition release carbon into the atmosphere. Photosynthesis takes carbon from the atmosphere and stores it in plant biomass on land. This cycle of dynamic carbon exchange has continued throughout Earth’s history. Both fire and carbon sequestration should be considered together when assessing emissions from fires in ecosystems.
Fossil fuel combustion is different from the natural exchange of carbon between land and the atmosphere. Fossil fuels consist of ancient carbon that has been stored underground for millions of years. Fossil fuel combustion contributes to climate change by rapidly releasing large amounts of fossil carbon that have not been part of the Earth’s atmosphere and biosphere carbon cycle for millions of years. No commensurate natural carbon sequestration process exists that can remove carbon at the rate that fossil carbon has been released into the atmosphere since the inception of the Industrial Revolution. This results in the continuously rising carbon dioxide (CO2) emissions in the atmosphere and climate change. Therefore, fossil fuel emissions and biomass carbon emissions should be evaluated separately and not be compared to each other.
1.4 Factors that Influence Fire Characteristics and Emissions
Many environmental and human factors influence the way fires burn in ecosystems. The spread of fires and their intensity are determined by the “fire behavior triangle”:
4
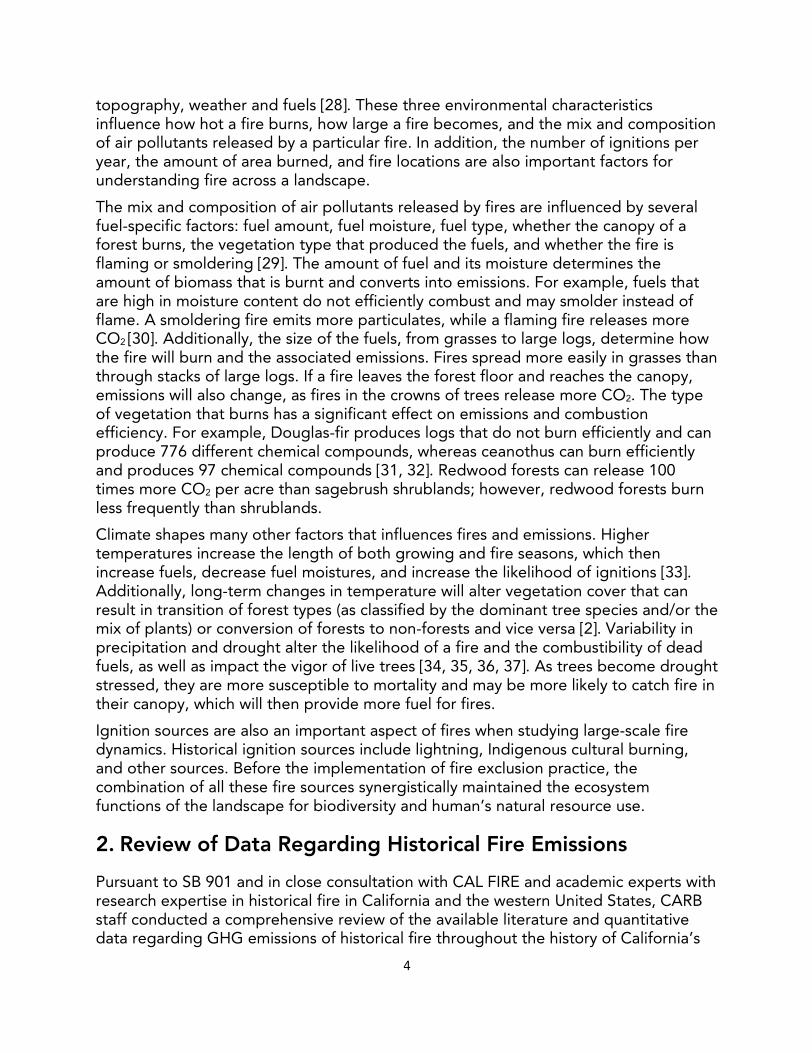
topography, weather and fuels [28]. These three environmental characteristics influence how hot a fire burns, how large a fire becomes, and the mix and composition of air pollutants released by a particular fire. In addition, the number of ignitions per year, the amount of area burned, and fire locations are also important factors for understanding fire across a landscape.
The mix and composition of air pollutants released by fires are influenced by several fuel-specific factors: fuel amount, fuel moisture, fuel type, whether the canopy of a forest burns, the vegetation type that produced the fuels, and whether the fire is flaming or smoldering [29]. The amount of fuel and its moisture determines the amount of biomass that is burnt and converts into emissions. For example, fuels that are high in moisture content do not efficiently combust and may smolder instead of flame. A smoldering fire emits more particulates, while a flaming fire releases more CO2 [30]. Additionally, the size of the fuels, from grasses to large logs, determine how the fire will burn and the associated emissions. Fires spread more easily in grasses than through stacks of large logs. If a fire leaves the forest floor and reaches the canopy, emissions will also change, as fires in the crowns of trees release more CO2. The type of vegetation that burns has a significant effect on emissions and combustion efficiency. For example, Douglas-fir produces logs that do not burn efficiently and can produce 776 different chemical compounds, whereas ceanothus can burn efficiently and produces 97 chemical compounds [31, 32]. Redwood forests can release 100 times more CO2 per acre than sagebrush shrublands; however, redwood forests burn less frequently than shrublands.
Climate shapes many other factors that influences fires and emissions. Higher temperatures increase the length of both growing and fire seasons, which then increase fuels, decrease fuel moistures, and increase the likelihood of ignitions [33]. Additionally, long-term changes in temperature will alter vegetation cover that can result in transition of forest types (as classified by the dominant tree species and/or the mix of plants) or conversion of forests to non-forests and vice versa [2]. Variability in precipitation and drought alter the likelihood of a fire and the combustibility of dead fuels, as well as impact the vigor of live trees [34, 35, 36, 37]. As trees become drought stressed, they are more susceptible to mortality and may be more likely to catch fire in their canopy, which will then provide more fuel for fires.
Ignition sources are also an important aspect of fires when studying large-scale fire dynamics. Historical ignition sources include lightning, Indigenous cultural burning, and other sources. Before the implementation of fire exclusion practice, the combination of all these fire sources synergistically maintained the ecosystem functions of the landscape for biodiversity and human’s natural resource use.
2. Review of Data Regarding Historical Fire Emissions
Pursuant to SB 901 and in close consultation with CAL FIRE and academic experts with research expertise in historical fire in California and the western United States, CARB staff conducted a comprehensive review of the available literature and quantitative data regarding GHG emissions of historical fire throughout the history of California’s

5
diverse ecosystems. Section 2 summarizes CARB staff’s literature and data review, including an evaluation of the available data for modeling historical fire emissions. Land management agencies and scientists commonly consider 1910, when the U.S. Forest Service established its fire suppression program, as the beginning of modern fire suppression. (See Section 3.3 for additional information on California’s fire history timeline.) Accordingly, CARB staff’s review focuses on time period before 1910.
2.1 Proxy Data on Historical Fire
Measuring fire activity in the past, from hundreds to thousands of years, requires the use of proxy data. Proxy data refers to the use of information from the environment that can be physically measured today and then be used to infer environmental characteristics of the past, such as climate, vegetation, and fire activity.
When gathering quantitative data for fire emission modeling, two major sources of quantitative proxy data exist: burn scars from trees and charcoal found in lakebed sediment cores (FIGURE 1). In addition to these types of quantitative information, oral histories, archeological sites, and early explorer accounts also provide qualitative descriptions and site-specific information about historical fire and how fire affected environments. Section 2.1 discusses the available proxy data, the information they each provide, and the data gaps for fire emissions modeling.
FIGURE 1: EXAMPLES OF BURN SCARS ON THE LEFT AND SEDIMENT CORES ON THE RIGHT

6
FIGURE 2: LOCATIONS OF BURN SCAR DATA AND SEDIMENT CORES WITH CHARCOAL DATA IN CALIFORNIA [38, 39]
Tree Rings In conducting this review, CARB staff considered data from burn scars in tree ring samples. When a tree survives fire, it become damaged as a portion of its wood burns. This damage eventually heals and becomes a fire scar. Dendrochronology is the science of determining historical environmental conditions using tree rings. Utilizing dendrochronology and burn scars, scientists can determine when historical fires occurred throughout the life of the tree or a stand of trees [40]. Multiple trees within a stand are sampled to derive an estimate of fire within the area. Dendrochronology and fire scars provide information on the environmental conditions, such as drought and temperature, and the fire frequency throughout the history of the sampled trees.
Burn scar data can provide precise temporal information about fire, including the year and the season in which a fire occurred. Burn scars provide particularly important ecological information in areas containing older trees, providing an important historical record (FIGURE 2). Some areas of California have stands of large and old trees, especially in conifer forests, which have been studied for their fire history; however, large areas of California lack historical burn scar data that can be sampled and analyzed (FIGURE 2). These data primarily cover the last few hundred years although among fire history studies in California, some Giant Sequoia samples contain burn scars dating back more than a thousand years [41]. In general, the further back in time, the less data exist in burn scar datasets.
Area burned per year is one of the quantitative model inputs required for fire emission modeling. Area burned per year could be inferred from fire frequencies seen in burn scars for some historical time periods for certain forest types [42, 43, 44, 45]. To estimate burn area for California using burn scar data, vegetation maps of the time period in question are also required, but there are currently no statewide vegetation

7
maps prior to the 20th century. Burn scar and dendrochronology do not provide the other quantitative data (e.g., fuel loads; see APPENDIX TABLE 1 for a list) that are required as inputs for statewide fire emission modeling, nor do they provide information on the ignition source of individual fires throughout history. In studying burn scars, scientists cannot verify whether individual fires in the past were ignited by lightning or were part of Indigenous People’s use of fire for land stewardship. However, in areas of the landscape not conductive of summer thunder-lightning storms, having less probability for lightning ignitions can indicate anthropogenic burning [46].
Sediment Cores CARB staff considered and analyzed data derived from charcoal quantities in lake sediment core samples. Sediment cores from lake beds provide information about relative fire activity level and the local vegetation that were generally present at a decade-scale, providing information dating back tens of thousands of years. When a fire occurs in mountainous terrain, charcoal from the burn is eventually transported by wind, precipitation, and surface water into a lake basin. The charcoal settles at the bottom of the lake and is deposited into the sediment, where it will remain and be overlaid by subsequent years’ sediment layers. Also, some pollen from the vegetation surrounding a lake settle in lake sediments. Using radio-carbon dating and layer location within a core, scientists can determine how the age, quantities, and variation of these charcoal and pollen deposits, and then recreate generalized local vegetation composition and fire history at the decade-scale. Using scientific knowledge of the climatic conditions under which certain types of plant species can exist, scientists can infer prevailing climatic conditions based on the types and amount of pollen in a sediment. Sediment cores can be collected at multiple lakes in a region to develop a larger picture of climate and fire in the area.
Sediment cores can be collected in glacial, landslide slumps, or volcanically formed lakes in mountainous terrain in California where sediment must be undisturbed for thousands of years; these geological conditions generally do not exist outside of California’s high mountainous regions (FIGURE 2). California has sediment cores from approximately 20 higher elevation forested lakes. Each of these samples provides the fire history specific to the watershed and catchment where the sample is located, and each of these fire histories displays unique temporal changes as compared to the other samples, while some similarities in long term patterns can also be observed. The fire activities observed in charcoal data may be ignited by lightning or humans; however, the data do not distinguish between the two. These data provide quantitative data about relative historical fire activity levels, but they do not provide the full spectrum of the quantitative data needed for historical fire emission modeling.
Oral Histories and Ethnography CARB staff considered other qualitative information sources to help supplement the quantitative data derived from burn scars and sediment cores. Burn scar and charcoal records can provide deep-time history only in areas that have old trees or ancient

8
lakes where samples indicate fires [47]. However, fire occurs within every region in California. Since time immemorial, California has been and continues to be home to Indigenous People, with physical archeological evidence of humans in North America going back thirty-three thousand years [48]. Indigenous People have used fire throughout California, including in areas that have no known extant fire-scarred trees or sediment core data, such as the California Central Valley, the Sierra Foothills, and the desert regions. Indigenous People’s oral histories provide insights into how fire and human’s relationship with it has changed through time around their territories [8, 49]. Oral histories and ethnographies associated with Native Americans can provide invaluable information about historical fire activity [3].
Historical fire information derived from oral histories and ethnographies is specific to the Tribe and the area in and around the Tribe’s homeland territories. The level of spatial, temporal, and quantitative specificity can vary among Tribes and the individual keepers of oral histories. Fire emission modeling requires several arrays of quantitative data with consistent spatial and temporal coverage state-wide (see APPENDIX TABLE 1 for a list of data needed for fire emission modeling). Any effort to estimate historical fire emissions from oral histories and ethnographies would be specific to the site and the Tribe. Given the great diversity in ecosystems and Tribal cultural traditions in California, using site-specific and Tribe-specific information to extrapolate a fire activity baseline for the entire state through time would not provide a statistically robust conclusion for a statewide baseline.
Other Proxies CARB staff assessed other proxy data sources for any additional information that may help inform the historical emissions of California fires before modern day fire suppression. Archeological sites can also provide a glimpse into historical fire activity. Utilizing radiocarbon dating along with the organic (plant materials and animal remains) found in hearths at these sites, scientists can infer approximately how much fire might have been present in the areas where Indigenous People gathered food [50]. For example, with the knowledge that hazelnut thrives in open shrubland, abundant physical evidence of hazelnut is an indication that the landscape experienced relatively frequent, perhaps high intensity fire. Alternatively, knowing that oaks and other woody plants need time to grow without severe fire, abundant evidence of acorns indicates less severe fires on the landscape.
Early explorer accounts can also provide insight into how early European explorers perceived fire in California [7]. These accounts not only speak about fire itself but also about the smoke they produced. Maps and drawings of early European explorers provide graphical depictions of the landscape and vegetation as snapshots in time and specific locales.
Archeological sites and early explorer accounts are site specific. For example, even though acorns may indicate less fire, this does not provide fire frequency, burn area, or fuels information. Though these lines of data provide invaluable historical information, they do not provide the spatial, temporal, and fuel specific quantitative data required as inputs into statewide fire emission models.

9
Spatial Coverage of Available Proxy Data Fire creates mosaics of severities, intensities, and frequencies across a landscape. This mosaic across the landscape and through time results in large variations in fire activity levels and emissions statewide. California’s landscape is composed of diverse ecoregions, each with its own climate patterns, mix of vegetation composition, and fire regimes [51, 52, 53, 54, 55, 56, 57, 58, 59, 60] [61, 62, 63, 64]. This diversity results in large variability of fire regimes and emissions across California. Variability exists even within similar forest or vegetation types [3]. Given the large variability of conditions that influence fire regimes across California, a large number of proxy data samples covering all ecosystems spatially and temporally would be needed to derive a statistically robust extrapolation of a statewide baseline. Such data do not exist for the proxies currently available.
Various forms of proxy data indicate that every portion of California has experienced fire throughout history, but for several regions of California (e.g., grassland and shrublands, the Central Valley, Central Coast, and the interior southwest), there are significant data gaps in the types of quantitative data needed for fire emission modeling. The ecosystem with the most proxy data in California, including both charcoal and burn scars, were taken from forests in the Sierra Nevada mountain range, which represents about 25% of California’s land area. Additionally, fire information obtained through proxy data represents specific forest types and does not represent fires for other vegetation types or ecoregions. For example, fire frequencies measured in Giant Sequoias do not represent other forest types, woodlands, grasslands, or chaparral.
2.2 Data Gaps for Historical Fire Emission Modeling
Fire emission models require a large number of inputs, including: time of year, location, area burned, vegetation type and associated fuel composition (grasses/herbaceous vegetation, shrubs, forest understory, dead wood by stem diameter class, forest live canopy branch wood and foliage, forest litter and duff) and quantity (tons/acre), vegetation fuel moisture, and fire behavior (e.g., crown fire) at the time of the burn. APPENDIX TABLE 1 provides a detailed list of model inputs that CARB staff use for estimating emissions from contemporary fires - The First Order Fire Effects Model (FOFEM). Emission estimates can vary by two orders of magnitude depending on model parameters and inputs. It is essential to have model inputs that are representative of the area being simulated and to have quantitative data that are field-verified to validate model results. Emission estimates for contemporary fires are constrained in part by site-specific fuel composition and loading assumptions based on up-to-date vegetation mapping and fuel inventory produced by scientists and the fire management community. Laboratory and field studies inform more fundamental advances in and validation of fire models [65]. Fire emission estimation is an area of active research subject to evaluation against real-world measurements.
To produce a scientifically rigorous and meaningful emission estimate for historical fire, the emission modeling would require quantitative datasets compiled from
10
contemporaneous field measurement and systematic data recording, which were not done before the modern time. Physical proxy records (burn scars and sediment cores) sketch the outlines of the extent and frequency of fire, but contain no information about the full spectrum of detailed data for fire modeling. Unlike for contemporary fire emissions, there are no physical proxy record data that can be used to constrain model-based emission estimates for pre-1910 fires.
Vegetation type is a requirement for fire emission modeling, and science shows that the type of vegetation greatly influences fire behavior and emissions. Pollen records and oral histories indicate that vegetation types are always changing across California. Therefore, modeling historical fire would require vegetation maps through time. The earliest known historical vegetation map for all of California represents the early 1900’s. This historical vegetation map represents one snapshot in time and does not capture the vegetation cover of California’s diverse and ever-changing landscape for time periods before the 20th century. Following the establishment of Spanish territorial claims in 1776, cultural burning by Indigenous People were banned [66, 67, 68]. From the Spanish colonization era to the Gold Rush, Indigenous People’s land stewardship was replaced by the forest management ethic of the newly-arrived European-American settlers. Land management by European-American settlers consisted of more land clearing in areas designated for grazing and mining; while other areas were conserved for timber production. As a result, a different fire regime altered the fire and fuels on the landscape across California by the early 1900s, as compared to earlier time periods.
Fuel amount and moisture also greatly influence fire emission estimates. Proxy data, however, do not provide insights into the amount of fuel that was consumed during fires. Additionally, the moisture of the fuels at the time of burning is unknown. Cultural burning can occur with a wide range of fuel moistures. Additionally, even though a year may receive high total precipitation, periods of dry days, weeks or months still can occur. Therefore, even if proxy data indicate that a particular time period has a certain level of precipitation, this does not provide information on the moisture of the fuels when a fire occurred.
If vegetation maps throughout historical time existed, burned acreage per year could be inferred from fire frequencies derived from burn scars in tree ring samples for some historical time periods and in certain areas of California. However, all other quantitative data needed for historical fire emission modeling would require contemporaneous observation and systematic data recording that were not done before modern times. In addition, one cannot verify whether evidence of a fire event seen in burn scar or sediment core samples was initiated by lightning or by land stewardship practices of Indigenous People. Quantification of lightning-ignited fire events and frequencies requires systematic and contemporaneous observations, and such quantitative data do not exist.

11
2.3 Estimation of Historical Fire Emissions
Estimating emissions from fires for the State of California requires significantly more quantitative data than can be extracted from proxy data. Quantitative data required for emissions modeling include: burn Area per year, vegetation type maps, fuel loads, and fuel moisture (see APPENDIX TABLE 1 for a more detailed list). To date, there has only been one study, Stephens et al. (2007) [3] that estimated emissions of historical fire. Faced with the same data gaps discussed in Sections 2.1 and 2.2 of this report, Stephens et al. made several assumptions about the parameters to be inputted into a fire emission model. Their estimate focused on emissions representing the period between the mid-15th to the mid-19th centuries, which approximately covered the period that is also known as the “Little Ice Age” (1450-1849).
Stephens et al. [3] aggregated the burn scar data in California that were available at the time to estimate fire frequencies representing forested land in the Little Ice Age. The burn scar data consisted of 55 locations, primarily in the Northern Sierra Nevada and San Bernardino mountain regions. They used a map of historical vegetation that represents the early 1900’s, fire frequencies in forests, and expert opinion and oral histories for grasslands and other non-forest lands to estimate the area burned per year. For example, if Stephen’s et al. estimated that Redwood forest had a Little Ice Age fire frequency of 10 years, and the early 1900’s vegetation map indicates that California had 928,102 hectares of Redwood forest at the time, then the area of Redwood forest that burned in a year is assumed to be:
928,102 hectares/10 years = 92,810 hectares/year.
To estimate emissions, Stephens et al. used the First Order Fire Effects Model (FOFEM), the same fire emission model used by CARB staff to estimate contemporary fire emissions. When running this model, they assumed the lightest fuel loads and the driest fuels conditions that are currently programmed into FOFEM. They used the model to calculate what the emissions per hectare would be by vegetation type and scaled those up by the assumed acres burned per year.
To perform this analysis, several assumptions had to be made due to lack of historical data. First, the scientists assumed that current fire models can represent fire behavior in the Little Ice Age. The current models are built upon data derived from measured fire behavior of contemporary times. It is unknown whether current fire emission models can produce results that are representative of historical conditions. Secondly, the scientists assumed that vegetation from the early 1900’s is representative of the Little Ice Age (1450-1849), and that vegetation across California did not change between 1450 and 1900. As discussed in Section 2.2, proxy data show that vegetation types, structure, and composition have always been changing through time, but there are no vegetation maps before the early 1900’s. Finally, to estimate area burned per year, the scientists assumed that every acre in California has an equal probability of being burned. This assumption has most likely led to an over estimation of the annual burn area during the Little Ice Age because burn probability varies across the landscape.

12
Their estimation results (converted to acres) indicated 4.5 to 12 million acres burned per year (TABLE 1). As a comparison, California’s contemporary (2000–2020) average burned acreage is 0.79 million acres per year (0.09–4.1 million acres). They estimated that 34 to 90 million metric tons (MMT) of CO2 emissions were emitted each year. In comparison, contemporary emissions (2000–2020) range from 1 to 107 MMT CO2 annually with an average of 19 MMT CO2. Using the various assumptions described above, this study estimates an overall average emission factor of 7.5 metric tons of CO2 per acre, whereas currently California fires average about 24 metric tons of CO2 per acre, approximately 3 times more emissions per acre than in Stephens et al. estimates.
TABLE 1: SUMMARY OF STEPHENS ET AL. ESTIMATES AND CONTEMPORARY WILDFIRE
Area burned per year and CO2 emissions estimated by Stephens et al. (2007) for the Little Ice Age are presented alongside contemporary burn acreage and emissions estimates for 2000–2020 [4]. The number in parenthesis indicates the year with the highest value among years 2000–2020.
Comparisons between the Little Ice Age estimates and current burned area and emissions illustrate that one acre burned in the past is not equivalent to one acre burned today, making historical fire and emissions not analogous of contemporary fires and emissions. Fire suppression over the last century has led to a buildup of fuels that results in more emissions per acre. This increase in fuels and emissions equate to hotter and potentially more destructive fires than the estimates for the Little Ice Age indicate.
3. Fire History of California
Despite data limitations for emission estimation, published scientific literature provides a wealth of information about California’s fire history and the various factors that have shaped California’s historical fire regime. This knowledge can help put contemporary fire in historical context and enhance understanding of the factors that contributed to the wildfire conditions of modern times. Section 3 is a synthesis of the scientific literature on historical fire that CARB staff has compiled during the literature and data review for SB 901.
3.1 Native American’s Use of Fire on Natural Resources
Since time immemorial, Indigenous People have lived and continue to live on the land that is now California. Indigenous People of California have long used fire to steward the land where they live to encourage a variety of ecological outcomes [5]. The use of Indigenous knowledge includes ecological, societal, cultural, spiritual and other factors
Statewide Annual VariableStephens et al.
2007 Estimates for the Little Ice Age
Highestin 2000-2020
Average of2000-2020
Area burned (Million acres) 4.5–12 4.1 (2020) 0.79CO2 fire emissions (MMT CO2) 34–90 106.7 (2020) 19

13
in stewardship decision making. Using Indigenous knowledge, Indigenous cultural burning is typically associated with fires of varying intensities that alter the frequency, seasonality, and specificity of fire regimes designed to elicit the ecological, societal, and cultural outcomes that are specific to that time and place [5, 6, 7, 8]. Some of the examples include: using fire to clear sight lines and drive out game for more efficient hunting; setting fire to the forest understory to create new growth that attract deer and other herbivores; and selectively removing certain plants in specific areas to ensure sustainable supply of food, water, and fiber. Throughout history, cultural burning has shaped large portions of California [7]. Areas around Indigenous settlements, resources collection areas, hunting grounds, and travel routes across the landscape have been under the care of Indigenous People throughout history [7]. Indigenous fire regimes evolved with the conditions of the time [9] as they adapt their fire practices to changes in climate, vegetation, and resource needs. As the environmental and climate conditions of California have changed continuously through time, so too has cultural burning and Tribal adaptive practices.
3.2 Climate Impacts on Fire
Climate influences fire in a number of different ways. Temperature influences the length of the fire and growing season, which alters the time in which fires can burn and the amount of available fuels. Annually variability in precipitation and drought affect the production and moisture of fuels which affects their amount and combustibility. Droughts are often influenced by the frequency and strength of variation in the Pacific Ocean, particularly the El Niño Southern Oscillation (ENSO), Pacific North America Pattern, and the Pacific Decadal Oscillation (PDO), which are cyclical sea surface temperature fluctuations [69]. Changing atmospheric temperatures can also change the strength and duration of drought cycles. When data are aggregated over large areas, such as the western United States, clear climate-fire patterns exist with fire activity following a combination of temperature and drought [13, 14].
Climate also influences population dynamics of the humans on the landscape and how they interact with the environment. During periods of intense historical drought, Indigenous tribes often reduced travel and trade because of a lack of surface water to support long-distance trips [12]. This reduction in movement may have affected their burning practices as cultural burning primarily influences the place where tribes lived, worked, and traveled [7].
Climate also influences occurrence of lightning [10] and wind [11], factors that determine the number of lightning ignitions and fire behavior respectively. Climate also regulates the vegetative communities throughout California. As vegetation changes, so do human’s use of fire, fire behavior, and the associated fire emissions.

3.3 Fire, Humans, and Environment through Time
Fire has always been a part of the California landscape. Data show that fire and its drivers in California have experienced many changes and are always evolving through time [51, 52, 53, 54, 55, 56, 57, 58, 59, 60] [61, 62, 63, 64] (FIGURE 3 ). Additionally, great diversity in the ecosystems and Indigenous tribes of California exist. Climate and fire affect California’s various ecosystems and the people who live there in different ways [70]. Though generalizations are difficult to make considering the diversity of California, this section synthesizes CARB staff’s review of the various climatic, environmental, and cultural-societal factors that have influenced fire activity over the past 1,500 years of California history.
Fire activity data throughout the western United States show that fire is variable throughout space and time. Aggregating data over large areas reveals general correlation between fire activity, temperature, and drought [13, 14].
FIGURE 3 presents relative fire activity measured from 69 lake sediment core sample locations in the western United States, shown alongside historical drought level in the western United States and historical temperature in the Northern Hemisphere. In
FIGURE 3 , the gray band is a composite of relative fire activity levels from all 69 samples. The wider the band, the more variability in fire activity exist among the samples.
Before the 20th century, there was a coherent range of fire activity levels that followed climate variability. Variability in fire activity remains relatively constant until approximately 1850, the start of rapid European-American westward expansion due to the Gold Rush. Though variability widened at this time, fire activity still followed climate. Since the beginning of the 20th century, relative fire activity levels have diverged significantly from the historical range. By the later part of the 20th century, some sample locations saw almost no fire, while others experienced extremely high fire activity. Trends in fire activity and climate, on the decadal scale, have diverged since the start of large-scale fire suppression practice. Unlike the time in history before European-American settlement, when the Indigenous People’s way of life was closely integrated with fire’s many socio-ecological functions on the landscape, currently fire exclusion practices have led to an increase in fuel accumulation on the landscape, which have resulted in more severe fires and associated high emissions.
14
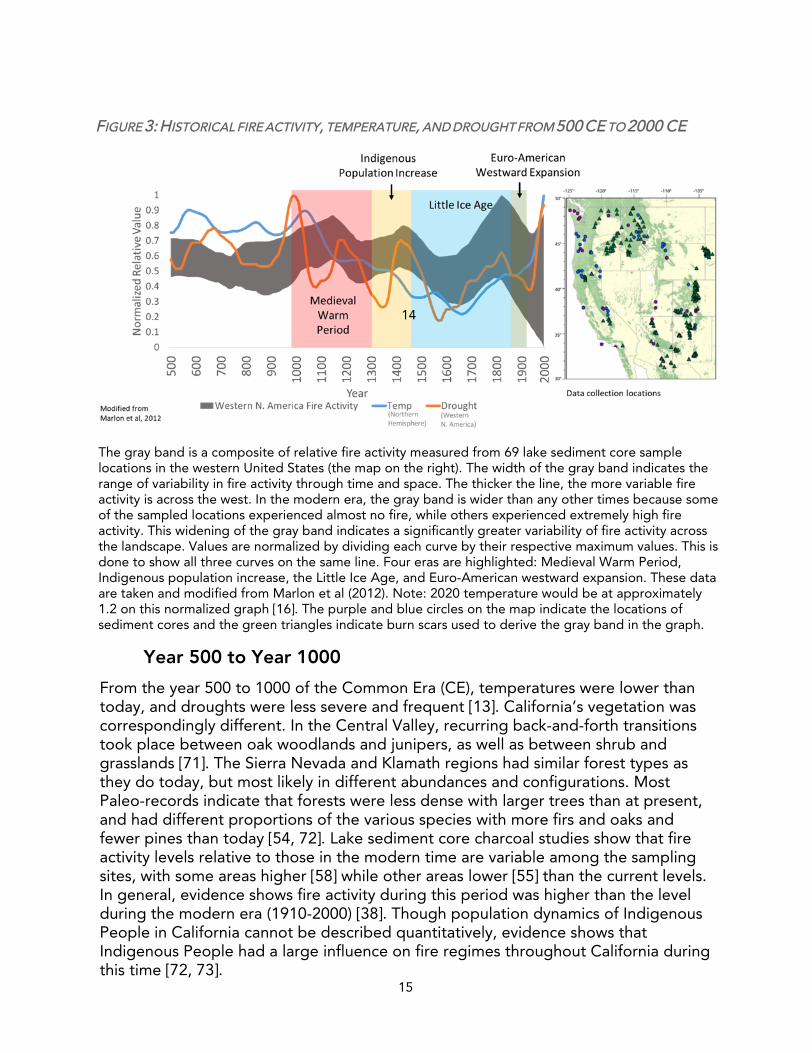
The gray band is a composite of relative fire activity measured from 69 lake sediment core sample locations in the western United States (the map on the right). The width of the gray band indicates the range of variability in fire activity through time and space. The thicker the line, the more variable fire activity is across the west. In the modern era, the gray band is wider than any other times because some of the sampled locations experienced almost no fire, while others experienced extremely high fire activity. This widening of the gray band indicates a significantly greater variability of fire activity across the landscape. Values are normalized by dividing each curve by their respective maximum values. This is done to show all three curves on the same line. Four eras are highlighted: Medieval Warm Period, Indigenous population increase, the Little Ice Age, and Euro-American westward expansion. These data are taken and modified from Marlon et al (2012). Note: 2020 temperature would be at approximately 1.2 on this normalized graph [16]. The purple and blue circles on the map indicate the locations of sediment cores and the green triangles indicate burn scars used to derive the gray band in the graph.
Year 500 to Year 1000
From the year 500 to 1000 of the Common Era (CE), temperatures were lower than today, and droughts were less severe and frequent [13]. California’s vegetation was correspondingly different. In the Central Valley, recurring back-and-forth transitions took place between oak woodlands and junipers, as well as between shrub and grasslands [71]. The Sierra Nevada and Klamath regions had similar forest types as they do today, but most likely in different abundances and configurations. Most Paleo-records indicate that forests were less dense with larger trees than at present, and had different proportions of the various species with more firs and oaks and fewer pines than today [54, 72]. Lake sediment core charcoal studies show that fire activity levels relative to those in the modern time are variable among the sampling sites, with some areas higher [58] while other areas lower [55] than the current levels. In general, evidence shows fire activity during this period was higher than the level during the modern era (1910-2000) [38]. Though population dynamics of Indigenous People in California cannot be described quantitatively, evidence shows that Indigenous People had a large influence on fire regimes throughout California during this time [72, 73].
FIGURE 3: HISTORICAL FIRE ACTIVITY, TEMPERATURE, AND DROUGHT FROM 500 CE TO 2000 CE
14
15

16
Medieval Warm PeriodThe period from 1000 to 1300 CE is often referred to as the Medieval Warm Period or the Medieval Climate Anomaly (MCA). This period experienced historically high temperatures (though still lower than the temperatures of the contemporary period) and had frequent and long droughts [13]. Vegetation was most likely sparser than today, with open stands within forests and more grass and shrublands [54]. Combined with climate, this sparse vegetation is likely the result of frequent low severity fires that were present during this period [54]. Towards the end of this period, fire activity tended to decrease as the landscape became fuels limited, likely due to low levels of vegetation as a result of frequent fires and poor growing conditions caused by drought [13]. During this period, Indigenous tribes declined in population, became more isolated and generally experienced dramatic societal changes [74]. This decline in population could have occurred because the extended droughts during this period reduced many water sources that supported long distance travel and trade, and stressed the ecosystems that these communities depended upon [74].
Native American Population IncreaseFollowing the MCA, Native American tribes expanded throughout California [12]. The period from 1300 to 1450 had more moderate temperatures and fewer droughts and generally a more stable climate [75]. Vegetation recovered from the MCA and became relatively more productive, leading to more closed canopies and more shade tolerant vegetation [75]. Fire activity during this time also began to increase [51, 52, 53, 54, 55, 56, 57, 58, 59, 60] [61, 62, 63, 64]. Tribes that already called California home grew in population, while some tribes that were native to other regions moved into California. Indigenous People saw an increase in cultural and linguistic diversity, and the introduction of new technologies during this period.
Little Ice AgeThe Little Ice Age followed the Native American Expansion period. The Little Ice Age period (1450-1849) is marked by extended cool and wet conditions [13]. Vegetation shifted with this change in climate. Higher amounts of oaks, cypress (both sedges and trees), and ash trees and more grasses were present than in previous periods. Additionally, fewer pines and firs were present [75]. Fire activity was generally lower than in previous periods [51, 52, 53, 54, 55, 56, 57, 58, 59, 60] [61, 62, 63, 64]. Later in this time period (circa 1700-1850) also saw a general decrease in Indigenous populations, primarily as a result of disease introduced by Spanish missionaries [76]. Although the Spanish invaders had begun exploring California by the 16th century, the
Portola Expedition of 1769 marked the beginning of the solidification of Spanish rule over this territory. Soon after, cultural burning was banned by the Spanish [68]. Indigenous People could not use fire and their traditional ecological knowledge to steward the land, which especially affected the coastal ranges and interior valleys nearest missions over much of California [67, 38, 68] at this time.

17
European-American Westward ExpansionThe year 1849 marks the beginning of the Gold Rush in California. The following period (1849-1910) saw an increase in westward expansion of European-Americans into California, which resulted in an increase of non-indigenous population from about 2,000 to 53,000 within one year [77]. Native American populations were already on the decline at this point from the introduction of disease and genocide by Spanish/Russian/American settlers, but the influx of new settlers further exacerbated the plight of Indigenous People [76]. The numerous atrocities against Native Americans not only decimated Native populations, but also almost eliminated cultural burning from the Californian landscape and replaced it with a new land ethic. This change affected California’s various ecosystems in different ways. For example, in coastal areas that receive little lightning, the absence of cultural burning led to increased vegetation cover and different species mixes. In areas that did not receive much cultural burning, such as high elevation forests, new settlers applied frequent high intensity fire to clear the forests for grazing and mining [77]. Warmer and drier than the Little Ice Age, this period was similar in climate to the time of Native American population increase (1300-1450) with moderate temperatures and droughts [13].
Eureka, Humboldt Co., California. Sequoia Sempervirens, Bear Gulch. This photograph, made at Bear Gulch, California in 1888 shows how a forest looked after logging operations. The land is bare except for snags and stumps. Source: Forest History Society Photograph Collection, Forest History Society, Inc., 701 William Vickers Ave., Durham, NC 27701

18
Modern Fire ExclusionIn 1910, a fire called The Big Burn burned 3 million acres in Montana, Idaho, and Washington within 36 hours and killed 80 people [78]. This fire provided the impetus for the newly formed U.S. Forest Service (USFS) to establish its fire suppression program, [79] which eventually led to its “10 a.m. policy” [80]. This policy states that the USFS should extinguish any wildland fire by 10:00 a.m. on the morning after the fire was detected, no matter how the fire started. After large-scale modern fire suppression practice began, there was a decoupling of fire and climate [15]. This departure of fire from climate indicates a shift in fire activity, delineating a change in the influences on fire in California. Data indicate that current fire regimes diverge widely from historical regimes, which were driven by climate and cultural burning [42, 13]. Some areas currently experience high levels of fire activity due to intensified burning conditions caused by climate change and larger fuel loads as a result of fire suppression. Some areas currently see exceptionally low levels of fire activity as the result of fire suppression. The western United States and large areas of California currently have a high level of fuel accumulation on the landscape, making them at a high risk for intense fires and high emissions when a fire does occur, often under more extreme burning conditions. Although this pattern represents the western United States as a whole, it provides insights into how climate and society may have and continue to shape California’s fire regime.
Burned timber on Rainey Creek in Lolo National Forest, Montana following 1910 fires. Source: The Forest History Society

19
3.4 Diversity in Historical Fire Regime by Region
In California, there are currently 16 publicly available lake sediment core samples that can be used to reconstruct a history of relative fire activity levels (FIGURE 2, TABLE 2) [51, 52, 53, 54, 55, 56, 57, 58, 59, 60] [61, 62, 63, 64, 13] specific to the watershed or catchment where the sample is located. The fire activity trend in each watershed or catchment is unique, and significant variability among the samples can be seen. Within the same region for the same time period, some records show low fire activity while other records show high fire activity. Additionally, the pattern and magnitude of change from one year to another differs between records.
The 16 sediment core records in California indicate that historically, fire activity levels were generally higher than the current level. Only seven out of the 16 sediment cores indicate equivalent or lower levels of burning historically as compared to after the inception of fire suppression in California, indicating that in some parts of California, fire activity during the modern era is similar or higher than historical activity. Each region where data is available has unique vegetation and climate conditions as compared to other regions. When there is wide variation among samples, drawing conclusions about statewide fire activity based on the samples would be less statistically robust. Given the variation, comparison among samples in a similar region but topographically separated also may not provide statistically robust conclusions.

TABLE 2: RELATIVE HISTORICAL FIRE ACTIVITY BY REGION COMPARED TO FIRE ACTIVITY FROM 1900–2000*
Each row represents a different lake bed sediment core. The cores below are all of the publicly available data within California [13]. Averages are derived for each time period indicated and are compared to fire activity from 1900 to 2000. The time periods indicated, correspond approximately with distinct historical eras. Colors correspond with whether the fire activity during a time period, for an individual core, is higher or lower than the modern era prior to the year 2000. Data were processed into 100-year averages and then aggregated to the eras indicated in this table.
* Fire activity represents averages of charcoal influx. Data shown here are the California informationfrom paleofire.org [69, 38] that had an estimate for 1900–2000 from which a comparison could bemade. Data from each study is normalized for the whole time-series (dividing the entire time-series bythe maximum value found in the core). The values for the time period 1900–2000 are subtracted fromthe values for the time period indicated. Values in the table are: Much lower (< -0.5), Lower (>= -0.5 and<-0.25), Slightly Lower (>=-0.25 and < -0.1), Equivalent (>= -0.1 and < 0.1), Slightly Higher (>= 0.1 and< 0.25), Higher (>= 0.25 and < 0.5), Much Higher (>0.5).
4. Discussion: Putting the Past into Context
Historical fire activity and how it relates to humans and climate enhances understanding of the complex dynamics of earth and social systems throughout time and space. As explained in Section 2.3 and Section 3, climate has cyclical patterns, landscapes have always been changing, and fire has varied throughout time. Any comparison between historical and contemporary fire and emissions should be made with an understanding that the environmental, climatic, and cultural-societal conditions that shape the fire landscape are very different; therefore, historical fire is not analogous to contemporary fire across California.
20
RegionTime Period (CE)
0001-1000Time Period (CE)
1000-1300Time Period (CE)
1300-1500Time Period (CE)
1500-1800Time Period (CE)
1800-1900Klamath [81] Higher Higher Slightly Higher Slightly Higher Slightly Higher
Klamath [61] Higher Higher Slightly Lower Equivalent Equivalent
Klamath [58] Equivalent Equivalent Higher Equivalent Slightly Higher
Klamath [62] Higher Higher Slightly Higher Slightly Higher Slightly Higher
Klamath [63] Slightly Higher Higher Higher Slightly Higher Much Higher
Klamath [62] Higher Higher Much Higher Much Higher Higher
Klamath [64] Equivalent Higher Equivalent Equivalent Equivalent
Southern Sierra [55] Higher Slightly Higher Slightly Higher Slightly Higher Equivalent
Southern Sierra [53] Much Lower Much Lower Equivalent Equivalent Lower
North Coast [56] Higher Much Higher Much Higher Higher Higher
North Coast [56] Higher Higher Equivalent Equivalent Equivalent
North Coast [57] Slightly Higher Slightly Higher Slightly Higher Much Higher Slightly Higher
Great Basin [60] Slightly Higher Slightly Higher Slightly Higher Equivalent Equivalent
Great Basin [60] Slightly Higher Higher Much Higher Slightly Higher Slightly Higher
Southern Coast [51] Higher No Data Slightly Higher Slightly Higher Equivalent
Southern Coast [52] Higher Equivalent Higher No Data Slightly Higher
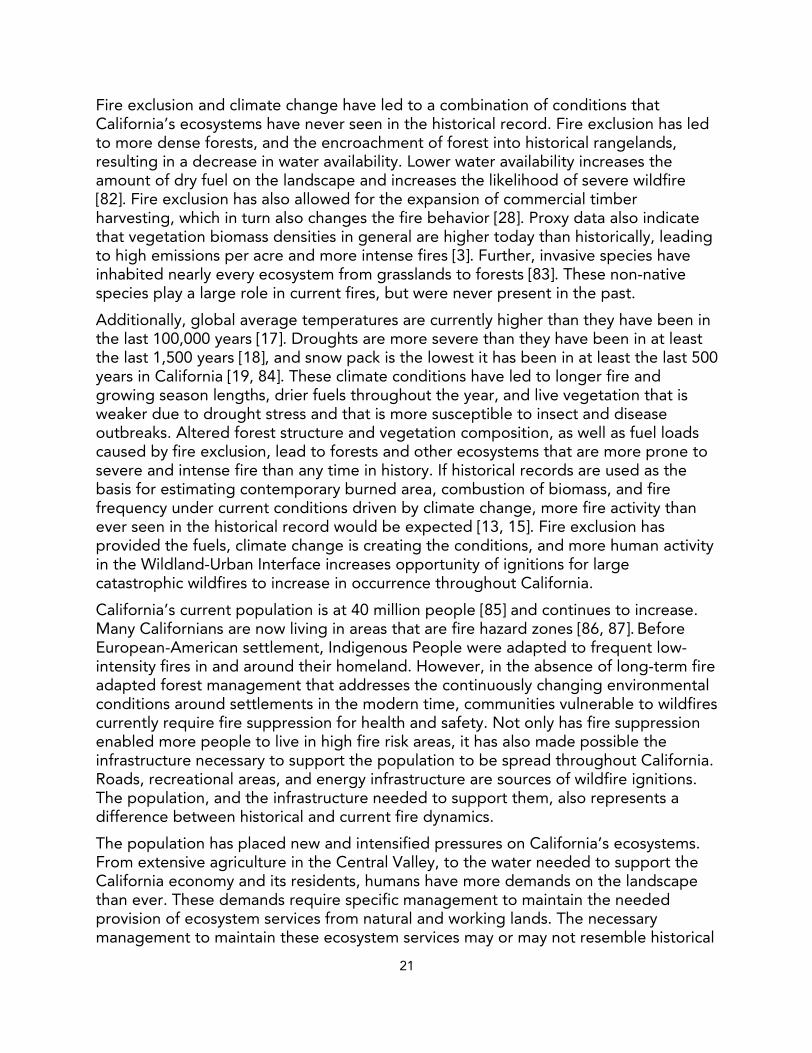
Fire exclusion and climate change have led to a combination of conditions that California’s ecosystems have never seen in the historical record. Fire exclusion has led to more dense forests, and the encroachment of forest into historical rangelands, resulting in a decrease in water availability. Lower water availability increases the amount of dry fuel on the landscape and increases the likelihood of severe wildfire [82]. Fire exclusion has also allowed for the expansion of commercial timber harvesting, which in turn also changes the fire behavior [28]. Proxy data also indicate that vegetation biomass densities in general are higher today than historically, leading to high emissions per acre and more intense fires [3]. Further, invasive species have inhabited nearly every ecosystem from grasslands to forests [83]. These non-native species play a large role in current fires, but were never present in the past.
Additionally, global average temperatures are currently higher than they have been in the last 100,000 years [17]. Droughts are more severe than they have been in at least the last 1,500 years [18], and snow pack is the lowest it has been in at least the last 500 years in California [19, 84]. These climate conditions have led to longer fire and growing season lengths, drier fuels throughout the year, and live vegetation that is weaker due to drought stress and that is more susceptible to insect and disease outbreaks. Altered forest structure and vegetation composition, as well as fuel loads caused by fire exclusion, lead to forests and other ecosystems that are more prone to severe and intense fire than any time in history. If historical records are used as the basis for estimating contemporary burned area, combustion of biomass, and fire frequency under current conditions driven by climate change, more fire activity than ever seen in the historical record would be expected [13, 15]. Fire exclusion has provided the fuels, climate change is creating the conditions, and more human activity in the Wildland-Urban Interface increases opportunity of ignitions for large catastrophic wildfires to increase in occurrence throughout California.
California’s current population is at 40 million people [85] and continues to increase. Many Californians are now living in areas that are fire hazard zones [86, 87]. Before European-American settlement, Indigenous People were adapted to frequent low-intensity fires in and around their homeland. However, in the absence of long-term fire adapted forest management that addresses the continuously changing environmental conditions around settlements in the modern time, communities vulnerable to wildfires currently require fire suppression for health and safety. Not only has fire suppression enabled more people to live in high fire risk areas, it has also made possible the infrastructure necessary to support the population to be spread throughout California. Roads, recreational areas, and energy infrastructure are sources of wildfire ignitions. The population, and the infrastructure needed to support them, also represents a difference between historical and current fire dynamics.
The population has placed new and intensified pressures on California’s ecosystems. From extensive agriculture in the Central Valley, to the water needed to support the California economy and its residents, humans have more demands on the landscape than ever. These demands require specific management to maintain the needed provision of ecosystem services from natural and working lands. The necessary management to maintain these ecosystem services may or may not resemble historical
21

disturbance regimes. When comparing historical and current fire regimes, one must acknowledge that historical disturbance regimes may or may not maintain a sustainable supply of services demanded for by the current population under a changing climate and with invasive species. To understand how ecosystem services are altered given varying fire regimes under climate change, complex modeling studies would need to be performed [88, 89]. Contemporary California society is not a fire-adapted culture as many of California’s Tribes were and are wanting to maintain with cultural burning. Within applicable fire-prone areas of California, many Tribes contend that cultural/prescribed burning can be human services for ecosystems, where fire management and Tribal stewardship can promote fire-adapted, more climate resilient vegetation and communities among different ecosystems.
Comparisons between historical and contemporary fire activity and emissions should be done with a clear understanding that the combination of climatic, ecological, and societal conditions that created today’s fire landscape has never existed in California’s past. Historical fire regimes were a result of integrated dynamics between the environment (lightning, climate variations, etc.) and Indigenous land stewardship; it is not analogous to what a hypothetical current fire regime would be if there were no fire suppression or human-ignited fires today. It is unclear that historical fire activity and emissions under current conditions would be attainable or desirable. However, the data and science do indicate that our current fire activity and the environmental and societal conditions that drive it is unique in history. Never have so many people needed so much from California’s ecosystems. There are currently more fuels and biomass on land under hotter and drier conditions than historically, with a fire regime that has diverged from climate.
5. Summary
California’s ecosystems are diverse and ever-changing
The Earth’s climate is not static and has always changed through time. This variation led to large differences in fire activity from one era to another. Additionally, ecosystems respond to changes in climate, environmental conditions, and human activities. In turn, humans cope or adapt with the changing ecosystems. Each region of California has a different fire regime, which changes through time depending on the dynamic interactions of climate, environment, and people. No single fire regime represents California’s diverse history and landscape.
Fire exclusion has led to a divergence of fire from climate
Long-term trends in fire activity generally followed variation in the Earth’s climate until fire suppression began in the early 20th Century. Due to fire exclusion, currently many areas of California, mostly in the North, are experiencing less fire activity than what their ecosystems had historically experienced. Other areas, mostly in the South, are experiencing more frequent fire than in the historical record, because of an increase in
22

23
ignitions. This has greatly modified the fire-climate relationship. There are no historical analogs to the current combination of societal, environmental, and climate conditions, which has never been seen in history.
Estimating historical fire emissions is challenging due to lack of data
Fire emissions are estimated by inputting several arrays of specific quantitative data into a fire emission model. The required data include all of the following: area burned per year, emission factors, vegetation type, fuel quantity, fuel moisture, and fire behavior at the time of burn. Emission estimates can vary by multiple orders of magnitude depending on model inputs and parameters. It is essential to have model inputs that are representative of the area being simulated and to have quantitative data that are field-verified to validate model results. All elements of these datasets do not exist statewide throughout historical time periods.
Source of ignition cannot be distinguished with historical data
Since time immemorial, Indigenous People have used and continue to use fire as a tool in their stewardship of the land. There was not a time in recorded or oral history when fires were ignited solely by lightning or other non-human causes. In analyzing burn scars and sediment cores, differentiation between lightning-ignited fire, Indigenous fire, and any other ignition source cannot be done using existing scientific methods. Accordingly, paleo-ecological data characterize the combined effects of human and non-human contributions to California’s historical fire regime.
Climate change exacerbates fire
The current average global temperature is the highest that the Earth has seen in roughly 100,000 years [17]. As the climate continues to warm, wildfire is expected to become more severe and extreme. It is therefore critical to continue reducing the human contribution to climate change by reducing fossil fuel GHG emissions. Historical data have shown that California’s land base used to be more ecologically diverse and more adapted to the Earth’s climate variability when fire was a more frequent feature of the landscape. Opportunities exist to reintegrate Indigenous knowledge into prescribed burning and land management practices, as part of the ongoing efforts of making California’s Natural and Working Lands more resilient to climate change, fire, and other disturbances.

24
References
[1] D. G. Gavin, D. J. Hallett, F. S. Hu, K. P. Lertzman, S. J. Prichard, K. J. Brown, J.A. Lynch, P. Bartlein and D. L. Peterson, "Forest fire and climate change inwestern North America: insights from sediment charcoal records.," Frontiers inEcology and the Environment, vol. 247, pp. 499-506., 2007.
[2] J. Foley, S. Levis, M. Costa, W. Cramer and D. Pollard, "Incorporating dynamicvegetation cover within global climate models.," Ecological Applications, vol.10.6, pp. 1620-1632., 2000.
[3] S. Stephens, R. Martin and N. Clinton, "Prehistoric fire area and emissions fromCalifornia's forests, woodlands, shrublands, and grasslands.," Forest Ecology andManagement, vol. 251.3, pp. 205-216., 2007.
[4] California Air Resources Board staff, "Califonria Wildfire Burn Acreage andPreliminary Emissions Estimates.," Sacramento, CA, 2021.
[5] F. K. Lake and J. W. Long, "Fire and tribal cultural resources.," Gen. Tech. Rep.PSW-GTR-247. Albany, CA:US Department of Agriculture, Forest Service, PacificSouthwest Research Station: 173-186. Chap., vol. 247, pp. 173-186., 2014.
[6] D. L. Hankins, "The effects of indigenous prescribed fire on riparian vegetation incentral California.," Ecological Processes, vol. 2.1, pp. 1-9., 2013.
[7] M. K. Anderson, "The use of fire by Native Americans in California.," Fire inCalifornia’s ecosystems. University of California Press, Berkeley, California, USA ,pp. 417-430., 2006.
[8] C. Eriksen and D. L. Hankins, "The retention, revival, and subjugation ofindigenous fire knowledge through agency fire fighting in Eastern Australia andCalifornia.," Society & Natural Resources, vol. 27.12, pp. 1288-1303., 2014.
[9] F. K. Lake, "Traditional ecological knowledge to develop and maintain fireregimes in northwestern California, Klamath-Siskiyou bioregion: management andrestoration of culturally significant habitats.," Oregon State University, PhDDissertation, 2007.
[10] D. Finney, R. Doherty, O. Wild, D. Stevenson, I. MacKenzie and A. Blyth, "Aprojected decrease in lightning under climate change.," Nature Climate Change,vol. 8.3, pp. 210-213., 2018.

25
[11] N. L. Miller and N. J. Schlegel, "Climate change projected fire weather sensitivity:California Santa Ana wind occurrence.," Geophysical Research Letters, vol. 33.15,2006.
[12] T. J. Connolly and D. L. Jenkins, "Population dynamics on the northwestern GreatBasin periphery: clues from obsidian geochemistry.," Journal of California andGreat Basin Anthropology , pp. 241-250., 1997.
[13] J. Marlon, P. Bartlein, D. Gavin, C. Long, R. Anderson, C. Briles, K. Brown, D.Colombaroli, D. Hallett, M. Power and E. Scharf, "Long-term perspective onwildfires in the western USA.," Proceedings of the National Academy of Sciences,vol. 109.9, pp. E535-E543., 2012.
[14] M. Power, F. Mayle, P. Bartlein, J. Marlon, R. Anderson, H. Behling, K. Brown, C.Carcaillet, D. Colombaroli, D. Gavin and D. Hallett, "Climatic control of thebiomass-burning decline in the Americas after AD 1500.," The Holocene, vol.23.1, pp. 3-13., 2013.
[15] A. Taylor, V. Trouet, C. Skinner and S. Stephens, "Socioecological transitionstrigger fire regime shifts and modulate fire–climate interactions in the SierraNevada, USA, 1600–2015 CE.," Proceedings of the National Academy ofSciences, vol. 113.48, pp. 13684-13689., 2016.
[16] P. Jones, D. Parker, T. Osborn and K. Briffa, "Global and hemispherictemperature anomalies—land and marine instrumental records. In Trends: ACompendium of Data on Global Change.," Carbon Dioxide Information AnalysisCenter, Oak Ridge National Laboratory, U.S. Department of Energy, Oak Ridge,Tenn., U.S.A. , 2006.
[17] C. Snyder, "Evolution of global temperature over the past two million years.,"Nature, vol. 538, p. 226–228, 2016.
[18] D. Griffin and K. J. Anchukaitis, "How unusual is the 2012–2014 Californiadrought?," Geophysical Research Letters, vol. 41.24, pp. 9017-9023., 2014.
[19] S. Belmecheri, F. Babst, E. Wahl, D. Stahle and V. Trouet, "Multi-centuryevaluation of Sierra Nevada snowpack.," Nature Climate Change, vol. 6.1, pp. 2-3., 2016.
[20] A. L. Westerling, "Wildfire Simulations for California's Fourth Climate ChnageAssessment: Projecting Changes in Extreme Wildfire Events with a WarmingClimate," State of California, Sacramento, California, 2018.

26
[21] T. Kitzberger, D. Falk, A. Westerling and T. Swetnam, "Direct and indirect climatecontrols predict heterogeneous early-mid 21st century wildfire burned areaacross western and boreal North America," PLoS ONE, vol. 12, no. 12, 2017.
[22] G. Boisramé, S. Thompson, M. Kelly, J. Cavalli, K. Wilkin and S. Stephens,"Vegetation change during 40 years of repeated managed wildfires in the SierraNevada, California," Forest Ecology and Management, vol. 402, pp. 241-252,2017.
[23] M. Borchert, "Serotiny and cone-habit variation in populations of Pinus coulteri(Pinaceae) in the southern Coast Ranges of California.," Madrono, pp. 29-48.,1985.
[24] T. H. Harvey, "Giant sequoia reproduction, survival, and growth.," Harvey, H. T.;Shellhammer, HS; Stecker, RE Giant sequoia ecology, fire and reproduction.Washington, DC: US Department of Interior, National Park Service, Sci. Monogr.Series, pp. 41-68., 1980.
[25] J. Rämö, A. Aino and T. Olli, "Optimal Continuous Cover Forest Managementwith a Lower Bound Constraint on Dead Wood.," Forest Science, vol. 66.2, pp.202-209., 2020.
[26] J. Lutz, S. Struckman, T. Furniss, C. Cansler, S. Germain, L. Yocom, D. McAvoy, C.Kolden, A. Smith, M. Swanson and A. Larson, "Large-diameter trees dominatesnag and surface biomass following reintroduced fire.," Ecological Processes,vol. 9.1, pp. 1-13., 2020.
[27] M. G. Turner, D. C. Donato and W. H. Romme, "Consequences of spatialheterogeneity for ecosystem services in changing forest landscapes: priorities forfuture research.," Landscape ecology, vol. 28.6, pp. 1081-1097., 2013.
[28] H. S. Zald and C. J. Dunn, "Severe fire weather and intensive forest managementincrease fire severity in a multi‐ownership landscape.," Ecological Applications,vol. 28.4, pp. 1068-1080., 2018.
[29] D. R. Weise and C. S. Wright, "Wildland fire emissions, carbon and climate:characterizing wildland fuels.," Forest Ecology and Management, vol. 317, pp.26-40., 2014.
[30] S. Urbanski, "Wildland fire emissions, carbon, and climate: Emissionfactors.," Forest Ecology and Management, vol. 317, pp. 51-60., 2014.

27
[31] C. Jen, L. Hatch, V. Selimovic, R. Yokelson, R. Weber, A. Fernandez, N. Kreisberg,K. Barsanti and A. Goldstein, "Speciated and total emission factors of particulateorganics from burning western US wildland fuels and their dependence oncombustion efficiency.," Atmospheric Chemistry and Physics, vol. 19.2, 2019.
[32] E. Pallozzi, I. Lusini, L. Cherubini, R. Hajiaghayeva, P. Ciccioli and C. Calfapietra,"Differences between a deciduous and a conifer tree species in gaseous andparticulate emissions from biomass burning.," Environmental pollution, vol. 234,pp. 457-467., 2018.
[33] J. T. Abatzoglou and A. P. Williams, "Impact of anthropogenic climate change onwildfire across western US forests," Proceedings of the National Academy ofSciences, vol. 113, pp. 11770-11775, 2016.
[34] J. Coop, S. Parks, C. Stevens-Rumann, S. Crausbay, P. Higuera, M. Hurteau, A.Tepley, E. Whitman, T. Assal, B. Collins, K. Davis, S. Dobrowski, D. Falk, P.Fornwalt, P. Fulé, B. Harvey, V. Kane, C. Littlefield, E. Margolis, M. North, M.Parisien, S. Prichard and K. Rodman, "Wildfire-driven forest conversion in westernNorth American landscapes," BioSciences, vol. 70, no. 8, pp. 659-673, 2020.
[35] C. Lauvaux, C. Skinner and A. Taylor, "High severity fire and mixed conifer forest-chaparral dynamics in the southern Cascade Range, USA," Forest Ecology andManagement, vol. 363, pp. 74-85, 2016.
[36] M. Coppoletta, K. Merriam and B. Collins, "Post-fire vegetation and fueldevelopment influences fire severity patterns in reburns," Ecological applications,vol. 26, no. 3, pp. 686-699, 2016.
[37] P. Mantgem, D. Falk, E. Williams, A. Das and N. Stephenson, "Pre-fire droughtand competition mediate post-fire conifer mortality in western U.S. NationalParks," Ecological Applications, vol. 28, no. 7, pp. 1730-1739, 2018.
[38] Global Paleofire Working Group, "International Paleofire Network.," [Online].Available: https://ipn.paleofire.org/. [Accessed 1 Dec 2020].
[39] E. Margolis, C. Guiterman, F. D.A. and e. al, "The North American tree-ring fire-scar network," in-prep.
[40] D. Falk, E. Heyerdahl, P. Brown, C. Farris, P. Fulé, D. McKenzie, T. Swetnam, A.Taylor and M. V. Horne, "Multiscale controls of historical fire regimes: Newinsights from fire-scar networks," Frontiers in Ecology and the Environment, vol.9, no. 8, pp. 446-454, 2011.

28
[41] T. Swetnam, C. Baisan, A. Caprio, P. Brown, R. Touchan, R. Anderson and D.Hallett, "Multi-millennial fire history of the giant forest, Sequoia National Park,California, USA.," Fire Ecology, vol. 5.3, pp. 120-150., 2009.
[42] A. Taylor and C. Skinner, "Spatial patterns and controls on historical fire regimesand forest structure in the Klamath Mountains," Ecological Applications, vol. 13,no. 3, pp. 704-719, 2003.
[43] A. Scholl and A. Taylor, "Fire regimes, forest change, and self-organization in anold-growth mixed‐conifer forest, Yosemite National Park, USA," EcologicalApplications, vol. 20, no. 2, pp. 362-380, 2010.
[44] A. Taylor, "Fire regimes and forest changes in mid and upper montane forests ofthe southern Cascades, Lassen Volcanic National Park, California, USA," Journalof Biogeography, vol. 27, no. 1, pp. 87-104, 2000.
[45] F. CA, C. Baisan, D. Falk, M. V. Horne, P. Fulé and T. Swetnam, "A comparison oftargeted and systematic fire-scar sampling for estimating historical fire frequencyin south-western ponderosa pine forests," International Journal of Wildland Fire,vol. 22, no. 8, pp. 1021-1033, 2013.
[46] S. Stephens and D. Fry, "Fire history in coast redwood stands in the northeasternSanta Cruz Mountains, California," Fire Ecology, vol. 1, no. 1, pp. 2-19, 2005.
[47] M. MacKenzie, E. McIntire, S. Quideau and R. Graham, "Charcoal distributionaffects carbon and nitrogen contents in forest soils of California," Soil ScienceSociety of America Journal, vol. 72, no. 6, pp. 1774-1785, 2008.
[48] C. Ardelean, L. Becerra-Valdivia, M. Pedersen, J. Schwenninger, C. Oviatt, J.Macías-Quintero, J. Arroyo-Cabrales, M. Sikora, Y. Ocampo-Díaz, I. Rubio-Cisneros and J. Watling, "Evidence of human occupation in Mexico around theLast Glacial Maximum.," Nature, vol. 584.7819, pp. 87-92., 2020.
[49] F. K. Lake, "Historical and cultural fires, tribal management and research issues inNorthern California: Trails, fires and tribulations.," Occasion: InterdisciplinaryStudies in the Humanities, vol. 5, 2013.
[50] K. Lightfoot, R. Cuthrell, C. Boone, R. Byrne, A. Chavez, L. Collins, A. Cowart, R.Evett, P. Fine, D. Gifford-Gonzalez and M. Hylkema, "Anthropogenic burning onthe Central California coast in Late Holocene and Early historical times: findings,implications, and future directions.," California Archaeology, vol. 5.2, pp. 371-390., 2013.

29
[51] K. L. Cole and G.-W. Liu, "Holocene paleoecology of an estuary on Santa RosaIsland, California.," Quaternary Research, vol. 41.3, pp. 326-335., 1994.
[52] O. K. Davis, "Rapid climatic change in coastal southern California inferred frompollen analysis of San Joaquin Marsh.," Quaternary Research, vol. 37.1, pp. 89-100., 1992.
[53] D. J. Hallett and R. S. Anderson, "Paleofire reconstruction for high-elevationforests in the Sierra Nevada, California, with implications for wildfire synchronyand climate variability in the late Holocene.," Quaternary Research, vol. 73.2, pp.180-190., 2010.
[54] A. Brunelle and R. S. Anderson, "Sedimentary charcoal as an indicator of late-Holocene drought in the Sierra Nevada, California, and its relevance to thefuture.," The Holocene, vol. 13.1, pp. 21-28., 2003.
[55] S. J. Smith and R. S. Anderson, "Late Wisconsin paleoecologic record fromSwamp Lake, Yosemite National Park, California.," Quaternary Research, vol.38.1, pp. 91-102., 1992.
[56] R. S. Anderson, "Long-Term Fire History from Sedimentary Charcoal Analysis: theWildcat Lake and Glenmire Sites in Point Reyes National Seashore, California.,"Center for Environmental Sciences & Education, pp. 1-18., 2001.
[57] R. S. Anderson, "Contrasting vegetation and fire histories on the Point ReyesPeninsula during the pre-settlement and settlement periods.," Northern ArizonaUniversity, Flagstaff, USA , 2005.
[58] M. L. Daniels, S. Anderson and C. Whitlock, "Vegetation and fire history since theLate Pleistocene from the Trinity Mountains, northwestern California, USA.," TheHolocene, vol. 15.7, pp. 1062-1071., 2005.
[59] C. Whitlock, C. Skinner, P. Bartlein, T. Minckley and J. Mohr, "Comparison ofcharcoal and tree-ring records of recent fires in the eastern Klamath Mountains,California, USA.," Canadian Journal of Forest Research, vol. 34.1, pp. 2110-2121.,2004.
[60] T. A. Minckley, C. Whitlock and P. J. Bartlein, "Vegetation, fire, and climatehistory of the northwestern Great Basin during the last 14,000 years.,"Quaternary Science Reviews, Vols. 26.17-18, pp. 2167-2184., 2007.

30
[61] J. A. Mohr, C. Whitlock and C. N. Skinner, "Postglacial vegetation and firehistory, eastern Klamath Mountains, California, USA.," The Holocene, vol. 10.5,pp. 587-601., 2000.
[62] C. Briles, C. Whitlock, C. Skinner and J. Mohr, "Holocene forest development and maintenance on different substrates in the Klamath Mountains, northernCalifornia, USA.," Ecology, vol. 92.3, pp. 590-601, 2011.
[63] C. Briles, C. Whitlock, P. Bartlein and P. Higuera, "Regional and local controls onpostglacial vegetation and fire in the Siskiyou Mountains, northern California,USA.," Palaeogeography, Palaeoclimatology, Palaeoecology, Vols. 265.1-2, pp.159-169., 2008.
[64] D. Colombaroli and D. G. Gavin, "Highly episodic fire and erosion regime overthe past 2,000 y in the Siskiyou Mountains, Oregon.," Proceedings of theNational Academy of Sciences, vol. 107.44, pp. 18909-18914., 2010.
[65] NOAA, "Fire Influence on Regional to Global Environments Experiment - AirQuality (FIREX-AQ 2020).," [Online]. Available: https://csl.noaa.gov/projects/firex-aq/ . [Accessed 22 Nov 2020].
[66] M. C. Duggan, "With and without an Empire: Financing for California Missionsbefore and after 1810.," Pacific Historical Review, vol. 85.1, pp. 23-71., 2016.
[67] V. Lopez, "Amah Mutsun Fire Relationships," Amah Mutsun Land Trust FireSymposium, 2020.
[68] J. Timbrook, J. Johnson and D. Earle, "Vegetation Burning by the Chumash,"Journal of California and Great Basin Anthropology, vol. 4, no. 2, pp. 163-186,1982.
[69] G. M. MacDonald and R. A. Case, "Variations in the Pacific Decadal Oscillationover the past millennium.," Geophysical Research Letters, vol. 32.8, 2005.
[70] S. E. Metcalfe, J. A. Barron and S. J. Davies, "The Holocene history of the NorthAmerican Monsoon: ‘known knowns’ and ‘known unknowns’ in understanding itsspatial and temporal complexity.," Quaternary Science Reviews, vol. 120, pp. 1-27., 2015.
[71] O. K. Davis, "Pollen analysis of Tulare Lake, California: Great Basin-like vegetationin Central California during the full-glacial and early Holocene.," Review ofPalaeobotany and Palynology, Vols. 107.3-4, pp. 249-257., 1999.

31
[72] J. Crawford, S. Mensing, F. Lake and S. Zimmerman, "Late Holocene fire andvegetation reconstruction from the western Klamath Mountains, California, USA:A multi-disciplinary approach for examining potential human land-use impacts.,"The Holocene, vol. 25.8, pp. 1341-1357., 2015.
[73] M. K. Anderson and M. J. Moratto, "Native American land-use practices andecological impacts.," Sierra Nevada ecosystem project: final report to Congress.Vol.2. University of California, Centers for Water and Wildland Resources Davis,1996.
[74] T. L. Jones and A. Schwitalla, "Archaeological perspectives on the effects ofmedieval drought in prehistoric California.," Quaternary International, vol. 188.1,pp. 41-58., 2008.
[75] A. Klimaszewski-Patterson and S. A. Mensing, "Multi-disciplinary approach toidentifying Native American impacts on Late Holocene forest dynamics in thesouthern Sierra Nevada range, California, USA.," Anthropocene, vol. 15, pp. 37-48., 2016.
[76] C. E. Trafzer and J. R. Hyer , "Exterminate them: Written accounts of the murder,rape, and enslavement of Native Americans during the California gold rush.,"MSU Press, 1999.
[77] S. L. Stephens and N. G. Sugihara, "Fire management and policy since Europeansettlement.," Fire in California’s Ecosystems. University of California Press,Berkeley, pp. 431-443., 2006.
[78] T. Egan, "The big burn: Teddy Roosevelt and the fire that saved America.,"Houghton Mifflin Harcourt, 2009.
[79] L. C. E. C. Anderson and R. H. Wakimoto, "Forest fire frequency and westernspruce budworm outbreaks in western Montana.," Forest Ecology andManagement, Vols. 22.3-4, pp. 251-260., 1987.
[80] S. C. K. Olmstead and R. Sedjo, "Wildland fire suppression and landdevelopment in the wildland/urban interface.," JFSP Research Project Report,2012.
[81] C. E. Briles, C. Whitlock and P. J. Bartlein, "Postglacial vegetation, fire, andclimate history of the Siskiyou Mountains, Oregon, USA.," Quaternary Research,vol. 64.1, pp. 44-56., 2005.

32
[82] Z. Holden, C. Luce, M. Crimmins and P. Morgan, "Wildfire extent and severitycorrelated with annual streamflow distribution and timing in the PacificNorthwest, USA (1984–2005)," Ecohydrology, vol. 5, no. 5, pp. 677-684, 2012.
[83] S. J. Dark, "The biogeography of invasive alien plants in California: an applicationof GIS and spatial regression analysis.," Diversity and Distributions, vol. 10.1, pp.1-9., 2004.
[84] K. Lepley, R. Touchan, D. Meko, E. Shamir, R. Graham and D. Falk, "A multi-century Sierra Nevada snowpack reconstruction modeled using upper-elevationconiferous tree rings (California, USA)," The Holocene, vol. 30, no. 9, pp. 1266-78, 2020.
[85] United States Census Bureau, "QuickFacts, California," [Online]. Available:https://www.census.gov/quickfacts/fact/table/CA/PST045219. [Accessed 2 Nov2020].
[86] A. Syphard, V. Radeloff, J. Keeley, T. Hawbaker, M. Clayton, S. Stewart and R.Hammer, "Human influence on California fire regimes.," Ecological applications,vol. 17.5, pp. 1388-1402., 2007.
[87] UCLA Geospatial, "Fire Hazard Of Every Building In California: An Interactivemap," [Online]. Available: https://gis.ucla.edu/blog/fire-hazard-every-building-in-california-interactive-map. [Accessed 1 Dec 2020].
[88] E. Rakhmatulina, G. Boisramé, S. Stephens and S. Thompson, "ydrologicalbenefits of restoring wildfire regimes in the Sierra Nevada persist in a warmingclimate," Journal of Hydrology, vol. 593, p. 125808, 2021.
[89] L. Chiono, D. Fry, B. Collins, A. Chatfield and S. Stephens, "Landscape‐scale fueltreatment and wildfire impacts on carbon stocks and fire hazard in Californiaspotted owl habita," Ecosphere, vol. 8, no. 1, p. e01648, 2017.

33
Appendix
APPENDIX TABLE 1: FIRST ORDER FIRE EFFECTS MODEL (FOFEM) INPUTS FOR FIRE EMISSIONS MODELING
Input Variable UnitsArea burned for each input data combination as defined below
Acres
Litter fuel load Tons/acre1 hour fuel load Tons/acre10 hour fuel load Tons/acre100 hour fuel load Tons/acre1000 hour fuel load Tons/acreDuff fuel load Tons/acreHerbaceous fuel load Tons/acreShrub fuel load Tons/acreCrown fuel load Tons/acreBranch fuel load Tons/acre10 hour fuel moisture percent; range: 3-298%1000 hour fuel moisture percent; range: 1-300%Duff moisture percent; range 10-197.2%Duff moisture method “Entire”, “Lower”, “NFDR”, “Adj_NFDR”Soil moisture percent ; range 0–25%1000 hour percent rotten percent1000 hour weight distribution Distribution of size classes; “Even”, “Right”,
“Left”, “End”, “Center”Duff depth InchesPercent of crown that will burn percentGeographic region where fire occurred “InteriorWest”, “PacificWest”, “NorthEast”,
“SouthEast”Vegetation cover type group 1 of 9 predefined groupsSeason in which fire occurred “Spring”, “Summer”, “Fall”, “Winter”Fuel category “Natural”, “Piles”, “Slash”Soil family “Loamy-Skeletal”, “Fine-Silt”, “Fine”,
“Coarse-Silt”, CoarseLoamy”, “NA”