Chapter 11 - Australia and New Zealand
34
1 1 Australia and New Zealand Coordinating Lead Authors: Kevin Hennessy (Australia), Blair Fitzharris (New Zealand) Lead Authors: Bryson C. Bates (Australia), Nick Harvey (Australia), Mark Howden (Australia), Lesley Hughes (Australia), Jim Salinger (New Zealand), Richard Warrick (New Zealand) Contributin g Authors: Susanne Becken (New Zealand), Lynda Chambers (Australia), Tony Coleman (Australia), Matt Dunn (New Zealand), Donna Green (Australia), Roddy Henderson (New Zealand), Alistair Hobday (Australia), Ove Hoegh-Guldberg (Australia), Gavin Kenny (New Zealand), Darren King (New Zealand), Guy Penny (New Zealand), Rosalie Woodruff (Australia) Review Editors: Michael Coughlan (Australia), Henrik Moller (New Zealand) This chapter should be cited as: Hennessy, K., B. Fitzharris, B.C. Bates, N. Harvey, S.M. Howden, L. Hughes, J. Salinger and R. Warrick, 2007: Australia and New Zealand. Climate Change 2007: Impacts, Adaptation and Vulnerability. Contribution of Working Group II to the Fourth Assessment Report of the Intergovernmental Panel on Climate Change, M.L. Parry, O.F. Canziani, J.P. Palutikof, P.J. van der Linden and C.E. Hanson, Eds., Cambridge University Press, Cambridge, UK, 507-540.
-
Upload
intergovernmental-panel-on-climate-change -
Category
Documents
-
view
228 -
download
0
Transcript of Chapter 11 - Australia and New Zealand

8/3/2019 Chapter 11 - Australia and New Zealand
http://slidepdf.com/reader/full/chapter-11-australia-and-new-zealand 1/34
11
Australia and New Zealand
Coordinating Lead Authors:Kevin Hennessy (Australia), Blair Fitzharris (New Zealand)
Lead Authors:
Bryson C. Bates (Australia), Nick Harvey (Australia), Mark Howden (Australia), Lesley Hughes (Australia), Jim Salinger (New Zealand),
Richard Warrick (New Zealand)
Contributing Authors:
Susanne Becken (New Zealand), Lynda Chambers (Australia), Tony Coleman (Australia), Matt Dunn (New Zealand), Donna Green
(Australia), Roddy Henderson (New Zealand), Alistair Hobday (Australia), Ove Hoegh-Guldberg (Australia), Gavin Kenny (New Zealand),
Darren King (New Zealand), Guy Penny (New Zealand), Rosalie Woodruff (Australia)
Review Editors:
Michael Coughlan (Australia), Henrik Moller (New Zealand)
This chapter should be cited as:
Hennessy, K., B. Fitzharris, B.C. Bates, N. Harvey, S.M. Howden, L. Hughes, J. Salinger and R. Warrick, 2007: Australia and New
Zealand. Climate Change 2007: Impacts, Adaptation and Vulnerability. Contribution of Working Group II to the Fourth Assessment Report
of the Intergovernmental Panel on Climate Change, M.L. Parry, O.F. Canziani, J.P. Palutikof, P.J. van der Linden and C.E. Hanson, Eds.,
Cambridge University Press, Cambridge, UK, 507-540.
8/3/2019 Chapter 11 - Australia and New Zealand
http://slidepdf.com/reader/full/chapter-11-australia-and-new-zealand 2/34
Australia and New Zealand Chapt
508
Executive summary.....................................................509
11.1 Introduction........................................................510
11.1.1 Summary of knowledge from the Third
Assessment Report(TAR).................. ................. ......510
11.1.2 New findings of this Fourth Assessment
Report (AR4) ............... ................. ................. .........510
11.2 Current sensitivity/vulnerability ...................510
11.2.1 Climate variability and 20th-century trends .........510
11.2.2 Human systems: sensitivity/vulnerability
to climate andweather..... ................. ................. ......511
11.2.3 Natural systems: sensitivity/vulnerability
to climate andweather..... ................. ................. ......511
11.2.4 Sensitivity/vulnerability to other stresses.............511
Box 11.1 Examples of extreme weather events in
Australia and New Zealand ..................................511
11.2.5 Current adaptation ...............................................513
11.3 Assumptions about future trends..................514
11.3.1 Climate .................................................................514
11.3.2 Population, energy and agriculture ......................516
11.4 Key future impacts and vulnerabilities .......516
11.4.1 Freshwater resources...........................................51611.4.2 Natural ecosystems..............................................517
11.4.3 Agriculture ............................................................518
11.4.4 Forestry.................................................................520
11.4.5 Coasts...................................................................520
11.4.6 Fisheries................................................................521
11.4.7 Settlements, industry and societies .....................521
11.4.8 Indigenous people ................................................522
11.4.9 Tourism and recreation .........................................523
11.4.10 Energy..................................................................523
11.4.11 Human health.......................................................524
11.4.12 Synthesis..............................................................524
11.5 Adaptation constraints and opportunities...524
11.6 Case studies.........................................................526
Box 11.2. Adaptation of water supplies in cities...............526
Box 11.3. Climate change and the Great Barrier Reef......527
Box 11.4. Climate change adaptation in coastal areas.....528
11.7 Conclusions: implications forsustainable development.................................. 528
11.8 Key uncertainties and research priorities...529
11.8.1 Assessing impacts of climate change
andvulnerability forcritical systems ................. ..........529
11.8.2 Fostering the process of adaptation
to climate change ................ ................. ................. ..530
11.8.3 Assessing risks and opportunities of
climate changefordifferentscenarios ................. .......531
11.8.4 Analysing global trade, immigration and
security forclimate changeoutcomes..... ................. ..531
References...................................................................... 531
Table of Contents
8/3/2019 Chapter 11 - Australia and New Zealand
http://slidepdf.com/reader/full/chapter-11-australia-and-new-zealand 3/34
Chapter 11 Australia and New Zealand
509
Executive summary
Literature published since the IPCC Third Assessment
Report confirms and extends its main findings (high
confidence).
There is more extensive documentation of observed changes to
natural systems, major advances in understanding potential
future climate changes and impacts, more attention to the roleof planned adaptation in reducing vulnerability, and
assessments of key risks and benefits [11.1].
Regional climate change has occurred (very high confidence).
Since 1950, there has been 0.4 to 0.7°C warming, with more
heatwaves, fewer frosts, more rain in north-west Australia and
south-west New Zealand, less rain in southern and eastern
Australia and north-eastern New Zealand, an increase in the
intensity of Australian droughts, and a rise in sea level of about
70 mm [11.2.1].
Australia and New Zealand are already experiencing
impacts from recent climate change (high confidence).
These are now evident in increasing stresses on water supply
and agriculture, changed natural ecosystems, reduced seasonal
snow cover, and glacier shrinkage [11.2.1, 11.2.3].
Some adaptation has already occurred in response to
observed climate change (high confidence).
Examples come from sectors such as water, natural ecosystems,
agriculture, horticulture and coasts [11.2.5]. However, ongoing
vulnerability to extreme events is demonstrated by substantial
economic losses caused by droughts, floods, fire, tropical
cyclones and hail [11.2.2].
The climate of the 21st century is virtually certain to be
warmer, with changes in extreme events.
Heatwaves and fires are virtually certain to increase in intensity
and frequency (high confidence). Floods, landslides, droughts
and storm surges are very likely to become more frequent and
intense, and snow and frost are very likely to become less
frequent (high confidence). Large areas of mainland Australia
and eastern New Zealand are likely to have less soil moisture,
although western New Zealand is likely to receive more rain
(medium confidence) [11.3.1].
Potential impacts of climate change are likely to be
substantial without further adaptation.• As a result of reduced precipitation and increased
evaporation, water security problems are projected to
intensify by 2030 in southern and eastern Australia and, in
New Zealand, in Northland and some eastern regions (high
confidence) [11.4.1].
• Ongoing coastal development and population growth, in
areas such as Cairns and south-east Queensland (Australia)
and Northland to Bay of Plenty (New Zealand), are
projected to exacerbate risks from sea-level rise and
increases in the severity and frequency of storms and
coastal flooding by 2050 (high confidence) [11.4.5
11.4.7].
• Significant loss of biodiversity is projected to occur by
2020 in some ecologically rich sites, including the Great
Barrier Reef and Queensland Wet Tropics. Other sites at
risk include Kakadu wetlands, south-west Australia, sub-
Antarctic islands and alpine areas of both countries (veryhigh confidence) [11.4.2].
• Risks to major infrastructure are likely to increase. By
2030, design criteria for extreme events are very likely to
be exceeded more frequently. Risks include failure of
floodplain protection and urban drainage/sewerage
increased storm and fire damage, and more heatwaves
causing more deaths and more blackouts (high confidence)
[11.4.1, 11.4.5, 11.4.7, 11.4.10, 11.4.11].
• Production from agriculture and forestry is projected to
decline by 2030 over much of southern and eastern
Australia, and over parts of eastern New Zealand, due to
increased drought and fire. However, in New Zealand,
initial benefits to agriculture and forestry are projected inwestern and southern areas and close to major rivers due
to a longer growing season, less frost and increased rainfall
(high confidence) [11.4.3, 11.4.4].
Vulnerability is likely to increase in many sectors, but this
depends on adaptive capacity.
• Most human systems have considerable adaptive capacity
The region has well-developed economies, extensive
scientific and technical capabilities, disaster mitigation
strategies, and biosecurity measures. However, there are
likely to be considerable cost and institutional constraints
to the implementation of adaptation options (high
confidence) [11.5]. Some Indigenous communities have
low adaptive capacity (medium confidence) [11.4.8]
Water security and coastal communities are the most
vulnerable sectors (high confidence) [11.7].
• Natural systems have limited adaptive capacity: Projected
rates of climate change are very likely to exceed rates of
evolutionary adaptation in many species (high confidence)
[11.5]. Habitat loss and fragmentation are very likely to
limit species migration in response to shifting climatic
zones (high confidence) [11.2.5, 11.5].
• Vulnerability is likely to rise due to an increase in extreme
events: Economic damage from extreme weather is very
likely to increase and provide major challenges foradaptation (high confidence) [11.5].
• Vulnerability is likely to be high by 2050 in a few identified
hotspots: In Australia, these include the Great Barrier
Reef, eastern Queensland, the South-West, Murray-
Darling Basin, the Alps and Kakadu wetlands; in New
Zealand, these include the Bay of Plenty, Northland
eastern regions and the Southern Alps (medium
confidence) [11.7].
8/3/2019 Chapter 11 - Australia and New Zealand
http://slidepdf.com/reader/full/chapter-11-australia-and-new-zealand 4/34
Australia and New Zealand Chapt
510
11.1 Introduction
The region is defined here as the lands and territories of
Australia and New Zealand. It includes their outlying tropical,
mid-latitude and sub-Antarctic islands and the waters of their
Exclusive Economic Zones. New Zealand’s population was 4.1
million in 2006, growing by 1.6%/yr (Statistics New Zealand,
2006). Australia’s population was 20.1 million in 2004, growingby 0.9%/yr (ABS, 2005a). Many of the social, cultural and
economic aspects of the two countries are comparable. Both
countries are relatively wealthy and have export-based
economies largely dependent on natural resources, agriculture,
manufacturing, mining and tourism. Many of these are
climatically sensitive.
11.1.1 Summary of knowledge from the
Third Assessment Report (TAR)
In the IPCC Third Assessment Report (TAR; Pittock and
Wratt, 2001), the following impacts were assessed as important
for Australia and New Zealand.• Water resources are likely to become increasingly stressed
in some areas of both countries, with rising competition for
water supply.
• Warming is likely to threaten the survival of species in
some natural ecosystems, notably in alpine regions, south-
western Australia, coral reefs and freshwater wetlands.
• Regional reductions in rainfall in south-west and inland
Australia and eastern New Zealand are likely to make
agricultural activities particularly vulnerable.
• Increasing coastal vulnerability to tropical cyclones, storm
surges and sea-level rise.
• Increased frequency of high-intensity rainfall, which is
likely to increase flood damage.
• The spread of some disease vectors is very likely, thereby
increasing the potential for disease outbreaks, despite
existing biosecurity and health services.
The overall conclusions of the TAR were that: (i) climate change
is likely to add to existing stresses to the conservation of
terrestrial and aquatic biodiversity and to achieving sustainable
land use, and (ii) Australia has significant vulnerability to
climate change expected over the next 100 years, whereas New
Zealand appears more resilient, except in a few eastern areas.
11.1.2 New findings of this Fourth Assessment
Report (AR4)
The scientific literature published since 2001 supports the TAR
findings. Key differences from the TAR include (i) more extensive
documentation of observed changes in natural systems consistent
with global warming, (ii) significant advances in understanding
potential future impacts on water, natural ecosystems, agriculture,
coasts, Indigenous people and health, (iii) more attention to the
role of adaptation, and (iv) identification of the most vulnerable
sectors and hotspots. Vulnerability is given more attention – it is
dependent on the exposure to climate change, the sensitivity of
sectors to this exposure, and their capacity to adapt.
11.2 Current sensitivity/vulnerability
11.2.1 Climate variability and 20th-century trends
In this section, climate change is taken to be due to both
natural variability and human activities. The relative proportions
are unknown unless otherwise stated. The strongest regional
driver of climate variability is the El Niño-Southern Oscillation
(ENSO). In New Zealand, El Niño brings stronger and coolersouth-westerly airflow, with drier conditions in the north-east of
the country and wetter conditions in the south-west (Gordon,
1986; Mullan, 1995). The converse occurs during La Niña. In
Australia, El Niño tends to bring warmer and drier conditions to
eastern and south-western regions, and the converse during La
Niña (Power et al., 1998). The positive phase of the Inter-
decadal Pacific Oscillation (IPO) strengthens the ENSO-rainfall
links in New Zealand and weakens links in Australia (Power et
al., 1999; Salinger et al., 2004; Folland et al., 2005).
In New Zealand, mean air temperatures have increased by
1.0°C over the period 1855 to 2004, and by 0.4°C since 1950
(NIWA, 2005). Local sea surface temperatures have risen by
0.7°C since 1871 (Folland et al., 2003). From 1951 to 1996, thenumber of cold nights and frosts declined by 10-20 days/yr
(Salinger and Griffiths, 2001). From 1971 to 2004, tropical
cyclones in the south-west Pacific averaged nine/year, with no
trend in frequency (Burgess, 2005) or intensity (Diamond,
2006). The frequency and strength of extreme westerly winds
have increased significantly in the south. Extreme easterly winds
have decreased over land but have increased in the south
(Salinger et al., 2005a). Relative sea-level rise has averaged 1.6
± 0.2 mm/yr since 1900 (Hannah, 2004). Rainfall has increased
in the south-west and decreased in the north-east (Salinger and
Mullan, 1999) due to changes in circulation linked to the IPO,
with extremes showing similar trends (Griffiths, 2007). Pan
evaporation has declined significantly at six out of nineteen sites
since the 1970s, with no significant change at the other thirteen
sites (Roderick and Farquhar, 2005). Snow accumulation in the
Southern Alps shows considerable interannual variability but no
trend since 1930 (Owens and Fitzharris, 2004).
In Australia, from 1910 to 2004, the average maximum
temperature rose 0.6°C and the minimum temperature rose 1.2°C,
mostly since 1950 (Nicholls and Collins, 2006). It is very likely
that increases in greenhouse gases have significantly contributed
to the warming since 1950 (Karoly and Braganza, 2005a, b). From
1957 to 2004, the Australian average shows an increase in hot
days (≥35°C) of 0.10 days/yr, an increase in hot nights (≥20°C) of
0.18 nights/yr, a decrease in cold days (≤15°C) of 0.14 days/yrand a decrease in cold nights (≤5°C) of 0.15 nights/yr (Nicholls
and Collins, 2006). Due to a shift in climate around 1950, the
north-western two-thirds of Australia has seen an increase in
summer monsoon rainfall, while southern and eastern Australia
have become drier (Smith, 2004b). While the causes of decreased
rainfall in the east are unknown, the decrease in the south-west is
probably due to a combination of increased greenhouse gas
concentrations, natural climate variability and land-use change,
whilst the increased rainfall in the north-west may be due to
increased aerosols resulting from human activity, especially in
Asia (Nicholls, 2006). Droughts have become hotter since about
8/3/2019 Chapter 11 - Australia and New Zealand
http://slidepdf.com/reader/full/chapter-11-australia-and-new-zealand 5/34
Chapter 11 Australia and New Zealand
511
1973 because temperatures are higher for a given rainfall
deficiency (Nicholls, 2004). From 1950 to 2005, extreme daily
rainfall has increased in north-western and central Australia and
over the western tablelands of New South Wales (NSW), but has
decreased in the south-east, south-west and central east coast
(Gallant et al., 2007). Trends in the frequency and intensity of
most extreme temperature and rainfall events are rising faster than
the means (Alexander et al., 2007). South-east Australian snow
depths at the start of October have declined 40% in the past 40years (Nicholls, 2005). Pan evaporation averaged over Australia
from 1970 to 2005 showed large interannual variability but no
significant trend (Roderick and Farquhar, 2004; Jovanovic et al.,
2007; Kirono and Jones, 2007). There is no trend in the frequency
of tropical cyclones in the Australian region from 1981 to 2003,
but there has been an increase in intense systems (very low central
pressure) (Kuleshov, 2003; Hennessy, 2004). Relative sea-level
rise around Australia averaged 1.2 mm/yr from 1920 to 2000
(Church et al., 2004).
The offshore islands of Australia and New Zealand have
recorded significant warming. The Chatham Islands (44°S,
177°W) have warmed 1°C over the past 100 years (Mullan et
al., 2005b). Macquarie Island (55°S, 159°E) has warmed 0.3°Cfrom 1948 to 1998 (Tweedie and Bergstrom, 2000), along with
increases in wind speed, precipitation and evapotranspiration,
and decreases in air moisture content and sunshine hours since
1950 (Frenot et al., 2005). Campbell Island (53°S, 169°E) has
warmed by 0.6°C in summer and 0.4°C in winter since the late
1960s. Heard Island (53°S, 73°E) shows rapid glacial retreat and
a reduced area of annual snow cover from 1948 to 2001
(Bergstrom, 2003).
11.2.2 Human systems: sensitivity/vulnerability
to climate and weather
Extreme events have severe impacts in both countries (Box
11.1). In Australia, around 87% of economic damage due to
natural disasters (storms, floods, cyclones, earthquakes, fires and
landslides) is caused by weather-related events (BTE, 2001).
From 1967 to 1999, these costs averaged US$719 million/yr,
mostly due to floods, severe storms and tropical cyclones. In
New Zealand, floods are the most costly natural disasters apart from
earthquakes and droughts, and total flood damage costs averaged
about US$85 million/yr from 1968 to 1998 (NZIER, 2004).
11.2.3 Natural systems: sensitivity/vulnerability
to climate and weather
Some species and natural systems in Australia and New
Zealand are already showing evidence of recent climate-
associated change (Table 11.1). In many cases, the relative
contributions of other factors such as changes in fire regimes
and land use are not well understood.
11.2.4 Sensitivity/vulnerability to other stresses
Human and natural systems are sensitive to a variety of
stresses independent of those produced by climate change.
Growing populations and energy demands have placed stress on
energy supply infrastructure. In Australia, energy consumption
has increased 2.5%/yr over the past 20 years (PB Associates
2007). Increases in water demand have placed stress on supply
capacity for irrigation, cities, industry and environmental flows
Increased water demand in New Zealand has been due to
agricultural intensification (Woods and Howard-Williams, 2004)
Box 11.1. Examples of extreme weather
events in Australia and New Zealand*
Droughts: In Australia, the droughts of 1982-1983, 1991-
1995 and 2002-2003 cost US$2.3 billion, US$3.8 billion
and US$7.6 billion, respectively (Adams et al., 2002; BoM,
2006a). In New Zealand, the 1997-1998 and 1998-1999
droughts had agricultural losses of US$800 million(MAF, 1999).
Sydney hailstorm, 14 April 1999: With the exception of
the droughts listed above, this is the most expensive
natural disaster in Australian history, costing US$1.7 billion,
of which US$1.3 billion was insured (Schuster et al., 2005).
Eastern Australian heatwave, 1 to 22 February 2004:
About two-thirds of continental Australia recorded
maximum temperatures over 39°C. Temperatures reached
48.5°C in western New South Wales. The Queensland
ambulance service recorded a 53% increase in
ambulance call-outs (Steffen et al., 2006).
Canberra fire, 19 January 2003: Wildfires caused
US$261 million damage (Lavorel and Steffen, 2004; ICA,
2007). About 500 houses were destroyed, four people
were killed and hundreds injured. Three of the city’s four
dams were contaminated for several months by sediment-
laden runoff.
South-east Australian storm, 2 February 2005: Strong
winds and heavy rain led to insurance claims of almost
US$152 million (ICA, 2007). Transport was severely
disrupted and beaches were eroded.
Tropical cyclone Larry, 20 March 2006: Significant
damage or disruption to houses, businesses, industry,
utilities, infrastructure (including road, rail and air transport
systems, schools, hospitals and communications), crops
and state forests, costing US$263 million. Fortunately, the
1.75 m storm surge occurred at low tide (BoM, 2006b;
Queensland Government, 2006).
New Zealand floods: The 10 April 1968 Wahine storm
cost US$188 million, the 26 January 1984 Southland
floods cost US$80 million, and the February 2004 North
Island floods cost US$78 million (Insurance Council ofNew Zealand, 2005).
* All costs are adjusted to 2002-2006 values.
8/3/2019 Chapter 11 - Australia and New Zealand
http://slidepdf.com/reader/full/chapter-11-australia-and-new-zealand 6/34
Australia and New Zealand Chapt
512
and has seen the irrigated area of New Zealand increase by
around 55% each decade since the 1960s (Lincoln
Environmental, 2000). Per capita daily water consumption is
180-300 litres in New Zealand and 270 litres for Australia (Robb
and Bright, 2004). In Australia, dryland salinity, alteration of
river flows, over-allocation and inefficient use of water
resources, land clearing, intensification of agriculture, and
fragmentation of ecosystems still represent major stresses (SOE,
2001; Cullen, 2002). From 1985 to 1996, Australian water
demand increased by 65% (NLWRA, 2001). Invasive plant and
animal species pose significant environmental problems in both
countries, particularly for agriculture and forestry (MfE, 2001;
SOE, 2001); for example, Cryptostegia grandiflora (Kriticos et
al., 2003a, b).
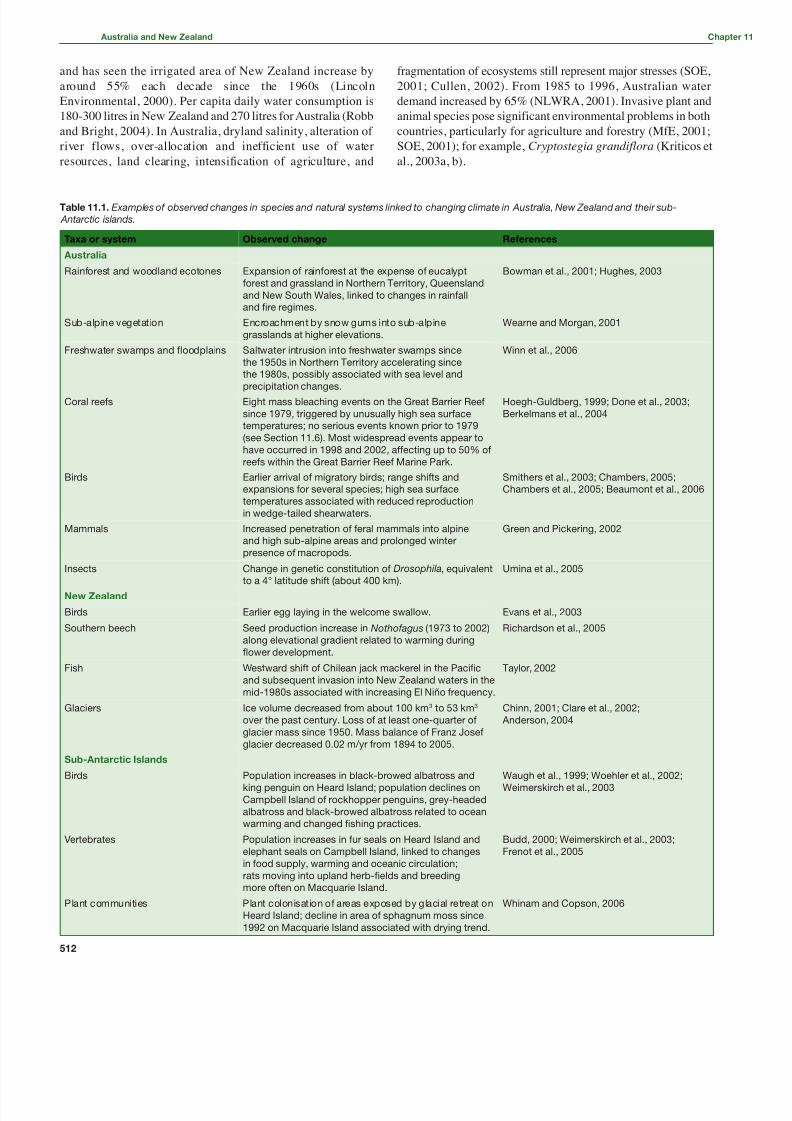
Taxa or system Observed change References
Australia
Rainforest and woodland ecotones Expansion of rainforest at the expense of eucalyptforest and grassland in Northern Territory, Queenslandand New South Wales, linked to changes in rainfalland fire regimes.
Bowman et al., 2001; Hughes, 2003
Sub-alpine vegetation Encroachment by snow gums into sub-alpinegrasslands at higher elevations.
Wearne and Morgan, 2001
Freshwater swamps and floodplains Saltwater intrusion into freshwater swamps sincethe 1950s in Northern Territory accelerating sincethe 1980s, possibly associated with sea level and
precipitation changes.
Winn et al., 2006
Coral reefs Eight mass bleaching events on the Great Barrier Reefsince 1979, triggered by unusually high sea surfacetemperatures; no serious events known prior to 1979(see Section 11.6). Most widespread events appear tohave occurred in 1998 and 2002, affecting up to 50% ofreefs within the Great Barrier Reef Marine Park.
Hoegh-Guldberg, 1999; Done et al., 2003;Berkelmans et al., 2004
Birds Earlier arrival of migratory birds; range shifts andexpansions for several species; high sea surfacetemperatures associated with reduced reproductionin wedge-tailed shearwaters.
Smithers et al., 2003; Chambers, 2005;Chambers et al., 2005; Beaumont et al., 2006
Mammals Increased penetration of feral mammals into alpineand high sub-alpine areas and prolonged winterpresence of macropods.
Green and Pickering, 2002
Insects Change in genetic constitution of Drosophila, equivalentto a 4° latitude shift (about 400 km).
Umina et al., 2005
New Zealand
Birds Earlier egg laying in the welcome swallow. Evans et al., 2003
Southern beech Seed production increase in Nothofagus (1973 to 2002)along elevational gradient related to warming duringflower development.
Richardson et al., 2005
Fish Westward shift of Chilean jack mackerel in the Pacificand subsequent invasion into New Zealand waters in themid-1980s associated with increasing El Niño frequency.
Taylor, 2002
Glaciers Ice volume decreased from about 100 km3 to 53 km3
over the past century. Loss of at least one-quarter ofglacier mass since 1950. Mass balance of Franz Josefglacier decreased 0.02 m/yr from 1894 to 2005.
Chinn, 2001; Clare et al., 2002; Anderson, 2004
Sub-Antarctic Islands
Birds Population increases in black-browed albatross andking penguin on Heard Island; population declines onCampbell Island of rockhopper penguins, grey-headedalbatross and black-browed albatross related to oceanwarming and changed fishing practices.
Waugh et al., 1999; Woehler et al., 2002;Weimerskirch et al., 2003
Vertebrates Population increases in fur seals on Heard Island andelephant seals on Campbell Island, linked to changesin food supply, warming and oceanic circulation;rats moving into upland herb-fields and breedingmore often on Macquarie Island.
Budd, 2000; Weimerskirch et al., 2003;Frenot et al., 2005
Plant communities Plant colonisation of areas exposed by glacial retreat onHeard Island; decline in area of sphagnum moss since1992 on Macquarie Island associated with drying trend.
Whinam and Copson, 2006
Table 11.1. Examples of observed changes in species and natural systems linked to changing climate in Australia, New Zealand and their sub-
Antarctic islands.
8/3/2019 Chapter 11 - Australia and New Zealand
http://slidepdf.com/reader/full/chapter-11-australia-and-new-zealand 7/34
Chapter 11 Australia and New Zealand
513
11.2.5 Current adaptation
Since vulnerability is influenced by adaptation, a summary of
current adaptation is given here rather than in Section 11.5 (which
looks at future adaptation). Adaptation refers to planned and
autonomous (or spontaneous) adjustments in natural or human
systems in response to climatic stimuli. Adaptation can reduce
harmful effects or exploit opportunities (see Chapter 17). An
example of autonomous adaptation is the intensification of grazingin the rangelands of north-west Australia over the last 30 years, as
graziers have exploited more reliable and better pasture growth
following an increase in monsoon rainfall (Ash et al., 2006).
However, there is currently insufficient information to
comprehensively quantify this capacity. While planned adaptation
usually refers to specific measures or actions, it can also be viewed
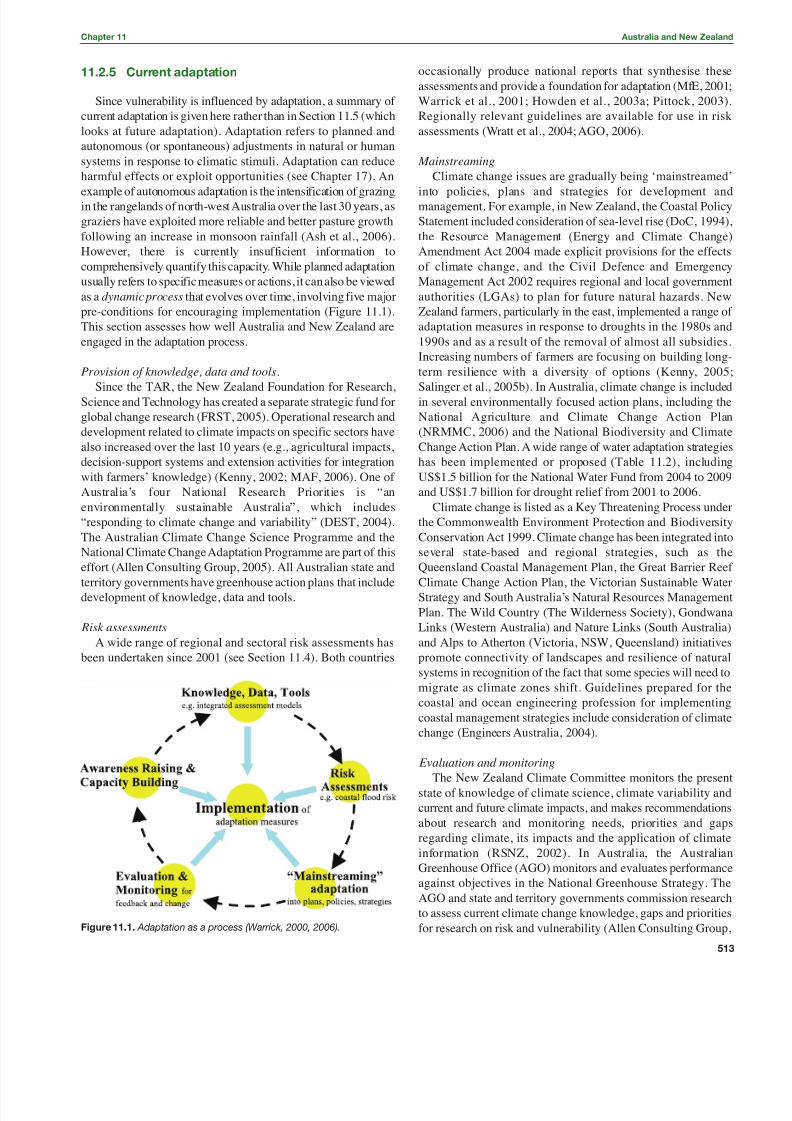
as a dynamic process that evolves over time, involving five major
pre-conditions for encouraging implementation (Figure 11.1).
This section assesses how well Australia and New Zealand are
engaged in the adaptation process.
Provision of knowledge, data and tools.
Since the TAR, the New Zealand Foundation for Research,Science and Technology has created a separate strategic fund for
global change research (FRST, 2005). Operational research and
development related to climate impacts on specific sectors have
also increased over the last 10 years (e.g., agricultural impacts,
decision-support systems and extension activities for integration
with farmers’ knowledge) (Kenny, 2002; MAF, 2006). One of
Australia’s four National Research Priorities is “an
environmentally sustainable Australia”, which includes
“responding to climate change and variability” (DEST, 2004).
The Australian Climate Change Science Programme and the
National Climate Change Adaptation Programme are part of this
effort (Allen Consulting Group, 2005). All Australian state and
territory governments have greenhouse action plans that include
development of knowledge, data and tools.
Risk assessments
A wide range of regional and sectoral risk assessments has
been undertaken since 2001 (see Section 11.4). Both countries
occasionally produce national reports that synthesise these
assessments and provide a foundation for adaptation (MfE, 2001
Warrick et al., 2001; Howden et al., 2003a; Pittock, 2003).
Regionally relevant guidelines are available for use in risk
assessments (Wratt et al., 2004; AGO, 2006).
Mainstreaming
Climate change issues are gradually being ‘mainstreamed
into policies, plans and strategies for development andmanagement. For example, in New Zealand, the Coastal Policy
Statement included consideration of sea-level rise (DoC, 1994)
the Resource Management (Energy and Climate Change)
Amendment Act 2004 made explicit provisions for the effects
of climate change, and the Civil Defence and Emergency
Management Act 2002 requires regional and local government
authorities (LGAs) to plan for future natural hazards. New
Zealand farmers, particularly in the east, implemented a range of
adaptation measures in response to droughts in the 1980s and
1990s and as a result of the removal of almost all subsidies
Increasing numbers of farmers are focusing on building long-
term resilience with a diversity of options (Kenny, 2005
Salinger et al., 2005b). In Australia, climate change is includedin several environmentally focused action plans, including the
National Agriculture and Climate Change Action Plan
(NRMMC, 2006) and the National Biodiversity and Climate
Change Action Plan. A wide range of water adaptation strategies
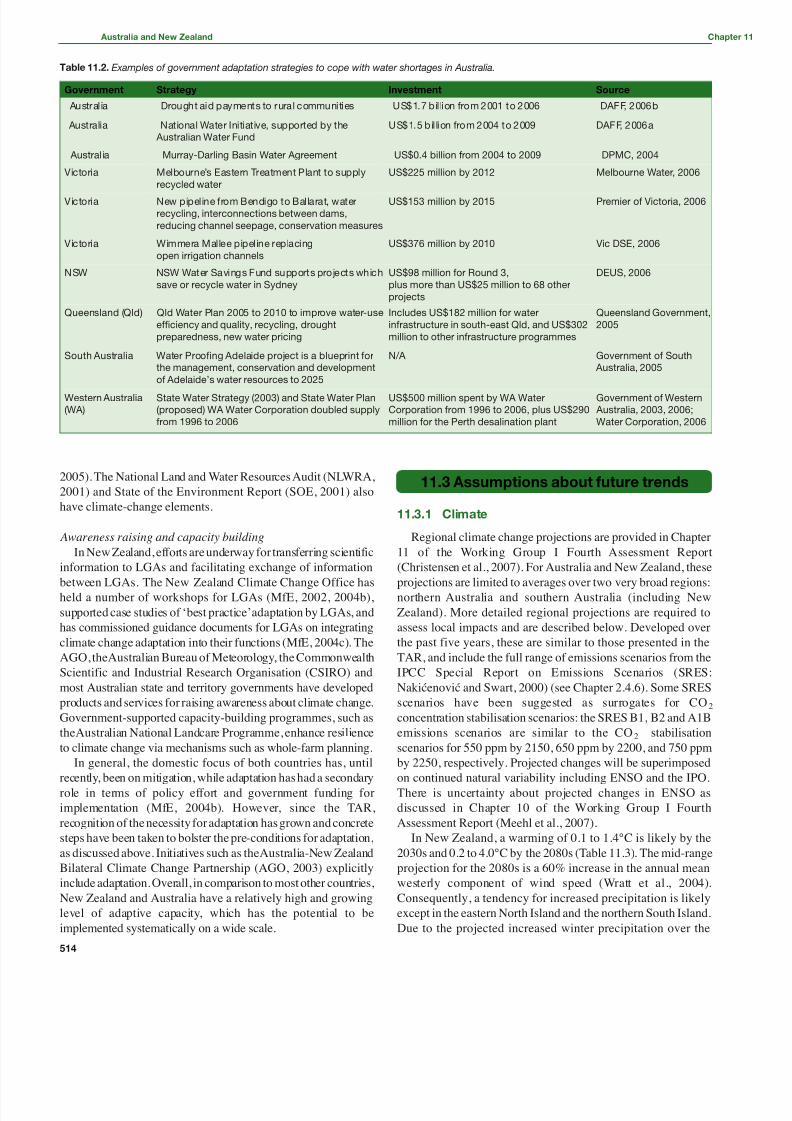
has been implemented or proposed (Table 11.2), including
US$1.5 billion for the National Water Fund from 2004 to 2009
and US$1.7 billion for drought relief from 2001 to 2006.
Climate change is listed as a Key Threatening Process under
the Commonwealth Environment Protection and Biodiversity
Conservation Act 1999. Climate change has been integrated into
several state-based and regional strategies, such as the
Queensland Coastal Management Plan, the Great Barrier Reef
Climate Change Action Plan, the Victorian Sustainable Water
Strategy and South Australia’s Natural Resources Management
Plan. The Wild Country (The Wilderness Society), Gondwana
Links (Western Australia) and Nature Links (South Australia)
and Alps to Atherton (Victoria, NSW, Queensland) initiatives
promote connectivity of landscapes and resilience of natural
systems in recognition of the fact that some species will need to
migrate as climate zones shift. Guidelines prepared for the
coastal and ocean engineering profession for implementing
coastal management strategies include consideration of climate
change (Engineers Australia, 2004).
Evaluation and monitoringThe New Zealand Climate Committee monitors the present
state of knowledge of climate science, climate variability and
current and future climate impacts, and makes recommendations
about research and monitoring needs, priorities and gaps
regarding climate, its impacts and the application of climate
information (RSNZ, 2002). In Australia, the Australian
Greenhouse Office (AGO) monitors and evaluates performance
against objectives in the National Greenhouse Strategy. The
AGO and state and territory governments commission research
to assess current climate change knowledge, gaps and priorities
for research on risk and vulnerability (Allen Consulting GroupFigure 11.1. Adaptation as a process (Warrick, 2000, 2006).
8/3/2019 Chapter 11 - Australia and New Zealand
http://slidepdf.com/reader/full/chapter-11-australia-and-new-zealand 8/34
Australia and New Zealand Chapt
514
2005). The National Land and Water Resources Audit (NLWRA,
2001) and State of the Environment Report (SOE, 2001) also
have climate-change elements.
Awareness raising and capacity building
In New Zealand, efforts are underway for transferring scientific
information to LGAs and facilitating exchange of information
between LGAs. The New Zealand Climate Change Office has
held a number of workshops for LGAs (MfE, 2002, 2004b),
supported case studies of ‘best practice’adaptation by LGAs, and
has commissioned guidance documents for LGAs on integrating
climate change adaptation into their functions (MfE, 2004c). The
AGO, theAustralian Bureau of Meteorology, the Commonwealth
Scientific and Industrial Research Organisation (CSIRO) and
most Australian state and territory governments have developed
products and services for raising awareness about climate change.
Government-supported capacity-building programmes, such as
theAustralian National Landcare Programme, enhance resilience
to climate change via mechanisms such as whole-farm planning.
In general, the domestic focus of both countries has, untilrecently, been on mitigation, while adaptation has had a secondary
role in terms of policy effort and government funding for
implementation (MfE, 2004b). However, since the TAR,
recognition of the necessity for adaptation has grown and concrete
steps have been taken to bolster the pre-conditions for adaptation,
as discussed above. Initiatives such as theAustralia-New Zealand
Bilateral Climate Change Partnership (AGO, 2003) explicitly
include adaptation. Overall, in comparison to most other countries,
New Zealand and Australia have a relatively high and growing
level of adaptive capacity, which has the potential to be
implemented systematically on a wide scale.
11.3 Assumptions about future trends
11.3.1 Climate
Regional climate change projections are provided in Chapter
11 of the Working Group I Fourth Assessment Report
(Christensen et al., 2007). For Australia and New Zealand, these
projections are limited to averages over two very broad regions:
northern Australia and southern Australia (including New
Zealand). More detailed regional projections are required to
assess local impacts and are described below. Developed over
the past five years, these are similar to those presented in the
TAR, and include the full range of emissions scenarios from the
IPCC Special Report on Emissions Scenarios (SRES:
Nakićenović and Swart, 2000) (see Chapter 2.4.6). Some SRES
scenarios have been suggested as surrogates for CO2
concentration stabilisation scenarios: the SRES B1, B2 and A1B
emissions scenarios are similar to the CO2 stabilisation
scenarios for 550 ppm by 2150, 650 ppm by 2200, and 750 ppm
by 2250, respectively. Projected changes will be superimposedon continued natural variability including ENSO and the IPO.
There is uncertainty about projected changes in ENSO as
discussed in Chapter 10 of the Working Group I Fourth
Assessment Report (Meehl et al., 2007).
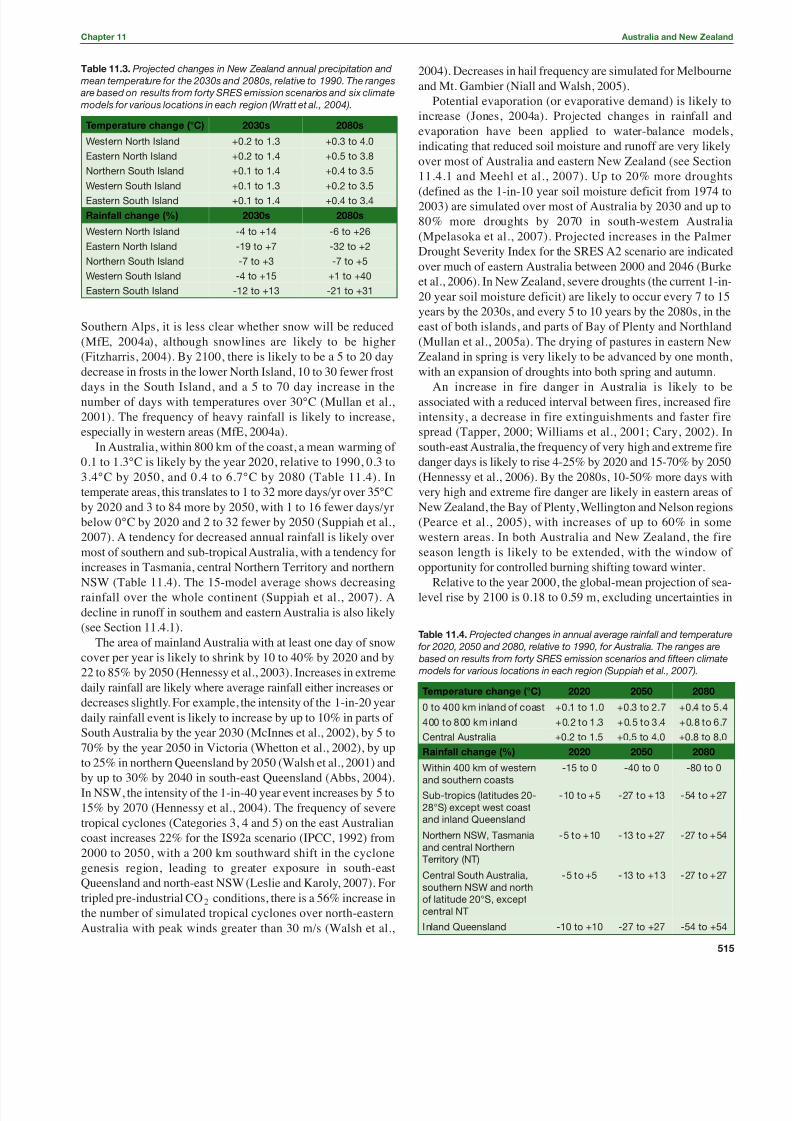
In New Zealand, a warming of 0.1 to 1.4°C is likely by the
2030s and 0.2 to 4.0°C by the 2080s (Table 11.3). The mid-range
projection for the 2080s is a 60% increase in the annual mean
westerly component of wind speed (Wratt et al., 2004).
Consequently, a tendency for increased precipitation is likely
except in the eastern North Island and the northern South Island.
Due to the projected increased winter precipitation over the
Government Strategy Investment Source
Australia Drought aid payments to rural communities US$1.7 bil lion from 2001 to 2006 DAFF, 2006b
Australia National Water Initiative, supported by the Australian Water Fund
US$1.5 bil lion from 2004 to 2009 DAFF, 2006a
Austral ia Murray-Darling Basin Water Agreement US$0.4 billion from 2004 to 2009 DPMC, 2004
Victoria Melbourne’s Eastern Treatment Plant to supplyrecycled water
US$225 million by 2012 Melbourne Water, 2006
Victoria New pipeline from Bendigo to Ballarat, waterrecycling, interconnections between dams,reducing channel seepage, conservation measures
US$153 million by 2015 Premier of Victoria, 2006
Victoria Wimmera Mallee pipeline replacingopen irrigation channels
US$376 million by 2010 Vic DSE, 2006
NSW NSW Water Savings Fund supports projects whichsave or recycle water in Sydney
US$98 million for Round 3,plus more than US$25 million to 68 otherprojects
DEUS, 2006
Queensland (Qld) Qld Water Plan 2005 to 2010 to improve water-useefficiency and quality, recycling, droughtpreparedness, new water pricing
Includes US$182 million for waterinfrastructure in south-east Qld, and US$302million to other infrastructure programmes
Queensland Government,2005
South Australia Water Proofing Adelaide project is a blueprint forthe management, conservation and development
of Adelaide’s water resources to 2025
N/A Government of South Australia, 2005
Western Australia(WA)
State Water Strategy (2003) and State Water Plan(proposed) WA Water Corporation doubled supplyfrom 1996 to 2006
US$500 million spent by WA WaterCorporation from 1996 to 2006, plus US$290million for the Perth desalination plant
Government of Western Australia, 2003, 2006;Water Corporation, 2006
Table 11.2. Examples of government adaptation strategies to cope with water shortages in Australia.
8/3/2019 Chapter 11 - Australia and New Zealand
http://slidepdf.com/reader/full/chapter-11-australia-and-new-zealand 9/34
Chapter 11 Australia and New Zealand
Southern Alps, it is less clear whether snow will be reduced
(MfE, 2004a), although snowlines are likely to be higher
(Fitzharris, 2004). By 2100, there is likely to be a 5 to 20 day
decrease in frosts in the lower North Island, 10 to 30 fewer frost
days in the South Island, and a 5 to 70 day increase in thenumber of days with temperatures over 30°C (Mullan et al.,
2001). The frequency of heavy rainfall is likely to increase,
especially in western areas (MfE, 2004a).
In Australia, within 800 km of the coast, a mean warming of
0.1 to 1.3°C is likely by the year 2020, relative to 1990, 0.3 to
3.4°C by 2050, and 0.4 to 6.7°C by 2080 (Table 11.4). In
temperate areas, this translates to 1 to 32 more days/yr over 35°C
by 2020 and 3 to 84 more by 2050, with 1 to 16 fewer days/yr
below 0°C by 2020 and 2 to 32 fewer by 2050 (Suppiah et al.,
2007). A tendency for decreased annual rainfall is likely over
most of southern and sub-tropical Australia, with a tendency for
increases in Tasmania, central Northern Territory and northern
NSW (Table 11.4). The 15-model average shows decreasing
rainfall over the whole continent (Suppiah et al., 2007). A
decline in runoff in southern and eastern Australia is also likely
(see Section 11.4.1).
The area of mainland Australia with at least one day of snow
cover per year is likely to shrink by 10 to 40% by 2020 and by
22 to 85% by 2050 (Hennessy et al., 2003). Increases in extreme
daily rainfall are likely where average rainfall either increases or
decreases slightly. For example, the intensity of the 1-in-20 year
daily rainfall event is likely to increase by up to 10% in parts of
South Australia by the year 2030 (McInnes et al., 2002), by 5 to
70% by the year 2050 in Victoria (Whetton et al., 2002), by up
to 25% in northern Queensland by 2050 (Walsh et al., 2001) andby up to 30% by 2040 in south-east Queensland (Abbs, 2004).
In NSW, the intensity of the 1-in-40 year event increases by 5 to
15% by 2070 (Hennessy et al., 2004). The frequency of severe
tropical cyclones (Categories 3, 4 and 5) on the east Australian
coast increases 22% for the IS92a scenario (IPCC, 1992) from
2000 to 2050, with a 200 km southward shift in the cyclone
genesis region, leading to greater exposure in south-east
Queensland and north-east NSW (Leslie and Karoly, 2007). For
tripled pre-industrial CO2 conditions, there is a 56% increase in
the number of simulated tropical cyclones over north-eastern
Australia with peak winds greater than 30 m/s (Walsh et al.,
2004). Decreases in hail frequency are simulated for Melbourne
and Mt. Gambier (Niall and Walsh, 2005).
Potential evaporation (or evaporative demand) is likely to
increase (Jones, 2004a). Projected changes in rainfall and
evaporation have been applied to water-balance models
indicating that reduced soil moisture and runoff are very likely
over most of Australia and eastern New Zealand (see Section
11.4.1 and Meehl et al., 2007). Up to 20% more droughts
(defined as the 1-in-10 year soil moisture deficit from 1974 to2003) are simulated over most of Australia by 2030 and up to
80% more droughts by 2070 in south-western Australia
(Mpelasoka et al., 2007). Projected increases in the Palmer
Drought Severity Index for the SRES A2 scenario are indicated
over much of eastern Australia between 2000 and 2046 (Burke
et al., 2006). In New Zealand, severe droughts (the current 1-in-
20 year soil moisture deficit) are likely to occur every 7 to 15
years by the 2030s, and every 5 to 10 years by the 2080s, in the
east of both islands, and parts of Bay of Plenty and Northland
(Mullan et al., 2005a). The drying of pastures in eastern New
Zealand in spring is very likely to be advanced by one month
with an expansion of droughts into both spring and autumn.
An increase in fire danger in Australia is likely to beassociated with a reduced interval between fires, increased fire
intensity, a decrease in fire extinguishments and faster fire
spread (Tapper, 2000; Williams et al., 2001; Cary, 2002). In
south-east Australia, the frequency of very high and extreme fire
danger days is likely to rise 4-25% by 2020 and 15-70% by 2050
(Hennessy et al., 2006). By the 2080s, 10-50% more days with
very high and extreme fire danger are likely in eastern areas of
New Zealand, the Bay of Plenty, Wellington and Nelson regions
(Pearce et al., 2005), with increases of up to 60% in some
western areas. In both Australia and New Zealand, the fire
season length is likely to be extended, with the window of
opportunity for controlled burning shifting toward winter.
Relative to the year 2000, the global-mean projection of sea-
level rise by 2100 is 0.18 to 0.59 m, excluding uncertainties in
Temperature change (°C) 2030s 2080s
Western North Island +0.2 to 1.3 +0.3 to 4.0
Eastern North Island +0.2 to 1.4 +0.5 to 3.8
Northern South Island +0.1 to 1.4 +0.4 to 3.5
Western South Island +0.1 to 1.3 +0.2 to 3.5Eastern South Island +0.1 to 1.4 +0.4 to 3.4
Rainfall change (%) 2030s 2080s
Western North Island -4 to +14 -6 to +26
Eastern North Island -19 to +7 -32 to +2
Northern South Island -7 to +3 -7 to +5
Western South Island -4 to +15 +1 to +40
Eastern South Island -12 to +13 -21 to +31
Table 11.3. Projected changes in New Zealand annual precipitation and
mean temperature for the 2030s and 2080s, relative to 1990. The ranges
are based on results from forty SRES emission scenarios and six climate
models for various locations in each region (Wratt et al., 2004).
Temperature change (°C) 2020 2050 2080
0 to 400 km inland of coast +0.1 to 1.0 +0.3 to 2.7 +0.4 to 5.4
400 to 800 km inland +0.2 to 1.3 +0.5 to 3.4 +0.8 to 6.7
Central Australia +0.2 to 1.5 +0.5 to 4.0 +0.8 to 8.0
Rainfall change (%) 2020 2050 2080
Within 400 km of westernand southern coasts
-15 to 0 -40 to 0 -80 to 0
Sub-tropics (latitudes 20-28°S) except west coastand inland Queensland
-10 to +5 -27 to +13 -54 to +27
Northern NSW, Tasmaniaand central NorthernTerritory (NT)
-5 to +10 -13 to +27 -27 to +54
Central South Australia,southern NSW and northof latitude 20°S, exceptcentral NT
-5 to +5 -13 to +13 -27 to +27
Inland Queensland -10 to +10 -27 to +27 -54 to +54
Table 11.4. Projected changes in annual average rainfall and temperature
for 2020, 2050 and 2080, relative to 1990, for Australia. The ranges are
based on results from forty SRES emission scenarios and fifteen climate
models for various locations in each region (Suppiah et al., 2007).
515
8/3/2019 Chapter 11 - Australia and New Zealand
http://slidepdf.com/reader/full/chapter-11-australia-and-new-zealand 10/34
Australia and New Zealand Chapt
516
carbon cycle feedbacks and the possibility of faster ice loss
from Greenland and Antarctica (Meehl et al., 2007). These
values would apply to Australia and New Zealand, but would
be further modified by as much as ±25% due to regional
differences in thermal expansion rates, oceanic circulation
changes (as derived from atmosphere-ocean general
circulation model experiments; Gregory et al., 2001) and by
local differences in relative sea-level changes due to vertical
land movements. An increase in westerly winds is probablesouth of latitude 45°S, with a strengthening of the East
Australian Current and southern mid-latitude ocean
circulation (Cai et al., 2005).
11.3.2 Population, energy and agriculture
The Australian population is projected to grow from 20
million in 2003 to 26.4 million in 2051, then stabilise (ABS,
2003a). This is under medium assumptions, including a fall
in the number of children per woman from 1.75 at present to
1.6 from 2011 onward, net immigration of 100,000/yr, and a
10% increase in life expectancy by 2051 (ABS, 2003a). A
greater concentration of the population is likely in Sydney,Melbourne, Perth, Brisbane and south-east Queensland. The
proportion of people aged 65 and over is likely to increase
from 13% in 2003 to 27% in 2051 (ABS, 2003a). Population
growth is likely to intensify the urban heat island effect,
exacerbating greenhouse-induced warming (Torok et al.,
2001). Up to at least 2020, Australian energy consumption is
projected to grow 2.1%/yr on average (ABARE, 2004). New
energy sources will be needed to meet peak energy demands
in Victoria, NSW, Queensland and South Australia between
2007 and 2010 (NEMMCO, 2006). Agriculture is likely to
contribute about 3% of national gross domestic product
(GDP).
In New Zealand, under medium assumptions, the
population is likely to grow from 4.1 million in 2004 to 5.05
million in 2051 (Statistics New Zealand, 2005b). These
assumptions include a net immigration of 10,000/yr, a drop in
fertility rate from 2.01 in 2004 to 1.85 from 2016 onward and
a 10% increase in life expectancy by 2051. The proportion
aged 65 and over is likely to grow from 12% in 2004 to 25%
in 2051. Total energy demand is likely to grow at an average
rate of 2.4%/yr from 2005 to 2025 (Electricity Commission,
2005). Agriculture is likely to continue contributing about 5%
of GDP (MFAT, 2006).
11.4 Key future impacts and vulnerabilities
This section discusses potential impacts of climate change,
mostly based on climate projections consistent with those
described in Section 11.3. It does not take into account
adaptation; this is discussed in Section 11.5 and in more detail
in Chapter 17. Conclusions are drawn from the available literature.
Very little information is available on social and economic impacts.
Further details on potential impacts can be found in various
synthesis reports (MfE, 2001; Pittock, 2003).
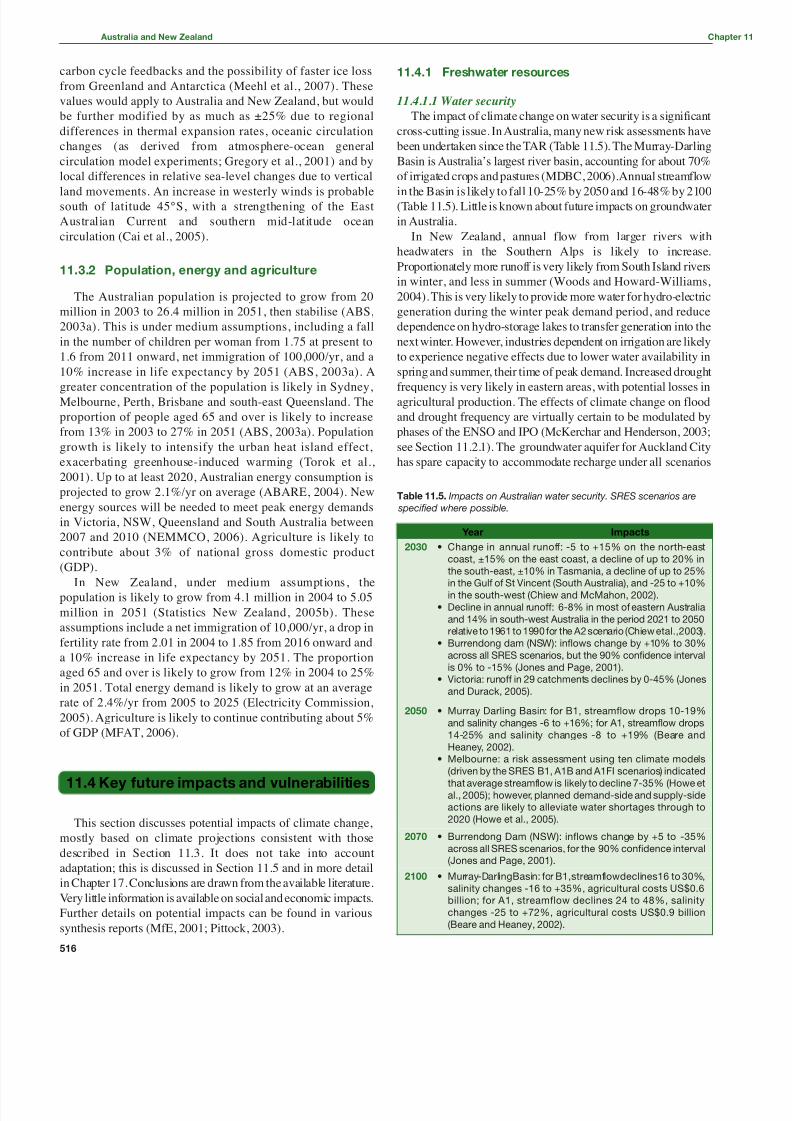
11.4.1 Freshwater resources
11.4.1.1 Water security
The impact of climate change on water security is a significant
cross-cutting issue. In Australia, many new risk assessments have
been undertaken since the TAR (Table 11.5). The Murray-Darling
Basin is Australia’s largest river basin, accounting for about 70%
of irrigated crops and pastures (MDBC, 2006).Annual streamflow
in the Basin is likely to fall 10-25% by 2050 and 16-48% by 2100(Table 11.5). Little is known about future impacts on groundwater
in Australia.
In New Zealand, annual flow from larger rivers with
headwaters in the Southern Alps is likely to increase.
Proportionately more runoff is very likely from South Island rivers
in winter, and less in summer (Woods and Howard-Williams,
2004). This is very likely to provide more water for hydro-electric
generation during the winter peak demand period, and reduce
dependence on hydro-storage lakes to transfer generation into the
next winter. However, industries dependent on irrigation are likely
to experience negative effects due to lower water availability in
spring and summer, their time of peak demand. Increased drought
frequency is very likely in eastern areas, with potential losses inagricultural production. The effects of climate change on flood
and drought frequency are virtually certain to be modulated by
phases of the ENSO and IPO (McKerchar and Henderson, 2003;
see Section 11.2.1). The groundwater aquifer for Auckland City
has spare capacity to accommodate recharge under all scenarios
Year Impacts
2030 • Change in annual runoff: -5 to +15% on the north-eastcoast, ±15% on the east coast, a decline of up to 20% in
the south-east, ±10% in Tasmania, a decline of up to 25%in the Gulf of St Vincent (South Australia), and -25 to +10%in the south-west (Chiew and McMahon, 2002).
• Decline in annual runoff: 6-8% in most of eastern Australiaand 14% in south-west Australia in the period 2021 to 2050relative to 1961 to 1990 for the A2 scenario (Chiew etal.,2003).
• Burrendong dam (NSW): inflows change by +10% to 30%across all SRES scenarios, but the 90% confidence intervalis 0% to -15% (Jones and Page, 2001).
• Victoria: runoff in 29 catchments declines by 0-45% (Jonesand Durack, 2005).
2050 • Murray Darling Basin: for B1, streamflow drops 10-19%and salinity changes -6 to +16%; for A1, streamflow drops14-25% and salinity changes -8 to +19% (Beare andHeaney, 2002).
• Melbourne: a risk assessment using ten climate models(driven by the SRES B1, A1B and A1FI scenarios) indicatedthat average streamflow is likely to decline 7-35% (Howe etal., 2005); however, planned demand-side and supply-sideactions are likely to alleviate water shortages through to2020 (Howe et al., 2005).
2070 • Burrendong Dam (NSW): inflows change by +5 to -35%across all SRES scenarios, for the 90% confidence interval(Jones and Page, 2001).
2100 • Murray-DarlingBasin: for B1,streamflowdeclines16 to 30%,salinity changes -16 to +35%, agricultural costs US$0.6billion; for A1, streamflow declines 24 to 48%, salinitychanges -25 to +72%, agricultural costs US$0.9 billion(Beare and Heaney, 2002).
Table 11.5. Impacts on Australian water security. SRES scenarios are
specified where possible.

8/3/2019 Chapter 11 - Australia and New Zealand
http://slidepdf.com/reader/full/chapter-11-australia-and-new-zealand 11/34
Chapter 11 Australia and New Zealand
517
examined (Namjou et al., 2005). Base flows in principal streams
and springs are very unlikely to be compromised unless many dry
years occur in succession.
11.4.1.2 Flood and waste water management
Little quantitative information is available about potential
changes in flood risk inAustralia. Sufficient capacity exists within
the Melbourne sewerage and drainage systems to accommodate
moderate increases (up to 20%) in storm rainfall totals withminimal surcharging (Howe et al., 2005). For the Albert-Logan
Rivers system near the Gold Coast in Queensland, each 1%
increase in rainfall intensity is likely to produce a 1.4% increase
in peak runoff (Abbs et al., 2000). However, increases in runoff
and flooding are partially offset by a reduction in average rainfall,
which reduces soil wetness prior to storms. A high-resolution
atmospheric model of storm events coupled with a non-linear
flood event model has been applied to flooding around the Gold
Coast caused by tropical cyclone Wanda in 1974. If the same event
occurred in 2050 with a 10 to 40 cm rise in mean sea level, the
number of dwellings and people affected is likely to increase by
3 to 18% (Abbs et al., 2000).
In New Zealand, rain events are likely to become moreintense, leading to greater storm runoff, but with lower river
levels between events. This is likely to cause greater erosion of
land surfaces, more landslides (Glade, 1998; Dymond et al.,
2006), redistribution of river sediments (Griffiths, 1990) and a
decrease in the protection afforded by levees. Increased demands
for enhancement of flood protection works are likely, as
evidenced by the response to large floods in 2004 (MCDEM,
2004; CAE, 2005). Flood risk to Westport has been assessed
using a regional atmospheric model, a rainfall-runoff model for
the Buller River, projected sea-level rise and a detailed inundation
model. Assuming the current levee configuration, the proportion
of the town inundated by a 1-in-50 year event is currently 4.3%,
but rises to 13 to 30% by 2030, and 30 to 80% by 2080 (Gray et
al., 2005). Peak flow increases 4% by 2030 and 40% by 2080. In
contrast, a flood risk study for Auckland using 2050 climate
scenarios with 1 to 2°C global warming indicated only minor
increases in flood levels (Dayananda et al., 2005). Higher flows
and flood risk are likely in the Wairau catchment in North Shore
City (URS, 2004).
11.4.1.3 Water quality
In Australia, there is a 50% chance by 2020 of the average
salinity of the lower Murray River exceeding the 800 EC
threshold set for desirable drinking and irrigation water
(MDBMC, 1999). There are no integrated assessments of theimpacts of climate change on runoff quantity and quality, salt
interception and revegetation policies, and water pricing and
trading policies. Eutrophication is a major water-quality problem
(Davis, 1997; SOE, 2001). Toxic algal blooms are likely to
become more frequent and to last longer due to climate change.
They can pose a threat to human health, for both recreation and
consumptive water use, and can kill fish and livestock (Falconer,
1997). Simple, resource-neutral, adaptive management
strategies, such as flushing flows, can substantially reduce their
occurrence and duration in nutrient-rich, thermally stratified
water bodies (Viney et al., 2003).
In New Zealand, lowland waterways in agricultural catchments
are in a relatively poor state and these streams are under pressure
from land-use intensification and increasing water abstraction
demands (Larned et al., 2004). There is no literature on impacts of
climate change on water quality in New Zealand.
11.4.2 Natural ecosystems
The flora and fauna of Australia and New Zealand have ahigh degree of endemism (80 to 100% in many taxa). Many
species are at risk from rapid climate change because they are
restricted in geographical and climatic range. Most species are
well-adapted to short-term climate variability, but not to longer-
term shifts in mean climate and increased frequency or intensity
of extreme events. Many reserved areas are small and isolated
particularly in the New Zealand lowlands and in the agricultura
areas of Australia. Bioclimatic modelling studies generally
project reductions and/or fragmentation of existing climatic
ranges. Climate change will also interact with other stresses
such as invasive species and habitat fragmentation. The most
vulnerable include the Wet Tropics and Kakadu wetlands, alpine
areas, tropical and deep-sea coral reefs, south-east Tasman Sea,isolated habitats in the New Zealand lowlands, coastal and
freshwater wetlands and south-west Australian heathlands
(Table 11.6). There is little research on the impacts of climate
change on New Zealand species or natural ecosystems, with the
exception of the alpine zone and some forested areas.
Major changes are expected in all vegetation communities. In
the Australian rangelands (75% of total continental land area)
shifts in rainfall patterns are likely to favour establishment of
woody vegetation and encroachment of unpalatable woody
shrubs. Interactions between CO2, water supply, grazing
practices and fire regimes are likely to be critical (Gifford and
Howden, 2001; Hughes, 2003). In New Zealand, fragmented
native forests of drier lowland areas (Northland, Waikato
Manawatu) and in the east (from East Cape to Southland) are
likely to be most vulnerable to drying and changes in fire
regimes (McGlone, 2001; MfE, 2001). In alpine zones of both
countries, reductions in duration and depth of snow cover are
likely to alter distributions of communities, for example
favouring an expansion of woody vegetation into herbfields
(Pickering et al., 2004). More fires are likely in alpine peatlands
(Whinam et al., 2003). Alpine vertebrates dependent on snow
cover for hibernation are likely to be at risk of extinction
(Pickering et al., 2004). In regions such as south-western
Australia, many narrow-ranged endemic species will be
vulnerable to extinction with relatively small amounts ofwarming (Hughes, 2003). Saltwater intrusion as a result of sea-
level rise, decreases in river flows and increased drought
frequency, are very likely to alter species composition of
freshwater habitats, with consequent impacts on estuarine and
coastal fisheries (Bunn and Arthington, 2002; Hall and Burns
2002; Herron et al., 2002; Schallenberg et al., 2003). In marine
ecosystems, ocean acidification is likely to decrease
productivity and diversity of plankton communities around
Australia, while warmer oceans are likely to lead to further
southward movement of fish and kelp communities
(Poloczanska et al., 2007).
8/3/2019 Chapter 11 - Australia and New Zealand
http://slidepdf.com/reader/full/chapter-11-australia-and-new-zealand 12/34
On the sub-Antarctic Islands, likely impacts include
increased mortality of burrowing petrels, increased invasions
by disturbance-tolerant alien plants such as Poa annua,
increased abundance of existing rats, mice and rabbits onislands, and reduced distribution of Sphagnum moss (Bergstrom
and Selkirk, 1999; Frenot et al., 2005).
11.4.3 Agriculture
11.4.3.1 Cropping
Since the TAR, there has been further assessment of potential
impacts of climate and CO2 changes at local, regional and
national scales in both Australia and New Zealand. Overall,
these emphasise the vulnerability of cropping and the potential
for regional differences. Impacts of climate change on pests,
diseases and weeds, and their effects on crops, remain uncertain,
since few experimental or modelling studies have been
performed (Chakraborty et al., 2002).
In New Zealand, for C3 crops such as wheat, the CO2
response is likely to more than compensate for a moderate
increase in temperature (Jamieson et al., 2000) (see Section 5.4).
The net impact in irrigation areas depends on the availability of
water (Miller and Veltman, 2004). For maize (a C4 crop),
reduction in growth duration reduces crop water requirements,providing closer synchronisation of development with seasonal
climatic conditions (Sorensen et al., 2000).
In Australia, the potential impacts of climate change on wheat
vary regionally, as shown by a study which used the full range
of CO2 and climate change in the IPCC SRES scenarios
(Howden and Jones, 2004), in conjunction with a crop model
recently validated for its CO2 response for current wheat
varieties (Reyenga et al., 2001; Asseng et al., 2004). South-
western Australian regions are likely to have significant yield
reductions by 2070 (increased yield very unlikely). In contrast,
regions in north-eastern Australia are likely to have moderate
increases in yield (unlikely to have substantial yield reductions).
Nationally, median crop yields dropped slightly. There is asubstantial risk to the industry as maximum potential increases
in crop value are limited (to about 10% or US$0.3 billion/yr)
but maximum potential losses are large (about 50% or US$1.4
billion/yr) (Figure 11.2). However, adaptation through changing
planting dates and varieties is likely to be highly effective: the
median benefit is projected to be US$158 million/yr but with a
range of US$70 million to over US$350 million/yr (Howden and
Jones, 2004) (Figure 11.2).
Climate change is likely to change land use in southern
Australia, with cropping becoming non-viable at the dry
margins if rainfall is reduced substantially, even though yield
increases from elevated CO2
partly offset this effect (Sinclair et
al., 2000; Luo et al., 2003). In contrast, cropping is likely to
expand into the wet margins if rainfall declines. In the north of
Australia, climate change and CO2 increases are likely to enable
cropping to persist (Howden et al., 2001a). Observed warming
trends are already reducing frost risk and increasing yields
(Howden et al., 2003b).
Grain quality is also likely to be affected. Firstly, elevated CO2
reduces grain protein levels (Sinclair et al., 2000). Significant
increases in nitrogenous fertiliser application or increased use of
pasture legume rotations would be needed to maintain protein
levels (Howden et al., 2003c). Secondly, there is increased risk of
development of undesirable heat-shock proteins in wheat grain in
both northern and southern cropping zones with temperatureincreases greater than 4°C (Howden et al., 1999d).
Land degradation is likely to be affected by climate change.
Elevated atmospheric CO2 concentrations slightly reduce crop
evapotranspiration. This increases the risk of water moving
below the root zone of crops (deep drainage), potentially
exacerbating three of Australia’s most severe land degradation
problems across agricultural zones: waterlogging, soil
acidification and dryland salinity. In Western Australia, deep
drainage is simulated to increase 1 to 10% when CO2 is raised
to 550 ppm, but deep drainage decreases 8 to 29% for a 3°C
warming (van Ittersum et al., 2003). Deep drainage is reduced by
Australia and New Zealand Chapt
518
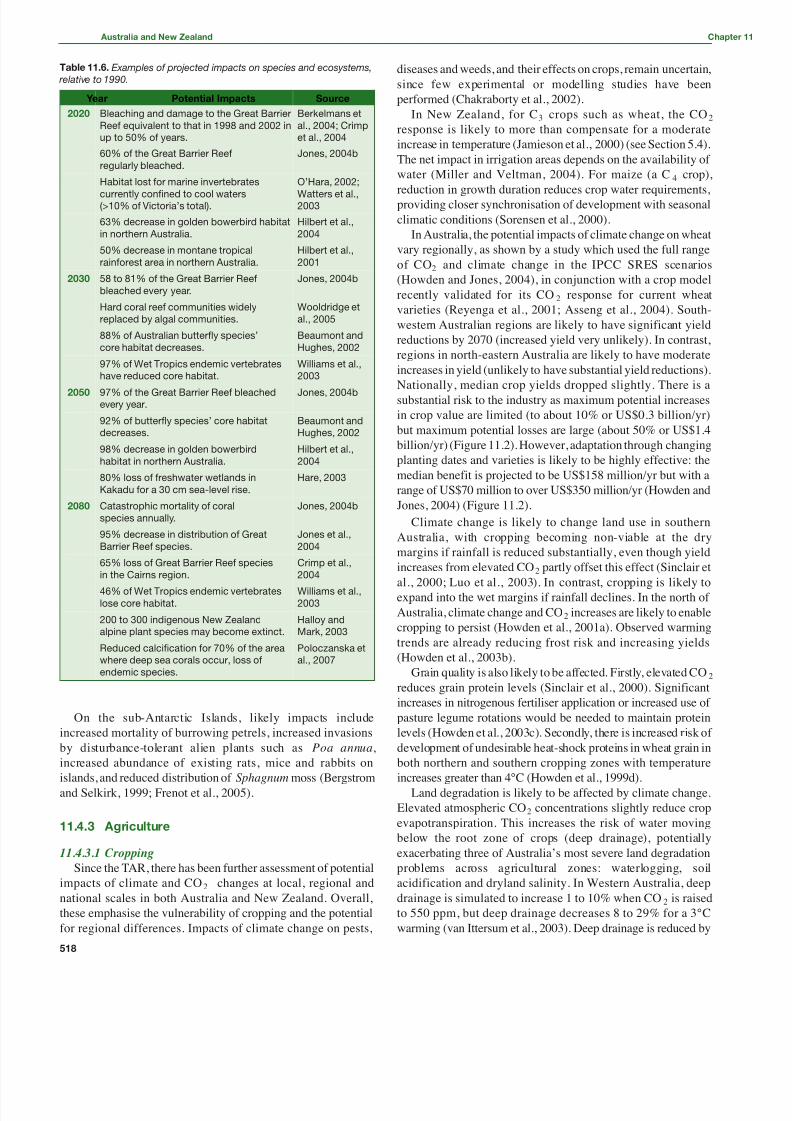
Year Potential Impacts Source
2020 Bleaching and damage to the Great BarrierReef equivalent to that in 1998 and 2002 inup to 50% of years.
Berkelmans etal., 2004; Crimpet al., 2004
60% of the Great Barrier Reefregularly bleached.
Jones, 2004b
Habitat lost for marine invertebrates
currently confined to cool waters(>10% of Victoria’s total).
O’Hara, 2002;
Watters et al.,2003
63% decrease in golden bowerbird habitatin northern Australia.
Hilbert et al.,2004
50% decrease in montane tropicalrainforest area in northern Australia.
Hilbert et al.,2001
2030 58 to 81% of the Great Barrier Reefbleached every year.
Jones, 2004b
Hard coral reef communities widelyreplaced by algal communities.
Wooldridge etal., 2005
88% of Australian butterfly species’core habitat decreases.
Beaumont andHughes, 2002
97% of Wet Tropics endemic vertebrateshave reduced core habitat.
Williams et al.,2003
2050 97% of the Great Barrier Reef bleachedevery year.
Jones, 2004b
92% of butterfly species’ core habitatdecreases.
Beaumont andHughes, 2002
98% decrease in golden bowerbirdhabitat in northern Australia.
Hilbert et al.,2004
80% loss of freshwater wetlands inKakadu for a 30 cm sea-level rise.
Hare, 2003
2080 Catastrophic mortality of coralspecies annually.
Jones, 2004b
95% decrease in distribution of GreatBarrier Reef species.
Jones et al.,2004
65% loss of Great Barrier Reef species
in the Cairns region.
Crimp et al.,
200446% of Wet Tropics endemic vertebrateslose core habitat.
Williams et al.,2003
200 to 300 indigenous New Zealandalpine plant species may become extinct.
Halloy andMark, 2003
Reduced calcification for 70% of the areawhere deep sea corals occur, loss ofendemic species.
Poloczanska etal., 2007
Table 11.6. Examples of projected impacts on species and ecosystems,
relative to 1990.

8/3/2019 Chapter 11 - Australia and New Zealand
http://slidepdf.com/reader/full/chapter-11-australia-and-new-zealand 13/34
Chapter 11 Australia and New Zealand
519
Figure 11.2: Change in national gross value of wheat from historical baseline values (%) for 2070 as a result of increases in CO 2 and changes in
temperature and rainfall: (a) without adaptation and (b) with adaptations of changed planting dates and varieties (Howden and Jones, 2004).
up to 94% in low precipitation scenarios. However, the changes
in deep drainage were not correlated with changes in
productivity or gross margin.
11.4.3.2 Horticulture
Australian temperate fruits and nuts are all likely to be
negatively affected by warmer conditions because they require
winter chill or vernalisation. Crops reliant on irrigation are likely
to be threatened where irrigation water availability is reduced.
Climate change is likely to make a major horticultural pest, the
Queensland fruit fly Bactrocera tryoni, a significant threat to
southern Australia. Warming scenarios of 0.5, 1.0 and 2.0°C
suggest expansion from its endemic range in the north and north-
east across most of the non-arid areas of the continent, including
the currently quarantined fruit fly-free zone (Sutherst et al.,
2000). Apple, orange and pear growers in endemic Queensland
fruit fly areas are likely to have cost increases of 42 to 82%, and
24 to 83% in the current fruit fly-free zone (Sutherst et al., 2000).
In New Zealand, warmer summer temperatures for Hayward
kiwifruit are likely to increase vegetative growth at the expense of
fruit growth and quality (Richardson et al., 2004). Kiwifruit
budbreak is likely to occur later, reducing flower numbers and
yield in northern zones (Hall et al., 2001). Production of current
kiwifruit varieties is likely to become uneconomic in Northland by
2050 because of a lack of winter chilling, and be dependent on
dormancy-breaking agents and varieties bred for warmer winter
temperatures in the Bay of Plenty (Kenny et al., 2000). In contrast,
more areas in the South Island are likely to be suitable (MfE,
2001). Apples, another major crop, are very likely to flower andreach maturity earlier, with increased fruit size, especially after
2050 (Austin et al., 2000). New Zealand is likely to be more
susceptible to the establishment of new horticultural pests. For
example, under the current climate, only small areas in the north
are suitable for the oriental fruit fly, but by the 2080s it is likely
to expand to much of the North Island (Stephens et al., 2007).
Viticulture has expanded rapidly in both countries. Earlier
ripening and reductions in grape quality and value are likely by
2030, e.g., in Australia, price per tonne drops 4 to 10% in the
Yarra Valley and 16 to 52% in the Riverina (Webb et al., 2006).
In cooler Australian climates, warming is likely to allow
alternative varieties to be grown. With warming and a longer
growing season in New Zealand, red wine production is
increasingly likely to be practised in the south, with higher yields
(Salinger et al., 1990). Higher CO2 levels increase vinevegetative growth, and subsequent shading is likely to reduce
fruitfulness. Distribution of vines is likely to change depending
upon suitability compared with high-yield pasture and
silviculture, and with future irrigation water availability and cost
(Hood et al., 2002).
11.4.3.3 Pastoral and rangeland farming
In western, southern and higher-altitude areas of New
Zealand, higher temperatures, a longer growing season, higher
CO2 concentrations and less frost are very likely to increase
annual pasture production by 10 to 20% by 2030, although gains
may decline thereafter (MfE, 2001). In eastern New Zealand and
Northland, pasture productivity is likely to decline by 2030 due
to increased drought frequency (see Section 11.3.1). Sub-tropical
pastoral species with lower feed quality such as Paspalum are
likely to spread southwards, reducing productivity (Clark et al.
2001), particularly in the Waikato district. The range and
incidence of many pests and diseases are likely to increase
Drought and water security problems are likely to make irrigated
agriculture vulnerable, e.g., intensive dairying in Canterbury
(Jenkins, 2006).
In Australia, a rise in CO2 concentration is likely to increase
pasture growth, particularly in water-limited environments
(Ghannoum et al., 2000; Stokes and Ash, 2006; see also Section
5.4). However, if rainfall is reduced by 10%, this CO2 benefit islikely to be offset (Howden et al., 1999d; Crimp et al., 2002). A
20% reduction in rainfall is likely to reduce pasture productivity
by an average of 15% and liveweight gain in cattle by 12%
substantially increasing variability in stocking rates and reducing
farm income (Crimp et al., 2002). Elevated concentrations of CO2
significantly decrease leaf nitrogen content and increase non-
structural carbohydrate, but cause little change in digestibility
(Lilley et al., 2001). In farming systems with high nitrogen forage
(e.g., temperate pastures), these effects are likely to increase
energy availability, nitrogen processing in the rumen and
productivity. In contrast, where nitrogen is deficient (e.g.
8/3/2019 Chapter 11 - Australia and New Zealand
http://slidepdf.com/reader/full/chapter-11-australia-and-new-zealand 14/34
Australia and New Zealand Chapt
520
rangelands), higher temperatures are likely to exacerbate existing
problems by decreasing non-structural carbohydrate
concentrations and digestibility, particularly in tropical C4 grasses
(see Section 5.4.3). Doubled CO2 concentrations and warming are
likely to result in only limited changes in the distributions of
native C3 and C4 grasses (Howden et al., 1999b).
Climatic changes are likely to increase major land-
degradation problems such as erosion and salinisation (see
Section 11.4.3.1). They are also likely to increase the potentialdistribution and abundance of exotic weeds, e.g., Acacia nilotica
and Cryptostegia grandiflora (Kriticos et al., 2003a, b) and
native woody species, e.g., A. aneura (Moore et al., 2001). This
is likely to increase competition with pasture grasses, reducing
livestock productivity. However, the same CO2 and climate
changes are likely to provide increased opportunities for woody
weed control through increased burning opportunities (Howden
et al., 2001b). A warming of 2.5°C is likely to lead to a 15 to
60% reduction in rabbit populations in some areas via the impact
on biological control agents, e.g., myxomatosis and rabbit
haemorrhagic disease virus (Scanlan et al., 2006).
Heat stress already affects livestock in many Australian
regions, reducing production and reproductive performance andenhancing mortality (see Section 5.4.3). Increased thermal stress
on animals is very likely (Howden et al., 1999a). In contrast,
less cold-stress is likely to reduce lamb mortality in both
countries. Impacts of the cattle tick ( Boophilus microplus) on
the Australian beef industry are likely to increase and move
southwards (White et al., 2003). If breakdown of quarantine
occurs, losses in live-weight gain from tick infestation are
projected to increase 30% in 2030 and 120% in 2100 (in the
absence of adaptation). The net present value of future tick
losses is estimated as 21% of farm cash income in Queensland,
the state currently most severely affected.
11.4.4 Forestry
In Australia, the value of wood and wood products in 2001-
2002 was US$5 billion/yr. About 164 million ha are classified as
forest, with 1% as plantation forests and 7% available for timber
production in state-managed, multiple-use native forests (BRS,
2003). New Zealand’s indigenous forests cover 6.4 million ha,
with 1.7 million ha of planted production exotic forests, the latter
providing substantial export income (MAF, 2001). Research
since the TAR confirms that climate change is likely to have
both positive and negative impacts on forestry in both countries.
Productivity of exotic softwood and native hardwood plantations
is likely to be increased by CO2 fertilisation effects, althoughthe amount of increase will be limited by projected increases in
temperature, reductions in rainfall and by feedbacks such as
nutrient cycling (Howden et al., 1999c; Kirschbaum, 1999a, b).
Where trees are not water-limited, warming expands the
growing season in southern Australia, but pest damage is likely
to negate some gains (see Section 5.4.5). Reduction in average
runoff in some regions (see Section 11.4.1) and increased fire
risk (see Section 11.3.1) are very likely to reduce productivity,
whilst increased rainfall intensity is likely to exacerbate soil
erosion problems and pollution of streams during forestry
operations (Howden et al., 1999c). In Pinus radiata and
Eucalyptus plantations, fertile sites are likely to have increased
productivity for moderate warming, whereas infertile sites are
likely to have decreased production (Howden et al., 1999c).
In New Zealand, the growth rates for plantation forestry
(mainly P. radiata) are likely to increase in response to elevated
CO2 and wetter conditions in the south and west. Studies of pine
seedlings confirm that the growth and wood density of P. radiata
are enhanced during the first two years of artificial CO2
fertilisation (Atwell et al., 2003). Tree growth reductions arelikely for the east of the North Island due to projected rainfall
decreases and increased fire risk (see Section 11.3.1). However,
uncertainties remain regarding increased water-use efficiency
with elevated CO2 (MfE, 2001), and whether warmer and drier
conditions could increase the frequency of upper mid-crown
yellowing and winter fungal diseases (MfE, 2001).
11.4.5 Coasts
Over 80% of the Australian population lives in the coastal
zone, with significant recent non-metropolitan population
growth (Harvey and Caton, 2003). About 711,000 addresses
(from the National Geo-coded Address File) are within 3 km of the coast and less than 6 m above sea level, with more than 60%
located in Queensland and NSW (Chen and McAneney, 2006).
These are potentially at risk from long-term sea-level rise and
large storm surges.
Rises in sea level, together with changes to weather patterns,
ocean currents, ocean temperature and storm surges are very
likely to create differences in regional exposure (Walsh, 2002;
MfE, 2004a; Voice et al., 2006). In New Zealand, there are likely
to be more vigorous and regular swells on western coasts (MfE,
2004a). In northern Australia, tropical cyclones are likely to
become more intense (see Section 11.3). The area of Cairns at
risk of inundation by a 1-in-100 year storm surge is likely to
more than double by 2050 (McInnes et al., 2003). Major impacts
are very likely for coral reefs, particularly the Great Barrier Reef
(see Section 11.6).
Future effects on coastal erosion include climate-induced
changes in coastal sediment supply and storminess. In Pegasus
Bay (New Zealand), shoreline erosion of up to 50 m is likely
between 1980 and 2030 near the Waipara River if southerly
waves are reduced by 50%, and up to 80 m near the Waimakariri
River if river sand is reduced by 50% (Bell et al., 2001). In New
Zealand, emphasis has been placed on providing information,
guidelines and tools such as zoning and setbacks to local
authorities for risk-based planning and management of coastal
hazards affected by climate change and variability (Bell et al.,2001; MfE, 2004a) (see Section 11.6). In Australia, linkages
between the IPO, ENSO and changes in coastal geomorphology
have been demonstrated for the northern NSW coast (Goodwin,
2005; Goodwin et al., 2006) and between historic beach erosion
and ENSO for Narabeen Beach (NSW) (Ranasinghe et al., 2004).
Sea-level rise is virtually certain to cause greater coastal
inundation, erosion, loss of wetlands and salt-water intrusion
into freshwater sources (MfE, 2004a), with impacts on
infrastructure, coastal resources and existing coastal
management programmes. Model simulations indicate that the
loss of wetlands and mangroves in Spencer Gulf due to sea-level
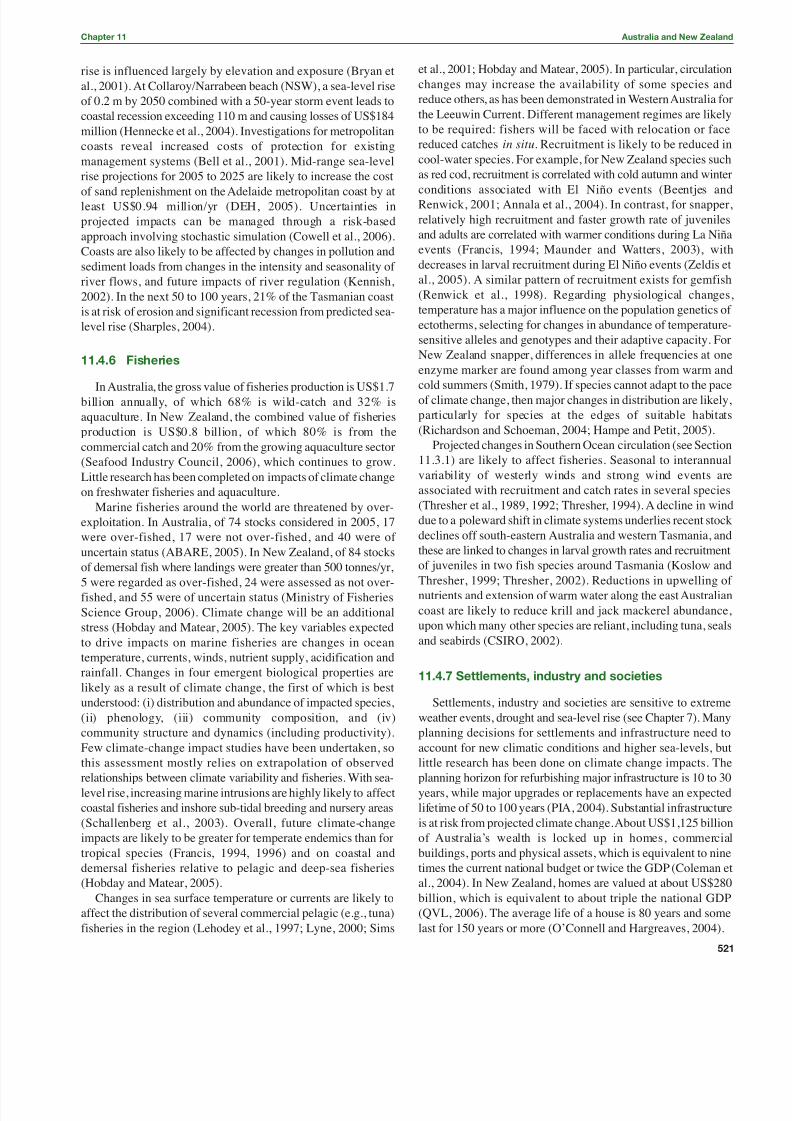
8/3/2019 Chapter 11 - Australia and New Zealand
http://slidepdf.com/reader/full/chapter-11-australia-and-new-zealand 15/34
Chapter 11 Australia and New Zealand
521
rise is influenced largely by elevation and exposure (Bryan et
al., 2001). At Collaroy/Narrabeen beach (NSW), a sea-level rise
of 0.2 m by 2050 combined with a 50-year storm event leads to
coastal recession exceeding 110 m and causing losses of US$184
million (Hennecke et al., 2004). Investigations for metropolitan
coasts reveal increased costs of protection for existing
management systems (Bell et al., 2001). Mid-range sea-level
rise projections for 2005 to 2025 are likely to increase the cost
of sand replenishment on the Adelaide metropolitan coast by atleast US$0.94 million/yr (DEH, 2005). Uncertainties in
projected impacts can be managed through a risk-based
approach involving stochastic simulation (Cowell et al., 2006).
Coasts are also likely to be affected by changes in pollution and
sediment loads from changes in the intensity and seasonality of
river flows, and future impacts of river regulation (Kennish,
2002). In the next 50 to 100 years, 21% of the Tasmanian coast
is at risk of erosion and significant recession from predicted sea-
level rise (Sharples, 2004).
11.4.6 Fisheries
In Australia, the gross value of fisheries production is US$1.7billion annually, of which 68% is wild-catch and 32% is
aquaculture. In New Zealand, the combined value of fisheries
production is US$0.8 billion, of which 80% is from the
commercial catch and 20% from the growing aquaculture sector
(Seafood Industry Council, 2006), which continues to grow.
Little research has been completed on impacts of climate change
on freshwater fisheries and aquaculture.
Marine fisheries around the world are threatened by over-
exploitation. In Australia, of 74 stocks considered in 2005, 17
were over-fished, 17 were not over-fished, and 40 were of
uncertain status (ABARE, 2005). In New Zealand, of 84 stocks
of demersal fish where landings were greater than 500 tonnes/yr,
5 were regarded as over-fished, 24 were assessed as not over-
fished, and 55 were of uncertain status (Ministry of Fisheries
Science Group, 2006). Climate change will be an additional
stress (Hobday and Matear, 2005). The key variables expected
to drive impacts on marine fisheries are changes in ocean
temperature, currents, winds, nutrient supply, acidification and
rainfall. Changes in four emergent biological properties are
likely as a result of climate change, the first of which is best
understood: (i) distribution and abundance of impacted species,
(ii) phenology, (iii) community composition, and (iv)
community structure and dynamics (including productivity).
Few climate-change impact studies have been undertaken, so
this assessment mostly relies on extrapolation of observedrelationships between climate variability and fisheries. With sea-
level rise, increasing marine intrusions are highly likely to affect
coastal fisheries and inshore sub-tidal breeding and nursery areas
(Schallenberg et al., 2003). Overall, future climate-change
impacts are likely to be greater for temperate endemics than for
tropical species (Francis, 1994, 1996) and on coastal and
demersal fisheries relative to pelagic and deep-sea fisheries
(Hobday and Matear, 2005).
Changes in sea surface temperature or currents are likely to
affect the distribution of several commercial pelagic (e.g., tuna)
fisheries in the region (Lehodey et al., 1997; Lyne, 2000; Sims
et al., 2001; Hobday and Matear, 2005). In particular, circulation
changes may increase the availability of some species and
reduce others, as has been demonstrated in Western Australia for
the Leeuwin Current. Different management regimes are likely
to be required: fishers will be faced with relocation or face
reduced catches in situ. Recruitment is likely to be reduced in
cool-water species. For example, for New Zealand species such
as red cod, recruitment is correlated with cold autumn and winter
conditions associated with El Niño events (Beentjes andRenwick, 2001; Annala et al., 2004). In contrast, for snapper
relatively high recruitment and faster growth rate of juveniles
and adults are correlated with warmer conditions during La Niña
events (Francis, 1994; Maunder and Watters, 2003), with
decreases in larval recruitment during El Niño events (Zeldis et
al., 2005). A similar pattern of recruitment exists for gemfish
(Renwick et al., 1998). Regarding physiological changes
temperature has a major influence on the population genetics of
ectotherms, selecting for changes in abundance of temperature-
sensitive alleles and genotypes and their adaptive capacity. For
New Zealand snapper, differences in allele frequencies at one
enzyme marker are found among year classes from warm and
cold summers (Smith, 1979). If species cannot adapt to the paceof climate change, then major changes in distribution are likely
particularly for species at the edges of suitable habitats
(Richardson and Schoeman, 2004; Hampe and Petit, 2005).
Projected changes in Southern Ocean circulation (see Section
11.3.1) are likely to affect fisheries. Seasonal to interannual
variability of westerly winds and strong wind events are
associated with recruitment and catch rates in several species
(Thresher et al., 1989, 1992; Thresher, 1994). A decline in wind
due to a poleward shift in climate systems underlies recent stock
declines off south-eastern Australia and western Tasmania, and
these are linked to changes in larval growth rates and recruitment
of juveniles in two fish species around Tasmania (Koslow and
Thresher, 1999; Thresher, 2002). Reductions in upwelling of
nutrients and extension of warm water along the east Australian
coast are likely to reduce krill and jack mackerel abundance
upon which many other species are reliant, including tuna, seals
and seabirds (CSIRO, 2002).
11.4.7 Settlements, industry and societies
Settlements, industry and societies are sensitive to extreme
weather events, drought and sea-level rise (see Chapter 7). Many
planning decisions for settlements and infrastructure need to
account for new climatic conditions and higher sea-levels, but
little research has been done on climate change impacts. Theplanning horizon for refurbishing major infrastructure is 10 to 30
years, while major upgrades or replacements have an expected
lifetime of 50 to 100 years (PIA, 2004). Substantial infrastructure
is at risk from projected climate change.About US$1,125 billion
of Australia’s wealth is locked up in homes, commercial
buildings, ports and physical assets, which is equivalent to nine
times the current national budget or twice the GDP (Coleman et
al., 2004). In New Zealand, homes are valued at about US$280
billion, which is equivalent to about triple the national GDP
(QVL, 2006). The average life of a house is 80 years and some
last for 150 years or more (O’Connell and Hargreaves, 2004).

8/3/2019 Chapter 11 - Australia and New Zealand
http://slidepdf.com/reader/full/chapter-11-australia-and-new-zealand 16/34
For infrastructure, design criteria for extreme events are very
likely to be exceeded more frequently. Increased damage is
likely for buildings (e.g., concrete joints, steel, asphalt,
protective cladding, sealants), transport structures (e.g., roads,
railways, ports, airports, bridges, tunnels), energy services (see
Section 11.4.10), telecommunications (e.g., cables, towers,
manholes), and water services (see Section 11.4.1) (PIA, 2004;
BRANZ, 2007; Holper et al., 2007). In Victoria, water
infrastructure is at significant risk for the B1 scenario by 2030,while power, telecommunications, transport and buildings are
all at significant risk for the A1FI emission scenario by 2030
(Holper et al., 2007).
Climate change is very likely to affect property values and
investment through disclosure of increased hazards and risk,
as well as affecting the price and availability of insurance. In
many Australian jurisdictions, flood hazard liability is not
mandatory, or is poorly quantified (Yeo, 2003). Governments
sometimes provide financial relief to the uninsured from large
natural disasters (Box 11.1) and such costs are likely to rise.
Insurance costs are very likely to rise in areas with increased
risk. Hail damage accounts for 50% of the 20 highest insurance
payouts in Australia (ICA, 2007), but there is limitedinformation about potential changes in hail frequency (see
Section 11.3).
Despite the economic significance of mining in Australia
(5% of GDP and 35% of export earnings; ABS, 2005c), there
is little information regarding climate change impacts on
mining. However, in northern Australia, projected increases in
extreme events, such as floods and cyclones, have the potential
to increase erosion, slow down re-vegetation, shift capping
materials and expose tailings in the area that includes Ranger
and Jabiluka mines. These impacts have not been adequately
considered in long-term mine planning (Wasson et al., 1988;
Parliament of Australia, 2003). The traditional owners, the
Mirrar, are concerned that these impacts may detrimentally
affect land between Madjinbardi Billabong and the East
Alligator River and the lowlands on the floodplain margins that
lie downstream from these mine sites (Kyle, 2006).
There are major implications for amenities, cultural heritage,
accessibility, and health of communities. These include costs,
injury and trauma due to increased storm intensity and higher
extreme temperatures, damage to items and landscapes of
cultural significance, degraded beaches due to sea-level rise
and larger storm surges, and higher insurance premiums (PIA,
2004). Increased demand for emergency services is likely. By
2100, costs of road maintenance in Australia are estimated to
rise 31% for the SRES A2 scenario in a CSIRO climatesimulation (Austroads, 2004).
Climate change may contribute to destabilising unregulated
population movements in the Asia-Pacific region, providing an
additional challenge to national security (Dupont and Pearman,
2006; Preston et al., 2006). Population growth and a one-metre
rise in sea-level are likely to affect 200-450 million people in
the Asia-Pacific region (Mimura, 2006). An increase in
migrations from the Asia-Pacific region to surrounding nations
such as New Zealand and Australia is possible (Woodward et
al., 2001). Displacement of Torres Strait Islanders to mainland
Australia is also likely (Green, 2006b).
11.4.8 Indigenous people
Indigenous people comprise about 15% of the New Zealand
population (Statistics New Zealand, 2005a) and 2.4% of the
Australian population (including about 30% of the Northern
Territory population) (ABS, 2002).
Changes in New Zealand’s climate over the next 50 to 100
years are likely to challenge the Māori economy and influence the
social and cultural landscapes of Māori people (Packman et al.,2001). Some Māori have significant investment in fishing,
agriculture and forestry and the downstream activities of
processing and marketing (NZIER, 2003), as well as being
important stakeholders in New Zealand’s growing tourist industry
(McIntosh, 2004) and in the energy sector. Economic performance
and opportunities in these primary industries are likely to be
influenced by climate-induced changes to production rates,
product quality, pest and disease prevalence, drought, fire-risk and
biodiversity, which, in turn, will affect the ability to raise
development capital in these industries (MAF, 2001; Cottrell et
al., 2004). While the majority of Māori live in urban
environments, they also occupy remote and rural areas where the
economy and social and cultural systems are strongly tied tonatural environmental systems (e.g., traditional resource use,
tourism), and where vital infrastructure and services are
vulnerable to extreme weather events (e.g., flooding, landslides)
(Harmsworth and Raynor, 2005). The capacity of the Māori
people to plan and respond to threats of climate change to their
assets (i.e., buildings, farms, forests, native forest, coastal
resources, businesses) varies greatly, and is likely to be limited by
access to funds, information and human capital, especially in
Northland and on the East Coast, where there are large populations
of Māori (TPK, 2001) and increased risks of extreme weather are
likely (Mullan et al., 2001). Other pressures include the unclear
role of local authorities with regard to rules, regulations and
strategies for adaptation; multiple land-ownership and decision-
making processes can be complex, often making it difficult to
reach consensus and implement costly or non-traditional
adaptation measures; and the high spiritual and cultural value
placed on traditional lands/resources that can restrict or rule out
some adaptation options such as relocation (NZIER, 2003). Many
rural Māori also rely on the use of public and private land and
coastal areas for hunting and fishing to supplement household
food supplies, recreation, and the collection of firewood and
cultural resources. The distribution and abundance of culturally
important flora and fauna is likely to be adversely influenced by
climate change, so the nature of such activities and the values
associated with these resources are likely to be adversely affected,including spiritual well-being and cultural affirmation (NIWA,
2006). These challenges compound the sensitivity of the Māori to
climate change.
Indigenous communities in remote areas of Australia often
have inadequate infrastructure, health services and employment
(Braaf, 1999; Ring and Brown, 2002; IGWG, 2004; Arthur and
Morphy, 2005). Consequently, many of these communities show
features of social and economic disadvantage (Altman, 2000;
ABS, 2005b). Existing social disadvantage reduces coping ability
and may restrict adaptive capacity (Woodward et al., 1998; Braaf,
1999), affecting these communities’ resilience to climate hazards
Australia and New Zealand Chapt
522

8/3/2019 Chapter 11 - Australia and New Zealand
http://slidepdf.com/reader/full/chapter-11-australia-and-new-zealand 17/34
Chapter 11 Australia and New Zealand
523
(Watson and McMichael, 2001; Ellemor, 2005). Many of these
communities strongly connect the health of their ‘country’to their
cultural, mental and physical well-being (Smith, 2004a; Jackson,
2005). Direct biophysical impacts, such as increases in
temperature, rainfall extremes or sea-level rise, are likely to have
significant indirect impacts on the social and cultural cohesion
of these communities. There is recent recognition of the untapped
resource of Indigenous knowledge about past climate change
(Rose, 1996; Lewis, 2002; Orlove, 2003) which could be used toinform adaptation options. However, the oral tradition of
recording this knowledge has, until recently, largely hindered
non-Indigenous scientists from using this expertise to inform
their science (Webb, 1997; Hill, 2004). Climate-change impacts
identified for remote Indigenous communities include increases
in the number of days of extreme heat, which may affect disease
vectors, reproduction and survival of infectious pathogens, and
heat stress (Green, 2006a; McMichael et al., 2006); extreme
rainfall events and flooding, causing infrastructure damage
(Green and Preston, 2006); salt inundation of freshwater aquifers
and changes in mangrove ecology (UNEP-WCMC, 2006);
changing fire regimes; sea-level rise and coastal erosion (Bessen
Consulting Services, 2005; Green and Preston, 2006). King tides1
in 2005 and 2006 in the Torres Strait have highlighted the need
to revisit short-term coastal protection and long-term relocation
plans for up to 2,000 Australians living on the central coral cays
and north-west islands (Mulrennan, 1992; Green, 2006b).
11.4.9 Tourism and recreation
Tourism contributes 4.5% of Australian GDP and represents
11.2% of exports (Allen Consulting Group, 2005), and even more
in New Zealand (about 5% of GDP and 16% of exports). The main
tourism centres are the Gold Coast and tropical north Queensland
in Australia, and Queenstown and Rotorua in New Zealand. Most
tourism and recreation in Australia and New Zealand rely on
resources of the natural environment. In Australia’s Wet Tropics,
the value of ecosystem goods and services, including tourism, is
about US$132 to 148 million/yr (Curtis, 2004).
Few regional studies have assessed potential impacts on
tourism, but elsewhere there is evidence that climate change has
direct impacts (Agnew and Palutikof, 2001; Maddison, 2001).
Some tourist destinations may benefit from drier and warmer
conditions, e.g., for beach activities, viewing wildlife and
geothermal activity, trekking, camping, climbing, wine tasting and
fishing. However, greater risks to tourism are likely from increases
in hazards such as flooding, storm surges, heatwaves, cyclones,
fires and droughts (World Tourism Organisation, 2003; Scott etal., 2004; Becken, 2005; Hall and Higham, 2005; Becken and
Hay, 2007). These adversely affect transport, personal safety,
communication, water availability and natural attractions such as
coral reefs, beaches, freshwater wetlands, snow, glaciers and
forests. Changes in species distribution and ecosystems in
National Parks (see Section 11.4.2) are likely to alter their tourism
appeal. Tropical Australian destinations are particularly vulnerable
to climate impacts (Allen Consulting Group, 2005). Queensland
tourism is likely to be negatively affected by more intense tropical
cyclones and by degradation of the Great Barrier Reef (see Section
11.6) and beaches (PIA, 2004).
Skiing attracts many tourists to New Zealand and south-eastern
Australia. For the full range of SRES scenarios, by 2020 in south-
east Australia, there are likely to be 5 to 40 fewer days of snow
cover per year, a rise in the snowline of 30 to 165 m, and a
reduction in the total snow-covered area of 10 to 40% (Hennessy
et al., 2003). By 2050, the duration of snow cover reduces by 15
to 100 days, the maximum snow depth reduces by 10 to 99%, thesnowline rises 60 to 570 m and the total area of snow cover shrinks
by 20 to 85%. Similarly, in New Zealand, changes in seasonal
snow cover are likely to have a significant impact on the ski
industry. The snow line is likely to rise by 120 to 270 m based on
scenarios for the 2080s (Fitzharris, 2004). Tourist flows from
Australia to New Zealand might grow as a result of the relatively
poorer snow conditions in Australia. Numerical modelling of the
Franz Josef glacier reveals that temperature is the dominant contro
on glacier length for New Zealand’s maritime glaciers (Anderson
and Mackintosh, 2006). Noticeable shrinkage and retreat is very
likely for even small temperature increases (Anderson, 2004;
Anderson et al., 2006), and is likely to reduce visitor flows through
tourism-dependent towns such as Fox and Franz Josef.
11.4.10 Energy
Energy consumption is projected to grow due to demographic
and socio-economic factors (see Section 11.3.2). However, average
and peak energy demands are also linked to climatic conditions
Increases in peak energy demand due to increased air-conditioner
use are likely to exceed increases for base load. The risk of line
outages and blackouts is likely to increase (PB Associates, 2007)
More peak generating capacity is likely to be needed beyond that
for underlying economic growth (Howden and Crimp, 2001). For
a 2°C warming, peak demand increases 4% in Brisbane and 10%
inAdelaide, but decreases 1% in Melbourne and Sydney (Howden
and Crimp, 2001). About 10% of the existing asset levels may be
required to allow for climate-related increases in peak demand by
2030 (PB Associates, 2007). However, annual total demand may
be less sensitive to warming; a likely reduction in winter heating
demand counteracts the increasing summer demand, e.g., New
Zealand electricity demand decreases by 3%/°C increase in mean
winter temperature (Salinger, 1990).
Climate change is likely to affect energy infrastructure in
Australia and New Zealand through impacts of severe weather
events on wind power stations, electricity transmission and
distribution networks, oil and gas product storage and transport
facilities, and off-shore oil and gas production (see Chapter 7).There are also likely to be costs and damages that can be avoided
by adaptation and mitigation (see Section 18.4).An assessment of
potential risks for Australia (PB Associates, 2007) found (i)
increased peak and average temperatures are likely to reduce
electricity generation efficiency, transmission line capacity
transformer capacity and the life of switchgear and other
components; (ii) if climate changes gradually, both the generation
utilities and the equipment manufacturers are likely to have enough
time to adjust their standards and specifications; and (iii)
1 King tide: any high tide well above average height.
8/3/2019 Chapter 11 - Australia and New Zealand
http://slidepdf.com/reader/full/chapter-11-australia-and-new-zealand 18/34
vulnerability to the above impacts is low, but there is medium
vulnerability to a decline in water supply for large-scale coal, hydro
and gas turbine power generation.
In New Zealand, increased westerly wind speed is very likely to
enhance wind generation and spill-over precipitation into major
South Island hydro catchments, and to increase winter rain in the
Waikato catchment (Wratt et al., 2004). Warming is virtually
certain to increase snow melt, the ratio of rainfall to snowfall, and
river flows in winter and early spring. This is very likely to assisthydroelectric generation at the time of highest energy demand for
heating.
11.4.11 Human health
One of the most significant health impacts of climate change is
likely to be an increase in heat-related deaths. Assuming no
planned adaptation, the number of deaths is likely to rise from
1,115/yr at present in Adelaide, Melbourne, Perth, Sydney and
Brisbane to 2,300 to 2,500/yr by 2020, and 4,300 to 6,300/yr by
2050, for all SRES scenarios, including demographic change
(McMichael et al., 2003). In Auckland and Christchurch, a total of
14 heat-related deaths occur per year in people aged over 65, butthis is likely to rise to 28, 51 and 88 deaths for warmings of 1, 2
and 3°C, respectively (McMichael et al., 2003). Demographic
change is likely to amplify these figures. By 2100, the Australian
annual death rate in people aged over 65 is estimated to increase
from a 1999 baseline of 82 per 100,000 to 131-246 per 100,000,
for the SRES B2 and A2 scenarios and the 450 ppm stabilisation
scenario (Woodruff et al., 2005). Australian temperate cities are
likely to experience higher heat-related deaths than tropical cities,
and the winter peak in deaths is likely to be overtaken by heat-
related deaths in nearly all cities by 2050 (McMichael et al.,
2003). In New Zealand, the winter peak in deaths is likely to
decline.
There are likely to be alterations in the geographical range and
seasonality of some mosquito-borne infectious diseases. Fewer but
heavier rainfall events are likely to affect mosquito breeding and
increase the variability in annual rates of Ross River disease,
particularly in temperate and semi-arid areas (Woodruff et al.,
2002, 2006). The risk of establishment of dengue fever is likely to
increase through changes in climate and population sensitivity in
both tropical and temperate latitudes (Sutherst, 2004). Dengue is a
substantial threat in Australia: the climate of the far north already
supports Aedes aegypti (the major mosquito vector of the dengue
virus); and outbreaks of dengue have occurred with increasing
frequency and magnitude in far-northern Australia over the past
decade. Projected climate changes in north-eastern Australia,combined with population growth, are likely to increase the
average annual number of people living in areas suitable for
supporting the dengue vector (an additional 0.1 to 0.3 million
exposed in 2020, and 0.6 to 1.4 million in 2050) (McMichael et
al., 2003). Malaria is unlikely to become established unless there
is a dramatic deterioration in the public health response
(McMichael et al., 2003). In New Zealand, parts of the North
Island are likely to become suitable for breeding of the major
dengue vector, while much of the country becomes receptive to
other less-efficient vector species (De Wet et al., 2001; Woodward
et al., 2001). The risk of dengue in New Zealand is likely to remain
below the threshold for local transmission beyond 2050
(McMichael et al., 2003).
Warmer temperatures and increased rainfall variability are
likely to increase the intensity and frequency of food-borne
(D’Souza et al., 2004) and water-borne (Hall et al., 2002) diseases
in both countries. Indigenous people living in remote communities
are likely to be at increased risk due to their particular living
conditions and poor access to services. The annual number of
diarrhoeal hospital admissions among Aboriginal children livingin central Australia is likely to increase 10% by 2050, assuming no
change in current health standards (McMichael et al., 2003). The
relationship between drought, suicide and severe mental health
impacts in rural communities (Nicholls et al., 2006) suggests that
parts of Australia are likely to experience increased mental health
risks in future. Impacts on aeroallergens and photochemical smog
in cities remain uncertain. High concentrations of bushfire smoke
play a role in increasing hospital presentations of asthma
(Johnston et al., 2002), so projected increases in fire risk may lead
to more asthma.
11.4.12 Synthesis
Climate change adds new dimensions to the challenges already
facing communities, businesses, governments and individuals.
Assessment of the information given in this section leads to the
conclusion that climate change is likely to give rise to six key risks
in specific sectors (Table 11.7): natural systems, water security,
coastal communities, agriculture and forestry, major infrastructure
and health. Some extreme events can trigger multiple and
simultaneous impacts across systems, e.g., heatwaves leading to
heat-related deaths, fires, smoke pollution, respiratory illness,
blackouts, and buckling of railways. There are also four key
benefits for particular sectors: (i) in New Zealand, initial benefits
to agriculture and forestry are projected in western and southern
areas and close to major rivers due to a longer growing season,
less frost and increased rainfall; (ii) reduced energy demand is
very likely in winter; (iii) tourism is likely to directly benefit from
drier and warmer weather in some areas; and (iv) flows in New
Zealand’s larger mountain-fed rivers are likely to increase,
benefiting hydroelectricity generation and irrigation supply.
Adaptation can alleviate or delay vulnerability in some sectors,
as well as allowing benefits to accrue more rapidly (see Section
11.5).
11.5 Adaptation constraintsand opportunities
Planned adaptation can greatly reduce vulnerability (see
examples in Chapter 17). Since the TAR, Australia and New
Zealand have taken notable steps in building adaptive capacity
(see Section 11.2.5) by increasing support for research and
knowledge, expanding assessments for decision makers of the
risks of climate change, infusing climate change into policies
and plans, promoting awareness, and better dealing with climate
issues. However, there remain formidable environmental,
Australia and New Zealand Chapt
524

8/3/2019 Chapter 11 - Australia and New Zealand
http://slidepdf.com/reader/full/chapter-11-australia-and-new-zealand 19/34
Chapter 11 Australia and New Zealand
525
economic, informational, social, attitudinal and political barriers
to the implementation of adaptation.
For many natural ecosystems, impacts have limited
reversibility. Planned adaptation opportunities for offsetting
potentially deleterious impacts are often limited due to fixed
habitat regions (e.g., the Wet Tropics and upland rainforests in
Australia and the alpine zone in both Australia and New
Zealand). One adaptive strategy is to provide corridors to
facilitate migration of species under future warming. This will
require changes in land tenure in many regions, with significant
economic costs, although schemes to promote such connectivity
are already under way in some Australian states (see Section
11.2.5). Another strategy is translocation of species. This is a
very expensive measure, but it may be considered desirable for
some iconic, charismatic or particularly vulnerable species.
For water, planned adaptation opportunities lie in the
inclusion of risks due to climate change on both the demand and
supply side (Allen Consulting Group, 2005; Table 11.2). In
urban catchments, better use of storm and recycled water can
augment supply, although existing institutional arrangements
and technical systems for water distribution constrain
implementation. Moreover, there is community resistance to the
use of recycled water for human consumption (e.g., in such citiesas Toowoomba in Queensland and Goulburn in NSW).
Desalination schemes are being considered in some Australian
capital cities. Installation of rainwater tanks is another adaptation
response and is now actively pursued through incentive policies
and rebates. For rural activities, more flexible arrangements for
allocation are required, via the expansion of water markets,
where trading can increase water-use efficiency (Beare and
Heaney, 2002). Existing attitudes toward water pricing and
difficulties with structural adjustment are significant barriers.
For agriculture, there are opportunities for planned adaptation
via improvements in crop varieties (Figure 11.2), rotations, farm
technology, farm practices and land-use mix. Cropping can be
extended to historically wetter regions. Implementation will
require new investment and significant managerial changes
(Howden et al., 2003a). Farmers in eastern New Zealand are
engaging in local discussion of risks posed by future climate
change and how to enhance adaptation options (Kenny, 2005).
They stress the need for support and education for ‘bottom-up
adaptation (Kenny, 2007). Farming of marginal land at the drier
fringe is likely to be increasingly challenging, especially in those
regions of both countries with prospective declines in rainfall.
In coastal areas, there is solid progress in risk assessments
and in fashioning policies and plans at the local and regional
level in New Zealand. However, there remain significant
challenges to achieving concrete actions that reduce risks
Consistent implementation of adaptation measures (e.g., setback
lines, planned retreat, dune management (Dahm et al., 2005)
building designs, prohibition of new structures and siting
requirements that account for sea-level rise) has been difficult
Differences in political commitment, lack of strong and clear
guidelines from government, and legal challenges by property
owners are major constraints (MfE, 2003).
Considering all sectors, four broad barriers to adaptation
are evident.1. A lack of methods for integrated assessment of impacts and
adaptation that can be applied on an area-wide basis. While
sector-specific knowledge and tools have steadily
progressed, the vulnerability of water resources, coasts
agriculture and ecosystems of local areas and regions are
interconnected and need to be assessed accordingly (see
Section 11.8).
2. Lack of well-developed evaluation tools for assessing
planned adaptation options, such as benefit-cost analysis
incorporating climate change and adapted for local and
regional application.
System Impacts Identified hotspots
Naturalsystems
Damage to coral reefs, coasts, rainforests, wetlands and alpine areas. Increaseddisturbance, loss of biodiversity including possible extinctions, changed speciesranges and interactions, loss of ecosystem services (e.g., for tourism and water).Potentially catastrophic for some systems (e.g., reefs may be dominated bymacroalgae by 2050, extinctions of endemic vertebrates in Queensland Wet
Tropics). Shrinking glaciers create slope instability.
Aus: Great Barrier Reef, Kakadu, eastQueensland, alpine zones, Murray-DarlingBasin (MDB) and south-western Aus;NZ: Southern Alps and their National Parks,eastern lowlands
Watersecurity
Reduction in water supply for irrigation, cities, industry and riverine environment inthose areas where streamflow declines, e.g., in the Murray-Darling Basin, annualmean flow may drop 10 to 25% by 2050 and 16 to 48% by 2100.
Southern and eastern Aus; Northland andparts of eastern lowlands of NZ
Coastalcommunities
Greater coastal inundation and erosion, especially in regions exposed to cyclonesand storm surges. Coastal development is exacerbating the climate risks.
Tropical and south-east Queensland (Aus)and from Bay of Plenty to Northland in NZ
Agricultureand forestry
Reduced crop, pastoral and rangeland production over much of southern andeastern Australia and parts of eastern New Zealand. Reduced grain and grapequality. A southward shift of pests and disease vectors. Increased fire risk for forests.
Southern and eastern Aus and eastern NZ
Majorinfrastructure
Design criteria for extreme climatic events, floods and storm surges very likely to beexceeded more frequently. Increased damage likely for buildings, transportstructures, telecommunications, energy services and water services.
Large cities, floodplains ofmajor rivers, coastal communities,north-eastern parts of both countries
Health By 2050, 3,200 to 5200 more heat-related deaths/yr, and 0.6 to 1.4 million more
people exposed to dengue fever.
Large cities of both countries
Table 11.7. Six key risks in Australia (Aus) and New Zealand (NZ) (assuming no new adaptation). Underlying climate projections (see Section 11.3)
include higher temperatures, sea-level rise, heavier rainfall, greater fire risk, less snow cover, reduced runoff over southern and eastern Australia and in
the smaller lowland rivers of eastern New Zealand, more intense tropical cyclones and larger storm surges.

8/3/2019 Chapter 11 - Australia and New Zealand
http://slidepdf.com/reader/full/chapter-11-australia-and-new-zealand 20/34
Australia and New Zealand Chapt
526
3. Ongoing scepticism about climate change science,
uncertainty in regional climate change projections, and a
lack of knowledge about how to promote adaptation. This
is despite 87% of Australians being more concerned about
climate change impacts than terrorism (Lowy Institute,
2006). Application of risk-based approaches to adaptation
(e.g., upgrading urban storm-water infrastructure design;
Shaw et al., 2005) demonstrate how developments can be
‘climate-proofed’ (ADB, 2005). While a risk-basedmethod for planned adaptation has been published for
Australia (AGO, 2006), there are few examples of where
it has been applied.
4. Weak linkages between the various strata of government,
from national to local, regarding adaptation policy, plans
and requirements. Stronger guidance and support are
required from state (in Australia) and central government
(in New Zealand) to underpin efforts to promote
adaptation locally. For example, the New Zealand Coastal
Policy Statement recommends that regional councils
should take account of future sea-level rise. But there is a
lack of guidance as to how this should be accomplished
and little support for building capacity to undertake the
necessary actions. As a consequence, regional and local
responses have been limited, variable and inconsistent.
11.6 Case studies
The following case studies (Boxes 11.2 to 11.4) illustrate regions
where climate change has already occurred, impacts are evident
and planned adaptation is being considered or implemented.
Box 11.2. Adaptation of water supplies in cities
In capital cities such as Perth, Brisbane, Sydney, Melbourne, Adelaide, Canberra and Auckland, concern about population
pressures and the impact of climate change is leading water planners to implement a range of adaptation options (Table 11.2).
For example, the winter rainfall-dominated region of south-west Western Australia has experienced a substantial decline in May
to July rainfall since the mid-20th century. The effects of the decline on natural runoff have been severe, as evidenced by a
50% drop in annual inflows to reservoirs supplying the city of Perth (Figure 11.3). Similar pressures have been imposed on
groundwater resources and wetlands. This has been accompanied by a 20% increase in domestic usage in 20 years, and a
population growth of 1.7%/yr (IOCI, 2002). Climate simulations indicate that at least some of the observed drying is due to the
enhanced greenhouse effect (IOCI, 2002). To ensure water security, a US$350 million programme of investment in water source
development was undertaken by the WA Water Corporation (WA Water Corporation, 2004) from 1993 to 2003. In 2004, the
continuation of low streamflow led to the decision to construct a seawater desalination plant, which will provide 45 Gl of water
each year, at a cost of US$271 million. Energy requirements (24 MW) will be met by 48 wind turbines.
Figure 11.3. Annual inflow to Perth Water Supply System from 1911 to 2005. Horizontal lines show averages.
Source: www.watercorporation.com.au/D/dams_streamflow.cfm. Courtesy of the Water Corporation of Western Australia.

8/3/2019 Chapter 11 - Australia and New Zealand
http://slidepdf.com/reader/full/chapter-11-australia-and-new-zealand 21/34
Chapter 11 Australia and New Zealand
527
Box 11.3. Climate change and the Great Barrier Reef
The Great Barrier Reef (GBR) is the world’s largest continuous reef system (2,100 km long) and is a critical storehouse of
Australian marine biodiversity and a breeding ground for seabirds and other marine vertebrates such as the humpback whale.
Tourism associated with the GBR generated over US$4.48 billion in the 12-month period 2004/5 and provided employment
for about 63,000 full-time equivalent persons (Access Economics, 2005). The two greatest threats from climate change to the
GBR are (i) rising sea temperatures, which are almost certain to increase the frequency and intensity of mass coral bleaching
events, and (ii) ocean acidification, which is likely to reduce the calcifying ability of key organisms such as corals. Other factors,such as droughts and more intense storms, are likely to influence reefs through physical damage and extended flood plumes
(Puotinen, 2006).
Sea temperatures on the GBR have warmed by about 0.4°C over the past century (Lough, 2000). Temperatures currently
typical of the northern tip of the GBR are very likely to extend to its southern end by 2040 to 2050 (SRES scenarios A1, A2)
and 2070 to 2090 (SRES scenarios B1, B2) (Done et al., 2003). Temperatures only 1°C above the long-term summer maxima
already cause mass coral bleaching (loss of symbiotic algae). Corals may recover but will die under high or prolonged
temperatures (2 to 3°C above long-term maxima for at least 4 weeks). The GBR has experienced eight mass bleaching events
since 1979 (1980, 1982, 1987, 1992, 1994, 1998, 2002 and 2006); there are no records of events prior to 1979 (Hoegh-
Guldberg, 1999). The most widespread and intense events occurred in the summers of 1998 and 2002, with about 42% and
54% of reefs affected, respectively (Done et al., 2003; Berkelmans et al., 2004). Mortality was distributed patchily, with the
greatest effects on near-shore reefs, possibly exacerbated by osmotic stress caused by floodwaters in some areas (Berkelmans
and Oliver, 1999). The 2002 event was followed by localised outbreaks of coral disease, with incidence of some disease-likesyndromes increasing by as much as 500% over the past decade at a few sites (Willis et al., 2004). While the impacts of coral
disease on the GBR are currently minor, experiences in other parts of the world suggest that disease has the potential to be
a threat to GBR reefs. Effects from thermal stress are likely to be exacerbated under future scenarios by the gradual acidification
of the world’s oceans, which have absorbed about 30% excess CO2 released to the atmosphere (Orr et al., 2005; Raven et
al., 2005). Calcification declines with decreasing carbonate ion concentrations, becoming zero at carbonate ion concentrations
of approximately 200 µmol/kg (Langdon et al., 2000; Langdon, 2002). These occur at atmospheric CO 2 concentrations of
approximately 500 ppm. Reduced growth due to acidic conditions is very likely to hinder reef recovery after bleaching events
and will reduce the resilience of reefs to other stressors (e.g., sediment, eutrophication).
Even under a moderate warming scenario (A1T, 2°C by 2100), corals on the GBR are very likely to be exposed to regular
summer temperatures that exceed the thermal thresholds observed over the past 20 years (Done et al., 2003). Annual bleaching
is projected under the A1FI scenario by 2030, and under A1T by 2050 (Done et al., 2003; Wooldridge et al., 2005). Given that
the recovery time from a severe bleaching-induced mortality event is at least 10 years (and may exceed 50 years for full
recovery), these models suggest that reefs are likely to be dominated by non-coral organisms such as macroalgae by 2050
(Hoegh-Guldberg, 1999; Done et al., 2003). Substantial impacts on biodiversity, fishing and tourism are likely. Maintenance of
hard coral cover on the GBR will require corals to increase their upper thermal tolerance limits at the same pace as the change
in sea temperatures driven by climate change, i.e. about 0.1-0.5°C/decade (Donner et al., 2005). There is currently little evidence
that corals have the capacity for such rapid genetic change; most of the evidence is to the contrary (Hoegh-Guldberg, 1999,
2004). Given that recovery from mortality can be potentially enhanced by reducing local stresses (water quality, fishing
pressure), management initiatives such as the Reef Water Quality Protection Plan and the Representative Areas Programme
(which expanded totally protected areas on the GBR from 4.6% to over 33%) represent adaptation options to enhance the
ability of coral reefs to endure the rising pressure from rapid climate change.
8/3/2019 Chapter 11 - Australia and New Zealand
http://slidepdf.com/reader/full/chapter-11-australia-and-new-zealand 22/34
Australia and New Zealand Chapt
528
11.7 Conclusions: implications for
sustainable development
An assessment of aggregate vulnerability for key sectors of
the region is given in Figure 11.4, as a function of potential
global warming. It synthesises relevant information in Sections
11.2 to 11.5 about current sensitivity, coping ranges, potential
impacts, adaptive capacity and vulnerability. It follows similar
diagrams and concepts published elsewhere (Jones et al., 2007)
and emulates the ‘Reasons for Concern’ diagram (Figure SPM-
3) in the TAR Synthesis Report. Since most impact assessments
in the available literature do not allow for adaptation, the yellow
band in Figure 11.4 is indicative only. In line with Chapter 19,
vulnerability is assessed using criteria of: magnitude of impact,
timing, persistence and reversibility, likelihood and confidence,
potential for planned adaptation, geographical distribution andimportance of the vulnerable system. Ecosystems, water security
and coastal communities of the region have a narrow coping
range. Even if adaptive capacity is realised, vulnerability
becomes significant for 1.5 to 2.0°C of global warming. Energy
security, health (heat-related deaths), agriculture and tourism
have larger coping ranges and adaptive capacity, but they
become vulnerable if global warming exceeds 3.0°C. The three
key vulnerability factors identified in Article 2 of the United
Nations Framework Convention on Climate Change (UNFCCC)
– natural ecosystems, sustainable development and food security
– are also shown in Figure 11.4.
When these climate change impacts are combined with other
non-climate trends (see Section 11.3.2), there are some serious
implications for sustainability in both Australia and New
Zealand. Climate change is very likely to threaten natural
ecosystems, with extinction of some species. There are limited
planned adaptation options, but the resilience of many
ecosystems can be enhanced by reducing non-climatic stresses
such as water pollution, habitat fragmentation and invasive
species. In river catchments, where increasing urban and rural
water demand has already exceeded sustainable levels of supply,
ongoing and proposed adaptation strategies (see Section 11.2.5)
are likely to buy some time. Continued rates of coastal
development are likely to require tighter planning and regulation
if they are to remain sustainable. Climate change is very likely
to increase peak energy demand during heatwaves, posing
challenges for sustainable energy supply. A substantial public
health and community response is likely to be needed in order toavoid an increase of several thousand heat-related deaths per
year.
Large shifts in the geographical distribution of agriculture and
its services are very likely. Farming of marginal land in drier
regions is likely to become unsustainable due to water shortages,
new biosecurity hazards, environmental degradation and social
disruption. In areas that are likely to become wetter and less
frosty, it may be possible to grow new crops or those displaced
from other regions. Adaptation has the capacity to capture these
benefits; they are unlikely to accrue without investment in the
adaptation process. Food security is very likely to remain robust,
Box 11.4. Climate change adaptation in coastal areas
Australia and New Zealand have very long coastlines with ongoing development and large and rapidly growing populations in
the coastal zone. This situation is placing intense pressure on land and water resources and is increasing vulnerability to
climatic variations, including storm surges, droughts and floods. A major challenge facing both countries is how to adapt to
changes in climate, reduce vulnerability, and yet achieve sustainable development. Two examples illustrate this challenge.
Bay of Plenty, North Island, New Zealand. This bay is characterised by a narrow coastal zone with two of the fastest-growingdistricts of New Zealand. Combined population growth was 13.4% over the period 1996 to 2001, centred on the cities of
Tauranga and Whakatane. By 2050, the population is projected to increase 2 to 3 times. Beachfront locations demand the
highest premiums on the property market, but face the highest risks from storm surge flooding and erosion. Substantial efforts
have been made to reduce the risks. For the purpose of delineation of hazard zones and design of adaptation measures, the
Environment Bay of Plenty regional council explicitly included IPCC projections of sea-level rise in its Regional Coastal
Environment Plan. This identified ‘areas sensitive to coastal hazards within the next 100 years’. Implementation of such policy
and plans by local government authorities has been repeatedly challenged by property developers, commercial interests and
individual homeowners with different interpretations of the risks.
Sunshine Coast and Wide Bay-Burnett, Queensland, Australia. Between 2001 and 2021, the Sunshine Coast population
is projected to grow from 277,987 to 479,806 (QDLGP, 2003), and the Wide Bay-Burnett population is projected to grow from
236,500 to 333,900 (ABS, 2003b). Sandy beaches and dunes are key biophysical characteristics of this coastline, including
Fraser Island which is the largest sand island in the world. These natural features and the human populations they attract arevulnerable to sea-level rise, flooding, storm surges and tropical cyclones. Many estuaries and adjacent lowlands have been
intensively developed, some as high-value canal estates. Local government is clearly becoming aware of climate-change
risks. This topic is included in the agenda of the Sea-Change Taskforce, made up of coastal councils throughout Australia. At
the regional planning level, climate change was recently embedded at a policy level into the strategic planning processes for
the Wide Bay-Burnett region.
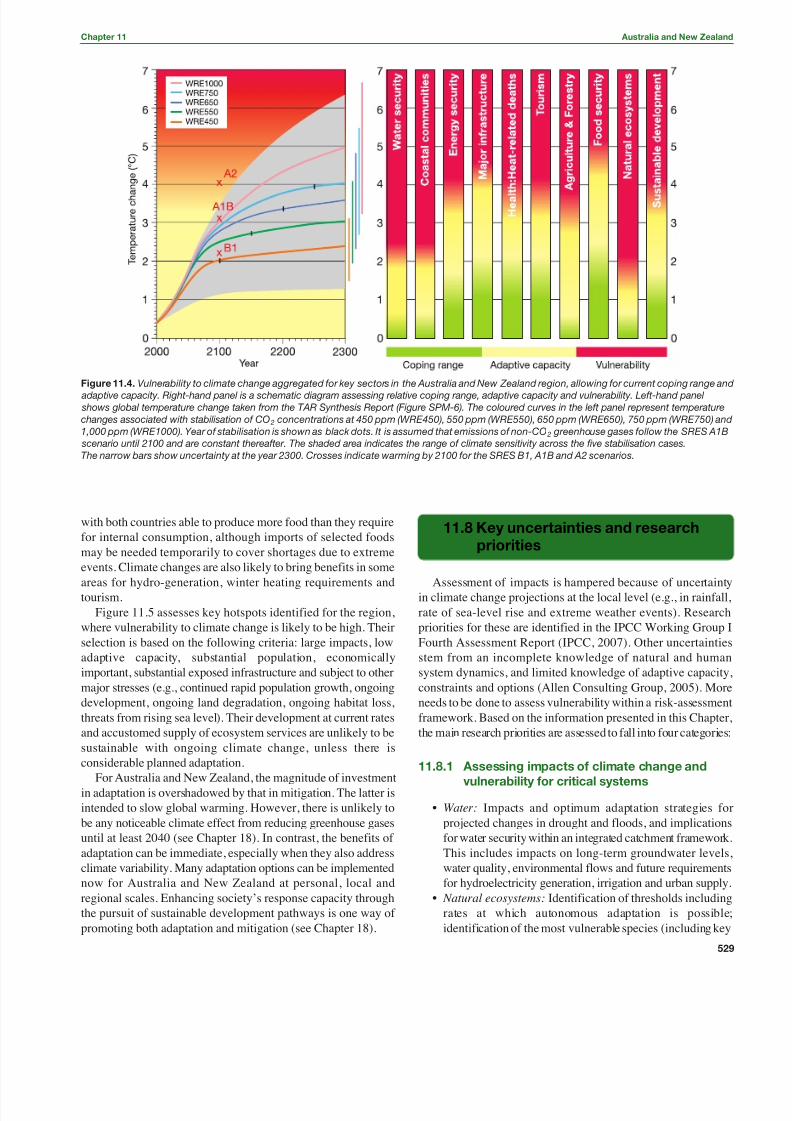
8/3/2019 Chapter 11 - Australia and New Zealand
http://slidepdf.com/reader/full/chapter-11-australia-and-new-zealand 23/34
Chapter 11 Australia and New Zealand
529
with both countries able to produce more food than they require
for internal consumption, although imports of selected foods
may be needed temporarily to cover shortages due to extreme
events. Climate changes are also likely to bring benefits in some
areas for hydro-generation, winter heating requirements and
tourism.
Figure 11.5 assesses key hotspots identified for the region,
where vulnerability to climate change is likely to be high. Their
selection is based on the following criteria: large impacts, low
adaptive capacity, substantial population, economically
important, substantial exposed infrastructure and subject to other
major stresses (e.g., continued rapid population growth, ongoing
development, ongoing land degradation, ongoing habitat loss,
threats from rising sea level). Their development at current rates
and accustomed supply of ecosystem services are unlikely to be
sustainable with ongoing climate change, unless there is
considerable planned adaptation.For Australia and New Zealand, the magnitude of investment
in adaptation is overshadowed by that in mitigation. The latter is
intended to slow global warming. However, there is unlikely to
be any noticeable climate effect from reducing greenhouse gases
until at least 2040 (see Chapter 18). In contrast, the benefits of
adaptation can be immediate, especially when they also address
climate variability. Many adaptation options can be implemented
now for Australia and New Zealand at personal, local and
regional scales. Enhancing society’s response capacity through
the pursuit of sustainable development pathways is one way of
promoting both adaptation and mitigation (see Chapter 18).
11.8 Key uncertainties and researchpriorities
Assessment of impacts is hampered because of uncertainty
in climate change projections at the local level (e.g., in rainfall
rate of sea-level rise and extreme weather events). Research
priorities for these are identified in the IPCC Working Group I
Fourth Assessment Report (IPCC, 2007). Other uncertainties
stem from an incomplete knowledge of natural and human
system dynamics, and limited knowledge of adaptive capacity
constraints and options (Allen Consulting Group, 2005). More
needs to be done to assess vulnerability within a risk-assessment
framework. Based on the information presented in this Chapter
the main research priorities are assessed to fall into four categories
11.8.1 Assessing impacts of climate change andvulnerability for critical systems
• Water: Impacts and optimum adaptation strategies for
projected changes in drought and floods, and implications
for water security within an integrated catchment framework
This includes impacts on long-term groundwater levels
water quality, environmental flows and future requirements
for hydroelectricity generation, irrigation and urban supply
• Natural ecosystems: Identification of thresholds including
rates at which autonomous adaptation is possible
identification of the most vulnerable species (including key
Figure 11.4. Vulnerability to climate change aggregated for key sectors in the Australia and New Zealand region, allowing for current coping range and adaptive capacity. Right-hand panel is a schematic diagram assessing relative coping range, adaptive capacity and vulnerability. Left-hand panel
shows global temperature change taken from the TAR Synthesis Report (Figure SPM-6). The coloured curves in the left panel represent temperature
changes associated with stabilisation of CO 2 concentrations at 450 ppm (WRE450), 550 ppm (WRE550), 650 ppm (WRE650), 750 ppm (WRE750) and
1,000 ppm (WRE1000). Year of stabilisation is shown as black dots. It is assumed that emissions of non-CO 2 greenhouse gases follow the SRES A1B
scenario until 2100 and are constant thereafter. The shaded area indicates the range of climate sensitivity across the five stabilisation cases.
The narrow bars show uncertainty at the year 2300. Crosses indicate warming by 2100 for the SRES B1, A1B and A2 scenarios.
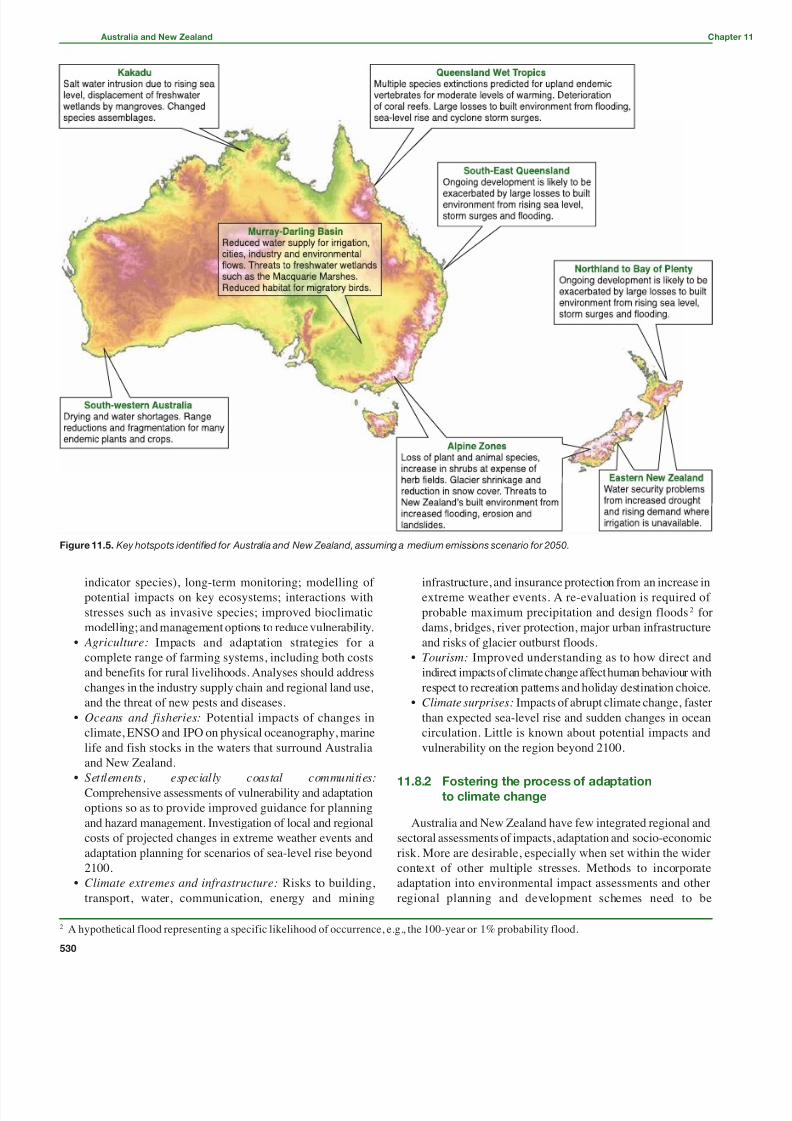
8/3/2019 Chapter 11 - Australia and New Zealand
http://slidepdf.com/reader/full/chapter-11-australia-and-new-zealand 24/34
Australia and New Zealand Chapt
530
Figure 11.5. Key hotspots identified for Australia and New Zealand, assuming a medium emissions scenario for 2050.
indicator species), long-term monitoring; modelling of
potential impacts on key ecosystems; interactions with
stresses such as invasive species; improved bioclimatic
modelling; and management options to reduce vulnerability.
• Agriculture: Impacts and adaptation strategies for a
complete range of farming systems, including both costs
and benefits for rural livelihoods. Analyses should address
changes in the industry supply chain and regional land use,
and the threat of new pests and diseases.
• Oceans and fisheries: Potential impacts of changes in
climate, ENSO and IPO on physical oceanography, marine
life and fish stocks in the waters that surround Australia
and New Zealand.• Settlements, especially coastal communities:
Comprehensive assessments of vulnerability and adaptation
options so as to provide improved guidance for planning
and hazard management. Investigation of local and regional
costs of projected changes in extreme weather events and
adaptation planning for scenarios of sea-level rise beyond
2100.
• Climate extremes and infrastructure: Risks to building,
transport, water, communication, energy and mining
infrastructure, and insurance protection from an increase in
extreme weather events. A re-evaluation is required of
probable maximum precipitation and design floods2 for
dams, bridges, river protection, major urban infrastructure
and risks of glacier outburst floods.
• Tourism: Improved understanding as to how direct and
indirect impacts of climate change affect human behaviour with
respect to recreation patterns and holiday destination choice.
• Climate surprises: Impacts of abrupt climate change, faster
than expected sea-level rise and sudden changes in ocean
circulation. Little is known about potential impacts and
vulnerability on the region beyond 2100.
11.8.2 Fostering the process of adaptation
to climate change
Australia and New Zealand have few integrated regional and
sectoral assessments of impacts, adaptation and socio-economic
risk. More are desirable, especially when set within the wider
context of other multiple stresses. Methods to incorporate
adaptation into environmental impact assessments and other
regional planning and development schemes need to be
2 A hypothetical flood representing a specific likelihood of occurrence, e.g., the 100-year or 1% probability flood.

8/3/2019 Chapter 11 - Australia and New Zealand
http://slidepdf.com/reader/full/chapter-11-australia-and-new-zealand 25/34
developed. More research is required as to how local communities
can shape adaptation (Kenny, 2005) and of adaptation options
for Māori and Indigenous Australian communities, especially
for those on traditional lands. Priority should be given to
reducing the vulnerability of ‘hotspot’ areas through:
• identification of mechanisms that governments might use to
reduce vulnerability,
• better understanding of societal preparedness and of the
limitations and barriers to adaptation,• better definition of costs and benefits of adaptation options,
including benefits of impacts avoided, co-benefits, side
effects, limits and better modelling,
• analyses of various options for social equity and fairness,
the impacts of different discount rates, price incentives,
delayed effects and inter-generational equity.
11.8.3 Assessing risks and opportunities of
climate change for different scenarios
Impact scenarios underpin policy decisions about adaptation
options and emission reduction targets. The following analyses are
required for the full range of SRES and CO2 stabilisation scenarios:• definition of the probabilities of exceeding critical
biophysical and socio-economic thresholds and assessment
of consequent vulnerability or new opportunities,
• assessment of net costs and benefits for key economic
sectors and for each country,
• better modelling of land-use change as climatic boundaries
shift, and assessment of the implications for regional
development, social change, food security and sustainability.
11.8.4 Analysing global trade, immigration and
security for climate change outcomes
Impacts of climate change and adaptation elsewhere in the
world are very likely to change global interactions, and
especially trade in commodities. The implications are large for
the strongly export-based economies of Australia and New
Zealand. Further studies are needed in order to assess the
impacts of climate change on the region’s competitiveness and
export mix. In the Asia-Pacific region, adverse effects on food,
disease, water, energy and coastal settlements are likely (Dupont
and Pearman, 2006), but implications for immigration and
security in Australia and New Zealand are poorly understood.
References
ABARE, 2004: Securing Australia’s Energy Future. Australian Bureau of Re-
source Economics, Canberra, 104 pp.
ABARE, 2005: Australian Fisheries Statistics 2004. Australian Bureau of Agri-
cultural and Resource Economics, Canberra, 65 pp. http://www.abareconomics
.com/publications_html/fisheries/fisheries_04/fs04.pdf.
Abbs, D.J., 2004:A high-resolutionmodelling study of theeffect of climate change
on theintensity of extreme rainfall events. Proc. Staying Afloat: Floodplain Man-
agement Authorities of NSW 44th Annual Conference, Floodplain Management
Authorities of NSW, Coffs Harbour, New South Wales, 17-24.
Abbs, D.J., S. Maheepala, K.L. McInnes, G. Mitchell, B. Shipton andG. Trinidad
2000: Climate change, urban flooding and infrastructure. Proc. Hydro 2000: 3rd
International Hydrology and Water Resources Symposium of the Institution of
Engineers, Australia: Perth, Western Australia, 686-691.
ABS, 2002: Population Distribution, Indigenous Australians, 2001. Repor
4705.0, Australian Bureau of Statistics, Canberra. http://abs.gov.au/
Ausstats/[email protected]/lookupMF/14E7A4A075D53A6CCA2569450007E46.
ABS, 2003a: Population Projections Australia 2004-2101. Report 3222.0, Aus-
tralian Bureau of Statistics, Canberra. http://www.abs.gov.au/Ausstats/abs
@.nsf/0e5fa1cc95cd093c4a2568110007852b/0cd69ef8568dec8eca2568a9001
9392!OpenDocument.ABS, 2003b: Queensland Government Population Projections. Report 3218.0
Australian Bureau of Statistics, Canberra. http://www.abs.gov.au/AUSSTATS/
[email protected]/DetailsPage/3218.02004-05?OpenDocument.
ABS, 2005a: Australian Social Trends 2005. Report 4102.0, Australian Bureau o
Statistics, Canberra. http://www.abs.gov.au/AUSSTATS/[email protected]/Lookup
4102.0I-Note12002?OpenDocument.
ABS, 2005b: The Health and Welfare of Australia’s Aboriginal and Torres Strai
Islander Peoples. Report 4704.0, Australian Bureau of Statistics, Canberra
http://www.abs.gov.au/ausstats/[email protected]/mf/4704.0.
ABS, 2005c: Year Book Australia. Industry Structure and Performance: 100 Years
of Change in Australian Industry. Report 1301.0, Australian Bureau of Statistics
Canberra. http://www.abs.gov.au/Ausstats/[email protected]/Previousproducts/1301.0
Feature%20Article212005?opendocument&tabname=Summary&prodno=1301
0&issue=2005&num=&view=.
Access Economics, 2005: Measuring the Economic and Financial Value of theGreat Barrier Reef Marine Park. Report byAccessEconomics forGreat Barrie
Reef Marine Park Authority, June 2005, 61 pp. http://www.accesseconomics
com.au/publicationsreports/showreport.php?id=10&searchfor=Economic
%20Consulting&searchby=area.
Adams, P.D., M. Horridge, J.R. Masden and G. Wittwer, 2002: Drought, regions
and the Australian economy between 2001-02 and 2004-05. Australian Bulletin
of Labour, 28, 233-249.
ADB, 2005: Climate Proofing: A Risk-based Approach to Adaptation. Pacific
Studies Series. Asian Development Bank, Manila, 191 pp. http://www.adb.org
Documents/Reports/Climate-Proofing/default.asp.
Agnew, M.D. and J.P. Palutikof, 2001: Impacts of climate on the demand for
tourism. Proceedings of the First International Workshop on Climate, Tourism
and Recreation,A. Matzarakis and C.R.d. Freitas, Eds., International Society o
Biometeorology, Commission on ClimateTourismand Recreation, Porto Carras
Halkidiki, 1-10.AGO, 2003: Australia–New Zealand Bilateral Climate Change Partnership
http://www.greenhouse.gov.au/international/partnerships/index.html#newze
land.
AGO, 2006: Vulnerability to Climate Change of Australia’s Coastal Zone: Analy
sis of gaps in methods, data and system thresholds..Australian Greenhouse Of-
fice, Commonwealth Government, 120 pp. http://www.greenhouse.gov
au/impacts/publications/pubs/coastal-vulnerability.pdf.
Alexander, L., P. Hope, D. Collins, B. Trewin, A. Lynch and N. Nicholls, 2007:
Trends in Australia’s climate means and extremes: a global context. Aust. Mete-
orol. Mag., 56, 1-18.
Allen Consulting Group, 2005: Climate Change Risk and Vulnerability: Promot-
ing an Efficient Adaptation Response in Australia. Report to the Australian
Greenhouse Office by the Allen Consulting Group, 159 pp. http://www.green
house.gov.au/impacts/publications/risk-vulnerability.html.
Altman, J., 2000: The economic status of Indigenous Australians. Discussion Pape
#193, Centre forAboriginal Economic PolicyResearch,Australian National Uni
versity, 18 pp. http://eprints.anu.edu.au/archive/00001001/.
Anderson, B., 2004: The response of Ko Roimate o Hine Hukatere Franz Josef
Glacier to climate change. PhD thesis, University of Canterbury, Christchurch
Anderson, B. and A. Mackintosh, 2006: Temperature change is the major driver
of late-glacial and Holocene glacier fluctuations in New Zealand. Geology, 34
121-124.
Anderson, B., W. Lawson, I. Owens and B. Goodsell, 2006: Past and future mass
balance of Ka Roimata o Hine Hukatere (Franz Josef Glacier). Int. J. Glaciol.
52, 597-607.
Annala, J.H., K.J. Sullivan, N.W.M. Smith, M.H. Griffiths, P.R. Todd, P.M. Mace
and A.M. Connell, 2004: Report from the Fishery Assessment Plenary, May
2004: stock assessment and yield estimates. Unpublished report held in NIWA
Chapter 11 Australia and New Zealand
531
8/3/2019 Chapter 11 - Australia and New Zealand
http://slidepdf.com/reader/full/chapter-11-australia-and-new-zealand 26/34
library, Wellington, 690 pp.
Arthur, B. and F. Morphy, 2005: Macquarie Atlas of Indigenous Australia: Cul-
ture and Society through Space and Time. Macquarie University, Macquarie,
New South Wales, 278 pp.
Ash, A., L. Hunt, C. Petty, R. Cowley, A. Fisher, N. MacDonald and C. Stokes,
2006: Intensification of pastoral lands in northern Australia. Proceedings of the
14th Biennial Conference of the Australian Rangeland Society, P. Erkelenz, Ed.,
Renmark,Australia, 43.
Asseng, S., P.D. Jamieson, B. Kimball, P. Pinter, K. Sayre, J.W. Bowden and S.M.
Howden, 2004: Simulated wheat growth affected by rising temperature, in-
creased water deficit and elevated atmospheric CO2. Field Crop. Res., 85, 85-102.
Atwell, B.J., M.L. Henery and D. Whitehead, 2003: Sapwood development in
Pinus radiata trees grown for three years at ambient and elevated carbon diox-
ide partial pressures. Tree Physiol., 23, 13-21.
Austin, P.T., A.J. Hall, W.P. Snelgar and M.J. Currie, 2000: Earlier maturity lim-
its increasing apple fruit size under climate change scenarios. New Zealand In-
stitute of Agricultural Science and the New Zealand Society for Horticultural
Science Annual Convention 2000, 77pp.
Austroads, 2004: Impact of Climate Change on Road Infrastructure. AP-R243/04,
Austroads, Sydney, 124 pp. http://www.onlinepublications.austroads.com.au
/script/Details.asp?DocN=AR0000048_0904.
Beare, S. and A. Heaney, 2002: Climate change and water resources in the Mur-
ray Darling Basin, Australia, impacts and adaptation. Conference Paper 02.11,
Australian Bureau of Agricultural and Resource Economics, 33 pp.
http://www.abarepublications.com/product.asp?prodid=12389.Beaumont, L. and L. Hughes, 2002: Potential changes in the distributions of lati-
tudinally restricted Australian butterflies in response to climate change. Glob.
Change Biol., 8, 954-971.
Beaumont,L.J., I.A.W. McAllanand L. Hughes, 2006:A matter of timing: changes
in the first dateof arrivaland last date of departure ofAustralian migratory birds.
Glob. Change Biol., 12, 1339-1354.
Becken, S.,2005: Harmonizing climate changeadaptationand mitigation: the case
of tourist resorts in Fiji. Global Environ. Chang., 15, 381-393.
Becken, S. and J. Hay, 2007: Tourism and Climate Change: Risks and Opportu-
nities. Climate Change, Economies and Society series, Channel View Publica-
tions, Clevedon, 352 pp.
Beentjes, M.P. andJ.A. Renwick, 2001: The relationshipbetween redcod, Pseudo-
phycis bachus, recruitment and environmental variables in New Zealand. Envi-
ron. Biol. Fish., 61, 315-328.
Bell, R.G., T.M. Hume and D.M. Hicks, 2001: Planning for Climate Change Ef- fects on CoastalMargins. National Institute of Waterand Atmospheric Research
and New Zealand Climate Change Programme, Hamilton. http://www.climate
change.govt.nz/resources/reports/effect-coastal-sep01/index.html.
Bergstrom, D., 2003: Impact of climate change on terrestrial Antarctic and sub-
Antarctic biodiversity. Climate Change Impactson Biodiversityin Australia, M.
Howden, L. Hughes, M. Dunlop, I. Zethoven, D.W. Hilbert andC. Chilcott, Eds.,
CSIRO Sustainable Ecosystems, Canberra, 55-57.
Bergstrom, D.M. and P.M. Selkirk, 1999: Bryophyte propagule banks in a feld-
mark on sub-Antarctic Macquarie Island. Arct. Antarct. Alp. Res., 31, 202-208.
http://www.environment.gov.au/biodiversity/publications/greenhouse/index.html.
Berkelmans, R. andJ.K. Oliver, 1999: Large-scale bleachingof corals on the Great
Barrier Reef. Coral Reefs, 18, 55-60.
Berkelmans, R., G. De’ath, S. Kininmonth and W.J. Skirving, 2004: A compari-
son of the 1998 and 2002 coral bleaching events of the Great Barrier Reef: spa-
tial correlation, patterns and predictions. Coral Reefs, 23, 74-83.
Bessen Consulting Services, 2005: Land and Sea Management Strategy for Tor-
res Strait. Bessen Consulting Services and Torres Strait NRM Reference Group
(TSRA), 97 pp. http://www.tsra.gov.au/pdf/Torres%20Strait%20 Land%20&
%20Sea%20Mgt%20Strategy%202006.pdf.
BoM, 2006a: Living with Drought. Australian Bureau of Meteorology.
http://www.bom.gov.au/climate/drought/livedrought.shtml.
BoM, 2006b: Severe Tropical Cyclone Larry. Queensland Regional Office, Aus-
tralian Bureau of Meteorology. http://www.bom.gov.au/weather/qld/cyclone/
tc_larry/.
Bowman, D.M.J.S., A. Walsh and D.J. Milne, 2001: Forest expansion and grass-
land contraction within a Eucalytpus savanna matrix between 1941 and 1994 at
Litchfield National Park in the Australian monsoon tropics. Global Ecol. Bio-
geogr., 10, 535-538.
Braaf, R., 1999: Improving impact assessment methods: climate change and the
health of indigenous Australians. Global Environ. Chang., 9, 95-104.
BRANZ, 2007:An assessment of the need to adapt buildings for the unavoidable
consequences of climate change. Report EC0893, Building Research Australia
and New Zealand. http://www.greenhouse.gov.au. In press.
BRS, 2003: State of the Forest Report. Bureau of Rural Sciences, Australian Gov-
ernment Printer, Canberra, 408 pp. http://www.affa.gov.au/stateoftheforests.
Bryan, B., N. Harvey, T. Belperio and B. Bourman, 2001: Distributed process
modeling for regional assessment of coastal vulnerability to sea-level rise. Env-
iron. Model. Assess., 6, 57-65.
BTE, 2001: Economic costs of natural disasters in Australia. Report 103, Bureauof Transport Economics, Canberra. http://www.btre.gov.au/docs/reports/r103/
r103.aspx.
Budd, G.M., 2000: Changes in Heard Island glaciers, king penguins and fur seals
since 1947. Papers and Proceedings of the Royal Society of Tasmania , 133, 47-
60.
Bunn, S.E. and A.H. Arthington, 2002: Basic principles and ecological conse-
quences of altered flow regimes for aquatic biodiversity. Environ. Manage., 30,
492-507.
Burgess, S.M., 2005: 2004-05 Tropical cyclone summary. Island Climate Update,
57, 6.
Burke, E.J., S.J. Brown and N. Christidis, 2006: Modelling the recent evolution of
global drought and projections for the 21st century with the Hadley Centre cli-
mate model. J. Hydrometeorol., 7, 1113-1125.
CAE, 2005: Managing flood risk: the case for change. Report prepared for the
Flood Risk Management Governance Group by the Centre for Advanced Engi-neering, University of Canterbury. http://www.caenz.com/ info/MFR/MFR.html.
Cai, W., G. Shi, T. Cowan, D. Bi and J. Ribbe, 2005: The response of the South-
ern annular mode, the East Australian current, and the southern mid-latitude
ocean circulation to global warming. Geophys. Res. Lett., 32, L23706,
doi:10.1029/2005GL024701.
Cary, G.J., 2002: Importance of a changing climate for fire regimes in Australia.
Flammable Australia:Fire Regimes andBiodiversity of a Continent , R.A. Brad-
stock, J.E. Williams and A.M. Gill, Eds., Cambridge University Press, Mel-
bourne, 26-49.
Chakraborty, S., G. Murray and N. White, 2002: Impact of Climate Change on
Important Plant Diseases in Australia. RIRDC Publication No. W02/010.
http://www.rirdc.gov.au/reports/AFT/02-010sum.html.
Chambers, L.E., 2005: Migration dates at Eyre Bird Observatory: links with cli-
mate change? Climate Res., 29, 157-165.
Chambers, L.E., L. Hughes and M.A. Weston, 2005: Climate change and its im-pact on Australia’s avifauna. Emu, 105, 1-20.
Chen, K. and J. McAneney, 2006: High-resolutionestimates ofAustralia’s coastal
population with validations of global population, shoreline and elevation
datasets. Geophys. Res. Lett., 33, L16601. doi:10.1029/2006GL026981.
Chiew, F.H.S. andT.A. McMahon, 2002: Modelling the impactsof climate change
on Australian stream-flow. Hydrol. Process., 16, 1235-1245.
Chiew, F.H.S., T.I. Harrold, L. Siriwardenena, R.N. Jones and R. Srikanthan, 2003:
Simulation of climate change impact on runoffusing rainfall scenarios that con-
sider daily patterns of change from GCMs. MODSIM 2003: International Con-
gress on Modelling and Simulation: Proceedings, D.A. Post, Ed., Modelling and
Simulation Society of Australia and New Zealand, Canberra, 154-159.
Chinn, T.J., 2001: Distribution of the glacial water resources of New Zealand.
Journal of Hydrolology (NZ), 40, 139–187.
Christensen, J.H., B. Hewitson, A. Busuioc, A. Chen, X. Gao, I. Held, R. Jones,
R.K. Kolli, W.-T. Kwon, R. Laprise,V.Magaña Rueda, L. Mearns, C.G. Menén-
dez, J. Räisänen,A. Rinke, A. Sarr and P. Whetton, 2007: Regional climate pro-
jections. Climate Change 2007 :The Physical Science Basis, Contribution of:
Working Group I to the Fourth Assessment Report of the Intergovernmental
Panel on Climate Change. S. Solomon, D. Qin, M. Manning, Z. Chen, M. Mar-
quis, K.B. Averyt, M. Tignor andH.L. Miller, Eds., Cambridge UniversityPress,
Cambridge, 847-940.
Church, J., J. Hunter,K. McInnes and N.J.White, 2004: Sea-level rise and the fre-
quency of extreme event around the Australian coastline. Coast to Coast ’04:
Australia’s National Coastal Conference, conference proceedings, Hobart, Tas-
mania. 8 pp.
Clare, G.R., B.B. Fitzharris, T.J. Chinn and M.J. Salinger, 2002: Interannual vari-
ation in end-of-summer snow-lines of the SouthernAlps of New Zealand, in re-
sponse to changes in Southern Hemisphere atmospheric circulation and sea
Australia and New Zealand Chapt
532
8/3/2019 Chapter 11 - Australia and New Zealand
http://slidepdf.com/reader/full/chapter-11-australia-and-new-zealand 27/34
surface temperature patterns. Int. J. Climatol., 22, 107-120.
Clark, H., N.D. Mitchell, P.C.D. Newton and B.D. Campbell, 2001: The sensitiv-
ity of NewZealand’s managed pastures to climate change. TheEffects of Climate
Change and Variation in New Zealand: An Assessment using the CLIMPACTS
System, R.A. Warrick, G.J. Kenny and J.J. Harman, Eds., International Global
Change Institute (IGCI), University of Waikato, Hamilton, 65-77.
Coleman, T., O. Hoegh-Guldberg, D. Karoly, I. Lowe, T. McMichael, C.D.
Mitchell, G.I. Pearman, P. Scaife and J. Reynolds, 2004: Climate Change: So-
lutions for Australia. Australian Climate Group, 35 pp. http://www.wwf.org.au/
publications/acg_solutions.pdf.
Cottrell, B., C. Insley, R. Meade and J. West, 2004: Report of the Climate ChangeMaori Issues Group. New Zealand Climate Change Office, Ministry for the En-
vironment, Wellington. http://www.climatechange.govt.nz/resources/.
Cowell, P.J., B.G. Thom, R.A. Jones, C.H. Evert and D. Simanovic, 2006: Man-
agement of uncertainty in predicting climate-change impacts on beaches. J.
Coastal Res., 22, 232-245.
Crimp, S.J., N.R. Flood, J.O. Carter, J.P. Conroy and G.M. McKeon, 2002: Eval-
uation of the Potential Impacts of Climate Change On Native Pasture Produc-
tion – Implications for livestock carrying capacity: Final Report for the
Australian Greenhouse Office, 60pp.
Crimp, S., J. Balston,A. Ash, L. Anderson-Berry, T. Done, R. Greiner, D. Hilbert,
M. Howden, R. Jones, C. Stokes, N. Stoeckl, B. Sutherst and P. Whetton, 2004:
Climate Change in theCairns and Great Barrier Reef Region: Scope and Focus
for an Integrated Assessment. Australian Greenhouse Office, 100 pp.
http://www.greenhouse.gov.au/impacts/publications/pubs/gbr.pdf.
CSIRO, 2002: Climate change and Australia’s coastal communities. CSIRO At-mospheric Research, Aspendale, Victoria, 8 pp. http://www.cmar.csiro.au/e-
print/open/CoastalBroch2002.pdf.
Cullen, P., 2002: Living with water: sustainability in a dry land. Adelaide Festival
of Arts, Getting it Right Symposium, 1-12 March, 2002. http://freshwater.can-
berra.edu.au/Publications.nsf/0/3c1c61a1a89d5798ca256f0b001b7a30?OpenDo
cument.
Curtis, I.A., 2004: Valuing ecosystem goods and services: a new approach using
a surrogatemarket andthe combinationof a multiple criteriaanalysis and a Del-
phi panel to assign weights to the attributes. Ecol. Econ., 50, 163-194.
DAFF, 2006a: National Water Initiative. Department of Agriculture, Forestry and
Fisheries, Australia. http://www.pmc.gov.au/water_reform/nwi.cfm.
DAFF, 2006b: Contours. Department ofAgriculture, Forestry and Fisheries, 24 pp.
http://www.daff.gov.au/__data/assets/pdf_file/0020/98201/contours-dec-06.pdf.
Dahm, J., G. Jenks and D. Bergin, 2005: Community-based dune management for
the mitigation of coastal hazards andclimatechangeeffects: a guide forlocal au-thorities. Report for the New Zealand Ministry for the Environment, 36 pp.
http://www.envbop.govt.nz/media/pdf/Report_Coastalhazardsandclimate.pdf.
Davis, J.R., Ed., 1997: Managing Algal Blooms: Outcomes from CSIRO’s Multi-
Divisional Blue-Green Algae Program. CSIRO Land and Water, Canberra,
113 pp.
Dayananda, K.G., J. Pathirana, M.D. Davis, M.J. Salinger, A.B. Mullan, P. Kin-
ley and G. Paterson, 2005: Flood risk under existing and future climate scenar-
ios inAuckland City(New Zealand). World Water and Environmental Resources
Congress 2005, American Society of Civil Engineers, Reston, Virginia, doi:
10.1061/40792(173)477.
De Wet, N.,W.Ye, S. Hales,R. Warrick, A. Woodward andP.Weinstein, 2001: Use
of a computer model to identify potential hotspots for dengue fever in New
Zealand. New Zeal. Med. J., 114, 420-422.
DEH, 2005: Adelaide’s Living Beaches: A Strategy for 2005-2025. South Aus-
tralian Department for Environment and Heritage, Government of South Aus-
tralia, 220 pp. http://www.environment.sa.gov.au/coasts/pdfs/alb_technical_
report.pdf.
DEST, 2004: National Research Priorities. http://www.dest.gov.au/sectors/re-
search_sector/policies_issues_reviews/key_issues/national_research_priorities/d
efault.htm.
DEUS, 2006: NSW Government Water Savings Fund. Department of Energy, Util-
ities and Sustainability, 17 pp. http://www.deus.nsw.gov.au/Publications/
WaterSavingsFundR3Guide.pdf.
Diamond, H., 2006: Review of recent tropical cyclone research. Island Climate
Update, 72, 6.
DoC, 1994: New Zealand Coastal Policy Statement 1994. Department of Conser-
vation, Wellington, 30 pp. http://www.doc.govt.nz/upload/documents/conservation
/marine-and-coastal/coastal-management/nz-coastal-policy-statement.pdf.
Done, T., P. Whetton, R. Jones, R. Berkelmans, J. Lough, W. Skirving and S
Wooldridge, 2003: Global climate changeand coral bleachingon theGreat Bar-
rier Reef. Final Report to the State of Queensland Greenhouse Taskforce through
the Department of Natural Resources and Mining, Townsville, 49pp
http://www.longpaddock.qld.gov.au/ClimateChanges/pub/CoralBleaching.pdf.
Donner, S.D., W.J. Skirving, C.M. Little, M. Oppenheimer and O. Hoegh-Guld-
berg, 2005: Global assessment of coral bleaching and required rates of adapta
tion under climate change. Glob. Change Biol., 11, 1-15.
DPMC, 2004: Water Reform. Department of Prime Minister and Cabinet, Aus-
tralia. http://www.dpmc.gov.au/nwi/index.cfm.
D’Souza, R.M., N.G. Becker, G. Hall and K. Moodie, 2004: Does ambient tem-perature affect foodborne disease? Epidemiology, 15, 86-92.
Dupont, A. and G. Pearman, 2006: Heating up the planet: climate change and se-
curity. Paper 12, Lowy Institute for International Policy. Longueville Media
143 pp.www.lowyinstitute.org/PublicationGet.asp?i=391.
Dymond, J.R., A.G. Ausseil, J.D. Shepherd and L. Buetttner, 2006: Validation o
a region-wide model of landslide susceptibility in the Manawatu-Wanganui re
gion of New Zealand. Geomorphology, 74, 70-79.
Electricity Commission, 2005: Initial statement of opportunities: Electricity Com
mission, Wellington, 158 pp. http://www.electricitycommission.govt.nz/opdev
transmis/soo/pdfssoo/SOOv2.pdf.
Ellemor, H., 2005: Reconsidering emergency management and Indigenous com-
munities in Australia. Environmental Hazards, 6, 1-7.
Engineers Australia, 2004: Guidelines for Responding to the Effects of Climate
Change in Coastal andOcean Engineering. National Committee on Coastal and
Ocean Engineering, 64 pp. http://www.engineersaustralia.org.au/.Evans, K.L., C. Tyler, T.M. Blackburn and R.P. Duncan, 2003: Changes in the
breeding biology of the welcome swallow ( Hirundo tahitica) in New Zealand
since colonisation. Emu, 103, 215-220.
Falconer, I.R., 1997: Blue-green algae in lakes and rivers: their harmfuleffectson
human health. Australian Biologist , 10, 107-110.
Fitzharris, B.B., 2004: Possible impact of future climate change on seasonal snow
of the SouthernAlps of NewZealand. A Gaian World: Essaysin Honourof Peter
Holland , G. Kearsleyand B. Fitzharris, Eds., Department of Geography, Schoo
of Social Science, University of Otago, Dunedin, 231-241.
Folland,C.K., M.J. Salinger, N. Jiang and N. Rayner,2003: Trends and variations
in South Pacific island and ocean surface temperatures. J. Climate, 16, 2859-
2874.
Folland, C.K., B. Dong, R.J. Allan, H. Meinke and B. Bhaskaran, 2005: The In-
terdecadal Pacific Oscillation and its climatic impacts. AMS16th Conference on
Climate Variability and Change. http://ams.confex.com/ams/Annual2005techprogram/paper_86167.htm.
Francis, M.P., 1994: Growth of juvenile snapper, Pagrus auratus (Sparidae). New
Zeal. J. Mar. Fresh., 28, 201-218.
Francis, M.P., 1996: Geographic distribution of marine reef fishes in the New
Zealand region. New Zeal. J. Mar. Fresh., 30, 35-55.
Frenot, Y., S.L. Chown, J. Whinam, P.M. Selkirk, P. Convey, M. Skotnicki and D
Bergstrom, 2005: Biological invasions in the Antarctic: extent, impacts and im-
plications. Biol. Rev., 80, 45-72.
FRST, 2005: Target Outcomes and Themes for the Foundation’s Investment Port-
folios. Foundation for Research Science and Technology, 39 pp
http://www.frst.govt.nz/research/downloads/ArchivedDocuments/20050500_Inv
estment_Portfolio-Target_Outcomes_ and_Themes_May05.pdf.
Gallant, A., K. Hennessy and J. Risbey, 2007: A re-examination of trends in rain
fall indices for six Australian regions. Aust. Meteorol. Mag., accepted.
Ghannoum, O., S. von Caemmerer, L.H. Ziska and J.P. Conroy, 2000: The growth
response of C4 plants to rising atmospheric CO2 partial pressure: a reassessment
Plant Cell Environ., 23, 931-942.
Gifford, R.M. and S.M. Howden, 2001: Vegetation thickening in an ecological
perspective. significance to national greenhouse-gas inventories. Environ. Sci
Policy, 2-3, 59-72.
Glade, T., 1998: Establishing the frequency and magnitude of landslide-triggering
rainstorm events in New Zealand. Environ. Geol., 35, 160-174.
Goodwin, I.D., 2005: A mid-shelf, mean wave direction climatology for south-
eastern Australia, and its relationship to the El Niño-Southern Oscillation since
1878 AD. Int. J. Climatol., 25, 1715-1729.
Goodwin, I.D., M.A. Stables and J.M. Olley, 2006: Wave climate, sand budget
and shoreline alignment evolution of the Iluka–Woody Bay sand barrier, north-
ern New South Wales, Australia, since 3000 yr BP. Mar. Geol., 226, 127-144.
Chapter 11 Australia and New Zealand
533
8/3/2019 Chapter 11 - Australia and New Zealand
http://slidepdf.com/reader/full/chapter-11-australia-and-new-zealand 28/34
Gordon, N.D., 1986: The Southern Oscillation and New Zealand weather. Mon.
Weather Rev., 114, 371-387.
Government of South Australia, 2005: Water Proofing Adelaide: A Thirst for
Change 2005–2025. Government of SA, 64 pp. http://www.waterproofingade-
laide.sa.gov.au/pdf/wpa_Strategy.pdf.
Government of WesternAustralia, 2003: Securing ourWater Future: A State Water
Strategy for Western Australia. Government of WA, 64 pp. http://dows.lincdig-
ital.com.au/files/State_Water_Strategy_complete_001.pdf.
Government of Western Australia, 2006: Draft State Water Plan. Government of
WA, 88 pp. htt p://dows.lincdigital.com.au/files/Draft%20State%20Water%
20Plan.pdf.Gray, W., R. Ibbitt, R. Turner, M. Duncan and M. Hollis, 2005: A methodology to
assess the impactsof climate changeon flood riskin New Zealand. NIWA Client
Report CHC2005-060, New Zealand Climate Change Office, Ministry for the
Environment. NIWA, Christchurch, 36 pp. http://www.mfe.govt.nz/ publica-
tions/climate/impact-climate-change-flood-risk-jul05/html/page8.html.
Green, D.,2006a: Climate Change andhealth: impacts on remote Indigenous com-
munities in northern Australia. CSIRO Research Paper No. 12, Melbourne, 17
pp. http://sharingknowledge.net.au/files/climateimpacts_health_report.pdf.
Green, D., 2006b: How might climate change impact island culture in the in the
Torres Strait? CSIRO Research Paper No. 11, Melbourne, 20 pp.
www.dar.csiro.au/sharingknowledge/files/climateimpacts_TSIculture_report.pdf
Green, D. and B. Preston, 2006: Climate change impacts on remote Indigenous
communities in northern Australia. CSIRO Working Paper, Melbourne.
http://sharingknowledge.net.au/regions.html
Green, K. and C.M. Pickering, 2002:A potential scenariofor mammal andbird di-versityin the Snowy Mountainsof Australia in relation to climate change. Moun-
tain Biodiversity: A Global Assessment , C. Korner and E.M. Spehn, Eds.,
Parthenon Press, London, 241-249.
Gregory, J.M., J.A. Church, G.J. Boer, K.W. Dixon, G.M. Flato, D.R. Jackett, J.A.
Lowe, S.P. O’Farrell, E. Roeckner, G.L. Russell, R.J. Stouffer and M. Winton,
2001: Comparisonof resultsfrom several AOGCMs for global and regional sea-
level change 1900-2100. Clim. Dynam., 18, 225-240.
Griffiths, G.A., 1990: Water resources. Climatic Change: Impacts on New
Zealand . Ministry for the Environment, Wellington, 38-43.
Griffiths, G.M, 2007: Changes in NewZealanddaily rainfall extremes 1930-2004.
Weather Climate, 27, 47-66.
Hall, A.J., G.J. Kenny, P.T. Austin and H.G. McPherson, 2001: Changes in ki-
wifruit phenology with climate. The Effects of Climate Change and Variation in
New Zealand: An Assessment using the CLIMPACTSSystem, R.A. Warrick, G.J.
Kenny, and J.J. Harman, Eds., International Global Change Institute (IGCI),Hamilton, 33-46. http://www.waikato.ac.nz/igci/ climpacts/Linked%20docu-
ments/Chapter_3.pdf.
Hall, C.J.and C.W. Burns, 2002: Mortality and growth responses of Daphnia car-
inata to increases in temperature and salinity. Freshwater Biol., 47, 451-458.
Hall, G.V., R.M. D’Souza and M.D. Kirk, 2002: Food-borne disease in the new
millennium: out of the frying pan and into the fire? Med. J. Australia, 177, 614-
618.
Hall, M. andJ. Higham, 2005: Tourism,Recreation andClimate Change:Aspects
of Tourism. Channel View Publications, Clevedon, 309 pp.
Halloy, S.R.P. and A.F. Mark, 2003: Climate change effects on alpine plant biodi-
versity: a New Zealand perspective on quantifying the threat. Arct. Antarct. Alp.
Res., 35, 248-254.
Hampe, A. and R.J. Petit, 2005: Conserving biodiversity under climate change:
the rear edge matters. Ecol. Lett., 8, 461-467.
Hannah, J., 2004: An updated analysis of long-term sea-level change in New
Zealand. Geophys. Res. Lett., 31, L03307. doi:10.1029/2003GL019166.
Hare, W., 2003: Assessment of Knowledge on Impacts of Climate Change: Con-
tribution to the Specification of Article 2 of the UNFCCC. WGBU, Berlin, 106
pp. http://www.wbgu.de/wbgu_sn2003_ex01.pdf.
Harmsworth, G.R. and B. Raynor, 2005: Cultural consideration in landslide risk
perception. Landslide Hazard and Risk , T. Glade, M. Anderson and M. Crozier,
Eds., John Wiley and Sons, Chichester, 219-249.
Harvey, N. and B. Caton, 2003: Coastal Management in Australia. Oxford Uni-
versity Press, Melbourne, 342 pp.
Hennecke, W., C. Greve, P. Cowell and B. Thom, 2004: GIS-based coastal be-
haviour modeling and simulation of potential land and property loss: implications
of sea-level rise at Colloroy/Narrabeen beach, Sydney (Australia). Coast. Man-
age., 32, 449-470.
Hennessy, K.,C. Lucas,N. Nicholls, J. Bathols,R. Suppiahand J. Ricketts, 2006:
Climate Change Impactson Fire-Weather in South-East Australia. Consultancy
Report for the New South Wales Greenhouse Office, Victorian Department of
Sustainability and Environment, Tasmanian Department of Primary Industries,
Water and Environment, and the Australian Greenhouse Office. CSIRO Atmos-
pheric Research and Australian Government Bureau of Meteorology, 78 pp.
http://www.greenhouse.gov.au/impacts/publications/pubs/bushfire-report.pdf.
Hennessy, K.J., 2004: Climate change and Australian storms. Proceedings of the
International Conference on Storms, Brisbane, 8.
Hennessy, K.J., P.H. Whetton, J. Bathols, M. Hutchinson and J. Sharples, 2003:
The Impact of Climate Change on Snow Conditions in Australia. ConsultancyReport forthe VictorianDept of Sustainability and Environment, NSWNational
Parks andWildlifeService,Australian Greenhouse Officeand theAustralian Ski
Areas Association., CSIRO Atmospheric Research, 47 pp.
http://www.cmar.csiro.au/e-print/open/hennessy_2003a.pdf.
Hennessy, K.J., K.L. McInnes, D.J. Abbs, R.N. Jones, J.M. Bathols, R. Suppiah,
J.R. Ricketts, A.S. Rafter, D. Collins and D. Jones, 2004: Climate Change in
New South Wales. Part 2, Projected Changes in Climate Extremes. Consultancy
Report for the New South Wales Greenhouse Office, CSIRO Atmospheric Re-
search, 79 pp. http://www.cmar.csiro.au/e-print/ open/hennessy_2004c.pdf.
Herron, N., R. Davis and R. Jones, 2002: The effects of large-scale afforestation
and climate change on water allocation in the Macquarie river catchment, NSW,
Australia. Journal of Environmental Management Australia, 65, 369-381.
Hilbert, D.H., B. Ostendorf and M.S. Hopkins, 2001: Sensitivity of tropical forests
to climate change in the humid tropics of North Queensland. Austral Ecol., 26,
590-603.Hilbert,D.W., M. Bradford, T. Parker andD.A. Westcott,2004: Golden bowerbird
(Prionodura newtonia) habitat in past, present and future climates: predicted ex-
tinction of a vertebrate in tropical highlands due to global warming. Biol. Con-
serv., 116, 367-377. http://www.cababstractsplus.org/google/abstract.asp?
AcNo=20043043667.
Hill, R., 2004: Yalanji Warranga Kaban: Yalanji People of the Rainforest Fire
Management Book.Little Ramsay Press, Cairns, 110 pp.
Hobday, A. and R. Matear, Eds., 2005: Review of climate impacts on Australian
fisheries andaquaculture: implications for the effects of climate change. Report
to the Australian Greenhouse Office, Canberra.
Hoegh-Guldberg, O., 1999: Climate change, coral bleaching and the future of the
world’s coral reefs. Mar. Freshwater Res., 50, 839-866.
Hoegh-Guldberg, O.,2004: Coral reefs in a century of rapid environmental change.
Symbiosis, 37, 1-31.
Holper, P.N., S. Lucy, M. Nolan, C. Senese and K. Hennessy, 2007: Infrastructureand Climate Change Risk Assessment for Victoria. Consultancy Report to the
Victorian Government prepared by CSIRO, MaunsellAECOM andPhillips Fox,
84 pp. http://www.greenhouse.vic.gov.au/greenhouse/wcmn302.nsf/childdocs/-
9440F41741A0AF31CA2571A80011CBB6?open.
Hood,A., H. Hossain, V. Sposito, L. Tiller, S. Cook, C. Jayawardana, S. Ryan, A.
Skelton, P. Whetton, B. Cechet, K. Hennessy and C. Page, 2002: Options for
Victorian Agriculture in a “New” Climate: A Pilot Study Linking Climate
Change Scenario Modelling and Land Suitability Modelling. Vol. 1: Concepts
and Analysis. Vol. Two: Modelling Outputs. Department of Natural Resources
and Environment, Victoria, 83pp. http://www.dar.csiro.au/cgi-bin/abstract_sr
ch.pl?_ abstract_available_2256.
Howden, M. and R.N. Jones, 2004: Riskassessment of climate change impacts on
Australia’s wheat industry. New Directions for a Diverse Planet: Proceedings of
the 4th International Crop Science Congress, Brisbane. http://www.
cropscience.org.au/icsc2004/symposia/6/2/1848_howdensm.htm.
Howden, S.M. and S. Crimp, 2001: Effect of climate change on electricity de-
mand in Australia. Proceedings of Integrating Models for Natural Resource
Management across Disciplines, Issues and Scales (2). MODSIM 2001 Inter-
national Congress on Modelling and Simulation, F. Ghassemi, P. Whetton, R.
Little and M. Littleboy, Eds., Modelling and SimulationSocietyof Australia and
New Zealand, Canberra, 655-660.
Howden, S.M., W.B. Hall and D. Bruget, 1999a: Heat stress and beef cattle in
Australian rangelands: recent trends and climate change. People and Range-
lands: Building the Future. Proceedings of the VI International Rangeland Con-
gress, D. Eldridge and D. Freudenberger, Eds., Townsville, 43-45.
Howden, S.M., G.M. McKeon, J.O. Carter and A. Beswick, 1999b: Potential
global change impacts on C3-C4 grass distribution in eastern Australian range-
lands. People and Rangelands: Building the Future. Proceedings of the VI In-
Australia and New Zealand Chapt
534
8/3/2019 Chapter 11 - Australia and New Zealand
http://slidepdf.com/reader/full/chapter-11-australia-and-new-zealand 29/34
ternational Rangeland Congress, D. Eldridge and D. Freudenberger, Eds.,
Townsville, 41-43.
Howden, S.M., P.J. Reyenga and J.T. Gorman, 1999c: Current evidence of global
changeand its impacts: Australianforests andother ecosystems. CSIRO Wildlife
and Ecology Working Paper 99/01, Canberra, 23 pp.
Howden, S.M., P.J. Reyenga and H. Meinke, 1999d: Global change impacts on
Australian wheat cropping. CSIRO Wildlife and EcologyWorking Paper 99/04,
Report to the Australian Greenhouse Office, Canberra, 121 pp.
http://www.cse.csiro.au/publications/1999/globalchange-99-01.pdf.
Howden, S.M., G.M. McKeon, H. Meinke, M. Entel and N. Flood, 2001a: Im-
pacts of climate change and climate variability on the competitiveness of wheatandbeef cattle production in Emerald,northeast Australia. Environ. Int., 27, 155-
160.
Howden, S.M., J.L.Moore,G.M. McKeon and J.O.Carter, 2001b: Global change
and the mulga woodlands of southwest Queensland: Greenhouse emissions, im-
pacts and adaptation. Environ. Int., 27, 161-166.
Howden, S.M., A.J. Ash, E.W.R. Barlow, T. Booth, S. Charles, R. Cechet, S.
Crimp, R.M. Gifford, K. Hennessy, R.N. Jones, M.U.F. Kirschbaum, G.M. McK-
eon, H. Meinke, S. Park, R. Sutherst, L. Webb and P.J. Whetton, 2003a: An
Overview of the Adaptive Capacity of the Australian Agricultural Sector to Cli-
mateChange: Options, Costs andBenefits. Report to theAustralian Greenhouse
Office, Canberra, 157 pp.
Howden, S.M., H. Meinke, B. Power and G.M. McKeon, 2003b: Risk manage-
ment of wheat in a non-stationary climate: frost in Central Queensland. Integra-
tive modelling of biophysical, social and economic systems for resource
management solutions. Proceedings of the International Congress on Model-ling and Simulation, D.A. Post, Ed., Townsville, 17-22.
Howden, S.M., P.J.Reyenga andH. Meinke, 2003c:Managingthe qualityof wheat
grain under global change. Integrative Modelling of Biophysical, Social and Eco-
nomic Systems for Resource Management Solutions: Proceedings of the Inter-
national Congress on Modelling and Simulation, D.A. Post, Ed., Townsville,
35-41.
Howe, C., R.N. Jones, S. Maheepala and B. Rhodes, 2005: Implications of Po-
tential Climate Change for Melbourne’s Water Resources. CSIRO Urban Water,
CSIRO Atmospheric Research, and Melbourne Water, Melbourne, 36 pp.
http://www.melbournewater.com.au/content/library/news/whats_new/Climate_C
hange_Study.pdf
Hughes, L., 2003: Climate change and Australia: trends, projections and impacts.
Austral Ecol., 28, 423-443.
ICA, 2007: Catastrophe Information. Insurance Council of Australia.
http://www.insurancecouncil.com.au/Catastrophe-Information/default.aspxIGWG, 2004: Environmental Health Needs of Indigenous Communities in West-
ern Australia: The 2004 Survey and its Findings. Western Australia Department
of Indigenous Affairs, 240 pp. http://www.dia.wa.gov.au/Publications/.
Insurance Council of New Zealand, 2005: Current Issues: The Cost of Weather
Losses: Claims History. NZ Insurance Council, Wellington. http://www.icnz.
org.nz/current/wx.php.
IOCI, 2002: Climate Variability and Change in Southwest Western Australia. In-
dian Ocean Climate Initiative, Perth, 36 pp. http://www.ioci.org.au/publica-
tions/pdf/IOCI_CVCSW02.pdf.
IPCC, 1992: Climate Change 1992: The Supplementary Report to the IPCC Sci-
entific Assessment. J.T. Houghton, B.A. Callander and S.K. Varney, Eds., Cam-
bridge University Press, Cambridge, 200 pp.
IPCC, 2007: Climate Change 2007: The Physical Science Basis, Contribution of:
Working Group I to the Fourth Assessment Report of the Intergovernmental
Panel on Climate Change. S. Solomon, D. Qin, M. Manning, Z. Chen, M. Mar-
quis, K.B. Averyt, M. Tignorand H.L. Miller, Eds., Cambridge UniversityPress,
Cambridge, 18 pp.
Jackson, S., 2005: A burgeoning role for Aboriginal knowledge. ECOS CSIRO
Publication, June-July 2005, 11-12.
Jamieson, P.D., J. Berntsen, F. Ewert, B.A.Kimball, J.E. Olesen, P.J. Pinter Jr, J.R.
Porter and M.A. Semenov, 2000: Modelling CO2 effects on wheat with varying
nitrogen supplies. Agr. Ecosyst. Environ., 82, 27-37.
Jenkins, B., 2006: Overview of Environment Canterbury water issues: managing
drought in a changing climate. Royal Society of New Zealand Drought Work-
shop, 10 April 2006 , Christchurch. http://www.rsnz.org/advisory/nz_climate/
workshopApr2006/.
Johnston, F.H., A.M. Kavanagh, D.M. Bowman and R.K. Scott, 2002: Exposure
to bushfire smoke and asthma: an ecological study. Med. J. Australia, 176, 535–
538.
Jones, R. and P. Durack, 2005: Estimating the impacts of climate change on Vic
toria’s runoffusing a hydrological sensitivity model. Consultancy Report for the
Victorian Department of Sustainability and Environment, Victoria, 50 pp
http://www.greenhouse.vic.gov.au/CSIRO%20Report%20-%20Runoff.pdf.
Jones, R.J., J. Bowyer,O. Hoegh-Guldberg and L.L.Blackall, 2004: Dynamics o
a temperature-related coral disease outbreak. Mar. Ecol.-Prog. Ser., 281, 63-77
Jones, R.N., Ed., 2004a: Applying a climate scenario generator to water resource
policy issues. Final Report . CSIRO Atmospheric Research, Hassall and Asso-
ciates, NSW Department of Infrastructure, Planning and Natural Resources
RIRDC Project No. CSM-5A, 48 pp.Jones, R.N., 2004b: Managing climate change risks. The Benefitsof Climate Poli-
cies:Analytical and Framework Issues, J. Corfee Morlot andS. Agrawala, Eds.
OECD, 251-297. http://www.oecd.org/document/35/0,2340,en_ 2649_34361_
34086819_1_1_1_1,00.html.
Jones, R.N. and C.M. Page, 2001: Assessing the risk of climate change on the
water resources of the Macquarie river catchment. Integrating Models for Nat
ural Resources Management across Disciplines, Issues and Scales. Part 2
MODSIM 2001 International Congress on Modelling and Simulation, P. Ghas-
semi, P. Whetton, R. Little and M. Littleboy, Eds., Modelling and Simulation
Society of Australia and New Zealand, Canberra, 673-678. http://www.aiac-
cproject.org/resources/ele_lib_docs/rjones.pdf.
Jones, R.N., P. Dettman,G. Park, M. Rogers and T. White, 2007: The relationship
between adaptation and mitigation in managingclimate change risks: a regiona
approach. Mitigation Adaptation Strategies Global Change, 12, 685-712.
Jovanovic,B., D.A. Jones and D. Collins,2007:A high-quality monthlypan evap-oration dataset for Australia. Climatic Change, accepted.
Karoly, D.J. and K. Braganza, 2005a:Attribution of recent temperature changes in
the Australian region. J. Climate, 18, 457-464.
Karoly, D.J. and K. Braganza, 2005b: A new approach to detection of anthro-
pogenic temperature changes in the Australian region. Meteorol. Atmos. Phys.
89, 57-67.
Kennish, M.J., 2002: Environmentalthreatsand environmentalfutureof estuaries
Environ. Conserv., 29, 78-107.
Kenny, G., 2005: Adapting to Climate Change in EasternNew Zealand: A Farmer
Perspective. Earthwise Consulting, Hastings, 148 pp. http://www.earthlim-
ited.org.
Kenny, G., 2007: Adapting to Climate Change: A View from the Ground. Parlia-
mentary Commissioner for the Environment, New Zealand, 23 pp., in press.
Kenny, G.J., 2002: Climate change and landmanagement in Hawke’s Bay: a pilo
study on adaptation. Ministry for the Environment, Wellingtonhttp://www.maf.govt.nz/mafnet/publications/rmupdate/rm10/rm-update-june
2002-01.htm.
Kenny, G.J., R.A. Warrick, B.D. Campbell, G.C. Sims, M. Camilleri, P.D
Jamieson, N.D. Mitchell, H.G. McPherson and M.J. Salinger, 2000: Investigat-
ing climate change impacts and thresholds: an application of the CLIMPACTS
integrated assessment model for New Zealand agriculture. Climatic Change, 46
91-113.
Kirono, D.G.C. and R.N. Jones, 2007: A bivariate test for detecting inhomo
geneities in pan evaporation time series. Aust. Meteorol. Mag., accepted.
Kirschbaum, M.U.F., 1999a: Forest growth and species distributions in a chang
ing climate. Tree Physiol., 20, 309-322.
Kirschbaum,M.U.F., 1999b: Modelling forest growth and carbon storage within-
creasing CO2 and temperature. Tellus B, 51, 871-888.
Koslow, A. and R.E. Thresher, 1999: Climate and fisheries on the south-east Aus
tralian continental shelf and slope. Final Report, FRDC Project Number 96/111
http://www.cvap.gov.au/newfsKoslow.html.
Kriticos, D.J., R.W. Sutherst, J.R.Brown,S.W. Adkins and G.F. Maywald, 2003a
Climate change and biotic invasions: a case history of a tropical woody vine
Biol. Invasions, 5, 147-165.
Kriticos, D.J., R.W. Sutherst, J.R.Brown,S.W. Adkins and G.F. Maywald, 2003b
Climate change and the potential distribution of an invasive alien plant: Acacia
nilotica spp. indica in Australia. J. Appl. Ecol., 40, 111-124.
Kuleshov, Y.A., 2003: Tropical Cyclone Climatology for the Southern Hemisphere
Part 1. Spatial andTemporal Profiles of Tropical Cyclones in theSouthernHemi
sphere. National Climate Centre, Australian Bureau of Meteorology, 1-22.
Kyle, G., 2006: Impacts of climate change on the Mirarr estates, Northern Terri
tory. Report #100406, Gundjeihmi Aboriginal Corporation report, 7 pp.
Langdon, C., 2002: Review of experimental evidence for effects of CO2 on calci-
Chapter 11 Australia and New Zealand
535
8/3/2019 Chapter 11 - Australia and New Zealand
http://slidepdf.com/reader/full/chapter-11-australia-and-new-zealand 30/34
fication of reef builders. Proceedings of the 9th International Coral Reef Sym-
posium, Ministry of Environment, Indonesian Instituteof Science,International
Society for Reef Studies, Bali 23–27 October, 1091-1098.
Langdon, C., T. Takahashi, F. Marubini, M.Atkinson, C. Sweeney, H. Aceves, H.
Barnett, D. Chipman and J. Goddard, 2000: Effect of calcium carbonate satura-
tion state on the calcification rate of an experimental coral reef. Global Bio-
geochem. Cy., 14, 639-654.
Larned, S.T., M.R. Scarsbrook, T.H. Snelder, N.J. Norton and B.J.F. Biggs, 2004:
Water quality in low-elevation streams and rivers of New Zealand: recent state
and trends in contrasting land-cover classes. New Zeal. J. Mar. Fresh., 38, 347-
366.Lavorel,S. andW. Steffen, 2004: Cascading impacts of landuse through time: the
Canberra bushfire disaster. Global Change and the Earth System: A Planet
Under Pressure, W. Steffen, A. Sanderson, P.D. Tyson, J. Jäger, P.A. Matson, B.
Moore III, F. Oldfield, K. Richardson, H.J. Schellnhuber, B.L.Turner II and R.J.
Wasson, Eds., IGBP Global Change Series. Springer-Verlag, Berlin, 186-188.
Lehodey, P., M. Mertignac, J. Hampton, A. Lewis and J. Picaut, 1997: El Niño
Southern Oscillation and tuna in the Western Pacific. Nature, 389, 715-718.
Leslie, L.M. andD.J. Karoly, 2007: Variability of tropical cyclones over the south-
west Pacific Ocean using a high-resolution climate model. Meteorol. Atmos.
Phys., doi:10.1007/s00703-006-0250-3.
Lewis, D., 2002: Slower Than the Eye Can See: Environmental Change in North-
ern Australia’s Cattle Lands, A Case Study from the Victoria River District,
Northern Territory. Tropical Savannas CRC, Darwin, Northern Territory.
http://savanna.ntu.edu.au/publications/landscape_change.html.
Lilley, J.M., T.P. Bolger, M.B. Peoples andR.M. Gifford, 2001:Nutritive value andthe dynamics of Trifolium subterrraneum and Phalaris aquatica under warmer,
high CO2 conditions. New Phytol., 150, 385-395.
Lincoln Environmental, 2000: Information on water allocation in New Zealand.
Report No 4375/1, Prepared for Ministry for the Environment by Lincoln Ven-
tures, Canterbury, 190 pp. http://www.mfe.govt.nz/publications/water/water-al-
location-apr00.pdf.
Lough, J.M., 2000: 1997-98: Unprecedented thermal stress to coral reefs? Geo-
phys. Res. Lett., 27, 3901-3904.
Lowy Institute, 2006: Public Opinion on Foreign Policy in the Asia-Pacific.
Chicago Council on Global Affairs in partnership with Asia Society and in as-
sociation with East Asia Institute and Lowy Institute for International Policy,
91 pp. http://www.lowyinstitute.org/Publication.asp?pid=483.
Luo, Q., M.A.J. Williams, W. Bellotti and B. Bryan, 2003: Quantitative and visual
assessments of climate change impacts on South Australian wheat production.
Agr. Syst., 77, 173-186.Lyne, V.D., 2000: Development, evaluation and application of remotely sensed
ocean colour data by Australian fisheries. Final Report for 1994/045, Fisheries
Research and Development Corporation, Canberra, 88 pp.
http://www.frdc.com.au/.
Maddison, D., 2001: In searchof warmerclimates? The impactof climate change
on flows of British tourists. Climatic Change, 49, 193-208.
MAF, 1999: 1999 Post-election brief: the agriculture, horticultural and forestry
sectors. http://www.maf.govt.nz/mafnet/publications/1999-post-election-
brief/pstelbrf99-05.htm.
MAF, 2001: A national exotic forest description. Ministry of Agriculture and
Forestry, 63 pp. http://www.maf.govt.nz/statistics/primaryindustries /forestry/for-
est-resources/national-exotic-forest-2001/nefd-2001.pdf.
MAF, 2006: Howclimate changeis likely to affect agriculture andforestry in New
Zealand. Ministry of Agriculture and Forestry. http://www.maf.govt.nz/
mafnet/rural-nz/sustainable-resource-use/climate/index.htm.
Maunder, M.N. and B.M. Watters, 2003:A general framework for integrating en-
vironmental time series into stock assessment models: model description, sim-
ulation testing, and example. Fish. B.–NOAA, 101, 89-99.
MCDEM, 2004: Review of the February 2004 flood event. Review Team Report.
Director of Civil Defence and Emergency Management, Wellington, 93 pp.
http://www.civildefence.govt.nz/memwebsite.nsf/Files/FINAL_review_of_the_
February_2004_floods/$file/FINAL_review_of_the_February_2004_floods.pdf.
McGlone, M.S., 2001: Linkagesbetweenclimate change and biodiversity in New
Zealand.Landcare ResearchContract Report LC0102/014, Ministry for the En-
vironment, Wellington, 36 pp. http://www.mfe.govt.nz/publications/climate/bio-
diversity-sep01/biodiversity-sep01.pdf.
McInnes, K.L., R. Suppiah, P.H. Whetton, K.J. Hennessy and R.N. Jones, 2002:
Climate change in SouthAustralia. Report on assessment of climate change, im-
pacts and possible adaptation strategies relevant to South Australia, CSIRO At-
mospheric Research, Aspendale, 61 pp. http://www.cmar.csiro.au /e-print /open/
mcinnes_2003a.pdf.
McInnes, K.L., K.J.E.Walsh, G.D. Hubbert andT. Beer, 2003: Impact of sea-level
rise and storm surges on a coastal community. Nat. Hazards, 30, 187-207.
McIntosh, A.J., 2004: Tourists’ appreciation of Maori culture in New Zealand.
Tourism Manage., 25, 1-15.
McKerchar, A.I. and R.D.Henderson, 2003: Shifts in flood and low-flowregimes
in New Zealand due to inter-decadal climate variations. Hydrolog. Sci. J., 48,
637-654.
McMichael, A., R. Woodruff, P. Whetton, K. Hennessy, N. Nicholls, S. Hales, A.Woodward and T. Kjellstrom, 2003: Human Health and Climate Change in
Oceania: A Risk Assessment 2002. Commonwealth Department of Health and
Ageing, 126 pp. http://www.health.gov.au/internet/wcms/Publishing.nsf/Con-
tent/health-pubhlth-publicat-document-metadata-env_climate.htm.
McMichael, A.J., R.E. Woodruff and S. Hales, 2006: Climate change and human
health: present and future risks. Lancet , 367, 859-869.
MDBC, 2006: Basin Statistics. Murray-Darling Basin Commission.
http://www.mdbc.gov.au/about/basin_statistics.
MDBMC, 1999: The Salinity Audit of the Murray-Darling Basin. Murray-Dar-
ling Basin Ministerial Council, 48 pp. http://www.mdbc.gov.au/salinity/
salinity_audit_1999.
Meehl, G.A., T.F. Stocker, W.D. Collins, P. Friedlingstein, A.T. Gaye, J.M. Gre-
gory, A. Kitoh, R. Knutti, J.M. Murphy, A. Noda, S.C.B. Raper, I.G. Watterson,
A.J.Weaver and Z.-C. Zhao, 2007: Global climate projections. Climate Change
2007: The Physical Science Basis, Contribution of: Working Group I to theFourth Assessment Report of the Intergovernmental Panel on Climate Change.
S. Solomon, D. Qin, M. Manning, Z. Chen, M. Marquis, K.B.Averyt, M. Tignor
and H.L. Miller, Eds., Cambridge University Press, Cambridge, 747-846.
Melbourne Water, 2006: Eastern Treatment plant: treating sewage from Mel-
bourne’s south-eastern and eastern suburbs. http://www.melbournewater
.com.au/content/sewerage/eastern_treatment_plant/eastern_treatment_plant.asp?
bhcp=1.
MFAT, 2006: A joint study investigating the benefits of a closer economic part-
nership (CEP) agreement between Thailand and New Zealand: overview of the
Thailand and New Zealand economies. http://www.mfat.govt.nz/foreign
/tnd/ceps/nzthaicep/thainzeconomies.html.
MfE, 2001: Climatechange impactson NewZealand. Report prepared by theMin-
istry for the Environment as part of the New Zealand Climate Change Pro-
gramme, Ministry for the Environment, Wellington, 39 pp.
http://www.climatechange.govt.nz/resources/reports/impacts-report/impacts-report-jun01.pd.
MfE, 2002: Adapting to the impacts of climate change: what role for local gov-
ernment? Proceedings of a Workshop Organised by the Ministry for the Envi-
ronment as Part of the New Zealand Climate Change Programme, 31 pp.
http://www.lgnz.co.nz/library/files/store_001/impacts-of-climate-change.pdf.
MfE, 2003: Climate change case study. Local government adaptation to climate
change: Environment Bay of Plenty andcoastal hazards: “Issues, barriers andso-
lutions”. Prepared for the NZ Climate Change Office (Ministry for the Envi-
ronment) by Lawrence Cross andChapman and the International Global Change
Institute, in conjunction with Environment Bay of Plenty, Tauranga District
Council and Western Bay of Plenty District Council, 13 pp.
http://www.mfe.govt.nz/publications/climate/ebop-coastal-hazards-jul03/ebop-
coastal-hazards-jul03.pdf.
MfE, 2004a: Coastal Hazards andClimate Change: A Guidance Manualfor Local
Government in New Zealand. Ministry for the Environment, 13 pp.
http://www.mfe.govt.nz/publications/climate/ebop-coastal-hazards-jul03/ebop-
coastal-hazards-jul03.pdf.
MfE, 2004b: Workshop summary report. International Workshop on Adaptation
Practices andStrategies in Developed Countries, 11-13 October 2004, Welling-
ton, A. Reisinger and H. Larsen, Eds., New Zealand Climate Change Office,
NZCCO of the Ministry for the Environment. http://www.mfe.govt.nz/issues/
climate/resources/workshops/preparing-climate-change/index.html.
MfE, 2004c: Preparing for Climate Change: A Guide for Local Government in
New Zealand. New Zealand Climate Change Office, Ministry for Environment,
Wellington, 37 pp.. http://www.mfe.govt.nz/publications/climate/preparing-for-
climate-change-jul04/index.html
Miller, M.G. andA. Veltman, 2004: Proposed Canterbury Natural Resources Plan
for river and groundwater allocation policies and the implications for irrigation
Australia and New Zealand Chapt
536

8/3/2019 Chapter 11 - Australia and New Zealand
http://slidepdf.com/reader/full/chapter-11-australia-and-new-zealand 31/34
dependent farming in Canterbury. Proceedings of the New Zealand Grassland
Association, 66, 11-23.
Mimura, N., 2006: State of the environment in Asia and Pacific coastal zones.
Global Change and Integrated Coastal Management: The Asia Pacific Region,
N. Harvey, Ed., Springer, 339 pp.
Ministry of Fisheries Science Group, 2006: Report from the Fishery Assessment
Plenary, May 2006: stock assessment and yield estimates. Report held in NIWA
Library, Wellington, 875 pp.
Moore, J.L., S.M. Howden, G.M. McKeon, J.O. Carter and J.C. Scanlan, 2001:
The dynamics of grazed woodlands in southwest Queensland,Australiaand their
effect on greenhouse gas emissions. Environ. Int., 27, 147-153.Mpelasoka, F., K.J. Hennessy, R. Jones and J. Bathols, 2007: Comparison of suit-
able drought indices for climate change impacts assessment over Australia to-
wards resource management. Int. J. Climatol., accepted.
Mullan,A.B., 1995: On the linearityand stabilityof Southern Oscillation–climate
relationships for New Zealand. Int. J. Climatol., 15, 1356-1386.
Mullan, A.B., M.J. Salinger, C.S. Thompson and A.S. Porteous, 2001: The New
Zealand climate: present and future. The Effects of Climate Change and Varia-
tion in New Zealand: An Assessment using the CLIMPACTS System, R.A. War-
rick, G.J. Kenny and J.J. Harman, Eds., International Global Change Institute
(IGCI), University of Waikato, Hamilton, 11-31. http://www.waikato.ac.nz/igci/
climpacts/Linked%20documents/Chapter_2.pdf.
Mullan, A.B., A. Porteous, D. Wratt and M. Hollis, 2005a: Changes in drought
risk with climate change. NIWA Report WLG2005-23, 58 pp. http://www.cli-
matechange.govt.nz/resources/reports/drought-risk-may05/drought-risk-climate-
change-may05.pdf.Mullan, A.B., J. Salinger, D. Ramsay and M. Wild, 2005b: Chatham Islands Cli-
mate Change. NIWA Report WLG2005-35, 42 pp. http://www.climate-
change.govt.nz/resources/reports/chatham-islands-climate-change-jun05/
chatham-islands-climate-change-jun05.pdf.
Mulrennan, M., 1992: Coastal management: challenges and changes in the Torres
Strait islands. Australian National University, North Australia Research Unit,
Discussion Paper 5, 40 pp.
Nakićenović, N. and R. Swart, Eds., 2000: Special Report on Emissions Scenar-
ios: A Special Report of Working Group III of the Intergovernmental Panel on
Climate Change. Cambridge University Press, Cambridge, 599 pp.
Namjou, P., G. Strayton, A. Pattle, M.D. Davis, P. Kinley, P. Cowpertwait, M.J.
Salinger,A.B. Mullan,G. Paterson and B. Sharman, 2005: The integrated catch-
ment study ofAuckland City (NewZealand): long-term groundwater behaviour
and assessment. EWRI Conference, 13.
NEMMCO, 2006: 2006 Statement of Opportunities. National Electricity MarketManagement Company. http://www.nemmco.com.au/nemgeneral/040-
0042.htm.
Niall, S. andK. Walsh, 2005: The impact of climate changeon hailstorms in south-
eastern Australia. Int. J. Climatol., 25, 1933-1952.
Nicholls, N.,2004: The changing nature ofAustraliandroughts. Climatic Change,
63, 323-336.
Nicholls, N., 2005: Climate variability, climate change and the Australian snow
season. Aust. Meteorol. Mag., 54, 177-185.
Nicholls, N., 2006: Detecting and attributingAustralian climate change: a review.
Aust. Meteorol. Mag., 55, 199-211.
Nicholls, N. and D. Collins, 2006: Observed change inAustralia over the pastcen-
tury. Energy and Environment , 17, 1-12.
Nicholls, N., C.D. Butler and I. Hanigan, 2006: Inter-annual rainfall variations
and suicide in New South Wales, Australia, 1964-2001. Int. J. Biometeorol., 50,
139-143.
NIWA, 2005: Past Climate Variations over New Zealand. National Institute of
Water and Atmospheric Research, Wellington. http://www.niwascience.co.nz
/ncc/clivar/pastclimate#y140.
NIWA, 2006: Proceedings of the Second Maori Climate Forum, 24 May 2006 ,
Hongoeka Marae, Plimmerton. http://www.niwascience.co.nz/ncc/maori/2006-
05/.
NLWRA, 2001: Australian Water Resources Assessment 2000. National Land and
Water Resources Audit, Land and Water Australia. http://www.nlwra.gov.au/.
NRMMC, 2006: National Agriculture and Climate Change Action Plan 2006-
2009. National resource management Ministerial Council, 20 pp.
http://www.daffa.gov.au/__data/assets/pdf_file/33981/nat_ag_clim_chang_
action_plan2006.pdf.
NZIER, 2003: Maori Economic Development: Te Ohanga Whakaketanga Maori.
New Zealand Institute of Economic Research, Wellington. http://www
nzier.org.nz/.
NZIER, 2004: Economic impacts on New Zealand of climate change-related ex-
treme events: focus on freshwaterfloods. Report to Climate ChangeOffice, New
Zealand Institute of Economic Research, Wellington, 73 pp. http://www.climat-
echange.govt.nz/resources/reports/economic-impacts-extreme-events-
jul04/economic-impacts-extreme-events-jul04.pdf.
O’Connell, M. and R. Hargreaves, 2004: Climate change adaptation. guidance on
adapting New Zealand’s built environment for the impacts of climate change.
BRANZ Study Report No. 130, 44 pp. http://www.branz.co.nz/branzltd/publi-
cations/pdfs/SR130.pdf.O’Hara, T.D., 2002: Endemism, rarity and vulnerability of marine species along
a temperate coastline. Invertebr. Syst., 16, 671-679.
Orlove, B., 2003: How People Name Seasons, S. Strauss and B. Orlove, Eds., Berg
Publishers, Oxford, 121-141.
Orr, J.C., V.J. Fabry, O. Aumont, L. Bopp, S.C. Doney, R.A. Feely, A. Gnanade
sikan, N. Gruber, A. Ishida, F. Joos, R.M. Key, K. Lindsay, E. Maier-Reimer
R.J.Matear, P. Monfray, A. Mouchet, R.G.Najjar, G.-K. Plattner, K.B.Rodgers
C.L. Sabine, J.L. Sarmiento,S. R, R.D. Slater, I.J. Totterdell,M.-F. Weirig,Y. Ya
manaka and A. Yool, 2005:Anthropogenic ocean acidification over the twenty
first century and its impact on calcifying organisms. Nature, 437, 681-686.
Owens, I.F. and B.B. Fitzharris, 2004: Seasonal snow and water. Waters of New
Zealand , M.P. Mosley, C. Pearson and B. Sorrell, Eds., New Zealand Hydro-
logical Society and New Zealand Limnological Society, 5.1-5.12.
Packman, D.,D. Ponter andT. Tutua-Nathan, 2001: Maori issues. Climate Change
Working Paper, New Zealand Climate Change Office, Ministry for the Envi-ronment, Wellington, 18 pp. http://www.climatechange.govt.nz/resources/.
Parliament of Australia, 2003: Regulatingthe Ranger, Jabiluka, Beverly andHon
eymoon Uranium Mines. Parliament of Australia, Committee Address: Envi-
ronment, Communications, Information Technology and the Arts Legislation
Committee S1, Canberra, ACT. http://www.aph.gov.au/senate/ committee/ecita_
ctte/completed_inquiries/2002-04/uranium/report/index.htm.
PB Associates, 2007: Assessment of the vulnerability of Australia’s energy infra
structure to the impacts of climate change. Issues Paper, 158292A-REP-002.doc
78 pp., in press.
Pearce, G.,A.B. Mullan, M.J. Salinger, T.W. Opperman, D. Woods and J.R. Moore
2005: Impact of climate variability and change on long-term fire danger. Repor
to the New Zealand Fire Service Commission, 75 pp. http://www.fire.org.nz
research/reports/reports/Report_50.pdf.
PIA, 2004: Sustainable regional and urban communities adapting to climate
change. Issues Paper, Planning Institute ofAustralia Queensland Division, Bris-bane, 88 pp. http://www.greenhouse.sa.gov.au/PDFs/issuespaperjune_21.pdf.
Pickering, C., R. Good and K. Green, 2004: Potential effects of global warming
on the biota of the AustralianAlps. Report to the Australian Greenhouse Office
Canberra, 51 pp. http://www.greenhouse.gov.au/impacts/publications/ alps.html
Pittock, B., 2003: Climate Change: An Australian Guide to the Science and Po-
tential of Impacts. Department for the Environment and Heritage, Australian
Greenhouse Office, Canberra, ACT, 250 pp. http://www.greenhouse. gov.au/sci
ence/guide/index.html.
Pittock, B. andD. Wratt,2001:Australia andNew Zealand. Climate Change 2001
Impacts, Adaptation, and Vulnerability. Contribution of Working Group II to the
Third Assessment Report of the Intergovernmental Panel on Climate Change
J.J. McCarthy, O.F. Canziani, N.A. Leary, D.J. Dokken and K.S. White, Eds.,
Cambridge University Press, Cambridge, 591-639.
Poloczanska, E.S., R.C. Babcock, A. Butler, A.J. Hobday, O. Hoegh-Guldberg
T.J. Kunz, R. Matear, D. Milton, T.A. Okey and A.J. Richardson, 2007: Climate
change and Australian marine life. Oceanography and Marine Biology: An An-
nual Review, Volume 45, R.N. Gibson, R.J.A.Atkinson andJ.D.M. Gordon, Eds.
CRC Press, Cleveland, 544 pp.
Power, S., F. Tseitkin, S. Torok, B. Lavery, R. Dahni and B. McAvaney, 1998:
Australian temperature, Australian rainfall and the Southern Oscillation, 1910
1992: coherent variabilityand recent changes. Aust. Meteorol. Mag., 47, 85-101
Power, S., T. Casey, C. Folland, C. A. and V. Mehta, 1999: Inter-decadal modula
tion of the impact of ENSO on Australia. Clim. Dynam., 15, 319-324.
Premier of Victoria, 2006: Ballarat’s futurewater supplies secured by major Brack
government action plan. Media release, 17 October 2006. http://www
premier.vic.gov.au/newsroom/news_item.asp?id=978.
Preston, B., R. Suppiah, I. Macadam and J. Bathols, 2006: Climate change in the
Asia/Pacific region. Consultancy Report prepared for the Climate Change and
Chapter 11 Australia and New Zealand
537
8/3/2019 Chapter 11 - Australia and New Zealand
http://slidepdf.com/reader/full/chapter-11-australia-and-new-zealand 32/34
Development Roundtable, CSIRO Marine and Atmospheric Research, As-
pendale, 92 pp. http://www.csiro.au/csiro/content/file/pfkd.html.
Puotinen, M.L., 2006: Modelling the risk of cyclone wave damage to coral reefs
using GIS: a case study of the Great Barrier Reef, 1969-2003. Int. J. Geogr. Inf.
Sci., 21, 97-120.
QDLGP, 2003: Queensland’s Future Population. Queensland Department of Local
Government and Planning (Medium Series). http://www.lgp.qld.gov.au/
?id=1216.
Queensland Government, 2005: Queensland Water Plan 2005-2010. Queensland
Government, 27 pp. http://www.nrw.qld.gov.au/water/pdf/qld_water_plan_
05_10.pdf.Queensland Government, 2006: TC Larry Report, 28 March 2006. http://www.dis-
aster.qld.gov.au/news/view.asp?id=1323.
QVL, 2006: Residential Property:Price Movement. Quotable Value Limited.
http://www.qv.co.nz/onlinereports/marketstatistics/.
Ranasinghe, R., R. McLoughlin, A.D. Short and G. Symonds, 2004: The Southern
Oscillation Index, wave climate, and beach rotation. Mar. Geol., 204, 273-287.
Raven, J., K. Caldeira, H. Elderfield, O. Hoegh-Guldberg, P. Liss, U. Riebesell, J.
Shepherd, C. Turley andA. Watson, 2005: Ocean acidification due to increasing
carbon dioxide. Report to the Royal Society, London, 68 pp. http://www.royal-
soc.ac.uk/displaypagedoc.asp?id=13539.
Renwick, J.A., R.J. Hurst and J.W. Kidson, 1998: Climatic influences on the re-
cruitment of southern gemfish ( Rexea solandri, Gempylidae) in New Zealand
waters. Int. J. Climatol., 18, 1655-1667.
Reyenga, P.J., S.M. Howden, H. Meinke and W.B. Hall, 2001: Global change im-
pacts on wheat production along an environmental gradient in South Australia. Environ. Int., 27, 195-200.
Richardson, A.C., K.B. Marsh, H.L. Boldingh, A.H. Pickering, S.M. Bulley, N.J.
Frearson, A.R. Ferguson, S.E. Thornber, K.M. Bolitho and E.A. Macrae, 2004:
High growing temperatures reduce fruit carbohydrate and vitamin C in fruit.
Plant Cell Environ., 27, 423-435.
Richardson, A.J. and D.S. Schoeman, 2004: Climate impact on plankton ecosys-
tems in the North-East Atlantic. Science, 305, 1609-1612.
Richardson, S.J., R.B.Allen, D. Whitehead, F.E. Carswell, W.A. Ruscoe and K.H.
Platt, 2005: Climate and net carbon availability determine temporal patterns of
seed productivity by Nothofagus. Ecology, 86, 972-981.
Ring, T. andN. Brown,2002: Indigenous health: chronically inadequateresponses
to damning statistics. Med. J. Australia, 177, 629-631.
Robb, C. and J. Bright, 2004: Values and uses of water. Freshwaters of New
Zealand , J.S. Harding, M.P. Mosley, C.P. Pearson and B.K. Sorrell, Eds., New
Zealand Hydrological Society and New Zealand Limnological Society, CaxtonPress, Christchurch, 42.1-42.14.
Roderick, M.L. and G.D. Farquhar, 2004: Changes in Australian pan evaporation
from 1970 to 2002. Int. J. Climatol., 24, 1077-1090.
Roderick, M.L. and G.D. Farquhar, 2005: Changes in New Zealand pan evapora-
tion since the 1970s. Int. J. Climatol., 25, 2031-2039.
Rose, D., 1996: Nourishing Terrains: Australian Aboriginal Views of Landscape
and Wilderness. Australian Heritage Commission, Canberra, 95 pp.
http://www.ahc.gov.au/publications/generalpubs/nourishing/index.html.
RSNZ, 2002: New Zealand Climate Committee: Terms of Reference. Royal Soci-
ety of New Zealand, New Zealand Climate Committee. http://www.rsnz.org/
advisory/nz_climate/terms.php/.
Salinger, M.J., 1990: Climate change and the electricity industry. New Zealand
Meteorological Service Report, 59 pp.
Salinger,M.J. andA.B. Mullan,1999: New Zealand climate: temperatureand pre-
cipitation variations and their links withatmospheric circulation 1930-1994. Int.
J. Climatol., 19, 1049-1071.
Salinger, M.J. and G.M. Griffiths,2001:Trends in New Zealand daily temperature
and rainfall extremes. Int. J. Climatol., 21, 1437-1452.
Salinger, M.J., W.M.Williams, J.M.Williams and R.J. Martin, 1990: Agricultural
resources. Climate Change: Impacts on New Zealand . Ministry for the Envi-
ronment, Wellington, 108-132.
Salinger, M.J., W. Gray, B. Mullan and D. Wratt, 2004: Atmospheric circulation
and precipitation. Freshwaters of New Zealand , J. Harding, P. Mosley, C. Pear-
son and B. Sorrell, Eds., Caxton Press, Christchurch, 2.1-2.18.
Salinger, M.J., G.M. Griffiths and A. Gosai, 2005a: Extreme daily pressure dif-
ferences and winds across New Zealand. Int. J. Climatol., 25, 1301-1330.
Salinger, M.J., M.V.K. Sivakumar and R. Motha, 2005b: Reducing vulnerability
of agriculture and forestry to climate variability andchange: workshop summary
and recommendations. Climatic Change, 70, 341-362.
Scanlan, J.C., D.M. Bermanand W.E.Grant, 2006: Population dynamics of theEu-
ropean rabbit (Oryctolagus cuniculus) in north eastern Australia: simulated re-
sponses to control. Ecol. Model., 196, 221-236.
Schallenberg, M., C.J. Hall and C.W. Burns, 2003: Consequences of climate-in-
duced salinity increases on zooplankton abundance anddiversityin coastallakes.
Mar. Ecol.-Prog. Ser., 251, 181-189.
Schuster, S.S., R.J. Blong, R.J. Leigh and K.J. McAneney, 2005: Characteristics
of the 14 April 1999 Sydney hailstorm based on ground observations, weather
radar, insurance data and emergency calls. Nat. Hazard. Earth Sys., 5, 613-620.
Scott, D., G. McBoyle and M. Schwartzentruber, 2004: Climate change and thedistribution of climaticresources fortourism in NorthAmerica. Climate Res., 27,
105-117.
Seafood Industry Council, 2006: New Zealand’s Seafood Business.
http://www.seafood.co.nz/sc-business/.
Sharples, C., 2004: Indicative mapping of Tasmania’s coastal vulnerability to cli-
mate change and sea-level rise. Explanatory Report, Tasmanian Department of
Primary Industries, Water and Environment, Hobart, 126 pp.
http://www.dpiw.tas.gov.au/inter.nsf/Publications/PMAS-6B59RQ?open.
Shaw, H., A. Reisinger, H. Larsen and C. Stumbles, 2005: Incorporating climate
change intostormwaterdesign: whyand how? Proceedings of the 4th South Pa-
cific Conference on Stormwater and Aquatic Resource Protection, May 2005,
Auckland, 18 pp. http://www.climatechange.govt.nz/resources/local-
govt/stormwater-design-mar05/stormwater-design-mar05.pdf.
Sims, D.W., M.J. Genner, A.J. Southward andS.J. Hawkins, 2001: Timingof squid
migration reflects North Atlantic climate variability. P. Roy. Soc. Lond. B, 2607-2611.
Sinclair,T.R., P.J. Pinter Jr,B.A. Kimball, F.J.Adamsen, R.L. LaMorte, G.W. Wall,
D.J. Hunsaker, N. Adam, T.J. Brooks, R.L. Garcia, T. Thompson, S. Leavitt and
A. Matthias, 2000: Leaf nitrogen concentration of wheat subjected to elevated
[CO2] and either water or N deficits. Agr. Ecosyst. Environ., 79, 53-60.
Smith, B.R., 2004a: Some natural resource management issues for Indigenous
people in northern Australia. Arafura Timor Research Facility Forum, ANU In-
stitute for Environment, The National Australia University.
http://www.anu.edu.au/anuie/.
Smith, I.N., 2004b: Trends in Australian rainfall: are they unusual? Aust. Meteo-
rol. Mag., 53, 163-173.
Smith, P.J., 1979: Esterase gene frequencies and temperature relationships in the
New Zealand snapper Chryophrys auratus. Mar. Biol., 53/4, 305-310.
Smithers, B.V., D.R. Peck, A.K. Krockenberger and B.C. Congdon, 2003: Ele-
vated sea-surface temperature, reducedprovisioning and reproductive failure of wedge-tailed shearwaters (Puffinus pacificus) in the Southern Great Barrier Reef,
Australia. Mar. Freshwater Res., 54, 973-977.
SOE, 2001: Australia State of the Environment 2001: Independent Report to the
Commonwealth Minister for the Environment and Heritage. Australian State of
the Environment Committee, CSIRO Publishing on behalf of the Department of
the Environment and Heritage, 129 pp. http:/www.ea.gov.au/soe/2001.
Sorensen, I., P. Stone and B. Rogers, 2000: Effect of time of sowing on yield of a
short and a long-season maize hybrid. Agronomy New Zealand , 30, 63-66.
Statistics New Zealand, 2005a: Demographic Trends. Statistics New Zealand, New
Zealand Government. http://www.stats.govt.nz/products-and-services/referen
ce-reports/demographic-trends.htm.
Statistics New Zealand, 2005b: National Population Projections 2004-2051. Sta-
tistics New Zealand, New Zealand Government. http://www.stats.govt.nz
/datasets/population/population-projections.htm.
Statistics New Zealand, 2006: QuickStats About New Zealand‘s Population and
Dwellings 2006 Census. Statistics New Zealand, 11 pp. http://www.stats.
govt.nz/NR/rdonlyres/CCA37BF2-2E49-44D4-82AB-35538608DEFD
/0/2006censusquickstatsaboutnzspopanddwellings.pdf.
Steffen, W., G. Love and P.H. Whetton, 2006: Approaches to defining dangerous
climate change: an Australian perspective. Avoiding Dangerous Climate Change,
H.J. Schellnhuber, W. Cramer, N. Nakićenović, T. Wigley and G. Yohe, Eds.,
Cambridge University Press, Cambridge, 392 pp.
Stephens,A.E.A., D.J. Kriticos and A. Leriche, 2007: The current and future dis-
tribution of the oriental fruit fly, Bactrocera dorsalis (Diptera: Tephritidae). B.
Entomol. Res., in press.
Stokes, C. and A. Ash, 2006: Impacts of climate change on marginal tropical pro-
duction systems. Agroecosystems in a Changing Climate, P. Newton, A. Carran
and G. Edwards, Eds., Taylor and Francis, Florida, 181-188.
Australia and New Zealand Chapt
538
8/3/2019 Chapter 11 - Australia and New Zealand
http://slidepdf.com/reader/full/chapter-11-australia-and-new-zealand 33/34
Suppiah, R., K.J. Hennessy, P.H.Whetton,K. McInnes, I. Macadam, J. Bathols and
J. Ricketts, 2007: Australian climate change projections derived from simula-
tions performed for the IPCC 4th Assessment Report. Aust. Meteorol. Mag., ac-
cepted.
Sutherst, R.W., 2004: Global change and human vulnerability to vector-borne dis-
eases. Clin. Microbiol. Rev., 17, 136-173.
Sutherst, R.W., B.S. Collyer and T. Yonow, 2000: The vulnerability of Australian
horticulture to the Queensland fruit fly, Bactrocera (Dacus) tryoni, under cli-
mate change. Aust. J. Agr. Res., 51, 467-480.
Tapper, N., 2000: Atmospheric issues for fire managementin Eastern Indonesia and
northern Australia. Proceedings of an International Workshop: Fire and Sustain-able Agricultural and Forestry Development in Eastern Indonesia and Northern
Australia, J. Russell-Smith, G. Hill, S. Djoeroemana and B. Myers, Eds., North-
ern Territory University, Darwin, 20-21. http://www.arts. monash.edu.au/ges
/who/pdf/Atmospheric%20Issues%20for%20Fire% 20Management.pdf.
Taylor, P.R., 2002: Stock structure and population biology of the Peruvian jack
mackerel, Trachurus symmetricus murphyi. Report 2002/21, New Zealand Fish-
eries Assessment, 79 pp.
Thresher, R.E., 1994: Climatic cycles may helpexplain fishrecruitmentin South-
East Australia. Australian Fisheries, 53, 20-22.
Thresher, R.E., 2002: Solar correlates of Southern Hemisphere climate variability.
Int. J. Climatol., 22, 901-915.
Thresher, R.E., B.D. Bruce, D.M. Furnali and J.S. Gunn, 1989: Distribution, ad-
vection, and growth of larvae of the southern temperate gadoid, Macruronus no-
vaezelandiae (Teleostei: Merlucciidae), in Australian coastal waters. Fish.
B.–NOAA, 87, 29-48.Thresher, R.E., P.D. Nichols,J.S. Gunn, B.D.Bruce and D.M. Furlani, 1992: Sea-
grass detritusas the basis of a coastal planktonic food-chain. Limnol. Oceanogr.,
37, 1754-1758.
Torok, S.J., C.J.G. Morris, C. Skinner and N. Plummer, 2001: Urban heat island
features of southeast Australian towns. Aust. Meteorol. Mag., 50, 1-13.
TPK, 2001: Te Maori I NgaRohe: Maori Regional Diversity. Te Puni Kokiri,Min-
istry of Maori Development, Wellington, 168 pp. http://www.tpk.govt.nz/
publications/docs/MRD_full.pdf.
Tweedie, C.E. and D.M. Bergstrom, 2000: A climate change scenario for surface
air temperature at sub-Antarctic Macquarie Island. Antarctic Ecosystems: Mod-
els for Wider Ecological Understanding, W. Davison, C. Howard-Williams and
P.A. Broady, Eds., New Zealand Natural Sciences, Christchurch, 272-281.
Umina, P.A., A.R. Weeks, M.R. Kearney, S.W. McKechnie and A.A. Hoffmann,
2005: A rapid shift in a classic clinal pattern in Drosophila reflecting climate
change. Science, 308, 691-693.UNEP-WCMC, 2006: In the front line: shoreline protection and other ecosystem
services from mangroves and coral reefs. United Nations Environment Pro-
gramme: World Conservation Monitoring Centre, Cambridge, 36 pp.
http://www.unep.org/pdf/infrontline_06.pdf.
URS, 2004: Climate change and infrastructure design case study: Wairau Catch-
ment, North Shore City. Prepared for North Shore City Council, August 2004,
26 pp. http://www.climatechange.govt.nz/resources/local-govt/case-study-
wairau-catchment-aug04/case-study-wairau-catchment-aug04.pdf.
van Ittersum, M.K., S.M. Howden and S. Asseng, 2003: Sensitivity of productiv-
ity anddeep drainage of wheat cropping systems in a Mediterranean environment
to changes in CO2, temperature and precipitation. Agr. Ecosyst. Environ., 97,
255-273.
Vic DSE, 2006: Wimmera Mallee Pipeline. Department of Sustainability and En-
vironment, Victoria. http://www.dse.vic.gov.au/DSE/wcmn202.nsf/LinkView
/77BBB217C2024716CA256FE2001F7B2460A84DA0F2283EA4CA256FDD
00136E35.
Viney, N.R., B.C. Bates, S.P. Charles, I.T. Webster, M. Bormans and S.K. Aryal,
2003: Impacts of climate variability on riverine algal blooms. Proceedings of
the International Congress on Modelling andSimulation, MODSIM 2003 14-17
July, Modelling and Simulation Society of Australia and New Zealand, 23-28.
http://mssanz.org.au/modsim03/Media/Articles/Vol%201%20Articles/23-
28.pdf.
Voice, M., N. Harvey and K. Walsh, Eds., 2006: Vulnerability to Climate Change
of Australia’s Coastal Zone: Analysis of Gaps in Methods, Data and System
Thresholds. Report to the Australian Greenhouse Office, Department of the En-
vironment and Heritage, Canberra, 120 pp. http://www.greenhouse.gov.au/im-
pacts/publications/pubs/coastal-vulnerability.pdf
WA Water Corporation, 2004: Perth Seawater Desalination Project.
http://www.watercorporation.com.au/D/desalination_environment.cfm.
Walsh, K., 2002: Climate change and coastal response. A Theme Report from the
Coast to Coast 2002 National Conference, November, 2002. Coastal CRC, Gold
Coast, Queensland, 37 pp. http://www.coastal.crc.org.au/pdf/coast2coas
2002papers/climate.pdf.
Walsh, K., K. Hennessy, R. Jones, K.L. McInnes, C.M. Page,A.B. Pittock, R. Sup-
piah and P. Whetton, 2001: Climate Change in Queensland Under Enhanced
Greenhouse Conditions: ThirdAnnual Report, 1999-2000. CSIRO Consultancy
Report for the Queensland Government, Aspendale, 108 pp
http://www.cmar.csiro.au/e-print/open/walsh_2001a.pdf.
Walsh, K.J.E., K.C. Nguyen and J.L. McGregor, 2004: Finer-resolution regionaclimate model simulations of the impact of climate change on tropical cyclone
near Australia. Clim. Dynam., 22, 47-56.
Warrick, R.A., 2000: Strategies for vulnerability and adaptation assessment in the
context of national communications. Asia-Pacific Journal for Environmenta
Development , 7, 43-51.
Warrick,R.A., 2006: Climate change impacts and adaptation in the Pacific: recen
breakthroughs in concept and practice. Confronting Climate Change: Critica
Issues for New Zealand , R. Chapman, J. Boston and M. Schwass, Eds., Victoria
University Press, Wellington, 189-196.
Warrick, R.A., G.J. Kenny and J.J. Harman, Eds., 2001: The Effects of Climate
Change and Variation in New Zealand: An Assessment using the CLIMPACTS
System. International Global Change Institute (IGCI), University of Waikato
Hamilton. http://www.waikato.ac.nz/igci/climpacts/Assessment.htm.
Wasson, R.J., I. White, B. Mackey and M. Fleming, 1988: The Jabiluka project:
environmental issues that threaten Kakadu National Park. Submission to UN-ESCO World Heritage Committee delegation to Australia, 22 pp
http://www.deh.gov.au/ssd/uranium-mining/arr-mines/jabiluka/pubs/appn2o
main.pdf.
Water Corporation, 2006: Planning for New Sources of Water. West Australian
Water Corporation. http://www.watercorporation.com.au/W/water_source
_new.cfm.
Watson, R. and A. McMichael, 2001: Global climate change – the latest assess-
ment: does global warming warrant a health warning? Global Change and
Human Health, 2, 64-75.
Watters, G.M., R.J. Olson, R.C. Francis, P.C. Fiedler, J.J. Polovina, S.B. Reilly
K.Y. Aydin, C.H. Boggs, T.E. Essington, C.J. Walters and J.F. Kitchell, 2003:
Physical forcing and the dynamics of the pelagic ecosystem in the eastern trop-
ical Pacific: simulations with ENSO-scale and global warming climate drivers
Can. J. Fish. Aquat. Sci., 60, 1161-1175.
Waugh, S.M., H. Weimerskirch, P.J. Moore and P.M. Sagar, 1999: Population dy-namics of black-browed and grey-headed albatrosses Diomedea melanophrys
and D. chrysostoma at Campbell Island, New Zealand, 1942-96. Ibis, 141, 216-
225.
Wearne, L.J. and J.W. Morgan, 2001: Recent forest encroachment into sub-alpine
grasslands near Mount Hotham, Victoria, Australia. Arct. Antarct. Alp. Res., 33
369-377.
Webb, E.K.,1997: Windows on Meteorology: Australian Perspective. CSIRO Pub
lishing, Collingwood, 342 pp.
Webb, L., P. Whetton and S. Barlow, 2006: Impact on Australian viticulture from
greenhouse-induced climate change. Bulletin of the Australian Meteorologica
and Oceanographic Society, 19, 15-17.
Weimerskirch, H., P. Inchausti, C. Guinet and C. Barbraud, 2003: Trends in bird
and seal populations as indicators of a system shift in the Southern Ocean
Antarct. Sci., 15, 249-256.
Whetton, P.H., R. Suppiah, K.L. McInnes, K.J. Hennessy and R.N. Jones, 2002
Climate change in Victoria: high-resolution regional assessment of climate
change impacts. CSIRO Consultancy Report for the Department of Natural Re-
sources and Environment, Victoria, 44 pp. http://www.greenhouse
vic.gov.au/climatechange.pdf.
Whinam, J. and G. Copson, 2006: Sphagnum moss: an indicator of climate change
in the Sub-Antarctic. Polar Rec., 42, 43-49.
Whinam, J., G.S. Hope, B.R. Clarkson, R.P. Buxton, P.A. Alspach and P. Adam
2003: Sphagnum in peat-lands of Australasia: their distribution, utilisation and
management. Wetlands Ecology and Management , 11, 37-49.
White, N., R.W. Sutherst, N. Hall and P. Whish-Wilson, 2003: The vulnerability
oftheAustralian beef industry to impactsof the cattletick( Boophilus microplus)
under climate change. Climatic Change, 61, 157-90.
Williams, A.A., D.J. Karoly and N. Tapper, 2001: The sensitivity of Australian
Chapter 11 Australia and New Zealand
539

8/3/2019 Chapter 11 - Australia and New Zealand
http://slidepdf.com/reader/full/chapter-11-australia-and-new-zealand 34/34
Australia and New Zealand Chapt
fire danger to climate change. Climatic Change, 49, 171-191.
Williams, S.E., E.E.Bolitho and S. Fox, 2003: Climate change in Australian trop-
ical forests:an impending environmental catastrophe. P. Roy. Soc. Lond. B, 270,
1887-1892.
Willis, B.L., C.A. Page and E.A. Dinsdale, 2004: Coral disease on the Great Bar-
rier Reef. Coral Health and Disease, E. Rosenberg and Y. Loya, Eds., Springer,
Berlin, 69-104.
Winn, K.O., M.J. Saynor, M.J. Eliot and I. Eliot, 2006: Saltwater intrusion and
morphological change at the mouth of the East Alligator River, Northern Terri-
tory. J. Coastal Res., 22, 137-149.
Woehler, E.J., H.J. Auman and M.J. Riddle, 2002: Long-term population increaseof black-browed albatrosses Thalassarche melanophrys at Heard Island,
1947/1948–2000/2001. Polar Biol., 25, 921-927.
Woodruff, R.E., C.S. Guest, M.G. Garner, N. Becker, J. Lindesay, T. Carvan and
K. Ebi,2002: PredictingRoss River virus epidemics from regional weatherdata.
Epidemiology, 13, 384-393.
Woodruff, R.E., S. Hales, C. Butler and A.J. McMichael, 2005: Climate Change
Health Impacts in Australia: Effects of Dramatic CO2 Emission Reductions.Aus-
tralian Conservation Foundation and the Australian Medical Association, Can-
berra, 44 pp. http://www.acfonline.org.au/uploads/res_AMA_ACF_Full_
Report.pdf.
Woodruff, R.E., C.S.Guest, M.G. Garner, N. Becker and M. Lindsay, 2006: Early
warning of Ross River virus epidemics: combining surveillance data on climate
and mosquitoes. Epidemiology, 17, 569-575.
Woods, R.A. and C. Howard-Williams, 2004: Advances in freshwater sciences
and management. Freshwaters of New Zealand , J.S. Harding, M.P. Mosley, C.P.
Pearson and B.K. Sorrell, Eds., New Zealand Hydrological Society and New
Zealand Limnological Society, Caxton Press, Christchurch, 764 pp.
Woodward,A., S. Hales and P. Weinstein, 1998: Climate change andhuman health
in theAsia-Pacific region: whowill be most vulnerable? Climate Res., 11, 31-38.
Woodward,A., S. Hales andN. deWet, 2001: Climate Change: Potential Effectson
HumanHealth in New Zealand. Ministry for the Environment, Wellington, 21 pp.
http://www.mfe.govt.nz/publications/climate/effect-health-sep01/index. html.
Wooldridge, S., T. Done, R. Berkelmans, R. Jones and P. Marshall, 2005: Precur-
sors for resilience in coral communities in a warming climate: a belief network
approach. Mar. Ecol.-Prog. Ser., 295, 157-169.World Tourism Organisation, 2003: Climate change and tourism. Proceedings of
the First International Conference on Climate Change and Tourism, Djerba 9-
11 April. World Tourism Organisation, Madrid, 55 pp. http://www.world-
tourism.org/sustainable/climate/final-report.pdf.
Wratt, D.S.,A.B. Mullan, M.J.Salinger, S.Allan, T.Morgan and G. Kenny, 2004:
Climate Change Effects andImpacts Assessment:A Guidance Manual for Local
Government in New Zealand. New Zealand Climate Change Office, Ministry
for the Environment, Wellington, 140 pp. http://www.mfe.govt.nz/publica-
tions/climate/effects-impacts-may04/effects-impacts-may04.pdf.
Yeo, S., 2003: Effects of disclosure of flood-liability on residential property val-
ues. Australian Journal of Emergency Management , 18, 35-44.
Zeldis, J., J. Oldman, S. Ballara and L. Richards, 2005: Physical fluxes, pelagic
ecosystem structure, andlarvalfish survival in Hauraki Gulf, New Zealand. Can.
J. Fish. Aquat. Sci., 62, 593-610.