Chapter 1 True Maps, False Impressions: Making, Manipulating, and Interpreting Maps
22
Chapter 1 True Maps, False Impressions: Making, Manipulating, and Interpreting Maps Activity 1: Scale Activity 2: Thematic Maps
-
Upload
regina-acosta -
Category
Documents
-
view
49 -
download
5
description
Chapter 1 True Maps, False Impressions: Making, Manipulating, and Interpreting Maps. Activity 1: Scale. Activity 2: Thematic Maps. Learning Outcomes After completing the chapter, you will be able to:. Convert map scale to real-world distances. - PowerPoint PPT Presentation
Transcript of Chapter 1 True Maps, False Impressions: Making, Manipulating, and Interpreting Maps
Chapter 1
True Maps, False Impressions: Making, Manipulating, and Interpreting Maps
Activity 1: Scale
Activity 2: Thematic Maps
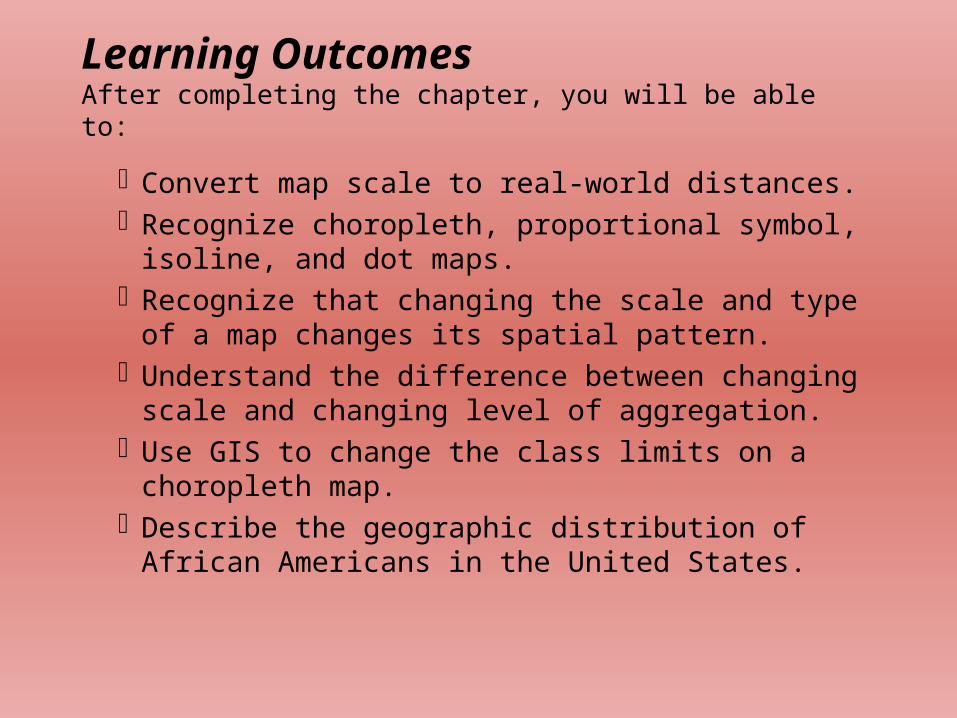
Learning OutcomesAfter completing the chapter, you will be able to:
Convert map scale to real-world distances. Recognize choropleth, proportional symbol, isoline, and
dot maps. Recognize that changing the scale and type of a map
changes its spatial pattern. Understand the difference between changing scale and
changing level of aggregation. Use GIS to change the class limits on a choropleth map. Describe the geographic distribution of African
Americans in the United States.
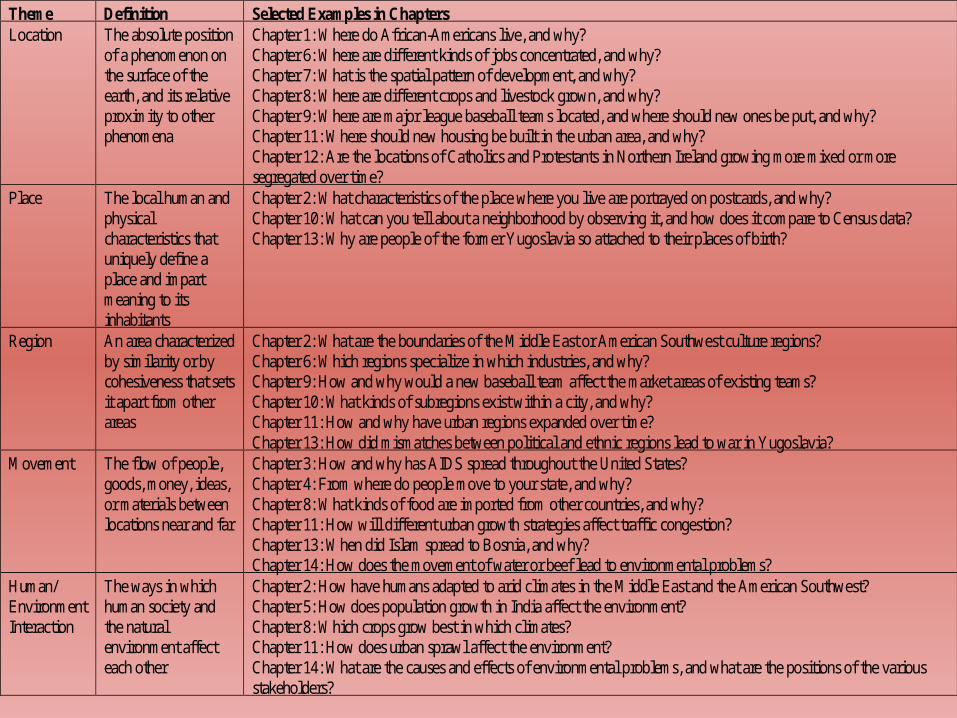
Theme Definition Selected Examples in ChaptersLocation The absolute position
of a phenomenon onthe surface of theearth, and its relativeproximity to otherphenomena
Chapter 1: Where do African-Americans live, and why?Chapter 6: Where are different kinds of jobs concentrated, and why?Chapter 7: What is the spatial pattern of development, and why?Chapter 8: Where are different crops and livestock grown, and why?Chapter 9: Where are major league baseball teams located, and where should new ones be put, and why?Chapter 11: Where should new housing be built in the urban area, and why?Chapter 12: Are the locations of Catholics and Protestants in Northern Ireland growing more mixed or moresegregated over time?
Place The local human andphysicalcharacteristics thatuniquely define aplace and impartmeaning to itsinhabitants
Chapter 2: What characteristics of the place where you live are portrayed on postcards, and why?Chapter 10: What can you tell about a neighborhood by observing it, and how does it compare to Census data?Chapter 13: Why are people of the former Yugoslavia so attached to their places of birth?
Region An area characterizedby similarity or bycohesiveness that setsit apart from otherareas
Chapter 2: What are the boundaries of the Middle East or American Southwest culture regions?Chapter 6: Which regions specialize in which industries, and why?Chapter 9: How and why would a new baseball team affect the market areas of existing teams?Chapter 10: What kinds of subregions exist within a city, and why?Chapter 11: How and why have urban regions expanded over time?Chapter 13: How did mismatches between political and ethnic regions lead to war in Yugoslavia?
Movement The flow of people,goods, money, ideas,or materials betweenlocations near and far
Chapter 3: How and why has AIDS spread throughout the United States?Chapter 4: From where do people move to your state, and why?Chapter 8: What kinds of food are imported from other countries, and why?Chapter 11: How will different urban growth strategies affect traffic congestion?Chapter 13: When did Islam spread to Bosnia, and why?Chapter 14: How does the movement of water or beef lead to environmental problems?
Human/EnvironmentInteraction
The ways in whichhuman society andthe naturalenvironment affecteach other
Chapter 2: How have humans adapted to arid climates in the Middle East and the American Southwest?Chapter 5: How does population growth in India affect the environment?Chapter 8: Which crops grow best in which climates?Chapter 11: How does urban sprawl affect the environment?Chapter 14: What are the causes and effects of environmental problems, and what are the positions of the variousstakeholders?
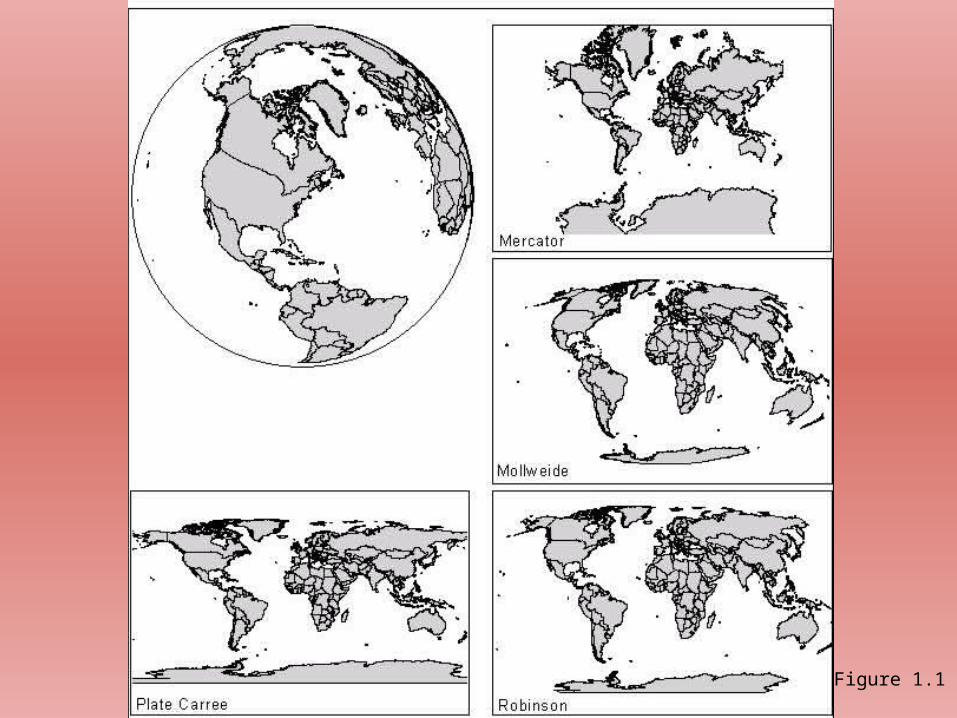
Figure 1.1
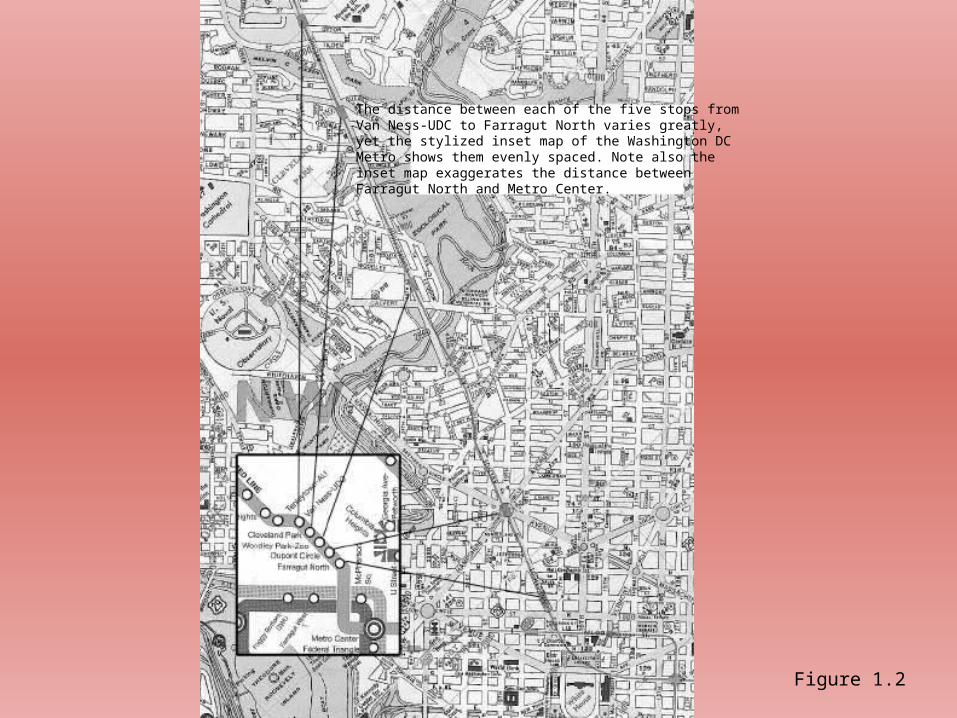
Figure 1.2
The distance between each of the five stops fromVan Ness-UDC to Farragut North varies greatly,yet the stylized inset map of the Washington DCMetro shows them evenly spaced. Note also the inset map exaggerates the distance betweenFarragut North and Metro Center.
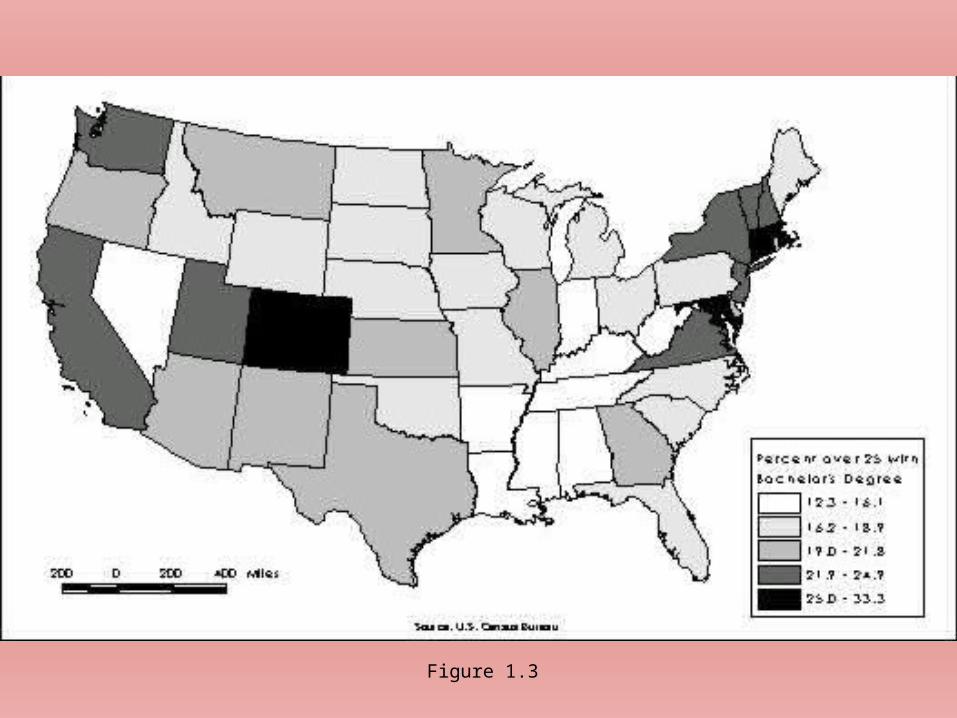
Figure 1.3
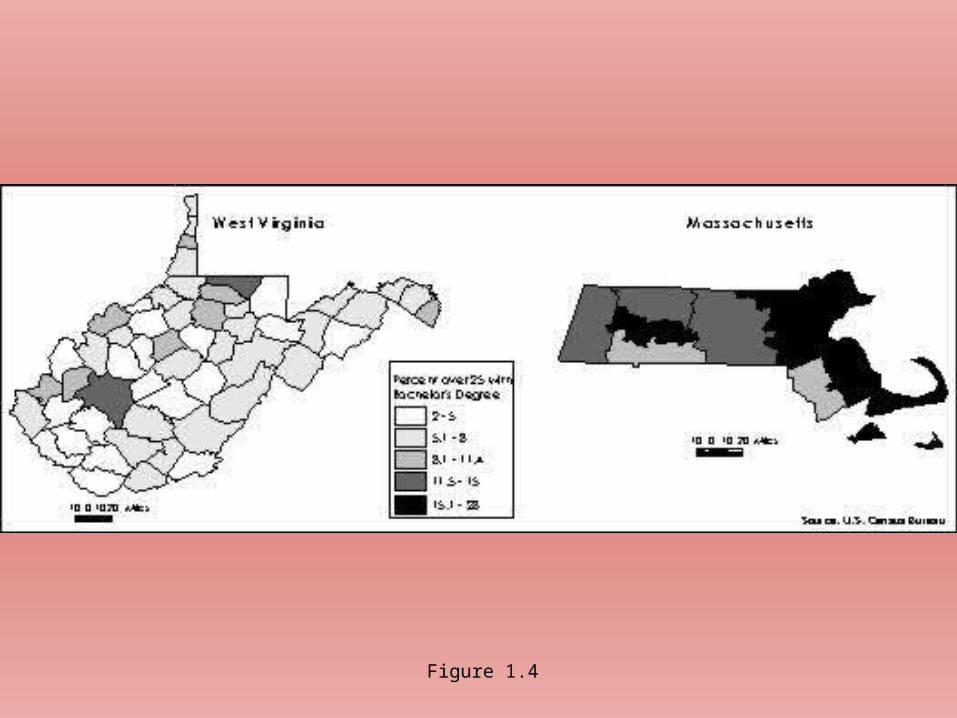
Figure 1.4
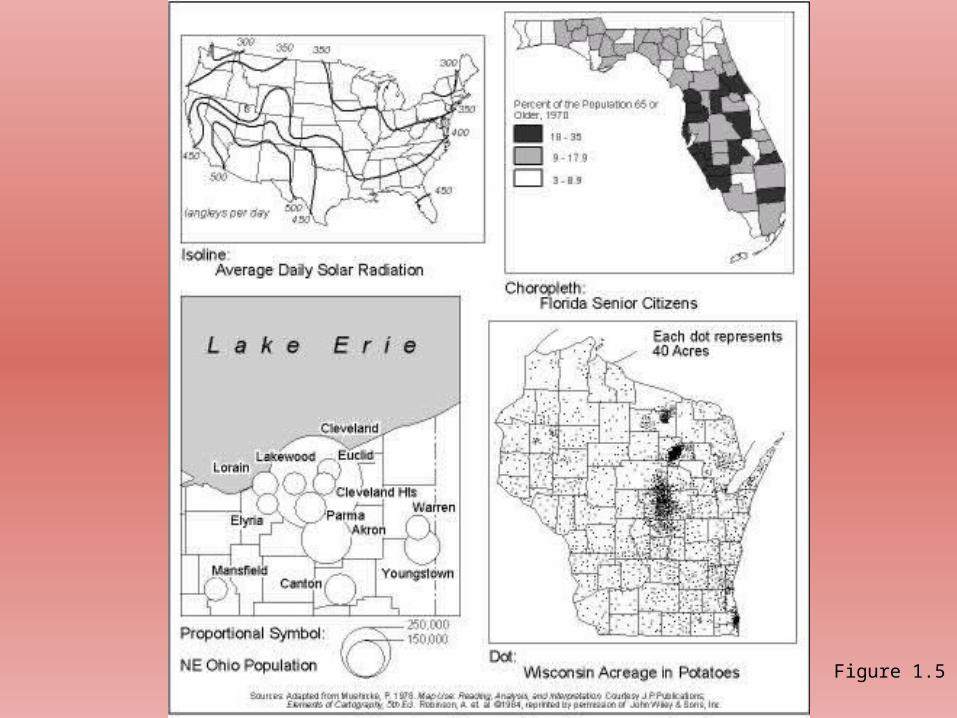
Figure 1.5
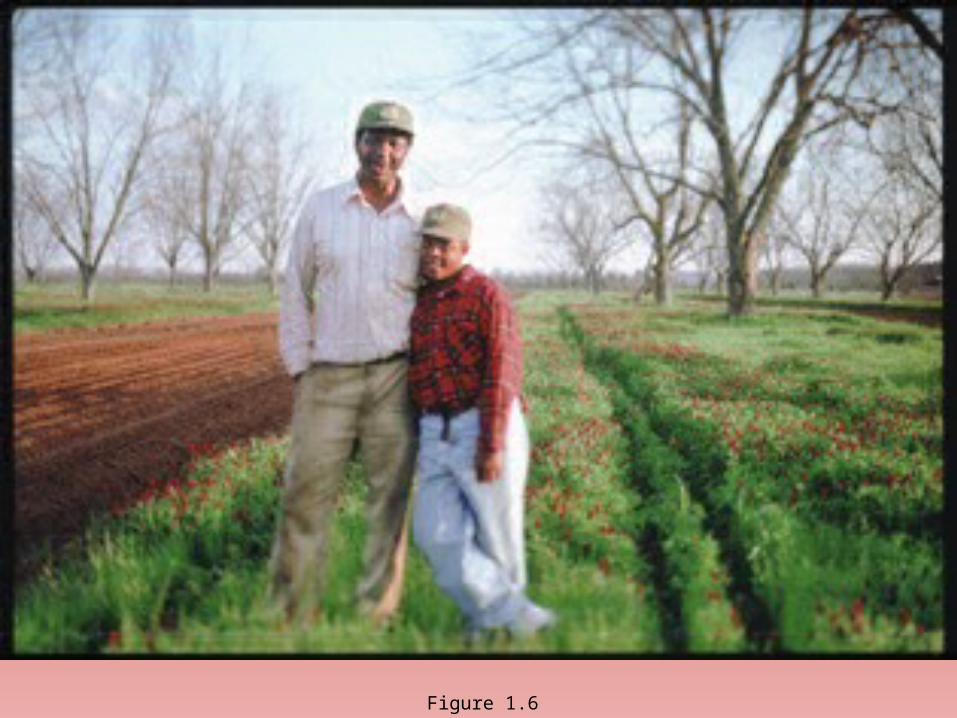
Figure 1.6
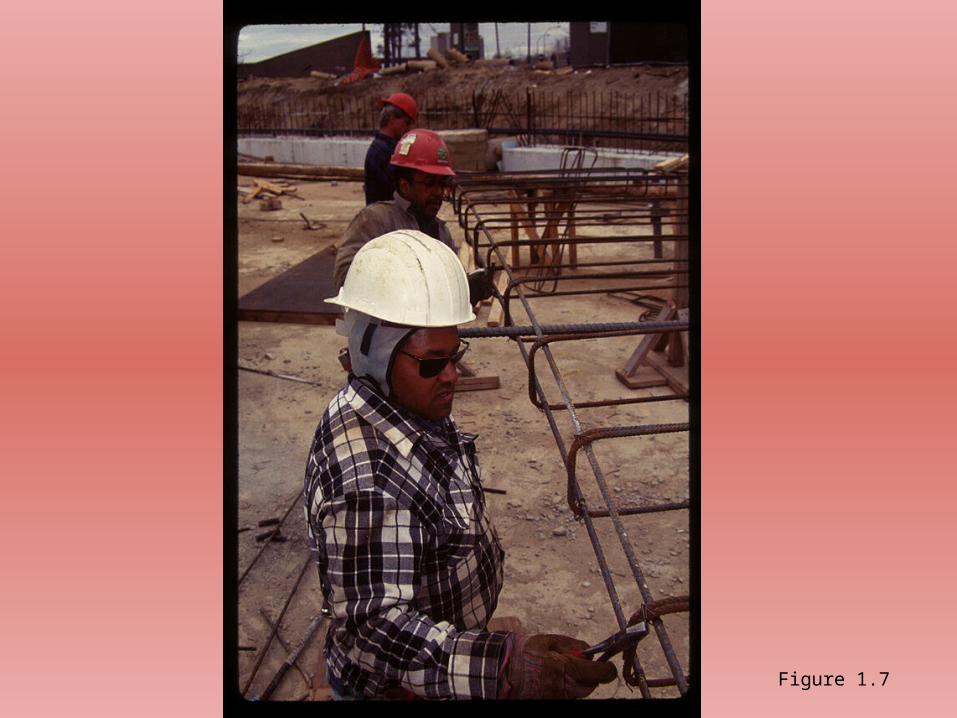
Figure 1.7

Figure 1.8

Figure 1.9
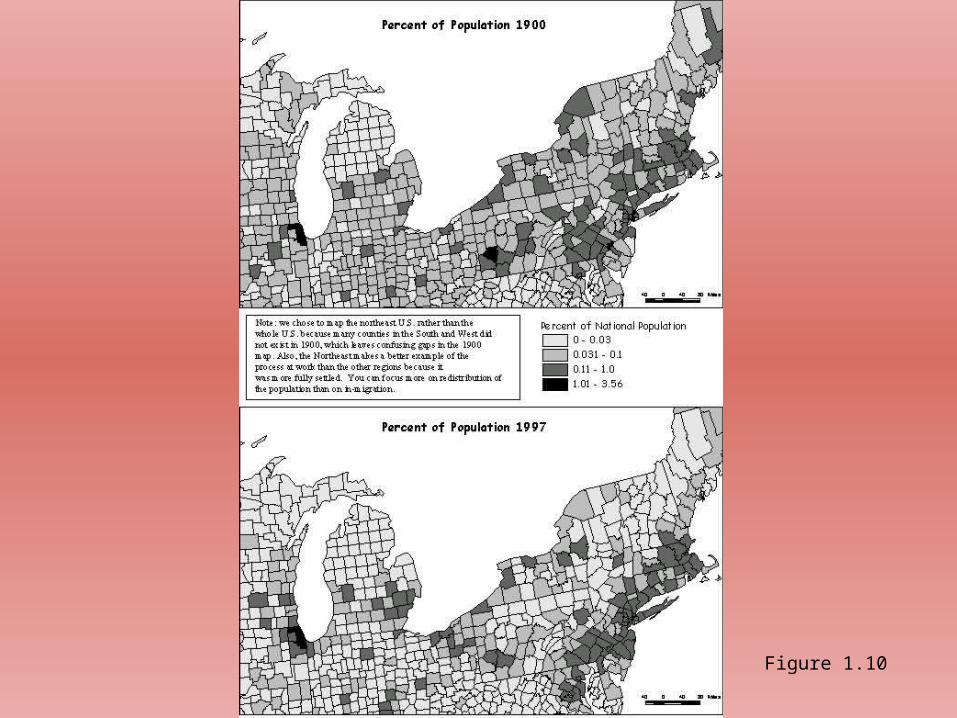
Figure 1.10
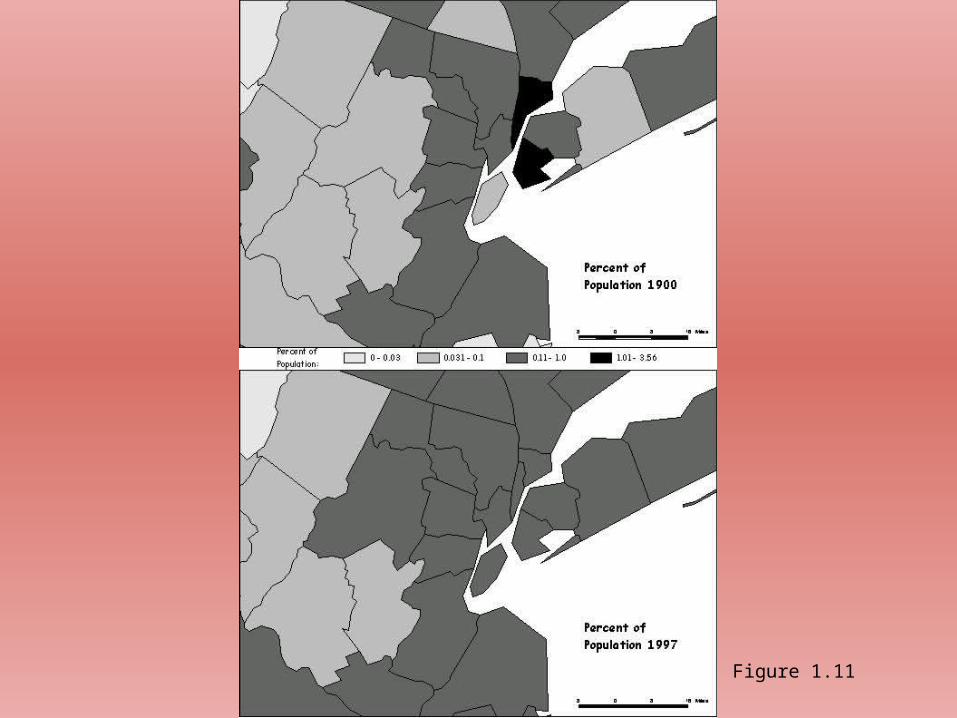
Figure 1.11
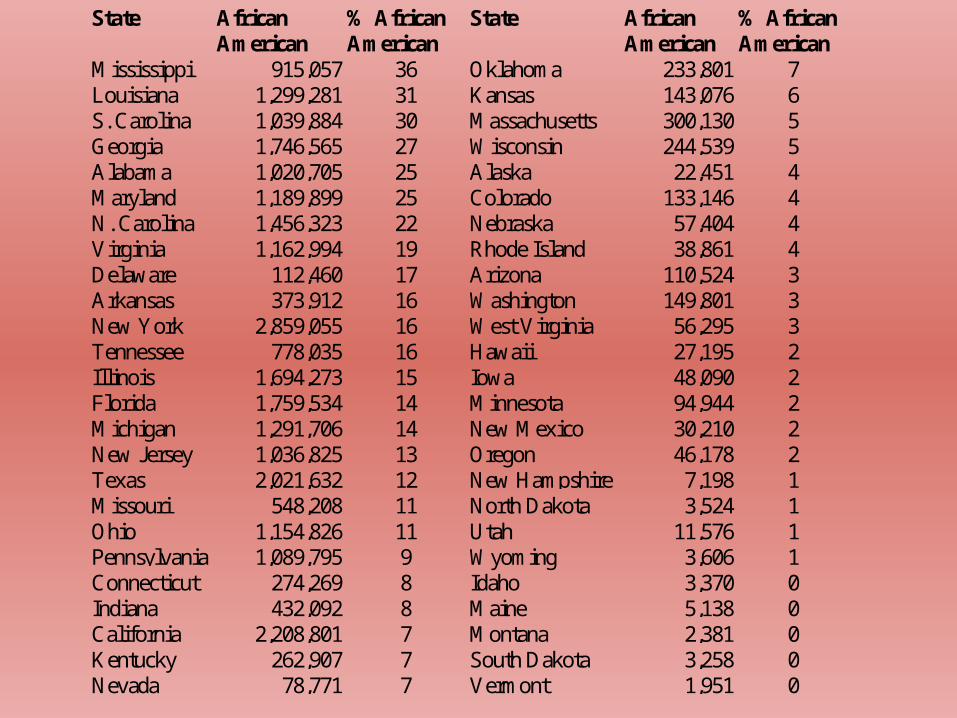
State AfricanAmerican
% AfricanAmerican
State AfricanAmerican
% AfricanAmerican
Mississippi 915,057 36 Oklahoma 233,801 7Louisiana 1,299,281 31 Kansas 143,076 6S. Carolina 1,039,884 30 Massachusetts 300,130 5Georgia 1,746,565 27 Wisconsin 244,539 5Alabama 1,020,705 25 Alaska 22,451 4Maryland 1,189,899 25 Colorado 133,146 4N. Carolina 1,456,323 22 Nebraska 57,404 4Virginia 1,162,994 19 Rhode Island 38,861 4Delaware 112,460 17 Arizona 110,524 3Arkansas 373,912 16 Washington 149,801 3New York 2,859,055 16 West Virginia 56,295 3Tennessee 778,035 16 Hawaii 27,195 2Illinois 1,694,273 15 Iowa 48,090 2Florida 1,759,534 14 Minnesota 94,944 2Michigan 1,291,706 14 New Mexico 30,210 2New Jersey 1,036,825 13 Oregon 46,178 2Texas 2,021,632 12 New Hampshire 7,198 1Missouri 548,208 11 North Dakota 3,524 1Ohio 1,154,826 11 Utah 11,576 1Pennsylvania 1,089,795 9 Wyoming 3,606 1Connecticut 274,269 8 Idaho 3,370 0Indiana 432,092 8 Maine 5,138 0California 2,208,801 7 Montana 2,381 0Kentucky 262,907 7 South Dakota 3,258 0Nevada 78,771 7 Vermont 1,951 0
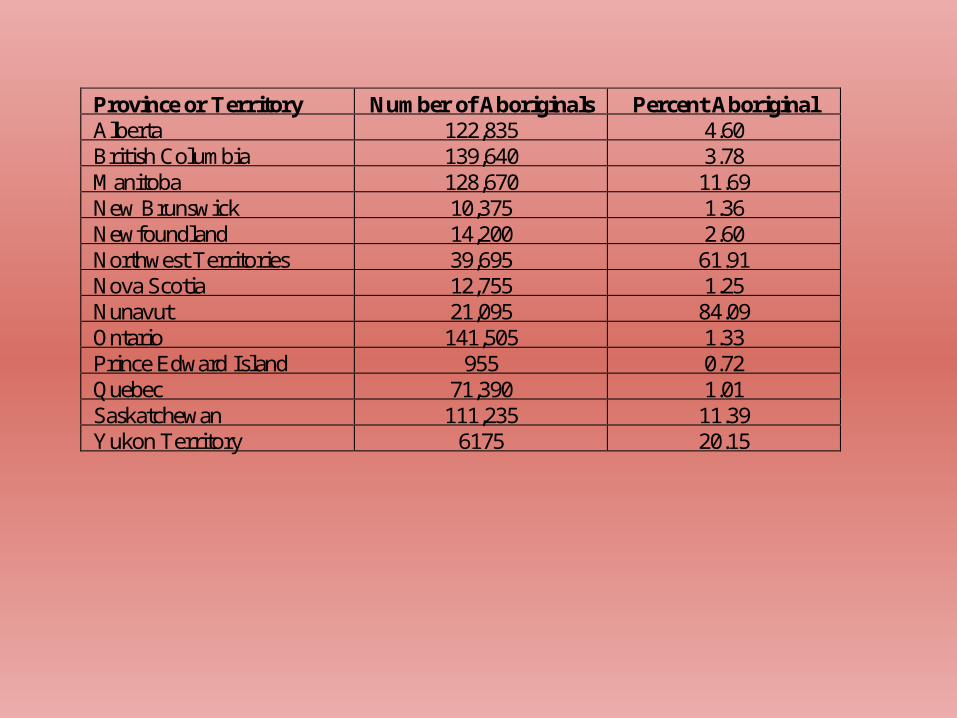
Province or Territory Number of Aboriginals Percent AboriginalAlberta 122,835 4.60British Columbia 139,640 3.78Manitoba 128,670 11.69New Brunswick 10,375 1.36Newfoundland 14,200 2.60Northwest Territories 39,695 61.91Nova Scotia 12,755 1.25Nunavut 21,095 84.09Ontario 141,505 1.33Prince Edward Island 955 0.72Quebec 71,390 1.01Saskatchewan 111,235 11.39Yukon Territory 6175 20.15
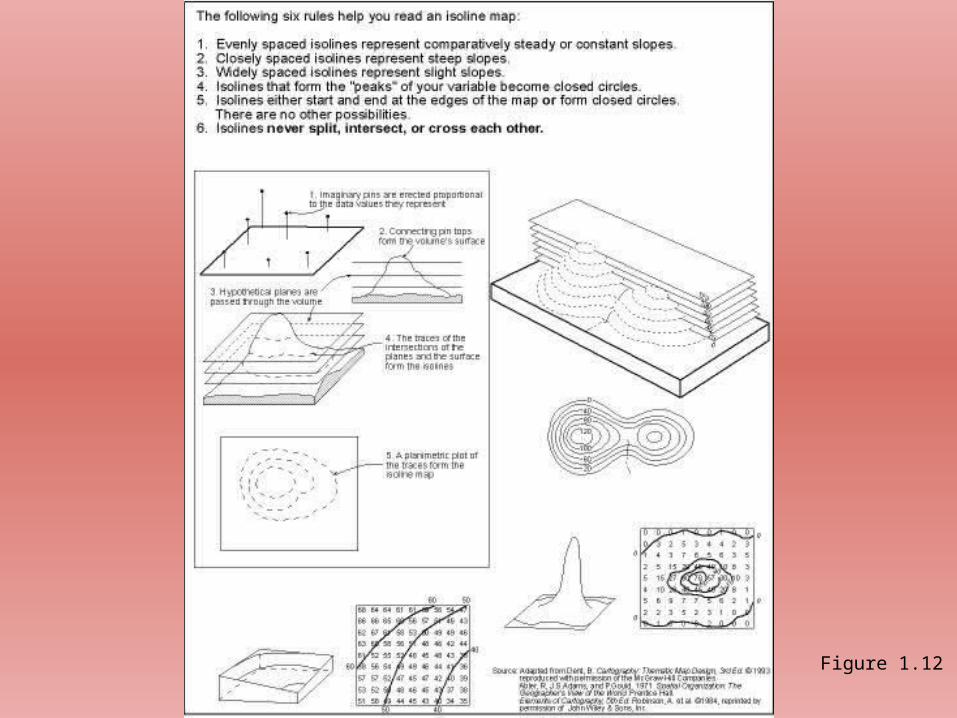
Figure 1.12
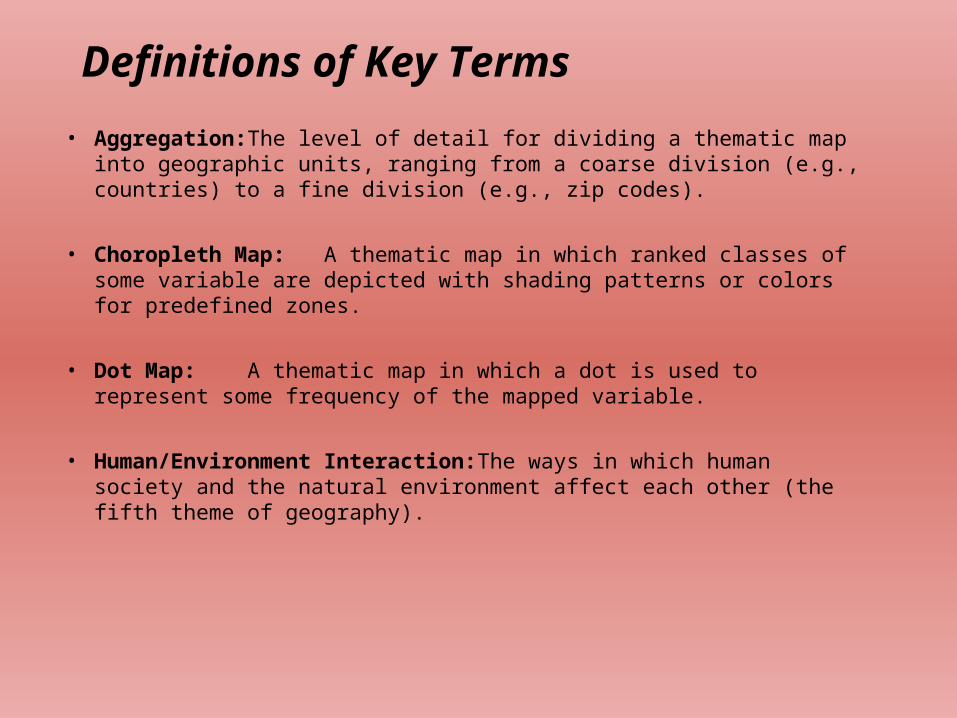
Definitions of Key Terms
• Aggregation: The level of detail for dividing a thematic map into geographic units, ranging from a coarse division (e.g., countries) to a fine division (e.g., zip codes).
• Choropleth Map: A thematic map in which ranked classes of some variable are depicted with shading patterns or colors for predefined zones.
• Dot Map: A thematic map in which a dot is used to represent some frequency of the mapped variable.
• Human/Environment Interaction: The ways in which human society and the natural environment affect each other (the fifth theme of geography).
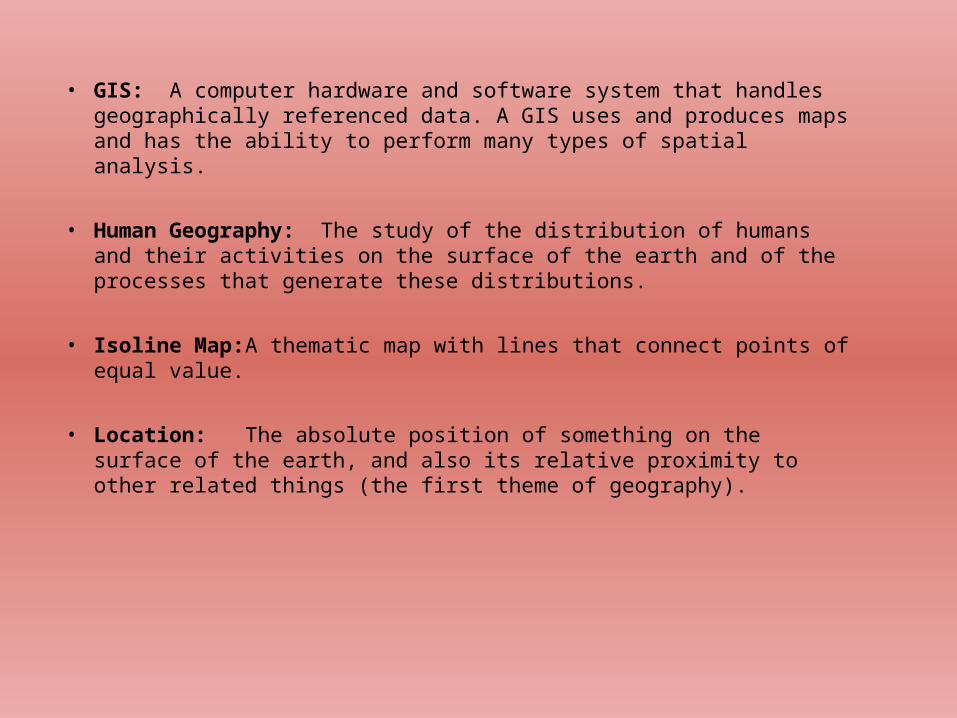
• GIS: A computer hardware and software system that handles geographically referenced data. A GIS uses and produces maps and has the ability to perform many types of spatial analysis.
• Human Geography: The study of the distribution of humans and their activities on the surface of the earth and of the processes that generate these distributions.
• Isoline Map: A thematic map with lines that connect points of equal value.
• Location: The absolute position of something on the surface of the earth, and also its relative proximity to other related things (the first theme of geography).
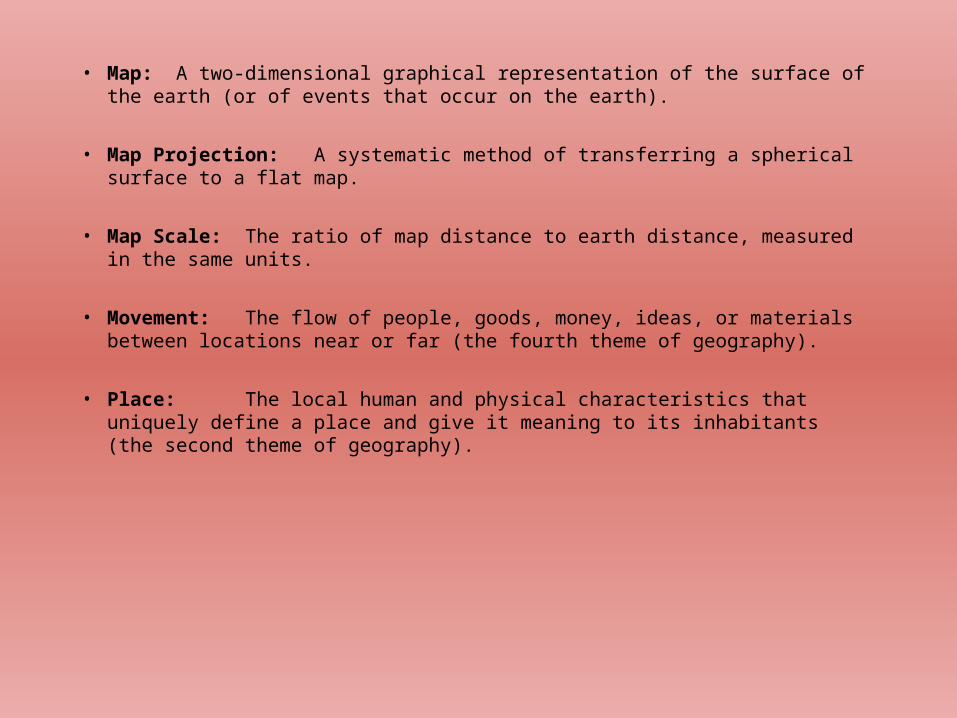
• Map: A two-dimensional graphical representation of the surface of the earth (or of events that occur on the earth).
• Map Projection: A systematic method of transferring a spherical surface to a flat map.
• Map Scale: The ratio of map distance to earth distance, measured in the same units.
• Movement: The flow of people, goods, money, ideas, or materials between locations near or far (the fourth theme of geography).
• Place: The local human and physical characteristics that uniquely define a place and give it meaning to its inhabitants (the second theme of geography).
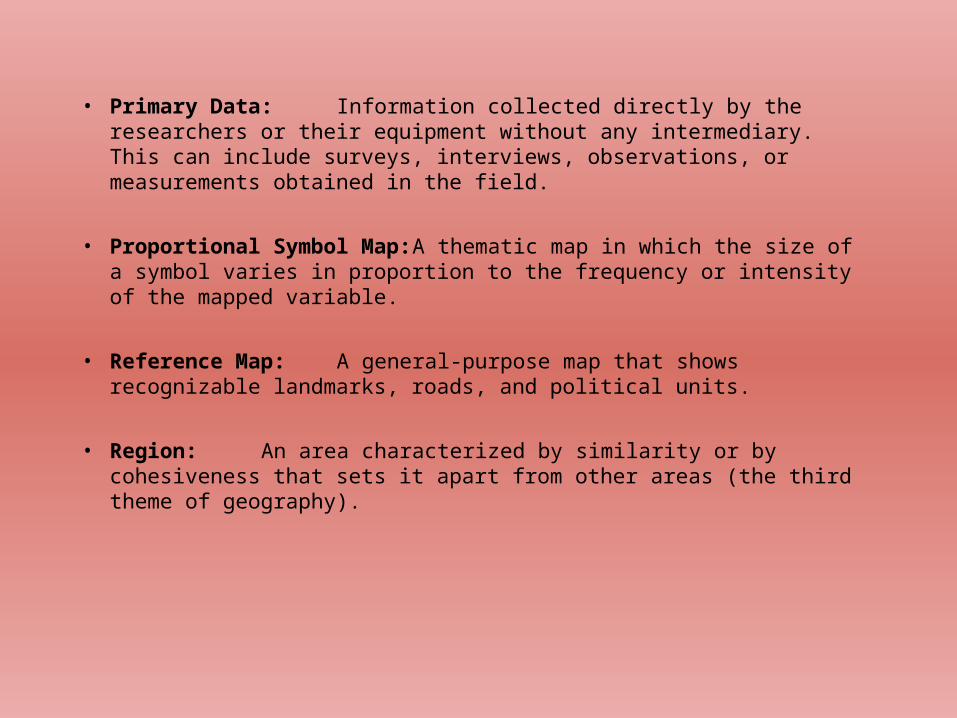
• Primary Data: Information collected directly by the researchers or their equipment without any intermediary. This can include surveys, interviews, observations, or measurements obtained in the field.
• Proportional Symbol Map: A thematic map in which the size of a symbol varies in proportion to the frequency or intensity of the mapped variable.
• Reference Map: A general-purpose map that shows recognizable landmarks, roads, and political units.
• Region: An area characterized by similarity or by cohesiveness that sets it apart from other areas (the third theme of geography).
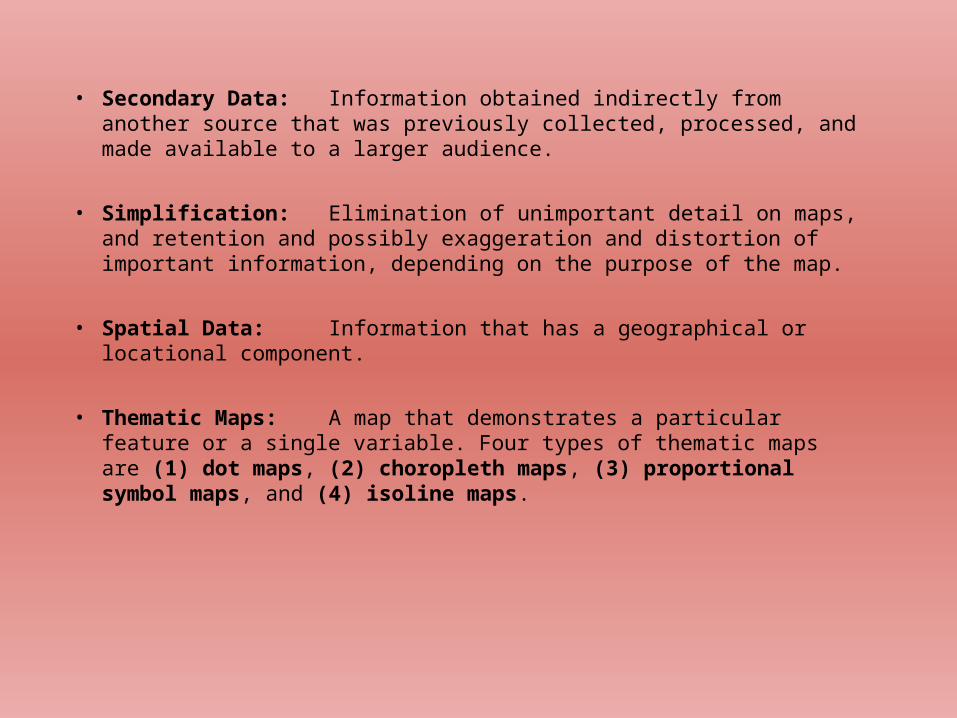
• Secondary Data:Information obtained indirectly from another source that was previously collected, processed, and made available to a larger audience.
• Simplification: Elimination of unimportant detail on maps, and retention and possibly exaggeration and distortion of important information, depending on the purpose of the map.
• Spatial Data: Information that has a geographical or locational component.
• Thematic Maps: A map that demonstrates a particular feature or a single variable. Four types of thematic maps are (1) dot maps, (2) choropleth maps, (3) proportional symbol maps, and (4) isoline maps.