Channel morphometry, sediment transport, and implications for tectonic activity and surficial ages...
10
Channel morphometry, sediment transport, and implications for tectonic activity and surficial ages of Titan basins Richard Cartwright a,⇑ , Jordan A. Clayton b , Randolph L. Kirk c a Dept. of Physics and Astronomy, Georgia State University, Atlanta, GA 30302, USA b Dept. of Geosciences, Georgia State University, Atlanta, GA 30302, USA c US Geological Survey Astrogeology Division, Flagstaff, AZ 86001, USA article info Article history: Received 31 May 2010 Revised 6 March 2011 Accepted 10 March 2011 Available online 23 March 2011 Keywords: Titan Satellites, Surfaces Tectonics Geological processes Earth abstract Fluvial features on Titan and drainage basins on Earth are remarkably similar despite differences in grav- ity and surface composition. We determined network bifurcation (R b ) ratios for five Titan and three ter- restrial analog basins. Tectonically-modified Earth basins have R b values greater than the expected range (3.0–5.0) for dendritic networks; comparisons with R b values determined for Titan basins, in conjunction with similarities in network patterns, suggest that portions of Titan’s north polar region are modified by tectonic forces. Sufficient elevation data existed to calculate bed slope and potential fluvial sediment transport rates in at least one Titan basin, indicating that 75 mm water ice grains (observed at the Huy- gens landing site) should be readily entrained given sufficient flow depths of liquid hydrocarbons. Volu- metric sediment transport estimates suggest that 6700–10,000 Titan years (2.0–3.0 10 5 Earth years) are required to erode this basin to its minimum relief (assuming constant 1 m and 1.5 m flows); these lowering rates increase to 27,000–41,000 Titan years (8.0–12.0 10 5 Earth years) when flows in the north polar region are restricted to summer months. Ó 2011 Elsevier Inc. All rights reserved. 1. Introduction Images gathered by the Cassini orbiter suggest that fluvial pro- cesses have generated the channel networks observed on the sur- face of Saturn’s moon, Titan (Perron et al., 2006; Jaumann et al., 2008; Lorenz et al., 2008; Lunine and Lorenz, 2009), likely driven by infrequent, high-intensity precipitation of liquid methane (Lor- enz, 2000; Hueso and Sanchez-Lavega, 2006; Barth and Rafkin, 2007). Networks observed around Titan’s north polar seas (Fig. 1) are coincident with topographic data that suggest that the terrain surrounding the north polar hydrocarbon seas is more rugged than other locations observed on Titan (Stiles et al., 2009). This might indicate that: (1) channels are eroding tectonically-uplifted terrain (see Radebaugh et al., 2007); (2) fluctuating subsurface methane (alkanifer) levels (Hayes et al., 2008; Mitchell et al., 2009) produce intermittent base level decreases; or (3) some combination of these factors is responsible for generating initial relief. Further- more, the relatively large range in elevation observed in the north polar region surrounding the analyzed channel networks might lead to heightened fluvial erosion rates compared to other, more level sections of Titan, as described by terrestrial landscape evolu- tion modeling studies (e.g. Whipple and Tucker, 1999; Tucker and Hancock, 2010) and reconstructions of fluvial incision rates in Earth’s geologic past (e.g. Snyder et al., 2000; Montgomery and Brandon, 2002; Stock et al., 2004). Inferring tectonic processes from bifurcation ratios and network morphologies has been explored for drainage basins on Earth where tectonic history is well-understood (e.g. Zuchiewicz, 1998; Beneduce et al., 2004). Furthermore, researchers have linked differ- ent types of terrestrial network patterns to the influence (or ab- sence) of tectonic controls (e.g. Zernitz, 1932). This study compares bifurcation ratios and network patterns found in five Ti- tan basins with analogous channel networks on Earth to make inferences regarding the development of rugged topography in Ti- tan’s north polar areas. In addition, we generate rough calculations of bed load trans- port rates for one of the Titan basins in order to estimate relief denudation minima (see Table 1). These estimates represent one possible scenario for describing the persistence of topographic fea- tures; consequently, they provide a loose, but plausible, timescale for the age of Titan’s surface that might compliment cratering rate data. The denudation results presented herein include order-of- magnitude scale uncertainty; however, we feel that our estimates may still help resolve outstanding questions related to Titan’s sur- ficial processes and geologic past, as well as provide a useful pro- cedure for modeling changes to the north polar landscape and other locations potentially altered by fluvial erosion. Clearly, as superior data (elevation, precipitation, surface grain size, etc.) 0019-1035/$ - see front matter Ó 2011 Elsevier Inc. All rights reserved. doi:10.1016/j.icarus.2011.03.011 ⇑ Corresponding author. Present address: Dept. of Earth and Planetary Sciences, University of Tennessee, Knoxville, TN 37996, USA. E-mail addresses: [email protected], [email protected] (R. Cartwright). Icarus 214 (2011) 561–570 Contents lists available at ScienceDirect Icarus journal homepage: www.elsevier.com/locate/icarus
-
Upload
richard-cartwright -
Category
Documents
-
view
212 -
download
0
Transcript of Channel morphometry, sediment transport, and implications for tectonic activity and surficial ages...
Icarus 214 (2011) 561–570
Contents lists available at ScienceDirect
Icarus
journal homepage: www.elsevier .com/locate / icarus
Channel morphometry, sediment transport, and implications for tectonicactivity and surficial ages of Titan basins
Richard Cartwright a,⇑, Jordan A. Clayton b, Randolph L. Kirk c
a Dept. of Physics and Astronomy, Georgia State University, Atlanta, GA 30302, USAb Dept. of Geosciences, Georgia State University, Atlanta, GA 30302, USAc US Geological Survey Astrogeology Division, Flagstaff, AZ 86001, USA
a r t i c l e i n f o
Article history:Received 31 May 2010Revised 6 March 2011Accepted 10 March 2011Available online 23 March 2011
Keywords:TitanSatellites, SurfacesTectonicsGeological processesEarth
0019-1035/$ - see front matter � 2011 Elsevier Inc. Adoi:10.1016/j.icarus.2011.03.011
⇑ Corresponding author. Present address: Dept. of EUniversity of Tennessee, Knoxville, TN 37996, USA.
E-mail addresses: [email protected], rcart
a b s t r a c t
Fluvial features on Titan and drainage basins on Earth are remarkably similar despite differences in grav-ity and surface composition. We determined network bifurcation (Rb) ratios for five Titan and three ter-restrial analog basins. Tectonically-modified Earth basins have Rb values greater than the expected range(3.0–5.0) for dendritic networks; comparisons with Rb values determined for Titan basins, in conjunctionwith similarities in network patterns, suggest that portions of Titan’s north polar region are modified bytectonic forces. Sufficient elevation data existed to calculate bed slope and potential fluvial sedimenttransport rates in at least one Titan basin, indicating that 75 mm water ice grains (observed at the Huy-gens landing site) should be readily entrained given sufficient flow depths of liquid hydrocarbons. Volu-metric sediment transport estimates suggest that �6700–10,000 Titan years (�2.0–3.0 � 105 Earth years)are required to erode this basin to its minimum relief (assuming constant 1 m and 1.5 m flows); theselowering rates increase to �27,000–41,000 Titan years (�8.0–12.0 � 105 Earth years) when flows inthe north polar region are restricted to summer months.
� 2011 Elsevier Inc. All rights reserved.
1. Introduction
Images gathered by the Cassini orbiter suggest that fluvial pro-cesses have generated the channel networks observed on the sur-face of Saturn’s moon, Titan (Perron et al., 2006; Jaumann et al.,2008; Lorenz et al., 2008; Lunine and Lorenz, 2009), likely drivenby infrequent, high-intensity precipitation of liquid methane (Lor-enz, 2000; Hueso and Sanchez-Lavega, 2006; Barth and Rafkin,2007). Networks observed around Titan’s north polar seas (Fig. 1)are coincident with topographic data that suggest that the terrainsurrounding the north polar hydrocarbon seas is more rugged thanother locations observed on Titan (Stiles et al., 2009). This mightindicate that: (1) channels are eroding tectonically-uplifted terrain(see Radebaugh et al., 2007); (2) fluctuating subsurface methane(alkanifer) levels (Hayes et al., 2008; Mitchell et al., 2009) produceintermittent base level decreases; or (3) some combination ofthese factors is responsible for generating initial relief. Further-more, the relatively large range in elevation observed in the northpolar region surrounding the analyzed channel networks mightlead to heightened fluvial erosion rates compared to other, morelevel sections of Titan, as described by terrestrial landscape evolu-tion modeling studies (e.g. Whipple and Tucker, 1999; Tucker and
ll rights reserved.
arth and Planetary Sciences,
[email protected] (R. Cartwright).
Hancock, 2010) and reconstructions of fluvial incision rates inEarth’s geologic past (e.g. Snyder et al., 2000; Montgomery andBrandon, 2002; Stock et al., 2004).
Inferring tectonic processes from bifurcation ratios and networkmorphologies has been explored for drainage basins on Earthwhere tectonic history is well-understood (e.g. Zuchiewicz, 1998;Beneduce et al., 2004). Furthermore, researchers have linked differ-ent types of terrestrial network patterns to the influence (or ab-sence) of tectonic controls (e.g. Zernitz, 1932). This studycompares bifurcation ratios and network patterns found in five Ti-tan basins with analogous channel networks on Earth to makeinferences regarding the development of rugged topography in Ti-tan’s north polar areas.
In addition, we generate rough calculations of bed load trans-port rates for one of the Titan basins in order to estimate reliefdenudation minima (see Table 1). These estimates represent onepossible scenario for describing the persistence of topographic fea-tures; consequently, they provide a loose, but plausible, timescalefor the age of Titan’s surface that might compliment cratering ratedata. The denudation results presented herein include order-of-magnitude scale uncertainty; however, we feel that our estimatesmay still help resolve outstanding questions related to Titan’s sur-ficial processes and geologic past, as well as provide a useful pro-cedure for modeling changes to the north polar landscape andother locations potentially altered by fluvial erosion. Clearly, assuperior data (elevation, precipitation, surface grain size, etc.)

Fig. 1. A regional perspective of the five Titan basins. Basins A and B drain into what is expected to be a branch of Kraken Mare. Basins C–E drain into Ligeia Mare. Images fromNASA Jet Propulsion Laboratory.
562 R. Cartwright et al. / Icarus 214 (2011) 561–570
continue to become available, our results may be refined asneeded.
2. Basins
Within overlapping portions of Cassini’s T25 and T28 radarswaths are several channel networks that drain into a nearbybranch of Kraken Mare. One of these (Basin ‘‘A’’ herein, locatedalong the 270�W meridian) is a large (�125 km length), dendriticbasin draining surrounding highland areas (Fig. 2A). Nearby Basin‘‘B’’ (�100 km length) empties into the same polar ‘estuary’ as Ba-sin A, but has a contorted, semi-linear morphology (Fig. 2B) sug-gestive of extensional ridges on Earth, as examined below. Basin‘‘C’’ (�300 km length) has a somewhat dendritic morphology thatappears to be laterally-constrained by proximal highland areas,with tributary channels oriented parallel or at highly acute anglesto the main trunk (Fig. 2C). The orientation of Basin C’s tributaries,along with its semi-linear central trunk, suggest that Basin C dis-plays a ‘subdendritic’ pattern, or more specifically, its networkclassification lies somewhere between dendritic and pinnate (formore detailed explanation of network morphologies, see e.g. Zer-nitz, 1932; Howard, 1967; Mejia and Niemann, 2008). Because ofdifficulties deciphering the direction of flow for lower portions ofBasin C, our analysis was limited to upstream portions of this ba-sin. Basins ‘‘D’’ and ‘‘E’’ (�75 and 90 km length, respectively) havedendritic morphologies with a flooded central trunk at the basin’sdownstream end suggestive of fluctuating stage in the nearby mare(Fig. 2D and E).
Given the dearth of vegetation and infrequent rainfall (Huesoand Sanchez-Lavega, 2006; Lorenz et al., 2008), arid basins onEarth share many analogous traits with fluvial features on Titan(Lorenz et al., 2007a). The terrestrial basins used in this study wereselected because (1) they shared morphological similarities to Ti-tan basins and (2) they were located in arid regions with well-de-scribed tectonic and/or eustatic history that could be used to infertopography-inducing processes on Titan. We refer to each of theterrestrial basins described herein according to their geographicregion, representing coastal Oman, central Nevada, and coastalPakistan. The Oman basin (spanning 17�5505800N, 56�1604100E to
17�5804600N, 56�2202500E, near the town of Sharbthat), is an�14.40 km long dendritic network cut into an uplifted plateau (Pe-tit et al., 2007), resembling Titan Basins A, and to an extent, C(Fig. 2O). The Nevada basin, which is �51 km long, (spanning37�5005900N, 114�2002100W, where it joins the Meadow Valley Wash,to 38�1305300N, 44�3204000W) is located within the Basin and Rangephysiographic province of the western United States, characterizedby extensional tectonic forces and linear faulting (Ellis et al., 1999)and an arid climate with sparse vegetation. The basin has a linearcentral channel with numerous small tributary channels that flowinto it at roughly perpendicular angles, resembling Titan Basin B’s‘drowned’ main trunk (Fig. 2N). The Pakistan basin (�17 km length,spanning 25�1404400N, 63�1201400E to 25�1900600N, 63�0403900E, nearthe village of Chur), drains into the Arabian Sea and is subjectedto diurnal tidal fluctuations as well as Quaternary eustatic sea levelchange – presumably broadly analogous to a fluctuating alkaniferin polar Titan (Fig. 2P).
3. Methods
3.1. Calculation of basin slope
Basin A is fully contained within overlapping RADAR SAR imag-ery used to generate a digital terrain model (DTM) covering part ofTitan’s north polar region (DTM horizontal and vertical accuracy of5 km and 130 m, respectively). In particular, it lies within the�200 km wide by �1700 km long intersection of images fromthe Titan flybys numbered T25 and T28. We extracted coordinatedata from the DTM in order to estimate parameters used in sedi-ment transport relations, such as channel dimensions and bedslope.
The DTM was collected with a grid spacing of 1404 m/pixel(32 pixels/degree) based on images prepared at 175 m/pixel(256 pixels/degree). The grid spacing of the images is used by theCassini RADAR team to guarantee that the true resolution of theimages is oversampled. Because stereo mapping requires matchingcorresponding features (from different radar swaths) that containdissimilar resolution elements, the resolution of the DTM is neces-sarily coarser than that of the radar images. In order to create a

Table 1Sensitivity analysis for denudation model. See Section 3.2 for symbol definitions.
D (m) hc (m) h (m) w (m) Lowering timescale De Summer only Titan years Summer only Earth years Remnant elevation (m) Remnant slope (m)
Titan years Earth years
0.001 0.008 1.0 1750 52,000 1.5E+06 210,000 6.2E+06 3 �0.000031400 65,000 1.9E+06 260,000 7.7E+06 3 �0.000031050 86,000 2.5E+06 340,000 1.0E+07 3 �0.00003
350 260,000 7.7E+06 1,000,000 3.0E+07 3 �0.0000388 1000,000 3.0E+07 4100,000 1.2E+08 3 �0.0000322 4100,000 1.2E+08 16,000,000 4.7E+08 3 �0.00003
0.001 0.008 1.5 1750 34,000 1.0E+06 140,000 4.1E+06 2 �0.000021400 42,000 1.2E+06 170,000 5.0E+06 2 �0.000021050 56,000 1.7E+06 230,000 6.8E+06 2 �0.00002
350 170,000 5.0E+06 680,000 2.0E+07 2 �0.0000288 670,000 2.0E+07 2700,000 8.0E+07 2 �0.0000222 2700,00 7.9E+07 11,000,000 3.2E+08 2 �0.00002
0.075 0.578 1.0 1750 8200 2.4E+05 33,000 9.7E+05 239 �0.0021400 10,000 3.0E+05 41,000 1.2E+06 239 �0.0021050 14,000 4.1E+05 55,000 1.6E+06 239 �0.002
350 42,000 1.2E+06 170,000 5.0E+06 239 �0.00288 170,000 5.0E+06 670,000 2.0E+07 239 �0.00222 670,000 2.0E+07 2700,000 7.9+E07 239 �0.002
0.075 0.578 1.5 1750 5300 1.6E+05 21,000 6.2E+05 148 �0.0011400 6700 2.0E+05 27,000 8.0E+05 148 �0.0011050 8900 2.6E+05 36,000 1.1E+06 148 �0.001
350 27,000 8.0E+05 110,000 3.2E+06 148 �0.00188 110,000 3.2E+06 430,000 1.3E+07 148 �0.00122 430,000 1.3E+07 1700,000 5.1E+07 148 �0.001
0.15 1.156 1.5 1750 2100 6.2E+04 8400 2.5E+05 355 �0.0041400 2700 8.0E+04 11000 3.2E+05 355 �0.0041050 3500 1.0E+05 14,000 4.1E+05 355 �0.004
350 11000 3.2E+05 42,000 1.2E+06 355 �0.00488 42,000 1.2E+06 170,000 5.0E+06 355 �0.00422 170,000 5.0E+06 680,000 2.0E+07 355 �0.004
R. Cartwright et al. / Icarus 214 (2011) 561–570 563
profile of the main channel of Basin A, we used the softwarepackage ImageJ (http://rsbweb.nih.gov/ij/) to define a segmentedline along the channel as it appeared in the T28 image resampledto 1404 m/pixel to match the DTM in a polar stereographic pro-jection. This path was then transferred to the DTM. Visual inspec-tion of the DTM revealed the topographic expression of thechannel quite clearly along most of its length. As a result of theslight residual parallax distortions between the image and DTM,however, the profile wandered out of the channel onto adjacenthigher standing terrain in a few places. We therefore modifiedthe path to follow the channel bottom where it could be seenin the DTM. With this adjustment, the elevations extracted alongthe profile showed no systematic deviations from a constant gra-dient along the channel, only minor fluctuations of less than100 m amplitude that could be attributed to stereo measurementerror. These results give us confidence that the DTM did in factresolve the channel and that the extracted elevations accuratelyreflect its bed slope.
3.2. Sediment transport
Sediment transport estimates are useful because they may beused inversely – that is, to approximate the temporal longevityof surface features. Ground-based spectra of Titan (Griffith et al.,2003) suggest that the moon’s crust consists predominantly ofwater ice bedrock (Lunine and Atreya, 2008) and a 10–100 m thicklayer of organic matter formed by photolysis in the upper atmo-sphere (Thompson, 1984; Tran et al., 2003; Lorenz and Lunine,2005; Atreya, 2007; Hayes et al., 2008). Channels likely serve as li-quid methane conduits (Atreya et al., 2006) that transport waterice clasts as bed load (Burr et al., 2006) and have long since re-moved the precipitated organics. For a given flow, larger sedimentparticles may be transported in flows on Titan compared to similar
flows on Earth due to the lower gravitational acceleration (1.35 m/s2) and higher buoyancy of water ice grains in liquid methane ver-sus quartz grains in liquid water (Collins, 2005). Conversely, Titan’slow gravity also retards sediment transport relative to terrestrialsettings because it requires comparatively steeper slopes and/orgreater flow depths to obtain the same shear velocity (Collins,2005; Burr et al., 2006); however, high particle buoyancy probablyoutweighs such factors, giving clast entrainment thresholds thatare lower than comparable values for sediment entrainment onEarth (Collins, 2005).
Sediment transport potential and particle entrainment on Titancan be described as a function of the Shields stress, s�, for a givenflow:
s� ¼ qghs=ðqs � qÞgD50 ð1Þ
(extensively developed in Buffington and Montgomery, 1997)where q is the density of liquid methane (450 kg/m3, Burr et al.,2006), qs is the density of water ice sediment (992 kg/m3, Lorenzet al., 2003), g is the gravitational acceleration, (1.35 m/s2), s isthe slope, and D50 is used herein as the mid-point surface grain size(0.075 m) from images of well-rounded cobbles (up to 0.15 m size)obtained from the Huygens probe landing site (Tomasko et al.,2005). While the Huygens landing site is located near the equator,and Basin A is located near Titan’s north pole, the water ice cobblesimaged by the Huygens probe provide the only available grain sizedata and are therefore used in these calculations with appropriatereservation – see Discussion, Section 5. The flow depth, h, is mod-eled as a constant value herein for h = 1.0 and 1.5 m. We chose1 m and 1.5 m flow depths because they allow for the entrainmentof 0.075 m water ice grains (critical flow depth of �0.6 m, discus-sion given in subsequent sections) and evaluation of surficial ero-sion on Titan (similar to Collins, 2005; Burr et al., 2006). Whilecurrent remote imagery of Titan’s surface precludes our ability to

Fig. 2. Titan Basins A–E and terrestrial Oman (O), Nevada (N), and Pakistan (P) Basins (above), and stream orders (below), where order (n) = blue, (n + 1) = green, (n + 2) = red,(n + 3) = purple, (n + 4) = orange, and (n + 5) = yellow. See Cartwright (2009) for discussion of resolution differences between Titan radar imagery and terrestrial aerialphotographs. Titan images from NASA Jet Propulsion Laboratory. The paths of the channel segments and their stream orders were obtained from visual identification andmapping using Google Earth™, and the images were gathered by the following institutions and companies: (1) basin in Nevada – USDA Farm Service Agency; (2) basin inOman – image � TerraMetrics 2010, � LeadDog Consulting, image � 2010 DigitalGlobe, Data SIO, NOAA, US Navy, NGA, GEBCO; (3) basin along coast of Pakistan – image �TerraMetrics 2010, Image � 2010 DigitalGlobe, � 2010 Google, Data SIO, NOAA, US Navy, NGA, GEBCO. See Table 3 for corresponding Rb values for each of the basins.
564 R. Cartwright et al. / Icarus 214 (2011) 561–570
employ more precise depth estimates, we discuss the effect of usinga range of depths in later sections.
The critical Shields stress required to initiate the movement of(water ice) bed grains, s�c , was estimated using an empirically-gen-erated equation for mountain streams on Earth (Mueller et al.,2005):
s�c ¼ ð2:18sþ 0:021Þ ð2Þ
This empirical equation was developed to determine critical Shieldsstress values in 45 streams and rivers on Earth and improves uponformer estimation methods for s�c that do not incorporate slope ef-fects (see discussion in Buffington and Montgomery (1997)). Muel-ler et al. (2005) used measurements of flow, slope, and sedimenttransport from mountainous and lower-gradient terrestrial loca-tions to develop their empirical relationship for the referenceShields stress, s�r , or the stress required to generate a near-zerobed load transport rate (for our analysis, we substitute s�c for s�r ,as these values are roughly equivalent). From (2) and the definitionof s�, we calculated the critical flow depths, hc, required to initiatesediment transport for 0.001 m, 0.075 m, and 0.15 m water icegrains through Basin A.
Bed load transport was estimated from the Meyer-Peter andMüller (1948) relation:
q� ¼ k s� � s�c� �1:5 ð3Þ
where q� is the dimensionless transport rate, k is a constant (�8),and the quantity (s� � s�c) is the excess stress available to mobilizesediment grains. Values of q� were used to determine dimensionalvolumetric transport rates per unit width, qb (m3/m/s), from theEinstein (1950) relation:
qb ¼ q�pðcs � 1ÞgD3
50
� �ð4Þ
where cs is the sediment specific gravity (qs/q) (Clayton and Pit-lick, 2007). From (3), we estimated the denudation rate, De, for Ba-sin A, defined here as the speed at which a given basin erodesdownward to either its base level or the minimum elevationwherein erosional forces are equal or less than critical entrain-ment thresholds (see also Lague et al., 2003); this provides a con-straint on the age of a landscape. Similar to Lague et al. (2003), wetherefore define the denudation limit as the height of remnanttopography following asymptotic elevation reduction. The initialDe was obtained by multiplying qb by the width, w, of the outletof Basin A (�1400 m, consistent with the range of channel widthsmeasured by Barnes et al., 2007) and converted kg to m3 for waterice sediment to obtain a volume of material moved per time, thendivided by the area of the basin (�2200 km2) to obtain a loweringrate. Values of De should decay with decreasing basin relief (fromdecreasing slope) for transport-limited, or diffusive, topography(Tucker, 2009). To account for this effect, estimates of De for the
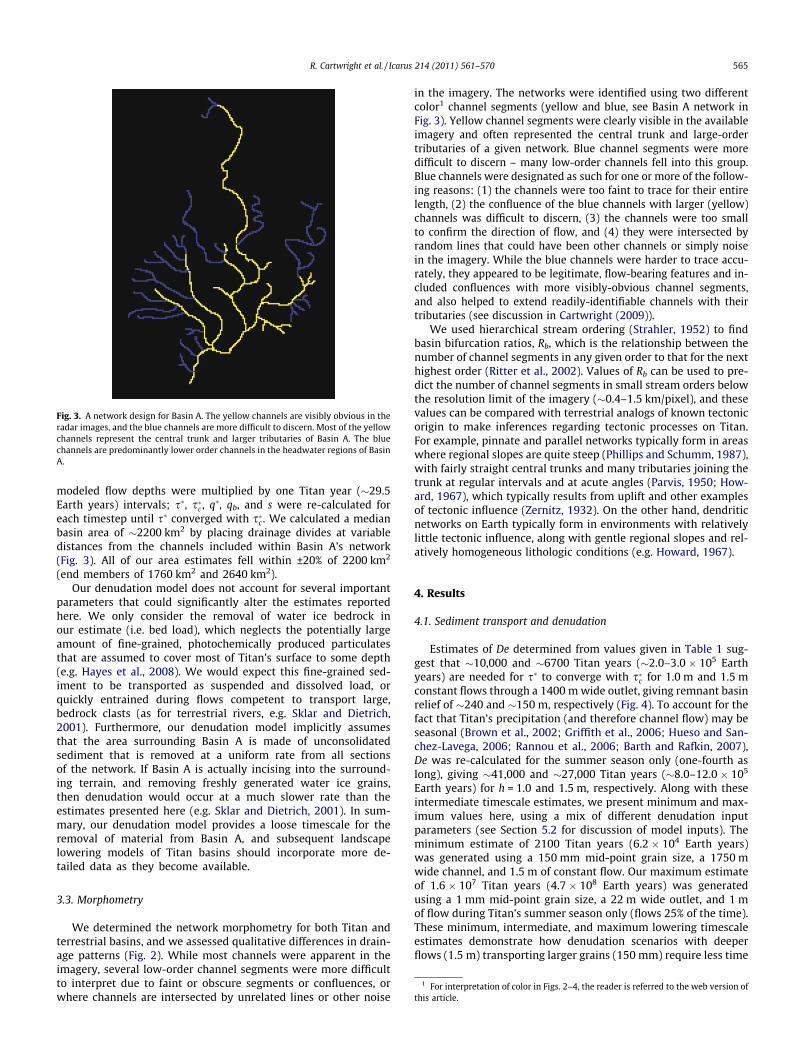
Fig. 3. A network design for Basin A. The yellow channels are visibly obvious in theradar images, and the blue channels are more difficult to discern. Most of the yellowchannels represent the central trunk and larger tributaries of Basin A. The bluechannels are predominantly lower order channels in the headwater regions of BasinA.
R. Cartwright et al. / Icarus 214 (2011) 561–570 565
modeled flow depths were multiplied by one Titan year (�29.5Earth years) intervals; s�, s�c , q�, qb, and s were re-calculated foreach timestep until s� converged with s�c . We calculated a medianbasin area of �2200 km2 by placing drainage divides at variabledistances from the channels included within Basin A’s network(Fig. 3). All of our area estimates fell within ±20% of 2200 km2
(end members of 1760 km2 and 2640 km2).Our denudation model does not account for several important
parameters that could significantly alter the estimates reportedhere. We only consider the removal of water ice bedrock inour estimate (i.e. bed load), which neglects the potentially largeamount of fine-grained, photochemically produced particulatesthat are assumed to cover most of Titan’s surface to some depth(e.g. Hayes et al., 2008). We would expect this fine-grained sed-iment to be transported as suspended and dissolved load, orquickly entrained during flows competent to transport large,bedrock clasts (as for terrestrial rivers, e.g. Sklar and Dietrich,2001). Furthermore, our denudation model implicitly assumesthat the area surrounding Basin A is made of unconsolidatedsediment that is removed at a uniform rate from all sectionsof the network. If Basin A is actually incising into the surround-ing terrain, and removing freshly generated water ice grains,then denudation would occur at a much slower rate than theestimates presented here (e.g. Sklar and Dietrich, 2001). In sum-mary, our denudation model provides a loose timescale for theremoval of material from Basin A, and subsequent landscapelowering models of Titan basins should incorporate more de-tailed data as they become available.
1 For interpretation of color in Figs. 2–4, the reader is referred to the web version ofthis article.
3.3. Morphometry
We determined the network morphometry for both Titan andterrestrial basins, and we assessed qualitative differences in drain-age patterns (Fig. 2). While most channels were apparent in theimagery, several low-order channel segments were more difficultto interpret due to faint or obscure segments or confluences, orwhere channels are intersected by unrelated lines or other noise
in the imagery. The networks were identified using two differentcolor1 channel segments (yellow and blue, see Basin A network inFig. 3). Yellow channel segments were clearly visible in the availableimagery and often represented the central trunk and large-ordertributaries of a given network. Blue channel segments were moredifficult to discern – many low-order channels fell into this group.Blue channels were designated as such for one or more of the follow-ing reasons: (1) the channels were too faint to trace for their entirelength, (2) the confluence of the blue channels with larger (yellow)channels was difficult to discern, (3) the channels were too smallto confirm the direction of flow, and (4) they were intersected byrandom lines that could have been other channels or simply noisein the imagery. While the blue channels were harder to trace accu-rately, they appeared to be legitimate, flow-bearing features and in-cluded confluences with more visibly-obvious channel segments,and also helped to extend readily-identifiable channels with theirtributaries (see discussion in Cartwright (2009)).
We used hierarchical stream ordering (Strahler, 1952) to findbasin bifurcation ratios, Rb, which is the relationship between thenumber of channel segments in any given order to that for the nexthighest order (Ritter et al., 2002). Values of Rb can be used to pre-dict the number of channel segments in small stream orders belowthe resolution limit of the imagery (�0.4–1.5 km/pixel), and thesevalues can be compared with terrestrial analogs of known tectonicorigin to make inferences regarding tectonic processes on Titan.For example, pinnate and parallel networks typically form in areaswhere regional slopes are quite steep (Phillips and Schumm, 1987),with fairly straight central trunks and many tributaries joining thetrunk at regular intervals and at acute angles (Parvis, 1950; How-ard, 1967), which typically results from uplift and other examplesof tectonic influence (Zernitz, 1932). On the other hand, dendriticnetworks on Earth typically form in environments with relativelylittle tectonic influence, along with gentle regional slopes and rel-atively homogeneous lithologic conditions (e.g. Howard, 1967).
4. Results
4.1. Sediment transport and denudation
Estimates of De determined from values given in Table 1 sug-gest that �10,000 and �6700 Titan years (�2.0–3.0 � 105 Earthyears) are needed for s� to converge with s�c for 1.0 m and 1.5 mconstant flows through a 1400 m wide outlet, giving remnant basinrelief of �240 and �150 m, respectively (Fig. 4). To account for thefact that Titan’s precipitation (and therefore channel flow) may beseasonal (Brown et al., 2002; Griffith et al., 2006; Hueso and San-chez-Lavega, 2006; Rannou et al., 2006; Barth and Rafkin, 2007),De was re-calculated for the summer season only (one-fourth aslong), giving �41,000 and �27,000 Titan years (�8.0–12.0 � 105
Earth years) for h = 1.0 and 1.5 m, respectively. Along with theseintermediate timescale estimates, we present minimum and max-imum values here, using a mix of different denudation inputparameters (see Section 5.2 for discussion of model inputs). Theminimum estimate of 2100 Titan years (6.2 � 104 Earth years)was generated using a 150 mm mid-point grain size, a 1750 mwide channel, and 1.5 m of constant flow. Our maximum estimateof 1.6 � 107 Titan years (4.7 � 108 Earth years) was generatedusing a 1 mm mid-point grain size, a 22 m wide outlet, and 1 mof flow during Titan’s summer season only (flows 25% of the time).These minimum, intermediate, and maximum lowering timescaleestimates demonstrate how denudation scenarios with deeperflows (1.5 m) transporting larger grains (150 mm) require less time

0
100
200
300
400
500
600
0
5,00
0
10,0
00
15,0
00
20,0
00
25,0
00
Titan years
Bas
in re
lief (
m)
D=75 mm, 1.5 m flow, normal widthD=75 mm, 1.5 m flow, +1 pixel widthD=75 mm, 1.5 m flow, -1 pixel widthD=75 mm, 1.5 m flow, -3.75 pixel width
D=75 mm, 1.0 m flow, normal widthD=75 mm, 1.0 m flow, +1 pixel widthD=75 mm, 1.0 m flow, -1 pixel widthD=75 mm, 1.0 m flow, -3.75 pixel width
D=150 mm, 1.5 mflow, normal width
D=1 mm, 1.0mflow, normal widthD=1 mm, 1.5 mflow, normal width
Fig. 4. Change in Basin A’s elevation over the first 25,000 Titan years of the modeled flow scenarios (1 m, 1.5 m), with pixel width adjustments of +0 pixels (1400 m wideoutlet), +1 pixel (1750 m outlet), �1 pixel (1050 m outlet), and �3.75 pixels (88 m outlet). Note the disparity in the displayed lowering rates, stemming from variation in thewidth of the outlet. Of interest, the +/�1 pixel cases for the 1 m flow scenario converge around �25,000 Titan years, and around �15,000 Titan years for the 1.5 m flowscenario. The �3 pixel outlet width case, �3.75 pixel case, and �3.94 pixel case also converge with their respective flow scenario at longer timescales than displayed (�3 and�3.94 pixel runs not shown in the figure). This graphical convergence of the denudation regimes illustrates how the initial impact of a variable outlet width is dampened overtime.
566 R. Cartwright et al. / Icarus 214 (2011) 561–570
to reach their remnant elevations compared to scenarios that mod-eled the transport of smaller grains (1 mm) in shallower flows(1 m).
In the absence of better data regarding the frequency and mag-nitude of precipitation in Titan’s north polar region, we generatedlowering timescale estimates using constant flow duration (as rec-ommended for terrestrial landscape modeling by Tucker and Bras(2000) and Snyder et al. (2003)), and we also provide denudationestimates that assume flows deep enough to transport sedimentonly during Titan’s summer season (25% of the year). Given thatthese lowering timescale estimates assume constant flow (either100% or 25% of the Titan year), it is important to note that theseestimates might be more rapid than the actual rates. Besides theseprimary denudation estimates, we present six additional flowschemes that explore the potential impact of intense and infre-quent storms on sediment transport in Basin A (Table 2). These re-duced flow duration scenarios are included to demonstrate how
Table 2Sensitivity analysis for denudation model using different flow duration estimates. Thefollowing runs were conducted using a uniform grain size of 75 mm and a 1400 mwide channel. See Section 3.2 for symbol definitions.
h(m)
Flow duration(% of Titanyear)
Lowering timescale De Remnantelevation(m)
Remnantslope
Titan years Earthyears
1 1% 1,000,000 2.9E+07 239 �0.0021.5 1% 670,000 2.0E+07 148 �0.0011 0.1% 10,000,000 2.9E+08 239 �0.0021.5 0.1% 6700,000 2.0E+08 148 �0.0012.5 1% 250,000 7.4E+06 85 �0.0015.0 1% 130,000 3.8E+06 41 �0.0004
our denudation model would be affected by both constant andinfrequent flows. Four of the reduced flow duration scenarios(1 m, 1.5 m, 2.5 m, and 5 m flow depths) assume sediment trans-port occurs only 1% of the time (�108 Earth days per Titan year).Furthermore, an additional two flow scenarios (1 m and 1.5 m flowdepths) assume sediment transport occurs only 0.1% of the time(�10.8 Earth days per Titan year).
All denudation calculations are limited to those sediments thatwould likely be transported as bed load and do not include fineparticles that would remain suspended in surficial flows; De valuespresented herein should therefore be considered minimum esti-mates. The proportion of suspended load to bed load is a strongfunction of a given area’s lithology on Earth (Knighton, 1998;Mueller and Pitlick, 2010). Given that lithologic conditions on Titanare unknown, it is not yet possible to estimate the ratio betweencoarser grained sediment, transported as bed load, and finer mate-rial moving in suspension. While large regions of the surface of Ti-tan could be buried by a substantial depth of accumulatedatmospheric particulate matter (e.g. Hayes et al., 2008) that mightbe transported as suspended and dissolved load in fluvial channels,
Table 3Morphometric analysis for Titan Basins A–E and three terrestrial analogs.
Order A B C D E Oman Nevada Pakistan
n 39 49 95 15 20 337 75 22n + 1 13 12 35 5 8 89 22 6n + 2 4 1 9 2 3 25 2 2n + 3 2 N/A 2 1 1 5 1 N/An + 4 1 N/A 1 N/A N/A 2 N/A N/An + 5 N/A N/A N/A N/A N/A 1 N/A N/AMean Rb 2.6 8.1 3.3 2.5 2.7 3.4 5.5 2.9
R. Cartwright et al. / Icarus 214 (2011) 561–570 567
the spatial distribution of depths of this particulate matter are un-known. As such, we only considered the bed load transport ofwater ice cobbles.
Studies regarding crater retention rates (Lorenz et al., 2007b;Wood et al., 2010) suggest that craters are less abundant on Titancompared to other saturnian satellites (by roughly an order ofmagnitude). The dearth of small impact features is not surprisinggiven the dense atmosphere; however, atmospheric processes can-not fully account for the low number of visible craters on Titan’ssurface. Moreover, some of the observed craters on Titan appearto be dissected by channels, perhaps of fluvial origin (Woodet al., 2010). Differentiating the relative significance of geologicalforces that resurface the titanian landscape (including liquid meth-ane precipitation, surficial flows, mass wasting, eolian processes,and cryovolcanic activity) is not yet possible; however, includedestimates of De (Table 1) may provide approximate constraintson the age of the polar surface of Titan. Thus far, the surface ageof Titan has proven difficult to discern from cratering rates alone(Lorenz et al., 2007b), which are hampered by a large range (sev-eral 100 Myr to �1 Gyr) in the cratering rate production estimates(Wood et al., 2010).
Estimates of the width of the main channel at the outlet of BasinA substantially affect the denudation results included herein. Weestimated the width of the channel in accordance with the numberof darkened pixels at the downstream end of Basin A just prior toits confluence with Kraken Mare. In order to account for the possi-bility that the darkened channel does not directly correspond withareas that would transport flow out of Basin A, we include severalscenarios that test the effect of a variable channel width on thedenudation rate by adding/subtracting pixels from the albedo fea-ture (�1400 m unadulterated width). Table 1 summarizes the re-sults of the denudation model using a range of channel widths,including 1750 m (+1 pixel), 1400 m (unaltered width), 1050 m(�1 pixel), 350 m (�3 pixels), 88 m (�3.75 pixels), and 22 m(�3.94 pixels) widths.
4.2. Morphometry
Bifurcation ratios for Titan Basins A–E and the terrestrial ana-logs are given in Table 3, and ordered networks are shown inFig. 2. The mean bifurcation ratios calculated for Basin C and theOman basin fall within the normal range found for dendritic,high-density basins on Earth (3.0 < Rb < 5.0) (Strahler, 1952), andBasin A is slightly below the normal range (Rb = 2.6). Bifurcation ra-tios for the linear, contorted Nevada basin and Basin B are signifi-cantly higher (Rb = 5.5 and 8.1, respectively); both have numeroustributaries that flow roughly orthogonally into a central trunk.Similar (linear) drainage patterns and high Rb values could indicatebasins strongly influenced by tectonics (Zuchiewicz, 1998; Bene-duce et al., 2004), raising the possibility that extensional spreadinghas generated the upland (horst-like) areas that drain into the cen-tral valley (graben-like) of Basin B; others (e.g. Radebaugh et al.,2007) have likewise presumed that tectonics have played animportant role on Titan – for both the generation of initial reliefand for the pooling of large seas of hydrocarbons present nearthe northern pole.
Given the similarity in network patterns observed on Titan toterrestrial equivalents in tectonically active areas, the compara-tively-large bifurcation ratio of Basin B (Rb of 8.1) suggests that up-lift process could have occurred in the vicinity of this basin in the(geologically) recent past. Downstream portions of Basin B appearto be drowned (Stofan et al., 2007). A fluctuating methane (alkanif-er) table (Hayes et al., 2008; Mitchell et al., 2009) could help ex-plain this morphology, similar to eustatic changes that affectterrestrial coastal areas, e.g. Chesapeake Bay in the United States.Titan Basins D and E, and the Pakistan basin provide further exam-
ples of channel networks with flooded trunks and tributaries; Rb
values for these are not significantly different, and network pat-terns are quite similar (Table 3 and Fig. 1D, E, and P). The Pakistanbasin is an eustatically-controlled basin draining directly into theIndian Ocean, and perhaps Basins D and E are controlled in a sim-ilar fashion by a fluctuating base level of the nearby Ligeia Mare(via subsurface alkanifer, see Hayes et al., 2008).
5. Discussion
5.1. Sediment transport and denudation
We used the best data available to calculate sediment transportand denudation rates for basins located in Titan’s north polar re-gion, leading to the generation of estimates that describe one pos-sible scenario for lowering Basin A to its remnant elevation. Still,several caveats warrant mention.
(1) h was held constant herein, while in reality h likely increasesin the downstream direction and fluctuates over time in responseto precipitation events of varying intensity. Current radar imagerydoes not permit a precise determination of fluid depth. This hasimportant implications for calculations of De; deeper (1.5 m) flowswere better able to reduce the bed slope of Basin A than 1.0 mflows (final timestep s = 0.001 and 0.002, respectively), in a signif-icantly shorter amount of time (�6700 and �10,000 Titan years,respectively). Our reasoning behind using 1 m and 1.5 m flows inthe denudation model was to surpass the critical flow depth(�0.6 m) required to initiate the entrainment of 0.075 m waterice grains as bed load (the mid-point grain size considered in ourstudy).
An alterative flow scenario for Titan might be generated byusing precipitation magnitudes and frequencies typical of arid re-gions of Earth that experience infrequent, but intense, rainstorms.To this end, we have included additional scenarios (1 m, 1.5 m,2.5 m, and 5 m flow depths, summarized in Table 2) that assumeappreciable flows only occur for 1% and 0.1% of the Titan year(�108 Earth days per Titan year and �10.8 Earth days per Titanyear, respectively). While the similarities between the annual pre-cipitation patterns that are received in Titan’s polar regions andthose experienced in arid regions on Earth are limited (given thelarge disparity in solar flux and other factors), the large potentialfor infrequent, high-intensity precipitation events on Titan (Lorenz,2000; Hueso and Sanchez-Lavega, 2006; Barth and Rafkin, 2007),warrants such comparisons.
(2) Our analysis uses the mid-point grain size of imaged waterice cobbles at the Huygens’ landing site. The north polar locationof the basins considered in this study are a significant distancefrom the Huygens’ landing site. As such, correlating SAR imageryfrom both locations could strengthen the case for water ice cob-bles, similar to those imaged at the Huygens’ landing site, existingnear the north polar drainage basins and hydrocarbons seas. How-ever, at the highest resolution available for Cassini’s SAR imager(�350 m/pixel), it is difficult to discern how much small waterice cobbles contribute to the returned backscatter from a givenlocation. Recent work by members of the Cassini RADAR team(Le Gall et al., 2010; Janssen et al., 2011) suggests that extremelybright channels imaged on Titan may result from rounded waterice cobbles acting as retroreflectors. However, neither the Huygens’landing site nor the region surrounding the basins analyzed in thisstudy show much evidence of such ultra-bright channels. Givenour limited knowledge regarding surficial grain diameters on Titan,this study uses the range of grains imaged by the Huygens’ probeas a guide for our sediment transport analysis.
(3) We assumed that the width of Basin A’s outlet is representedby the entirety of the albedo feature, with adjustments in channel
568 R. Cartwright et al. / Icarus 214 (2011) 561–570
width (+/�1 pixel, �3 pixels, �3.75 pixels, and �3.94 pixels, de-tailed further below) included to provide some constraint on thepossible width of Basin A’s outlet. It is currently impossible to dis-cern the true width of the outlet because it is unclear whether themouth spans the entire albedo feature, or whether some sort ofmeandering or braided channel system covers the area in fine-grained, organic sediment that might produce a similar radar back-scatter response (Ostro et al., 2006; Soderblom et al., 2007). Whilethe outlet of Basin A might be wider than the observed albedo fea-ture (�1400 m), it seems more likely that the channel is narrowerthan this width; thus, we included four scenarios that test for aprogressively smaller outlet (�1 pixel, 1050 m width; �3 pixels,350 m width; �3.75 pixels, 88 m width; �3.94 pixels, 22 m width),and only one scenario that considers a wider outlet (+1 pixel,1750 m width). By scaling different channel widths with three dif-ferent flow durations (0.1%, 1%, and 100% of Titan year), our denu-dation scenarios implicitly assume that Basin A experiences asubstantial range in the volume of discharge and corresponding re-charge rate.
(4) One of our model’s implicit assumptions is that the land-scape surrounding Basin A is made of cohesionless clasts that tra-vel as bed load. In natural streams on Earth, drainage basins areoften underlain by a mix of unconsolidated sediment and bedrock.The timescales required for fluvial networks to incise bedrock onEarth, as opposed to simply removing unconsolidated sediment,are substantially longer. Subsequent modeling of fluvially-drivenlandscape lowering on Titan would benefit from better informationon the depth of unconsolidated material draping Titan’s basinslopes as well as an improved process understanding of how liquidhydrocarbons interact with (and presumably incise) water icebedrock.
(5) Because the lithology of Titan’s surface is largely unknown,it is currently impossible to determine the proportion of sedimentthat is transported as bed load compared to suspended or dissolvedload in Basin A or elsewhere. While suspended load can be animportant control on the erosion of channel forms in certain envi-ronments (Whipple et al., 2000), most channels are shaped by thetransportation and deposition of bed load material (Leopold, 1992;Church, 2006). We limited this analysis to transport of water iceclasts moving as bed load; future studies may explore the relativeproportions of dissolved, suspended, and bed load material in Ti-tan’s fluvial features as improved information regarding the extentand nature of surficial sediments and detachment properties ofwater ice bedrock becomes available.
5.2. Denudation model sensitivity analysis
Adjustments to the model input parameters can lead to sub-stantial alteration to the resulting timescale estimates; as such, itis useful to explore model sensitivity to changes in basin area, sed-iment size, flow depth and duration, and channel width. We usedthree different mid-point grain sizes in our modeling runs:1 mm, 75 mm, and 150 mm. The 150 mm grain size scenarios gen-erated the shortest lowering timescales (2100–680,000 Titanyears), the steepest remnant slope (�0.004), and the highest rem-nant elevation (�355 m). Contrastingly, 1 mm grain size scenariosresulted in significantly longer lowering timescales (34,000–1.6 � 107 Titan years), lower remnant slopes (�0.00002–0.00003)and lower remnant elevations (2–3 m). Transport of 75 mm grainsgenerated intermediate results: lowering estimates of 5300–2.7 � 107 Titan years, remnant slopes ranging from �0.001 to0.002, and remnant elevation ranging from 148 to 239 m. These re-sults demonstrate that smaller grain sizes lead to longer loweringtimescale estimates because the threshold stress for fine grains issignificantly lower, leading to a much greater amount of materialremoved (lower remnant elevation) compared to model runs that
used coarser grains. We ran the model until flows became incom-petent and unable to transport sediment; as our estimates ofthreshold stress are slope-dependent, this led to a positive feed-back wherein the increasingly gradual slopes led to progressivelylower entrainment values until s� converged with s�c , thereby end-ing the model run.
Other input parameters (flow duration, basin area, channelwidth) modified lowering timescales in a direct and correspondingfashion. One percent flow durations increased the lowering time-scale by two orders of magnitude compared to constant flows(100% flow duration); 0.1% flow duration scenarios increased the100% flow duration lowering timescale by three orders of magni-tude (Table 2). The ±20% range in area for Basin A produces time-scale estimates up to 20% shorter (for an area of 1760 km2) and20% longer (for an area of 2640 km2) compared to lowering time-scales generated using the median area (2200 km2). Changes inchannel width also scale linearly; for example, denudation scenar-ios that use a 1400 m width channel take one-fourth the amount oftime to reach their remnant elevations compared to scenariosusing a 350 m wide outlet, which in turn, lower the landscape ofBasin A four times as fast as runs that use an 88 m wide channel.Channel width variations initially lead to noticeable differencesin the denudation rate for a given flow depth and grain size(Fig. 4); however, after �15,000 Titan years (1.5 m flows) and�25,000 Titan years (1 m flows) the remnant elevation generatedfor the +1/�1 pixel cases (1750 m, and 1050 m outlet widths) con-verge (Fig. 4), and subsequent lowering of Basin A progresses at afairly uniform rate for these outlet widths (350 m, 88 m, and22 m width runs converge with their respective flow depth sce-nario on longer timescales). Furthermore, in all denudation runs1 m flows took longer to lower the landscape, and removed lessmaterial, than the 1.5 m flow scenarios (Table 1).
5.3. Basin resolution and bifurcation scaling
There are inherent difficulties with the interpretation of radarimagery of planetary surfaces (Campbell, 2002); future work thatcompares basins on Earth imaged using synthetic aperture radarwith basins on Titan imaged by Cassini will aid in the interpreta-tion of the titanian channel networks. We note, however, that rivernetworks on Earth often display self-similarity between differentstream orders (Gupta et al., 2007, and references therein), therebyrendering morphometric values, such as Rb, scale independent. Forterrestrial basins, comparing 3rd order to 5th order channel char-acteristics within the same basin is therefore analogous to compar-ing 5th order to 7th order channel segments (Rodriguez-Iturbe andRinaldo, 2001). This scaling similarity suggests that the scaling ra-tios observed between each order of channel segments on Titanshould remain fairly constant, and that differences in image reso-lution (and, consequently, channel order) between the Titan basinsand the terrestrial basins does not bias our morphometric analysis,as supported by empirical evidence (e.g. Peckham and Gupta,1999) supporting scale-independence in Rb values between differ-ent orders of channel segments for basins on Earth.
Of interest to our bifurcation results, recent work examininglarge basins on the martian surface (Hynek et al., 2010) indicatesthat a factor of �2 increase in drainage density measurementswas made possible as a result of improvements in the spatial res-olution of remotely-sensed images. Given that channel networkson both Titan and Mars are remarkably similar in morphology tostream networks on Earth, it seems plausible that a large numberof channels are too small to resolve on Titan given currently-avail-able imagery. While the significant enhancement of spatial resolu-tion that has occurred over the past couple decades on Mars isunlikely to occur for Titan observing platforms in the near future,the small channel networks (�5 km length) observed by the

R. Cartwright et al. / Icarus 214 (2011) 561–570 569
Huygens probe during its descent (Tomasko et al., 2005) indicatethat small, RADAR-unresolved channels exist on Titan’s surface,at least in some locations. Thus, it seems plausible that the num-bers of stream segments of different orders provided herein mayneglect many smaller-order channels that fall below the resolutionlimit of the RADAR instrument onboard Cassini.
5.4. Basin morphologies and potential tectonic influence
Our work analyzes network patterns and bifurcation ratios forfive Titan basins in order to investigate potential tectonic activityon Titan, where the internal processes resulting in initial reliefare not yet identifiable. While the geologic structure and mechan-ics of particle transport are most likely rather different on Titanthan Earth, some of the channel networks observed on the icymoon’s surface (e.g. Basin B) look strikingly similar to tectoni-cally-altered (rectangular) drainage basins on Earth, with subper-pendicular tributaries feeding into a semi-linear central trunk(e.g. Howard, 1967). While the bifurcation ratio of Basin C (3.3)suggests that it has a dendritic morphology, upon visual inspectionof its network pattern, Basin C appears to be closer to ‘subdendritic’which might indicate that it flows through an area with fairly steepslopes compared to other regions of Titan. Subsequent topographicanalysis of the region surrounding Basin C could provide vital ele-vation data that might suggest the potential for fairly vigorous sed-iment transport through the basin (compared to other Titannetworks in less topographically varied regions). As mentionedpreviously, the downstream portion of Basin C was removed fromthis analysis due to difficulties in determining the direction of flowand the location of its outlet. This downstream section includesmultiple examples of right-angle bends, and subperpendiculartributaries, similar to rectangular networks on Earth (e.g. Howard,1967). Whether the geologic processes that helped shape the mor-phology of the upstream and downstream sections of Basin C arerelated is impossible to discern given our limited understandingof Titan’s geologic history. While morphologic characteristics inBasin C strongly suggest former, and potentially ongoing, tectonicactivity, lithologic heterogeneity in different sections of the basin,along with adjustment to a fluctuating alkanifer in the nearby Li-geia Mare, cannot be ruled out as possible drivers of change in Ba-sin C, based on data and imagery available at this time.
It is important to note that our morphometric analysis suggeststhat tectonic controls might have influenced the morphology ofonly Basin B and C. Basin A, D, and E are classified as dendritic(based on their network patterns and low Rb values) and do notdisplay obvious evidence of tectonic influence. While our data donot elucidate which specific tectonic forces may be most influentialin Titan’s north polar areas (see discussion in Radebaugh et al.(2007)), they do support hypotheses of tectonic uplift and conse-quent modification of the drainage basins surrounding the liquidhydrocarbon seas.
Lopes et al. (2009) interpret ridges, hummocky terrain, andsmall mountain ranges as likely products of tectonic processes thatoccurred during an earlier period of Titan’s geologic history. Whilemost of the evidence for tectonic activity is confined to lower lat-itudes, the terrain around the north polar seas is some of the mosttopographically varied on Titan (Stiles et al., 2009), which coupledwith tectonically-suggestive channel networks examined in thispaper draining into the polar seas, could indicate that tectonicshelped shape the polar terrain, although perhaps not in the recentpast.
Using measurements gathered by a nadir-pointing radar altim-eter, and the SAR imaging system onboard Cassini, Zebker et al.(2009) discerned that the poles of Titan lie at lower elevations thanthe equator. The workers go on to suggest that the globally de-pressed poles could help explain why large accumulations of liquid
hydrocarbons are present at Titan’s poles as the lowered surfacepotentially interacts with a semi-continuous alkanifer. However,this does not adequately explain why liquid hydrocarbons prefer-entially accumulate around the north pole of Titan. Aharonsonet al. (2009) proposes that along with seasonal changes, the dispar-ity in the distribution of lakes may be attributed to polar asymme-try in the seasons that leads to shorter and more intense southernsummers. Seasonal fluctuations in the delivery of liquid hydrocar-bons to each pole are likely a significant contributor to the asym-metric distribution of polar lakes, and a detailed comparison ofthe topography of each pole could help elucidate other, possiblygeologic and tectonic, mechanisms that could help explain why Ti-tan’s north pole preferentially accumulates more liquid hydrocar-bons than the south pole.
6. Conclusions
We examined five north polar basins to deduce how observeddifferences in channel network patterns and morphometric rela-tionships may stem from variable tectonic influences, ranging fromrelatively unaffected basins (Basin A) to channel networks thathave strikingly contorted or constrained patterns (Basins B andC) that support hypotheses for regional tectonic uplift. We also em-ploy a novel methodology to estimate denudation rates using sed-iment transport estimates for Basin A; these provide a roughtimescale for the age of Titan’s surface that complements existingsurface aging methods, like crater retention rates, for Titan andother extra-terrestrial bodies. The current cratering productionrate for Titan displays a wide range (several 100 Myr to �1 Gyr)in its surficial age estimates (Wood et al., 2010). Our results sug-gest that �60 Kyr to �470 Myr are required to lower Basin A toits remnant relief (range in values due to differences in mid-pointgrain size, flow height and duration, and width of channel inputparameters). It is possible that the global scale of the cratering pro-duction rate, compared to the localized scale of our denudationrate for Basin A, creates some of the disparity between these time-scale estimates (along with uncertainties in both sets of estimates).Cratering production and denudation rate estimates will likely im-prove as the Titan dataset becomes more robust.
Future work should analyze the network patterns of other ba-sins draining into Titan’s north polar hydrocarbon seas, as well asother examples of similar terrestrial basins. Where the topographicdata are available, calculating the mean slope of basins on Titancould help confirm the potential influence of tectonics and othersub-surface processes on the visible channel networks. These areareas of ongoing research for planetary scientists and geomorphol-ogists, and our results (Section 4) consequently advance our under-standing of the landscape evolution affecting Titan’s north polarareas.
Acknowledgments
This work was greatly improved from written feedback pro-vided by Todd Henry and Lawrence Kiage, and discussions with De-von Burr and J. Taylor Perron. Ralph Lorenz and Geoffrey Collinsprovided helpful comments on earlier versions of this manuscript,along with two anonymous reviewers.
References
Aharonson, O., Hayes, A.G., Lunine, J.I., Lorenz, R.D., Allison, M.D., Elachi, C., 2009. Anasymmetric distribution of lakes on Titan as a possible consequence of orbitalforcing. Nat. Geosci. Lett. 2. doi:10.1038/NGEO698.
Atreya, S.K., 2007. Titan’s organic factory. Science 316, 843–845.Atreya, S.k., Adams, E.Y., Niemann, H.B., Demick-Montelara, J.E., Owen, T.C.,
Fulchignoni, M., Ferri, F., Wilson, E.H., 2006. Titan’s methane cycle. Planet.Space Sci. 54, 1177–1187.
570 R. Cartwright et al. / Icarus 214 (2011) 561–570
Barnes, J.W. et al., 2007. Near-infrared spectral mapping of Titan’s mountains andchannels. J. Geophys. Res. 112, E11006. doi:10.1029/2007JE002932.
Barth, E.L., Rafkin, S.C.R., 2007. TRAMS: A new dynamic cloud model for Titan’smethane clouds. Geophys. Res. Lett. 34, L03203. doi:10.1029/2006GL028652.
Beneduce, P., Festa, V., Francioso, R., Schiattarella, M., Tropeano, M., 2004.Conflicting drainage patterns in the Matera Horst Area, southern Italy. Phys.Chem. Earth 29, 717–724.
Brown, M.E., Bouchez, A.H., Griffith, C.A., 2002. Direct detection of variabletropospheric clouds near Titan’s south pole. Nature 420, 795–797.
Buffington, J.M., Montgomery, D.R., 1997. A systematic analysis of eight decades ofincipient motion studies, with special reference to gravel-bedded rivers. WaterResour. Res. 33, 1993–2029.
Burr, D.M., Emery, J.P., Lorenz, R.D., Collins, G.C., Carling, P.A., 2006. Sedimenttransport by liquid surficial flow: Application to Titan. Icarus 181, 235–242.
Campbell, B.A., 2002. Radar Remote Sensing of Planetary Surfaces. Cambridge Univ.Press, Cambridge.
Cartwright, R., 2009. Analysis of Channel Networks and the Potential for SedimentTransport in the Vicinity of the North Polar Seas of Titan. Thesis, Georgia StateUniversity, Atlanta.
Church, M., 2006. Bed material transport and the morphology of alluvial riverchannels. Annu. Rev. Earth Planet. Sci. 34, 325–354.
Clayton, J.A., Pitlick, J., 2007. Spatial and temporal variations in bed load transportintensity in a gravel bed river bend. Water Resour. Res. 43, W02426.doi:10.1029/2006WR005253.
Collins, G.C., 2005. Relative rates of fluvial bedrock incision on Titan and Earth.Geophys. Res. Lett. 32, L22202. doi:10.1029/2005GL024551.
Einstein, H.A., 1950. The bed-load function for sediment transportation in openchannel flows. US Dept. Agric. Soil Conserv. Serv. Tech. Bull., 1026.
Ellis, M.A., Densmore, A.L., Anderson, R.S., 1999. Development of mountainoustopography in the Basin Ranges, USA. Basin Res. 11, 21–41.
Griffith, C.A., Owen, T., Gaballe, T.R., Rayner, J., Rannou, P., 2003. Evidence for theexposure of water ice on Titan’s surface. Science 300, 628–630.
Griffith, C.A. et al., 2006. Evidence for a polar ethane cloud on Titan. Science 313,1620–1622.
Gupta, V.K., Troutman, B.M., Dawdy, D.R., 2007. Towards a nonlinear geophysicaltheory of floods in river networks: An overview of 20 years of progress. In:Tsonis, A.A., Elsner, J.B. (Eds.), Nonlinear Dynamics in Geosciences. Springer,New York, pp. 121–151.
Hayes, A. et al., 2008. Hydrocarbon lakes on Titan: Distribution and interaction witha porous regolith. Geophys. Res. Lett. 35, L09204. doi:10.1029/2008GL033409.
Howard, A.D., 1967. Drainage analysis in geologic interpretation: A summation. Am.Assoc. Petrol. Geol. Bull. 51, 2246–2259.
Hueso, R., Sanchez-Lavega, A., 2006. Methane storms on Saturn’s moon Titan.Nature 442, 428–431.
Hynek, B.M., Beach, M., Hoke, M.R.T., 2010. Updated global map of martian valleynetworks and implications for climate and hydrologic processes. J. Geophys.Res. 115, E09008. doi:10.1029/2009JE003548.
Janssen, M.A., Le Gall, A., Wye, L.C., 2011. Anomalous radar backscatter from Titan’ssurface? Icarus 212, 321–328.
Jaumann, R. et al., 2008. Fluvial erosion and post-erosional processes on Titan.Icarus 197, 526–538.
Knighton, A.D., 1998. Fluvial Forms and Processes – A New Perspective. Arnold,London.
Lague, D., Crave, A., Davy, P., 2003. Laboratory experiments simulating thegeomorphic response to tectonic uplift. J. Geophys Res. 108. doi:10.1029/2002JB001785.
Le Gall, A., Janssen, M.A., Paillou, P., Lorenz, R.D., Wall, S.D., Cassini RADAR Team,2010. Radar-bright channels on Titan. Icarus 207, 948–958. doi:10.1016/j.icarus.2009.12.027.
Leopold, L.B., 1992. Sediment size that determines channel morphology. In: Billi, P.,Hey, R.D., Thorne, C.R., Tacconi, P. (Eds.), Dynamics of Gravel-bed Rivers. JohnWiley & Sons, Chichester, pp. 299–311.
Lopes, R.M.C. et al., 2009. Distribution and interplay of geologic processes on Titanfrom Cassini RADAR data. Icarus 205, 540–558. doi:10.1016/j.icarus.2009.08.010.
Lorenz, R.D., 2000. The weather on Titan. Science 290, 467–468.Lorenz, R.D., Lunine, J.I., 2005. Titan’s surface before Cassini. Planet. Space Sci. 53,
557–576.Lorenz, R.D., Kraal, E., Asphaug, E., Thomson, R.E., 2003. The seas of Titan. Eos 84
(14), 125–132.Lorenz, R.D. et al., 2007a. Titan’s inventory of organic surface materials. Geophys.
Res. Lett. 35, L02206. doi:10.1029/2007GL032118.Lorenz, R.D. et al., 2007b. Titan’s young surface: Initial crater survey by Cassini
RADAR and model comparison. Geophys. Res. Lett. 34, L07204. doi:10.1029/2006GL028971.
Lorenz, R.D. et al., 2008. Fluvial channel on Titan: Initial Cassini RADARobservations. Planet. Space Sci. 1016, 1–13.
Lunine, J.I., Atreya, S.K., 2008. The methane cycle on Titan. Nat. Geosci. 1, 159–164.Lunine, J.I., Lorenz, R.D., 2009. Rivers, lakes, dunes, and rain: Crustal processes in
Titan’s methane cycle. Annu. Rev. Earth Planet. Sci. 37, 299–320.Mejia, A.I., Niemann, J.D., 2008. Identification and characterization of dendritic,
parallel, pinnate, rectangular, and trellis networks based on deviations fromplanform self-similarity. J. Geophys. Res. 113, F02015. doi:10.1029/2007JF000781.
Meyer-Peter, E., Muller, R., 1948. Formulas for bedload transport. In: Report on 2ndMeeting, Intl. Assoc. of Hydraul. Struct. Res., Stockholm, Sweden, pp. 39–64.
Mitchell, K.L. et al., 2009. A global sub-surface alkanifer system on Titan? LunarPlanet. Sci. 40. Abstract 1966.
Montgomery, D.R., Brandon, M.T., 2002. Topographic controls on erosion rates intectonically active mountain ranges. Earth Planet. Sci. Lett. 201 (3–4), 481–489.doi:10.1016/S0012-821X(02)00725-2.
Mueller, E., Pitlick, J., 2010. Lithology, Sediment Supply, and Channel Morphology inthe Northern Rocky Mountains, USA. Poster Prepared for Gravel Rivers 7Conference. Tadoussec, Canada. <http://www.geog.umontreal.ca/gbr7/PosterWeb/Mueller%20and%20Pitlick.pdf>.
Mueller, E., Pitlick, J., Nelson, J.M., 2005. Variation in the reference Shields stress forbed load transport in gravel-bed streams and rivers. Water Resour. Res. 41,W04006. doi:10.1029/2004WR003692.
Ostro, S.J. et al., 2006. Cassini RADAR observations of Enceladus, Tethys, Dione,Rhea, Iapetus, Hyperion, and Phoebe. Icarus 183, 479–490.
Parvis, M., 1950. Drainage pattern significance in airphoto identification of soils andbedrocks. Photogramm. Eng. 16, 375–409.
Peckham, S.D., Gupta, V.K., 1999. A reformation of Horton’s laws for large rivernetworks in terms of statistical self-similarity. Water Resour. Res. 35, 2763–2777.
Perron, J.T., Lamb, M.P., Koven, C.D., Fung, I.Y., Yager, E., Adamkovics, M., 2006.Valley formation and methane precipitation rates on Titan. J. Geophys. Res. 111,E11001. doi:10.1029/2205JE002602.
Petit, C., Fournier, M., Gunnell, Y., 2007. Tectonic and climatic controls on riftescarpments: Erosion and flexural rebound of the Dhofar passive margin (Gulfof Aden, Oman). J. Geophys. Res. 112, B03406. doi:10.1029/2006JB004554.
Phillips, L.F., Schumm, S.A., 1987. Effect of regional slope on drainage networks.Geology 15, 813–816.
Radebaugh, J., Lorenz, R.D., Kirk, R.L., Lunine, J.I., Stofan, E.R., Lopes, R.M.C., Wall,S.D., 2007. Mountains on Titan observed by Cassini RADAR. Icarus 192, 77–91.
Rannou, P., Montmessin, F., Hourdin, F., Lebonnois, S., 2006. The latitudinaldistribution of clouds on Titan. Science 311, 201–205.
Ritter, D., Kochel, R., Miller, J., 2002. Process Geomorphology. Waveland Press Inc.,Long Grove, Illinois.
Rodriguez-Iturbe, I., Rinaldo, A., 2001. Fractal River Basins: Chance and Self-Organization. Cambridge Univ. Press, Cambridge.
Sklar, L.S., Dietrich, W.E., 2001. Sediment and rock strength controls on riverincision into bedrock. Geology 29 (12), 1087–1090. doi:10.1130/0091-7613(2001)029<1087:SARSCO>2.0.CO;2.
Snyder, N.P., Whipple, K.X., Tucker, G.E., Merritts, D.J., 2000. Landscape response totectonic forcing: Digital elevation model analysis of stream profiles in theMendocino triple junction region, northern California. Geol. Soc. Am. Bull. 112(8), 1250–1263. doi:10.1130/0016-7606(2000)112<1250:LRTTFD>2.0.CO;2.
Snyder, N.P., Whipple, K.X., Tucker, G.E., Merritts, D.J., 2003. Importance of astochastic distribution of floods and erosion thresholds in the bedrock riverincision problem. J. Geophys. Res. 108 (B2), 2117. doi:10.1029/2001JB001655.
Soderblom, L. et al., 2007. Correlations between Cassini VIMS spectra and RADARSAR images: Implications for Titan’s surface composition and the character ofthe Huygens probe landing site. Planet. Space Sci. 55, 2025–2036.
Stiles, B.W. et al., 2009. Determining Titan surface topography from Cassini SARdata. Icarus 202, 584–598.
Stock, G.M., Anderson, R.S., Finkel, R.C., 2004. Pace of landscape evolution in theSierra Nevada, California, revealed by cosmogenic dating of cave sediments.Geology 32 (3), 193–196. doi:10.1130/G20197.1.
Stofan, E.R. et al., 2007. The lakes of Titan. Nature 445, 61–64.Strahler, A., 1952. Dynamic basis of geomorphology. Geol. Soc. Am. Bull. 63, 923–
938.Thompson, W., 1984. A Physical and Chemical Study of Titan: Atmosphere, Clouds,
and Hazes. Ph.D. Dissertation, Cornell U, Ithaca. 504pp.Tomasko, M.G. et al., 2005. Rain, winds and haze during the Huygens probe’s
descent to Titan’s surface. Nature 438, 765–778.Tran, B.N., Ferris, J.P., Chera, J.J., 2003. The photochemical formation of a Titan haze
analog. Structural analysis by X-ray photoelectron and infrared spectroscopy.Icarus 162, 114–124.
Tucker, G.E., 2009. Natural experiments in landscape evolution. Earth Surf. Proc.Land. 34, 1450–1460.
Tucker, G.E., Bras, R.L., 2000. A stochastic approach to modeling the role of rainfallvariability in drainage basin evolution. Water Resour. Res. 36 (7), 1953–1964.doi:10.1029/2000WR900065.
Tucker, G.E., Hancock, G.R., 2010. Modeling landscape evolution. Earth Surf. Process.Land. 35 (1), 28–50. doi:10.1002/esp.1952.
Whipple, K.X., Tucker, G.E., 1999. Dynamics of the stream-power river incisionmodel: Implications for height limits of mountain ranges, landscape responsetimescales, and research needs. J. Geophys. Res. 104 (B8), 17661–17674.doi:10.1029/1999JB900120.
Whipple, K.X., Hancock, G.S., Anderson, R.S., 2000. River incision into bedrock:Mechanics and relative efficacy of plucking, abrasion, and cavitation. Geol. Soc.Am. Bull. 112, 490–503.
Wood, C.A., Lorenz, R., Kirk, R., Lopes, R., Mitchell, K., Stofan, E.the Cassini RADARTeam, 2010. Impact craters on Titan. Icarus 206, 334–344. doi:10.1016/j.icarus.2009.08.021.
Zebker, H.A., Stiles, B., Hensley, S., Lorenz, R.D., Kirk, R.L., Lunine, J.I., 2009. Size andshape of Saturn’s moon Titan. Science 324. doi:10.1126/science.1168905.
Zernitz, E.R., 1932. Drainage patterns and their significance. J. Geol. 40, 498–521.Zuchiewicz, W., 1998. Quaternary tectonics of the Outer West Carpathians, Poland.
Tectonophysics 297, 121–132.