
Digital Morphometry : A Taxonomy Of Morphological Filters ...

Quantitative Morphometry of ElectrophysiologicallyIdentified CA3b Interneurons Reveals Robust LocalGeometry and Distinct Cell Classes
GIORGIO A. ASCOLI,1* KERRY M. BROWN,1 EDUARDO CALIXTO,2 J. PATRICK CARD,3 E.J. GALVAN,3
T. PEREZ-ROSELLO,3 AND GERMAN BARRIONUEVO3
1Center for Neural Informatics, Structures, & Plasticity, and Molecular Neuroscience Department, Krasnow Institute for AdvancedStudy, George Mason University, Fairfax, Virginia 220302Instituto Nacional de Psiquiatrıa Ramon de la Fuente Muniz, Mexico City, DF Mexico3Department of Neuroscience, University of Pittsburgh, Pittsburgh, Pennsylvania 15260
ABSTRACTThe morphological and electrophysiological diversity of in-hibitory cells in hippocampal area CA3 may underlie specificcomputational roles and is not yet fully elucidated. In par-ticular, interneurons with somata in strata radiatum (R) andlacunosum-moleculare (L-M) receive converging stimula-tion from the dentate gyrus and entorhinal cortex as well aswithin CA3. Although these cells express different forms ofsynaptic plasticity, their axonal trees and connectivity arestill largely unknown. We investigated the branching andspatial patterns, plus the membrane and synaptic proper-ties, of rat CA3b R and L-M interneurons digitally recon-structed after intracellular labeling. We found considerablevariability within but no difference between the two layers,and no correlation between morphological and biophysicalproperties. Nevertheless, two cell types were identifiedbased on the number of dendritic bifurcations, with signifi-cantly different anatomical and electrophysiological fea-
tures. Axons generally branched an order of magnitudemore than dendrites. However, interneurons on both sidesof the R/L-M boundary revealed surprisingly modular axo-dendritic arborizations with consistently uniform localbranch geometry. Both axons and dendrites followed a la-mellar organization, and axons displayed a spatial prefer-ence toward the fissure. Moreover, only a small fraction ofthe axonal arbor extended to the outer portion of the in-vaded volume, and tended to return toward the proximalregion. In contrast, dendritic trees demonstrated more lim-ited but isotropic volume occupancy. These results suggesta role of predominantly local feedforward and lateral inhib-itory control for both R and L-M interneurons. Such a rolemay be essential to balance the extensive recurrent excita-tion of area CA3 underlying hippocampal autoassociativememory function. J. Comp. Neurol. 515:677–695, 2009.© 2009 Wiley-Liss, Inc.
Indexing terms: axons; branching; dendrites, feed-forward inhibition; hippocampus; lateralinhibition; stratum lacunosum-moleculare; stratum radiatum
The diversity of cortical interneurons is reflected in molec-ular, electrophysiological, and anatomical features (Maccaf-erri and Lacaille, 2003; Klausberger and Somogyi, 2008). Ex-pression patterns of neurotransmitter receptors and voltage-gated channels determine key biophysical properties, andmolecular markers such as calcium-binding proteins and neu-ropeptides also identify specific neuronal types (Blatow et al.,2005; Toledo-Rodriguez et al., 2005; Sugino et al., 2006). Mor-phological studies have provided essential insights into howinterneurons function within the modular architecture of thecerebral cortex (Douglas and Martin, 2004) and subfields ofthe hippocampus (Bernard and Wheal, 1994). Particularly im-portant in this regard have been technical advances permit-ting three-dimensional rendering of entire neurons from serialsections rather than camera lucida tracing of cells within asingle section (Ascoli, 2006). Quantitative morphometric anal-
ysis of dendritic and, especially, axonal arbors from thesedetailed digital reconstructions yielded recent breakthroughsinto neuronal function within larger circuits (Shepherd et al.,2005; Stepanyants et al., 2008).
Grant sponsor: Human Brain Project joint sponsors—National Institute ofNeurological Disorders and Stroke, National Institute of Mental Health, andNational Science Foundation; Grant numbers: NS24288, AG25633, andNS39600.
*Correspondence to: Giorgio A. Ascoli, George Mason University, 4400University Dr. - MS2A1, Fairfax, VA 22030-4444. E-mail: [email protected]
Received 23 January 2009; Revised 20 February 2009; Accepted 27March 2009
DOI 10.1002/cne.22082Published online April 3, 2009 in Wiley InterScience (www.interscience.wiley.
com).
The Journal of Comparative Neurology 515:677–695 (2009)
Research in Systems Neuroscience
© 2009 Wiley-Liss, Inc.

The power of this approach has recently been increased bycombining morphometric and electrophysiological analysis inneocortical interneurons (Dumitriu et al., 2007; Helmstaedteret al., 2008). In the study of hippocampal interneurons, how-ever, this combined characterization has to date been largelylimited to the dentate gyrus (Mott et al., 1997), CA1 dendritictrees (Gulyas et al., 1999), or tangential observations (McQuis-ton and Madison, 1999).
In the hippocampus, area CA3 plays prominent roles inmemory function (McNaughton and Morris, 1987; Treves andRolls, 1992) and pathological conditions such as epilepsy(Avoli et al., 2002; Fisahn, 2005). The CA3 circuitry is distin-guished by preponderant recurrent collaterals among pyrami-dal cells, as well as converging laminar excitation from theentorhinal perforant path and dentate mossy fibers (Witter etal., 1988; Witter, 2007). This organization may subserve thecomplementary abilities of CA3 to minimize recall errors by“pattern completion” and to decorrelate incoming corticalfiring patterns into distinct events by “pattern separation”(O’Reilly and McClelland, 1994; Lisman, 1999; Leutgeb et al.,2007). Interneurons with soma in the strata radiatum (R) andlacunosum-moleculare (L-M) of area CA1 have been shown tomodulate the entorhinal influence on pyramidal cells (Freundand Antal, 1988) through feedforward inhibition (Kunkel et al.,1988; Khazipov et al., 1995; Christie et al., 2000; Savic et al.,2001; Cope et al., 2002; Martina et al., 2003).
Although R and L-M interneurons in area CA3 have notbenefited from similar detailed analysis, they are major recip-ients of glutamatergic input (Buhl et al., 1994; Gulyas et al.,1993) from recurrent collaterals (RCs), perforant path (PP), andmossy fibers (MF). In turn, R and L-M interneurons modulateCA3 pyramidal activity through dendritic shunting and so-matic inhibition (McBain and Fisahn, 2001; Romo-Parra et al.,2008).
At least some of the excitatory inputs to R and L-M inter-neurons in CA3 exhibit several forms of long-term synapticplasticity (long-term potentiation/depression [LTP/LTD]) trig-gered by a rise in cytosolic Ca2� concentration (Laezza et al.,1999; Kullman and Lamsa, 2007). Unlike in pyramidal cells,however, the differential expression of glutamate receptorsubtypes in hippocampal interneurons may yield predomi-nantly calcium-permeable (CP) or calcium-impermeable (CI)AMPA receptor (AMPAR)-containing synapses (McBain andFisahn, 2001; Kullman and Lamsa, 2007; Galvan et al., 2008).Distinct AMPAR subunit composition could underlie the mul-tiplicity of interneuron synaptic plasticity, particularly with re-spect to the mechanisms controlling the induction and polar-ity of long-term modifications. Although the layer location ofthe soma is not generally regarded as a significant criterion forinterneuron classification (Klausberger and Somogyi, 2008),considerable differences in LTP/LTD mechanisms betweenCA3 R and L-M interneurons raise the possibility that synapticplasticity in these interneurons could be layer dependent (Zia-kopoulos et al., 1999). Specifically, changes in synapticstrength in R interneurons are induced at predominately CP-AMPAR synapses, whereas cells expressing mostly CI-AMPAreceptors lack use-dependent plasticity (Laezza et al., 1999).
Depending on the membrane potential, high-frequencystimulation (HFS) leads to either LTP or LTD (Laezza andDingledine, 2004). In contrast, bidirectional plasticity in L-Minterneurons occurs solely at predominantly CI-AMPAR-
containing synapses, and is contingent on the activation ofL-type Ca channels and the availability of metabotropic glu-tamate receptor 1� (mGluR1�) (Galvan et al., 2008). It is thuspossible that R and L-M interneurons might be distinguishedon the basis of the mechanisms underlying long-term plastic-ity.
Persistent changes in the strength of the excitatory input tointerneurons will affect the input-output relationship betweenprincipal cells, the excitability of the neuronal network, andthe generation of rhythmic oscillations. Therefore, the degreeto which different forms of long-term synaptic plasticity aresegregated in specific layers may represent a relevant func-tional component of information processing and dynamics inarea CA3 (McBain and Maccaferri, 1997). Recent evidencefrom the neocortex indicates that structural remodeling ofadult dendrites in �-aminobutyric acid (GABA)ergic interneu-rons might also be limited selectively to a layer-specific “dy-namic zone” (Lee et al., 2008). Synaptic plasticity may be animportant determinant in the classification of neocortical andhippocampal interneurons alike, especially if complementedwith the quantitative morphological characterization of bothaxons and dendrites, which subserve network connectivity. Inthe present investigation we sought to gain further insight intothe diversity and possible functional roles of hippocampalinterneurons through detailed morphometric analysis of elec-trophysiologically identified CA3b R and L-M cells.
MATERIALS AND METHODSSlice preparation
Animal use was in accordance with the University of Pitts-burgh Institutional Animal Care and Use Committee. MaleSprague-Dawley rats (22 � 4 days old) were deeply anaesthe-tized with Nembutal, perfused intracardially with modified ar-tificial cerebrospinal fluid, and decapitated. Tissue blockscontaining the hippocampus were sectioned (350 �m/section)at an angle of 30° to the long axis of the hippocampus with aLeica (Nussloch, Germany) VT1000S Vibratome. Slices weremaintained for at least 60 minutes at room temperature in anincubation solution (composition in mM: 125 NaCl, 2.0 KCl, 1.2NaH2PO4, 25.0 NaHCO3, 10.0 glucose, 1.0 CaCl2 and 6.0MgCl2; pH 7.4) with bubbled O2 (95%)/CO2 (5%). The sliceswere then transferred to a submerged recording chamber andsuperfused at constant flow (2.5 ml/min) with the followingsolution (in mM): 125 NaCl, 3.0 KCl, 1.25 Na2HPO4, 25NaHCO3, 2.0 CaCl2, 1.0 MgCl2, 10 glucose, 0.01 bicuculline;0.05 D-2-amino-5-phosphonopentanoic acid (AP5), pH 7.4 at33 � 1°C.
Recording and stimulation techniquesSomata of interneurons in the stratum radiatum (R) and
stratum lacunosum-moleculare (L-M) of hippocampal areaCA3b (60–80 �m from the slice surface) were identified byinfrared-differential interference contrast (IR-DIC) optics of aZeiss FS2 microscope (Carl Zeiss, Oberkochen, Germany)fitted with a water immersion objective (40� or 60�). Patchpipettes with electrical resistances of 3–6 M� were pulledfrom borosilicate glass and filled with a solution containing (inmM: 120 potassium methyl sulfate, 10 KCl, 10 HEPES, 0.5EGTA, 4.5 Mg.ATP, 0.3 Na2GTP, 14 phosphocreatine. Biocy-tin, 0.5% (Molecular Probes, Eugene, OR), was routinely
Research in Systems Neuroscience The Journal of Comparative Neurology
678 G.A. ASCOLI ET AL.

added to the pipette solution to allow subsequent morpho-logical identification and reconstruction of the neurons.
Current clamp recordings were obtained with a Cornerstoneamplifier (model BVC-700A, Dagan, Minneapolis, MN); voltageclamp recordings were obtained with an Axoclamp-1D ampli-fied (Axon Instruments, Union City, CA). Membrane potentialwas measured after breaking into whole-cell mode, and wasnot corrected for changes in junction potential. Whole-cellrecordings were accepted only if seal resistance was >2 G�and if the resting membrane potential was more negative than�65 mV. Signals were low-pass filtered at 3–5 kHz, digitized at10 or 20 kHz, and stored on disk for off-line analysis. Dataacquisition and analysis were performed by using LabView(National Instruments, Austin, TX) with customized programs.
Extracellular stimulation with bipolar nichrome electrodes(62 �m in diameter) consisted of single monopolar pulses(100–300 �A, 50–100 �s, 0.2 Hz). To activate the perforantpath (PP) and minimize the spurious activation of mossy fibers(MF), the stimulation electrode was placed in the stratumlacunosum-moleculare of area CA1 far from CA3, and close tothe hippocampal fissure (Henze et al., 1997). In addition, theprobability of antidromic stimulation of CA3 pyramidal cellsand activation of CA3 collaterals was reduced by applying lowcurrent intensities resulting in responses with amplitude<30% of the threshold required to fire the interneurons. Ear-lier current source density analysis (Berzhanskaya et al., 1998)showed a large sink restricted to between 50 and 150 �m fromthe hippocampal fissure and a current source in the stratumradiatum, followed milliseconds later by a current source inthe CA3 stratum pyramidale, indicating specific activation ofPP synapses. The MF pathway was activated by placing thestimulating electrode in the medial extent of the suprapyrami-dal blade of the dentate gyrus. The recurrent collateral path-way (RC) was activated by placing an electrode in the stratumpyramidale of area CA3b.
Electrophysiological data analysisInput resistance (Ri) reported here is the slope of the best-fit
line to the linear portion of the relation between the injectedcurrent step (500 ms, 5–20 pA, 3–5 sweeps each at 0.2 Hz) andthe membrane potential at the end of the step. Membranetime constant () was determined by fitting a single exponen-tial to the response to long (500-ms) hyperpolarizing currentsteps (�10 to �30 pA). Action potential (AP) amplitude andthreshold were measured for each spike in a train evoked bydepolarizing current injections. AP amplitude was determinedfrom the AP threshold to the peak of the spike. AP thresholdwas computed by initially determining the AP peak from themembrane potential first derivative, and then by looking backto the point where the membrane potential third derivativechanged from negative to positive (Henze et al., 2000). Theafterhyperpolarization (AHP) was measured from AP thresholdto the hyperpolarization peak. The spike adaptation ratio (AR)of the first to last interspike interval within a sweep wasquantified upon a depolarizing step of 150 pA above thecurrent threshold for the first spike for each cell (Porter et al.,2001).
Based on this measure, interneurons were grouped eitheras adapting (AR > 1.3) or nonadapting (AR < 1.25). Quantita-tive analysis of the excitatory postsynaptic potentials (EPSPs)was performed by using customized programs written in LabView. For measuring EPSP amplitude, cursors were posi-
tioned 5 ms before the stimulation artifact and at 100 ms afterthe onset of the EPSP. The EPSP rise was determined bysubtracting the times corresponding to 20% and 80% of thevalue of EPSP peak amplitude. The EPSP decay time constantwas calculated between 1 and 3 ms after the EPSP peakamplitude and the end of the EPSP waveform. We used athird-order exponential function to fit the decay of the EPSP.
Cell labeling, digital reconstruction, and publicavailability of data
Following recordings, slices were fixed in cold 4% parafor-maldehyde for 72 hours and transferred into an antifreezesolution (1:1 mixture of glycerol and ethylene glycol in 0.1 mphosphate buffer). Slices were then resectioned at 60 mM byusing a freezing microtome, reacted with 1% H2O2 to reduceendogenous peroxidase reactivity and placed in blocking se-rum with 0.5% Triton X-100 for 2 hours at room temperature.Biocytin-labeled neurons were revealed by using the Vec-tastain Elite kit (Vector, Burlingame, CA), and the resultingdiaminobenzidine reaction product was intensified with nickelammonium sulfate to produce a blue-black reaction product.Cells were photographed by using a Zeiss Axioplan photomi-croscope equipped with a Hamamatsu digital camera(Hamamatsu Photonics, Hamamatsu, Japan). The contrastand brightness of individual images was manually adjustedwith Adobe (San Jose, CA) Photoshop software for optimalclarity, and the final plates were assembled by using AdobeIllustrator software.
All interneurons were reconstructed by the same operatorby using the Neurolucida tracing system (MicroBrightField,Williston, VT) attached to a Nikon Optiphot-2 photomicro-scope equipped with a 100� planapochromatic lens (NA 1.4) and additional Optovar magnification of 1.6� (final opticalmagnification, 1,600�; screen magnification, 7,200�). The celland all labeled processes were faithfully mapped in all serialsections that contained labeled profiles. Processes were colorcoded as dendrites or axons based on morphological fea-tures. Processes that progressively decreased in cross-sectional diameter with increasing distance from the cellsoma and with each bifurcation were classified as dendrites.Axons consisted of highly branched process that exhibitednumerous en passant boutons separated by intervaricosesegments of uniform diameter.
The entire somatodendritic compartment of each labeledneuron, as well as the full extent of the axonal arbor, wasreconstructed from all sections containing labeled profiles.This was achieved by maintaining the serial order of 60-�msections cut on the freezing microtome, mapping all labeledprofiles within each section, and then by using anatomicallandmarks to align sections in the appropriate registration.Labeled portions of the same processes identified in adjacentsections were then used to make the final alignment of alllabeled profiles. The final reconstruction was produced byrepeating this process for all adjacent sections that containedlabeled profiles and merging the maps into a single file byusing Neurolucida software. The final Neurolucida output(.asc) files were converted to the non-proprietary SWC format(Ascoli et al., 2001) with the freely available L-Measure soft-ware (Scorcioni et al., 2008; http://krasnow.gmu.edu/cn3). Thevisualization and editing application Cvapp (Cannon et al.,1998) was then employed together with a semiautomatedquality-check process (Halavi et al., 2008) to find and adjust
Research in Systems NeuroscienceThe Journal of Comparative Neurology
679QUANTITATIVE MORPHOMETRY OF CA3b INTERNEURONS

connectivity inconsistencies, as well as to correct for shrink-age in the depth of the slice (Z coordinate). The shrinkagefactor, measured by focusing on the top and bottom of eachsection and dividing this distance by the nominal slice thick-ness, ranged between 0.53 and 0.76.
All reconstruction files of both axons and dendrites arepublicly available for download at NeuroMorpho.Org (Ascoli etal., 2007). Some dendritic reconstructions previously col-lected by other investigators were also obtained from thissame archive in the course of our study for the purpose ofcomparative analysis, as described in the Results section. Wenote that NeuroMorpho.Org also currently contains 29 inter-neurons from area CA1 of the mouse (Yuste archive) withthree-dimensional reconstructions of the axonal arbor. How-ever, because these morphologies have not yet been de-scribed in the published literature, we refrained from includingtheir quantitative analysis in this report.
Quantitative morphometryMorphological reconstructions were digitally represented
as a series of tubular compartments corresponding to a pairof tracing points, and specified by their type (axon vs. den-drite), three-dimensional coordinates, thickness, and internal(parent-to-child) connectivity (Ascoli, 2006). Following theconventional “Petilla” terminology (Ascoli et al., 2008), werefer to an internal or terminal branch as the portion betweentwo bifurcations and between a bifurcation and a termination,respectively. We further define a tree as the collection ofinterconnected branches stemming from the soma, and anarborization as the set of trees in a neuron. Morphometricparameters were extracted with L-Measure and with the Neu-rolucida analysis tool NeuroExplorer (Glaser and Glaser,1990). Many of these morphometrics are self-explanatory, buta few are explained below.
The branch order is the number of bifurcations in the path tothe soma. Path distance measures the length along the neu-rite, as opposed to Euclidean distance, which measures thestraight line. Taper rate records the diameter change as theratio between the ending and starting points of each branch.The bifurcation diameter drop is the ratio between the diam-eters of the parent and the largest of the child branches. Thebifurcation amplitude and tilt angles are delineated by the twochild branches, and by the parent and the most bent child,respectively. The partition asymmetry equals |N1 � N2|/(N1 �N2 � 2), where N1 and N2 are the number of terminals eachchild of the bifurcation leads to. Contraction measures thetortuosity of dendritic or axonal meandering as the ratio ofEuclidean to path lengths of each branch. The fractal dimen-sion captures the space-filling qualities of a structure, and canbe specified locally for individual branches or globally for thewhole neuron with the caliper and box-counting methods,respectively (Smith et al., 1996). Principal component analysisdetermines the orientation of the three orthogonal axes thatare best aligned with an arborization. The isotropy of thearbor, computed as the ratio between the minor and majoraxis components, is close to 1 for spherical shapes and to 0for planar or elongated shapes. Many morphometrics can becharacterized as functions of distance from the soma (Sholl-like diagrams) or within binned angular deviations relative tothe soma (polar histograms).
The longitudinal spread of a given cell was estimated astwice the standard deviation of the Euclidean distances of all
tracing points from the soma in the septotemporal direction.This measure approximates the 95% distribution range alongthe longitudinal hippocampal axis. Similarly, the transversespread is twice the standard deviation of the Euclidean dis-tances of all tracing points from the soma in the plane definedby the directions from CA3a to CA3c and from the hippocam-pal fissure to the alveus. The lamellar ratio is the transversespread divided by the longitudinal spread; it describes thetendency of a cell to be confined perpendicular to the septo-temporal extent. Space occupancy was analyzed by dividingthe smallest sphere centered at the soma and containing theentire neuron either into two hemispheres separated by one ofthree orthogonal planes defined by the axes described above(longitudinal, CA3a/CA3c, and fissure/alveus), or into eightsectors. The volume of all branches in each hemisphere orsector was then summed for statistical comparison.
Statistical analysisMann-Whitney nonparametric U tests were performed to
compare anatomical, electrophysiological, and morphometricmeasures between cell groups. Significance was determinedby two-tailed exact (as opposed to asymptotic) P values un-less otherwise noted. The Kolmogorov-Smirnov D test wasemployed to determine whether the number of dendriticbranches for each cell was consistent with a single cell type,by using uniform or Poisson distributions compatible with thelow integer values. Pearson’s R was computed to quantify thecorrelation between measurement pairs, with P values indi-cating the probability of two independent distributions. Theuniformity of space occupancy across multiple sectors waschecked with the Kruskall-Wallis H test, with a post hocMann-Whitney test to extract significant binary differencesbetween sectors/groups. False Discovery Rate was used toadjust for multiple comparisons when appropriate. All regres-sion lines were obtained by residual error minimization.
RESULTSWhole-cell recordings were obtained from a total of 79
interneurons with somata located in the stratum radiatum (R;n 23) and stratum lacunosum-moleculare (L-M; n 56) ofthe CA3b area. The somata of R and L-M interneurons in-cluded in this analysis were positioned 147 � 9.0 �m and257.2 � 10.2 �m from the boundary between the strata pyra-midale and lucidum, respectively, and approximately 250 �mfrom the medial extent of the suprapyramidal blade of thedentate gyrus (Calixto et al., 2008). Thirteen electrophysiologi-cally characterized cells (six R and seven L-M interneurons)had sufficient axonal and dendritic labeling within serial sec-tions to produce complete three-dimensional digital recon-structions by using all labeled profiles. The anatomical local-ization of somata for these cells is reported in Table 1. Onlysomatic distance from the stratum lucidum/pyramidaleboundary is significantly different among subgroups of neu-rons. This difference is expected for two cell groups located indifferent layers. (L-M cells are found further away from thestratum lucidum/pyramidale boundary.)
R and L-M interneurons have similar passive andactive membrane properties
To determine whether R and L-M interneurons could berecognized on the basis of distinct physiological properties,
Research in Systems Neuroscience The Journal of Comparative Neurology
680 G.A. ASCOLI ET AL.

we measured passive and active membrane parameters.Comparable sets of electrophysiological data were obtainedfrom the two interneuron classes at a membrane potentialclose to �70 mV. These data for the 13 interneurons includedin the morphometric analysis are summarized in Table 2. Thepassive properties did not appear to vary between these twogroups of neurons, suggesting a lack of physiological distinc-tion between cells segregated by the anatomical position oftheir somata. Although across individual cells there was con-siderable variability of interspike intervals in response to de-polarizing current injections, R and L-M interneurons showedsimilar strong adaptation ratios as a group (AR 3.24 � 1.88and 3.05 � 1.04 for R and L-M interneurons, respectively; Fig.1A,B; Table 2).
Several of these measurements can be contrasted withpreviously reported independent data (Chitwood et al., 1999)from the same animal strain and age, in matching hippocam-pal region and layers, and from similar group sizes (five R andseven L-M). Although the absolute values of the input resis-tance cannot be compared directly because they were re-corded at room rather than physiological temperature in thatearlier study, their measurements were also very similar be-tween R and L-M cells (within 5% of the mean). Similarly, thedifference in average time constants between the two cellgroups was well within the respective standard deviations inboth studies (Chitwood et al., 1999; Calixto et al., 2008).
Isolated AMPAR-mediated EPSPs in R and L-Minterneurons
Area CA3 receives two converging excitatory inputs fromthe entorhinal cortex. One input is conveyed monosynapti-cally via the perforant path (PP) by axons of layer II stellatecells of entorhinal cortex (Segal and Landis, 1974; Stewardand Scoville, 1976), and the other input is conveyed disynap-tically via the mossy fibers (MF) by axons of the dentate gyrusgranule cells, which are also the targets of the same entorhinallayer II neurons (Tamamaki and Nojyo, 1993). Because R andL-M interneurons have dendrites that extend into the stratalacunosum-moleculare and lucidum, they could receive inputfrom the PP and MF, respectively. The granule cells may
Figure 1.Electrophysiological characteristics of R and L-M interneurons in areaCA3b. A,B: Examples of membrane responses and firing patternselicited by low and high depolarizing current injections (240 pA, uppertraces, and 510 pA, lower traces, respectively). The membrane poten-tial was �70 mV. Adaptation ratio: 4.0 and 2.2 for the R and L-Minterneurons, respectively. C,D: Samples of average (10 sweeps) ex-citatory postsynaptic potentials (EPSPs) and excitatory postsynapticcurrents (EPSCs evoked from three excitatory pathways innervating Rand L-M interneurons. Only mossy fiber responses show high sensi-tivity to the application of the group II mGluR agonist DCG-IV (1 �M,red traces, DCG-IV sensitivity 79 � 7% for EPSPs and 82.9 � 5% forEPSCs).
TABLE 1. Anatomy and Localization of R and L-M Interneuron Somata
Somatic feature R � � � (n 7) L-M � � � (n 6) P value
Somatic surface area (�m2) 1221.29 � 772.60 748.68 � 527.74 0.13Depth in the slice (�m) 183.79 � 28.52 143.90 � 21.40 0.06Distance from SP/SL boundary (�m) 122.00 � 12.87 277.03 � 81.80 0.0011
Distance from septal/dorsal pole (mm) 1.49 � 0.11 1.63 � 0.41 0.95Distance from bregma (mm) 2.26 � 0.15 2.45 � 0.67 0.95Distance from midline (mm) 2.50 � 0.08 2.52 � 0.08 0.73Distance from DG suprapyramidal blade tip (mm) 2.40 � 0.00 2.33 � 0.16 0.70
Abbreviations: R, stratum radiatum; L-M, stratum lacunosum-moleculare; SP, stratum pyramidale; SL, stratum lucidum.1Significant after false discovery rate correction.
TABLE 2. Passive and Active Physiological Properties of R and L-M Interneurons
Membrane properties R � � � (n 7) L-M � � � (n 6) P value
Adaptation ratio 3.24 � 1.88 3.05 � 1.04 0.73Resting membrane potential (mV) �71.43 � 4.20 �72.17 � 5.64 0.84Input resistance (M�) 170.14 � 35.23 218.00 � 73.92 0.14Action potential amplitude (mV) 74.00 � 7.09 73.83 � 5.98 0.53Action potential duration (ms) 0.91 � 0.22 0.77 � 0.24 0.53Action potential threshold (mV) �44.43 � 3.64 �44.67 � 3.67 0.63Afterhyperpolarization amplitude (mV) 11.71 � 1.80 12.50 � 3.21 0.73
Abbreviations: R, stratum radiatum; L-M, stratum lacunosum-moleculare.
Research in Systems NeuroscienceThe Journal of Comparative Neurology
681QUANTITATIVE MORPHOMETRY OF CA3b INTERNEURONS

provide additional excitatory input to the dendritic branches inthe stratum lacunosum-moleculare coursing near the dentatesuprapyramidal blade via the MF traveling toward the stratumlucidum, and via the MF collateral plexus in the hilus of thedentate gyrus (Claiborne et al., 1986; Acsady et al., 1998). Inaddition, interneurons also receive excitatory input from CA3pyramidal neurons via recurrent collaterals (RC) of the axonsforming the Schaffer commissural/collaterals to CA1 (Li et al.,1994).
In the presence of bicuculline and AP5, subthresholdAMPAR-mediated EPSPs (range 2–4 mV) were recorded so-matically from R and L-M interneurons at a resting potentialaround �70 mV by stimulating MFs, PP, or RCs (Table 3).Application of the agonist for group II metabotropic receptors(2S,2�R,3�R)-2-(2�3�-dicarboxycyclopropyl) glycine (DCG-IV; 1�M) selectively reduced MF EPSPs (47.3 � 3.2% of control;P < 0.001; data not shown), as previously reported (Calixto etal., 2008). The EPSP waveforms from all three pathways havesimilar kinetics, suggesting that synapses were located atcomparable electrotonic distances from the soma (Fig. 4C,D).For example, the decay constant was 27.96 � 2.40 ms (� � �)for MF, 30.62 � 3.20 ms for RC, and 27.23 � 2.35 ms for PP.In contrast, whereas the amplitude was similar for MF and PP(3.05 � 0.17 mV vs. 2.89 � 0.20 mV, respectively), the valuewas lower for RC (1.98 � 0.33 mV), possibly indicating a lowerdensity of AMPA receptors in this postsynaptic region. Nev-ertheless, all synaptic properties for each of the three path-ways were nearly identical between R and L-M interneurons(Fig. 1C,D; Table 3).
R and L-M interneurons have different forms oflong-term synaptic plasticity
We have previously reported that high-frequency stimula-tion (HFS) delivered to the MF pathway induces LTP in themajority (>90%) of L-M interneurons (Galvan et al., 2008). Incontrast, we found robust LTD in the population of recon-structed R interneurons shown here (Fig. 2).
General appearance of R and L-M interneuronsMicrographs of a sample of the cells reconstructed and
analyzed in this study are shown in Figure 3. The somata ofthe majority of neurons in each class were bipolar, with pri-mary dendrites arising from the polar extremes of the cellsand the long axis of the cell oriented principally in the hori-zontal plane. Each cell had one to six typically aspiny dendritictrees stemming from the soma (� � � 3.08 � 1.26). In bothcategories of interneuron, dendrites branched profuselythrough both the strata radiatum and the lacunosum-
moleculare. The number of dendritic bifurcations variedwidely from cell to cell over an order of magnitude. Typically,the long axis of the dendritic tree of R interneurons extendedbetween the dorsal blade of the dentate gyrus and the stratumpyramidale of CA3. Distal branches of the ventrally orientedprimary dendrites of each cell extended into the stratum luci-dum, and in some cases, into the immediately adjacent stra-tum pyramidale (Fig. 3). The dendritic arbors arising from L-Minterneurons were typically oriented more horizontally withrespect to the mediolateral axis of the hippocampus com-pared with R interneurons. Nevertheless, the distal branchesof the dorsally and ventrally oriented primary dendrites weresimilar to R interneurons.
Neurons in both classes gave rise to elaborated axonalarbors, which often extended beyond their layer of somaticresidence into the stratum radiatum (for L-M interneurons) andstrata lacunosum-moleculare or pyramidale (R cells). How-ever, unlike the recently described GABAergic hippocampalcells projecting to the medial septum (Takacs et al., 2008),most of these axonal arbors were concentrated near thesoma, suggesting local connectivity for all cells. A quantitativeanalysis of the dendritic and axonal patterns with respect tothe major hippocampal axes and planes is reported at the endof this Results section. Figure 4 shows four representativereconstructions with both axonal and dendritic arborizations.Of these examples, two cells are from R (Fig. 4A,C) and twofrom L-M (Fig. 4B,D). These neurons are further distinguishedby dendritic branching as having either low (<10; Fig. 4A,B) orhigh (>18; Fig. 4C,D) numbers of dendritic bifurcations.
In order to test for potential truncation artifacts introducedby slice sectioning, the distribution of axonal terminal tips wasplotted for each cell against the depth (Z coordinate; Fig. 5). Inthe top panel, the abscissa ranks the tips by depth, with anadditional offset (for visual display) between cells. If the slicethickness constitutes a limiting constraint to the Z spread, oneshould detect a disproportionally larger percentage of termi-nations at the extreme top and/or bottom locations. In con-
Figure 2.R interneurons show predominantly mossy fiber (MF) LTD. HFS (3trains of 100 pulses each at 100 Hz, repeated every 10 seconds)delivered to the mossy fibers induced robust synaptic depression incurrent-clamp recordings (�70 mV) at 35 minutes post high-frequencystimulation(HFS; 40.69 � 3.89% of the control excitatory postsynapticpotential (EPSP) amplitude; P < 0.0001, unpaired t test; n 7). Insetsare average MF EPSP (10 sweeps) from a typical experiment.
TABLE 3. Properties of MF, PP, and RC EPSPs in R and L-M Interneurons
Synaptic propertiesR � � �(n 7)
L-M � � �(n 6) P value
MF 20-80% rise (ms) 2.01 � 0.16 2.02 � 0.15 0.84MF decay (ms) 28.36 � 3.20 27.5 � 1.05 0.37MF amplitude (mV) 2.96 � 0.08 3.15 � 0.19 0.06PP 20-80% rise (ms) 1.79 � 0.13 1.93 � 0.23 0.23PP decay (ms) 27.29 � 3.20 27.17 � 0.98 0.53PP amplitude (mV) 2.91 � 0.19 2.87 � 0.23 0.73RC 20-80% rise (ms) 2.67 � 0.50 2.67 � 0.39 0.95RC decay (ms) 30.50 � 2.59 30.71 � 3.86 0.84RC amplitude (mV) 2.05 � 0.45 1.93 � 0.20 0.95
Abbreviations: R, stratum radiatum; L-M, stratum lacunosum-moleculare; MF, mossyfibers; PP, perforant pathway; RC, recurrent collaterals.
Research in Systems Neuroscience The Journal of Comparative Neurology
682 G.A. ASCOLI ET AL.

trast, this distribution was uniform, with 8.3�4.8% (� � �, n13) and 9.2 � 4.5% of the tips, respectively, in the top andbottom tenth of each neuronal spread. Only one cell (markedwith a # sign in Fig. 5A) had more than one in five terminal tips(21%) within the extreme 10% of its depth. The farthest ter-minal point of this interneuron (i.e., the tip with greatest pathdistance from the soma) was inspected visually and found tobe >20 �m away from the physical edge of the slice (beforeshrinkage correction). If trees were relatively elongated in theZ direction, their termination with greatest depth would alsotend to have the greatest path distance. In contrast, only twoother cells (marked with asterisks) had their farthest terminalpoints within 10 �m of an edge, and their overall tip distribu-tion did not deviate from linearity at the extremes.
Throughout the rest of the analyses, the relevant morpho-logical properties of these three cells were compared with theremaining 10 interneurons, and no significant deviations werefound in any of the measures. Moreover, the maximum neu-ritic spread in the depth of the section was on average con-siderably smaller than the slice thickness (192 vs. 350 �m,<55%). Only one cell (the central position in Fig. 5) spanned
most of the section depth, and this morphology also did notdeviate from the rest of the distribution in any of the quanti-tative measures. Overall, these observations suggest that thevast majority of the terminal tip positions demarcate real ter-minations, and that artifact truncations, if present, are unlikelyto alter the conclusions of the morphometric analysis sub-stantially.
R and L-M interneurons cannot be differentiatedbased on quantitative morphological measures of
their dendrites and axonsTables 4 and 5 compare the summary morphological prop-
erties of the dendritic and axonal arbors, respectively, be-tween R and L-M cell groups. The first set of metrics in eachtable is related to the overall arborization size and geometry:number of bifurcations, maximum branch order, total length,surface area, and volume, maximum path and Euclidean dis-tance from soma to tips, global fractal dimension, and isot-ropy. In contrast, the second set of metrics characterizes theaverage local properties of dendritic branches: branch pathlength, taper rate, diameter drop at bifurcations, partitionasymmetry, contraction, branch fractal dimension, and bifur-cation angles (see Materials and Methods for definitions).Neither dendrites nor axons differ in any of these morpholog-ical properties between cell groups. Several other summarymorphometrics were extracted and statistically tested withL-Measure (Scorcioni et al., 2008), but no significant differ-ences were found between R and L-M interneurons.
Comparing Tables 4 and 5, it is immediately apparent thataxonal arbors are much larger than the dendritic trees withrespect to all size metrics. In particular, both the number ofbifurcations and the overall length are nearly an order ofmagnitude greater for axons than for dendrites in both R andL-M interneurons. Interestingly, both groups of neurons dis-played considerable cell-to-cell variability in their overall den-dritic and arbor properties, with close to unitary coefficients ofvariation in several measures of size. In contrast, most branchproperties appeared more uniformly distributed among cells.The within-neuron variability of these local measures is furtherexamined and discussed below.
Although this is the first characterization of R and L-Maxonal morphology in CA3, several of the dendritic propertiescan be compared with similar available data. In particular, thedigital dendritic reconstructions of 13 R and 13 L-M interneu-rons from the previously cited study are archived in Neuro-Morpho.Org (Chitwood et al., 1999). These files were down-loaded and analyzed with L-Measure by extracting the sameparameters reported in Table 4. Although there were somenumerical differences between the metrics measured from ourreconstructions and these archival data, the ratios betweenthe average measures of R and L-M interneurons were con-sistently similar (e.g., bifurcation amplitude angle: 83.62 �7.81° and 86.88 � 8.05° for R and L-M cells from NeuroMor-pho.Org; cf. Table 4 for our reconstructions). In particular,none of the measured parameters was significantly differentbetween the two cell groups. One statistically significant dif-ference was detected between our data sets and those fromthis earlier study in the R interneurons, in spite of the largevariability. Specifically, the files from NeuroMorpho.Org hadhalf as many branches (16.92 � 8.92), but twice the averagebranch length (95.45 � 16.01 �m). Because our cells wereconfined within CA3b, whereas those reconstructed by Chit-
Figure 3.Representative micrographs of CA3b interneurons typical of cellsselected for quantitative morphometric analysis. Such cells exhibiteddense labeling of both the somatodendritic compartment and axonalarbor in multiple serial sections. A,B: Dense labeling of both dendritesand axons. The boxed areas in A illustrate the smooth fiber morphol-ogy characteristic of dendrites (lower left box) and the varicose natureof axons (two remaining boxes). Note the localized arborization ofboth classes of process with respect to the cell soma evident at bothhigh and low magnification (inset: f, fimbria). This distinction is alsoevident in B, where black arrows identify a long sparsely branchingdendrite, and varicose axons (gray arrows) branch prolifically withinthe stratum pyramidale of CA3. Scale bar 100 �m in A,B, inset to A.
Research in Systems NeuroscienceThe Journal of Comparative Neurology
683QUANTITATIVE MORPHOMETRY OF CA3b INTERNEURONS

Figure 4.Cropped images around the somata and proximal processes of four illustrative cells used in the analysis (A–D), along with their digitalreconstructions (E–H). R (A/E and C/G) and L-M (B/F and D/H) groups are defined by somatic location. These examples also represent thedistinction between cells with high (A/E and B/F) and low (C/G and D/H) numbers of dendritic branches. Dendrites (red) have been thickenedfivefold to help distinguish them from axons (blue). Scale bar 100 �m in A (applies to A–D).
Research in Systems Neuroscience The Journal of Comparative Neurology

wood and colleagues were not, this single discrepancy couldbe due to different dispositions of the neurons in the hip-pocampus (similar to the CA3a vs. CA3c distinction in pyra-midal cell dendrites reported by Ishizuka et al., 1995).
Even though the axons of R and L-M cells do not signifi-cantly differ in overall length and maximum path distance, it isinteresting to compare them with respect to how the extent oftheir trees is distributed in relation to their cell somas (“Sholl-like” plots). Figure 6 illustrates the results of this analysis forthe axonal arbors. In particular, within each individual cell, wesummed the axonal length falling within successive path dis-tance bins of 100 �m. Moreover, we measured separately theinternal and terminal axonal branches (i.e., those leading to abifurcation and to a termination, respectively), in light of theirdifferent growth regulation during development (e.g., Rossi etal., 2007). The resulting distributions were then averaged overthe cell in each group (Fig. 6A). Terminal and internal axons forR and L-M cells all share similar bell-shaped functions, with arelatively steep increase to a peak between 600 and 800 �m
from the soma, and a shallower, steady decline until >2,500�m from the soma. The lack of difference between terminaland internal axonal portions suggests that the branches havethe same probability of terminating at any path distance. Thesimilar distributions between the two cell groups indicate thatthese features are fairly independent of the somatic layerlocation.
Inspection of these axonal length distributions for individualinterneurons revealed considerable cell-to-cell diversity inboth the R and L-M groups. Figure 6B illustrates these differ-ences across neurons by comparing two representative indi-viduals in each class and pooling together internal and termi-nal axonal length. Because of the considerable variability inmaximum path length mentioned above (Table 5), we adopteda relative scale in the abscissa. Despite this normalization,some cells exhibit peaks in axonal length in the more proximalhalf of the tree (25–30%) and others in the distal half (70–75%), again independent of the somatic layer.
Overall length distributions were next compared betweenaxons and dendrites, pooling together all (R and L-M) inter-neurons. Given the overall size difference between axonal anddendritic arbors in addition to the large variability among cells,these data were also normalized within each neuron. In theresulting cumulative plots (Fig. 6C), the initially higher slopefor dendrites indicates that they distribute more of their lengthrelatively closer to the soma, whereas axons maintain a morebalanced distribution across their own path distance. In par-ticular, dendrites and axons on average pass the midpoint oftheir length distributions (50% of their total amount in eachcell) close to one-third and one-half, respectively, of theirmaximum path (�35% vs. �45%, respectively).
Dendritic branching alone identifies distinctsubclasses of CA3b interneurons
Both overall size measures (Tables 4, 5) and relative distri-butions (Fig. 6) emphasize the spread of values among indi-vidual cells relative to any separation between R and L-Minterneurons. For example, both groups display a particularlystriking variability in the number of dendritic bifurcations (9–83). Considering the trend difference in somatic surface area,and the dependence previously reported between number ofbifurcations and somatic surface in other morphologicalclasses (e.g., Cullheim et al., 1987), we analyzed the relation-ship between these two measures (Fig. 7A). Although wefailed to find any significant correlation either within cellgroups (R and L-M) or through all 13 cells jointly, there ap-peared to be two separate clusters of cells with lower andhigher counts of bifurcations. In particular, 8 cells have 18 ormore dendritic bifurcations, whereas 5 cells have 10 or fewerbifurcations, with nothing in between (Fig. 7B). A Kolmogorov-Smirnov test rejected the null hypotheses of these two groupsbelonging to the same Poisson or uniform distributions (P <0.05 in both cases). The distribution of R and L-M interneuronswas equally balanced between the two pools, confirming thatthis dendritic measure is unrelated to the layer identity of thecorresponding somata.
To investigate further the putative distinction of CA3b inter-neurons into two distinct types based on the complexity oftheir dendrites, several morphometric comparisons were car-ried out between the cells with higher and lower numbers ofdendritic bifurcations (henceforth named HiDe and LoDe, re-spectively). Numerous dendritic parameters were significantly
Figure 5.Analysis of axonal terminal tips. A: The position of every axonal terminationin each of the reconstructed cells after shrinkage correction was rank or-dered in the depth of the slice from lowest (left) to highest (right). Thelocations of the soma and of the farthest point along the path are marked ineach case. Significant truncation artifacts due to slice sectioning wouldresult in a disproportional number of terminals lying along one of the edges.No cells clearly exhibit this trend. Two interneurons (*) had their farthest pointnear the edge of the cell, and one (#) had more than 20% of its terminals inthe extreme tenth of the slice, indicating the potential for truncation. None ofthese cells exhibited morphometric outliers compared with the other cells.B: Histogram of the frequency of tips at several depths, with left and rightordinates representing absolute numbers and relative proportions of thetotal count.
Research in Systems NeuroscienceThe Journal of Comparative Neurology
685QUANTITATIVE MORPHOMETRY OF CA3b INTERNEURONS

different between the two groups (Table 6). Although the mea-sures of overall size are clearly related to the bifurcationnumber (e.g., maximum branch order, length, and surfacearea), global fractal dimension and the branch-level charac-teristics constitute in principle independent features, includ-ing branch path length, taper rate, angle metrics, and partitionasymmetry. This distinction was quantitatively confirmed bymeasuring the correlation coefficients between each of theselatter metrics and the number of bifurcations. (None wasfound to be statistically significant.) Interestingly, branch pathlength is longer for LoDe cells, which could be causally relatedto their significantly smaller taper rate. Various angle mea-surements were also significantly different between HiDe andLoDe cells. These angles are highly correlated to each other,and should be considered as one robust underlying measure,suggesting that HiDe cells branch at wider angles.
In contrast to the numerous differences in dendritic mor-phometrics between HiDe and LoDe groups, no differences inaxonal morphology were found (data not shown). Similarly, nodifferences in somatic location in the horizontal axis of hip-pocampus were found between HiDe and LoDe neurons, sup-porting the notion that this morphological distinction is notaffected by placement within the hippocampus. Thus, basedsolely on morphological differences in the dendrites, HiDe andLoDe cells may represent two distinct interneuron types inarea CA3. This observation is also practically convenient be-cause the count of dendritic branches can distinguish cellswith more or less than 10 bifurcations quickly and directlyfrom visual inspection of the microscopic field.
These findings were corroborated by the quantitative anal-ysis from the previous independent study of the dendriticreconstructions of CA3 R and L-M interneurons available inNeuroMorpho.Org (Chitwood et al., 1999). In particular, 5 and10 cells of these cells from NeuroMorpho.Org satisfied thecriteria for the LoDe (<10 bifurcations) and HiDe (>18 bifur-cations) definitions, respectively. Among the morphometricsfound to differ significantly (but not to correlate with dendriticcount) in our cells, several were matched in these indepen-dent datasets, including taper rate (HiDe: 0.21 � 0.03, LoDe:0.34 � 0.11; P < 0.005) and partition asymmetry (HiDe: 0.49 �0.07, LoDe: 0.32 � 0.15; P < 0.05). Another morphometric wasalso significantly different in the NeuroMorpho.Org data,namely, the bifurcation diameter drop (HiDe: 0.82 � 0.03,LoDe: 0.73 � 0.06; P < 0.01). This parameter had strikinglysimilar averages in our data and followed the same trend,although without reaching statistical significance (our HiDe:0.82 � 0.09, LoDe: 0.73 � 0.08; P � 0.07). Interestingly, all ofthe metrics that significantly differ between HiDe and LoDecells in either our set or NeuroMorpho.Org reached strongstatistical significance when the two data sources were com-bined, likely due to the larger sample size (combined NHiDe 18, NLoDe 10). Most importantly, the Kolmogorov-Smirnovtest for these pooled groups strongly supported the hypoth-esis of two separate distributions for HiDe and LoDe (P < 10�5
and P < 0.002 for the uniform and Poisson assumptions,respectively).
Moreover, our electrophysiological data indicate that HiDecells have significantly faster RC synaptic kinetics, larger APAs,
TABLE 4. Dendritic Morphometry of R and L-M Interneurons
Dendrites R � � � (n 7) L-M � � � (n 6) P value
No. of bifurcations 30.29 � 25.69 24.50 � 19.56 0.73Maximum branch order 7.29 � 3.45 8.67 � 4.97 0.63Total length (�m) 2909.74 � 1387.31 3217.44 � 2899.56 0.84Surface area (�m2) 7691.60 � 4016.77 10315.10 � 11864.16 0.84Volume (�m3) 2304.56 � 1452.51 3211.60 � 4342.99 0.84Max. path distance from soma to tips (�m) 553.36 � 171.27 591.89 � 294.71 1.00Max. Euclidean distance (�m) 392.33 � 88.71 373.14 � 191.75 0.95Global fractal dimension (box-counting) 1.07 � 0.04 1.14 � 0.13 0.73Isotropy 0.27 � 0.07 0.27 � 0.17 1.00Branch path length (�m) 54.98 � 16.98 57.10 � 28.91 0.63Taper rate 0.20 � 0.16 0.20 � 0.13 0.84Bifurcation diameter drop 0.77 � 0.08 0.81 � 0.11 0.53Partition asymmetry 0.51 � 0.10 0.52 � 0.09 0.84Contraction 0.86 � 0.03 0.86 � 0.04 0.95Branch fractal dimension (Caliper) 0.94 � 0.03 0.94 � 0.02 0.84Amplitude bifurcation angle (°) 70.45 � 8.58 72.67 � 19.89 0.63Tilt bifurcation angle (°) 107.62 � 16.32 108.54 � 15.04 0.95
Abbreviations: R, stratum radiatum; L-M, stratum lacunosum-moleculare.
TABLE 5. Axonal Morphometry of R and L-M Interneurons
Axons R � � � (n 7) L-M � � � (n 6) P value
No. of bifurcations 192.14 � 71.73 288.83 � 82.88 0.06Maximum branch order 37.86 � 17.45 37.33 � 11.11 0.95Total length (�m) 21534.56 � 12041.69 25081.30 � 10937.61 0.63Surface area (�m2) 33431.49 � 24343.35 38700.12 � 18976.73 0.29Volume (�m3) 4760.39 � 3846.53 5850.29 � 4730.13 0.37Max. path distance from soma to tips (�m) 1931.85 � 579.70 1927.32 � 557.24 1.00Max. Euclidean distance (�m) 679.83 � 206.60 476.39 � 130.00 0.07Global fractal dimension (box-counting) 1.28 � 0.09 1.34 � 0.17 0.18Branch path length (�m) 54.83 � 14.80 46.77 � 5.89 0.37Taper rate -0.11 � 0.15 -0.02 � 0.06 0.53Bifurcation diameter drop 0.96 � 0.05 0.96 � 0.08 0.53Partition asymmetry 0.60 � 0.04 0.60 � 0.04 0.84Contraction 0.82 � 0.03 0.82 � 0.03 0.84Branch fractal dimension (Caliper) 0.93 � 0.02 0.91 � 0.02 0.23Amplitude bifurcation angle (°) 89.61 � 7.53 91.66 � 8.19 0.29Tilt bifurcation angle (°) 91.60 � 6.52 90.35 � 8.10 0.45
Abbreviations: R, stratum radiatum; L-M, stratum lacunosum-moleculare.
Research in Systems Neuroscience The Journal of Comparative Neurology
686 G.A. ASCOLI ET AL.

and smaller AHPAs than LoDe cells (Table 6). These biophysicalmeasures are not interrelated and constitute independent fea-tures. In particular, the relationship between APA and AHPA wastested by augmenting this pool of 13 cells with data from 42additional R and L-M interneurons (Calixto et al., 2008), andrevealed no significant correlation (R �0.06, P > 0.6). Further-more, these different functional characteristics could not be ex-plained by (and generally contrasted with) the differences indendritic morphometrics based on cable theory (Burke, 2000).Thus, these observations indicate disparities in intrinsic mem-brane properties between HiDe and LoDe cells. In contrast, thedendritic branching count was not correlated with the polarity ofthe MF plasticity. In particular, cells showing LTD belonged toboth the HiDe and LoDe groups, and HiDe and LoDe neurons
were not separated along the lines of different forms of synapticplasticity. In other words, there is a clear dichotomy betweenmorphometrics (HiDe vs. LoDe) and long-term plasticity (MF LTPin SLM vs. MF LTD in SR), and, within each layer, cells aredendritically divided in the same way regardless of the plasticity.
Modular branch organization of CA3binterneuron axons and dendrites
Additional analysis of the local geometry of axons and den-drites was carried out as a function of branch order (thenumber of bifurcations in the path to the soma). Quantifyingany of these parameters separately for different groups (R vs.L-M or HiDe vs. LoDe) did not reflect any differential trend inthe change of morphometric measures with respect to branchorder above and beyond reproducing statistical differencesfor the overall values reported in Table 6. Thus, these patterndistributions are reported here for all 13 cells characterized asa single pool (Fig. 8). The results indicated a surprising uni-formity of all tested morphometrics across branch order. Inparticular, the average branch path length was fairly constantat �55 �m throughout the trees (Fig. 8A). Similarly, partitionasymmetry and contraction did not deviate from their respec-tive grand averages at any of the branch orders (Fig. 8B,C,respectively). Although axons extend over a clearly more pro-
Figure 6.Length distribution across path distance from soma. A: Sholl-like plot of theamount of axonal length at subsequent 100-�m-wide path distance bins.Cell values are grouped and averaged by layer of somatic location and byinternal (Int) and terminal branches (Term). B: The axonal length distributionsfor two representative cells from both the L-M and R groups are plotted insubsequent 5%-wide bins, where path distance is measured as a proportionof the maximum path distance for each cell. C: Comparison of relativeaxonal and dendritic length distributions by 5% path increments for all cellspooled together.
Figure 7.Dendritic branching in CA3b interneurons. A: Scatter plot distributionof the number of dendritic bifurcations by somatic surface area.Dashed lines separate cells with high (HiDe) and low (LoDe) numbersof dendritic bifurcations. B: Semi-log histogram of dendritic branchingcharacteristics. Cells cluster into two groups by number of dendriticbifurcations, with a gap in between <10 and >18 dendritic bifurca-tions. R and L-M cells are found in both high and low dendritic groups.The Mann-Whitney (M-W) test was used to compare number of den-dritic bifurcations for LoDe and HiDe cell groups. Kolmogorov-Smirnov (K-S) Poisson and uniform distribution tests were performedon all cells grouped together. bifs, bifurcations.
Research in Systems NeuroscienceThe Journal of Comparative Neurology
687QUANTITATIVE MORPHOMETRY OF CA3b INTERNEURONS
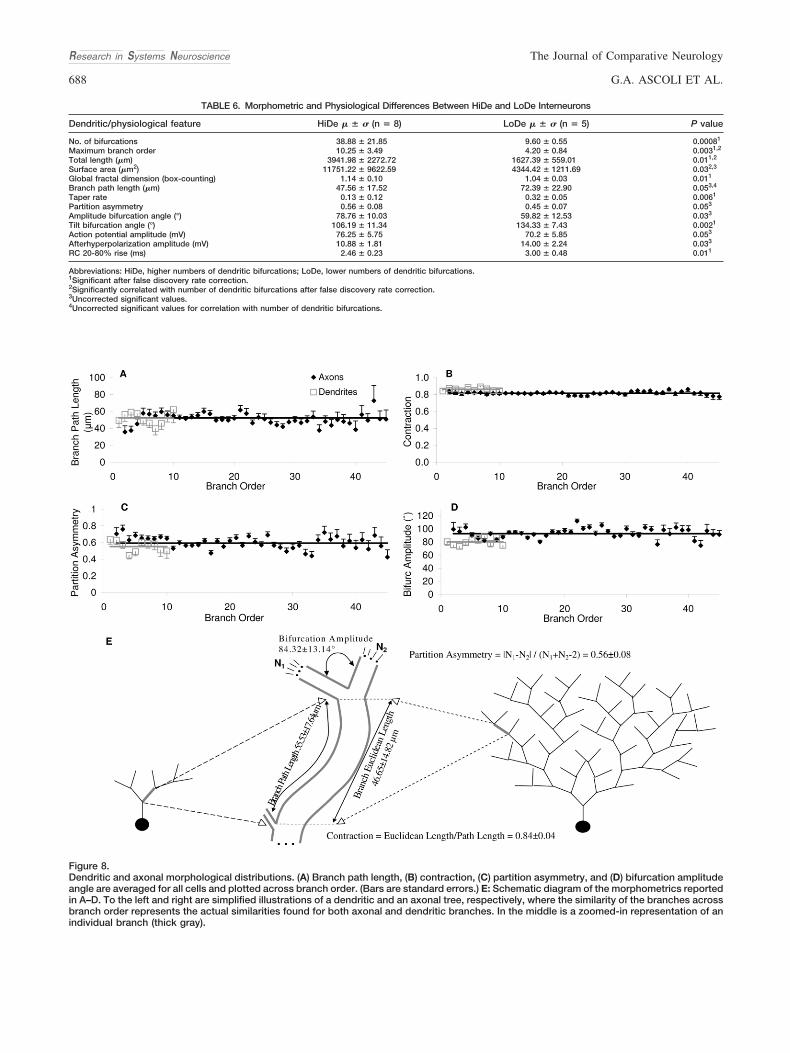
Figure 8.Dendritic and axonal morphological distributions. (A) Branch path length, (B) contraction, (C) partition asymmetry, and (D) bifurcation amplitudeangle are averaged for all cells and plotted across branch order. (Bars are standard errors.) E: Schematic diagram of the morphometrics reportedin A–D. To the left and right are simplified illustrations of a dendritic and an axonal tree, respectively, where the similarity of the branches acrossbranch order represents the actual similarities found for both axonal and dendritic branches. In the middle is a zoomed-in representation of anindividual branch (thick gray).
TABLE 6. Morphometric and Physiological Differences Between HiDe and LoDe Interneurons
Dendritic/physiological feature HiDe � � � (n 8) LoDe � � � (n 5) P value
No. of bifurcations 38.88 � 21.85 9.60 � 0.55 0.00081
Maximum branch order 10.25 � 3.49 4.20 � 0.84 0.0031,2
Total length (�m) 3941.98 � 2272.72 1627.39 � 559.01 0.011,2
Surface area (�m2) 11751.22 � 9622.59 4344.42 � 1211.69 0.032,3
Global fractal dimension (box-counting) 1.14 � 0.10 1.04 � 0.03 0.011
Branch path length (�m) 47.56 � 17.52 72.39 � 22.90 0.053,4
Taper rate 0.13 � 0.12 0.32 � 0.05 0.0061
Partition asymmetry 0.56 � 0.08 0.45 � 0.07 0.053
Amplitude bifurcation angle (°) 78.76 � 10.03 59.82 � 12.53 0.033
Tilt bifurcation angle (°) 106.19 � 11.34 134.33 � 7.43 0.0021
Action potential amplitude (mV) 76.25 � 5.75 70.2 � 5.85 0.053
Afterhyperpolarization amplitude (mV) 10.88 � 1.81 14.00 � 2.24 0.033
RC 20-80% rise (ms) 2.46 � 0.23 3.00 � 0.48 0.011
Abbreviations: HiDe, higher numbers of dendritic bifurcations; LoDe, lower numbers of dendritic bifurcations.1Significant after false discovery rate correction.2Significantly correlated with number of dendritic bifurcations after false discovery rate correction.3Uncorrected significant values.4Uncorrected significant values for correlation with number of dendritic bifurcations.
Research in Systems Neuroscience The Journal of Comparative Neurology
688 G.A. ASCOLI ET AL.

fuse arborization than dendrites (spanning �45 vs. �10branch orders, respectively), the uniformity at the level ofindividual branches was generally preserved between the twoarbor types. The only minor exception was a slightly greaterbifurcation angle for axons than for dendrites (90 vs. 80), againconsistent over the entire respective ranges of branch order(Fig. 8D).
This branch level similarity across branch order was alsovisually apparent in both the axons and dendrites of mostcells. In particular, much of the morphological features ofCA3b interneurons could be described with a “modular”branch composition (Fig. 8E). In other words, the data arecompatible with one and the same distribution of branchesthat is sampled independent of locations in the somatic layer(R or L-M), in the cell (axon or dendrite), or in the individualtrees (low and high branching orders). The statistically signif-icant morphological differences between groups can be ac-counted for by the different number of branches assembled indistinct cell classes (HiDe vs. LoDe) or arbor types (axons vs.dendrites).
Interestingly, the axons of GABAergic cells in the somato-sensory neocortex display significantly more spatial meander-ing than either the dendrites of the same interneurons or theaxons of pyramidal neurons (Stepanyants et al., 2004). Thisobservation was taken as evidence that interneuron axonscould deviate locally to reach their targets, suggesting a spe-cific layout opposite to the random connectivity of principalcells. The paths of our CA3b interneurons (“contraction” inTables 4, 5 and Fig. 7) are statistically more tortuous in axonsthan in dendrites (0.81 � 0.15 vs. 0.86 � 0.13 over 5,845axonal and 754 dendritic branches, respectively; P < 0.0001).However, the CA3 pyramidal cell axons (Wittner et al., 2007)available in NeuroMorpho.Org show even more extreme tor-tuosity (0.68 � 0.14 over 808 branches; P < 10�5 comparedwith our interneurons). This finding potentially highlights afunctional distinction between cell class features in differentcortical regions (hippocampal CA3b vs. somatosensory neo-cortex).
The axonal and dendritic patterns across R andL-M layers are local and lamellar
The investigation of axonal and dendritic spatial patterns inCA3b interneurons was expanded by analyzing the relationbetween the extent of the arbors and Euclidean distancesfrom the soma (Fig. 9). Dendritic path increases linearly withEuclidean distance, suggesting a similar direction of growthfor dendrites located closer and farther from the cell bodylocation. In stark contrast, axonal path distance increaseslinearly only up until a definite Euclidean distance (�200 �m),and then remains constant (at a value close to �1 mm) asEuclidean distance increases (Fig. 8A). Thus, axonal locationsat considerably different Euclidean distances from the soma(e.g., �250 �m vs. >500 �m) are on average separated fromthe cell body by the same path length. This surprising findingcan have important functional consequences, because pathdistance may relate to spike propagation delay (Soleng et al.,2003) and failure probability (Kopysova and Debanne, 1998),whereas Euclidean distance determines the radius of presyn-aptic influence on the surrounding network (Stepanyants andChklovskii, 2005). The observed relation can be explained byassuming that the axons of these interneurons tend to grow
radially only in the neighborhood of the soma, but not fartheraway.
This hypothesis was consistent with the observation thatthe main axonal path meandered extensively in all cells, butsystematically returned to terminate in the proximity of the cellbody. The peculiar split-slope characteristic was robustly ev-ident in all cell groups (R, L-M, HiDe, and LoDe), and was alsoapparent in 10 of the 13 cells analyzed individually.
To investigate the impact of this feature, it is useful toevaluate the proportion of axonal extent “near” or “far from”the cell body. In particular, it appears that the axons ofthese neurons, whereas they extend some of their branchesto a certain distance, tend to maintain most of their arbormore proximally. To determine whether this is the case, wemeasured the axonal surface area, which reflects the abilityto establish synaptic contacts (Shepherd and Harris, 1998),as a function of relative Euclidean distance from the soma,thus normalizing all cells by their maximum spread (Fig. 9B).This distribution peaked at less than 30% distance, indicat-ing that most of the spatial density is contained within themost proximal third of the axonal outreach. Therefore, if thespherical volume containing each cell is divided into inner(core) and outer (shell) halves, the average path distancefrom the soma is similar between the two regions, but thesurface area found within the shell is nearly two orders ofmagnitude smaller compared with that in the core (Fig. 9B,
Figure 9.Morphological properties across Euclidean distance from the soma.A: Axonal (black) and dendritic (gray) path distance averaged for allcells and plotted against absolute Euclidean distance (25-�m bins).B: Axonal surface area averaged for all cells and plotted in subsequent5%-wide bins, where distance is measured as a proportion of themaximum Euclidean distance for each cell. B, inset: Path distance andsurface area are averaged for all 13 cells in the “core” (C) and “shell”(S), respectively defined as the inner and outer halves of the smallestspherical volume enclosing the entire axonal tree. Bars representstandard errors in A and B, and standard deviations in the inset to B.
Research in Systems NeuroscienceThe Journal of Comparative Neurology
689QUANTITATIVE MORPHOMETRY OF CA3b INTERNEURONS

inset). Together, these results suggest that the bulk of theaxonal tree is found near the soma, yet the (relativelysmaller) extent located in the outer circles does not differ interms of path distance. Along with the more containedextent of dendrites compared with axons, the emergingspatial distribution of CA3b interneuron arbors is consistentwith a prevalently local input and output connectivity forboth R and L-M cells.
The overall space invaded by the arbor spread was quan-tified by multiplying the three dimensions of the smallest boxcontaining 95% of each individual neuron after principal com-ponent analysis (see Materials and Methods). Axons invadedon average three times as much space as dendrites (0.0457 �0.0339 mm3 vs. 0.0149 � 0.0154, n 13, P < 0.001), but onceagain there were no differences in either axonal or dendriticspatial invasion between R and L-M interneurons (P > 0.3). Inorder to characterize further the three-dimensional spatialoccupancy around the soma relative to the main orientation ofthe hippocampus, axonal and dendritic volumes were mea-sured according to different partitions (Tables 7, 8). In partic-ular, three orthogonal divisions were considered along theplanes passing through each cell body and separating thehemispheric halves, which corresponded to the directionsbetween CA3a and CA3c, between the hippocampal fissureand the alveus, and between the septal and temporal poles(Table 7). The internal volume occupied by each cell wascompared in every case between opposite hemispaces. Be-cause the same results were found for R and L-M cells, and forHiDe and LoDe cells, the analysis is reported here for all 13interneurons pooled together. Axons occupied significantlygreater volume toward the hippocampal fissure than towardthe alveus. No other significant differences between hemi-spheres were found for either dendritic or axonal arbors.
The region surrounding every soma was then separated intoeight sectors based on each of the three binary partitions(Table 8). The axonal and dendritic volumes in each octant
were divided by their respective measures summed over thewhole space, such that a perfectly even regional distributionwould result in values of 0.125 for every sector. A Kruskall-Wallis test detected a statistically significant deviation fromthis uniform spread for axons, but not from dendrites. Cross-sector pairwise comparisons were thus performed, and fivegroups significantly differed in terms of axonal volume, asgraphically illustrated in Figure 10A. The grayscale of eachsector in this map represents the volumetric proportion(darker shades correspond to higher values). Each couple ofstars of corresponding colors represents a significant pair-wise difference. Consistent with the planar analysis, all five ofthese pairs contained one sector closer to the fissure (highervolume) and one sector closer to the alveus (lower volume).Even though the planar analysis revealed no statistical differ-ences between CA3a and CA3c (Table 7), four significantlydifferent sector pairs contained one CA3c and one CA3aoctant (with higher and lower volume, respectively). The lowergrayscale contrast in the corresponding dendritic volume sec-tor map (Fig. 10B) suggests a more homogeneously balanceddistribution, visually confirming the quantitative statistics (Ta-ble 8).
According to the lamellar hypothesis (Amaral and Witter,1989; Andersen et al., 2000), local circuitry of the rodent hip-pocampus is mainly organized perpendicular to the septotem-poral axis. The low isotropy displayed by the dendrites of ourR and L-M cells (Table 4) suggests that this principle may alsoapply to CA3b interneurons. To determine the exact relation-ship between the observed anisotropy and the lamellar archi-tecture, the planar and octant analyses were complementedby a detailed investigation of axonal and dendritic lengthdistributions in the transverse and longitudinal directions. Thetransverse plane, defined by the CA3a-CA3c and alveus-fissure directions, was represented in polar coordinates rela-tive to the somatic position. The radial distance from thecenter was set equal to the neuronal length normalized by theaverage value over all directions. Thus, a value of two at agiven orientation means that cells exhibit on average twice asmuch extent in that direction as would be expected from auniform spatial distribution. The axons of both R and L-Minterneurons are elongated along the alveus-fissure direction,and tend to grow toward the fissure (Fig. 9C, left). Dendritesdo not appear to grow systematically in any particular direc-tion (Fig. 9D, left), consistent with the plane and sector anal-yses (Tables 7, 8). Moreover, R and L-M cells had distributionssimilar (Fig. 10C,D), to those of the HiDe and LoDe groups(data not shown).
Next, the arbor spread in the septotemporal direction wasmeasured and compared with the transverse spread. Axonsextended transversally on average three times as much aslongitudinally, again with very similar measurements for R andL-M interneurons (Fig. 10C, right). The situation was evenmore extreme in dendrites, which exhibited far less longitudi-nal spread than transverse spread (Fig. 10D, right). The lamel-lar ratio for dendrites was greatest in L-M cells, displaying analmost 10-fold larger transversal than longitudinal extent onaverage, but it varied considerably from neuron to neuron,such that the resulting mean differences were statisticallysimilar for all cell groups. This analysis shows that both axonsand dendrites of CA3 interneurons are characterized by alamellar distribution. Furthermore, within the transverse plane,
TABLE 7. Planar Analysis of Axonal and Dendritic Occupied Volumes
Planar hemisphereAxonal volume
(� � �)Dendritic
volume (� � �)
CA3c 3450.26 � 3091.59 1572.00 � 2357.67CA3a 1911.05 � 1450.82 950.30 � 922.02
Mann-Whitney P value 0.35 1.00Fissure 4023.15 � 3609.59 1018.82 � 677.78Alveus 1337.70 � 855.55 1502.28 � 2963.89
Mann-Whitney P value 0.021 0.29Septal 2208.81 � 1963.76 966.58 � 1338.63Temporal 3151.50 � 3527.88 1558.73 � 1922.82
Mann-Whitney P value 0.63 0.22
1Significant.
TABLE 8. Sector Analysis of Axonal and Dendritic Relative VolumetricDistributions
OctantRelative axonal volume
(mean � SEM)Relative dendritic volume
(mean � SEM)
CA3c/alveus/septal 0.19 � 0.06 0.14 � 0.04CA3c/alveus/temporal 0.25 � 0.06 0.21 � 0.06CA3c/fissure/septal 0.09 � 0.05 0.07 � 0.03CA3c/fissure /temporal 0.12 � 0.04 0.15 � 0.03CA3a/alveus/septal 0.11 � 0.03 0.09 � 0.02CA3a/alveus/temporal 0.16 � 0.05 0.14 � 0.05CA3a/fissure/septal 0.04 � 0.01 0.08 � 0.03CA3a/fissure /temporal 0.05 � 0.02 0.13 � 0.04Kruskall-Wallis P value 0.041 0.23
1Significant.
Research in Systems Neuroscience The Journal of Comparative Neurology
690 G.A. ASCOLI ET AL.

axons extend more between the alveus and the hippocampalfissure than between areas CA3a and CA3c, whereas den-drites show no preferential orientation. These spatial distribu-tions are robust with respect to the layer location of the cellbody (R vs. L-M) and the complexity of dendritic branching(HiDe vs. LoDe).
It is important to remark that, because the “functional”orientation of the transverse section is perpendicular to thelongitudinal curvature of the hippocampus, it varies with re-spect to the plane of the actual slice preparation. Although ourexperiments were always carefully controlled for the regionalconsistency of the recording site, the variation among prep-arations can be assumed to be small yet not necessarilynegligible. Thus, the interpretation of the above spatial anal-ysis in the slice plane (Table 8 and Fig. 10) should be limited toa relative comparison between axonal and dendritic arbors.
DISCUSSIONGABAergic interneurons stir considerable scientific interest
due to their dynamic role in the control of information pro-
cessing within mammalian neural circuits (Mann and Paulsen,2007). Numerous studies have defined the morphological andphenotypic heterogeneity of interneurons in the neocortex andhippocampus (Yuste, 2005; Houser, 2007). However, a clear un-derstanding of the computational role of populations of interneu-rons within well-characterized polysynaptic circuits has beendifficult to obtain due to the scarcity of detailed quantitativemorphometric analysis, especially of axonal arbors, in electro-physiologically identified neurons. In this study we quantitativelyassessed the branching and spatial patterns of dendrites andaxons of R and L-M interneurons in hippocampal area CA3. Bothtypes of interneurons belong to a larger population of GABAergiccells that act as subthreshold coincidence detectors for con-verging MF and PP inputs (Calixto et al., 2008). However, thelong-term plastic properties of excitatory synapses in R inter-neurons differ from the ones observed in L-M interneurons. Forexample, most of the R interneurons described here underwentMF LTD (Fig. 2) whereas the majority of L-M interneuronsshowed Hebbian bidirectional plasticity at their MF synapses(Galvan et al., 2008).
Figure 10.Anatomical orientation of axonal/dendritic trees. A,B: Axonal (A) and dendritic (B) maps show the volumetric proportion for eight sectors, eachcorresponding to a square on a cube face. The soma of each cell would be located in the middle of the cube. The darkness of every square isproportional to the volumetric proportion of the given sector. Matching color stars indicate significantly different volumetric proportions. C,D:Left, Axonal and dendritic polar histograms of average length distribution relative to the soma for R (blue) and L-M (red) cell groups (bin size:�/8 rad). Values are normalized by dividing the length in each bin by the mean length over all bins. Right, Both axons and dendrites exhibitlamellar spread, in which the arborization is more confined in the longitudinal direction compared with the transverse plane. The lamellar ratiobetween the longitudinal and transverse spreads of tracing points is averaged over all cells.
Research in Systems NeuroscienceThe Journal of Comparative Neurology
691QUANTITATIVE MORPHOMETRY OF CA3b INTERNEURONS

In the context of this “layer-dependent plasticity,” it is in-teresting to note that in stratum lucidum interneurons, MFsynapses exhibit LTD/LTP that is induced presynaptically(Pelkey et al., 2008). We hypothesized that the R/L-M layerspecific plasticity may be correlated with distinct morphomet-rics and electrophysiological features that could extend thesubclassification of these two types of interneurons to theanatomical and functional level. However, our data demon-strate that R and L-M interneurons were indistinguishable inthe branching and spatial patterns of dendrites and axons,and had comparable electrophysiological properties. Never-theless and consistent with the notion that interneurons ofdifferent types have the same somatic position (Klausbergerand Somogyi, 2008), we found two separate subclasses ofcells with lower and higher counts of dendritic bifurcationsunrelated to the layer localization of the soma.
An earlier study of CA3 R and L-M interneurons focused onelectrophysiological properties (Chitwood and Jaffe, 1998).Like our cells, both types of interneurons were found to haveadapting (accommodating) firing rates. The passive mem-brane properties and synaptic kinetics are not directly com-parable between that earlier report and our data due to thedifferent recording temperatures. However, all the relativefindings comparing R and L-M interneurons are coherent be-tween the two studies, and generally point to a broad cell-to-cell variability and overall similarity between the R and L-Mgroups. Although the axonal arbors were not traced in thisprevious report, the dendritic reconstructions availablethrough NeuroMorpho.Org enabled a limited comparison withour morphologies. The results were again consistent, withonly minor differences that are not surprising given our morestringent control of the anatomical location of somata (CA3bvs. CA3).
The morphology of CA3 R interneurons was also analyzed inthe developing rat hippocampus (Gaıarsa et al., 2001). Despiteimmature features (somatic and dendritic filopodial pro-cesses) in the first postnatal week, both the dendritic andaxonal patterns in that report closely resemble our data. How-ever, these tracings were not digitally reconstructed, limitingthe comparison to a two-dimensional, qualitative assessment.Empirical evidence and theoretical analysis concur that quan-titatively characterizing axonal morphology is crucial to deter-mine circuit connectivity (Somogyi and Klausberger, 2005;Stepanyants and Chklovskii, 2005). The computational role ofeach cortical interneuron type is linked to its ability to affectactivity and plasticity through cell class-specific and possiblysubcellularly specialized synaptic connections (Wittner et al.,2006). The function of R and L-M interneurons in area CA3thus depends on the interaction of their intrinsic biophysicaland morphological features with the structural and dynamicalnetwork properties of this particular hippocampal region. Todate, most efforts to characterize hippocampal interneurons,and specifically the axonal morphology of R and L-M cells,have been limited to area CA1.
An influential morphological study of L-M interneurons inCA1 was performed by intracellular Lucifer Yellow injectionwith sharp electrodes (Lacaille and Schwartzkroin, 1988). Arelatively homogenous group of 16 clearly nonpyramidal neu-rons was recovered near the stratum radiatum border. Most ofthese cells had fusiform multipolar somata (�p20 �m in di-ameter, their Fig. 3), and extended mainly smooth, beaded
dendrites through two-thirds of CA1. Axons, reconstructed infive neurons, started from a primary dendrite in the stratumlacunosum-moleculare, and projected through the stratumradiatum, along the stratum pyramidale, and occasionally intothe stratum oriens. In two interneurons, axon collaterals werenot restricted to CA1, but crossed the hippocampal fissureinto the molecular layer of the dentate gyrus. While recogniz-ing the still undetermined role of L-M interneurons in hip-pocampal circuitry, this study suggested a feedforward inhib-itory function based on their strong excitation by majorextrinsic afferents, and the presence in this layer of immuno-reactivity for GABA (Gamrani et al., 1986) and its synthesizingenzyme (Somogyi et al., 1984; Kunkel et al., 1986). Similarmorphological data were reported based on whole-cell biocy-tin injections (Williams et al., 1994), with axons branching instrata lacunosum-moleculare and radiatum, and into the den-tate gyrus and CA3.
Another CA1 study (Vida et al., 1998) described the mor-phology of Schaffer-associated cells as similar to that de-scribed above and in previous L-M reports (Kawaguchi andHama, 1988), identifying heavy dendritic branching in the stra-tum lacunosum-moleculare (like L-M cells). Moreover, rela-tively few axons of the PP-associated interneurons was con-tained in stratum radiatum, also consistent with a combinedcategory of R and L-M cells. At the same time, importantdistinctions must be noted between CA1 and CA3. The ab-sence of physiologically induced synaptic connections fromCA1 pyramidal cells to L-M interneurons (Lacaille andSchwartzkroin, 1988) is consistent with the anatomy of thisregion. Pyramidal cell axons in CA1 primarily ascend in stra-tum oriens and project in the alveus (Ramon y Cajal, 1911;Lorente de No, 1934). The dendrites of feedforward interneu-rons are largely confined to the strata radiatum andlacunosum-moleculare (Lamsa et al., 2005), which are mostlydevoid of local pyramidal cell axon collaterals (Finch andBabb, 1981; Knowles and Schwartzkroin, 1981). The pre-sumed absence of pyramidal cell input indicates that R/L-Minterneurons in CA1 do not mediate feedback inhibition.
In contrast, our data in CA3 identify a strong RC input toboth R and L-M cells along with those from the PP and MF(Table 3). This is again consistent with the anatomical evi-dence of extensive axonal collaterals of pyramidal cells intothe CA3 stratum radiatum (Li et al., 1994; Sik et al., 1993).Therefore, compared with CA1, L-M and R interneurons inCA3 may have a different circuit arrangement relative to py-ramidal cells. Specifically, the RC input may be part of recur-rent lateral inhibition (Grossberg, 1972) which is nonexistent inCA1 (Turner, 1990). Computationally, this form of dendriticinhibition could foster pattern separation (Schoppa and Ur-ban, 2003), which also is unique to CA3 (Guzowski et al.,2004). Our morphological and physiological analysis furtherindicates that the feedforward role of CA3b R/L-M interneu-rons extends to the MF (absent in CA1) in addition to the PP,similarly to other CA3 interneurons (Lawrence and McBain,2003). The tendency we observed of both R and L-M cells toextend their axons toward the fissure suggests that theiraction may involve a mechanism of axodendritic shunting.
Moreover, L-M cells in CA1 exhibit excitatory synaptic re-sponses when major hippocampal afferents are stimulated intransversely cut slices, whereas inhibitory synaptic inputs arepredominantly activated when afferents are stimulated in lon-
Research in Systems Neuroscience The Journal of Comparative Neurology
692 G.A. ASCOLI ET AL.

gitudinal preparations (Lacaille and Schwartzkroin, 1988). Thismay be explained by the combined extrinsic action of Schaffercollaterals from CA3 pyramidal cells and of oriens/lacunosum-moleculare interneurons, which display a prominent septo-temporal axonal alignment (Maccaferri, 2005; Gloveli et al.,2005). Our findings on the lamellar dendritic orientation of Rand L-M cells in CA3b as well as the confinement of most oftheir axonal path within a proximal volume suggest that theseinterneurons may receive and produce predominantly localprojections. In this regard, it is important to recognize thelimits of the thick slice preparation used in our study. Due toits practical advantages, this experimental model is populareven in applications that aim at reconstructing circuit connec-tivity and axonal morphology (Markram, 2006). Our analysisshows that most of the visualized arbor extents are well withinthe section boundaries, thus alleviating the concerns of trun-cation artifacts (Fig. 5). Nonetheless, even relatively far fromthe slice edge, the terminals may have been sealed by theslicing procedure. Moreover, cells predominantly locatedaway from the slice surface may be healthier and thus couldtend to be preferentially recorded (Pyapali et al, 1998). There-fore, the possibility of these interneuron axonal arbors beinglimited artifactually cannot be excluded, and the definitivevalidation of these results will ultimately require labeling invivo.
The comparison with previous CA1 investigations togetherwith the morphological and physiological similarity of R andL-M cells, with the notable exception of the differences insynaptic plasticity, tentatively hints at a functional and ana-tomical distinction more pronounced along the CA3–CA1 axisthan across the R/L-M border. In particular, based on theiranatomical and physiological characteristics, R and L-M in-terneurons in CA3b might combine feedforward and lateralinhibitory roles, possibly modulated by different rhythmic os-cillations (Tort et al., 2007; Tukker et al., 2007) and long-termbidirectional plasticity (Kullmann and Lamsa, 2007). Futureadditional studies of the postsynaptic targets of these cellsmight allow a more direct inference on the functional role ofthese interneurons.
In neocortical interneurons, synaptic response kinetics cor-relate with arbor morphology but not with somatic layer(Dumitriu et al., 2007). Similarly, our biophysical measures donot depend on layer location, but vary with dendritic branchcount (HiDe/LoDe). Further studies are needed to elucidatethe specific computational roles implied by this additionalidentification of putative R/L-M interneuron subtypes. At theleast, a larger data sample is required before settling on arobust classification of interneurons. The modulation of circuitdynamics in CA3 may also be affected by the remarkablecell-to-cell variability of these interneurons, and by their con-trasting modular consistency of local branch geometry. Thisintriguing observation extends to both axons and dendrites ofR and L-M cells, and is opposite to the morphological ho-meostasis observed in pyramidal and granule cells (Sam-sonovich and Ascoli, 2006). This different organization is com-patible with the distinct developmental ontogeny of corticalprincipal cells and interneurons (Flames and Marın, 2005), andmay reflect separate constraints on the establishment of themature size and shape of these neurons.
ACKNOWLEDGMENTSThe authors are grateful to Mr. John Cavaretta for tracing
the neuronal morphologies, to Mrs. Sridevi Polavaram and Dr.Ruggero Scorcioni for development of and help withL-Measure, to Dr. Duncan Donohue for the reconstructionpostprocessing software, and to Dr. J. Josh Lawrence forfeedback on an earlier version of the manuscript.
LITERATURE CITEDAcsady L, Kamondi A, Sık A, Freund T, Buzsaki G. 1998. GABAergic cells
are the major postsynaptic targets of mossy fibers in the rat hippocam-pus. J Neurosci 18:3386 –3403.
Amaral DG, Witter MP. 1989. The three-dimensional organization of thehippocampal formation: a review of anatomical data. Neuroscience31:571–591.
Andersen P, Soleng AF, Raastad M. 2000. The hippocampal lamella hy-pothesis revisited. Brain Res 886:165–171.
Ascoli GA. 2006. Mobilizing the base of neuroscience data: the case ofneuronal morphologies. Nat Rev Neurosci 7:318 –324.
Ascoli GA, Krichmar JL, Nasuto SJ, Senft SL. 2001. Generation, descrip-tion and storage of dendritic morphology data. Philos Trans R SocLond B Biol Sci 356:1131–1145.
Ascoli GA, Donohue DE, Halavi M. 2007. NeuroMorpho.org: a centralresource for neuronal morphologies. J Neurosci 27:9247–9251.
Ascoli GA, Alonso-Nanclares L, Anderson SA, Barrionuevo G, Benavides-Piccione R, Burkhalter A, Buzsaki G, Cauli B, Defelipe J, Fairen A,Feldmeyer D, Fishell G, Fregnac Y, Freund TF, Gardner D, Gardner EP,Goldberg JH, Helmstaedter M, Hestrin S, Karube F, Kisvarday ZF,Lambolez B, Lewis DA, Marin O, Markram H, Munoz A, Packer A,Petersen CC, Rockland KS, Rossier J, Rudy B, Somogyi P, Staiger JF,Tamas G, Thomson AM, Toledo-Rodriguez M, Wang Y, West DC,Yuste R. 2008. Petilla terminology: nomenclature of features ofGABAergic interneurons of the cerebral cortex. Nat Rev Neurosci9:557–568.
Avoli M, D’Antuono M, Louvel J, Kohling R, Biagini G, Pumain R,D’Arcangelo G, Tancredi V. 2002. Network and pharmacological mech-anisms leading to epileptiform synchronization in the limbic system invitro. Prog Neurobiol 68:167–207.
Bernard C, Wheal HV. 1994. Model of local connectivity patterns in CA3and CA1 areas of the hippocampus. Hippocampus 4:497–529.
Berzhanskaya J, Urban NN, Barrionuevo G. 1998. Electrophysiological andpharmacological characterization of the direct perforant path input tohippocampal area CA3. J Neurophysiol 79:2111–2118.
Blatow M, Caputi A, Monyer H. 2005. Molecular diversity of neocorticalGABAergic interneurones. J Physiol 562:99 –105.
Buhl EH, Halasy K, Somogyi P. 1994. Diverse sources of hippocampalunitary inhibitory postsynaptic potentials and the number of synapticrelease sites. Nature 368:823– 828.
Burke RE. 2000. Comparison of alternative designs for reducing complexneurons to equivalent cables. J Comput Neurosci 9:31– 47.
Calixto E, Galvan EJ, Card JP, Barrionuevo G. 2008. Coincidence detec-tion of convergent perforant path and mossy fibre inputs by CA3interneurons. J Physiol 586:2695–2712.
Cannon RC, Turner DA, Pyapali GK, Wheal HV. 1998. An on-line archive ofreconstructed hippocampal neurons. J Neurosci Methods 84:49 –54.
Chitwood RA, Jaffe DB. 1998. Calcium-dependent spike-frequency ac-commodation in hippocampal CA3 nonpyramidal neurons. J Neuro-physiol 80:983–988.
Chitwood RA, Hubbard A, Jaffe DB. 1999. Passive electrotonic propertiesof rat hippocampal CA3 interneurones. J Physiol 515:743–756.
Christie BR, Franks KM, Seamans JK, Saga K, Sejnowski TJ. 2000. Syn-aptic plasticity in morphologically identified CA1 stratum radiatuminterneurons and giant projection cells. Hippocampus. 10:673– 683.
Claiborne BJ, Amaral DG, Cowan WM. 1986. A light and electron micro-scopic analysis of the mossy fibers of the rat dentate gyrus. J CompNeurol 246:435– 458.
Cope DW, Maccaferri G, Marton LF, Roberts JD, Cobden PM, Somogyi P.2002. Cholecystokinin-immunopositive basket and Schaffer collateral-associated interneurones target different domains of pyramidal cells inthe CA1 area of the rat hippocampus. Neuroscience 109:63– 80.
Cullheim S, Fleshman JW, Glenn LL, Burke RE. 1987. Membrane area and
Research in Systems NeuroscienceThe Journal of Comparative Neurology
693QUANTITATIVE MORPHOMETRY OF CA3b INTERNEURONS

dendritic structure in type-identified triceps surae alpha motoneurons.J Comp Neurol 255:68 – 81.
Douglas RJ, Martin KA. 2004. Neuronal circuits of the neocortex. Annu RevNeurosci 27:419 – 451.
Dumitriu D, Cossart R, Huang J, Yuste R. 2007. Correlation betweenaxonal morphologies and synaptic input kinetics of interneurons frommouse visual cortex. Cereb Cortex 17:81–91.
Finch DM, Babb TL. 1981. Demonstration of caudally directed hippocam-pal efferents in the rat by intracellular injection of horseradish peroxi-dase. Brain Res 214:405– 410.
Fisahn A. 2005. Kainate receptors and rhythmic activity in neuronal net-works: hippocampal gamma oscillations as a tool. J Physiol 562:65–72.
Flames N, Marın O. 2005. Developmental mechanisms underlying thegeneration of cortical interneuron diversity. Neuron 46:377–381.
Freund TF, Antal M. 1988. GABA-containing neurons in the septum controlinhibitory interneurons in the hippocampus. Nature 336:170 –173.
Gaıarsa JL, Khalilov I, Gozlan H, Ben-Ari Y. 2001. Morphology of CA3non-pyramidal cells in the developing rat hippocampus. Brain Res DevBrain Res 127:157–164.
Galvan EJ, Calixto E, Barrionuevo G. 2008. Bidirectional Hebbian plasticityat hippocampal mossy fiber synapses on CA3 interneurons. J Neurosci28:14042–14055.
Gamrani H, Onteniente B, Seguela P, Geffard M, Calas A. 1986. Gamma-aminobutyric acid-immunoreactivity in the rat hippocampus. A lightand electron microscopic study with anti-GABA antibodies. Brain Res364:30 –38.
Glaser JR, Glaser EM. 1990. Neuron imaging with Neurolucida—a PC-based system for image combining microscopy. Comput Med ImagingGraph 14:307–317.
Gloveli T, Dugladze T, Rotstein HG, Traub RD, Monyer H, Heinemann U,Whittington MA, Kopell NJ. 2005. Orthogonal arrangement of rhythm-generating microcircuits in the hippocampus. Proc Natl Acad Sci U SA 102:13295–13300.
Grossberg S. 1972. Neural expectation: cerebellar and retinal analogs ofcells fired by learnable or unlearned pattern classes. Kybernetik 10:49 –57.
Gulyas AI, Miles R, Hajos N, Freund TF. 1993. Precision and variability inpostsynaptic target selection of inhibitory cells in the hippocampalCA3 region. Eur J Neurosci 5:1729 –1751.
Gulyas AI, Megıas M, Emri Z, Freund TF. 1999. Total number and ratio ofexcitatory and inhibitory synapses converging onto single interneuronsof different types in the CA1 area of the rat hippocampus. J Neurosci19:10082–1097.
Guzowski JF, Knierim JJ, Moser EI. 2004. Ensemble dynamics of hip-pocampal regions CA3 and CA1. Neuron 44:581–584.
Halavi M, Polavaram S, Donohue DE, Hamilton G, Hoyt J, Smith KP, AscoliGA. 2008. NeuroMorpho.Org implementation of digital neuroscience:dense coverage and integration with the NIF. Neuroinformatics 6:241–252.
Helmstaedter M, Sakmann B, Feldmeyer D. 2008. L2/3 Interneuron groupsdefined by multiparameter analysis of axonal projection, dendritic ge-ometry, and electrical excitability. Cereb Cortex. 19:951–962.
Henze DA, Urban NN, Barrionuevo G. 1997. Origin of the apparent asyn-chronous activity of hippocampal mossy fibers. J Neurophysiol 78:24 –30.
Henze DA, Gonzalez-Burgos GR, Urban NN, Lewis DA, Barrionuevo G.2000. Dopamine increases excitability of pyramidal neurons in primateprefrontal cortex. J Neurophysiol 84:2799 –2809.
Houser CR. 2007. Interneurons of the dentate gyrus: an overview of celltypes, terminal fields and neurochemical identity. Prog Brain Res 163:217–232.
Ishizuka N, Cowan WM, Amaral DG. 1995. A quantitative analysis of thedendritic organization of pyramidal cells in the rat hippocampus.J Comp Neurol 362:17– 45.
Kawaguchi Y, Hama K. 1988. Physiological heterogeneity of nonpyramidalcells in rat hippocampal CA1 region. Exp Brain Res 72:494 –502.
Khazipov R, Congar P, Ben-Ari Y. 1995. Hippocampal CA1 lacunosum-moleculare interneurons: modulation of monosynaptic GABAergic IP-SCs by presynaptic GABAB receptors. J Neurophysiol 74:2126 –2137.
Klausberger T, Somogyi P. 2008. Neuronal diversity and temporal dynam-ics: the unity of hippocampal circuit operations. Science 321:53–57.
Knowles WD, Schwartzkroin PA. 1981. Axonal ramifications of hippocam-pal Ca1 pyramidal cells. J Neurosci 1:1236 –1241.
Kopysova IL, Debanne D. 1998. Critical role of axonal A-type K� channelsand axonal geometry in the gating of action potential propagationalong CA3 pyramidal cell axons: a simulation study. J Neurosci 18:7436 –7451.
Kullmann DM, Lamsa KP. 2007. Long-term synaptic plasticity in hip-pocampal interneurons. Nat Rev Neurosci 8:687– 699.
Kunkel DD, Hendrickson AE, Wu JY, Schwartzkroin PA. 1986. Glutamicacid decarboxylase (GAD) immunocytochemistry of developing rabbithippocampus. J Neurosci 6:541–552.
Kunkel DD, Lacaille JC, Schwartzkroin PA. 1988. Ultrastructure of stratumlacunosum-moleculare interneurons of hippocampal CA1 region. Syn-apse 2:382–394.
Lacaille JC, Schwartzkroin PA. 1988. Stratum lacunosum-moleculare in-terneurons of hippocampal CA1 region. I. Intracellular response char-acteristics, synaptic responses, and morphology. J Neurosci 8:1400 –1410.
Laezza F, Dingledine R. 2004. Voltage-controlled plasticity at GluR2-deficient synapses onto hippocampal interneurons. J Neurophysiol92:3575–3581.
Lamsa K, Heeroma JH, Kullmann DM. 2005. Hebbian LTP in feedforwardinhibitory interneurons and the temporal fidelity of input discrimination.Nat Neurosci 8:916 –924.
Lawrence JJ, McBain CJ. 2003. Interneuron diversity series: containing thedetonation-feedforward inhibition in the CA3 hippocampus. TrendsNeurosci 26:631– 640.
Lee WC, Chen JL, Huang H, Leslie JH, Amitai Y, So PT, Nedivi E. 2008. Adynamic zone defines interneuron remodeling in the adult neocortex.Proc Natl Acad Sci U S A 105:19968 –19973.
Leutgeb JK, Leutgeb S, Moser MB, Moser EI. 2007. Pattern separation inthe dentate gyrus and CA3 of the hippocampus. Science 315:961–966.
Li XG, Somogyi P, Ylinen A, Buzsaki G. 1994. The hippocampal CA3network: an in vivo intracellular labeling study. J Comp Neurol 339:181–208.
Lisman JE. 1999. Relating hippocampal circuitry to function: recall ofmemory sequences by reciprocal dentate-CA3 interactions. Neuron22:233–242.
Lorente de No R. 1934. Studies on the structure of the cerebral cortex. II.Continuation of the study of the ammonic system. J Psychol Neurol(Lpz) 46:113–177.
Maccaferri G. 2005. Stratum oriens horizontal interneurone diversity andhippocampal network dynamics. J Physiol 562:73– 80.
Maccaferri G, Lacaille JC. 2003. Interneuron diversity series: hippocampalinterneuron classifications—-making things as simple as possible, notsimpler. Trends Neurosci 26:564 –571.
Mann EO, Paulsen O. 2007. Role of GABAergic inhibition in hippocampalnetwork oscillations. Trends Neurosci 30:343–349.
Markram H. 2006. The blue brain project. Nat Rev Neurosci 7:153–160.Martina M, Krasteniakov NV, Bergeron R. 2003. D-serine differently mod-
ulates NMDA receptor function in rat CA1 hippocampal pyramidal cellsand interneurons. J Physiol 548:411– 423.
McBain CJ, Fisahn A. 2001. Interneurons unbound. Nat Rev Neurosci2:11–23.
McBain CJ, Maccaferri G. 1997. Synaptic plasticity in hippocampal inter-neurons? A commentary. Can J Physiol Pharmacol 75:488 – 494.
McNaughton N, Morris RG. 1987. Chlordiazepoxide, an anxiolytic benzo-diazepine, impairs place navigation in rats. Behav Brain Res 24:39 – 46.
McQuiston AR, Madison DV. 1999. Nicotinic receptor activation excitesdistinct subtypes of interneurons in the rat hippocampus. J Neurosci19:2887–2896.
Mott DD, Turner DA, Okazaki MM, Lewis DV. 1997. Interneurons of thedentate-hilus border of the rat dentate gyrus: morphological and elec-trophysiological heterogeneity. J Neurosci 17:3990 – 4005.
O’Reilly RC, McClelland JL. 1994. Hippocampal conjunctive encoding,storage, and recall: avoiding a trade-off. Hippocampus 4:661– 682.
Pelkey KA, Topolnik L, Yuan XQ, Lacaille JC, McBain CJ. 2008. State-dependent cAMP sensitivity of presynaptic function underlies meta-plasticity in a hippocampal feedforward inhibitory circuit. Neuron 60:980 –987.
Porter JT, Johnson CK, Agmon A. 2001. Diverse types of interneuronsgenerate thalamus-evoked feedforward inhibition in the mouse barrelcortex. J Neurosci 21:2699 –2710.
Pyapali GK, Sik A, Penttonen M, Buzsaki G, Turner DA. 1998. Dendriticproperties of hippocampal CA1 pyramidal neurons in the rat: intracel-lular staining in vivo and in vitro. J Comp Neurol 391:335–352.
Research in Systems Neuroscience The Journal of Comparative Neurology
694 G.A. ASCOLI ET AL.

Ramon y Cajal S. 1911. Histologie du systeme nerveux de l’hommes et desvertebres. Paris: Maloine.
Romo-Parra H, Trevino M, Heinemann U, Gutierrez R. 2008. GABA actionsin hippocampal area CA3 during postnatal development: differentialshift from depolarizing to hyperpolarizing in somatic and dendriticcompartments. J Neurophysiol 99:1523–1534.
Rossi F, Gianola S, Corvetti L. 2007. Regulation of intrinsic neuronalproperties for axon growth and regeneration. Prog Neurobiol 81:1–28.
Samsonovich AV, Ascoli GA. 2006. Morphological homeostasis in corticaldendrites. Proc Natl Acad Sci U S A 103:1569 –1574.
Savic N, Pedarzani P, Sciancalepore M. 2001. Medium afterhyperpolar-ization and firing pattern modulation in interneurons of stratum radia-tum in the CA3 hippocampal region. J Neurophysiol 85:1986 –1997.
Schoppa NE, Urban NN. 2003. Dendritic processing within olfactory bulbcircuits. Trends Neurosci 26:501–506.
Scorcioni R, Polavaram S, Ascoli GA. 2008. L-Measure: a web-accessibletool for the analysis, comparison and search of digital reconstructionsof neuronal morphologies. Nat Protoc 3:866 – 876.
Segal M, Landis S. 1974. Afferents to the hippocampus of the rat studiedwith the method of retrograde transport of horseradish peroxidase.Brain Res 78:1–15.
Shepherd GM, Harris KM. 1998. Three-dimensional structure and compo-sition of CA33CA1 axons in rat hippocampal slices: implications forpresynaptic connectivity and compartmentalization. J Neurosci 18:8300 – 8310.
Shepherd GM, Stepanyants A, Bureau I, Chklovskii D, Svoboda K. 2005.Geometric and functional organization of cortical circuits. Nat Neurosci8:782–790.
Sik A, Tamamaki N, Freund TF. 1993. Complete axon arborization of asingle CA3 pyramidal cell in the rat hippocampus, and its relationshipwith postsynaptic parvalbumin-containing interneurons. Eur J Neuro-sci 5:1719 –1728.
Smith TG Jr, Lange GD, Marks WB. 1996. Fractal methods and results incellular morphology— dimensions, lacunarity and multifractals. J Neu-rosci Methods 69:123–136.
Soleng AF, Raastad M, Andersen P. 2003. Conduction latency along CA3hippocampal axons from rat. Hippocampus 13:953–961.
Somogyi P, Klausberger T. 2005. Defined types of cortical interneuronestructure space and spike timing in the hippocampus. J Physiol 562:9 –26.
Somogyi P, Hodgson AJ, Smith AD, Nunzi MG, Gorio A, Wu JY. 1984.Different populations of GABAergic neurons in the visual cortex andhippocampus of cat contain somatostatin- or cholecystokinin-immunoreactive material. J Neurosci 4:2590 –2603.
Stepanyants A, Chklovskii DB. 2005. Neurogeometry and potential synap-tic connectivity. Trends Neurosci 28:387–394.
Stepanyants A, Tamas G, Chklovskii DB. 2004. Class-specific features ofneuronal wiring. Neuron 43:251–259.
Stepanyants A, Hirsch JA, Martinez LM, Kisvarday ZF, Ferecsko AS,Chklovskii DB. 2008. Local potential connectivity in cat primary visualcortex. Cereb Cortex 18:13–28.
Steward O, Scoville SA. 1976. Cells of origin of entorhinal cortical afferents
to the hippocampus and fascia dentata of the rat. J Comp Neurol169:347–370.
Sugino K, Hempel CM, Miller MN, Hattox AM, Shapiro P, Wu C, Huang ZJ,Nelson SB. 2006. Molecular taxonomy of major neuronal classes in theadult mouse forebrain. Nat Neurosci 9:99 –107.
Takacs VT, Freund TF, Gulyas AI. 2008. Types and synaptic connectionsof hippocampal inhibitory neurons reciprocally connected with themedial septum. Eur J Neurosci 28:148 –164.
Tamamaki N, Nojyo Y. 1993. Projection of the entorhinal layer II neurons inthe rat as revealed by intracellular pressure-injection of neurobiotin.Hippocampus 3:471– 480.
Toledo-Rodriguez M, Goodman P, Illic M, Wu C, Markram H. 2005. Neu-ropeptide and calcium-binding protein gene expression profiles pre-dict neuronal anatomical type in the juvenile rat. J Physiol 567:401–413.
Tort AB, Rotstein HG, Dugladze T, Gloveli T, Kopell NJ. 2007. On theformation of gamma-coherent cell assemblies by oriens lacunosum-moleculare interneurons in the hippocampus. Proc Natl Acad Sci U S A104:13490 –13495.
Treves A, Rolls ET. 1992. Computational constraints suggest the need fortwo distinct input systems to the hippocampal CA3 network. Hip-pocampus 2:189 –199.
Tukker JJ, Fuentealba P, Hartwich K, Somogyi P, Klausberger T. 2007. Celltype-specific tuning of hippocampal interneuron firing during gammaoscillations in vivo. J Neurosci 27:8184 – 8189.
Turner DA. 1990. Feedforward inhibitory potentials and excitatory interac-tions in guinea-pig hippocampal pyramidal cells. J Physiol 422:333–350.
Vida I, Halasy K, Szinyei C, Somogyi P, Buhl EH. 1998. Unitary IPSPsevoked by interneurons at the stratum radiatum-stratum lacunosum-moleculare border in the CA1 area of the rat hippocampus in vitro.J Physiol 506:755–773.
Williams S, Samulack DD, Beaulieu C, LaCaille JC. 1994. Membraneproperties and synaptic responses of interneurons located near thestratum lacunosum-moleculare/radiatum border of area CA1 in whole-cell recordings from rat hippocampal slices. J Neurophysiol 71:2217–2235.
Witter MP. 2007. Intrinsic and extrinsic wiring of CA3: indications forconnectional heterogeneity. Learn Mem 14:705–13.
Witter MP, Griffioen AW, Jorritsma-Byham B, Krijnen JL. 1988. Entorhinalprojections to the hippocampal CA1 region in the rat: an underesti-mated pathway. Neurosci Lett 85:193–198.
Wittner L, Henze DA, Zaborszky L, Buzsaki G. 2006. Hippocampal CA3pyramidal cells selectively innervate aspiny interneurons. Eur J Neu-rosci 24:1286 –1298.
Wittner L, Henze DA, Zaborszky L, Buzsaki G. 2007. Three-dimensionalreconstruction of the axon arbor of a CA3 pyramidal cell recorded andfilled in vivo. Brain Struct Funct 212:75– 83.
Yuste R. 2005. Origin and classification of neocortical interneurons. Neu-ron 48:524 –527.
Ziakopoulos Z, Tillett CW, Brown MW, Bashir ZI. 1999. Input-and layer-dependent synaptic plasticity in the rat perirhinal cortex in vitro. Neu-roscience 92:459 – 472.
Research in Systems NeuroscienceThe Journal of Comparative Neurology
695QUANTITATIVE MORPHOMETRY OF CA3b INTERNEURONS


