Changes in rice farming profitability over five decades in Central Luzon
29
Changes in rice farming profitability over five decades in Central Luzon Kei Kajisa Aoyama Gakuin University SSD Division Seminar, 2014 Nov 19
-
Upload
irrisocialsciences -
Category
Documents
-
view
190 -
download
0
description
Dr. Kei KajisaSchool of International Politics, Economics and BusinessAoyama Gakuin UniversityTokyo, JapanSocial Sciences DivisionWednesday, 19 November 201410:30 am - 11:30 amSSD Conference Room | J. Drilon BuildingInternational Rice Research Institute Abstract:Central Luzon Loop survey is a rare longitudinal data set as it can date back to 1966, before the onset of the Green Revolution. The regular data collection in every four years allows us to explore how Filipino farmers have reacted to the introduction of new technologies, the development of non-farm sectors, price changes, and environmental changes over time. In this seminar I would like to show the changes in rice farming profitability and the underlying factors. A concern is the decline of profitability in the wet season. I will also show the changes in distribution and discuss who gained the most by the Green Revolution.
Transcript of Changes in rice farming profitability over five decades in Central Luzon

Changes in rice farming profitability over five
decades in Central LuzonKei Kajisa
Aoyama Gakuin UniversitySSD Division Seminar, 2014 Nov 19

Book publication project• Title:
• Changes in Rice Farming the Philippines: insights from five decades of a household level survey
• Authors: • Piedad F. Moya, Kei Kajisa, Randolph Barker, Sam Mohanty, Fe Gascon and
Maryrose San Valentin
• I took care of “Profitability section”• I would like to share findings of that section (together with the related findings
in the other chapters)
• All figures and tables are from the book draft. • More figures and tables which are useful and informative are available in the
book.

The Loop Survey• It started in 1966-67 (i.e, before the onset of the
Green Revolution). very rare• Twenty three (!) rounds of survey were conducted
every four to five years until 2011-12.• It covers detailed records on the production
systems in both wet and dry season.

Central Luzon Loop Survey
• the fields to be observed at specific kilometer posts along the “loop” of national highway (e.g., the 50th, 100h,150th etc.)
• Re-survey the same field (even when the operator changes) Plot panel data

Historical Background

Background (1): technologies1966 1970 1974 1979 1982 1986 1990 1994 1999 2003 2008 2011Wet %
Tv 100 34 36 9 7 4 5 3 1 1Mv1 77 86 14 10 11 4 2 2 3Mv2 88 95 43 18 10 6 1 1 0Mv3 1 65 88 93 43 12 4 2Mv4 60 89 95 98Hybrid 1 1
1967 1971 1975 1980 1987 1991 1995 1998 2004 2007 2012Dry %
TV 94 8 7 6 3Mv1 6 92 100 10 9 9 2 13 1Mv2 7 89 20 12 7 2 3 1Mv3 78 83 91 46 6 3 8Mv4 43 90 96 92Hybrid 5
• Continuous introduction of newer MVs. Adopting newer MVs without much time lag from the release. progressive farmers.
• MV2: short duration, pest and disease resistance• MV3: MV2+ grain quality• MV4: MV3+tolerance to environmental stress

Table 7.2. Top 5 Varieties planted overtime by season, Central Luzon Loop survey 1966-2012 Rank Wet
1966 1970 1974 1979 1982 1986 1990 1994 1998 2003 2007 2011
1 TJEREMAS IR5 IR20 IR36 IR36 IR64 IR64 IR64 IR64 PSBRc8
2 Rc128 216
2 BINATO IR20 IR1561 IR42 IR42 IR42 IR72, IR66
Rc14, RC10, IR60, IR66
Rc28 Rc18 PSBRc82 RC222
3 BE3 WAGWAG
IR28, RAMINAD, C4
IR44 IR50 IR36 IR70 Rc4 Rc18 ANGELICA Rc18 RC 224,
160
4 INTAN BE3, INANO BE3 IR48,
IR29 IR54 IR10, IR48 IR74 Rc2 IR74 Rc64,
IR64 Rc28 RC128
5 RAMINAD IR
IR747, IR5, TJEREMAS, IR12
BE3 IR48 IR62 IR36 IR36, IR74
Rc64,RC54, IR52, RC74
Rc28 ANGELICA
SUPER82
Top 5 varieties (WS)

Dry 1967 1971 1975 1980 1987 1991 1995 1999 2004 2008 2012
1 INTAN IR20 IR1561 IR36 IR64 IR64 IR64 IR64 PSBRc82 Rc128 SL8
2 WAGWAG IR8 IR20 IR42 IR36 IR72 Rc14 Rc28 Rc14 PSBRc82 216
3
TJEREMAS, SERUP KETCHEL, BINONTON, IR8, MACAM
IR5
IR1529, IR579, IR5, BPI76, IR747, BINATO, IR26
IR2307, IR247
IR22, IR66, IR42
IR66 Rc4 PSBRc Rc18 Rc28 224
4 INTAN IR44
DAKOT MOMONG, IR10, IR68
R10 R10, IR60
IR28, RC52
IR64, RC28
Rc18, RC130, SUPERINGO, ANGELICA, PJ25
222
5 IR22 IR23 TUNNEL, 13 IR74 IR66
IR32, IR52, IR20
Rc60
PG25, PSBRC10, PG7, BIGANTE, RC1163
PSBRc10, HYBRID, 160, 128
Top 5 varieties (DS)

Background (2): technologies (cont.)• Irrigation
• UPRIIS in 1975 DS rice farming became possible• low lift pumps and shallow tube wells since 1990s
• Direct seeding• since mid 1980s labor and water saving tech +
demand for herbicide ↑
• Small scale mechanization (hand tractor & threshing machine) (note: large threshing machine “tilyadora”was available at plantations in 1920s)
• since 1970s labor saving tech
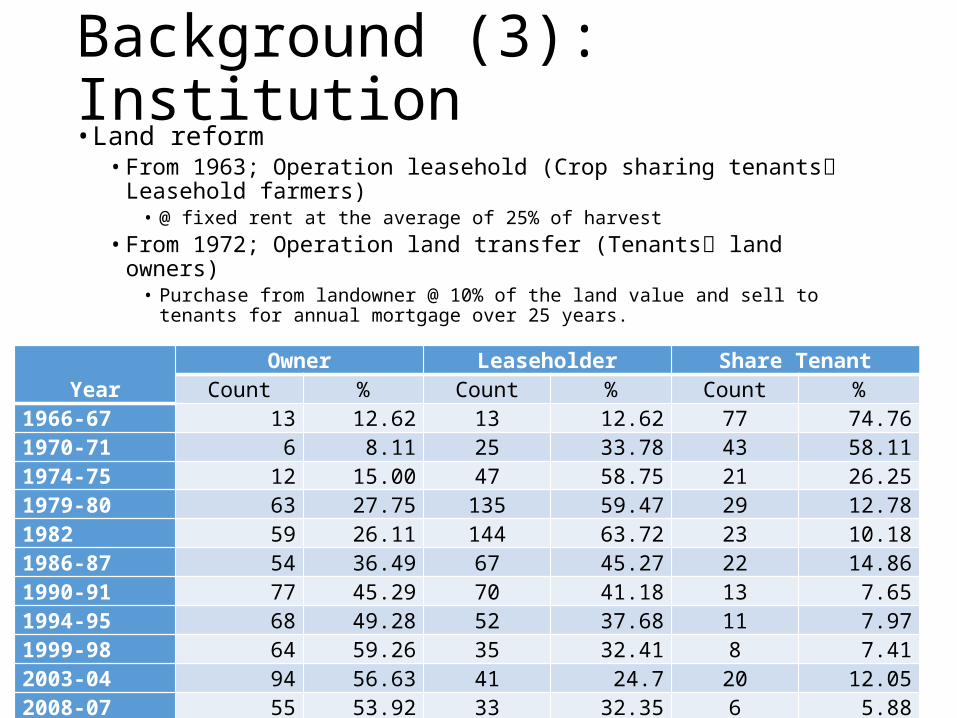
Background (3): Institution• Land reform
• From 1963; Operation leasehold (Crop sharing tenants Leasehold farmers)
• @ fixed rent at the average of 25% of harvest • From 1972; Operation land transfer (Tenants land owners)
• Purchase from landowner @ 10% of the land value and sell to tenants for annual mortgage over 25 years.
YearOwner Leaseholder Share Tenant
Count % Count % Count %1966-67 13 12.62 13 12.62 77 74.761970-71 6 8.11 25 33.78 43 58.111974-75 12 15.00 47 58.75 21 26.251979-80 63 27.75 135 59.47 29 12.781982 59 26.11 144 63.72 23 10.181986-87 54 36.49 67 45.27 22 14.861990-91 77 45.29 70 41.18 13 7.651994-95 68 49.28 52 37.68 11 7.971999-98 64 59.26 35 32.41 8 7.412003-04 94 56.63 41 24.7 20 12.052008-07 55 53.92 33 32.35 6 5.882011-12 75 63.03 32 26.89 6 5.04

Background (4): Market
Loop survey data International Market (Bangkok)
0
100
200
300
400
500
600
700
800
1961 1966 1971 1976 1981 1986 1991 1996 2001 2006 2011Year
0
300
600
900
1200
1500
1800
2100
• Rice markets are integrated very well.

Background (5): Non-agricultural sector development
Loop survey data Laguna (Brgy Tubuan) data• Once increased (in early 90s) but stable these days = ag. laborers
are still available in less favorable areas.• (probably labor shortage will emerge in a few years if the econ
growth continues at the current rate.)
0
100
200
300
400
500
600
700
1965 1970 1975 1980 1985 1990 1995 2000P
/day
(200
0 pr
ices
)
5
10
15
20
25
30
35
40
kg/d
ay
Ag. wage (deflator=CPI)Ind. wage (deflator=CPI)Ag. wage (deflator=rice price)
Figure 2. Changes in real wage rates in the non-farm sector and in a rice village in the Laguna lowland rice belt,
rough estimates, 1965-2002

Background (6): Non-agricultural sector development Aging of farmers
Average age of farm
operator: 59 years
old

Changes in Profitability and Factor Share

Changes in profitability• (1) Net return over
paid out costs= revenue - paid out cost (=income)
• (2)Net profit = (1) – imputed

Changes in revenue, costs, yield
Note: rice price has been declining over 5 decades.

Findings• Combination of stagnated yield & declining rice
price is the reason for declining profit in WS.• Unfavorable weather condition?• Need improvement in biotech or agronomy.
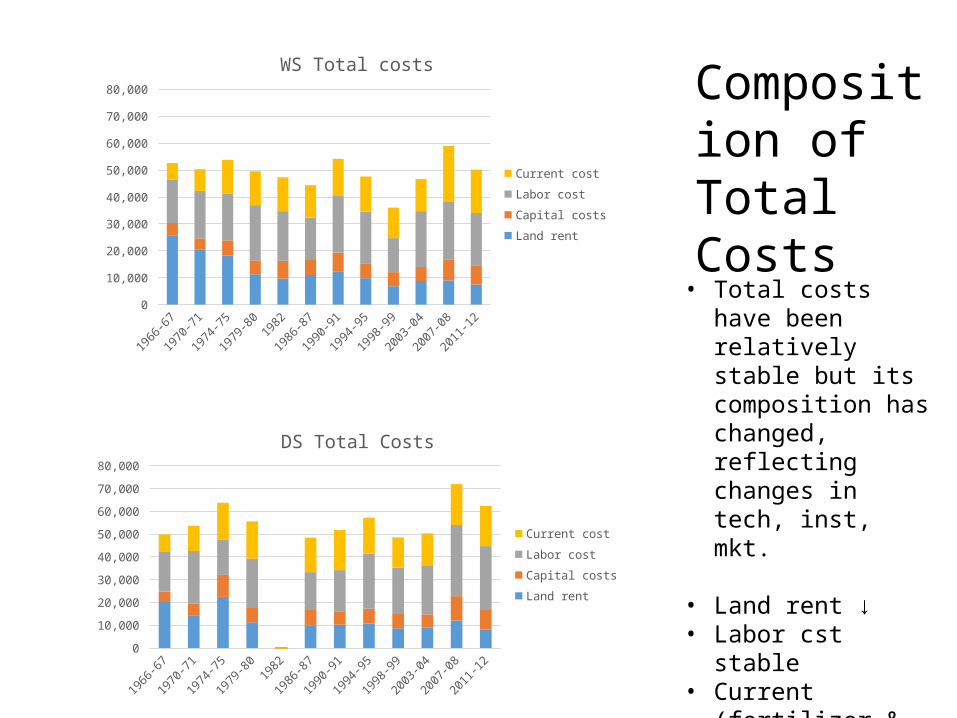
• Total costs are relatively stable over time, even though there have been dramatic changes in tech, inst, mkt.
• Why?
1966-67
1970-71
1974-
75
1979-
80
1982 1986-87
1990-91
1994-95
1998-99
2003-
04
2007-
08
2011-
12
0
10,000
20,000
30,000
40,000
50,000
60,000
70,000
80,000
WS Total costs
Current costLabor costCapital costsLand rent
1966-67
1970-71
1974-75
1979-80
1982 1986-87
1990-91
1994-95
1998-99
2003-04
2007-08
2011-12
0
10,000
20,000
30,000
40,000
50,000
60,000
70,000
80,000
DS Total Costs
Current costLabor costCapital costsLand rent
Composition of Total Costs
• Total costs have been relatively stable but its composition has changed, reflecting changes in tech, inst, mkt.
• Land rent ↓• Labor cst stable• Current (fertilizer &
seed) ↑
• Overall more or less stable

Fertilizer use and price


1966-67
1970-71
1974-75
1979-801982
1986-87
1990-91
1994-95
1998-99
2003-04
2007-08
2011-120
5,000
10,000
15,000
20,000
25,000
30,000
35,000
WS Current Inputs
Others ** Irrigation Cost Seeds* Other Pesticide Herbicide Insecticide Fertilizer
1966-67
1970-71
1974-75
1979-801982
1986-87
1990-91
1994-95
1998-99
2003-04
2007-08
2011-120
5,000
10,000
15,000
20,000
25,000
30,000
35,000
DS Current Input
Others ** Irrigation Cost Seeds* Other Pesticide Herbicide Insecticide Fertilizer

Labor use and wage rate

• Land rent• Land reform + (land saving tech) rent ↓
• Current input (Fertilizer)• 60s 70s: Introduction of MV fertilizer demand ↑ fertilizer use
↑(regardless of p↑) current input cost ↑• 80s: p↓ demand ↑↑ (reached recom level) expenditure no big change• 00s: p↑ maintain recom level expenditure ↑
• Current input (seed)• Use of certified seeds↑
• Labor• 70s: MV (labor using tech, weeding) labor demand and use↑• 80s90s: Wage rate ↑ substitution effect direct seeding & mechanization
& MV2 (short duration) Mandays ↓.• More obvious in DS, direct seeding is possible only in DS. (Seed cannot germinate in
continuous flooding in WS)
• 00s: Wage ↓substitution effect Mandays↑• Through these substitution effects, labor costs are relatively stable over
time• Proportion of hired labor continuously ↑ ( non-ag dev & aging)
• Facing the changes in technology, inst, and market price, farmers are actively changing inputs to achieve optimal combination. (i.e., use expensive one less and substitute cheaper inputs)
• Total cost did not change dramatically.

Factor share

• Share of labor cost• Relatively stable over time• Substitution of hired labor (poor landless) for family
labor• The GR has generated more returns to poor
households.
• The operators surplus and land rent • The share belonged to land reform beneficiaries in 80s &
90s. • However, this benefit is disappearing particularly in WS.

For the future• In the short run
• Need the improvement of WS yield.• Unfavorable weather? Need biological and agronomic technologies
• In the long run• Wage rate of hired labor will stat increasing. & Aging of
farmers (inevitable event along the course of econ dev)• Need to introduce labor saving tech = agglomeration of
land + mechanization• Need an active land rental market for agglomeration
• Seems to be very difficult. Continuous extension of the land reform code makes the land owners hesitant to rent out.
• Need to complete the reform and let the rental market determine allocation.

Cf. Japanese farm’s production costs by operational size
Total cost
Total cost
1960
2008
High cost farming can survive under highly protected rice market. expensive rice at the cost of consumers

Thank you very much