Challenges Facing The Malaysian Plastics Industry Malaysia Report 2… · 3 Development of the...
31
Challenges Facing The Malaysian Plastics Industry 15th Term AFPI Conference 20-22 October 2014 │ Bangkok, Thailand
Transcript of Challenges Facing The Malaysian Plastics Industry Malaysia Report 2… · 3 Development of the...
Challenges Facing The MalaysianPlastics Industry
15th Term AFPI Conference20-22 October 2014 │ Bangkok, Thailand

Updates on the MalaysianEconomy
2

3
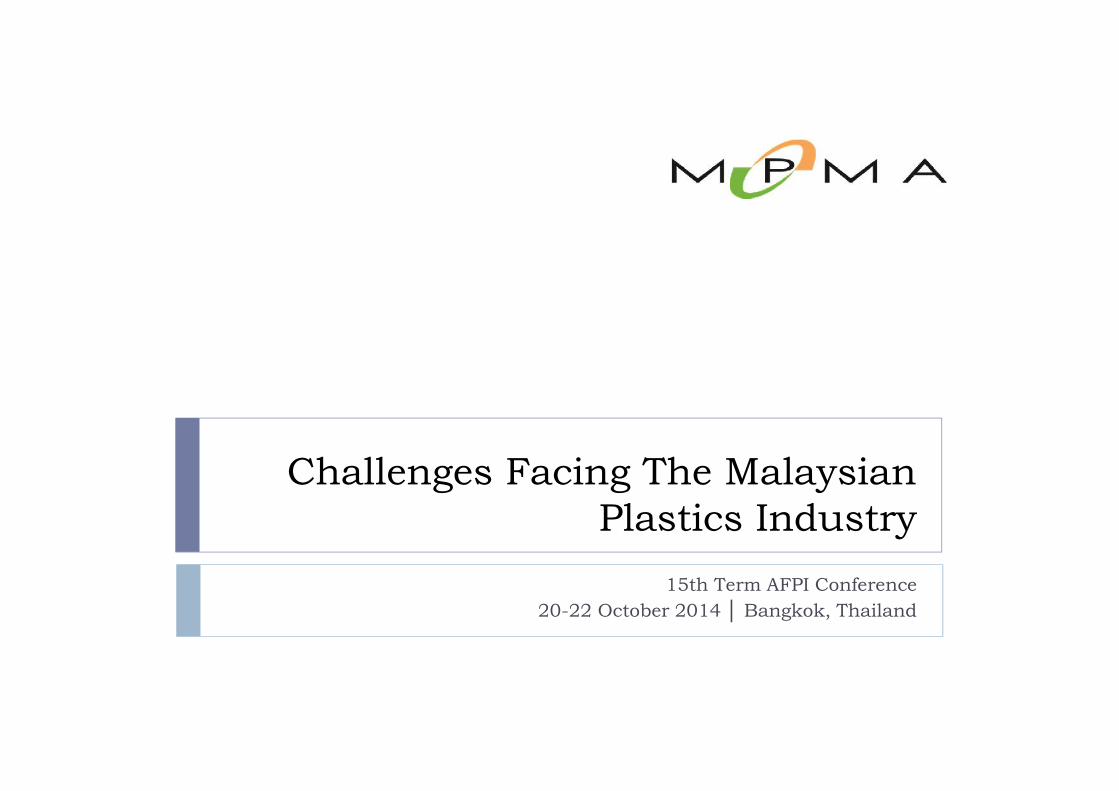
Development of the Malaysian Economy in2013 Growth for 2013: 4.7%, weaker than the 5.6% achieved in
2012.
Growth was focused on domestic-oriented sectors, forexample, construction and transport equipment..
Projection for the 2014 GDP growth: 5.0% – 5.50%.
Growth will be driven by the domestic demand which willcontinue to be supported by an accommodativemonetary policy.
4
Malaysia’s Quarter GDP Growth
-8
-6
-4
-2
0
2
4
6
8
10
12
Q1 Q2 Q3 Q4 Q1 Q2 Q3 Q4 Q1 Q2 Q3 Q4 Q1 Q2 Q3 Q4 Q1 Q2 Q3 Q4 Q1 Q2
Perc
enta
ge %
Year
Source: Bank Negara Malaysia
2009 2010 2011 2012 2013 2014

5
Malaysia’s GDP Growth 2013/14 bySub-sector
Share2013
2013 2014
(%) Q1 Q2 Q3 Q4 Q1 Q2
Real GDP(annual change) 4.1% 4.3% 5.0% 5.1% 6.2% 6.4%
Agriculture 7.1 6.0% 0.4% 2.1% 0.2% 2.3% 7.1%
Mining 8.1 -1.9% 4.1% 1.7% -1.5% -0.8% 2.1%
Manufacturing 24.5 0.3% 3.3% 4.2% 5.1% 6.8% 7.3%
Construction 3.8 14.2% 9.9% 10.1% 9.7% 18.9% 0.9%
Services 55.2 5.9% 4.8% 5.9% 6.4% 6.6% 6.0%
Source: Bank Negara Malaysia
6
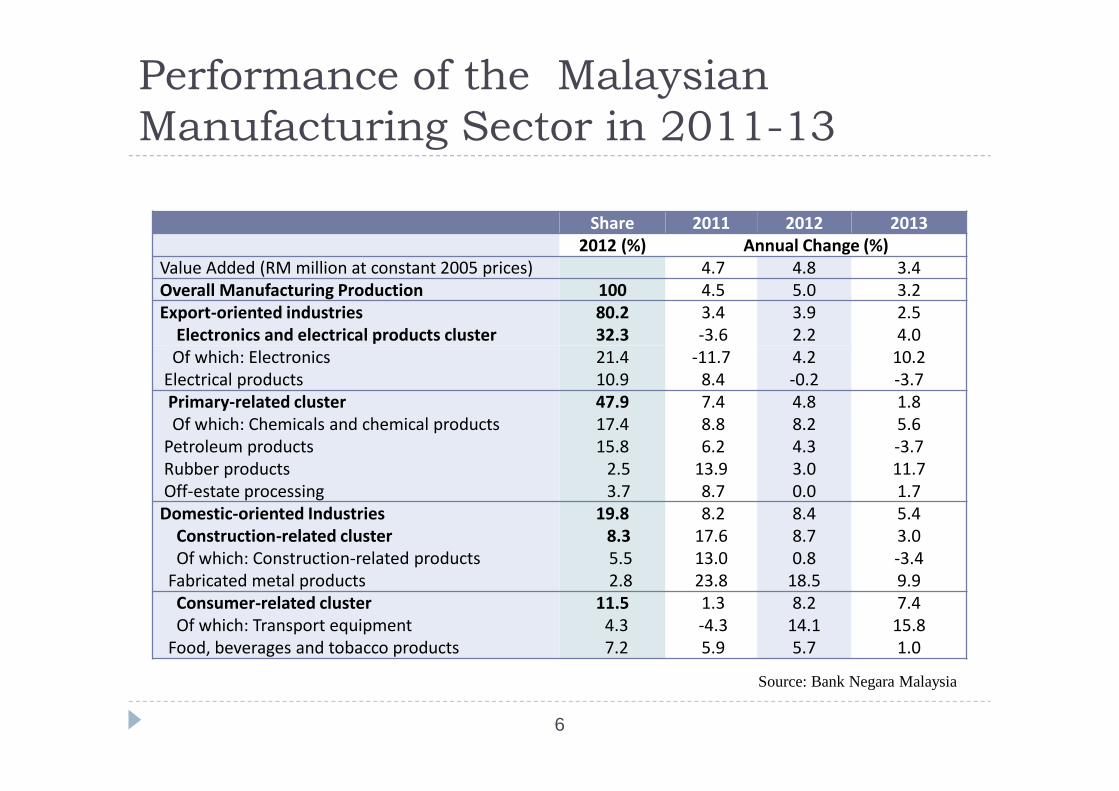
Performance of the MalaysianManufacturing Sector in 2011-13
Share 2011 2012 20132012 (%) Annual Change (%)
Value Added (RM million at constant 2005 prices) 4.7 4.8 3.4Overall Manufacturing Production 100 4.5 5.0 3.2Export-oriented industries
Electronics and electrical products cluster80.232.3
3.4-3.6
3.92.2
2.54.0
Of which: ElectronicsElectrical products
21.410.9
-11.78.4
4.2-0.2
10.2-3.7
Primary-related clusterOf which: Chemicals and chemical productsPetroleum productsRubber productsOff-estate processing
47.917.415.82.53.7
7.48.86.213.98.7
4.88.24.33.00.0
1.85.6-3.711.71.7
Domestic-oriented IndustriesConstruction-related clusterOf which: Construction-related productsFabricated metal products
19.88.35.52.8
8.217.613.023.8
8.48.70.818.5
5.43.0-3.49.9
Consumer-related clusterOf which: Transport equipmentFood, beverages and tobacco products
11.54.37.2
1.3-4.35.9
8.214.15.7
7.415.81.0
Source: Bank Negara Malaysia

Updates on the MalaysianPlastics Industry

8
Key Data for the Malaysian PlasticsIndustry
2010 2011 2012 2013 2014(1H)Malaysia’s gross domesticproduct (GDP) growth 7.2% 5.1% 5.6% 4.7% 6.3%
Number of plasticsmanufacturers 1,400 1,400 1,350 1,350 1,300
Employment 71,500 74,000 74,000 76,000 80,000
Turnover RM15.8b(+8%)
RM16.25b(+2.1%)
*RM17.16b(6.5%)
RM17.94b(4.5%)
RM9.15(7.8%)
Export RM9.4b(+14%)
RM10.15b(+6%)
RM10.05b(-1%)
RM10.69b(+6.4%)
RM5.87b(+15.9%)
% of export against turnover 59% 62% 59% 60% 64%
Resin consumption 1.89m MT(+11%)
1.98m MT(+5%)
2.04m MT(+3%)
2.10m MT(+3%) N/A
Per capita consumption ofresin 67kg 68kg 69kg 70kg N/A

9
Trends of the Malaysian Plastics Industry
Growth in the recent years has been affected by the globaleconomic situation arising principally from the economicsituation in the developed countries such as the US and EU ,MNCs re-location and emergence of the low-cost producingcountries.
Nevertheless, exports continue to grow, led by the packagingmaterials sector. The total exports to total turnover ratio hadshown an increasing trends aggressive export promotion bythe industry.
New Economic Model (2010-2020) rapid infrastructuredevelopment, opportunities in the construction industry.
Increased household income, low borrowing rates forexample – higher consumption, strong vehicle sales, exceeding600,000 unit per year.

10
Turnover and Growth Rate
%

11
Plastic Products:Export vs Domestic Production
2001 2002 2003 2004 2005 2006 2007 2008 2009 2010 2011 2012 2013Exp 3.72 3.92 4.53 5.57 6.67 7.7 8.38 9.3 8.3 9.4 10.15 10.05 10.69Dom 4.78 4.88 4.87 5.93 7.33 7.2 7.12 6.9 6.3 6.4 6.10 7.05 7.25T. Sales 8.5 8.8 9.4 11.5 14.0 14.9 15.5 16.2 14.6 15.8 16.25 17.1 17.94E/TRatio
44% 45% 48% 48% 48% 51% 53% 57% 57% 59% 62% 59% 60%
Source: Department of Statistics and MATRADE, Malaysia
RM
bil
lion

12
Export/Sales Turnover Ratio
TurnoverRM billion
E/T Ratio

13
Major Market Segments for PlasticProducts

Main Production Processes
Film Extrusion
46%
Others
4%
Pipes and Profiles
Extrusion
8%
Foam Moulding
3%
Injection
Moulding
34%
Blow Moulding
5%
Source: MPMA
2013: RM17.9 billion

Resin Consumption 2013Approximately 2.1 million MT
‘000MT
Source: MPMA & Plastic Resin Producers Group

16
Outlook for 2014
Global economy is still uncertain, with issues continuingto affect the economies of the developed countries.
Malaysia: Domestic demand is expected to continue to bethe key driver of growth.
GDP forecast: 5.0% to 5.5% for 2014. Being a trading nation heavily dependent on exports, the
eventual economic growth of the country would bedependent on the economic situations prevailing in thedeveloped countries such as US, Europe and Japan.

17
Labour Issue – Minimum Wages
Implemented by large companies: 1 January 2013, SMEs on 1 January 2014. Basic Pay Rate: RM900/month, Peninsular Malaysia RM800/month, East Malaysia
Huge impact on manufacturing cost: multiplier effectresulting in an increase of 30% to 50% in direct labourcost.

18
Labour Issue – Minimum Wages
Government is reviewing the minimum wage policy in2014, possible further rate hike in 2015.
Government is also trying to implement new policies toreduce the intake of foreign workers. Higher levy andmore stringent quota will be imposed.
19
Other costs increase
17% increase in electricity tariff beginning January 2014.
Increased transportation cost following the surge in fuelcost.
The chain effects had also led to an approximate 8%increase in packaging materials and other operationalcosts.

• MPMA’s Technology Roadmap - A 10-year plan that would provide a frameworkfor the future development of the Malaysian plastics industry.

21
MPMA-TDP Arising from the MPMA Roadmap, a proposal was
submitted to the government for human capitaldevelopment.
The Malaysian government allocated a grant to MPMA forthe MPMA-Talent Development Programme.
MPMA-TDP’s primary objective is to create a pool ofknowledge-based technicians/engineers as envisioned inthe Government’s Strategic Reform Initiatives (SRI) forhuman resource development as outlined in the NewEconomic Model (NEM) for Malaysia.
21

22
Advanced ScientificInjection Moulding
Certification
Expert ScientificInjection Moulding
CertificationTrain-the-Trainers
Certification
MPMA-TDP: Certification
Training is compliant with the Society of Plastics Engineers (SPE) and Societyof Plastics Industry (SPI).
Todate, 18 Malaysian trainers and more than 200 employees have benefittedfrom the Programme.

23
MPMA’s Media and PR Campaign
MPMA undertook the Media and PR Campaign in 2012 toovercome negative perception of plastics in Malaysia.
The Campaign’s strategy is three prong: 1. ‘Don’t be aLitterbug’, 2. 3Rs of Reduce, Reuse, Recycle, and 3. PlasticsSustainability. ‘Don’t be a Litterbug’ Campaign – promote anti-littering 3Rs – promote plastics recycling Plastics sustainability – showcase low carbon impact of plastics

24
Litter
Plastics is a unique and useful material when itdoes not appear as litter (for example, in Japanwhere waste is well managed)
Plastics can be damaging when it becomeslitter:- Litter is an eyesore- Clogging drains which causes floods/health hazard

Platforms/EnvironmentalProgrammes
25
ENGAGE
DISPLACE
EDUCATEAND
PROMOTE
Anti-litter – ‘Don’t Be aLitterbug’ Campaign
Anti-litter and 3Rs:Reduce, Reuse, Recycle
Plastics Sustainability
Result: Plastics makes it possible

27 October 2013, MPMA collaborated with Department of Environment on its MalaysianEnvironment Week 2013 celebration at Putrajaya. MPMA volunteers gave out ‘Don’t be aLitterbug’ car stickers and encouraging the public to dispose of rubbish responsibly. The campaignhad received overwhelming support from the public by exchanging ‘Hi-5s’ and pledging towardsanti-litter by signing.
27 October 2013, MPMA collaborated with Department of Environment on its MalaysianEnvironment Week 2013 celebration at Putrajaya. MPMA volunteers gave out ‘Don’t be aLitterbug’ car stickers and encouraging the public to dispose of rubbish responsibly. The campaignhad received overwhelming support from the public by exchanging ‘Hi-5s’ and pledging towardsanti-litter by signing.

17 May 2014, MPMA had organised a ‘Hi-5 ME (Mother Earth) Don’t Be a Litterbug’ at AEON Bukit TinggiMall, Klang. The campaign was well supported by the public as they pledged their support against litteringwith their signatures.
17 May 2014, MPMA had organised a ‘Hi-5 ME (Mother Earth) Don’t Be a Litterbug’ at AEON Bukit TinggiMall, Klang. The campaign was well supported by the public as they pledged their support against litteringwith their signatures.

6 May 2014, MPMA-DOW Plastics Recyclables Collection Competition 2014, PenangLaunch Ceremony at KOMTAR Auditorium, Penang. Officiated by YB Tuan Phee Boon Poh,
Welfare, Caring Community and Environment Committee Chairman for Penang State Government.The Programme involved 30 schools in Penang.

8-9 August 2014, MPMA-Chevron Phillips Chemicals Environment Boot Camp 2014for Wesley Methodist Schools was held at the Wesley Methodist School Kuala Lumpur. The
Boot Camp involved 1,250 students, teachers and guests.

MPMA received the top honour of
winning the Special
Acknowledgement Award as
Leading Contributor towards
Environmental Sustainability from
the Department of Environment,
Ministry of Natural Resources and
Environment for the year 2013 in
conjunction with the Malaysia
Environment Week 2013.
The award was presented to MPMA
by YB Datuk Seri G. Palanivel,
Minister of Natural Resources and
Environment.

Thank you
Malaysian Plastics Manufacturers Association37, Jalan 20/14, Paramount Garden
46300 Petaling Jaya, Selangor, MalaysiaTel: 03-7876 3027 Fax: 03-7876 8352