Challenger Diversified Property Group Annual Report … Diversified Property Group Annual Report...
96
Challenger Diversified Property Group Annual Report 2012 Challenger Diversified Property Group comprising: Challenger Diversified Property Trust 1 (ARSN 121 484 606) Challenger Diversified Property Trust 2 (ARSN 121 484 713) Responsible Entity Challenger Listed Investments Limited (ABN 94 055 293 644) (AFSL 236887)
Transcript of Challenger Diversified Property Group Annual Report … Diversified Property Group Annual Report...

Challenger Diversified Property GroupAnnual Report 2012
Challeng
er Diversifi
ed Prop
erty Gro
up A
nnual Rep
ort 2012
Challenger Diversified Property Groupcomprising:
Challenger Diversified Property Trust 1(ARSN 121 484 606)
Challenger Diversified Property Trust 2(ARSN 121 484 713)
Responsible EntityChallenger Listed Investments Limited (ABN 94 055 293 644) (AFSL 236887)
Level 15 255 Pitt Street Sydney NSW 2000 telephone 02 9994 7000 facsimile 02 9994 7777
www.challenger.com.au
1378
4/C
G92
7/0
812

Contents
Key highlights 1
Chair’s letter 2
Fund Manager’s report 3
Case study 6
Portfolio summary 8
Property summaries 11
About Challenger 21
Corporate governance statement 22
Directors’ report 29
Financial report 40
Unitholder information 86
Additional information 88
Directory 90
Challenger Listed Investments Limited (ABN 94 055 293 644) (AFSL 236887) (CLIL) is the Responsible Entity of Challenger Diversified Property Trust 1 (ARSN 121 484 606) and Challenger Diversified Property Trust 2 (ARSN 121 484 713) which together form the Challenger Diversified Property Group (CDI).
CLIL, as the Responsible Entity of CDI, has prepared this Annual Report (Report) based on information available to it. The information in this Report should be regarded as general information only. Nothing contained in this Report constitutes investment, legal, tax or other advice. It has been prepared without taking account of any person’s objectives, financial situation or needs. Recipients should, before acting on any such information, consider its appropriateness, having regard to their objectives, financial situation and needs, and seek the assistance of their financial or other licensed professional adviser before making any investment decision.
Any investment in CDI is subject to investment risk and other risks, including possible loss of income and principal invested. None of CLIL, Challenger Management Services Limited (ABN 29 092 382 842) (AFSL 234678) (CMSL), Challenger Limited (ABN 85 106 842 371) (Challenger) or any other member of the Challenger Group gives any guarantee or assurance as to the performance of CDI or the repayment of capital.
Nothing in this Report should be considered a solicitation, offer or invitation to buy, subscribe or sell any, or a recommendation of, financial products.
All reasonable care has been taken to ensure that the facts stated and opinions given in this Report are fair and accurate. To the maximum extent permitted by law, the recipient releases CLIL, each member of the Challenger Group, their directors, officers, employees, representatives and advisers from any liability (including, without limitation, in respect of direct, indirect or consequential loss or damage or loss or damage arising by negligence) arising in relation to any recipient relying on anything contained in or omitted from this Report.
Any forward looking statements included in this Report involve subjective judgment and analysis and are subject to significant uncertainties, risks and contingencies, many of which are outside the control of, and are unknown to, CLIL. In particular, they speak only as of the date of these materials, they assume the success of CDI’s business strategies, and they are subject to significant regulatory, business, competitive and economic uncertainties and risks. Actual future events may vary materially from forward looking statements and assumptions on which those statements are based. Given these uncertainties, recipients are cautioned not to place undue reliance on such forward looking statements.
Any past performance information provided in this Report is not a reliable indication of future performance.
CLIL does not receive any specific remuneration for any general advice which may be provided to you in this Report. However, CLIL and CMSL receive trustee and management fees as issuer and manager of CDI, respectively. For more details on fees, please refer to the Financial Report contained in this Report along with the Constitution and Management Agreement on CDI’s website www.challenger.com.au/cdi (under the Corporate Governance tab). Financial advisers may receive fees or commissions if they provide advice to you or arrange for you to invest in a Challenger product (including CDI). CLIL and its associates may have an interest in the financial products referred to in this Report and may earn fees or other benefits as a result of transactions in any such financial products.
Members of the Challenger Group and their officers and directors may hold securities in CDI from time to time.
Important notice
500 Chapel Street South Yarra Victoria

Challenger Diversified Property Group Annual Report 2012
1
Key highlights
Strategy delivering results. Profit from operating activities: $44.8 million, equivalent to 5.06 cents per unit, up from 4.86 cents per unit in FY11.
Exceeded earnings guidance of 5.00 cents per unit and delivered distribution of 4.2 cents per unit.
1 2 3
4 5 6
7 8 9
Property metrics improving; Occupancy: 94.1% up from 93.7% in FY11, and WALE maintained at 5.0 years across the periods.
Investment property valuations up $17.1 million on 30 June 2011, a 2.2% increase in valuation over the 12 month period.
Balance sheet gearing of 29.8% post payment of 2H12 distribution, in line with target.
Strategic objectives remain to grow earnings via portfolio enhancement, improve lease metrics and active capital management in order to close the gap between price and NTA.
Portfolio enhancement progress; practical completion of both the development of Stage 2 at the Junction Industrial Park and the upgrade of the Domain Car Park. Talavera Road sold, down weighting exposure to hi-tech industrial sector.
Improving leasing metrics progress; numerous key leasing deals have been completed during the year, significantly de-risking the portfolio by reducing the lease expiries for the 2013 financial year from 12% to 4%.
10 11 12
Active capital management progress, buyback, purchased 6.2% of issued capital. To date ~57 million units purchased at 23% average discount to NTA – equivalent to purchasing a property on a 10.6% yield.
FY13 guidance announced; earnings of 5.25 cents per unit (EPU) and distributions 4.35 cents per unit (CPU), growth of 4% respectively in each.
1 for 4 unit consolidation undertaken.

2
The 2012 financial year has been both pleasing and challenging for AREITs, on one hand leasing conditions remain challenging and business confidence remains low, while on the other, the falling interest rate and low growth environment have caused investors to search for quality, defensive, high yielding stocks. As a result the AREIT sector has outperformed general equities.
Through the last two financial years CDI’s strategy remained unchanged. Its three strategic objectives of portfolio enhancement, improve leasing metrics and active capital management are all focused on closing the unit price discount relative to Net Tangible Assets (NTA) per unit.
I am pleased to report this financial year CDI has exceeded the earnings guidance of 5.00 cents per unit and met distribution guidance of 4.20 cents per unit. Importantly, if you look back to our expectations for both earnings and distributions this time last year, these numbers both represent significant growth.
We have announced guidance for the coming financial year for earnings of 5.25 cents per unit and distribution of 4.35 cents per unit. Using the closing price on Friday 10 August of 58.5 cents, this distribution guidance represents a solid 7.3% yield to unitholders.
CDI’s portfolio consists of 28 office, industrial and retail properties with 94.5% in Australia and 5.5% in France. CDI is working towards a medium-term goal to be a 100% Australian focused REIT with the proposed orderly sale of the French properties scheduled once the banking and economic situation in Europe improves and debt becomes more readily available.
CDI is in a strong financial postion with conservative balance sheet gearing of approximately 30%. The buyback continued with 6.2% of issued capital purchased at a 23% discount to NTA. Potential sales of CDI’s high tech assets as well as the French assets will fund both the buyback and future portfolio enhancement pipeline opportunities, depending on the most efficient use of capital.
I encourage all unitholders to read the Fund Manager’s report that follows and review the portfolio summary also contained in this document for further information on all CDI’s properties.
The management team and staff have worked diligently during the past year to further strengthen CDI. I congratulate the team and thank them for their hard work that ensures the Trust is positioned for further growth.
Finally, I thank you for your continued support of CDI, and I look forward to another productive year in which Challenger Diversified Property Group closes the discount to NTA and creates additional value for unitholders.
Michael Cole Chair
Chair’s letter

3
Challenger Diversified Property Group Annual Report 2012
Fund Manager’s report
Dear unitholder
The 2012 financial year has been a busy one for CDI, and I am pleased to report that the Fund has delivered on or exceeded all guided market expectations. CDI is well positioned going into the 2013 financial year having built a strong stable portfolio and a de-risked model. At CDI we are focused on three strategic objectives; portfolio enhancement, improve leasing metrics and active capital management as the vehicles to grow earnings and close the unit price to NTA gap.
CDI has strengthened the balance sheet and is positioned for further growth. CDI has made some good progress on its strategic objectives over the period with practical completion achieved for both the upgrade of the Domain Car Park and the development of Stage 2, The Junction, as well as continued progress in the repositioning of the Jam Factory, as key portfolio enhancement initiatives. Leasing has been very pleasing with a large number of expiries renewed, reducing our FY13 expiries materially. Lastly, for our active capital management initiatives the on market buyback, our primary capital management initiative, has now purchased 6.2% of issued capital, creating accretion for unitholders.
Financial performance
For the financial year to 30 June 2012 (FY12), CDI delivered solid profit from operating activities for the year of $44.8 million or
5.06 cents per unit, up from 4.86 at FY11 and representing 4% growth. This was primarily due to portfolio rental growth and the benefits of the accretion from the unit buyback. Distribution of 4.20 cents per unit was in line with guidance and up from 4.00 cents, again growing by 4% over the previous year, proving the quality and underlying resilience of the portfolio. Statutory net profit after tax of $36.2 million was primarily impacted by the unrealised adverse movement in interest rate swaps.
Total assets at 30 June 2011 were $880 million, with net tangible assets (NTA) of $586.7 million. On a per unit basis NTA was up 1 cent per unit to 68 cents from June 2011 due to the accretion from the buyback.
Distribution
Our policy is to distribute accounting profit earned from operating activities adjusted for non-cash expenses, such as straight-lining of rental income, and then deduct expected and incurred leasing costs, debt establishment fees and maintenance capex. After these adjustments, CDI distributed 4.2 cents per unit, which represents an operating profit payout ratio of 82%, and an available funds from operations (AFFO) payout ratio of 99.5%.
Portfolio
The CDI portfolio comprises interests in 28 office, industrial and retail properties located in Australia and France. CDI also holds a cumulative 25 year leasehold interest in respect to Sydney’s Domain Car Park.
All properties in CDI’s portfolio were revalued as at 30 June 2012, 66% by value were independently revalued and the remainder were internally valued. The investment property revaluation resulted in
a $17.1 million uplift or 2.2% on 30 June 2011 valuations. The carrying value of the total portfolio as at 30 June 2012 was $852 million.
CDI has progressed and completed a number of portfolio enhancement projects during the year. Practical completion was achieved on both the upgrade of the Domain Car Park and the development of Stage 2, The Junction. These projects were completed on time and to budget. The Jam Factory repositioning is progressing well and expected to complete in December 2012. All projects aim to realise latent value within the portfolio.
Stage 2 of The Junction development commenced after securing a 10 year lease pre-commitment for a 20,200 sqm distribution facility. The site is located in the inner west, the geographical heart of Sydney, and the facility’s attributes ensure a prime industrial grading that will meet the requirements of a broad group of distribution and warehouse users in the future. The lease commenced 3 July 2012 and will add to net property income in the coming period.
The Domain Car Park upgrade is now complete. The key aim of the upgrade was to improve the customer experience. The works included upgrading the façade and travelator, installing new lifts and service improvements. The car park is expected to provide an increased contribution to earnings now that the upgrade is complete and it can operate to its full potential.
The aim of the Jam Factory repositioning is to make the centre more contemporary, accessible and sought after by a broader demographic. The tenancy remix is nearing completion; focusing

4
on popular food, fashion and entertainment brands like TOPSHOP, Urban by Target, Salsa’s, Groove Train, Lindt Chocolates and Nando’s to complement the existing Village Cinemas. The food court commenced trading in June, while the upgrade of the 970 bay car park has commenced and is due to complete in September 2012.
The Jam Factory repositioning is the latest of CDI’s committed value add initiatives. There is a pipeline of future initiatives to take advantage of latent opportunities within the portfolio. The portfolio enhancement strategy also targets the continued value add to existing
portfolio through the recycling of capital.
Market cap rates remain relatively constant across the portfolio at 8.23%, the domestic portfolio tightening marginally across the period and the French portfolio remaining flat at 7.81%. CDI is currently trading on an implied cap rate of 9.6%, which looking across the market at relative peers looks compelling.
Leasing
Occupancy (94.1%) has increased on the prior period while the WALE (5.0 years) has been maintained across the periods. This is particularly pleasing given the backdrop of a challenging leasing market. Leasing activity throughout the market has been subdued, with tenants preferring to remain in their premises rather than relocate. However, CDI’s leasing progress during the year has been significant, with 38 lease deals negotiated representing a total of 70,767 sqm or $13.1 million in gross rent (14.2% of total; gross income). Our retention rate of existing tenants has been over 70%.
CDI has significantly reduced the expiry risk for the financial year 2013, down from 12% as at June 2011 to 4%, demonstrating the significant inroads made into the retention of these tenants.
There have been some key lease deals signed in this year with the highlights including the TOPSHOP lease for 10 years and approximately 1700 sqm as well as the recently signed 12 year Village office lease for 6,700 sqm. In 31 Queen Street and Makerston House there has been a total of 12 individual leases signed throughout these properties. 6 Foray Street has been a great result, signing IFC up for over 17,000 sqm of industrial warehousing space. Two French leases at Exel and ATAC have been renewed for 6 and 9 years respectively.
The leasing up of our current vacancies, sitting at 5.9%, represents upside in future earnings and therefore subsequently distribution. CDI has been actively marketing these premises and engaging in negotiations with prospective tenants; however, lead times have lengthened.
Capital management
In April 2011, CDI announced an on-market unit buyback, with the intention to buy back up to 10% of issued capital. The buyback is both NTA per unit and earnings accretive. Management believes the current discount to NTA does not represent the intrinsic value of CDI and a buyback will work to close the gap between NTA per unit and the unit price for the benefit of all unitholders.
Fund Manager’s report (continued)

Challenger Diversified Property Group Annual Report 2012 Challenger Diversified Property Group Annual Report 2012
5
CDI has bought back 6.2% of issued capital in the on-market unit buyback since commencement. CDI has purchased ~57 million units at an average of 23% discount to NTA per unit, generating $9 million in value. This is equivalent to purchasing a property on a 10.6% yield. CDI has approached the buyback tactically. Accordingly, purchases have been made on an opportunistic basis. This is reflected by CDI’s average purchase price of 52.50 cents being 1.6% lower than the market VWAP of 53.40 cents and CDI only purchasing on average 27% of available market volume.
The increase in the buyback during the six months to 30 June 2012 has been funded through the capital recycling strategy, specifically the sale of 75 Talavera Road. Further progress of the buyback will continue in line with future asset sales, subject to the most efficient use of capital.
On 7 August, CDI announced that it was undertaking a 1 for 4 unit consolidation. Management believes that the unit consolidation for a negligible cost will have the following benefits: reduced unit price volatility; improved market perception; and alignment with other A-REITs.
CDI has no maturities until July 2013. The undrawn capacity of approximately $35 million will be used to complete the current committed developments and provide CDI with financial flexibility and a liquidity buffer.
Environmental sustainability
CDI is committed to improving the environmental sustainability of its properties. The portfolio summary pages in this annual report provide
details of the energy rating of each rateable building. The rating system we utilise is the NABERS energy rating scale, a performance-based rating system for existing buildings. NABERS rates a building on the basis of its measured operational impacts on the environment, and provides a simple indication of how well environmental impacts are managed compared with peers and neighbours.
The NABERS energy ratings scale across our office buildings is currently at a weighted average 4.0 stars today. The NABERS rating has increased from 3.6 stars as at June 2011 to 4.0 stars. This increase is the result of three sustainability capex projects being completed across. The Forum Verizon, Makerston House and Discovery House Stage 1. CDI remains committed to lifting its NABERS rating. Over the next 12 months we have a pipeline of further projects which we expect will lift the NABERS rating across the office portfolio closer to our medium- term target of 4.5 stars.
Outlook
The management of CDI has a clearly defined strategy which has delivered results over the year. The Fund’s primary goal is to close the unit price to NTA per unit gap through growing earnings. The growth in earnings will be achieved through the three strategic initiatives; portfolio enhancement, improving leasing metrics and active capital management.
We have provided both earnings and distribution guidance for the coming financial year, 5.25 cents per unit and 4.35 cents per unit respectively. Within this guidance we have incorporated realistic assumptions around reletting and leasing costs. The 4.35 cent distribution guidance represents an 83% payout ratio and an implied yield of 7.4% (based on a 14 August close price of 58.5 cents).
With a clearly defined strategy and significant progress in leasing, capital management and portfolio enhancement, CDI is positioned well towards achieving its goals of growing earnings and closing the price to NTA per unit gap.
On behalf of management and our team at CDI, thank you for your ongoing support. I look forward to updating you on CDI’s progress and achievements during the coming year.
Trevor Hardie Fund Manager

Case study
6
Case Study – Stage 2 The Junction Industrial Park, Enfield
CDI acquired an 8.56 ha site at 34-48 Cosgrove Road Enfield in 2007 for the purpose of developing a prime industrial facility. The site is strategically located in Inner Western Sydney within the established industrial precinct of Enfield. The site is easily accessed via the M4 Motorway to the north and the M5 Motorway to the south and is located adjacent to the Enfield Intermodal Logistics Centre.
Stage 1, comprising 13,437sqm of warehouse facilities, was developed on a speculative basis and was completed in December 2008. A seven year lease to KW Doggett was secured on completion of the facility.
Stage 2 was developed after securing a 10 year lease pre-commitment to Bunzl Australasia Limited (Bunzl) for a 20,200sqm distribution facility in August 2011. Bunzl PLC, the parent company of Bunzl, is a leading global supply chain management and specialist distribution company operating in 23 countries and is listed on the London Stock Exchange.
Bunzl’s NSW Distribution Centre at The Junction Industrial Park will accommodate circa 170 personnel, with three businesses consolidating operations into the facility. Bunzl will move their businesses in on a staged basis occurring through the rest of 2012 and into early 2013.
Stage 2 also comprises a 150sqm café facility servicing the estate. Practical completion was achieved on 2 July 2012. The project has been delivered on time, within budget and to valuation. This has been achieved through effective builder selection, detailed up front commercial assessment and strong risk and project management throughout the process.
CDI entered into a Development and Construction Contract with FDC for the delivery of the base building and Bunzl also entered into contracts with FDC for the delivery of an integrated fitout. The construction period of ten months included both the construction of the base building as well as the integrated office and warehouse fitout. This ensured Bunzl were able to operate from the facility immediately upon practical completion.
The development of the Bunzl facility is in accordance with CDI’s strategies of portfolio enhancement, through the reduced exposure to purpose built facilities and improving leasing metrics. Stage 2 of The Junction Industrial Park is a prime industrial facility that will meet the requirements of a broad group of distribution and warehouse users in the future.
Stage 3 can accommodate a further 12,660sqm of warehouse and distribution facilities and is currently being marketed with a delivery time of 8 months from signing of AFL.
On completion The Junction Industrial Park will house 46,447sqm of facilities with a completion value of circa $75m.
Development Metrics
On Completion Valuation $34.0m
Total Development Cost $32.4m
Unrealised Value add $1.6m
Investment Metrics
Cap Rate 7.75%
Initial Income Yield on Cost 8.15%
5 year Investment IRR 11.5%
Impact on Industrial Portfolio Metrics
Pre Development
Post Development
WALE 3.9 years 5.5 years
Occupancy 93% 95%
Weighted average cap rate 8.81% 8.48%

7

8
Portfolio summary
Property Location
Net lettable
area (sqm)
Occupancy at 30 June
2012 (by income)
(%)
Weighted average lease
expiry (WALE) (by income)
(years)Date
acquired
Prior period
valuation ($m)
Prior market
cap rate (%)
Currentvaluation
($m)
Current market
cap rate (%)
Valuation change
($m)
Discount rate (%) Valuer
Book value
30 June 2012 ($m)
Average gross
passing rent
($/sqm)
Average gross
market rent
($/sqm)
Asset values
($/sqm)Office portfolioABS House Belconnen, ACT 31,050 100.0 4.7 Oct-2006 88.8 7.75 87.6 8.25 (1.2) 9.25 m3 87.6 457 420 4,702
31 Queen Street Melbourne, VIC 19,339 97.4 3.7 Mar-2011 89.0 8.00 91.0 8.00 2.0 9.50 m3 91.0 456 471 4,705
DIAC Building Belconnen, ACT 29,530 100.0 7.3 Oct-2006 68.4 7.75 69.0 8.00 0.6 9.25 m3 69.0 347 375 3,894
The Forum, Cisco St Leonards, NSW 16,584 99.1 2.4 Oct-2006 62.4 8.25 63.1 8.25 0.7 9.50 Internal 63.1 576 548 6,338
Discovery House Woden, ACT 22,239 100.0 10.2 Oct-2006 60.6 7.75 61.4 7.75 0.8 9.00 Internal 61.4 415 415 4,605
Makerston House Brisbane, QLD 14,652 100.0 2.8 Oct-2006 44.4 8.50 45.1 8.50 0.7 9.75 Internal 45.1 509 520 5,132
The Forum, Verizon St Leonards, NSW 11,711 69.0 3.2 Oct-2006 41.0 8.50 41.8 8.50 0.8 9.75 Internal 41.8 534 526 5,952
Elder House Adelaide, SA 14,086 100.0 3.8 Oct-2006 28.3 8.75 27.9 9.00 (0.4) 9.75 m3 27.9 434 368 3,301
Executive Building Hobart, TAS 9,887 100.0 3.0 Oct-2006 20.6 8.75 20.4 8.75 (0.2) 9.50 Savills 20.4 379 389 3,439
Office portfolio total/average 169,078 96.8 4.7 503.4 8.08 507.3 8.21 3.9 9.42 507.3 443 436 4,647
Retail portfolioJam Factory South Yarra, VIC 20,1271 98.7 8.0 Oct-2006 70.2 8.25 71.1 7.75 0.8 9.00 JLL 71.1 517 517 5,884Century City Walk Glen Waverley, VIC 8,289 100.0 5.2 Jun-2008 30.0 8.50 30.0 8.50 – 9.50 Savills 30.0 443 443 3,619Innaloo Cinema Centre Woodlands, WA 11,549 100.0 6.1 Oct-2006 25.0 8.00 25.5 8.00 0.5 9.25 JLL 25.5 388 388 3,680Kings Langley Shopping Centre Kings Langley, NSW 4,157 100.0 7.4 Oct-2006 9.7 8.75 9.4 8.75 (0.3) 9.75 Savills 9.4 420 420 3,753Retail portfolio total/average 44,122 99.3 7.0 134.9 8.30 135.9 8.03 1.0 9.21 135.9 445 445 4,563
Industrial portfolioDistribution centresThe Junction, Stage 2 Enfield, NSW 20,360 99.3 9.9 Jul-2012 34.0 7.75 34.0 7.75 – 9.50 Colliers 34.0 146 146 1,682The Junction, Stage 1 Enfield, NSW 13,437 100.0 3.5 Dec-2008 20.4 8.25 20.4 8.50 – 9.50 Internal 20.4 152 146 1,5186 Foray Street Fairfield, NSW 22,960 71.6 2.1 Oct-2006 16.3 10.00 15.3 10.00 (1.0) 10.00 Colliers 15.3 90 88 664Spotlight Laverton North, VIC 20,723 100.0 9.0 Oct-2006 16.8 8.25 17.3 8.25 0.4 9.75 Internal 17.3 77 77 83512-30 Toll Drive Altona North, VIC 13,885 100.0 3.6 Oct-2006 13.5 8.75 14.0 8.75 0.5 11.00 Colliers 14.0 114 107 1,0082-10 Toll Drive Altona North, VIC 6,244 100.0 0.6 Oct-2006 6.4 8.75 6.4 8.75 0.1 9.75 Internal 6.4 125 110 1,0251-9 Toll Drive Altona North, VIC 3,239 100.0 3.6 Oct-2006 3.5 8.50 3.9 8.50 0.4 10.50 Colliers 3.9 134 133 1,204Distribution portfolio total/average 100,848 94.5 5.5 110.8 8.45 111.3 8.48 0.5 9.85 111.3 115 112 1,103
High techTaylors House Waterloo, NSW 11,084 99.2 4.7 Oct-2006 26.9 8.25 26.9 8.25 – 9.25 Internal 26.9 465 377 4,042187 Todd Road Port Melbourne, VIC 9,308 24.9 1.0 Oct-2006 13.6 9.50 13.6 9.50 – 10.00 Internal 13.6 303 296 2,428Giffnock Avenue North Ryde, NSW 5,973 – 0.0 Jun-2008 12.0 8.75 9.9 9.50 (2.1) 9.75 Colliers 9.9 – 240 1,657High tech portfolio total/average 26,365 55.6 2.6 52.4 8.69 50.3 8.83 (2.1) 9.55 50.3 247 310 2,765Industrial portfolio total/average 127,213 80.1 4.4 163.2 8.53 161.6 8.59 (1.6) 9.75 161.6 132 137 1,357
Australian portfolio total/average 340,413 93.7 5.0 801.5 8.21 804.8 8.26 3.3 9.45 804.8 296 295 3,119
French portfolio m m m ($/sqm) ($/sqm) ($/sqm)Sully Sully sur Loire 15,500 100.0 5.5 Jun–2007 9.2 9.00 8.9 9.20 (0.3) – Knight Frank 8.9 104 83 713Aulnay Aulnay sous Bois, Paris 5,105 100.0 3.3 Jun–2007 8.9 6.50 9.3 6.25 0.4 – Knight Frank 9.3 217 193 2,243Béziers Rue Charles Nicolle 8,944 100.0 3.2 Jun–2007 8.1 8.25 8.2 8.25 0.2 – Knight Frank 8.2 113 103 1,141Gennevilliers Gennevilliers, Paris 7,409 100.0 8.7 Jun–2007 7.0 7.21 7.2 7.10 0.3 – Knight Frank 7.2 134 134 1,210Tours Parcay-Meslay, Tours 5,610 100.0 6.2 Jun–2007 4.2 8.25 4.4 8.65 0.2 – Knight Frank 4.4 116 105 971
French portfolio total/average 42,568 100.0 5.3 37.4 7.82 38.1 7.81 0.8 – 38.1 114 101 1,107Investment portfolio total/average
382,981 94.1 5.0 847.9 8.19 852.0 8.23 4.1 9.45 852.0 269 266 2,834
Development portfolio $m $m $mThe Junction, Stage 3 Enfield, NSW N/A – – Mar–2007 6.8 – 6.8 – – – Colliers 6.8 – – –Australian development portfolio total/average
– – – 6.8 – 6.8 – – – 6.8 – – –
1 Excludes development (strategic) vacancies.

9
Challenger Diversified Property Group Annual Report 2012
Property Location
Net lettable
area (sqm)
Occupancy at 30 June
2012 (by income)
(%)
Weighted average lease
expiry (WALE) (by income)
(years)Date
acquired
Prior period
valuation ($m)
Prior market
cap rate (%)
Currentvaluation
($m)
Current market
cap rate (%)
Valuation change
($m)
Discount rate (%) Valuer
Book value
30 June 2012 ($m)
Average gross
passing rent
($/sqm)
Average gross
market rent
($/sqm)
Asset values
($/sqm)Office portfolioABS House Belconnen, ACT 31,050 100.0 4.7 Oct-2006 88.8 7.75 87.6 8.25 (1.2) 9.25 m3 87.6 457 420 4,702
31 Queen Street Melbourne, VIC 19,339 97.4 3.7 Mar-2011 89.0 8.00 91.0 8.00 2.0 9.50 m3 91.0 456 471 4,705
DIAC Building Belconnen, ACT 29,530 100.0 7.3 Oct-2006 68.4 7.75 69.0 8.00 0.6 9.25 m3 69.0 347 375 3,894
The Forum, Cisco St Leonards, NSW 16,584 99.1 2.4 Oct-2006 62.4 8.25 63.1 8.25 0.7 9.50 Internal 63.1 576 548 6,338
Discovery House Woden, ACT 22,239 100.0 10.2 Oct-2006 60.6 7.75 61.4 7.75 0.8 9.00 Internal 61.4 415 415 4,605
Makerston House Brisbane, QLD 14,652 100.0 2.8 Oct-2006 44.4 8.50 45.1 8.50 0.7 9.75 Internal 45.1 509 520 5,132
The Forum, Verizon St Leonards, NSW 11,711 69.0 3.2 Oct-2006 41.0 8.50 41.8 8.50 0.8 9.75 Internal 41.8 534 526 5,952
Elder House Adelaide, SA 14,086 100.0 3.8 Oct-2006 28.3 8.75 27.9 9.00 (0.4) 9.75 m3 27.9 434 368 3,301
Executive Building Hobart, TAS 9,887 100.0 3.0 Oct-2006 20.6 8.75 20.4 8.75 (0.2) 9.50 Savills 20.4 379 389 3,439
Office portfolio total/average 169,078 96.8 4.7 503.4 8.08 507.3 8.21 3.9 9.42 507.3 443 436 4,647
Retail portfolioJam Factory South Yarra, VIC 20,1271 98.7 8.0 Oct-2006 70.2 8.25 71.1 7.75 0.8 9.00 JLL 71.1 517 517 5,884Century City Walk Glen Waverley, VIC 8,289 100.0 5.2 Jun-2008 30.0 8.50 30.0 8.50 – 9.50 Savills 30.0 443 443 3,619Innaloo Cinema Centre Woodlands, WA 11,549 100.0 6.1 Oct-2006 25.0 8.00 25.5 8.00 0.5 9.25 JLL 25.5 388 388 3,680Kings Langley Shopping Centre Kings Langley, NSW 4,157 100.0 7.4 Oct-2006 9.7 8.75 9.4 8.75 (0.3) 9.75 Savills 9.4 420 420 3,753Retail portfolio total/average 44,122 99.3 7.0 134.9 8.30 135.9 8.03 1.0 9.21 135.9 445 445 4,563
Industrial portfolioDistribution centresThe Junction, Stage 2 Enfield, NSW 20,360 99.3 9.9 Jul-2012 34.0 7.75 34.0 7.75 – 9.50 Colliers 34.0 146 146 1,682The Junction, Stage 1 Enfield, NSW 13,437 100.0 3.5 Dec-2008 20.4 8.25 20.4 8.50 – 9.50 Internal 20.4 152 146 1,5186 Foray Street Fairfield, NSW 22,960 71.6 2.1 Oct-2006 16.3 10.00 15.3 10.00 (1.0) 10.00 Colliers 15.3 90 88 664Spotlight Laverton North, VIC 20,723 100.0 9.0 Oct-2006 16.8 8.25 17.3 8.25 0.4 9.75 Internal 17.3 77 77 83512-30 Toll Drive Altona North, VIC 13,885 100.0 3.6 Oct-2006 13.5 8.75 14.0 8.75 0.5 11.00 Colliers 14.0 114 107 1,0082-10 Toll Drive Altona North, VIC 6,244 100.0 0.6 Oct-2006 6.4 8.75 6.4 8.75 0.1 9.75 Internal 6.4 125 110 1,0251-9 Toll Drive Altona North, VIC 3,239 100.0 3.6 Oct-2006 3.5 8.50 3.9 8.50 0.4 10.50 Colliers 3.9 134 133 1,204Distribution portfolio total/average 100,848 94.5 5.5 110.8 8.45 111.3 8.48 0.5 9.85 111.3 115 112 1,103
High techTaylors House Waterloo, NSW 11,084 99.2 4.7 Oct-2006 26.9 8.25 26.9 8.25 – 9.25 Internal 26.9 465 377 4,042187 Todd Road Port Melbourne, VIC 9,308 24.9 1.0 Oct-2006 13.6 9.50 13.6 9.50 – 10.00 Internal 13.6 303 296 2,428Giffnock Avenue North Ryde, NSW 5,973 – 0.0 Jun-2008 12.0 8.75 9.9 9.50 (2.1) 9.75 Colliers 9.9 – 240 1,657High tech portfolio total/average 26,365 55.6 2.6 52.4 8.69 50.3 8.83 (2.1) 9.55 50.3 247 310 2,765Industrial portfolio total/average 127,213 80.1 4.4 163.2 8.53 161.6 8.59 (1.6) 9.75 161.6 132 137 1,357
Australian portfolio total/average 340,413 93.7 5.0 801.5 8.21 804.8 8.26 3.3 9.45 804.8 296 295 3,119
French portfolio m m m ($/sqm) ($/sqm) ($/sqm)Sully Sully sur Loire 15,500 100.0 5.5 Jun–2007 9.2 9.00 8.9 9.20 (0.3) – Knight Frank 8.9 104 83 713Aulnay Aulnay sous Bois, Paris 5,105 100.0 3.3 Jun–2007 8.9 6.50 9.3 6.25 0.4 – Knight Frank 9.3 217 193 2,243Béziers Rue Charles Nicolle 8,944 100.0 3.2 Jun–2007 8.1 8.25 8.2 8.25 0.2 – Knight Frank 8.2 113 103 1,141Gennevilliers Gennevilliers, Paris 7,409 100.0 8.7 Jun–2007 7.0 7.21 7.2 7.10 0.3 – Knight Frank 7.2 134 134 1,210Tours Parcay-Meslay, Tours 5,610 100.0 6.2 Jun–2007 4.2 8.25 4.4 8.65 0.2 – Knight Frank 4.4 116 105 971
French portfolio total/average 42,568 100.0 5.3 37.4 7.82 38.1 7.81 0.8 – 38.1 114 101 1,107Investment portfolio total/average
382,981 94.1 5.0 847.9 8.19 852.0 8.23 4.1 9.45 852.0 269 266 2,834
Development portfolio $m $m $mThe Junction, Stage 3 Enfield, NSW N/A – – Mar–2007 6.8 – 6.8 – – – Colliers 6.8 – – –Australian development portfolio total/average
– – – 6.8 – 6.8 – – – 6.8 – – –
1 Excludes development (strategic) vacancies.

Our properties…
10

11
Challenger Diversified Property Group Annual Report 2012
Property summaries
1 % of gross income.2 Office only.
Our properties…
ABS House
45 Benjamin Way, Belconnen, ACT
Property details
Ownership interest 60%
Net lettable area 31,050 sqm
Car spaces 400
Occupancy 100%
WALE 4.7 years
Tenancy Multi-tenant
Review type/s Fixed annual reviews
Average gross passing rent $457 psm
Average gross market rent $420 psm
Date acquired October 2006
Book value $87.6 million
Valuation $87.6 million
Valuation date June 2012
Capitalisation rate 8.25%
NABERS energy rating 4.5 star
Property description
The property is located in Belconnen, approximately 10 kilometres north-west of the Canberra CBD. The ‘A’ grade building was completed in 2002 as the national headquarters for the Australian Bureau of Statistics (ABS), and comprises two seven-level office wings joined by a glazed roof atrium. The property provides basement parking for 60 vehicles and on-grade for 340 vehicles.
Major tenants
% Lease leased 1 expiry
Government 99 FY 2017
31 Queen Street
31 Queen Street, Melbourne, VIC
Property details
Ownership interest 100%
Net lettable area 19,339 sqm
Car spaces 172
Occupancy 97.4%
WALE 3.7 years
Tenancy Multi-tenant
Review type/s Mix of CPI-linked and fixed reviews
Average gross passing rent 2 $456 psm
Average gross market rent 2 $471 psm
Date acquired March 2011
Book value $91.0 million
Valuation $91.0 million
Valuation date June 2012
Capitalisation rate 8.00%
NABERS energy rating 2.5 star
Property description
A 27-level office building comprising ground floor retail, 21 upper levels of office accommodation and five levels of basement parking for 172 vehicles. The building has recently undergone a progressive refurbishment program including upgrade of the ground floor foyer and facade, lifts, numerous upper level lift lobbies, and major items of plant and equipment.
Major tenants
% Lease leased 1 expiry
OZ Minerals 14.0 FY 2013/ FY 2016
Defence Bank 8.3 FY 2021Hyder Consulting 10.3 FY 2016
DIAC Building
6 Chan Street, Belconnen, ACT
Property details
Ownership interest 60%
Net lettable area 29,530 sqm
Car spaces 525
Occupancy 100%
WALE 7.3 years
Tenancy Multi-tenant
Review type/s Fixed annual reviews
Average gross passing rent 2 $347 psm
Average gross market rent 2 $375 psm
Date acquired October 2006
Book value $69.0 million
Valuation $69.0 million
Valuation date June 2012
Capitalisation rate 8.00%
NABERS energy rating 4.5 star
Property description
The property is located in Belconnen, approximately 10 kilometres north-west of the Canberra CBD. The ‘A’ grade building was completed in November 2004 as the national headquarters for the Department of Immigration and Citizenship (DIAC), and comprises two six-level office wings, basement parking for 100 vehicles and on-grade for approximately 425 vehicles. The site also includes vacant land available for development.
Major tenants
% Lease leased 1 expiry
Government 97.8 FY 2020

1 % of gross income.2 Office only.
The Forum, Cisco
201 Pacific Highway, St Leonards, NSW
Property details
Ownership interest 60%
Net lettable area 16,584 sqm
Car spaces 262
Occupancy 99.1%
WALE 2.4 years
Tenancy Multi-tenant
Review type/s Mix of turnover-linked, CPI-linked and fixed reviews
Average gross passing rent 2 $576 psm
Average gross market rent 2 $548 psm
Date acquired October 2006
Book value $63.1 million
Valuation $63.1 million
Valuation date June 2012
Capitalisation rate 8.25%
NABERS energy rating 3 star
Property description
The property is a landmark development located directly above the St Leonards railway station on Sydney’s lower north shore, approximately six kilometres north of the Sydney CBD. The ‘A’ grade building was completed in 2000 and comprises 20 retail tenancies, 10 floors of office accommodation and basement parking for 262 vehicles.
Major tenants
% Lease leased 1 expiry
Cisco Systems 36.6 FY 2014
Flexi Rent 23.6 FY 2015
HCN 7.2 FY 2017
NAB 6.5 FY 2018
12
Discovery House
47 Bowes Street, Woden, ACT
Property details
Ownership interest 60%
Net lettable area 22,239 sqm
Car spaces 238
Occupancy 100%
WALE 10.2 years
Tenancy Single-tenant
Review type/s Fixed annual reviews
Average gross passing rent 2 $415 psm
Average gross market rent 2 $415 psm
Date acquired October 2006
Book value $61.4 million
Valuation $61.4 million
Valuation date June 2012
Capitalisation rate 7.75%
NABERS energy rating Stage 1 – 4.5 star Stage 2 – 5 star
Property description
The property is located in Woden, approximately 10 kilometres south of the Canberra CBD. The property comprises two stages, the first completed in 1997 and the second in 2007, when the building was extended and IP Australia renewed its lease for 15 years.
The whole building now comprises a well integrated design and construction between the new and old sections, with contemporary accommodation and finishes. The total accommodation comprises 20,642 sqm of office, 1,441 sqm of storage, 156 sqm of retail (café), 180 basement and 58 on-grade car spaces.
Major tenants
% Lease leased 1 expiry
Government 100 FY 2023
Makerston House
30 Makerston Street, Brisbane, QLD
Property details
Ownership interest 60%
Net lettable area 14,652 sqm
Car spaces 180
Occupancy 100%
WALE 2.8 years
Tenancy Multi-tenant
Review type/s Fixed annual reviews
Average gross passing rent 2 $509 psm
Average gross market rent 2 $520 psm
Date acquired October 2006
Book value $45.1 million
Valuation $45.1 million
Valuation date June 2012
Capitalisation rate 8.50%
NABERS energy rating 4.5 star
Property description
The property is located on the western fringe of the legal precinct of the Brisbane CBD, approximately 65 metres south-west of the Brisbane Transit Centre. The building comprises a ground floor, 11 upper levels of office and five levels of basement parking and storage.
Major tenants
% Lease leased 1 expiry
QLD Police 34.8 FY 2015
Tourism Queensland 26.3 FY 2013/ FY2019
Shine Lawyers 13.8 FY2016
Property summaries (continued)

13
Challenger Diversified Property Group Annual Report 2012 Challenger Diversified Property Group Annual Report 2012
1 % of gross income.2 Office only.
The Forum, Verizon
203 Pacific Highway, St Leonards, NSW
Property details
Ownership interest 60%
Net lettable area 11,711 sqm
Car spaces 151
Occupancy 69.0%
WALE 3.2 years
Tenancy Multi-tenant
Review type/s Mixture of fixed, market and CPI-linked reviews
Average gross passing rent 2 $534 psm
Average gross market rent 2 $526 psm
Date acquired October 2006
Book value $41.8 million
Valuation $41.8 million
Valuation date June 2012
Capitalisation rate 8.50%
NABERS energy rating 3 star
Property description
The property is a landmark development located directly above the St Leonards railway station on Sydney’s lower north shore, approximately six kilometres north of the Sydney CBD. The ‘A’ grade building was completed in 2000 and comprises seven retail tenancies, 10 floors of office accommodation and basement parking for 151 vehicles.
Major tenants
% Lease leased 1 expiry
Verizon 27.3 FY 2015
Cardno 28.1 FY 2019
Elder House
27-39 Currie Street, Adelaide, SA
Property details
Ownership interest 60%
Net lettable area 14,086 sqm
Car spaces 0
Occupancy 100%
WALE 3.8 years
Tenancy Single-tenant
Review type/s Fixed annual reviews
Average gross passing rent2 $434 psm
Average gross market rent2 $368 psm
Date acquired October 2006
Book value $27.9 million
Valuation $27.9 million
Valuation date June 2012
Capitalisation rate 9.00%
NABERS energy rating 3.5 star
Property description
The property is located in the core of the Adelaide CBD, and incorporates the heritage section of the former Elder House, constructed in 1940. The ‘A’ grade building comprises a ground level, six upper levels of office accommodation and a basement area, all of which were substantially refurbished and extended in 2001.
Major tenants
% Lease leased 1 expiry
Elders Limited 100 FY 2016
Executive Building
15 Murray Street, Hobart, TAS
Property details
Ownership interest 60%
Net lettable area 9,887 sqm
Car spaces 125
Occupancy 100%
WALE 3.0 years
Tenancy Single-tenant
Review type/s Market reviews
Average gross passing rent $379 psm
Average gross market rent 2 $389 psm
Date acquired October 2006
Book value $20.4 million
Valuation $20.4 million
Valuation date June 2012
Capitalisation rate 8.75%
NABERS energy rating 3.5 star
Property description
The property is located in the core of the Hobart CBD. The ‘A’ grade building was completed in March 1987 and comprises nine levels of modern office accommodation and two levels of parking for 125 vehicles.
Major tenants
% Lease leased 1 expiry
The Crown in Right of 100 FY 2015 the State of Tasmania

Innaloo Cinema Centre
57 Liege Street, Woodlands, Perth, WA
Property details
Ownership interest 60%
Net lettable area 11,549 sqm
Car spaces 1,046
Occupancy 100%
WALE 6.1 years
Tenancy Multi-tenant
Review type/s Mix of CPI-linked, fixed and market reviews
Average gross passing rent $388 psm
Average gross market rent $388 psm
Date acquired October 2006
Book value $25.5 million
Valuation $25.5 million
Valuation date June 2012
Capitalisation rate 8.00%
Property description
The property is located in Woodlands, approximately 11 kilometres north-west of the Perth CBD. Originally a small cinema and drive-in complex, the property has undergone a staged redevelopment and today comprises a modern 16-screen cinema complex with on-site parking for in excess of 1,046 vehicles.
Major tenants
% Lease leased 1 expiry
Greater Union 75.1 FY 2019
Sizzlers 8.8 FY 2020
14
Jam Factory
500 Chapel Street, South Yarra, VIC
Property details
Ownership interest 60%
Net lettable area 3 20,127 sqm
Car spaces 970
Occupancy 98.7%
WALE 8.0 years
Tenancy Multi-tenant
Review type/s Mix of CPI-linked and fixed reviews
Average gross passing rent $517 psm
Average gross market rent $517 psm
Date acquired October 2006
Book value $71.1 million
Valuation $71.1 million
Valuation date June 2012
Capitalisation rate 7.75%
Property description
The property is located on Chapel Street, South Yarra, approximately six kilometres south-east of the Melbourne CBD. Originally a manufacturing plant for jams and preserves, the property has been converted into a popular cinema and retail complex. The building comprises a 15-screen cinema complex, a retail precinct, level two office precinct and a five-level car park for 970 vehicles.
Major tenants
% Lease leased 1 expiry
Village Cinemas 31.6 FY 2018
Village Office 20.6 FY 2025
Topshop 7.2 FY 2022
Property summaries (continued)
1 % of gross income.2 Initial 60% purchased October 2006, balance purchased 30 June 2008.3 Ex Strategy’s/Development vacancy.
Century City Walk
285-287 Springvale Road, Glen Waverley, VIC
Property details
Ownership interest 100%
Net lettable area 8,289 sqm
Car spaces N/A
Occupancy 100%
WALE 5.2 years
Tenancy Multi-tenant
Review type/s Mix of CPI-linked and fixed reviews
Average gross passing rent $443 psm
Average gross market rent $443 psm
Date acquired 2 June 2008
Book value $30.0 million
Valuation $30.0 million
Valuation date June 2012
Capitalisation rate 8.50%
Property description
The property is located adjacent to the Novotel Hotel on Springvale Road, Glen Waverley, approximately 26 kilometres south-east of the Melbourne CBD. The building was originally completed in 1998 and refurbished in 2010. It comprises a 10-screen cinema centre, Strike bowling alley, seven restaurant and café tenancies and a bar plus gaming area situated around a ground level pedestrian mall.
Major tenants
% Lease leased 1 expiry
Village Cinemas 46.0 FY 2020
Century City 20.1 FY 2015 Entertainment

15
Challenger Diversified Property Group Annual Report 2012 Challenger Diversified Property Group Annual Report 2012
1 % of gross income.2 Development completion date.
Kings Langley Shopping Centre
13 Ravenhill Street, Kings Langley, NSW
Property details
Ownership interest 60%
Net lettable area 4,157 sqm
Car spaces 140
Occupancy 100%
WALE 7.4 years
Tenancy Multi-tenant
Review type/s Mix of turnover-linked, CPI-linked and fixed reviews
Average gross passing rent $420 psm
Average gross market rent $420 psm
Date acquired October 2006
Book value $9.4 million
Valuation $9.4 million
Valuation date June 2012
Capitalisation rate 8.75%
Property description
The property is located in Kings Langley, approximately 40 kilometres north-west of the Sydney CBD. The property is a neighbourhood shopping centre which comprises a Woolworths supermarket, a mezzanine area, nine specialty retail shops and on-site parking for 140 vehicles.
Major tenants
% Lease leased 1 expiry
Woolworths 66.0 FY 2022
Network Video 5.0 FY 2016
Commonwealth Bank 7.0 FY 2018 of Australia
The Junction Industrial Park (Stage 2)
34-48 Cosgrove Road Enfield, NSW
Property details
Ownership interest 100%
Net lettable area 20,360 sqm
Car spaces 155
Occupancy 99%
WALE 9.9 years
Tenancy Multi-tenant
Review type/s Mix CPI/Fixed with market
Average gross passing rent $146 psm
Average gross market rent $146 psm
Date acquired 2 July 2012
Book value $34 million
Valuation $34 million
Valuation date June 2012
Capitalisation rate 7.75%
Property description
CDI has secured a 10-year lease pre-commitment with Bunzl Australasia Limited for construction of a new 20,200 sqm distribution facility on Stage 2, with the Stage 2 development also including 150 sqm of café facilities. Construction commenced in September 2011 and practical completion was achieved 2 July 2012, with rent commencement 3 July 2012.
Major tenants
% Lease leased 1 expiry
Bunzl Australasia 99.3 FY 2022 Limited
The Junction Industrial Park (Stage 1)
34-48 Cosgrove Road, Enfield, NSW
Property details
Ownership interest 100%
Net lettable area 13,437 sqm
Car spaces 73
Occupancy 100%
WALE 3.5 years
Tenancy Single-tenant
Review type/s Fixed annual reviews
Average gross passing rent $152 psm
Average gross market rent $146 psm
Date acquired 2 December 2008
Book value $20.4 million
Valuation $20.4 million
Valuation date June 2012
Capitalisation rate 8.50%
Property description
The property comprises a recently constructed industrial facility extending to a lettable area of 13,437 sqm.
The property is located on the fringe of the established central Sydney suburb of Enfield.
Major tenants
% Lease leased 1 expiry
K.W. Doggetts 100 FY 2016

1 % of gross income.16
Property summaries (continued)
12-30 Toll Drive
12-30 Toll Drive, Altona North, VIC
Property details
Ownership interest 100%
Net lettable area 13,885 sqm
Car spaces 215
Occupancy 100%
WALE 3.6 years
Tenancy Single-tenant
Review type/s Fixed annual reviews
Average gross passing rent $114 psm
Average gross market rent $107 psm
Date acquired October 2006
Book value $14.0 million
Valuation $14.0 million
Valuation date June 2012
Capitalisation rate 8.75%
Property description
The property is located in Altona North, approximately 12 kilometres south-west of the Melbourne CBD. The site includes a warehouse facility, office accommodation, hardstand space, a security gatehouse, canopied areas, a weigh bridge, landscaping and parking for 215 vehicles.
Major tenants
% Lease leased 1 expiry
Toll Transport Pty Ltd 100 FY 2016
Spotlight
217-225 Boundary Road, Laverton North, VIC
Property details
Ownership interest 100%
Net lettable area 20,723 sqm
Car spaces N/A
Occupancy 100%
WALE 9.0 years
Tenancy Single-tenant
Review type/s Fixed annual reviews
Average gross passing rent $77 psm
Average gross market rent $77 psm
Date acquired October 2006
Book value $17.3 million
Valuation $17.3 million
Valuation date June 2012
Capitalisation rate 8.25%
Property description
The property is located on Boundary Road, Laverton North, approximately 15 kilometres west of the Melbourne CBD. This is an established industrial area that is well serviced by major roads including Princes Freeway, which provides excellent access to the Western Ring Road, Westgate Freeway and Melbourne CityLink. The building was completed in November 1999 and comprises warehouse and office facilities which were purpose built for Spotlight Stores Pty Ltd.
Major tenants
% Lease leased 1 expiry
Spotlight Stores Pty Ltd 100 FY 2021
6 Foray Street
6 Foray Street, Fairfield, NSW
Property details
Ownership interest 100%
Net lettable area 22,960 sqm
Car spaces N/A
Occupancy 71.6%
WALE 2.1 years
Tenancy Multi-tenant
Review type/s Fixed annual reviews
Average gross passing rent $90 psm
Average gross market rent $88 psm
Date acquired October 2006
Book value $15.3 million
Valuation $15.3 million
Valuation date June 2012
Capitalisation rate 10.00%
Property description
The property is located at Fairfield, approximately 29 kilometres west of the Sydney CBD, within close proximity of several major arterial roads including the Cumberland Highway, the M4 Motorway, Horsley Drive and Woodville Road. The property has been developed in various stages over the past 30 years, and today comprises two main manufacturing and warehouse buildings, commercial office facilities and a large parking area.
Major tenants
% Lease leased 1 expiry
IFC Warehousing 71.6 FY 2015 and Distribution

1 % of gross income. 17
Challenger Diversified Property Group Annual Report 2012 Challenger Diversified Property Group Annual Report 2012
1 % of gross income.2 Office only.
2-10 Toll Drive
2-10 Toll Drive, Altona North, VIC
Property details
Ownership interest 100%
Net lettable area 6,244 sqm
Car spaces N/A
Occupancy 100%
WALE 0.6 years
Tenancy Single-tenant
Review type/s Fixed annual reviews
Average gross passing rent $125 psm
Average gross market rent $110 psm
Date acquired October 2006
Book value $6.4 million
Valuation $6.4 million
Valuation date June 2012
Capitalisation rate 8.57%
Property description
The property is located in Altona North, approximately 12 kilometres south-west of the Melbourne CBD. The site includes a warehouse facility, office accommodation, hardstand space and canopied areas.
Major tenants
% Lease leased 1 expiry
Toll Transport Pty Ltd 100 FY 2013
1-9 Toll Drive
1-9 Toll Drive, Altona North, VIC
Property details
Ownership interest 100%
Net lettable area 3,239 sqm
Car spaces 42
Occupancy 100%
WALE 3.6 years
Tenancy Single-tenant
Review type/s Fixed annual reviews
Average gross passing rent $134 psm
Average gross market rent $133 psm
Date acquired October 2006
Book value $3.9 million
Valuation $3.9 million
Valuation date June 2012
Capitalisation rate 8.50%
Property description
The property is located in Altona North, approximately 12 kilometres south-west of the Melbourne CBD. The site is currently utilised as a truck depot and comprises a single-level office, amenities and sleeping quarters building, a high clearance mechanic workshop and truck wash facility and a large four-bay undercover fuelling station. It also includes hardstand space and truck manoeuvring areas, landscaping and parking for 42 vehicles.
Major tenants
% Lease leased 1 expiry
Toll Transport Pty Ltd 100 FY 2016
Taylors House
965 Bourke Street, Waterloo, NSW
Property details
Ownership interest 60%
Net lettable area 11,084 sqm
Car spaces 96
Occupancy 99.2%
WALE 4.7 years
Tenancy Multi-tenant
Review type/s Fixed annual reviews
Average gross passing rent 2 $465 psm
Average gross market rent 2 $377 psm
Date acquired October 2006
Book value $26.9 million
Valuation $26.9 million
Valuation date June 2012
Capitalisation rate 8.25%
NABERS energy rating Exempt
Property description
The property is located in Waterloo, approximately five kilometres south of the Sydney CBD. The building was completed in January 2001, and comprises a ground floor retail area, four levels of office and college accommodation and basement parking for 96 vehicles.
Major tenants
% Lease leased 1 expiry
Taylors College 84.0 FY 2018
Possum Furniture 7.4 FY 2013

18
Property summaries (continued)
Property details
Ownership interest 60%
Net lettable area 9,312 sqm
Car spaces 350
Occupancy 24.9%
WALE 1.0 years
Tenancy Multi-tenant
Review type/s Fixed annual reviews
Average gross passing rent $303 psm
Average gross market rent $296 psm
Date acquired October 2006
Book value $13.6 million
Valuation $13.6 million
Valuation date June 2012
Capitalisation rate 9.50%
NABERS energy rating Exempt
Property description
A modern commercial building located in a prime commercial/industrial high tech precinct on a corner allotment enjoying three street frontages in close proximity to the Melbourne CBD and major transport linkages (Westgate Freeway and CityLink Tollway). The property provides three levels of modern office accommodation, together with ancillary laboratory and warehouse/storage areas. 333 undercover car parks are provided on-site over two levels, plus 17 original parking spaces fronting Wirraway Drive.
Major tenants
% Lease leased 1 expiry
George Western 24.9 FY 2017
187 Todd Road
187 Todd Road, Port Melbourne, VIC
Property details
Ownership interest 100%
Net lettable area 15,500 sqm
Car spaces N/A
Occupancy 100%
WALE 5.5 years
Tenancy Single-tenant
Review type/s Annual reviews to INSEE Construction Cost Index
Average gross passing rent a84 psm ($104 psm)
Average gross market rent a67 psm ($83 psm)
Date acquired June 2007
Book value a8.9 million ($11.1 million)
Valuation a8.9 million ($11.1 million)
Valuation date June 2012
Capitalisation rate 9.20%
Property description
The property is a modern factory and office headquarters located approximately 50 kilometres east of Orleans and 160 kilometres south of Paris. The property is leased to Inteva, a major European car component manufacturer.
Major tenants
% Lease leased 1 expiry
Inteva 100 FY 2018
Sully
105 Route d’Orleans, Sully sur Loire, France
1 % of gross income.2 Excludes amenities.
Property details
Ownership interest 100%
Net lettable area 2 5,972 sqm
Car spaces 133
Occupancy –
WALE 0 years
Tenancy Vacant
Review type/s N/A
Average gross passing rent NIL psm
Average gross market rent $262 psm
Date acquired June 2008
Book value $9.9 million
Valuation $9.9 million
Valuation date June 2012
Capitalisation rate 9.50%
NABERS energy rating 1.5 star
Property description
This is a key strategic holding approximately 12 kilometres north-west of the Sydney CBD within close proximity to Lane Cove Road and the new Chatswood-Epping rail link. Within 200 metres of Macquarie Park station, the site offers potential for capital growth through future redevelopment. The property comprises a two-storey office building with an attached high clearance warehouse to the rear and on-grade parking for 133 vehicles.
Major tenants
% Lease leased 1 expiry
Vacant
Giffnock Avenue
2-4 Giffnock Avenue, North Ryde, NSW

1 % of gross income.
Property details
Ownership interest 100%
Net lettable area 5,105 sqm
Car spaces 285
Occupancy 100%
WALE 3.3 years
Tenancy Single-tenant
Review type/s Annual reviews to INSEE Construction Cost Index
Average gross passing rent a175 psm ($217 psm)
Average gross market rent a156 psm ($193 psm)
Date acquired June 2007
Book value a9.3 million ($11.5 million)
Valuation a9.3 million ($11.5 million)
Valuation date June 2012
Capitalisation rate 6.25%
Property description
The property is a modern retail warehouse located in a suburban centre approximately 19 kilometres to the north-east of central Paris in a high tech industrial precinct. The property is leased to Bricoman, a hardware retailer.
Major tenants
% Lease leased 1 expiry
Bricoman 100 FY 2016
19
Challenger Diversified Property Group Annual Report 2012 Challenger Diversified Property Group Annual Report 2012
Aulnay
54 Avenue de Savigny, Aulnay sous Bois, Paris, France
Property details
Ownership interest 100%
Net lettable area 8,944 sqm
Car spaces N/A
Occupancy 100%
WALE 3.2 years
Tenancy Single-tenant
Review type/s Annual reviews to INSEE Construction Cost Index
Average gross passing rent a91 psm ($113 psm)
Average gross market rent a83 psm ($103 psm)
Date acquired June 2007
Book value a8.2 million ($10.2 million)
Valuation a8.2 million ($10.2 million)
Valuation date June 2012
Capitalisation rate 8.25%
Property description
The property is a modern chillstore/logistics facility located in Béziers’ prime logistics estate adjacent to the A9 – the main east/west road link between Spain, France and Italy. The property is leased to Exel, a major French logistics and distribution operator.
Major tenants
% Lease leased 1 expiry
Exel 100 FY 20192
Béziers
Rue Charles Nicolle, Villeneuve-lès-Béziers, France
Property details
Ownership interest 100% (Leasehold until 2047)
Net lettable area 7,409 sqm
Car spaces N/A
Occupancy 100%
WALE 8.7 years
Tenancy Single-tenant
Review type/s Annual reviews to INSEE Construction Cost Index
Average gross passing rent a108 psm ($134 psm)
Average gross market rent a108 psm ($134 psm)
Date acquired June 2007
Book value a7.2 million ($9.0 million)
Valuation a7.2 million ($9.0 million)
Valuation date June 2012
Capitalisation rate 7.10%
Property description
The property is a modern industrial warehouse facility located in the established North Paris mixed commercial area of Zac de Louvresses. The property is leased to GrDF, a major French gas supplier and distributor.
Major tenants
% Lease leased 1 expiry
GrDF 100 FY 2021
Gennevilliers
ZAC des Louvresses, Gennevilliers, Paris, France
1 % of gross income.2 Tenant can break lease in FY 2016 and this is reflected in the WALE.

1 % of gross income.2 Tenant can break lease in FY 2019 and this is reflected in the WALE.20
Property summaries (continued)
Tours
ZI du Papillon, Parcay-Meslay, Tours, France
Property details
Ownership interest 100%
Net lettable area 5,610 sqm
Car spaces N/A
Occupancy 100%
WALE 6.2 years
Tenancy Single-tenant
Review type/s Annual reviews to INSEE Construction Cost Index
Average gross passing rent a94 psm ($116 psm)
Average gross market rent a85 psm ($105 psm)
Date acquired June 2007
Book value a4.4 million ($5.4 million)
Valuation a4.4 million ($5.4 million)
Valuation date June 2012
Capitalisation rate 8.65%
Property description
The property is a modern chillstore/logistics facility centrally located in a prime logistics park in Tours, the regional centre of the Indie et Loire. The property is leased to ATAC, a major French logistics and distribution operator.
Major tenants
% Lease leased 1 expiry
ATAC 100 FY 20222
The Junction Industrial Park (Stage 3)
34-48 Cosgrove Road Enfield, NSW
Property details
Ownership Interest 100%
Property description
The 8.56 ha site is located near the intersection of the Hume Highway and Roberts Road and opposite the Enfield Intermodal Logistics Centre in the established central western industrial area of Enfield.
Stage 1 and 2 comprising 33,637 sqm of warehouse facilities are fully leased and CDI is continuing to pursue a tenant pre-commitment for Stage 3.
Stage 3 comprises the remaining developable portion of the site, extending to an area of 22,828 sqm with master plan approval to construct a 12,660 sqm warehouse/distribution facility.
Property details
Ownership interest 100%
Property description
In May 2008, CDI signed two leases and a development deed with the Royal Botanic Gardens Trust (BGT) to manage and upgrade the Domain car park. CDI has two leases – four years and 21 years. The Domain car park is a three-level 1,123 bay car park located in close proximity to Sydney’s midcity CBD, the Royal Botanic Gardens and the Art Gallery of NSW. The car park is one of the largest car parks in Sydney and benefits from recent refurbishment works including lift installations, increased upgrades to building safety and security systems.
Refurbishment works reached practical completion on 18 July.
Domain
Royal Botanic Gardens, Sydney, NSW

21
Challenger Diversified Property Group Annual Report 2012 Challenger Diversified Property Group Annual Report 2012
About Challenger
Challenger Limited (Challenger) (ASX: CGF) is an ASX listed investment management firm originally established in 1985, with assets under management of A$31 billion at balance date.
Challenger is the leading issuer in Australia and provider of alternative retirement income solutions. Through Fidante Partners, our boutique stable, and the aligned investments business, Challenger is also the leading provider of investment products in Australia.
Challenger Life Company is a leading provider of annuities and alternative retirement income solutions in Australia. Via an Australian Prudential Regulation Authority (‘APRA’) regulated life company, we offer attractive returns and capital protection for our customers, making our annuities well suited to retirement income planning. Annuity premia, along with shareholder and other capital, are invested in a diversified portfolio of assets to deliver predictable, long-term cash flows to meet commitments to our annuitants while providing attractive returns for shareholders.
Challenger’s Funds Management is one of Australia’s long established and fastest growing funds management businesses. Challenger offers a wide range of fiduciary investment choices across a variety of asset classes and investment styles. Through Aligned Investment teams, we manage assets for Challenger Life and third party investors. Through our Boutique Partnership platform, we partner with a diverse array of independent fund managers in which we own equity stakes and provide distribution and administration support.

22
The Responsible Entity’s approach to corporate governance
The Board of the Responsible Entity (the Responsible Entity) recognises its duties and obligations to stakeholders to implement and maintain a robust system of corporate governance. The Responsible Entity believes that the adoption of good corporate governance adds real value to stakeholders and enhances investor confidence.
The Responsible Entity determines the most appropriate corporate governance arrangements for Challenger Diversified Property Group (CDI), taking into consideration Australian and international standards. This statement reflects the Responsible Entity’s corporate governance system as at August 2012.
This statement reports against the ASX Corporate Governance Council’s ‘Corporate Governance Principles and Recommendations’ as amended in 2010. As required by the ASX Listing Rules, this statement sets out the extent to which CDI has followed the principles or, where appropriate, indicates a departure from them with an explanation.
Principle 1 Lay solid foundations for management and oversightThe role of the Responsible Entity and delegations
The role of the Responsible Entity is to manage CDI in the unitholders’ best interests in accordance with CDI’s constitution and the Corporations Act 2001 (Cth) (Corporations Act). The Responsible Entity is accountable to unitholders for the activities and performance of CDI by overseeing the development of sustainable fund value within an appropriate framework of risk, and regard for all stakeholder
interests. The Responsible Entity has identified the key functions which it has reserved for itself. These duties are outlined below and set out in the Board Charter, a copy of which is available on CDI’s website www.challenger.com.au/cdi:
• approvalofthestrategyandannual budgets of the Funds;
• approvalofaccountingpoliciesand financial reports of the Funds;
• approvalofthefinancialandoperating policies;
• approvalofcorporategovernancestructure and monitoring of the performance and effectiveness of the corporate governance policies and procedures;
• oversightoftheestablishmentand maintenance of effective risk management policies and processes;
• evaluationandapprovalofacquisitions and investments and other corporate actions of the Fund;
• thepowertoissueunitsinaScheme;
• theissuanceofaProductDisclosure Statement;
• monitoringtheperformanceofthe Manager; and
• theevaluationoftheperformanceof the Board, Board Committees and individual Directors.
The Board has established a Committee to assist in carrying out its responsibilities and to consider certain issues and functions in detail. The Board Committee is discussed in Principle 2 below.
Non-executive Directors are issued with formal letters of appointment governing their role and responsibilities. The responsibilities of the Chair and the Directors are also set out in the Board Charter.
Management responsibility
The Corporations Act empowers the Responsible Entity to engage agents on its behalf; however, it remains fully responsible for the actions of those agents. The Responsible Entity has appointed Challenger Management Services Limited to manage CDI. Challenger Management Services Limited and the Responsible Entity are wholly owned subsidiaries of Challenger Limited (Challenger).
The Board has delegated to CDI’s Fund Manager the authority and powers necessary to implement the strategies approved by the Board for CDI and to manage the business affairs of CDI within the policies and specific delegation limits specified by the Board from time to time.
CDI’s constitution governs, among other things, how CDI will operate, how the Responsible Entity remuneration will be calculated and the rights of unitholders. The Responsible Entity must also prepare and lodge a compliance plan with the Australian Securities and Investments Commission (ASIC). The compliance plan sets out the mechanism the Responsible Entity has in place to ensure compliance with CDI’s constitution and the Corporations Act.
Relationship with Challenger Group
The corporate governance structure adopted by the Responsible Entity reflects its role as the Responsible Entity of CDI. In several ways, this will be different to the corporate governance structure of a listed company.
Challenger has expertise in developing and managing specialist investment funds in the areas of property and infrastructure.
Corporate governance statement

Challenger Diversified Property Group Annual Report 2012
23
The Responsible Entity makes extensive use of the resources available within Challenger in managing CDI.
The resources provided to assist the Responsible Entity to fulfil its role include the services of senior executives and responsible officers. Challenger appoints the executive Directors to the Responsible Entity Board and the Responsible Entity appoints appropriately skilled independent Directors to ensure that there is a majority of independent Directors and that CDI continues to be managed to maximise return to unitholders within CDI’s stated strategy and mandate.
Executive performance assessment
The performance of the Chief Executive, Funds Management and senior executives is reviewed at least annually against appropriately agreed and documented performance objectives and measures, consistent with the Performance Management Framework that applies to all Challenger employees. All Challenger Group employees are also assessed against the Challenger Corporate Principles (refer to Principle 3 below).
Performance evaluations for the Chief Executive, Funds Management and senior executives have taken place in respect of the 2012 reporting period in accordance with the above process.
Principle 2 Structure the Board to add valueMembership of the Board
The Board comprises Directors who possess an appropriate range of skills, experience and expertise to:
• haveaproperunderstandingof,and competence to deal with, the current and emerging issues of the business;
• exerciseindependentjudgement;
• encourageenhancedperformanceof the Fund; and
• effectivelyreviewandchallengethe performance of management.
The Responsible Entity’s constitution provides for a minimum of three Directors and a maximum of 12 Directors. The table below summarises the current composition of the Board. Background details of each Director are set out in the Directors’ report.
Nominations and appointment of new Directors
The Board of the Responsible Entity appoints the independent Directors, having regard to maintaining a majority of independent Directors and to ensuring an appropriate balance of skills, experience and competence on the Board. All new Directors are provided with an appropriate induction into the Responsible Entity’s business.
The Board has not appointed a formal nominations committee. This represents a departure from the ASX principles.
Review of Board performance
The Board Charter sets out the requirement for a formal review of the Board and individual Directors’ performance annually. A review of the Board and Directors’ performance was conducted in June 2012. The review involves consideration of the effectiveness of the Directors individually, and the effectiveness of the Board and the Audit and Compliance Committee, having regard to the knowledge, skills and experience of the Directors. The outcomes of the review were provided for discussion by the Board. The review indicated that the Board is performing soundly.
Independent Directors
The Responsible Entity has adopted an Independence Policy that states that an independent Director should be independent of management and free from any business or other relationship that could materially interfere with, or could reasonably be perceived to materially interfere with, the independent exercise of their judgement.
The Board regularly considers and assesses the independence of each Director in light of the interests and information which Directors disclose. In accordance with the Corporations Act, Directors are required to advise the Responsible Entity of any material personal interests they have in a matter.
Name Position Independent First appointed
Michael Cole Non-executive Chair Yes 2008
Ian Martens Non-executive Director Yes 2003
Ian Moore Non-executive Director Yes 2005
Geoff McWilliam Non-executive Director Yes 2006
Brendan O’Connor Executive Director No 2008
Rob Woods Executive Director No 2004
The roles of Chair and Chief Executive are not exercised by the same person.

24
In assessing independence, the Board will have regard to whether the Director has any of the following relationships with the Responsible Entity:
1. is a substantial shareholder (as defined by section 9 of the Corporations Act) of the Responsible Entity, or is a director or officer of, or otherwise associated directly with, a substantial shareholder of the Responsible Entity;
2. is employed, or has previously been employed in an executive capacity by a Challenger Group company, and there has not been a period of at least three years between ceasing such employment and serving on the Board;
3. has within the last three years been a principal of a material professional adviser or a material consultant to the Responsible Entity or another Challenger Group company, or an employee materially associated with the service provided;
4. is a material supplier or customer of the Responsible Entity or other Challenger Group company, or an officer of or otherwise associated directly or indirectly with a material supplier or customer; or
5. has a material contractual relationship with the Responsible Entity or another Challenger Group company other than as a Director.
The Responsible Entity will state its reasons if it considers a Director to be independent notwithstanding the existence of a relationship of the kind referred to in paragraphs 1–5 above.
In accordance with the ASX Corporate Governance Guidance for Independence, there is a majority of independent Directors on the Board.
Conflicts of interest
In accordance with the Board Charter and the Corporations Act, any Director with a material personal interest in a matter being considered by the Board must declare such an interest and may only be present when the matter is being considered at the Board’s discretion. Directors with a material interest may not vote on any matter in which they have declared a personal interest.
Meetings of the Board
During the year, the Board generally meets approximately every six weeks. In addition, the Board may meet whenever necessary to deal with specific matters needing attention between scheduled meetings. The Chief Executive, in consultation with the Chair, establishes the meeting agendas to ensure adequate coverage of strategic, financial and material risk areas throughout the year. The Fund Manager and senior management are invited to attend Board meetings and are available for contact by Non-executive Directors between meetings. The Non-executive Directors hold a private session without any executive involvement at least annually.
Director Board Audit and Compliance Committee
Eligible to attend
Attended Eligible to attend
Attended
M Cole 20 20 7 7
I Martens 20 19 7 7
G McWilliam 20 17 7 7
I Moore 20 17 7 7
B O’Connor 19 18 – –
R Woods 19 19 – –
Board access to information and advice
All Directors have unrestricted access to the Responsible Entity’s records and information. The Company Secretary provides Directors with guidance on corporate governance issues and developments and on all other matters reasonably requested by the Directors, and monitors compliance with the Board Charter. The Board, or each individual Director, has the right to seek independent professional advice at the Company’s expense to assist them to discharge their duties. Whilst the Chair’s prior approval is required, it may not be unreasonably withheld or delayed.
Board Committees
To assist it in undertaking its duties, the Board has established an Audit and Compliance Committee.
A copy of the Audit and Compliance Committee Charter is available on CDI’s website at www.challenger.com.au/cdi
Corporate governance statement (continued)

Challenger Diversified Property Group Annual Report 2012
25
Principle 3 Promote ethical and responsible decision-makingThe Responsible Entity’s commitment to ethical and responsible decision-making is reflected in the internal policies and procedures, underpinned by the Challenger Corporate Principles of:
• commercialownership;
• compliance;
• creativecustomersolutions;
• workingtogether;and
• integrity.
Code of Conduct
Challenger has adopted a Code of Conduct which applies to all Directors, executives, management and employees of the Challenger Group. The Code of Conduct articulates the standards of honest, ethical and law-abiding behaviour expected by Challenger. Employees are actively encouraged to bring any problems to the attention of management or the Board, including activities or behaviour which may not comply with the Code of Conduct, other policies and procedures in place, or other regulatory requirements or laws. A copy of the Code can be found at www.challenger.com.au/cdi
Political donations policy
Challenger Group has adopted a policy of not making political donations in any country or jurisdiction in which it operates. Representatives of Challenger may on occasion attend political functions. This attendance is strictly for commercial reasons and is predicated on the price charged not being in excess of commercial value (in terms of access) of the function.
Diversity
As a wholly owned subsidiary of Challenger, and not having any employees, the Responsible Entity does not have a Diversity Policy and does not set diversity objectives. This represents a departure from the ASX principles.
Staff trading policy
The Board has approved the Challenger Group’s Staff Trading Policy, which prescribes the manner in which Directors and staff can trade in the securities issued by the Challenger Group. The policy is available on CDI’s website.
Principle 4 Safeguard integrity in financial reportingIntegrity of financial reporting
The Board has the responsibility to ensure truthful and factual presentation of CDI’s financial position. The Board has established an Audit and Compliance Committee to assist the Board to focus on issues relevant to the integrity of CDI’s financial reporting. In accordance with its charter, the Audit and Compliance Committee must have at least three members and is comprised of all Non-executive Directors and a majority of independent members. The Committee is chaired by an independent Director, who is not Chair of the Board. The background details of the Audit and Compliance Committee members are set out in the Directors’ report. The Committee typically meets at least four times a year, and additional meetings are scheduled as required. The members’ names and attendance at meetings are set out on page 24.
The Committee oversees the financial reporting process, the system of internal control and risk management, the audit process and the Responsible Entity’s processes for monitoring compliance with laws and regulations. The Committee also assists the Board in discharging its responsibilities under the Compliance Plan adopted by the Responsible Entity. The Committee works on behalf of the Board with the external auditor and reviews non-audit services provided by the external auditor to confirm that they are consistent with maintaining external audit independence.
A copy of the Audit and Compliance Committee Charter is available on CDI’s website.
Declaration by the Fund Manager and the Chief Financial Officer
The Fund Manager and the Chief Financial Officer periodically provide formal assurance statements to the Board that:
• theFund’sfinancialstatementspresent a true and fair view of the Fund’s financial condition and operational results; and
• theriskmanagementandinternal compliance and control systems are sound, appropriate and operating efficiently and effectively.
Independent external audit
The Board requires the independent external audit to:
• providestakeholderswithassurance over the true and fair view of the financial reports; and
• ensurethataccountingpracticescomply with applicable accounting rules and policies.

26
CDI’S independent external auditor is Ernst & Young (E&Y). External auditors are required to rotate the engagement partner assigned to the Challenger Group on a five-year basis.
The external auditor will be invited to attend general meetings of CDI and be available to answer questions in relation to the conduct of its audit.
Principle 5 Make timely and balanced disclosureContinuous disclosure policy
The Responsible Entity is committed to ensuring that all investors have equal and timely access to material information concerning CDI and that CDI announcements are factual and presented in a clear and objective manner.
The Board has approved and implemented a Continuous Disclosure Policy. The policy is designed to ensure compliance with the Corporations Act and ASX Listing Rules continuous disclosure requirements. The Responsible Entity has a Continuous Disclosure Committee which is responsible for:
• makingdecisionsonwhatshouldbe disclosed publicly under the Continuous Disclosure Policy;
• maintainingawatchingbriefoninformation; and
• ensuringthatdisclosureismadein a timely and efficient manner.
Principle 6 Respect the rights of investorsThe Responsible Entity recognises the importance of enhancing our relationship with investors by:
• communicatingeffectively;and
• providingreadyaccesstoclearandbalanced information about CDI.
As set out in Principle 5, it is CDI’s policy that material information concerning the Fund will be announced to the market in a timely and objective manner. Following release to the market, the Responsible Entity publishes annual and half-yearly reports, announcements, media releases and other relevant information on its website at www.challenger.com.au/cdi. Internet web-casting is provided for market briefings to encourage participation from all stakeholders, regardless of their location. CDI also encourages greater use of electronic media by providing investors with greater access to the electronic receipt of reports and meeting notices. CDI also provides a facility to ask questions about the Fund and have them answered directly via electronic means.
The Responsible Entity is not required to hold annual general meetings for CDI; however, it may convene general meetings from time to time. Where the Responsible Entity convenes a general meeting for CDI, unitholders are encouraged to attend and participate in such meetings. The Responsible Entity will provide unitholders with details of any proposed meeting well in advance of the relevant date.
Principle 7 Recognise and manage riskRisk management and compliance
The management of risks is fundamental to the Fund’s business and to building unitholder value. The Responsible Entity recognises the broad range of risks which apply to CDI as a participant in the property industry, including, but not limited to, market risk, funding and liquidity risk, credit risk, investment, strategic and business risk, reputation, licence (compliance) and operational risk. The Responsible Entity is responsible for determining the Fund’s risk management strategy. Management is responsible for implementing the Responsible Entity’s strategy and for developing policies and procedures to identify, manage and mitigate risks across the whole of CDI’s operations.
The Responsible Entity has adopted a Risk Management Framework. The Responsible Entity utilises centralised risk management functions to support business managers in managing and mitigating risks across the Fund. Operational, licence (compliance), credit, market, funding and liquidity risks are driven through centralised teams, providing both scale and knowledge concentration benefits. The central functions have direct line of sight into the businesses, with reporting and oversight for functions within the businesses focused on their specific activities. Management is accountable for strategic, investment and business risk management within the delegated authority framework established by the Challenger Group Board. The framework is underpinned with a robust set of policies, delivery plans and procedures.
Corporate governance statement (continued)

Challenger Diversified Property Group Annual Report 2012
27
The framework and policies are developed and approved by management, reviewed and approved by the Responsible Entity’s Audit and Compliance Committee and made available to all staff of the Challenger Group. The Challenger Group risk management function has day-to-day responsibility for monitoring the implementation of the framework and policy, with regular reporting provided to the Responsible Entity’s Audit and Compliance Committee on the adequacy and effectiveness of management controls for material business risk. The Committee provides reporting to the Board on compliance with the framework and policies. A summary of the Challenger Group Risk Management Framework can be found at the Fund’s website.
The Audit and Compliance Committee reviews the effectiveness of the risk management and internal control system on an annual basis.
Internal audit
Internal audit services were provided to CDI by KPMG during the period.
The Audit and Compliance Committee oversees the scope of the internal audit and monitors the progress of the internal audit work program. The Committee receives internal audit reports at each meeting and monitors management’s responsiveness to internal audit findings and recommendations. The internal audit function is independent of the external auditor. The internal audit function reports directly to the Group Risk and Audit Committee.
Assurance
During the period, the Board has received formal assurance from the Fund Manager and the Chief Financial Officer that:
• CDI’sfinancialstatementspresenta true and fair view of the financial condition and operational results; and
• theriskmanagementandinternal compliance and control systems are sound, appropriate and operating efficiently and effectively.
This assurance forms part of the process by which the Board determines the effectiveness of its risk management and internal control systems in relation to financial reporting risks.
Principle 8 Remunerate fairly and responsiblyRemuneration
The Responsible Entity is entitled to be paid fees under the terms of the constitution for managing CDI. The details of fees paid in the period are set out in the notes to the financial statements on page 78.
All executives involved in the management of CDI are employees of the Challenger Group and are not remunerated by CDI.
As CDI does not pay any remuneration directly to executives of the Responsible Entity, the Responsible Entity considers that the requirements to disclose its remuneration policies, to establish a remuneration committee and to distinguish the nature of executive remuneration from that of non-executives are not relevant to CDI. In addition, CDI does not have equity based executive remuneration in operation and thus the disclosure required by Principle 8 is not relevant to CDI. These represent departures from the ASX principles.
Management fees
Management fees and performance fees are payable to Challenger Management Services Limited in accordance with the management agreement. The details of fees paid in the period are set out in the notes to the financial statements on page 78.
Non-executive Director fees
Non-executive Directors are paid an annual fee for their service on the Board and all Committees of the Board. Non-executive Directors are not entitled to participate in incentive schemes. There are no termination payments to Non-executive Directors on their retirement from office other than payments accruing from superannuation contributions comprising part of their remuneration. All Non-executive Director remuneration is paid by the Responsible Entity and is not an expense of CDI.
The staff trading policy prohibits any executive or staff member from entering into a transaction that is designed or intended to hedge that component of their unvested remuneration which is constituted by Challenger securities.

28
This page has been left intentionally blank.

Challenger Diversified Property Group Annual Report 2012
29
Directors’ report
The Directors of Challenger Listed Investments Limited (CLIL), the Responsible Entity of the Challenger Diversified Property Trust 1 (CDPT1) and Challenger Diversified Property Trust 2 (CDPT2), collectively known as the Challenger Diversified Property Group (herein known by its ASX code ‘CDI’), submit their report together with the financial report for the Challenger Diversified Property Trust 2 and its controlled entities (herein referred to as CDI2), for the year ended 30 June 2012.
Principal activities
The principal activity of CDPT1 (passive trust) during the year was investment in an office, retail and industrial property portfolio, with CDPT2 (active trust) operating a car park business.
Trust information
CDI consists of two stapled Australian registered managed investment schemes: CDPT1 and CDPT2. Each unit consists of one unit in CDPT1 and one unit in CDPT2. Units are stapled together so that one cannot be transferred, or otherwise dealt with, without the other.
CDPT1 has been identified as the parent entity of CDI.
CLIL, the Responsible Entity of CDPT1 and CDPT2, is incorporated and domiciled in Australia. The registered office of the Responsible Entity is located at Level 15, 255 Pitt Street, Sydney NSW 2000.
Directors’ summary
The following persons held office as Directors of CLIL during the year and up to the date of this report:
• MichaelCole–Chair;
• IanMartens;
• GeoffMcWilliam;
• IanMoore;
• BrendanO’Connor;and
• RobWoods.
Qualifications, experience and special responsibilities of Directors and Key Management Personnel
Directors
Michael ColeB Ec, M Ec, F FinChairNon-executive Director, Independent
Mr Cole is a Graduate of the University of Sydney in Economics and possesses a Master of Economics. He is also a Fellow of the Financial Services Institute of Australia. Mr Cole has over 30 years experience in the investment banking and funds management industry. He was an Executive Director at Bankers Trust Australia for over a decade. Mr Cole is currently Chair of Platinum Asset Management Ltd, Ironbark Capital Limited, and IMB Ltd (Illawarra Mutual Building Society). As well, Mr Cole is a director of NSW Treasury Corporation. In 2007 Mr Cole retired as Chair of SAS Trustee Corporation, a position he held from 2000.
Mr Cole is a member of the CLIL Audit and Compliance Committee.

30
Directors’ report (continued)
Directors
Ian MartensFCA, FAICDNon-executive Director, Independent
Mr Martens is a chartered accountant and was senior partner at BDO Chartered Accountants (SA), where he is now a consultant. Throughout his career, Mr Martens has advised a broad range of public and private companies on financial measurement and reporting, strategy development and evaluation and merger and acquisitions activities.
Mr Martens is Chairman of The Creeks Pipeline Company Ltd, appointed in January 2009. Mr Martens retired as Director of the Royal Automobile Association of SA Inc in February 2009.
Mr Martens is Chairman of the CLIL Audit and Compliance Committee.
.
Geoff McWilliamBE (Civil)Non-executive Director, Independent
Mr McWilliam has had an extensive career in the Australian property investment industry. Mr McWilliam spent 10 years to 2005 building the Commonwealth Bank’s property funds management and corporate real estate division, Colonial First State Property. As head of this business, he was responsible for the management and performance of over $16 billion in listed and unlisted property funds. Prior to this, Mr McWilliam spent 23 years with Lend Lease Corporation in a variety of senior management roles including international postings. Over the last five years, Mr McWilliam has been appointed to various property groups as an independent director.
Mr McWilliam is a director of Lend Lease Funds Management Limited, Lend Lease Asian Retail Investments Limited, Lend Lease Real Estate Investments Limited, the Gandel Group Limited, ProTen Limited, LaSalle Funds Management Limited and the Dusseldorp Skills Forum Incorporated, and is a Fellow of the Australian Property Institute.
Mr McWilliam is a member of the CLIL Audit and Compliance Committee.
Ian MooreBA (Actuarial Studies)Non-executive Director, Independent
Mr Moore has extensive experience in investment banking and structured finance. Mr Moore was Head of Corporate Finance at Bankers Trust Investment Bank, where he was responsible for all forms of corporate debt, project debt and asset backed debt financings. Prior to that, Mr Moore was Head of Fixed Income at Bankers Trust, where he was responsible for the trading and placement of all government, corporate and securitised debt. Mr Moore was a member of Bankers Trust’s Investment Bank Management Committee and a partner of Bankers Trust globally. Mr Moore was a non-executive director of Artesian Capital Management from 2005 to 2008.
Mr Moore is a member of the CLIL Audit and Compliance Committee.

Challenger Diversified Property Group Annual Report 2012
31
Brendan O’ConnorB Bus, CA, GAICDExecutive Director
Mr O’Connor is the Chief Financial Officer for Challenger’s Funds Management division. Mr O’Connor is responsible for the services that support the Funds Management business as well as the financial management and reporting for the Funds Management division’s funds, including the Challenger Diversified Property Group.
Mr O’Connor joined Challenger in 2006 as General Manager Group Finance. In 2007 Mr O’Connor was appointed as Chief Financial Officer of Challenger’s Asset Management business, before assuming his current role in 2008. Prior to joining Challenger, Mr O’Connor held senior finance roles with Westpac Banking Corporation.
Rob WoodsB Com Chief Executive, Funds Management
Mr Woods is Chief Executive, Funds Management at Challenger. The Funds Management business manages significant investments in property, infrastructure, fixed income and mortgages, as well as partnering with 11 boutique fund managers in the Fidante Partners business.
Mr Woods joined Challenger in 2003 and was initially responsible for Challenger’s Life business and the creation of Challenger’s Asset Management business, before assuming his current role in 2008.
Prior to joining Challenger, Mr Woods held senior investment banking roles at Zurich Capital Markets and Bankers Trust.
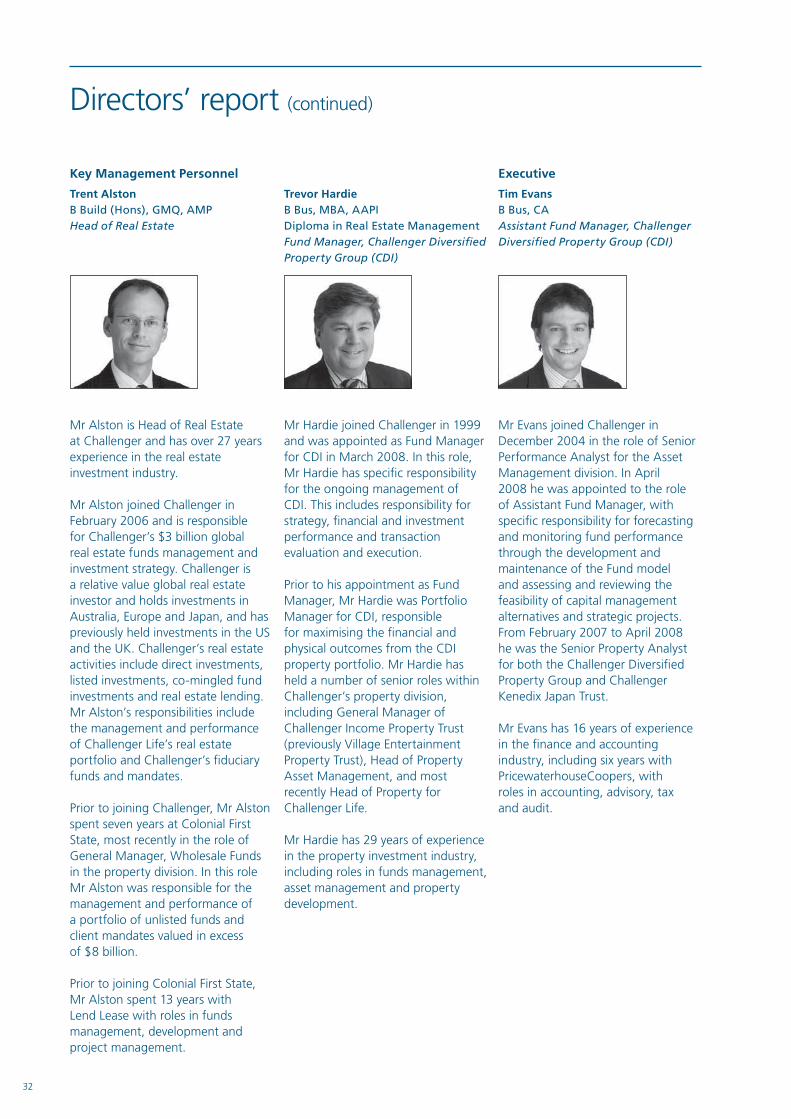
32
Directors’ report (continued)
Key Management Personnel
Trent AlstonB Build (Hons), GMQ, AMPHead of Real Estate
Mr Alston is Head of Real Estate at Challenger and has over 27 years experience in the real estate investment industry.
Mr Alston joined Challenger in February 2006 and is responsible for Challenger’s $3 billion global real estate funds management and investment strategy. Challenger is a relative value global real estate investor and holds investments in Australia, Europe and Japan, and has previously held investments in the US and the UK. Challenger’s real estate activities include direct investments, listed investments, co-mingled fund investments and real estate lending. Mr Alston’s responsibilities include the management and performance of Challenger Life’s real estate portfolio and Challenger’s fiduciary funds and mandates.
Prior to joining Challenger, Mr Alston spent seven years at Colonial First State, most recently in the role of General Manager, Wholesale Funds in the property division. In this role Mr Alston was responsible for the management and performance of a portfolio of unlisted funds and client mandates valued in excess of $8 billion.
Prior to joining Colonial First State, Mr Alston spent 13 years with Lend Lease with roles in funds management, development and project management.
Trevor HardieB Bus, MBA, AAPIDiploma in Real Estate ManagementFund Manager, Challenger Diversified Property Group (CDI)
Mr Hardie joined Challenger in 1999 and was appointed as Fund Manager for CDI in March 2008. In this role, Mr Hardie has specific responsibility for the ongoing management of CDI. This includes responsibility for strategy, financial and investment performance and transaction evaluation and execution.
Prior to his appointment as Fund Manager, Mr Hardie was Portfolio Manager for CDI, responsible for maximising the financial and physical outcomes from the CDI property portfolio. Mr Hardie has held a number of senior roles within Challenger’s property division, including General Manager of Challenger Income Property Trust (previously Village Entertainment Property Trust), Head of Property Asset Management, and most recently Head of Property for Challenger Life.
Mr Hardie has 29 years of experience in the property investment industry, including roles in funds management, asset management and property development.
Executive
Tim EvansB Bus, CAAssistant Fund Manager, Challenger Diversified Property Group (CDI)
Mr Evans joined Challenger in December 2004 in the role of Senior Performance Analyst for the Asset Management division. In April 2008 he was appointed to the role of Assistant Fund Manager, with specific responsibility for forecasting and monitoring fund performance through the development and maintenance of the Fund model and assessing and reviewing the feasibility of capital management alternatives and strategic projects. From February 2007 to April 2008 he was the Senior Property Analyst for both the Challenger Diversified Property Group and Challenger Kenedix Japan Trust.
Mr Evans has 16 years of experience in the finance and accounting industry, including six years with PricewaterhouseCoopers, with roles in accounting, advisory, tax and audit.

Challenger Diversified Property Group Annual Report 2012
33
Company Secretary
Michael VardanegaB Comm, LLB (Hons)General Counsel and Group Company Secretary
Mr Vardanega is a qualified solicitor and is the Group Company Secretary and General Counsel of Challenger Limited. In this role, he is responsible for the legal and company secretariat teams within Challenger. Since joining Challenger in 2006, he has been extensively involved in the general management of corporate actions, public entity compliance and governance matters for Challenger and its subsidiaries. Prior to joining Challenger, Mr Vardanega was a member of the corporate advisory practice at commercial law firm, Blake Dawson.
Suzie KoeppenkastropB Comm, LLB, LLMCompany Secretary and Senior Legal Counsel
Ms Koeppenkastrop is a qualified solicitor and head of the company secretariat team at Challenger. She has over 16 years experience in legal and company secretarial roles in the financial services industry.

34
Directors’ report (continued)
Review and results of operations
Profit from operating activities is the Directors’ view of fund performance as it is more closely aligned with the recurring net cash
earnings generated by CDI’s properties and operating business. The application of the profit from operating activities framework
is described in the segment note, Note 25 of the financial report.
CDI profit from operating activities for the year ended 30 June 2012 was $44.78 million (2011: $44.35 million) in line with 2011
mainly due to the accretion generated by the acquisition of 31 Queen Street, other portfolio rental growth and lower performance
fees being offset by higher finance costs associated with CDI’s development expenditure on Jam Factory, Domain Car Park and
the Junction Stage 2. On a per unit basis, profit from operating activities grew 4.1% to 5.06 cents for the 2012 financial year
(2011: 4.86 cents).
Statutory profit after tax attributable to unitholders of CDI for the year ended 30 June 2012 was $36.15 million (2011: $51.49 million),
down on 2011 primarily due to the negative movement of the fair value of interest rate swaps. These have been adversely impacted
by the current global economic uncertainty and its effect on forward interest rates, causing the interest rate swaps held by CDI to be
out of the money.
CDI2 loss from operating activities for the year ended 30 June 2012 was $0.62 million (2011: $0.16 million loss) down on 2011
primarily due to the increase in the Domain Car Park operating lease payments. This is partially offset by lower finance costs due to
loans repaid from the proceeds of the sale of property, plant and equipment by CDPT2 to CDPT1, which was sold as a consequence
of the assignment of the Domain Car Park leasehold interest from CDPT2 to CDPT1, discussed in more detail below.
The profit on sale of property, plant and equipment was the main driver of the increase in statutory profit after tax attributable to
unitholders of CDI2 to $3.51 million (2011: $1.46 million).
Set out below1 is a reconciliation of CDI’s profit from operating activities to statutory profit/(loss):
CDI CDI CDI2 CDI2 30 June 2012 30 June 2011 30 June 2012 30 June 2011 $’000 $’000 $’000 $’000
Profit from operating activities 44,781 44,353 (623) (159)
Straight-lining of rental income/(expense) 2,894 2,188 468 (76)
Property, plant and equipment depreciation (240) (27) (13) (27)
Discount on related party loan – – 942 –
Fair value movements (properties and derivatives held and disposed)2 (11,506) 3,441 – –
Net gain/(loss) on development property – 2,501 – 2,501
Net gain/(loss) on property, plant and equipment – – 2,112 –
Foreign exchange gain/(loss) (374) (173) – –
Income tax credit/(expense) 596 (795) 626 (777)
Net profit/(loss) after income tax 36,151 51,488 3,512 1,462
Earnings per unit based on profit from operating activities (cents) 3 5.06 4.86 (0.07) (0.02)
Earnings per unit based on net profit/(loss) attributable to unitholders of the parent entity (cents) 3 3.69 5.48 0.40 0.16
Weighted average number of securities (basic and diluted) (‘000) 3 884,927 912,688 884,927 912,688
1 The above table has been reviewed by CDI’s independent auditor.
2 For detail of fair value movements refer to table on page 35.
3 Basic earnings per stapled security is calculated using the profit attributable to the unitholders of the parent entity and the time
weighted average number of ordinary stapled units outstanding during the year.
Refer to Note 25 to this financial report for a dissection of profit from operating activities by segment as reported to the Board.

Challenger Diversified Property Group Annual Report 2012
35
Fair value movements comprise the following:
CDI CDI CDI2 CDI2 30 June 2012 30 June 2011 30 June 2012 30 June 2011 $’000 $’000 $’000 $’000
Fair value movement of derivatives held at the end of the year (10,081) 1,276 – –
Fair value movement of investment properties sold during the year 1 (770) (253) – –
Fair value movement of investment properties held at the end of the year (655) 2,418 – –
Total fair value movements (11,506) 3,441 – –
1 Fair value movement of investment properties sold during the year relates to Pacific Brands, which was sold on 29 July 2011, and
75 Talavera Road, which was sold on 30 March 2012.
CDI settled contracts for the sale of Pacific Brands investment property on 29 July 2011 and 75 Talavera Road, North Ryde on
30 March 2012. Proceeds from the sale of 75 Talavera Road were allocated towards CDI’s on-market unit buy-back. As at 30 June
2012, CDI had purchased 54.77 million units (6.0% of units on issue before commencement of the buy-back) at an average price
of 52.4 cents per unit.
In December 2011, CDPT2 assigned the Domain Car Park leasehold interest to CDPT1 for a net consideration of $10.8 million.
This assignment improved the capital position of CDPT2 and ensured that the entity with the lowest cost of capital, CDPT1, was
responsible for the completion of the car park refurbishment works. The consideration was supported by an independent valuation.
At the same time CDPT1 and CDPT2 entered into a sub-lease for CDPT2 to continue to manage the operation of the Domain Car
Park. As a result of the assignment one of the debt facility agreements between CDPT1 and CDPT2 was fully repaid and terminated.
The remaining debt facility has been partially repaid and amended to be interest free. Net operating cash flow from the Domain Car
Park has been directed to repay this loan.
Distributions
CDI’s distribution policy is to distribute profit from operating activities adjusted for non-cash expenses, straight-line rent, incurred
and expected: leasing costs, debt establishment fees and maintenance capital expenditure, subject to the ongoing objective to
distribute an amount which results in CDI not being subject to income tax. Realised gains from the sale of assets will be distributed
on a discretionary basis and are determined with regard to capital management strategies, market conditions and tax consequences.
On 20 June 2012, CDI announced an estimated final distribution to the ASX of 2.15 cents per unit (2011: 2.00 cents per unit).
The distribution amount of $18.5 million (2011: $18.1 million) will be paid on 30 August 2012.
An interim distribution of 2.05 cents per unit equal to $18.1 million (2011: 2.00 cents per unit, $18.3 million), was paid on
29 February 2012.

36
Directors’ report (continued)
The following schedule applies CDI’s distribution policy and reconciles the distribution to profit from operating activities:
CDI CDI CDI2 CDI2 30 June 2012 30 June 2011 30 June 2012 30 June 2011 $’000 $’000 $’000 $’000
Profit from operating activities 44,781 44,353 (623) (159)
Non-cash expenses
Amortisation of borrowing costs 805 287 – –
Other transfers per distribution policy
Debt establishment costs (1,240) (575) – –
Maintenance capital expenditure (3,206) (3,716) – –
Leasing costs (4,378) (841) – –
Current income tax expense/(credit) (30) (18) – –
Total income available for distribution 36,732 39,490 (623) (159)
Less: Current year undistributed (income)/loss carried forward (152) (3,100) 623 159
Distribution to unitholders 36,580 36,390 – –
Distribution per unit (cents) 4.20 4.00 – –
CDPT2 has not declared or paid a distribution to unitholders during the year (2011: Nil).
Units on issue
As at 30 June 2012, CDI had 858,653,199 (2011: 906,046,047) stapled units on issue. During the year, 47,392,848 ordinary stapled
securities were purchased and cancelled as part of CDI’s on-market buy-back program.
Trust assets
At 30 June 2012, CDI held assets to a total value of $880.4 million (2011: $876.3 million) and CDI2 held assets to a total value of
$1.4 million (2011: $10.0 million). The basis for valuation of the assets is disclosed in Note 2 to the financial statements.
Fees paid to the Responsible Entity and associates
The table below discloses all fees paid by CDI and CDI2 to CLIL and Challenger Management Services Limited (CMSL) under the
relevant Constitutions and to CMSL under the Management Agreement with CLIL and the Asset Management Agreement for the
Domain Car Park.
CDI CDI CDI2 CDI2 30 June 2012 30 June 2011 30 June 2012 30 June 2011 $’000 $’000 $’000 $’000
Base Responsible Entity fees paid or payable to CLIL, equating to 5% of the base management fee 218 204 1 3
Management fees paid or payable to CMSL, equating to 95% of the base management fee 4,138 3,874 22 48
Performance fees paid or payable to CMSL 39 2,190 – –
Asset management fees paid or payable to CMSL 135 135 135 135
Disposal fees for offshore properties paid or payable to CMSL – 12 – –
Total fees included in the income statement 4,530 6,415 158 186
Transaction fees paid or payable to CMSL capitalised as part of property development 658 2 165 2
Leasing fees paid or payable to CMSL 546 187 – –
Total fees paid or payable at balance date 5,734 6,604 323 188
Total expenses paid by CDI to reimburse CMSL for the year ended 30 June 2012 in respect of costs paid on behalf of CDI were
$4,968,889 (2011: $206,331). CDI2 has not paid any expenses to reimburse CMSL (2011: Nil).
All transactions were in accordance with the agreements in place.
Further details of fees paid to the Responsible Entity and associates are set out in the related party note (Note 27).

Challenger Diversified Property Group Annual Report 2012
37
Interests held in CDI by the Responsible Entity and its associates
Challenger Life Company Limited (CLC) holds 469,024,292 units, 54.62% in CDI (2011: 455,993,935 units, 50.33%). CDI is deemed
to be a controlled entity of CLC.
Balance sheet management
CDI’s policy is to effectively manage its working capital to ensure it has sufficient available funds to pay its current liabilities as and
when they fall due. Between distribution payment dates, CDI management utilises surplus operating cash flow to repay interest
bearing borrowings and maximise unitholder returns. Under the terms and conditions of the finance facility, these funds are available
to be redrawn for distribution and working capital requirements.
Further details on available finance facilities as at 30 June 2012 are set out in the interest bearing liabilities note (Note 20).
Significant changes in the state of affairs
There were no significant changes to the state of affairs of CDI and CDI2 during the year, other than those changes identified in
the financial statements for the year ended 30 June 2012.
Significant events after the balance date
Following Board approval on 6 August 2012, CDI announced the consolidation of issued capital by consolidating every four pre-
consolidation ordinary stapled securities into one post-consolidation ordinary stapled security. Formal notice and details of the
consolidation will be sent to unitholders by 10 August 2012 and normal trading of post-consolidation ordinary stapled securities
is expected to commence on 31 August 2012.
Other than the matter noted above, there have been no matters or circumstances that have arisen since the end of the financial year
that have significantly affected, or may significantly affect CDI’s and CDI2’s operations in future financial years, the results of those
operations or the state of affairs in future financial years.
Likely developments and expected results
Further information on likely developments on the operation of CDI and CDI2 and the expected results of those operations have
not been included in this report because the Responsible Entity believes it would be likely to result in unreasonable prejudice to
these entities.
Environmental regulation and performance
CDI owns properties which are subject to environmental regulations under both Commonwealth and State legislation. The Directors
are satisfied that adequate systems were in place for the management of the environmental responsibilities and the compliance with
various legislative, regulatory and licence requirements.
The operations of CDI2 are not subject to any particular or significant environmental regulation under a law of the Commonwealth or
of a State or Territory. There have been no known significant breaches of any other environmental requirements applicable to CDI2.
Indemnification and insurance of Directors and officers
The Responsible Entity has insured the Directors and officers against liabilities incurred in their role as Directors and officers of the
Responsible Entity. The Responsible Entity is prohibited by the insurance contract itself from disclosing the nature of the liabilities
covered and the amount of the premium. The auditors of CDI and CDI2 are not indemnified out of the assets of these entities.
Fund Manager and Chief Financial Officer declaration
The Fund Manager and the Chief Financial Officer have given a declaration to the Board of Directors that in their opinion the
financial records of CDI and CDI2 have been properly maintained in accordance with section 286 of the Corporations Act 2001, and
the financial statements and notes for the financial year ended 30 June 2012 comply with Australian Accounting Standards as issued
by the Australian Accounting Standards Board and with International Financial Reporting Standards as issued by the International
Accounting Standards Board and give a true and fair view of CDI and CDI2’s performance.

38
Rounding of amounts in the Directors’ report and the financial report
CDPT1 and CDPT2 are registered trusts that are of the kind referred to in Class Order 98/0100, issued by the Australian Securities
and Investments Commission, relating to the ‘rounding off’ of amounts in the Directors’ report and financial report. Amounts in the
Directors’ report and financial report have been rounded off to the nearest thousand dollars in accordance with that Class Order,
unless otherwise indicated.
Auditor’s independence declaration
We have obtained an independence declaration from our auditor, Ernst & Young as set out on page 39.
This report is made in accordance with a resolution of the Directors of Challenger Listed Investments Limited.
Michael ColeChairSydney
6 August 2012
Directors’ report (continued)

Challenger Diversified Property Group Annual Report 2012
39
Auditor’s independence declaration
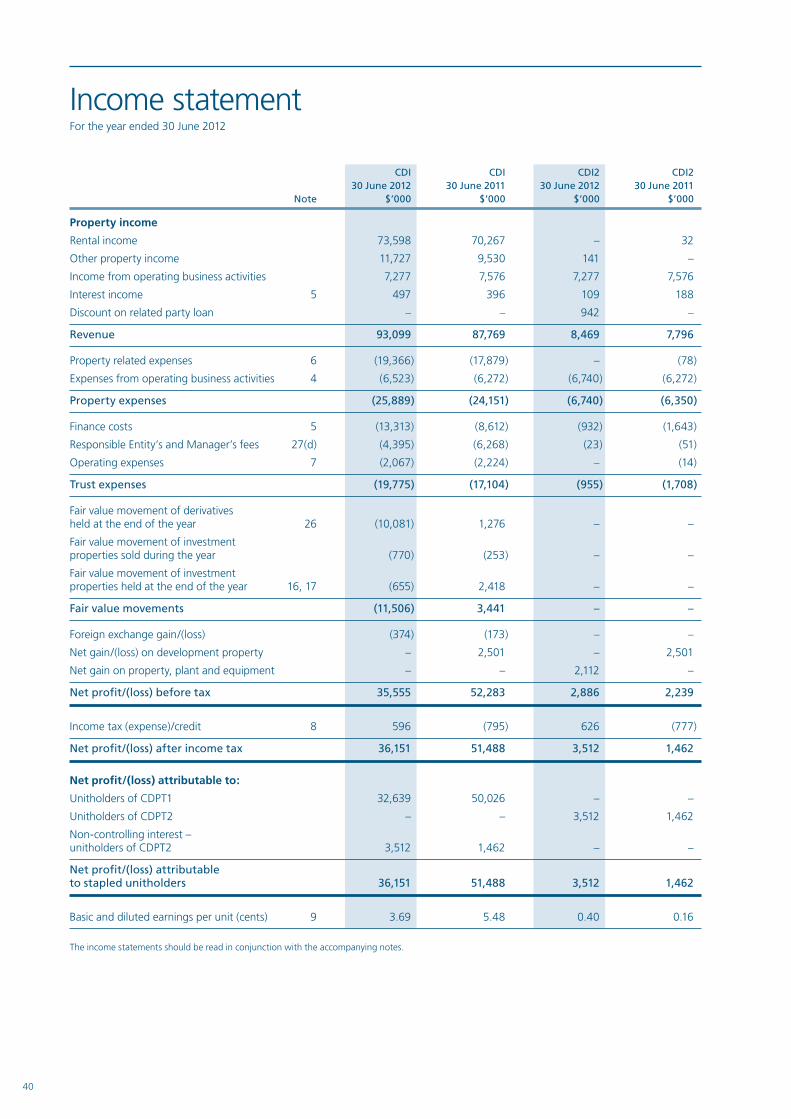
40
Income statementFor the year ended 30 June 2012
CDI CDI CDI2 CDI2 30 June 2012 30 June 2011 30 June 2012 30 June 2011 Note $’000 $’000 $’000 $’000
Property income
Rental income 73,598 70,267 – 32
Other property income 11,727 9,530 141 –
Income from operating business activities 7,277 7,576 7,277 7,576
Interest income 5 497 396 109 188
Discount on related party loan – – 942 –
Revenue 93,099 87,769 8,469 7,796
Property related expenses 6 (19,366) (17,879) – (78)
Expenses from operating business activities 4 (6,523) (6,272) (6,740) (6,272)
Property expenses (25,889) (24,151) (6,740) (6,350)
Finance costs 5 (13,313) (8,612) (932) (1,643)
Responsible Entity’s and Manager’s fees 27(d) (4,395) (6,268) (23) (51)
Operating expenses 7 (2,067) (2,224) – (14)
Trust expenses (19,775) (17,104) (955) (1,708)
Fair value movement of derivatives held at the end of the year 26 (10,081) 1,276 – –
Fair value movement of investment properties sold during the year (770) (253) – –
Fair value movement of investment properties held at the end of the year 16, 17 (655) 2,418 – –
Fair value movements (11,506) 3,441 – –
Foreign exchange gain/(loss) (374) (173) – –
Net gain/(loss) on development property – 2,501 – 2,501
Net gain on property, plant and equipment – – 2,112 –
Net profit/(loss) before tax 35,555 52,283 2,886 2,239
Income tax (expense)/credit 8 596 (795) 626 (777)
Net profit/(loss) after income tax 36,151 51,488 3,512 1,462
Net profit/(loss) attributable to:
Unitholders of CDPT1 32,639 50,026 – –
Unitholders of CDPT2 – – 3,512 1,462
Non-controlling interest – unitholders of CDPT2 3,512 1,462 – –
Net profit/(loss) attributable to stapled unitholders 36,151 51,488 3,512 1,462
Basic and diluted earnings per unit (cents) 9 3.69 5.48 0.40 0.16
The income statements should be read in conjunction with the accompanying notes.

Challenger Diversified Property Group Annual Report 2012
41
Statement of comprehensive incomeFor the year ended 30 June 2012
CDI CDI CDI2 CDI2 30 June 2012 30 June 2011 30 June 2012 30 June 2011 Note $’000 $’000 $’000 $’000
Net profit/(loss) after income tax 36,151 51,488 3,512 1,462
Other comprehensive income
Movements in foreign currency translation reserve
Net gain/(loss) on hedge of net investment in foreign operation 23 4,488 3,613 – –
Net gain/(loss) on foreign currency translation of net investment in foreign operation 23 (4,220) (3,574) – –
Other comprehensive income for the year 268 39 – –
Total comprehensive income for the year 36,419 51,527 3,512 1,462
Total comprehensive income attributable to:
Unitholders of CDPT1 32,907 50,065 – –
Unitholders of CDPT2 – – 3,512 1,462
Non-controlling interest – unitholders of CDPT2 3,512 1,462 – –
Total comprehensive income for the year 36,419 51,527 3,512 1,462
The statements of comprehensive income should be read in conjunction with the accompanying notes.

42
Balance sheetAs at 30 June 2012
CDI CDI CDI2 CDI2 30 June 2012 30 June 2011 30 June 2012 30 June 2011 Note $’000 $’000 $’000 $’000
Current assets
Cash and cash equivalents 10 2,923 2,716 316 890
Trade and other receivables 11 990 4,354 126 3,097
Derivative financial instruments 26 27 988 – –
Other financial assets 14 2,537 – – –
Other assets 12 1,732 846 147 15
Investment properties held for sale 13 – 13,200 – –
Total current assets 8,209 22,104 589 4,002
Non-current assets
Other financial assets 14 69 3,062 – 2,936
Derivative financial instruments 26 314 738 – –
Property, plant and equipment 15 12,186 2,895 – 2,895
Investment properties under development 16 6,800 18,500 – –
Investment properties 17 851,964 828,792 – –
Deferred tax assets 8 836 210 836 210
Total non-current assets 872,169 854,197 836 6,041
Total assets 880,378 876,301 1,425 10,043
Current liabilities
Trade and other payables 18 20,805 17,970 996 1,971
Provision for distribution 19 18,461 18,121 – –
Income tax payable 70 48 – –
Derivative financial instruments 26 2,739 1,087 – –
Interest bearing liabilities 20 – 140,834 – –
Total current liabilities 42,075 178,060 996 1,971
Non-current liabilities
Trade and other payables 18 – – 3,225 –
Derivative financial instruments 26 7,958 914 – –
Interest bearing liabilities 20 243,681 85,747 – 14,380
Total non-current liabilities 251,639 86,661 3,225 14,380
Total liabilities 293,714 264,721 4,221 16,351
Net assets 586,664 611,580 (2,796) (6,308)
Unitholders’ equity
Contributed equity 21 648,107 672,862 69 69
Undistributed income 22 14,618 14,468 (593) 30
Reserves 23 (76,061) (75,750) (2,272) (6,407)
Total equity attributable to stapled unitholders 586,664 611,580 (2,796) (6,308)
Equity attributable to:
Unitholders of CDPT1 589,460 617,888 – –
Unitholders of CDPT2 – – (2,796) (6,308)
Non-controlling interest – unitholders of CDPT2 (2,796) (6,308) – –
Total equity attributable to stapled unitholders 586,664 611,580 (2,796) (6,308)
Net tangible assets attributable to unitholders ($) 24 0.68 0.67 (0.00) (0.01)
The balance sheets should be read in conjunction with the accompanying notes.

Challenger Diversified Property Group Annual Report 2012
43
CDI CDI CDI2 CDI2 30 June 2012 30 June 2011 30 June 2012 30 June 2011 Note $’000 $’000 $’000 $’000
Cash flows from operating activities
Rental and other property income received 88,909 83,102 – 34
Operating business income 7,958 8,409 7,958 8,409
Interest received 357 305 266 97
Finance costs (11,800) (8,179) (1,300) (1,905)
Payments to suppliers (45,711) (37,335) (7,800) (7,260)
Net cash inflow/(outflow) from operating activities 10(a) 39,713 46,302 (876) (625)
Cash flows from investing activities
Property acquisition costs – (85,480) – –
Development and capital expenditure (40,670) (6,941) (5,849) (353)
Net proceeds from sale of properties 40,630 23,902 2,800 6,612
Proceeds from security deposit 2,936 – 2,936 –
Payment of security deposit (2,420) – – –
Net cash inflow/(outflow) from investing activities 476 (68,519) (113) 6,259
Cash flows from financing activities
Buy-back of stapled securities (24,704) (3,993) – –
Transaction costs on buy-back of stapled securities (51) (7) – –
Distributions paid (36,240) (37,908) – –
Debt establishment fees paid (1,240) (575) – –
Net proceeds from derivatives 2,040 – – –
Proceeds from borrowings 150,222 111,450 5,796 1,469
Repayment of borrowings (129,727) (44,950) (5,381) (6,375)
Net cash (outflow)/inflow from financing activities (39,700) 24,017 415 (4,906)
Net (decrease)/increase in cash and cash equivalents 489 1,800 (574) 728
Cash and cash equivalents at the beginning of the year 2,716 1,035 890 162
Translation differences arising on cash balances held in foreign currencies (282) (119) – –
Cash and cash equivalents at the end of the year 10 2,923 2,716 316 890
The cash flow statements should be read in conjunction with the accompanying notes.
Cash flow statementFor the year ended 30 June 2012

44
Statement of changes in equityFor the year ended 30 June 2012
Attributable to stapled unitholders of CDI
Foreign Gains/ currency Contributed Undistributed (losses) translation equity income reserve reserve Total $’000 $’000 $’000 $’000 $’000
Balance as at 1 July 2011 672,862 14,468 (82,541) 6,791 611,580
Changes in equity
Total comprehensive income attributable to:
unitholders of CDPT1 – 32,639 – 268 32,907
non-controlling interest – unitholders of CDPT21 – 3,512 – – 3,512
Total comprehensive income – 36,151 – 268 36,419
Transfers to reserves – 581 (581) – –
Distributions to stapled unitholders – (36,580) – – (36,580)
Units issued – – – – –
Units cancelled pursuant to share buy-back (24,704) – – – (24,704)
Unit issue/cancellation costs (51) – – – (51)
Balance as at 30 June 2012 648,107 14,620 (83,122) 7,059 586,664
Attributable to stapled unitholders of CDI
Foreign Gains/ currency Contributed Undistributed (losses) translation equity income reserve reserve Total $’000 $’000 $’000 $’000 $’000
Balance as at 1 July 2010 676,862 11,368 (94,539) 6,752 600,443
Changes in equity
Total comprehensive income attributable to:
unitholders of CDPT1 – 50,026 – 39 50,065
non-controlling interest – unitholders of CDPT21 – 1,462 – – 1,462
Total comprehensive income – 51,488 – 39 51,527
Transfers to reserves – (11,998) 11,998 – –
Distributions to stapled unitholders – (36,390) – – (36,390)
Units issued – – – – –
Units cancelled pursuant to share buy-back (4,006) – – – (4,006)
Unit issue/cancellation costs 6 – – – 6
Balance as at 30 June 2011 672,862 14,468 (82,541) 6,791 611,580
1 CDPT2 is the only non-controlling interest.
The statements of changes in equity should be read in conjunction with the accompanying notes.

Challenger Diversified Property Group Annual Report 2012
45
Attributable to unitholders of CDI2
Gains/ Contributed Undistributed (losses) equity income reserve Total $’000 $’000 $’000 $’000
Balance as at 1 July 2011 69 30 (6,407) (6,308)
Changes in equity
Total comprehensive income attributable to unitholders of CDPT2 – 3,512 – 3,512
Transfers to reserves – (4,135) 4,135 –
Balance as at 30 June 2012 69 (593) (2,272) (2,796)
Attributable to unitholders of CDI2
Gains/ Contributed Undistributed (losses) equity income reserve Total $’000 $’000 $’000 $’000
Balance as at 1 July 2010 69 189 (8,028) (7,770)
Changes in equity
Total comprehensive income attributable to unitholders of CDPT2 – 1,462 – 1,462
Transfers to reserves – (1,621) 1,621 –
Balance as at 30 June 2011 69 30 (6,407) (6,308)
The statements of changes in equity should be read in conjunction with the accompanying notes.
46
Notes to the financial statementsFor the year ended 30 June 2012
Note 1 – Trust informationThe financial report for the year ended 30 June 2012 was authorised for issue in accordance with a resolution of the Directors of the
Responsible Entity dated 6 August 2012.
Challenger Diversified Property Group (herein known by its ASX code ‘CDI’) was formed on 12 September 2006 by stapling the units
of CDPT1 and CDPT2, and is publicly traded on the Australian Securities Exchange (ASX).
The principal activity of CDPT1 during the year was investment in an office, retail and industrial property portfolio, with CDPT2
operating a car park business.
Note 2 – Summary of significant accounting policiesThe accounting policies which have been adopted in the preparation of the financial statements are stated to assist in a general
understanding of this report.
(a) Basis of preparationThe financial report is a general purpose financial report, which has been prepared in accordance with the requirements of the
Constitutions, Corporations Act 2001 and Australian Accounting Standards.
The CDI financial report has been prepared based on a business combination by the parent entity, and in recognition of the fact that
the units issued by CDPT1 and CDPT2 have been stapled and cannot be traded separately.
For the purposes of statutory reporting, CDI’s parent entity is CDPT1. The consolidated balance sheet and consolidated income
statement comprise the financial position and performance of CDPT1 and its controlled entities and CDPT2 and its controlled
entities, collectively known as CDI.
The CDI2 financial report includes the results of CDPT2 and its controlled entities. For the purposes of statutory reporting, CDI2’s
parent entity is CDPT2.
The financial report has been prepared on a historical cost basis, except for investment property, investment property under
development and derivative financial instruments that have been measured at fair value.
The accounting policies adopted in preparing these consolidated financial statements have been consistently applied by CDI and
CDI2 unless otherwise specified.
The financial report complies with Australian Accounting Standards as issued by the Australian Accounting Standards Board and
International Financial Reporting Standards (IFRS) as issued by the International Accounting Standards Board.
The financial report is presented in Australian dollars unless otherwise stated and all values are rounded to the nearest thousand
dollars ($’000) unless otherwise stated.
The CDI2 financial report has been prepared on a going concern basis as CDPT2 is expected to generate sufficient funds to enable
it to pay its debts as and when they fall due. In addition to this, CDPT1 has agreed to make available to CDPT2 sufficient funds to
enable CDPT2 to pay its debts as and when they fall due to the extent that money is not otherwise available to CDPT2 to meet
such liabilities.
A summary of significant accounting policies of CDI and CDI2 are disclosed below.
(b) New reporting standards issued and/or applied during the yearChanges in accounting policy or disclosureAmendments to the disclosure requirements of AASB 101 have resulted in a change in the format of the statement of changes in
equity to separately show the impact of other comprehensive income on the classes of equity. The adoption of other amendments
and changes which were effective during the period did not result in any material changes to the financial report.
There were no changes in accounting policy applied during the period.

Challenger Diversified Property Group Annual Report 2012
47
Accounting standards and interpretations issued but not yet effectiveThere are a number of minor amendments to Australian Accounting Standards, in addition to those described below, that are
available for early adoption but that have not been applied in this financial report. The amendments would have resulted in
only minor disclosure impacts if they had been early adopted. The consolidated entity’s assessment of the impact of the key
new Accounting Standards is set out below:
• AASB2011-9AmendmentstoAustralianAccountingStandards–PresentationofOtherComprehensiveIncome
Effective for annual reporting periods beginning on or after 1 July 2012. This standard requires entities to group items presented
in other comprehensive income on the basis of whether they might be reclassified subsequently to profit or loss and those that
will not. Initial application is not expected to result in any material impact.
• AASB9FinancialInstruments
Effective for annual reporting periods beginning on or after 1 January 2013. The standard includes requirements for the
classification and measurement of financial assets. These requirements improve and simplify the approach for classification and
measurement of financial assets compared with the requirements of AASB 139. CDI is required to first apply this standard from
1 July 2013 and is currently assessing the impact. The classification of a financial instrument will be assessed on the facts at
the date of initial application and it is possible that the classification of some financial assets may change upon adoption of the
new standard.
• AASB12DisclosureofInterestsinOtherEntities
Effective for annual reporting periods beginning on or after 1 January 2013. New disclosures have been introduced about the
judgements made by management to determine whether control exists, and to require summarised information about joint
arrangements, associates and structured entities and subsidiaries with non-controlling interests. Initial application is not expected
to result in any material impact.
• AASB13FairValueMeasurement
Effective for annual reporting periods beginning on or after 1 January 2013. This standard establishes a single source of guidance
for determining the fair value of assets and liabilities and expands the disclosure requirements for all assets or liabilities carried at
fair value. Application of this definition is not expected to result in different fair values being determined for the relevant assets.
(c) Basis of consolidationCDI’s consolidated financial statements comprise the financial statements of CDPT1 and CDPT2 and their controlled entities.
CDI2’s consolidated financial statements comprise the financial statements of CDPT2 and its controlled entities.
Adjustments are made to bring into line any dissimilar accounting policies that may exist. All intercompany balances and transactions,
including unrealised profits arising from intra-group transactions, have been eliminated in full.
Controlled entities are consolidated from the date on which the parent obtains control and cease to be consolidated from the date
on which control is transferred out. Where loss of control of a controlled entity occurs, the consolidated financial statements include
the results for the part of the reporting period during which CDI and CDI2 had control.
(d) RevenueRevenue is recognised and measured at the fair value of the consideration received or receivable to the extent that it is probable that
the economic benefits will flow to CDI and CDI2 and the revenue can be reliably measured. Revenue brought to account but not
received at balance date is recognised as a receivable.
Rental revenue from operating leases is recognised on a straight-line basis over the lease term.
Contingent rental revenue is recognised as income in the financial year in which it is earned.
Fixed rental increases which do not represent direct compensation for the underlying cost increases or capital expenditure are
recognised on a straight-line basis over the term of the lease until the next market review date.
Lease incentives granted are recognised in the income statement as an integral part of rental income.
Car park revenue is recognised when the services are provided.
Interest income is recognised as the interest accrues using the effective interest method.
48
Notes to the financial statements (continued)For the year ended 30 June 2012
Note 2 – Summary of significant accounting policies (continued)(d) Revenue (continued)Incidental revenues (and related costs) derived from an investment property undergoing construction or development, but not
directly related to bringing an asset to the location and working condition of an investment property, are recognised in the income
statement as they are earned.
Distribution income is recognised when the right to receive the payment is established.
(e) Expense recognitionExpenses are brought to account on an accruals basis.
Expenses incurred under an operating lease are recognised on a straight-line basis over the term of the lease.
Responsible Entity and Manager fees payable to the Responsible Entity and Manager are recognised as expenses when the services
are received. Fees relating to specific events or transactions are expensed upon completion or occurrence of a relevant service
or event.
Property expenditure, including rates, taxes, insurance, and other costs associated with the upkeep of a building, are brought to
account on an accruals basis. Repair costs are expensed when incurred. Other amounts that improve the condition of the investment
are capitalised.
Recovery of outgoings as specified in lease agreements are accrued on an estimated basis and adjusted at period end.
(f) DepreciationIn accordance with Accounting Standard AASB 140 Investment Property, investment properties are not depreciated.
(g) Income taxUnder current Australian income tax legislation, CDPT1 will not be subject to income tax, including capital gains tax, provided that
unitholders are presently entitled to the distributable income of CDI as calculated for trust law purposes.
CDPT2 is a public trading trust under Division 6C of Part III of the 1936 Tax Act. CDPT2 owns all the shares in Challenger Diversified
Property Development Pty Ltd (CDPD). Both CDPT2 and CDPD are subject to tax at the corporate tax rate on their taxable income.
Deferred income tax is provided on all temporary differences at the balance sheet date between the tax bases of assets and liabilities
and their carrying amounts for financial reporting purposes.
Deferred income tax liabilities are recognised for all taxable temporary differences except:
• whenthedeferredincometaxliabilityarisesfromtheinitialrecognitionofgoodwillorofanassetorliabilityinatransactionthat
is not a business combination and that, at the time of the transaction, affects neither the accounting profit nor taxable profit or
loss; or
• whenthetaxabletemporarydifferenceisassociatedwithinvestmentsinsubsidiaries,associatesorinterestsinjointventures,and
the timing of the reversal of the temporary difference can be controlled and it is probable that the temporary difference will not
reverse in the foreseeable future.
Deferred income tax assets are recognised for all deductible temporary differences, carry-forward of unused tax credits and unused
tax losses, to the extent that it is probable that taxable profit will be available against which the deductible temporary differences
and the carry-forward of unused tax credits and unused tax losses can be utilised, except:
• whenthedeferredincometaxassetrelatingtothedeductibletemporarydifferencearisesfromtheinitialrecognitionofanasset
or liability in a transaction that is not a business combination and, at the time of the transaction, affects neither the accounting
profit nor taxable profit or loss; or
• whenthedeductibletemporarydifferenceisassociatedwithinvestmentsinsubsidiaries,associatesorinterestsinjointventures,
in which case a deferred tax asset is only recognised to the extent that it is probable that the temporary difference will reverse in
the foreseeable future and taxable profit will be available against which the temporary difference can be utilised.
The carrying amount of deferred income tax assets is reviewed at each balance sheet date and reduced to the extent that it is no
longer probable that sufficient taxable profit will be available to allow all or part of the deferred income tax asset to be utilised.
Unrecognised deferred income tax assets are reassessed at each balance sheet date and are recognised to the extent that it has
become probable that future taxable profit will allow the deferred tax asset to be recovered.
Challenger Diversified Property Group Annual Report 2012
49
Deferred income tax assets and liabilities are measured at the tax rates that are expected to apply to the year when the asset is
realised or the liability is settled, based on tax rates (and tax laws) that have been enacted or substantively enacted at the balance
sheet date.
Income taxes relating to items recognised directly in equity are recognised in equity and not in profit or loss.
(h) DistributionsIn accordance with CDI’s Constitutions, CDI distributes its distributable income to unitholders in cash and/or units. In addition to
the distributable income, as provided for in CDI’s Constitutions, CDI may distribute a portion of capital. CDI’s distribution policy
is to distribute accounting profit earned from operating activities adjusted for non-cash expenses, straight-line rent, incurred and
expected: leasing costs, debt establishment fees and capital expenditure to maintain the investment properties, subject to the
ongoing objective to distribute an amount which results in CDI not being subject to income tax. Realised impacts from the sale of
assets will be distributed on a discretionary basis which will be determined with regard to capital management strategies, market
conditions and tax consequences. Distributions determined by the Responsible Entity are paid every six months for the periods ended
31 December and 30 June where distributable income exists.
A provision for distribution is recognised where the distribution has been declared prior to the balance date.
(i) Cash and cash equivalentsCash and cash equivalents in the balance sheet comprise cash at bank and short-term deposits with an original maturity of three
months or less.
For the purposes of the cash flow statement, cash and cash equivalents consist of cash and cash equivalents as defined above, net of
outstanding bank overdrafts.
(j) Trade and other receivablesTrade receivables are initially recognised at fair value and subsequently carried at amortised cost less an allowance for impairment.
An impairment provision is recognised when there is objective evidence that CDI and CDI2 will not be able to collect the debts.
Individual debts that are known to be uncollectible are written off when identified.
Intercompany receivables are initially recognised at the fair value of the consideration received less directly attributable transaction
costs. Interest is charged on these receivables at rates under the terms of applicable agreements.
After initial recognition, interest bearing receivables are subsequently measured at amortised cost using the effective interest
method. Amortised cost is calculated by taking into account any issue costs, and any discount or premium on settlement.
(k) Property, plant and equipmentRecognition and measurementProperty, plant and equipment (excluding land and buildings) are stated at cost less accumulated depreciation and impairment
losses. Cost includes expenditures that are directly attributable to the acquisition of the asset. The cost of self-constructed assets
includes the cost of materials, any other costs directly attributable to bringing the asset to a working condition for its intended use
and the costs of dismantling and removing the items and restoring the site on which they are located.
Where parts of an item of property, plant and equipment have different useful lives, they are accounted for as separate items (major
components) of property, plant and equipment.
DepreciationWith the exception of freehold land and development assets, depreciation is recognised in the profit and loss on a straight-line basis
over the estimated useful lives of the specific assets as follows:
Land: not depreciated
Building: over 20 years
Plant and equipment: 5 to 15 years
Leased equipment: over 8 to 10 years
The assets’ residual values, useful lives and amortisation methods are reviewed, and adjusted if appropriate, at each financial
year end.
50
Note 2 – Summary of significant accounting policies (continued)(l) Investment properties (including investment properties undergoing development)Initially, investment properties are measured at cost including all transaction costs. Subsequent to initial recognition the
investment property is stated at fair value at each reporting date. The fair value represents the amount at which the assets could
be exchanged between a knowledgeable willing buyer and a knowledgeable willing seller in an arm’s length transaction at the
date of the valuation.
Independent valuations of investment properties are obtained at least once every two years from suitably qualified valuers, unless
the Directors determine that a valuation is to be obtained in the intervening period. At each reporting date between obtaining
independent valuations, internal valuations are prepared. The valuations have been completed in accordance with AASB 140
Investment Property and the fair value definitions. The Directors of the Responsible Entity make reference to the independent and
internal valuations when assessing the fair value of investment properties at each reporting date. Where the carrying value differs
from fair value, that asset is adjusted to its fair value with gains or losses arising from changes in the fair values of investment
properties recognised in profit or loss in the year in which they arise.
In determining fair value, the capitalisation (market yield), discounted cash flow and direct comparison methods have been used
for properties in Australia. These methods are based upon assumptions and judgement in relation to future rental income, property
capitalisation rate, risk adjusted discount rate or estimated yield and make reference to market evidence of transaction prices for
similar properties. For properties in France, the term and reversion approach has been used and 6.2% transfer costs has been
allowed for when determining the fair value.
Expenditure capitalised to properties includes the cost of acquisition, capital and refurbishment additions, and during development
includes financing charges, related professional fees incurred and other directly attributable transaction costs.
Investment properties are derecognised when they have either been disposed of or when the investment is permanently withdrawn
from use and no future benefit is expected at its disposal. Any gains or losses on the derecognition of an investment property are
recognised in the income statement in the period of derecognition.
Investment properties are categorised as investment properties under development if no rental income is being earned from the
investment property and the site is undergoing or will undergo development activity.
(m) LeasesLeases are classified as either operating leases or finance leases at the date of inception of the lease.
A distinction is made between finance leases which effectively transfer from the lessor to the lessee substantially all of the risks and
benefits incident to ownership of leased assets, and operating leases under which the lessor effectively retains substantially all such
risks and benefits.
Operating leasesCDI and CDI2 as lesseeOperating lease payments are recognised as an operating expense in the income statement on a straight-line basis over the
lease term.
CDI as lessorLeases where the lessor retains substantially all the risk and benefits of ownership are classified as operating leases. Initial direct costs
incurred in negotiating an operating lease are added to the carrying amount of the leased asset and recognised as an expense over
the term of the lease on the same basis as the lease income.
Incentives may be provided to tenants to enter into an operating lease. These incentives may be in the form of cash, rent-free
periods and lessee or lessor owned fit outs. The incentive is amortised over the term of the lease as a reduction in rental income.
The unamortised carrying amount of the incentive is reflected in the carrying value of the investment property.
Leasing fees that are directly associated with the negotiation and execution of a lease agreement (including commissions, legal fees
and costs of preparing and processing documentation) are capitalised as part of the carrying value of the property and recognised as
an expense over the lease term, on the same basis as rental income.
Notes to the financial statements (continued)For the year ended 30 June 2012

Challenger Diversified Property Group Annual Report 2012
51
(n) Goods and services tax (GST)Revenue, expenses and assets (with the exception of receivables) are recognised net of the amount of GST to the extent that
the GST is recoverable from the Australian Taxation Office. Where GST is not recoverable, it is recognised as part of the cost of
acquisition of the asset, or as an expense, as applicable.
Receivables and payables are stated inclusive of GST. The net amount of GST recoverable from, or payable to the Australian Taxation
Office is included in the balance sheet as a receivable or payable.
Cash flows are included in the cash flow statement on a gross basis. The GST component of cash flows arising from investing and
financing activities, which is recoverable from, or payable to, the taxation authority are classified as operating cash flows.
(o) Borrowing costsBorrowing costs are recognised as an expense in the period in which they are incurred except for borrowing costs that are directly
attributable to the acquisition, construction or production of qualifying assets, which are assets that necessarily take a substantial
period of time to get ready for their intended use or sale. Such borrowing costs are capitalised as part of the cost of that asset.
Where borrowings are not directly attributable to an asset, a weighted average capitalisation rate is calculated which includes
interest on AUD borrowings, interest on AUD swaps, and establishment, agency and commitment fees. Investment income earned
on the investment of specific borrowings pending their expenditure on qualifying assets is deducted from the borrowing costs
eligible for capitalisation.
Debt establishment costs not capitalised to a qualifying asset are amortised as an expense over the term of the debt facility to which
they relate.
(p) Trade and other payablesTrade and other payables are carried at amortised cost and due to their short-term nature they are not discounted. They represent
liabilities for goods and services provided prior to the end of the financial year that are unpaid and arise when CDI and CDI2 become
obliged to make future payments in respect of the purchase of the goods and services.
(q) Interest bearing loans and borrowingsAll loans and borrowings are initially measured at fair value less directly attributable transaction costs.
After initial recognition, interest bearing loans and borrowings are subsequently measured at amortised cost using the effective
interest method. Amortised cost is calculated by taking into account any issue costs, and any discount or premium on settlement.
Gains and losses are recognised in the income statement when the liabilities are derecognised or impaired.
(r) Contributed equityIssued and paid up capital is recognised at the fair value of the consideration received.
Transaction costs arising on the issue or buy-back of ordinary units are recognised directly in equity as a reduction of
contributed equity.
(s) Earnings per unit (EPU)Basic EPU is calculated as net profit attributable to ordinary equity holders of the parent entity, divided by the time weighted average
number of ordinary units. Diluted EPU is calculated as net profit attributable to ordinary equity holders of the parent entity divided
by the weighted average number of ordinary units adjusted for the effects of all dilutive potential ordinary units.
(t) Segment reportingOperating segments have been determined based on the reports reviewed by CDI’s and CDI2’s Manager (CMSL represented by the
CDI Fund Manager and Head of Real Estate) that are used to make strategic decisions.
The Manager considers CDI’s Australian assets by asset class being: office, retail, industrial and car park operating business. Assets
held in France are considered to be a separate segment.
Based on the reports reviewed by the Manager it has been determined that CDI2 has a single operating segment. CDI2 operates
entirely within Australia, operating a car park business.
(u) Significant accounting judgements, estimates and assumptionsThe carrying amounts of certain assets and liabilities are often determined based on estimates and assumptions of future events.
Other than the estimation of fair values described in Note 16 (investment properties under development), Note 17 (investment
property) and Note 26 (financial instruments) and the process for determining fair value of investment properties as described
in Note 2(l), impairment of assets in Note 2(v) and derivative financial instruments in Note 2(w) there are no key estimates and
assumptions that have a significant risk of causing a material adjustment to the carrying amounts of the Group’s assets and liabilities
within the next annual reporting period.

52
Note 2 – Summary of significant accounting policies (continued)(v) Impairment of assetsAt each reporting date an assessment is made as to whether there is an indication that an asset may be impaired. If any such
indication exists, or when annual impairment testing for an asset is required, an estimate of the asset’s recoverable amount is made.
An asset’s recoverable amount is the higher of its fair value less costs to sell and its value in use and is determined for an individual
asset, unless the asset does not generate cash inflows that are largely independent of those from other assets or groups of assets
and the asset’s value in use cannot be estimated to be close to its fair value. In such cases the asset is tested for impairment as
part of the cash-generating unit to which it belongs. When the carrying amount of an asset or cash-generating unit exceeds its
recoverable amount, the asset or cash-generating unit is considered impaired and is written down to its recoverable amount.
In assessing value in use, the estimated future cash flows are discounted to their present value using a discount rate that reflects
current market assessments of the time value of money and the risks specific to the asset. Impairment losses relating to continuing
operations are recognised in those expense categories consistent with the function of the impaired asset.
An assessment is also made at each reporting date as to whether there is any indication that previously recognised impairment losses
may no longer exist or may have decreased. If such indication exists, the recoverable amount is estimated. A previously recognised
impairment loss is reversed only if there has been a change in the estimates used to determine the asset’s recoverable amount
since the last impairment loss was recognised. If that is the case the carrying amount of the asset is increased to its recoverable
amount. That increased amount cannot exceed the carrying amount that would have been determined, net of depreciation, had
no impairment loss been recognised for the asset in prior years. Such reversal is recognised in profit or loss. After such a reversal
the depreciation charge is adjusted in future periods to allocate the asset’s revised carrying amount, less any residual value, on a
systematic basis over its remaining useful life.
(w) Derivative financial instruments and hedgingCDI uses derivative financial instruments such as foreign currency contracts and interest rate swaps to hedge its risks associated with
foreign currency and interest rate fluctuations. Such derivative financial instruments are initially recognised at fair value on the date
on which a derivative contract is entered into and are subsequently remeasured to fair value. Derivatives are carried as assets when
their fair value is positive and as liabilities when their fair value is negative.
Any gains or losses arising from changes in the fair value of derivatives, except for those that qualify as effective cash flow hedges,
are taken directly to the income statement.
The fair value of forward exchange and interest rate contracts is calculated by an internal investment management system which
generates a fair market value based on market source data. The fair market value is compared to the counterparty valuation. The fair
value of interest rate swap contracts is determined by reference to the market for similar instruments.
For the purposes of hedge accounting, hedges are classified as either fair value hedges when they hedge the exposure to changes
in the fair value of a recognised asset or liability; or cash flow hedges where they hedge exposure to variability in cash flows that is
either attributable to a particular risk associated with a recognised asset or liability or a forecasted transaction.
In relation to cash flow hedges to hedge firm commitments which meet the conditions for hedge accounting, the portion of the
gain or loss on the hedging instrument that is determined to be an effective hedge is recognised directly in equity and the ineffective
portion is recognised in the income statement.
CDI has elected not to undertake the hedge accounting treatment available under AASB 139 for its derivative financial instruments
and recognises any changes in fair value of derivatives directly through its income statement. However, as described in Note 2(x),
CDI has adopted hedge accounting for foreign currency borrowings that provide a hedge against a net investment in a foreign entity.
(x) Foreign currency translationTranslation of foreign currency transactionsThe functional and presentation currency of CDI and CDI2 is the Australian dollar.
Transactions in foreign currencies are initially recorded in the functional currency at the exchange rate ruling at the date of the
transaction. Monetary assets and liabilities denominated in foreign currencies are retranslated at the rate of exchange ruling at the
balance sheet date.
All differences in the consolidated financial report are taken to the income statement with the exception of the net investment
in the foreign entity and differences on foreign currency borrowings that provide a hedge against a net investment in a foreign
entity. These are taken directly to equity until the disposal of the net investment, at which time they are recognised in the
income statement.
Notes to the financial statements (continued)For the year ended 30 June 2012

Challenger Diversified Property Group Annual Report 2012
53
A non-monetary item that is measured in terms of historical cost in a foreign currency is translated using the exchange rate at the
date of the transaction.
A non-monetary item that is measured at fair value in a foreign currency is translated using the exchange rates at the date when the
fair value was determined.
Translation of financial reports of overseas operationsAs at the reporting date, the assets and liabilities of overseas subsidiaries are translated into the presentation currency of CDI at the
rate of exchange ruling at the balance sheet date and the income statements are translated at the weighted average exchange rates
for the year. The exchange differences arising on the retranslation are taken directly to the foreign currency translation reserve.
On disposal of a foreign entity, the deferred cumulative amount recognised in equity relating to that particular foreign operation
shall be recognised in the income statement.
Exchange rates usedThe following exchange rates are used in translating foreign currency transactions, balances and financial statements:
30 June 2012 30 June 2011 EUR EUR
Weighted average exchange rate 0.7722 0.7252
Spot rate at balance date 0.8077 0.7384
Note 3 – Financial risk managementCDI’s activities expose it to a variety of financial risks:
• marketrisk(includingcurrencyriskandinterestraterisk);
• creditrisk;and
• liquidityrisk.
The Responsible Entity believes that the management of financial risks is fundamental to CDI’s and CDI2’s operations and to
building unitholder value. The Board is responsible for risk management strategy and management is responsible for implementing
the Board’s strategy and for developing policies and procedures to identify, manage and mitigate risks across CDI’s and CDI2’s
operations. Financial risk is managed collectively across CDPT1, CDPT2 and their controlled entities.
The Responsible Entity as a subsidiary of Challenger Limited (CGF) is subject to periodic review by the CGF internal audit function.
The Board has adopted the CGF Operational Risk Framework and formal policies in respect of compliance and operational risk
management. Risks at the Responsible Entity, CDI and CDI2 level are managed through the CGF Operational Risk Framework
and include:
• regulatoryandreportingrisks;
• financialrisks(suchasliquidity,interestrate,currencyandinvestment);
• legalrisks(suchascontractenforceabilityandcovenants);
• operationalrisks(suchaspeople,processes,infrastructureandtechnology);and
• reputationrisk(suchasinvestorrelationsandmediamanagement).
At the time of approving the financial statements of CDI and CDI2, the Board requires representation letters from management
addressing risk management and internal compliance and controls relevant to risk.
Exposure to credit, liquidity, interest rate and currency risks arise in the normal course of business. Derivative financial instruments
are used by CDI to hedge exposures to fluctuations in foreign exchange rates and in interest rates. Instruments used include forward
foreign exchange contracts and interest rate swap contracts.
Financial risks impact the financial assets and liabilities of CDI and CDI2. Principal financial instruments, other than derivatives,
comprise cash and cash equivalents, receivables, payables and interest bearing liabilities.
Details of the significant accounting policies and methods adopted, including the criteria for recognition, the basis of measurement
and the basis on which income and expenses are recognised, in respect of each class of financial instruments are disclosed in Note 2.

54
Note 3 – Financial risk management (continued)(a) Market riskMarket risk is the risk that the fair value or future cash flows of a financial instrument will fluctuate because of changes in market
factors. Market risk comprises (amongst others) various types of risk including interest rate risk (due to fluctuations in interest rates)
and currency risk (due to fluctuations in foreign exchange rates).
(i) Currency riskCDI’s exposure to foreign currency risk relates primarily to revenue, expenses, investment properties, borrowings, other assets and
other liabilities that are denominated in Euros. CDI manages these exposures by borrowing in foreign currency to implement a
natural capital hedge.
Natural capital hedgeCDI has a policy to implement a natural capital hedge of 100% of investments in foreign currency denominated assets by borrowing
in the same foreign currency to insulate against movements in exchange rates, both favourable and unfavourable. At 30 June 2012,
CDI has naturally hedged 101% (2011: 96%) of its foreign currency exposure.
(ii) Interest rate riskInterest rate risk is the risk to earnings arising from movements in interest rates, including changes in the absolute levels of interest
rates, the shape of the yield curve, the margin between the different yield curves and the volatility of interest rates.
Financial instruments with floating rate interest expose CDI and CDI2 to cash flow interest rate risk.
It is CDI’s policy to manage the impact of interest rate movements on its debt servicing capacity, profitability and business
requirements by entering into interest rate derivatives.
The purpose of using derivative financial instruments is to minimise financial risk from movements in interest rates. CDI’s exposure to
interest rate risk arises predominantly from liabilities bearing variable interest rates.
Hedging activity is performed using interest rate swaps. A swap transaction obliges the two parties to the contract to exchange a
series of cash flows at specified intervals known as payment or settlement dates.
CDI’s policy is to enter into interest rate derivatives to effectively hedge a minimum of 60% of its expected borrowings from exposure
to movements in interest rates. These derivative instruments are fair valued with changes recognised in the income statement.
At 30 June 2012, CDI has entered into interest rate derivatives to effectively hedge 68% (2011: 83%) of its expected debt exposure
to movements in interest rates. The contracts require settlement of net interest receivable or payable on a quarterly basis.
(b) Credit riskCredit risk is the risk that one party to a financial instrument will cause financial loss to the other party by failing to discharge an
obligation. CDI and CDI2 aim to ensure that at all times they have appropriate credit risk management in place and that the Board
and senior management are appropriately informed of the Group’s credit risks.
The approach to credit management utilises a credit risk framework to ensure that the following principles are adhered to:
• independencefromthefundmanager;
• appropriatesegregationpracticesareinplacetoavoidconflictsofinterest;
• creditexposuresarecontrolledandmonitored;
• creditexposuresareregularlyreviewedinaccordancewithcreditprocedures;and
• creditpersonnelareappropriatelyqualifiedandexperienced.
CDI and CDI2 make primary use of both external and internal ratings. Internal ratings are expressed on the basis of S&P rating
definitions. Where an external rating is available (predominantly from Standard & Poor’s, Moody’s or Fitch), the internal rating should
ordinarily be no greater than the lowest external rating assigned.
The credit risk in respect of derivative transactions is mitigated by entering into trades with counterparties with A rating or above.
Notes to the financial statements (continued)For the year ended 30 June 2012

Challenger Diversified Property Group Annual Report 2012
55
Concentration of credit risk in relation to trade receivables is minimised by providing leases to a number of different tenants who are
considered creditworthy third parties. It is CDI’s and CDI2’s policy that all customers who wish to trade on credit terms are subject
to credit verification procedures. In addition, rent receivable balances are monitored on an ongoing basis to ensure the Group’s
exposure to bad debts is managed through normal payment terms and review of any rental in arrears.
(c) Liquidity riskLiquidity risk is the risk that an entity will encounter difficulty in raising funds to meet cash commitments associated with financial
instruments. This may result from either the inability to recover or settle financial assets at their face values or at all; or a counterparty
failing on repayment of a contractual obligation; or the inability to generate cash inflows as anticipated.
CDI and CDI2 aim to ensure that they have sufficient liquidity to meet their obligations on a short-term and medium-term basis. In
setting the level of sufficient liquidity, consideration is made for new asset purchases and equity origination in addition to current
contracted obligations. In summary, CDI and CDI2 consider minimum cash requirements; cash flow forecasts; acquisition and
disposal pipeline; and cash mismatches by maturity.
Note 4 – Operating business CDI CDI CDI2 CDI2 30 June 2012 30 June 2011 30 June 2012 30 June 2011 $’000 $’000 $’000 $’000
Rent paid under operating lease (3,303) (3,039) (3,485) (3,039)
Rates and property related taxes (1,825) (1,703) (1,825) (1,703)
Maintenance, repairs and other property expenses (929) (1,260) (1,191) (1,260)
Property management fees (226) (243) (226) (243)
Depreciation (240) (27) (13) (27)
Total operating business expenses (6,523) (6,272) (6,740) (6,272)
Note 5 – Interest income and finance costs CDI CDI CDI2 CDI2 30 June 2012 30 June 2011 30 June 2012 30 June 2011 $’000 $’000 $’000 $’000
Interest income on bank deposits 497 396 109 188
Interest and loan amortisation costs paid or payable (16,567) (10,506) (1,018) (1,643)
Less:
Interest capitalised to property, plant and equipment 293 – 86 –
Interest capitalised to investment properties under development 2,817 1,894 – –
Interest capitalised to investment properties being redeveloped 144 – – –
Finance costs (13,313) (8,612) (932) (1,643)
Net interest income/finance costs (12,816) (8,216) (823) (1,455)
Capitalisation rate
The rate used to capitalise finance costs to qualifying assets was 7.55% 6.54% 7.72% –

56
Note 6 – Property related expenses CDI CDI CDI2 CDI2 30 June 2012 30 June 2011 30 June 2012 30 June 2011 $’000 $’000 $’000 $’000
Rates and property related taxes (4,533) (4,737) – (30)
Maintenance, repairs and other property expenses (12,229) (10,835) – (26)
Property management fees (2,026) (1,758) – (6)
Insurance expense (578) (549) – (16)
Total property related expenses (19,366) (17,879) – (78)
Note 7 – Operating expenses CDI CDI CDI2 CDI2 30 June 2012 30 June 2011 30 June 2012 30 June 2011 $’000 $’000 $’000 $’000
Consultant and legal fees (1,017) (1,220) – (13)
Auditor’s remuneration (215) (236) – –
Accounting and company secretarial – European entities (214) (207) – –
Valuation fees (209) (181) – –
Trust investor relations, ASX and registry fees (412) (380) – (1)
Total operating expenses (2,067) (2,224) – (14)
Note 8 – Income tax CDI CDI CDI2 CDI2 30 June 2012 30 June 2011 30 June 2012 30 June 2011 $’000 $’000 $’000 $’000
(a) Income tax credit
Current income tax credit/(expense) (30) (18) – –
Deferred income tax credit/(expense) 626 (777) 626 (777)
Income tax credit 596 (795) 626 (777)
(b) Reconciliation of income tax credit
Profit/(loss) before income tax 35,555 52,283 2,886 2,239
Tax at 30% (10,667) (15,685) (866) (672)
Tax effect of non-assessable/deductible amounts 11,263 14,890 1,492 (105)
Income tax credit 596 (795) 626 (777)
(c) Recognised deferred tax asset
Opening balance 210 987 210 987
Movements 626 (777) 626 (777)
Deferred tax asset 836 210 836 210
Straight-line of rent expense 69 210 69 210
Carried forward tax losses 767 – 767 –
Deferred tax asset 836 210 836 210
(d) Tax lossesCDI and CDI2 have Australian income tax losses, for which a deferred tax asset is recognised on the balance sheet, which are
available indefinitely for offset against future taxable income subject to continuing to meet relevant statutory tests.
Notes to the financial statements (continued)For the year ended 30 June 2012

Challenger Diversified Property Group Annual Report 2012
57
Note 9 – Earnings per unitBasic earnings per stapled security is calculated using the profit attributable to the ordinary unitholders of the parent entity and the
time weighted average number of ordinary stapled units outstanding during the year.
The following reflects the income and unit data used in the calculations of basic and diluted earnings per unit computations:
CDI CDI CDI2 CDI2 30 June 2012 30 June 2011 30 June 2012 30 June 2011
Basic and diluted earnings per ordinary unit (cents) 3.69 5.48 0.40 0.16
Net profit/(loss) attributable to unitholders of the parent entity ($’000) 32,639 50,026 3,512 1,462
Weighted average number of securities (basic and diluted) (‘000) 884,927 912,688 884,927 912,688
Note 10 – Cash and cash equivalentsFor the purposes of the cash flow statement, cash and cash equivalents comprise the following at year end:
CDI CDI CDI2 CDI2 30 June 2012 30 June 2011 30 June 2012 30 June 2011 $’000 $’000 $’000 $’000
Cash at bank and on hand 2,923 2,716 316 890
(a) Reconciliation of operating profit to the net cash flows from operations
CDI CDI CDI2 CDI2 30 June 2012 30 June 2011 30 June 2012 30 June 2011 $’000 $’000 $’000 $’000
Net profit/(loss) after tax 36,151 51,488 3,512 1,462
Non-cash items:
Fair value movement of derivatives held at the end of the year 10,081 (1,276) – –
Fair value movement of investment properties held at the end of the year 655 (2,418) – –
Unrealised foreign exchange (gain)/loss 374 173 – –
Straight-lining of rental (income)/expense (2,894) (2,188) (468) 76
Property, plant and equipment depreciation 240 27 13 27
Amortisation of borrowing costs 805 287 – –
Net (gain)/loss on development property – (2,501) – (2,501)
Deferred tax credit (626) 777 (626) 777
Movement in deferred leasing and tenancy costs (1,709) (782) – –
Gain on transfer of property, plant and equipment – – (2,112) –
Fair valuation of loan from related party – – (729) –
Classified as investing or financing activities:
Fair value movement of investment properties sold during the year 770 253 – –
Change in assets and liabilities
Decrease/(increase) in trade and other receivables 688 (387) (409) (219)
(Increase)/decrease in other assets (963) 776 (131) 275
(Decrease)/increase in trade and other payables (3,886) 2,092 74 (522)
(Decrease)/increase in income tax payable 27 (19) – –
Net cash flows from operating activities 39,713 46,302 (876) (625)
(b) Disclosure of financing facilitiesRefer to Note 20, interest bearing liabilities.

58
Note 11 – Trade and other receivables CDI CDI CDI2 CDI2 30 June 2012 30 June 2011 30 June 2012 30 June 2011 $’000 $’000 $’000 $’000
Trade receivables 1 461 1,133 – 10
Accrued income 141 55 – –
Litigation proceeds receivable 2 – 2,800 – 2,800
Other receivables 388 366 126 287
Total trade and other receivables 990 4,354 126 3,097
1 Trade receivables are non-interest bearing. A provision for impairment loss is recognised when there is objective evidence that a receivable is impaired. There was an impairment loss of $0.1 million (2011: $0.27 million) on trade debtors in CDI during the financial year.
2 The litigation proceedings related to 13 Cooper Street Smithfield, and were against the guarantor for the developer for their failure to deliver their obligations under the development agreement. The settlement amount of $2.8 million was received and banked into CDI’s operating bank account on 6 July 2011.
Movements in the provision for impairment loss were as follows:
CDI CDI CDI2 CDI2 30 June 2012 30 June 2011 30 June 2012 30 June 2011 $’000 $’000 $’000 $’000
Opening balance (275) (367) – –
Change for the year 178 92 – –
Closing balance (97) (275) – –
Note 12 – Other assets CDI CDI CDI2 CDI2 30 June 2012 30 June 2011 30 June 2012 30 June 2011 $’000 $’000 $’000 $’000
Prepayments 1,732 808 147 15
Other – 38 – –
Total other assets 1,732 846 147 15
Note 13 – Investment property held for saleOn 30 August 2010, contracts were exchanged for the sale of Pacific Brands, and settlement occurred on 29 July 2011. The carrying
value of $13.2 million at 30 June 2011 was based on the sale price.
As at 30 June 2012, the French investment properties and Giffnock Avenue, North Ryde NSW were not classified as held for sale as
was done at 31 December 2011.
Note 14 – Other financial assets CDI CDI CDI2 CDI2 30 June 2012 30 June 2011 30 June 2012 30 June 2011 $’000 $’000 $’000 $’000
Current
Cash on deposit1 2,537 – – –
Non-current
Cash on deposit1 69 3,062 – 2,936
Total other assets 2,606 3,062 – 2,936
1 Cash on deposit are restricted funds that require certain conditions to be met before they can be accessed.
Notes to the financial statements (continued)For the year ended 30 June 2012

Challenger Diversified Property Group Annual Report 2012
59
Note 15 – Property, plant and equipment CDI CDI CDI2 CDI2 30 June 2012 30 June 2011 30 June 2012 30 June 2011 $’000 $’000 $’000 $’000
Work in progress – at cost – 2,671 – 2,671
Installed and in use – at cost 12,186 224 – 224
Total property, plant and equipment1 12,186 2,895 – 2,895
Reconciliation of carrying amount
Carrying amount at beginning of year 2,895 2,562 2,895 2,562
Additions 9,238 360 5,823 360
Interest capitalised to property, plant and equipment 2 293 – 86 –
Depreciation (240) (27) (13) (27)
Sale of property, plant and equipment – – (8,791) –
Carrying amount at end of year 12,186 2,895 – 2,895
1 Property, plant and equipment relates to capital expenditure at the Domain Car Park. Further details relating to capital commitments are set out in the commitments and contingencies note (Note 30(b)).
2 The average annual capitalisation rate used to capitalise interest was 7.55% (2011: 6.54%).
Note 16 – Investment properties under development CDI CDI CDI2 CDI2 30 June 2012 30 June 2011 30 June 2012 30 June 2011 $’000 $’000 $’000 $’000
Investment property under development 6,800 18,500 – –
Reconciliation of carrying amount
Carrying amount at beginning of year 18,500 19,000 – –
Deferred leasing costs 244 –
Development expenditure 18,760 1,005 – –
Interest capitalised to investment properties under development 1 2,817 1,894 – –
Net gain/(loss) from fair value adjustments (1,463) (3,399) – –
Transfers to investment property on completion (32,058) – – –
Carrying amount at end of year 6,800 18,500 – –
1 The average annual capitalisation rate used to capitalise interest was 7.55% (2011: 6.54%).

60
Note 17 – Investment property CDI CDI CDI2 CDI2 30 June 2012 30 June 2011 30 June 2012 30 June 2011 $’000 $’000 $’000 $’000
Investment properties at fair value 851,964 828,792 – –
Reconciliation of carrying amount
Carrying amount at beginning of year 828,792 761,061 – –
Acquisitions – 85,699 – –
Redevelopment and restructuring expenditure 8,949 925 – –
Interest capitalised to investment property being redeveloped 1 144 – – –
Maintenance capital expenditure 3,206 3,716 – –
Straight-lining of rent 2,424 2,264 – –
Deferred leasing incentives and costs 5,079 841 – –
Fair value movement of investment properties 808 5,817 – –
Disposals (24,777) (14,596) – –
Transfer to non-current assets held for sale – (13,200) – –
Transfers from investment properties under development 32,058 – – –
Foreign currency translation differences (4,719) (3,735) – –
Carrying amount at end of year 851,964 828,792 – –
1 The average annual capitalisation rate used to capitalise interest was 7.55%.
Notes to the financial statements (continued)For the year ended 30 June 2012

Challenger Diversified Property Group Annual Report 2012
61
Market CDI Market CDI Director/ capitalisation Discount Carrying capitalisation Discount Carrying CDI Valuation independent rate rate value rate rate value ownership date valuer 30 June 2012 30 June 2012 30 June 2012 30 June 2011 30 June 2011 30 June 2011 % % % $’000 % % $’000
AustraliaOffice
ABS House, Belconnen, ACT 60 30-Jun-12 M3 Property 8.25 9.25 87,600 7.75 9.00 88,800
31 Queen Street, Melbourne, VIC 100 30-Jun-12 M3 Property 8.00 9.50 91,000 8.00 9.50 86,500
DIAC Building, Belconnen, ACT 60 30-Jun-12 M3 Property 8.00 9.25 69,000 7.75 9.25 67,950
The Forum, Cisco, St Leonards, NSW 60 30-Jun-12 Director 8.25 9.50 63,060 8.35 9.50 61,920
Discovery House, Woden, ACT 60 30-Jun-12 Director 7.75 9.00 61,440 7.50 9.00 60,900
Makerston House, Brisbane, QLD 60 30-Jun-12 Director 8.50 9.75 45,120 8.63 9.25 42,360
The Forum, Verizon, St Leonards, NSW 60 30-Jun-12 Director 8.50 9.75 41,820 8.50 9.50 37,260
Elder House, Adelaide, SA 60 30-Jun-12 M3 Property 9.00 9.75 27,900 8.75 9.75 28,500
Executive Building, Hobart, TAS 60 30-Jun-12 Savills 8.75 9.50 20,400 8.75 9.25 20,400
Office total 8.21 9.42 507,340 8.07 9.30 494,590
Retail
Jam Factory, South Yarra, VIC 1 60 30-Jun-12 JLL 7.75 9.00 71,054 8.25 9.00 62,400
Century City Walk, Glen Waverley, VIC 100 30-Jun-12 Savills 8.50 9.50 30,000 8.50 9.00 30,000
Innaloo Cinema Centre, Innaloo, WA 60 30-Jun-12 JLL 8.00 9.25 25,500 8.00 10.25 24,600
Kings Langley, Kings Langley, NSW 60 30-Jun-12 Savills 8.75 9.75 9,360 8.75 9.75 9,420
Retail total 8.03 9.21 135,914 8.30 9.30 126,420
Industrial – Distribution Centres
The Junction, Stage 2, Enfield, NSW 2 100 30-Jun-12 Colliers 7.75 9.50 34,000 N/A N/A N/A
The Junction, Stage 1, Enfield, NSW 100 30-Jun-12 Director 8.50 9.50 20,400 8.25 9.50 20,750
6 Foray Street, Fairfield, NSW 100 30-Jun-12 Colliers 10.00 10.00 15,250 10.25 10.75 16,500
Spotlight, Laverton North, VIC 100 30-Jun-12 Director 8.25 9.75 17,300 8.75 9.75 14,750
12-30 Toll Drive, Altona North, VIC 100 30-Jun-12 Colliers 8.75 11.00 14,000 8.75 9.75 13,350
2-10 Toll Drive, Altona North, VIC 100 30-Jun-12 Director 8.75 9.75 6,400 8.65 9.75 6,200
1-9 Toll Drive, Altona North, VIC 100 30-Jun-12 Colliers 8.50 10.50 3,900 8.50 9.75 3,625
Industrial – High tech
Taylors House, Waterloo, NSW 60 30-Jun-12 Director 8.25 9.25 26,880 8.25 9.25 26,880
187 Todd Road, Port Melbourne, VIC 60 30-Jun-12 Director 9.50 10.00 13,560 9.50 10.00 13,890
Giffnock Avenue, North Ryde, NSW 100 30-Jun-12 Colliers 9.50 9.75 9,900 8.75 9.75 13,400
75 Talavera Road, North Ryde, NSW 3 60 30-Jun-12 N/A N/A N/A N/A 8.50 9.50 23,490
Industrial total 8.59 9.75 161,590 8.78 9.72 152,835
Total investment properties – Australia 8.26 9.45 804,844 8.25 9.38 773,845
1 As at 30 June 2012, the Jam Factory has been independently valued by JLL at $129.0 million (at 100%) as if the development is complete. The fair value recognised in the financial statements deducts costs to complete and a portion of incremental value associated with the completed development.
2 The development of The Junction Stage 2 reached practical completion on 2 July 2012, and was transferred from investment properties under development to investment property as at 30 June 2012. The lease to Bunzl Australasia Limited commenced on 1 July 2012.
3 On 31 March 2012, 75 Talavera Road, North Ryde was sold for $24.3 million (CDI’s 60% share).

62
Note 17 – Investment property (continued) Market CDI Market CDI Director/ capitalisation Discount Carrying capitalisation Discount Carrying CDI Valuation independent rate rate value rate rate value ownership date valuer 30 June 2012 30 June 2012 30 June 2012 30 June 2011 30 June 2011 30 June 2011 % % % $’000 % % $’000
France
Sully, Sully sur Loire 100 30-Jun-12 Knight Frank 9.20 N/A4 11,056 8.50 N/A4 14,450
Aulnay, Aulnay sous Bois, Paris 100 30-Jun-12 Knight Frank 6.25 N/A4 11,452 6.50 N/A4 11,936
Beziers, Villeneuve les Beziers 100 30-Jun-12 Knight Frank 8.25 N/A4 10,202 7.98 N/A4 12,093
Gennevilliers, Gennevilliers, Paris 100 30-Jun-12 Knight Frank 7.10 N/A4 8,963 7.21 N/A4 9,913
Tours, Parcay-Meslay, Tours 100 30-Jun-12 Knight Frank 8.65 N/A4 5,447 8.00 N/A4 6,555
Total investment properties – France 7.81 47,120 7.66 54,947
Total investment properties 8.23 851,964 8.21 828,792
4 In France, the primary valuation method used is the term and reversion method, as such a discount rate which is applied under the discount cash flow method is not relevant.
The carrying values of properties in Australia have been determined with reference to valuations using the market capitalisation,
discounted cash flow methods and direct comparison methods. The significant valuation assumptions were sourced from the latest
market evidence in the respective financial year.
As at the date of this report, the investment property portfolio occupancy rate was 94.1% (2011: 93.7%) with a weighted average
lease expiry of 5.0 years (2011: 5.0 years).
Note 18 – Trade and other payables CDI CDI CDI2 CDI2 30 June 2012 30 June 2011 30 June 2012 30 June 2011 Note $’000 $’000 $’000 $’000
Trade creditors and accruals 5,581 5,939 752 654
Capital expenditure accruals 8,193 1,949 – –
Deposit received on investment property sold 1 – 1,980 – –
Straight-lining of operating lease 230 698 230 698
Interest payable 2,517 1,744 – 582
Amount payable to related parties 27(f) 2,746 4,488 14 37
Rent paid in advance 826 428 – –
Tenant security deposits 712 744 – –
Total trade and other payables 20,805 17,970 996 1,971
1 The deposit received in advance related to the sale of Pacific Brands which was settled on 29 July 2011.
Non-current trade and other payables represent a facility issued by CDPT1 to CDPT2. From 23 December 2011 this facility is
non-interest bearing resulting in a fair value adjustment of $0.9 million being recorded in the income statement reducing the loan
from $5.2 million to $4.3 million. During the year ended 30 June 2012, repayments totalling $1.3 million were made against the
loan and $0.2 million was recognised as interest expense. Further details regarding this loan are disclosed in the related party note
(Note 27 (f)).
Notes to the financial statements (continued)For the year ended 30 June 2012

Challenger Diversified Property Group Annual Report 2012
63
Note 19 – Provision for distributionThe following distributions were paid or payable for the year ended 30 June 2012:
CDI CDI CDI2 CDI2 30 June 2012 30 June 2011 30 June 2012 30 June 2011 $’000 $’000 $’000 $’000
(a) Distributions declared and paid during the year to unitholders
Interim stapled distribution (2012: 2.05 cpu paid on 29 February 2012, 2011: 2.00 cpu paid on 28 February 2011) 18,119 18,269 – –
(b) Distributions proposed and recognised as a liability
Final stapled distribution (2012: 2.15 cpu payable on 30 August 2012, 2011: 2.00 cpu paid on 30 August 2011) 18,461 18,121 – –
Total distribution (2012: 4.20 cpu, 2011: 4.00 cpu) 36,580 36,390 – –
CDPT2 has not declared or paid a distribution to unitholders during the year (2011: Nil).
Note 20 – Interest bearing liabilities CDI CDI CDI2 CDI2 30 June 2012 30 June 2011 30 June 2012 30 June 2011 $’000 $’000 $’000 $’000
Current
Bank loans – secured – 51,597 – –
Bank loans – unsecured – 89,237 – –
– 140,834 – –
Non-current
Bank loans – secured 45,689 – – –
Bank loans – unsecured 197,992 85,747 – –
Loans payable to related parties 1 – – – 14,380
243,681 85,747 – 14,380
Total interest bearing liabilities 243,681 226,581 – 14,380
1 Loans payable to related parties represents facilities issued by CDPT1 to CDPT2 in relation to the Domain leasehold development and Smithfield development. From 23 December 2011 the remaining facility became non-interest bearing and has been transferred to trade and other payables (Note 18).
Financing facilities availableCDI has entered into a $300.0 million multi-option syndicated finance facility with Westpac Banking Corporation Limited (WBC)
and Commonwealth Bank of Australia Limited (CBA). The facility comprises three tranches with limits of $110 million, $100 million
and $90 million maturing on 20 July 2013, 2014 and 2015 respectively. For Australian denominated loans (2012: AUD 198.9 million,
2011: AUD 175.4 million), interest on the facility is calculated at the bank bill swap rate, plus a margin. For Euro denominated loans
(2012: EUR 36.9 million or AUD 45.7 million, 2011: EUR 38.1 million or AUD 51.6 million), interest on the facility is calculated at
EURIBOR, plus a margin. CDPT2 and Challenger Diversified Property Development Pty Limited (CDPD), entities forming part of the
stapled CDI group, are guarantors of the facility.
The loan facility comprises a secured component (2012: $45.7 million, 2011: $51.6 million) and an unsecured component
(2011: $198.9 million, 2011: $175.4 million). In relation to the unsecured component, CDI has not granted security over its properties
but provided a number of negative undertakings, including an undertaking not to create or allow encumbrance over its properties.
The secured component relates to the funding of property acquisitions in France. Security was granted by way of mortgages of
shares in, and of debts between, entities established to acquire the French properties.

64
Note 20 – Interest bearing liabilities (continued)Financing facilities available (continued)During December 2011, CDPT2 assigned the Domain Car Park leasehold interest to CDPT1 for a net consideration of $10.8 million.
As a result of this assignment one of the debt facility agreements between CDPT1 and CDPT2 has been fully repaid and terminated.
The remaining debt facility has been partially repaid and amended with net operating cash flow from the Domain Car Park directed
to repay this loan and no interest being charged.
At reporting date, the following financing facilities had been negotiated and were available:
CDI CDI CDI2 CDI2 30 June 2012 30 June 2011 30 June 2012 30 June 2011 $’000 $’000 $’000 $’000
Total facilities:
Interest bearing liabilities 300,000 260,714 – 39,000
Facilities used at reporting date:
Interest bearing liabilities 244,589 227,006 – 14,380
Facilities unused at reporting date:
Interest bearing liabilities 55,411 33,708 – 24,620
Finance facilities maturity profileThe following tables set out the carrying value, by maturity, of CDI’s outstanding financing facilities:
Weighted average effective <1 1-2 2-3 3-4 >4 interest CDI year years years years years Total rate Year ended 30 June 2012 $’000 $’000 $’000 $’000 $’000 $’000 %
Bank loans – 110,000 88,900 45,689 – 244,589 6.57
Facilities unused – – 11,100 44,311 – 55,411
Total facilities – 110,000 100,000 90,000 – 300,000
Weighted average effective <1 1-2 2-3 3-4 >4 interest CDI year years years years years Total rate Year ended 30 June 2011 $’000 $’000 $’000 $’000 $’000 $’000 %
Bank loans 141,106 57,500 28,400 – – 227,006 4.65
Facilities unused 4,608 – 29,100 – – 33,708
Total facilities 145,714 57,500 57,500 – – 260,714
Effective interest rate riskInformation regarding the effective interest rate risk of the interest bearing loans and borrowings is set out in Note 26,
financial instruments.
Notes to the financial statements (continued)For the year ended 30 June 2012

Challenger Diversified Property Group Annual Report 2012
65
Note 21 – Contributed equity CDI CDI CDI2 CDI2 30 June 2012 30 June 2011 30 June 2012 30 June 2011 $’000 $’000 $’000 $’000
Issued units opening balance 672,862 676,862 69 69
Ordinary units purchased and cancelled as part of CDI’s on-market buy-back – CDPT1 between $0.5217 and $0.5587 per unit, CDPT2 $0.0000 per unit – (3,993) – –
Ordinary units purchased and cancelled as part of CDI’s on-market buy-back – CDPT1 between $0.4781 and $0.5600 per unit, CDPT2 $0.0000 per unit (24,704) – – –
648,158 672,869 69 69
Costs associated with the issue of units/buy-back (51) (7) – –
Contributed equity closing balance 648,107 672,862 69 69
CDI CDI CDI2 CDI2 30 June 2012 30 June 2011 30 June 2012 30 June 2011 Number of Number of Number of Number of securities securities securities securities ’000 ’000 ’000 ’000
Ordinary units on issue at the beginning of the period 906,046 913,426 906,046 913,426
Ordinary units issued/(cancelled):
Under on-market buy-back (47,393) (7,380) (47,393) (7,380)
Total ordinary units on issue at the end of the year 858,653 906,046 858,653 906,046
All units are fully paid and ranked equally with each other in all respects.
Capital managementCDI and CDI2 manage capital to ensure that they will be able to continue as a going concern while maximising returns to unitholders
through the optimisation of debt and equity balances. Management also aims to maintain a capital structure that ensures the lowest
cost of capital available to each entity.
The capital structure of CDI and CDI2 consists of debt which includes borrowings disclosed in Note 20, cash and cash equivalents
disclosed in Note 10, issued capital disclosed in Note 21 and undistributed income and reserves disclosed in Note 22 and Note 23
respectively. Management reviews the capital structure regularly and balances its overall capital structure through payment of
distributions, new unit issues and unit buy-backs as well as the drawing of new debt or repayment of existing debt.
Swaps are utilised by CDI to minimise interest rate risk and Euro denominated debt and forward foreign exchange are used to
minimise currency risk exposure.
Management’s policy is to effectively manage cash flow from operating activities by using surplus cash to repay debt.
CDI’s debt facility documentation specifically includes the capability to drawdown funds for distribution and working capital
requirements.

66
Note 21 – Contributed equity (continued)Capital risk is monitored against policies, guidelines and externally imposed covenants1:
CDI policy 30 June 2012 30 June 2011
Gearing 2 Targeted balance sheet gearing limit of 25%-35% 28% 26%
Covenant gearing 1 To be less than 50% 33% 30%
Covenant interest cover 1 Greater than 2 times 3.72 5.22
Interest rate risk To effectively hedge the interest on a minimum of 60% of expected debt 68% 83%
Capital hedging
– Maintain a natural capital hedge against a minimum of 100% of the total value of assets invested offshore 101% 96%
1 During the current and prior financial year, the covenants under the borrowing facilities were complied with. As at 30 June 2012 CDI had $292 million and $28 million of headroom before breaching its gearing and interest cover ratios respectively.
2 Gearing is calculated by dividing total debt by total gross assets.
Note 22 – Undistributed income CDI CDI CDI2 CDI2 30 June 2012 30 June 2011 30 June 2012 30 June 2011 $’000 $’000 $’000 $’000
Balance at beginning of the year 14,468 11,368 30 189
Net profit/(loss) after income tax 36,151 51,488 3,512 1,462
Transfer (to)/from reserves 581 (11,998) (4,135) (1,621)
Distribution to unitholders (36,580) (36,390) – –
Balance at end of year 14,620 14,468 (593) 30
Notes to the financial statements (continued)For the year ended 30 June 2012
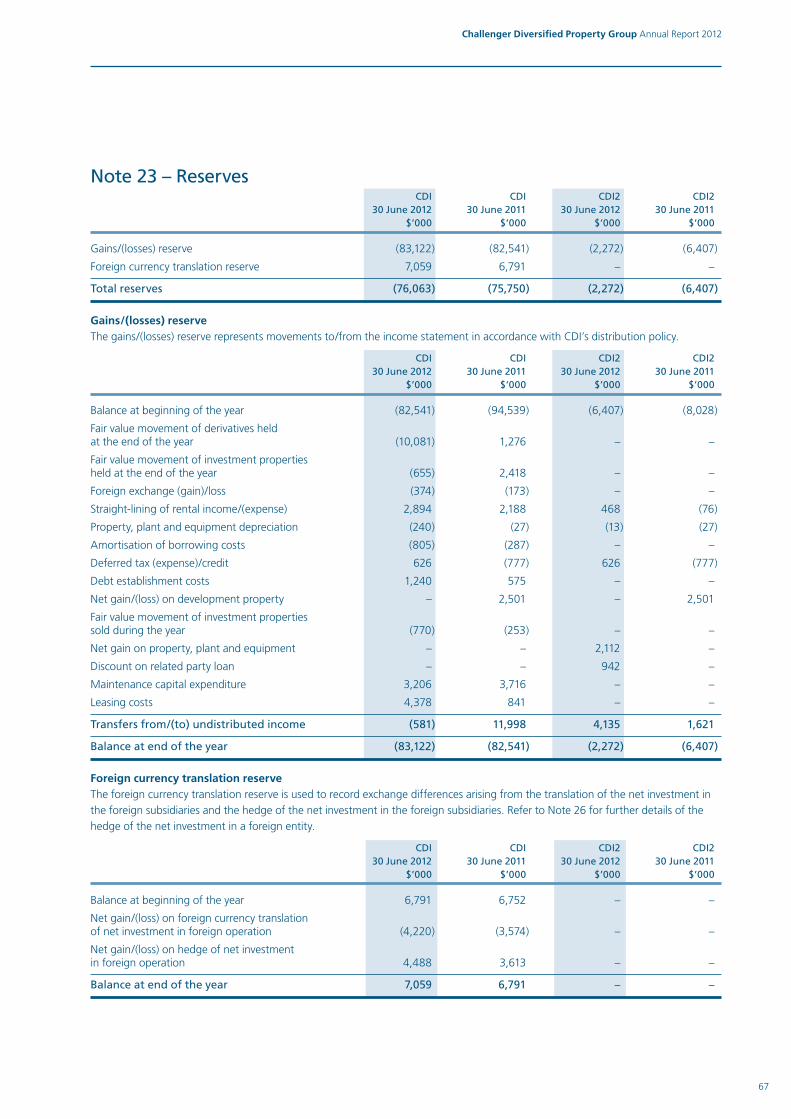
Challenger Diversified Property Group Annual Report 2012
67
Note 23 – Reserves CDI CDI CDI2 CDI2 30 June 2012 30 June 2011 30 June 2012 30 June 2011 $’000 $’000 $’000 $’000
Gains/(losses) reserve (83,122) (82,541) (2,272) (6,407)
Foreign currency translation reserve 7,059 6,791 – –
Total reserves (76,063) (75,750) (2,272) (6,407)
Gains/(losses) reserveThe gains/(losses) reserve represents movements to/from the income statement in accordance with CDI’s distribution policy.
CDI CDI CDI2 CDI2 30 June 2012 30 June 2011 30 June 2012 30 June 2011 $’000 $’000 $’000 $’000
Balance at beginning of the year (82,541) (94,539) (6,407) (8,028)
Fair value movement of derivatives held at the end of the year (10,081) 1,276 – –
Fair value movement of investment properties held at the end of the year (655) 2,418 – –
Foreign exchange (gain)/loss (374) (173) – –
Straight-lining of rental income/(expense) 2,894 2,188 468 (76)
Property, plant and equipment depreciation (240) (27) (13) (27)
Amortisation of borrowing costs (805) (287) – –
Deferred tax (expense)/credit 626 (777) 626 (777)
Debt establishment costs 1,240 575 – –
Net gain/(loss) on development property – 2,501 – 2,501
Fair value movement of investment properties sold during the year (770) (253) – –
Net gain on property, plant and equipment – – 2,112 –
Discount on related party loan – – 942 –
Maintenance capital expenditure 3,206 3,716 – –
Leasing costs 4,378 841 – –
Transfers from/(to) undistributed income (581) 11,998 4,135 1,621
Balance at end of the year (83,122) (82,541) (2,272) (6,407)
Foreign currency translation reserveThe foreign currency translation reserve is used to record exchange differences arising from the translation of the net investment in
the foreign subsidiaries and the hedge of the net investment in the foreign subsidiaries. Refer to Note 26 for further details of the
hedge of the net investment in a foreign entity.
CDI CDI CDI2 CDI2 30 June 2012 30 June 2011 30 June 2012 30 June 2011 $’000 $’000 $’000 $’000
Balance at beginning of the year 6,791 6,752 – –
Net gain/(loss) on foreign currency translation of net investment in foreign operation (4,220) (3,574) – –
Net gain/(loss) on hedge of net investment in foreign operation 4,488 3,613 – –
Balance at end of the year 7,059 6,791 – –
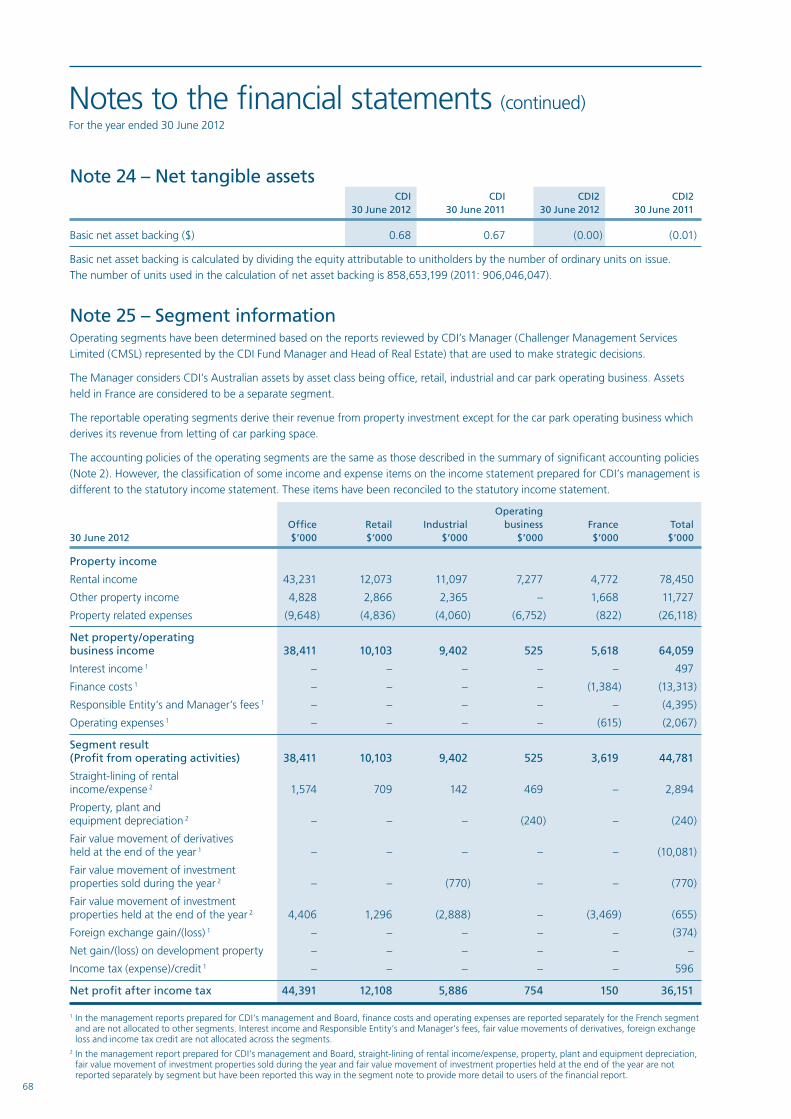
68
Note 24 – Net tangible assets CDI CDI CDI2 CDI2 30 June 2012 30 June 2011 30 June 2012 30 June 2011
Basic net asset backing ($) 0.68 0.67 (0.00) (0.01)
Basic net asset backing is calculated by dividing the equity attributable to unitholders by the number of ordinary units on issue.
The number of units used in the calculation of net asset backing is 858,653,199 (2011: 906,046,047).
Note 25 – Segment informationOperating segments have been determined based on the reports reviewed by CDI’s Manager (Challenger Management Services
Limited (CMSL) represented by the CDI Fund Manager and Head of Real Estate) that are used to make strategic decisions.
The Manager considers CDI’s Australian assets by asset class being office, retail, industrial and car park operating business. Assets
held in France are considered to be a separate segment.
The reportable operating segments derive their revenue from property investment except for the car park operating business which
derives its revenue from letting of car parking space.
The accounting policies of the operating segments are the same as those described in the summary of significant accounting policies
(Note 2). However, the classification of some income and expense items on the income statement prepared for CDI’s management is
different to the statutory income statement. These items have been reconciled to the statutory income statement.
Operating Office Retail Industrial business France Total 30 June 2012 $’000 $’000 $’000 $’000 $’000 $’000
Property income
Rental income 43,231 12,073 11,097 7,277 4,772 78,450
Other property income 4,828 2,866 2,365 – 1,668 11,727
Property related expenses (9,648) (4,836) (4,060) (6,752) (822) (26,118)
Net property/operating business income 38,411 10,103 9,402 525 5,618 64,059
Interest income 1 – – – – – 497
Finance costs 1 – – – – (1,384) (13,313)
Responsible Entity’s and Manager’s fees 1 – – – – – (4,395)
Operating expenses 1 – – – – (615) (2,067)
Segment result (Profit from operating activities) 38,411 10,103 9,402 525 3,619 44,781
Straight-lining of rental income/expense 2 1,574 709 142 469 – 2,894
Property, plant and equipment depreciation 2 – – – (240) – (240)
Fair value movement of derivatives held at the end of the year 1 – – – – – (10,081)
Fair value movement of investment properties sold during the year 2 – – (770) – – (770)
Fair value movement of investment properties held at the end of the year 2 4,406 1,296 (2,888) – (3,469) (655)
Foreign exchange gain/(loss) 1 – – – – – (374)
Net gain/(loss) on development property – – – – – –
Income tax (expense)/credit 1 – – – – – 596
Net profit after income tax 44,391 12,108 5,886 754 150 36,151
1 In the management reports prepared for CDI’s management and Board, finance costs and operating expenses are reported separately for the French segment and are not allocated to other segments. Interest income and Responsible Entity’s and Manager’s fees, fair value movements of derivatives, foreign exchange loss and income tax credit are not allocated across the segments.
2 In the management report prepared for CDI’s management and Board, straight-lining of rental income/expense, property, plant and equipment depreciation, fair value movement of investment properties sold during the year and fair value movement of investment properties held at the end of the year are not reported separately by segment but have been reported this way in the segment note to provide more detail to users of the financial report.
Notes to the financial statements (continued)For the year ended 30 June 2012

Challenger Diversified Property Group Annual Report 2012
69
Operating Office Retail Industrial business France Total 30 June 2011 $’000 $’000 $’000 $’000 $’000 $’000
Property income
Rental income 39,113 12,867 11,010 7,576 5,013 75,579
Other property income 3,954 2,483 1,879 – 1,214 9,530
Property related expenses (8,181) (5,206) (3,626) (6,169) (866) (24,048)
Net property/operating business income 34,886 10,144 9,263 1,407 5,361 61,061
Interest income 1 – – – – – 396
Finance costs 1 – – – – (2,592) (8,612)
Responsible Entity’s and Manager’s fees 1 – – – – – (6,268)
Operating expenses 1 – – – – (468) (2,224)
Segment result (Profit from operating activities) 34,886 10,144 9,263 1,407 2,301 44,353
Straight-lining of rental income/expense 2 1,732 449 83 (76) – 2,188
Property, plant and equipment depreciation 2 – – – (27) – (27)
Fair value movement of derivatives held at the end of the year 1 – – – – – 1,276
Fair value movement of investment properties sold during the year 2 – – (253) – – (253)
Fair value movement of investment properties held at the end of the year 2 2,841 536 (2,886) – 1,927 2,418
Foreign exchange gain/(loss) 1 – – – – – (173)
Net gain/(loss) on development property – – 2,501 – – 2,501
Income tax (expense)/credit 1 – – – – – (795)
Net profit after income tax 39,459 11,129 8,708 1,304 4,228 51,488
1 In the management reports prepared for CDI’s management and Board, finance costs and operating expenses are reported separately for the French segment and are not allocated to other segments. Interest income and Responsible Entity’s and Manager’s fees, fair value movements of derivatives, foreign exchange loss and income tax credit are not allocated across the segments.
2 In the management report prepared for CDI’s management and Board, straight-lining of rental income/expense, property, plant and equipment depreciation, fair value movement of investment properties sold during the year and fair value movement of investment properties held at the end of the year are not reported separately by segment but have been reported this way in the segment note to provide more detail to users of the financial report.
Profit from operating activities is calculated by taking ‘Net profit/(loss) after income tax’ per the income statement (herein referred to
as statutory net profit) and adjusting for the following items:
• straight-liningofrentalincome/expense;
• property,plantandequipmentdepreciationandimpairment;
• discountonrelatedpartyloan;
• fairvaluemovements;
• netgains/lossesondisposalofproperty,plantandequipment;
• foreignexchangegains/losses;
• incometaxcredit/expense;
• litigationproceeds;and
• otherone-offamountsoutsidethecoreoperatingbusiness.
The exclusion of these items provides a profit figure, which in management’s view is more closely aligned with the recurring net cash
earnings generated by CDI’s properties and operating business.

70
Note 25 – Segment information (continued)Below is a reconciliation of rental income on the segment note to rental income as shown on the income statement:
CDI CDI 30 June 2012 30 June 2011 $’000 $’000
Rental income per income statement 73,598 70,267
Net straight-lining of rental income (2,425) (2,264)
Income from operating business activities 7,277 7,576
Rental income per segment note 78,450 75,579
It has been determined that CDI2 has a single operating segment. CDI2 operates entirely within Australia, investing in a car park
operating business.
Total assets Operating Office Retail Industrial business France Total $’000 $’000 $’000 $’000 $’000 $’000
30 June 2012
Segment operating assets 508,728 136,175 169,141 16,348 47,354 877,746
Unallocated assets – – – – – 2,632
Total assets from continuing operations per balance sheet 880,378
30 June 2011
Segment operating assets 524,152 127,693 158,975 6,175 55,062 872,057
Unallocated assets – – – – – 4,244
Total assets from continuing operations per balance sheet 876,301
Major tenantsCDI receives approximately 31.9% (2011: 33.6%) of its revenue, equating to $27.7 million (2011: $28.3 million) from government
tenants which occupy office buildings within the Australian portfolio. No other tenants individually contribute more than 10% of
CDI’s revenue.
CDI2 currently receives the majority of its income from the car park operating business. The car park spaces are let to a number of
customers, all of which contribute less than 10% of the overall revenue.
Non-current assets by geographyThe geographic location of CDI’s non-current assets other than financial instruments and tax deferred assets is as follows:
30 June 2012 30 June 2011 $’000 $’000
Australia 823,830 795,240
Europe 47,120 54,947
Total non-current assets 870,950 850,187
Notes to the financial statements (continued)For the year ended 30 June 2012
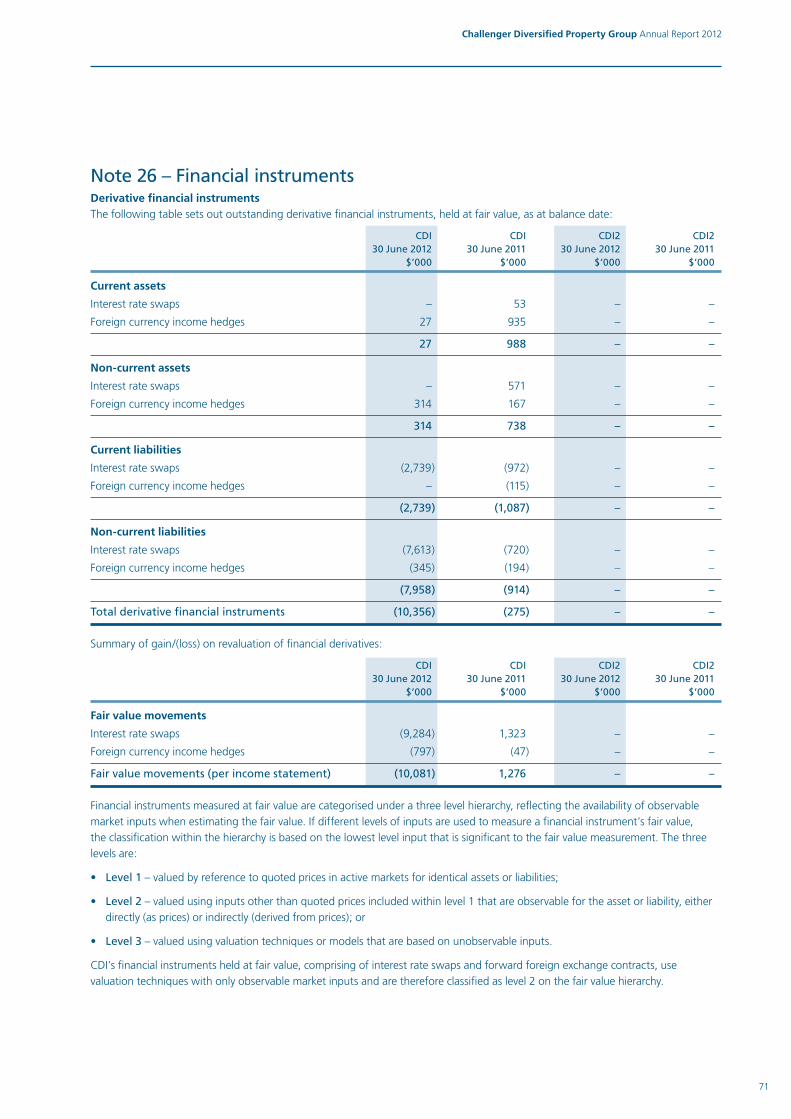
Challenger Diversified Property Group Annual Report 2012
71
Note 26 – Financial instrumentsDerivative financial instrumentsThe following table sets out outstanding derivative financial instruments, held at fair value, as at balance date:
CDI CDI CDI2 CDI2 30 June 2012 30 June 2011 30 June 2012 30 June 2011 $’000 $’000 $’000 $’000
Current assets
Interest rate swaps – 53 – –
Foreign currency income hedges 27 935 – –
27 988 – –
Non-current assets
Interest rate swaps – 571 – –
Foreign currency income hedges 314 167 – –
314 738 – –
Current liabilities
Interest rate swaps (2,739) (972) – –
Foreign currency income hedges – (115) – –
(2,739) (1,087) – –
Non-current liabilities
Interest rate swaps (7,613) (720) – –
Foreign currency income hedges (345) (194) – –
(7,958) (914) – –
Total derivative financial instruments (10,356) (275) – –
Summary of gain/(loss) on revaluation of financial derivatives:
CDI CDI CDI2 CDI2 30 June 2012 30 June 2011 30 June 2012 30 June 2011 $’000 $’000 $’000 $’000
Fair value movements
Interest rate swaps (9,284) 1,323 – –
Foreign currency income hedges (797) (47) – –
Fair value movements (per income statement) (10,081) 1,276 – –
Financial instruments measured at fair value are categorised under a three level hierarchy, reflecting the availability of observable
market inputs when estimating the fair value. If different levels of inputs are used to measure a financial instrument’s fair value,
the classification within the hierarchy is based on the lowest level input that is significant to the fair value measurement. The three
levels are:
• Level1 – valued by reference to quoted prices in active markets for identical assets or liabilities;
• Level2 – valued using inputs other than quoted prices included within level 1 that are observable for the asset or liability, either
directly (as prices) or indirectly (derived from prices); or
• Level3 – valued using valuation techniques or models that are based on unobservable inputs.
CDI’s financial instruments held at fair value, comprising of interest rate swaps and forward foreign exchange contracts, use
valuation techniques with only observable market inputs and are therefore classified as level 2 on the fair value hierarchy.
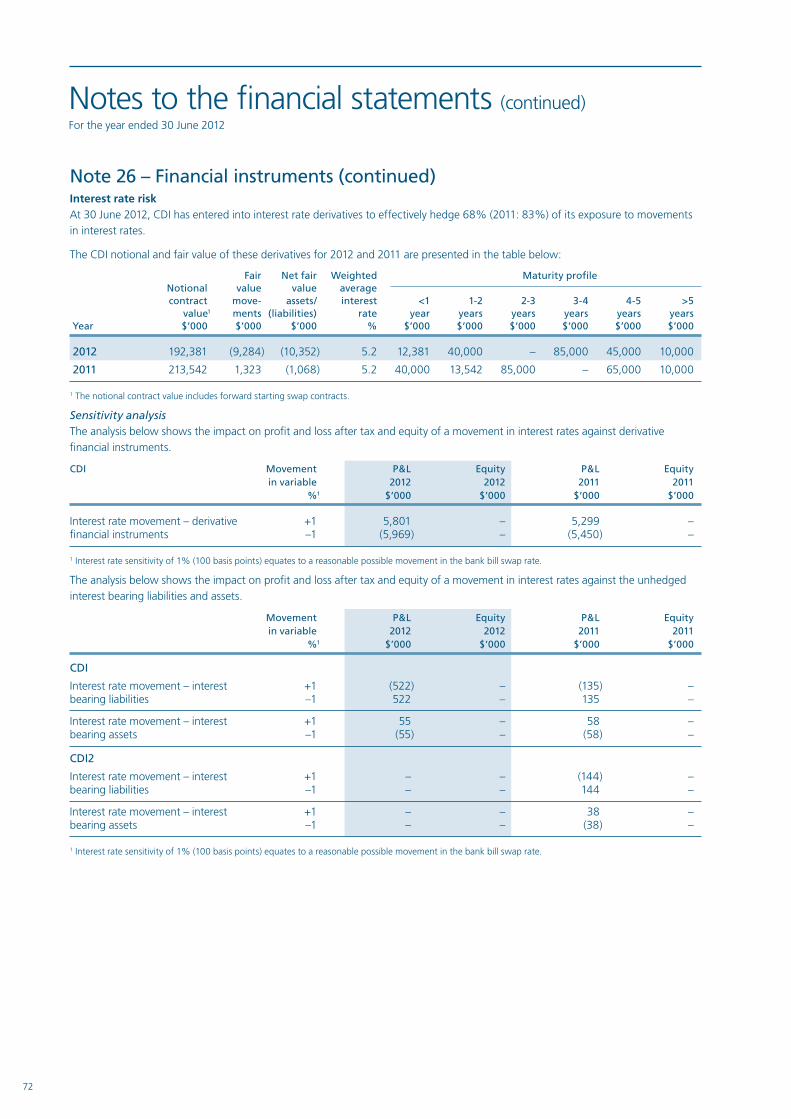
72
Note 26 – Financial instruments (continued)Interest rate riskAt 30 June 2012, CDI has entered into interest rate derivatives to effectively hedge 68% (2011: 83%) of its exposure to movements
in interest rates.
The CDI notional and fair value of these derivatives for 2012 and 2011 are presented in the table below:
Fair Net fair Weighted Maturity profile Notional value value average contract move- assets/ interest <1 1-2 2-3 3-4 4-5 >5 value1 ments (liabilities) rate year years years years years years Year $’000 $’000 $’000 % $’000 $’000 $’000 $’000 $’000 $’000
2012 192,381 (9,284) (10,352) 5.2 12,381 40,000 – 85,000 45,000 10,000
2011 213,542 1,323 (1,068) 5.2 40,000 13,542 85,000 – 65,000 10,000
1 The notional contract value includes forward starting swap contracts.
Sensitivity analysisThe analysis below shows the impact on profit and loss after tax and equity of a movement in interest rates against derivative
financial instruments.
CDI Movement P&L Equity P&L Equity in variable 2012 2012 2011 2011 %1 $’000 $’000 $’000 $’000
Interest rate movement – derivative +1 5,801 – 5,299 – financial instruments –1 (5,969) – (5,450) –
1 Interest rate sensitivity of 1% (100 basis points) equates to a reasonable possible movement in the bank bill swap rate.
The analysis below shows the impact on profit and loss after tax and equity of a movement in interest rates against the unhedged
interest bearing liabilities and assets.
Movement P&L Equity P&L Equity in variable 2012 2012 2011 2011 %1 $’000 $’000 $’000 $’000
CDI
Interest rate movement – interest +1 (522) – (135) – bearing liabilities –1 522 – 135 –
Interest rate movement – interest +1 55 – 58 – bearing assets –1 (55) – (58) –
CDI2
Interest rate movement – interest +1 – – (144) – bearing liabilities –1 – – 144 –
Interest rate movement – interest +1 – – 38 – bearing assets –1 – – (38) –
1 Interest rate sensitivity of 1% (100 basis points) equates to a reasonable possible movement in the bank bill swap rate.
Notes to the financial statements (continued)For the year ended 30 June 2012

Challenger Diversified Property Group Annual Report 2012
73
Currency riskCDI manages its exposure to currency risk by hedging its exposure to movements in foreign currency using forward foreign
exchange contracts and Euro denominated borrowings.
Income hedgesCDI is exposed to foreign exchange risk on Euro denominated earnings. Management has hedged 100% of estimated
distributions up to and including 31 December 2012. Any gains or losses arising from changes in fair value are reflected in
the income statement. The effect on CDI’s profit and loss for the year ended 30 June 2012 was an unrealised loss of $0.8 million
(2011: loss of $0.05 million).
The notional and fair value of income hedges for 2012 and 2011 are presented in the table below:
Foreign currency income hedges CDI CDI 30 June 2012 30 June 2011 $’000 $’000
Notional contract value 845 3,263
Fair value movements (797) (47)
Fair value assets/(liabilities) (4) 793
The details of the outstanding income hedge contracts are as follows:
Trust sells Average Trust sells Average Euro exchange Euro exchange ’000 rate ’000 rate 2012 2012 2011 2011
Maturity
Less than one year 686 0.8116 1,790 0.5483
1 - 2 years – – – –
2 - 3 years – – – –
3 - 4 years – – – –
4 - 5 years – – – –
Greater than five years – – – –
Hedge of net investment in foreign entityCDI has a policy to implement a natural capital hedge of a minimum of 100% of the total equity of CDI that is invested in foreign
currency denominated assets by borrowing in the same foreign currency to insulate against movements in exchange rates.
The hedge instrument is the Euro denominated loan held by CDPT1 under the multi option syndicated finance facility with WBC
and CBA. The carrying value of the loan as at 30 June 2012 was $45.7 million ( 36.9 million) (2011: $51.6 million; 38.1 million).
The hedged item is CDI’s net investment in CDPG Malta Limited and its subsidiaries. The net investment is comprised of shares held
in and loan to CDPG Malta Limited and its subsidiaries. As at 30 June 2012, the hedge of the net investment in CDPG Malta Limited
was 100% effective (2011: 100%).
During the period 5 December 2012 to 5 March 2012, a cross currency swap held by CDPT1, with a nominal value of 22.0 million
($28.7 million) was utilised as well as Euro denominated debt as the hedge instrument.
Foreign currency translation on consolidation is taken directly through the foreign currency translation reserve.

74
Note 26 – Financial instruments (continued)Sensitivity analysisThe analysis below shows a summary of the impact on profit/loss after tax and equity of a movement in foreign currency exchange
rates against the Australian dollar on the Euro exposure at balance date:
CDI Movement in variable P&L Equity P&L Equity against A$1 2012 2012 2011 2011
% $’000 $’000 $’000 $’000
Euro +5 28 223 128 9
–5 (32) (247) (141) (10)
The analysis below shows the impact on profit/loss after tax and equity of a movement in foreign currency exchange rates against
the Australian dollar on the Euro exposure for the foreign currency translation reserve:
CDI Movement in variable P&L Equity P&L Equity against A$1 2012 2012 2011 2011
% $’000 $’000 $’000 $’000
Euro +5 – 1,422 – 1,129
–5 – (1,572) – (1,248)
The analysis below shows the impact on profit/loss after tax and equity of a movement in foreign currency exchange rates against
the Australian dollar on the Euro exposure for the fair value of currency hedges.
CDI Movement in variable P&L Equity P&L Equity against A$1 2012 2012 2011 2011
% $’000 $’000 $’000 $’000
Euro +5 40 – 115 –
–5 (45) – (127) –
The analysis below shows the impact on profit/loss after tax and equity of a movement in foreign currency exchange rates against
the Australian dollar on the Euro exposure for the foreign currency denominated accounts at balance date.
CDI Movement in variable P&L Equity P&L Equity against A$1 2012 2012 2011 2011
% $’000 $’000 $’000 $’000
Euro +5 (12) (1,199) 13 (1,120)
–5 13 1,325 (14) 1,238
1 5% equates to a reasonable possible movement in variable against the AUD following detailed analysis of foreign exchange movements over the past 10 years.
Notes to the financial statements (continued)For the year ended 30 June 2012

Challenger Diversified Property Group Annual Report 2012
75
Credit riskThe approach to credit management utilises a credit risk framework as referred to in Note 3.
The credit risk in respect of derivative transactions is spread among two counterparties, within specified limits, each with an
S&P rating of AA.
Tenants are credit risk assessed with reference to internal and external ratings. The concentration of tenant credit risk for
approximately 43.0% (2011: 47.5%) of the portfolio is BBB+ or higher. As at 30 June 2012, the largest tenant (Commonwealth
Government of Australia) comprises 24.9% (2011: 25.0%) of the property portfolio. At 30 June 2012, there are $0.1 million in trade
debtor impairments for CDI (2011: $0.27 million). Tenant receivables that can be recovered from rental bonds or bank guarantees
provided by the tenant are considered to be unimpaired.
The credit risk on financial assets, excluding investments, which have been recognised on the balance sheet is the carrying amount
(refer to Note 14).
The following tables provide an ageing analysis of trade debtors at balance date:
CDI Past due but not impaired
Past Neither past Not past due 0-3 >3 due and due nor impaired but impaired months months impaired Total $’000 $’000 $’000 $’000 $’000 $’000
30 June 2012
Trade and other receivables 413 – 415 162 97 1,087
30 June 2011
Trade and other receivables 3,217 – 994 143 275 4,629
CDI2 Past due but not impaired
Past Neither past Not past due 0-3 >3 due and due nor impaired but impaired months months impaired Total $’000 $’000 $’000 $’000 $’000 $’000
30 June 2012
Trade and other receivables 126 – – – – 126
30 June 2011
Trade and other receivables 3,087 – 10 – – 3,097

76
Note 26 – Financial instruments (continued)Liquidity riskThe following tables summarise the contractual maturity profile of financial assets and liabilities.
CDI 2012 Carrying Contractual <1 1-2 2-3 3-4 4-5 >5 amount amount year years years years years years Note $’000 $’000 $’000 $’000 $’000 $’000 $’000 $’000
Financial liabilitiesNon-derivative financial liabilities
Trade and other payables 18 20,805 20,805 20,805 – – – – –
Interest bearing liabilities 1 20 243,681 263,843 11,657 116,152 90,283 45,751 – –
Derivative financial liabilities
Interest rate swaps 26 10,352 10,691 3,099 3,365 2,240 1,130 534 323
Foreign exchange contracts 26 345 345 – 345 – – – –
Total financial liabilities 275,183 295,684 35,561 119,862 92,523 46,881 534 323
CDI 2011 Carrying Contractual <1 1-2 2-3 3-4 4-5 >5 amount amount year years years years years years Note $’000 $’000 $’000 $’000 $’000 $’000 $’000 $’000
Financial liabilitiesNon-derivative financial liabilities
Trade and other payables 18 17,970 17,970 17,970 – – – – –
Interest bearing liabilities 1 20 226,581 235,956 148,021 59,383 28,551 – – –
Derivative financial liabilities
Interest rate swaps 26 1,692 2,068 972 447 243 125 105 176
Foreign exchange contracts 26 309 309 115 194 – – – –
Total financial liabilities 246,552 256,303 167,078 60,024 28,794 125 105 176
CDI2 2012 Carrying Contractual <1 1-2 2-3 3-4 4-5 >5 amount amount year years years years years years Note $’000 $’000 $’000 $’000 $’000 $’000 $’000 $’000
Financial liabilities
Trade and other payables 18 4,221 4,951 996 – – – – 3,955
Interest bearing liabilities 1 20 – – – – – – – –
Total financial liabilities 4,221 4,951 996 – – – – 3,955
CDI2 2011 Carrying Contractual <1 1-2 2-3 3-4 4-5 >5 amount amount year years years years years years Note $’000 $’000 $’000 $’000 $’000 $’000 $’000 $’000
Financial liabilities
Trade and other payables 18 1,971 1,971 1,971 – – – – –
Interest bearing liabilities 1 20 14,380 28,245 1,227 1,227 1,227 1,227 10,231 13,106
Total financial liabilities 16,351 30,216 3,198 1,227 1,227 1,227 10,231 13,106
1 The contractual amount of interest bearing liabilities at year end represents the undiscounted future principal and interest payments until expiry of the facility terms. Payments are calculated using the effective floating interest rate of debt at year end.
2 Cash outflows in the liquidity analysis may occur earlier than indicated or be for different amounts as interest rates and exchange rates may change.
Fair valuesAll assets and liabilities recognised in the balance sheet, whether they are carried at cost or fair value, are recognised at amounts that
represent a reasonable approximation of fair value unless otherwise stated in applicable notes.
Notes to the financial statements (continued)For the year ended 30 June 2012

Challenger Diversified Property Group Annual Report 2012
77
Note 27 – Related party disclosures(a) Responsible EntityThe Responsible Entity of CDI and CDI2 is CLIL, a wholly owned subsidiary of Challenger Life Holdings Pty Limited.
(b) Controlled entitiesThe consolidated financial statements include the financial statements of CDI and its controlled entities and CDPT2 and its controlled
entities. CDI consolidates each controlled entity listed in the following table and CDI2 consolidates CDPT2 and the controlled entities
for which CDPT2 is shown as parent in the following table:
Country of % equity interestName Parent incorporation 2012 2011
Challenger Diversified Property Trust 2 CDPT1 Australia 100 100
Challenger Diversified Property Development Pty Limited CDPT2 Australia 100 100
CDPG Australia Pty Limited CDPT1 Australia 100 100
CDPG France SAS CDPT1 France 100 100
CDPG France II SAS CDPT1 France 100 100
CDPG Luxembourg Holdings S.a.r.l. CDPT1 Luxembourg 100 100
CDPG Luxembourg S.a.r.l. CDPT1 Luxembourg 100 100
CDPG Luxembourg II S.a.r.l. CDPT1 Luxembourg 100 100
CDPG Malta Limited CDPT1 Malta 100 100
The ultimate parent of CDI and CDI2 is Challenger Limited (CGF).
(c) Details of Key Management PersonnelDirectorsThe Directors of CLIL are considered to be Key Management Personnel.
• MichaelCole(Chair);
• IanMartens;
• GeoffMcWilliam;
• IanMoore;
• BrendanO’Connor;
• RobWoods.
During the year ended 30 June 2012, Directors were paid $470,000 (2011: $595,207) in respect of their directorship of the
Responsible Entity. This amount includes all fees paid to the Directors of CLIL in respect of their Responsible Entity Board and
Committee duties for all Funds, including CDI and two other funds (Challenger Wine Trust and Challenger Infrastructure Fund).
Key Management PersonnelIn addition to the Directors noted above and CLIL, the following were considered Key Management Personnel during the year with
the authority for the strategic direction and management of CDI and CDI2:
• TrentAlston HeadofRealEstate,CGF
• TrevorHardie FundManager,CDI
Compensation of the Key Management Personnel of CDICompensation paid directly to CLIL Directors is disclosed in Note 27(c).
No amounts are paid by CDI and CDI2 directly to the Key Management Personnel individuals of these entities.

78
Note 27 – Related party disclosures (continued)(d) Management feesCLIL provides strategic and compliance management and outsources management, custodial and administrative functions to
associated entities that are wholly owned by CGF. CLIL is entitled to a fee under the CDI Constitutions.
CMSL provides custodial, fund management, asset management and leasing services in accordance with the CMSL Management
Agreement (Management Agreement) and Asset Management Agreement for the Domain Car Park.
The total base management fee payable is calculated as 0.5% per annum of the monthly gross asset value of CDI.
CMSL may also be entitled to an equity performance fee related to the relative equity performance of CDI. The equity performance
fee is calculated based on CDI’s accumulation index as calculated by Standard & Poor’s. The benchmark is the S&P/ASX 200
Property Trust Accumulation Index. The fee is capped at 0.25% per annum of the value of the gross assets of CDI at the end of
each financial year.
All costs associated with custodial and management services are paid for by CMSL. CMSL is entitled to recover all out of pocket
expenses as outlined in the Management Agreement. CLIL is entitled to recover costs from CDI under the Constitutions.
CMSL is entitled to transaction fees in respect of developments, leasing, debt arrangement and acquiring and disposing
offshore assets.
Transactions between CLIL, CMSL and CDI result from normal arm’s length dealings. CLIL is an Australian Financial Services
Licence holder.
The table shown below discloses all fees paid by CDI and CDI2 to CLIL and CMSL under the CDI Constitutions and to CMSL under
the Management Agreement with CLIL and the Asset Management Agreement for the Domain Car Park.
CDI CDI CDI2 CDI2 30 June 2012 30 June 2011 30 June 2012 30 June 2011 $’000 $’000 $’000 $’000
Base Responsible Entity fees paid or payable to CLIL, equating to 5% of the base management fee 218 204 1 3
Management fees paid or payable to CMSL, equating to 95% of the base management fee 4,138 3,874 22 48
Performance fees paid or payable to CMSL 39 2,190 – –
Asset management fees paid or payable to CMSL 135 135 135 135
Disposal fees for offshore properties paid or payable to CMSL – 12 – –
Total fees included in the income statement 4,530 6,415 158 186
Transaction fees paid or payable to CMSL capitalised as part of property development 658 2 165 2
Leasing fees paid or payable to CMSL 546 187 – –
Total fees paid or payable at balance date 5,734 6,604 323 188
Total expenses paid by CDI to reimburse CMSL for the year ended 30 June 2012 in respect of costs paid on behalf of CDI were
$4,968,889 (2011: $206,331). CDI2 has not paid any expenses to reimburse CMSL.
All transactions were in accordance with the agreements in place.
Notes to the financial statements (continued)For the year ended 30 June 2012

Challenger Diversified Property Group Annual Report 2012
79
(e) Units held in CDI by Directors and Key Management PersonnelAs at the balance date, the following related parties held interests in CDI:
Balance at Change Balance beginning during at end of the year the year of the year No. of units No. of units No. of units
Related entities
Challenger Life Company Limited 455,993,935 13,030,357 469,024,292
CLIL Directors
M Cole 111,918 – 111,918
I Martens 100,000 – 100,000
G McWilliam 371,429 18,573 390,002
B O’Connor 5,573 27,321 32,894
R Woods 1,141,282 388,412 1,529,694
Key Management Personnel
T Alston 586,714 – 586,714
T Hardie 310,144 (211,429) 98,715
Total 458,620,995 13,253,234 471,874,229
Related entities hold 54.62% of units in CDI (2011: 50.33%). CDI is deemed to be a controlled entity of CLC.
(f) Transactions with related partiesTransactions between CDPT2 and CDPT1 during the year ended 30 June 2012 included loans advanced by CDPT1 to CDPT2,
totalling $4.2 million (2011: $4.9 million) and interest of $0.7 million (2011: $1.6 million) charged on these loans.
During the year, CDPT2 assigned the Domain Car Park leasehold interest to CDPT1 for a net consideration of $10.8 million.
This assignment improves the capital position of CDPT2 and ensures that the entity with the lowest cost of capital, CDPT1, is
responsible for the completion of the car park refurbishment works. The consideration was supported by an independent valuation.
At the same time CDPT1 and CDPT2 entered into a sub-lease for CDPT2 to continue to manage the operation of the Domain Car
Park. As a result of this assignment one of the debt facility agreements between CDPT1 and CDPT2 has been fully repaid and
terminated. The remaining debt facility has been partially repaid and amended to be interest free and net operating cash flow from
the Domain Car Park directed to repay this loan.
Challenger Group Services Limited has a five year lease at 31 Queen Street, Melbourne, Victoria with CDI which expires on
30 June 2016. The lease is on arm’s length terms and conditions. Rent and outgoings during the year ended 30 June 2012 amounted
to $0.3 million (2011: $560).
CDI CDI CDI2 CDI2 30 June 2012 30 June 2011 30 June 2012 30 June 2011 Note $’000 $’000 $’000 $’000
Payables
Non-interest bearing payables 1 18 2,746 4,488 3,239 37
Interest bearing liabilities 2 20 – – – 14,380
2,746 4,488 3,239 14,417
1 Amounts payable relate to the fees outlined in Note 27(d) and are unsecured and non-interest bearing.2 Interest bearing liabilities represents facilities issued by CDPT1 to CDPT2 in relation to the Domain Car Park and Smithfield developments. These loans are
unsecured and during the year accrued weighted average interest at 10.07% (2011: 9.84%). One of the debt facility agreements between CDPT1 and CDPT2 has been fully repaid and terminated. The remaining debt facility has been partially repaid, amended to be interest free and expires on 30 June 2017, this loan appears in trade and other payables Note 18.
.

80
Note 28 – Parent entity informationThe following table provides information relating to the parent entities of CDI and CDI2 being CDPT1 and CDPT2 respectively:
CDI Parent CDI Parent CDI2 Parent CDI2 Parent 30 June 2012 30 June 2011 30 June 2012 30 June 2011 $’000 $’000 $’000 $’000
Current assets 15,157 8,222 588 4,000
Total assets 878,707 872,259 1,418 10,093
Current liabilities 38,851 176,480 995 1,389
Total liabilities 290,491 262,226 4,277 16,408
Issued capital 648,038 672,793 69 69
Retained earnings 32,498 21,165 (597) 23
Gains/(losses) reserve (92,320) (83,925) (2,331) (6,407)
Total unitholders’ equity 588,216 610,033 (2,859) (6,315)
Profit/(loss) from operations 55,460 50,256 777 2,367
Fair value movements (8,037) 1,488 2,112 (127)
Foreign exchange gain/(loss) (7,243) (2,426) – –
Net profit/(loss) before income tax 40,180 49,318 2,889 2,240
Income tax credit/(expense) – – 567 (777)
Net profit/(loss) after income tax 40,180 49,318 3,456 1,463
Total comprehensive income 40,180 49,318 3,456 1,463
Guarantees providedCDPT1 has agreed with WBC to provide two bank guarantees to the Royal Botanic Gardens and Domain Trust (BGT). One guarantee,
for $0.4 million is in relation to CDPT1’s obligation to BGT under the development deed dated 1 May 2008. The second guarantee is
for $1.1 million and relates to CDPT1’s obligation to BGT under the lease agreement dated 1 May 2008.
Contractual commitments for the acquisition of property, plant or equipmentCDPT1 has contractual commitments totalling $5.4 million (2011: $8.1 million) for development capital commitments at the Jam
Factory (2011: $0.1 million).
Further details relating to these commitments are set out in the commitments and contingencies note (Note 30(b)).
Note 29 – Auditor’s remunerationThe auditor of CDI is Ernst & Young.
CDI CDI CDI2 CDI2 30 June 2012 30 June 2011 30 June 2012 30 June 2011 $ $ $ $
Amounts received or due and receivable by Ernst & Young for:
An audit or review of the financial report of the entity – E&Y Australia 181,000 175,000 – –
An audit of the financial report for Malta and French entities in the consolidated group – E&Y Malta and France 34,450 61,132 – –
215,450 236,132 – –
Notes to the financial statements (continued)For the year ended 30 June 2012

Challenger Diversified Property Group Annual Report 2012
81
Note 30 – Commitments and contingencies(a) Leasing commitmentsOperating lease commitments – CDI as lessorAll investment properties owned by CDI are leased to tenants under operating leases at 30 June 2012 and measured at fair value
as the properties are held to earn rentals. Lease terms vary between tenants and some leases include percentage rental payments
based on sales volume.
CDPT1 and CDPT2 have entered into a sub-lease for CDPT2 to continue to manage the operation of the Domain Car Park. The sub-
lease is under normal commercial terms and includes the ability to charge percentage rent.
Future minimum rental revenues receivable under non-cancellable operating leases at 30 June 2012 are as follows:
CDI CDI CDI2 CDI2 30 June 2012 30 June 2011 30 June 2012 30 June 2011 $’000 $’000 $’000 $’000
Within one year 67,617 65,577 – –
After one year but not more than five years 206,280 169,601 – –
More than five years 108,412 93,537 – –
382,309 328,715 – –
Operating lease commitments – CDI as lesseeDuring the year ended 30 June 2008, CDPT2 entered into a four year operating lease over the Domain Car Park with Botanical
Gardens Trust (BGT). A further 21 year lease was also entered into and was conditional on completion of commitments under the
Development Deed. During the year, the operating lease between CDPT2 and BGT was transferred to CDPT1. Under the terms of
the lease, payments of $2.0 million were made by CDPT1 to BGT during the year. Before the lease was transferred, during the year
CDPT2 made payments of $1.8 million to BGT (2011: $3.0 million).
Future minimum lease payments under non-cancellable operating leases at 30 June 2012 are as follows:
CDI CDI CDI2 CDI2 30 June 2012 30 June 2011 30 June 2012 30 June 2011 $’000 $’000 $’000 $’000
Within one year 3,788 3,129 4,138 3,129
After one year but not more than five years 16,322 – 17,722 –
More than five years 87,343 – 92,885 –
107,453 3,129 114,745 3,129
(b) Capital expenditure commitmentsCapital expenditure commitments are outlined in the table below and have been made by CDI on the existing property portfolio.
Capital commitments will be financed by existing available facilities.
Future minimum capital commitments at 30 June 2012 are as follows1:
CDI CDI CDI2 CDI2 30 June 2012 30 June 2011 30 June 2012 30 June 2011 $’000 $’000 $’000 $’000
Within one year 6,911 9,314 – 8,040
After one year but not more than five years 3,789 4,462 – 25
More than five years 1,581 2,225 – –
12,281 16,001 – 8,065
1 Total capital commitments includes $6.9 million (2011: $7.8 million) for facilities management provided by Honeywell Limited and $5.4 million (2011: $0.1 million) for development capital commitments at the Jam Factory.

82
Note 30 – Commitments and contingencies (continued)(c) ContingenciesThe tenant (Bricoman) of the French property at Aulnay sous Bois in Paris has commenced an action against CDI alleging that
certain structural roadwork defects with the site have affected its use of the premises. A hearing was held on 13 December 2010,
and the court appointed an expert to review Bricoman’s claim. A meeting was held with the expert on 11 July 2012, at which the
appointed surveyor was introduced. The surveyor will carry out additional investigations and a meeting will be scheduled once they
provide their report, expected by September 2012. The expert indicated that he is aiming to provide his final report at the end of the
calendar year.
According to Article 1792-1 of the French Civil Code, the builder of the site is by law liable to the purchaser, for damages resulting
from a defect of the ground which affects the structural integrity of the building or which otherwise renders the building unsuitable
for its intended purpose. The property also has the benefit of a decennial guarantee (an automatic guarantee which provides that
the builders and architects of the building are liable for 10 years from the date of construction) in respect of damage arising from
defects in the soil or defects in the structure of the building. In addition, CDI has the benefit of an insurance policy issued by Covea
Risks (work damage guarantee), which covers the payment of any damage which the builder and architects are liable for under the
decennial guarantee.
It is CDI’s and its legal adviser’s understanding that Covea Risks has not denied the existence of the insurance policy or its liability
under such insurance policy.
Other than the above, as at balance date there are no material contingent liabilities or contingent assets.
Note 31 – Events subsequent to balance dateFollowing Board approval on 6 August 2012, CDI announced the consolidation of issued capital by consolidating every four pre-
consolidation ordinary stapled securities into one post-consolidation ordinary stapled security. Formal notice and details of the
consolidation will be sent to unitholders by 10 August 2012 and normal trading of post-consolidation ordinary stapled securities
is expected to commence on 31 August 2012.
Other than the matter noted above, there have been no matters or circumstances that have arisen since the end of the financial year
that have significantly affected, or may significantly affect CDI’s and CDI2’s operations in future financial years, the results of those
operations or state of affairs in future financial years.
Notes to the financial statements (continued)For the year ended 30 June 2012

Challenger Diversified Property Group Annual Report 2012
83
On the financial report of the Challenger Diversified Property GroupIn accordance with a resolution of the Directors of Challenger Listed Investments Limited (the Responsible Entity of the Challenger
Diversified Property Trust 1 and Challenger Diversified Property Trust 2, collectively known as the Challenger Diversified Property
Group (herein known by its ASX code ‘CDI’)), I state that:
1. In the opinion of the Directors:
(a) The financial statements and notes of CDI and CDI2 are in accordance with the CDI Constitutions and the Corporations
Act 2001, including:
(i) giving a true and fair view of CDI and CDI2 as at 30 June 2012 and of its performance for the year ended on that
date; and
(ii) complying with Australian Accounting Standards as issued by the Australian Accounting Standards Board, International
Financial Reporting Standards (IFRS) as issued by the International Accounting Standards Board and Corporations
Regulations 2001; and
(b) There are reasonable grounds to believe that CDI and CDI2 will be able to pay its debts as and when they become due
and payable.
2. This declaration has been made after receiving the declarations required to be made to the Directors in accordance with section
295A of the Corporations Act 2001 for the financial year ended 30 June 2012.
Michael Cole Chair
Sydney
6 August 2012
Statement by the Directors of the Responsible Entity of CDI

84
Independent audit report to unitholders of Challenger Diversified Property Group

Challenger Diversified Property Group Annual Report 2012
85

86
ASX listing
Challenger Diversified Property Group
(CDI) is listed on the Australian Securities
Exchange (ASX). The Fund’s units trade
under the code ‘CDI’. Unit prices are
published daily in major Australian
metropolitan newspapers, and are also
accessible from the CDI website.
The CDI website
The CDI website www.challenger.com.
au/cdi contains important information
about the Fund, including unit prices,
announcements, annual reports and
an overview of each asset in the
CDI portfolio.
Unitholder enquiries
If you have queries relating to your
unitholding or wish to provide a change of
address, Tax File Number, instructions for
payment of distributions or annual report
elections, please contact the Registry
as follows:
Challenger Diversified Property Group
C/– Link Market Services Limited
Locked Bag A14
Sydney South NSW 1235
Telephone: 1800 649 099
Telephone (outside Australia):
+61 2 8280 7612
Facsimile: +61 2 9287 0303
Alternatively, visit the Link Investor Service
Centre at www.linkmarketservices.com.
au, where you can access information
about your unitholding and update your
holding details online.
If you have any questions relating to the
management of the Fund, please contact
Challenger on +61 2 9994 7000, or send
an email to [email protected].
Distributions
CDI pays distributions six monthly for the
periods ending 30 June and 31 December.
Distribution payments can be paid by:
• directcredittoanominatedAustralian
financial institution account; or
• achequemailedtoyourregistered
unitholding address.
Annual taxation statements
The taxable income shown on your
Annual Taxation Statement is taxable in
the year of entitlement rather than the
year of receipt. This means that taxable
income included in distributions paid
in February 2012 and August 2012 is
assessable in the taxation year ended
30 June 2012.
An Annual Taxation Statement is sent
to unitholders in August each year. This
statement includes important taxation
information and should be retained by
unitholders to assist in the completion
of their taxation return.
Unitholder complaints
If you are dissatisfied with a service or
process relating to your investment, please
let us know. Complaints can be made
either verbally or in writing by contacting:
Complaints Manager
Challenger Diversified Property Group
C/– Link Market Services Limited
Locked Bag A14
Sydney South NSW 1235
Telephone: 1800 649 099
Telephone (outside Australia):
+61 2 8280 7612
Facsimile: +61 2 9287 0303
The Responsible Entity has a documented
internal dispute and resolution policy
in line with the Australian Standard for
Complaint Handling ISO 10002_2006.
If you are not happy with how the
complaint has been handled, you may
contact the Financial Ombudsman Service
(FOS), of which the Responsible Entity is
a member. This is an independent body
and is approved by ASIC to consider
complaints. The contact details for
FOS are:
Financial Ombudsman Service
GPO Box 3
Melbourne VIC 3001
Tel: 1300 780 808
www.fos.org.au
Unitholder information

Challenger Diversified Property Group Annual Report 2012
87
Substantial unitholdings as at 10 August 2012 Effective Number % issued date of units capital
Challenger Limited 12 June 2012 470,124,226 54.60%
APN Funds Management Limited 20 April 2012 88,785,584 10.04%
Top 20 unitholders as at 10 August 2012Number Name Number of units % issued capital
1 J P Morgan Nominees Australia Limited 547,863,391 63.97%
2 RBC Investor Services Australia Nominees Pty Limited 60,742,591 7.09%
3 HSBC Custody Nominees (Australia) Limited 55,481,260 6.48%
4 National Nominees Limited 50,942,446 5.95%
5 Citicorp Nominees Pty Limited 17,223,363 2.01%
6 JP Morgan Nominees Australia Limited 14,778,786 1.73%
7 BNP Paribas Nominees Pty Ltd 7,438,961 0.87%
8 Perpetual Trustee Company Ltd 6,876,618 0.80%
9 RBC Investor Services Australia Nominees Pty Limited 5,279,852 0.62%
10 Equity Trustees Limited 4,851,934 0.57%
11 UBS Wealth Management Australia Nominees Pty Ltd 4,330,988 0.51%
12 BNP Paribas Nominees (NZ) Ltd 3,729,288 0.44%
13 Sandhurst Trustees Ltd 3,532,879 0.41%
14 Navigator Australia Ltd 3,371,920 0.39%
15 Citicorp Nominees Pty Limited 3,270,772 0.38%
16 HSBC Custody Nominees (Australia) Limited 2,415,247 0.28%
17 Pelerman Holdings Pty Ltd 2,206,737 0.26%
18 Nulis Nominees (Australia) Limited 2,006,668 0.23%
19 Mr Dominic John Stevens 1,588,740 0.19%
20 Lecappio Pty Limited 1,529,694 0.18%
Total 799,462,135 93.35%
At 10 August 2012 there were 41 unitholders each holding less than a marketable parcel of 1,000 units.
VotingrightsOn a show of hands, each member of CDI, being a holder of ordinary units (Member) has one vote. On a poll, each Member has one
vote for each dollar of the value of the total units held by that Member.
Spread of unitholders as at 10 August 2012 Number Holding of holders Securities %
100,001 and over 825,606,659 96.40 105
50,001 to 100,000 11,680,882 1.36 157
10,001 to 50,000 17,574,074 2.05 673
5,001 to 10,000 1,235,944 0.14 146
1,001 to 5,000 291,090 0.03 90
1 to 1,000 14,550 0.00 50
Total 856,403,199 100.00 1,221
88
The following disclosures are made
in accordance with the listing rules of
Australian Securities Exchange Limited
(ASX), and waivers to these listing rules
granted to the Responsible Entity at the
time of the listing of CDI on ASX.
Co-Owners’ Agreements
The Challenger Group entity which was
vendor of each property (other than the
distribution centres, the French properties,
Rexel and Century City Walk) and the
Responsible Entity own their interest
(either freehold or leasehold) in those
properties as tenants in common 40%
as to a member of the Challenger Group
and 60% as to the Responsible Entity.
The Co-Owners’ Agreements regulate the
affairs of the owners for those properties
including dealings/acquisition rights and
voting rights.
Dealings/acquisition rights: The Co-
Owners’ Agreement envisages the
following scenarios where the ownership
of each of the properties may change:
• By way of a permitted transfer – in this instance, each co-owner is
permitted to deal with a whole or part
of its interests in the property where
the other party to the dealing is a
member of that co-owner’s group;
• By way of a dealing where first rights of refusal have been fully complied with first – the co-owner
that wishes to deal with its interest in
the property to a third party must first
offer to sell to the other co-owner.
If the co-owner does not accept
the offer to sell, then the co-owner
may offer the interest to any person
on terms and conditions no more
favourable. If at any time there is a
co-owner who is not a member of
the Challenger Group or CDI and
the co-owner who is a member of
the Challenger Group wishes to deal
with their interest in the property,
then they must first offer to sell to
the co-owner who is a member of
CDI before offering to a third party
co-owner. Equally if the co-owner
who is a member of CDI wishes to
deal with their interest they must first
offer to sell to the co-owner who is
a member of the Challenger Group
before offering the property to the
third party co-owner;
• Non-application – the first rights of
refusal do not apply if the Challenger
group entity transfers its interest in the
property to a member of Challenger
Group where it is the responsible
entity or trustee of a trust and there
is a change in the responsible entity
or trustee from the member of the
Challenger Group to a third party;
• If a default occurs – if a co-owner
defaults under the agreement, then
at any time within three months of
the default occurring and subsisting
the non-defaulting co-owner may
give notice that it (or its nominee,
being part of that co-owner’s group)
wants to exercise its right to purchase
the defaulting co-owner’s interest in
the property. If at any time there is a
co-owner who is not a member of the
Challenger Group or CDI then, if the
defaulting owner is a CDI member the
third party co-owner may not exercise
its right to purchase the defaulting co-
owner’s interest in the property unless
any co-owner who is a CDI member
has elected not to do so. Equally, if the
defaulting co-owner is a Challenger
Group member, the third party co-
owner may not exercise its right to
purchase the defaulting co-owner’s
interest in the property unless any
co-owner who is a CDI member has
elected not to do so;
• Change in control – as long as the
Challenger Group entity retains a
19.9% interest in the property, if there
is a change in control of either Stapled
Entity or a change in control is likely
to occur, then within six months of
a change in control occurring, that
Challenger Group entity may serve
a notice on the Responsible Entity,
requiring the Responsible Entity
to transfer all or some of its or its
subsidiary’s interest in the property to
a member of its co-owners’ group;
• Non-application – the change in
control provisions cease to apply
when the beneficial interest of
the Responsible Entity’s interest
in the property is no longer held
by a member of CDI, or the other
co-owner ceases to hold an interest of
19.9% or more in the property;
• Change in control – of CDI means:
a) the Responsible Entity ceasing
to be the responsible entity for
either of the CDI trusts, unless
the replacement or additional
responsible entity is a member
of the Challenger Group;
b) the winding up of either of the
CDI trusts being commenced
for any reason, including as a
result of:
i. the unitholders of either of
the CDI trusts resolving to
wind up the trust; or
ii. the responsible entity for the
time being of either of the CDI
trusts being required to wind
up the trust under the trust
deed or applicable law; or
iii. the responsible entity for
the time being of either of
the CDI trusts ceasing to be
authorised under the relevant
trust deed or constitution or at
law to own the trust property
in its name or to perform its
obligations under the Co-
Owners’ Agreement;
• Price – the price at which the
Responsible Entity’s interest in the
properties will be transferred if there
is a change of control is determined
by a valuer, who is appointed to
determine the fair value, in accordance
with an agreed procedure which
contemplates additional valuers being
appointed if there is a dispute as to
the value of the property. The same
process will be used to determine the
amount payable if there is a default
except that any damages incurred by
a non-defaulting co-owner will be
deducted from the amount paid to
the defaulting co-owner;
• Prior written consent – either co-
owner may, with the prior written
consent of the other co-owner, deal
with a whole or part of its interests in
the property.
Additional information

Challenger Diversified Property Group Annual Report 2012
89
Voting: The agreements establish a
co-owners’ committee which allows
each co-owner to have an equal vote in
the operation and management of each
property, until a co-owner deals with
a third party when voting will become
proportional to the co-owner’s percentage
ownership of the relevant property.
Members of the same co-owners’ group
will, however, only have one vote. If a co-
owner transfers their entire interest to a
third party then voting remains equal and
if a co-owner transfers a partial interest
to a third party then voting will be in
accordance with the co-owner percentage
ownership.
If the co-owners’ committee is unable
to agree on an issue in dispute it may be
referred to the chief executive officers of
the co-owner for resolution.
90
Directory
Responsible Entity
Challenger Listed Investments Limited
ABN 94 055 293 644
Registered Office and Principal Place of Business
Level 15
255 Pitt Street
Sydney NSW 2000
Telephone: +61 2 9994 7000
Facsimile: +61 2 9994 6381
Website: www.challenger.com.au
Challenger Diversified Property Group
Challenger Diversified Property Trust 1
ARSN 121 484 606
Challenger Diversified Property Trust 2
ARSN 121 484 713
Website: www.challenger.com.au/cdi
Unit Registry
Link Market Services Limited
Level 12
680 George Street
Sydney NSW 2000
Toll free: 1800 649 099
Telephone: +61 2 8280 7612
Facsimile: +61 2 9287 0303
Website: www.linkmarketservices.com.au
Auditor
For the Responsible Entity and CDI
Ernst & Young
680 George Street
Sydney NSW 2000
Website: www.ey.com/au

Challenger Diversified Property Group Annual Report 2012
91
This page has been left intentionally blank.

92
This page has been left intentionally blank.

Contents
Key highlights 1
Chair’s letter 2
Fund Manager’s report 3
Case study 6
Portfolio summary 8
Property summaries 11
About Challenger 21
Corporate governance statement 22
Directors’ report 29
Financial report 40
Unitholder information 86
Additional information 88
Directory 90
Challenger Listed Investments Limited (ABN 94 055 293 644) (AFSL 236887) (CLIL) is the Responsible Entity of Challenger Diversified Property Trust 1 (ARSN 121 484 606) and Challenger Diversified Property Trust 2 (ARSN 121 484 713) which together form the Challenger Diversified Property Group (CDI).
CLIL, as the Responsible Entity of CDI, has prepared this Annual Report (Report) based on information available to it. The information in this Report should be regarded as general information only. Nothing contained in this Report constitutes investment, legal, tax or other advice. It has been prepared without taking account of any person’s objectives, financial situation or needs. Recipients should, before acting on any such information, consider its appropriateness, having regard to their objectives, financial situation and needs, and seek the assistance of their financial or other licensed professional adviser before making any investment decision.
Any investment in CDI is subject to investment risk and other risks, including possible loss of income and principal invested. None of CLIL, Challenger Management Services Limited (ABN 29 092 382 842) (AFSL 234678) (CMSL), Challenger Limited (ABN 85 106 842 371) (Challenger) or any other member of the Challenger Group gives any guarantee or assurance as to the performance of CDI or the repayment of capital.
Nothing in this Report should be considered a solicitation, offer or invitation to buy, subscribe or sell any, or a recommendation of, financial products.
All reasonable care has been taken to ensure that the facts stated and opinions given in this Report are fair and accurate. To the maximum extent permitted by law, the recipient releases CLIL, each member of the Challenger Group, their directors, officers, employees, representatives and advisers from any liability (including, without limitation, in respect of direct, indirect or consequential loss or damage or loss or damage arising by negligence) arising in relation to any recipient relying on anything contained in or omitted from this Report.
Any forward looking statements included in this Report involve subjective judgment and analysis and are subject to significant uncertainties, risks and contingencies, many of which are outside the control of, and are unknown to, CLIL. In particular, they speak only as of the date of these materials, they assume the success of CDI’s business strategies, and they are subject to significant regulatory, business, competitive and economic uncertainties and risks. Actual future events may vary materially from forward looking statements and assumptions on which those statements are based. Given these uncertainties, recipients are cautioned not to place undue reliance on such forward looking statements.
Any past performance information provided in this Report is not a reliable indication of future performance.
CLIL does not receive any specific remuneration for any general advice which may be provided to you in this Report. However, CLIL and CMSL receive trustee and management fees as issuer and manager of CDI, respectively. For more details on fees, please refer to the Financial Report contained in this Report along with the Constitution and Management Agreement on CDI’s website www.challenger.com.au/cdi (under the Corporate Governance tab). Financial advisers may receive fees or commissions if they provide advice to you or arrange for you to invest in a Challenger product (including CDI). CLIL and its associates may have an interest in the financial products referred to in this Report and may earn fees or other benefits as a result of transactions in any such financial products.
Members of the Challenger Group and their officers and directors may hold securities in CDI from time to time.
Important notice
500 Chapel Street South Yarra Victoria

Challenger Diversified Property GroupAnnual Report 2012
Challeng
er Diversifi
ed Prop
erty Gro
up A
nnual Rep
ort 2012
Challenger Diversified Property Groupcomprising:
Challenger Diversified Property Trust 1(ARSN 121 484 606)
Challenger Diversified Property Trust 2(ARSN 121 484 713)
Responsible EntityChallenger Listed Investments Limited (ABN 94 055 293 644) (AFSL 236887)
Level 15 255 Pitt Street Sydney NSW 2000 telephone 02 9994 7000 facsimile 02 9994 7777
www.challenger.com.au
1378
4/C
G92
7/0
812