Challenger Diversified Property Group (ASX: CDI) · PDF fileChallenger Diversified Property...
45
1 Challenger Diversified Property Group (ASX: CDI) Results presentation for half-year ended 31 Dec 2011
Transcript of Challenger Diversified Property Group (ASX: CDI) · PDF fileChallenger Diversified Property...

1
Challenger Diversified Property Group (ASX: CDI)
Results presentation
for half-year ended 31 Dec
2011
2 2
Important notice
Information contained in this publication is current as at 7 February 2012 unless otherwise specified and is provided by Challenger Listed
Investments Limited (ABN 94 055 293 644) (AFSL 236887) (“Challenger”), as Responsible Entity of the Challenger Diversified Property
Trust 1 (ARSN 121 484 606) and the Challenger Diversified Property Trust 2 (ARSN 121 484 713) which together comprise the
Challenger Diversified Property Group (“Group”). This document has been prepared for general information purposes only and not with
regard to any particular recipient’s financial situation, objectives or needs nor to solicit offers or invitations for the Group's securities.
Nothing contained in this document constitutes investment, legal, tax or other advice. Accordingly, recipients should, before acting on
any information in this document, consider its appropriateness, having regard to their objectives, financial situation and needs, and seek
the assistance of their financial or other licensed professional adviser before making any investment decision.
Challenger makes no representation, gives no warranty and does not accept any responsibility for the accuracy or completeness of any
recommendation, information or advice contained herein. To the maximum extent permitted by law, the recipient releases Challenger,
each member of the Challenger Group, their directors, officers, employees, representatives and advisors from any liability (including,
without limitation, in respect of direct, indirect or consequential loss or damage or loss or damage arising by negligence) arising in
relation to any recipient relying on anything contained in or omitted from this document.
Past performance is no guarantee or assurance as to the future performance, profitability or capital value of the Group or its securities.
Any forward looking statements included in this document are by nature subject to significant uncertainties, risks and contingencies,
many of which are outside the control of, and are unknown to, Challenger, so that actual results or events may vary from those forward
looking statements, and the assumptions on which they are based.
Challenger, or persons associated with it, may have an interest in the securities or financial products mentioned in this document and
may earn fees including as a result of transactions in any such securities or financial products.

3 3
Results overview
Operating results • Profit from operating activities: $23.91 million; net property income: $33.8 million
• Statutory net profit after tax: $18.8 million, impacted by fair value movements
• 1H12 normalised EPU: 2.67 cents; DPU: 2.05 cents
• Net tangible assets (NTA): 68 cpu
• Pro forma balance sheet gearing at 28.9%2
Upgraded guidance • Upgraded FY12 guidance: normalised EPU3 5.0 cents, DPU 4.2 cents
• Due to earnings upside from extended timetable of French sales and the
strong operating profit from The Domain car park
Property metrics • Occupancy: 92.9%4; WALE: 5.04 years
• Property valuations up $9.3 million on 30 June 2011
• Challenging leasing market continues
Developments progressing well • The Junction Industrial Park - Bunzl
• The Jam Factory
• The Domain car park
1 For a detailed reconciliation between statutory net profit after tax & profit from operating activities refer to slide 41 2 Pro forma balance sheet gearing post payment of 1H12 distribution in February 2012 3 EPU calculated using profit from operating activities and weighted average units on issue 4 Includes The Junction, Stage 2 “As if Complete”

4
Challenger Diversified Property Group
High yielding quality earnings underpinned by sound property
fundamentals
Domestic focus
Diversified properties with focus on office income
Positioned well for macro volatility
KEY DATA – CDI 31 December 2011
Unit price 6 February 2012 - 10 day VWAP 49 cents
Market capitalisation $434 million
Total assets 31 December 2011 $879 million
Net tangible assets 31 December 2011 68 cents
Discount to NTA Based on 6 February 2012 - 10 day
VWAP
27.9%
Distribution guidance FY12 (per unit) 4.20 cents
DPU yield Based on 6 February 2012 - 10 day
VWAP and FY12 DPU guidance
8.6%

5 5
Strategy…
Talavera Rd North Ryde, NSW

Fund Objective: to provide investors with exposure to a diversified
portfolio of properties generating stable income
returns and potential for capital growth
6
CDI strategic objectives
Portfolio enhancement
Improve leasing metrics
Active capital management
Grow earnings
Close price to NTA gap

Portfolio enhancement
7
• French marketing campaign initiated Q4 2011
• French properties remain on market for orderly sale Domestic focus
• Increase focus on multi tenanted properties
• Reduce exposure to purpose built properties
• Concentrate on properties in deeper leasing markets with strong long term rental growth
Diversify portfolio
• The Junction Industrial Park – Bunzl
• The Jam Factory
• Domain car park Value add

Update on sale of French properties
Marketing campaign initiated Q4
2011
Challenging market conditions in
France and Europe as a whole,
investors remain cautious, with
uncertain economic conditions and
limited credit availability
Properties remain on market for
orderly sale
8
Properties 100% occupied
Portfolio WALE enhanced with
French leasing activity in 2011
Strong net income continues to be
delivered

Improve leasing metrics
9
Office • Lease deals - 7 • Area 6,318 sqm
• Rent $2.3m
Retail • Lease deals - 8 • Area 1,335 sqm
• Rent $561k
Industrial - High Tech Lease deals - 1 Area - 553 sqm
Rent $128k
Total deals completed
Lease deals - 20
Area 44,247 sqm
Gross rent $6.4m
(6.8% of CDI portfolio gross income)
Industrial – Distribution Lease deals - 4 Area 36,041 sqm
Rent $3.4m
Ongoing success with renewals
WALE: 5.0 years
Occupancy: 92.9%
Expiries and vacancies remain
our priority
Note: Area’s based on 100% NLA

Active capital management
Actively managing balance sheet
gearing levels to a 25% – 35%
range
Active management of debt
limits and available liquidity, to
maintain financial flexibility
Judicious use of buyback to date
Buyback cautiously slowed given
current status of asset sales
Efficient management of retained
earnings to fund future
maintenance capex projects and
leasing costs
10
11 11
Results highlights
31 Queen St Melbourne, VIC

12 12
Operating results
Statutory NPAT: $18.8m compared to $30.1m 1H11
Profit from operating activities, $23.9m or 2.67 cpu
Distribution of 2.05 cpu
NTA per unit 68 cents
Distribution payout ratio for 1H12: 75.9%2
1 EPU calculated using profit from operating activities and weighted average units on issue 2 Calculated as distribution to unitholders / profit from operating activities 3 AFFO: available funds from operations
1H12
$ million
1H11
$ million
Net property income 33.8 30.9
Financing costs 6.9 3.7
Profit from operating activities 23.9 24.0
Normalised earnings1 per unit 2.7 2.6
Net profit/(loss) after tax (including unrealised impacts) 18.8 30.1
Cash flow from operating activities 21.4 22.2
Distribution to unitholders 18.1 18.3
Distribution per unit (cents) 2.05 2.00
Operating profit distribution payout ratio2 76% 76%
AFFO3 distribution payout ratio 103% 87%
Undistributed income 15.3 11.6

FY12 earnings guidance – Upgraded
13
Upgraded EPU guidance now
5.0 cents
Significant underlying
assumptions: • No asset sales
• No leasing of major current vacancies
• No performance fee paid
Upgraded DPU guidance of
4.2 cents
Operating profit distribution
payout ratio: 84%
4.7
0.13
0.13
(0.20)
0.11
0.13
5.0
4.5
4.6
4.7
4.8
4.9
5
5.1
Original FY12guidance
Extended sale ofFrench portfolio
Domainoutperformance
Increased downtime Net propertyoutperformance
Finance & opexsavings
FY12 forecast

14 14
Capital management
Inside The Jam Factory Melbourne, VIC

On market buyback
Buyback funded through combination of debt and asset sales
Buyback 30% complete • Total of 29.6m units ($15.2m) acquired (3.2% of issued capital)
Buyback slowed given status of asset sales
Buyback metrics • Average vwap of 51.47 cents compared to market VWAP of 52.75 cents
• Purchased at an average 24% discount to NTA, equivalent to an implied cap rate of 9.7%
• Purchased on average 25% of total market volume
Management continue to believe units are currently undervalued
15

16 16
Debt metrics
Pro forma 31 December 20112
AUD denominated
borrowings
Euro
denominated
borrowings
Total
Borrowings A$206m A$48m1 A$254m
Gearing (debt to total assets) (%) 24.8 100.1 28.9
Covenant gearing (total liabilities to total tangible assets) (%) 27.5 102.7 31.7
Proportion hedged3 (%) 85.1 26.2 73.9
Weighted average hedged term (yrs) 3.0 0.7 2.8
Average cost of drawn debt (including margin) (%) 7.0 3.9 6.4
Weighted average undrawn commitment fee (%) 1.0
1 A$ / € spot rate of 0.7897 as at 31 December 2011; net of deferred borrowing costs 2 Post payment of the 1H12 distribution in February 2012 3 The adverse fair value movement of interest rate swaps during the period was $6.2m
Average cost of Australian drawn debt post refinance – 7.0% • includes average margin of 183 bps on drawn debt
Weighted average undrawn commitment fee: 100 bps
Incremental cost of drawing additional Australian debt - 5.3%

17
Facility expiry profile
Facility limit increased to $300m with no expiries until FY14
Undrawn $42m to fund committed developments and provide financial
flexibility
17
• 31 December 2011 pro forma expiry profile1
1. Pro-forma debt post payment of 1H12 distribution in February 2012 and includes bank guarantees issued by CDI
$25
-
90 100
68
20 -
22
-
50
100
150
200
Jul-12 Jul-13 Jul-14 Jul-15
$m
Expiry
Drawn Undrawn

18 18
Development progress
The Junction Industrial Park – Stage 2 Enfield, NSW

The Junction Industrial Park
Stage 2
GLA 20,200sqm
Lease term 10 yrs
Total project cost - excluding land
$21m
Total project cost - including land
$32m
Initial income yield
on cost (including
land)
8.15%
Target completion June 2012
Expected value on
completion
$34m
Bunzl
19
The project is forecast to complete
within budget
Key activities undertaken to date
include: • Earthwork compaction and piering complete
• Structural steel 79% complete
• Precast concrete 51% complete
• Formwork 70% complete
• Hydraulic services 63% complete
• Cost to complete $14m
Stage 3
Seeking 12,660 sqm pre-
commitment for Stage 3 (final
stage)
Forecast incremental cost for
Stage 3 - $13m

The Jam Factory
Operations World record opening for a Topshop franchise store
– 540 stores in 34 countries
Centre traffic increased by 27% in December 2011
(compared to December 2010)
Tenant refurbishments; Boost (Dec 11) and TGI
Friday’s (May 12)
Wilson Parking appointed to manage car park from
mid March 2012
20
Tenancy remix strategy underway targeting
fashion, food and entertainment
New major brands Topshop, Urban by Target
and Nando’s now open
Food court to open in April 2012.
Car park renovation works to start in March
2012
Cost to complete $6m (60%, CDI share)
Repositioning Works
Project cost $16m (100%)
Target completion July 2012
Value on
commencement
$104m
Expected value on
completion
$123m
Repositioning to make the centre more contemporary, accessible and
sought after by a broader demographic

The Domain car park
Refurbishment Targeting completion May 2012, ahead of contract
completion date 18 July 2012
Key activities undertaken to date include:
• Lift installation 45% complete
• Services upgrades and painting car park pods
complete
• Façade upgrade 95% complete
• Travelator upgrade complete
Forecast to be completed within budget
Cost to complete $2.9m
Operations Occupancy levels above expectations during
refurbishment, delivering above budget financial results
Marketing leveraged key events in locale – Picasso
exhibition, Open Air Cinema, Sydney Festival, Domain
events through summer
21

22 22
Portfolio performance
The Forum St Leonards, NSW

23 23
State of play
Office
• Demand for office space in most markets is likely to be subdued (excluding Perth and Brisbane)
• Incentive levels are forecast to remain high through 2012
• Prime stock with long WALE’s will remain attractive to investors. Cap rates to remain flat until more certainty
exists in the broader global market
Industrial
• Fewer pre-lease deals are expected to be completed in 2012 with many larger requirements satisfied in 2011
• Rents are expected to remain at current levels
• Investment yields are expected to remain static. Limited sales activity expected
Retail
• Pressure on discretionary retail to continue with occupancy costs expected to rise
• Food and restaurant performance complementary to cinema attendance has produced solid results for 2011
and is expected to continue throughout 2012
• Solid Australian cinema box office results for 2011: $1.09bn marginally down from 2010’s record year of
$1.13bn
24
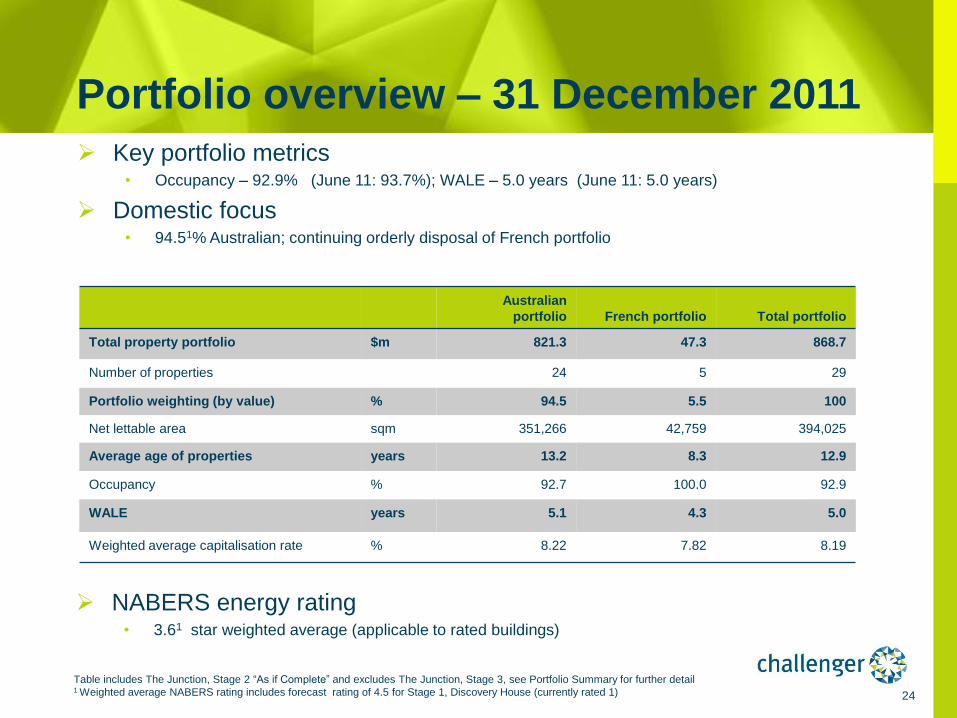
Portfolio overview – 31 December 2011
Australian
portfolio French portfolio Total portfolio
Total property portfolio $m 821.3 47.3 868.7
Number of properties 24 5 29
Portfolio weighting (by value) % 94.5 5.5 100
Net lettable area sqm 351,266 42,759 394,025
Average age of properties years 13.2 8.3 12.9
Occupancy % 92.7 100.0 92.9
WALE years 5.1 4.3 5.0
Weighted average capitalisation rate % 8.22 7.82 8.19
Key portfolio metrics • Occupancy – 92.9% (June 11: 93.7%); WALE – 5.0 years (June 11: 5.0 years)
Domestic focus • 94.51% Australian; continuing orderly disposal of French portfolio
NABERS energy rating • 3.61 star weighted average (applicable to rated buildings)
Table includes The Junction, Stage 2 “As if Complete” and excludes The Junction, Stage 3, see Portfolio Summary for further detail 1 Weighted average NABERS rating includes forecast rating of 4.5 for Stage 1, Discovery House (currently rated 1)

25
Portfolio revaluations at
31 December 2011
Carrying value
($m)
As at 31 Dec 11
Market cap rate
As at 31 Dec 11
Market cap rate
As at 30 Jun 11
Domestic office portfolio 503.4 8.08% 8.07%
Domestic retail portfolio 130.2 8.30% 8.30%
Domestic industrial (distribution centres) 110.8 8.45% 8.56%
Domestic industrial (high tech) 76.9 8.63% 8.64%
TOTAL DOMESTIC PORTFOLIO 821.3 8.22% 8.22%
French portfolio1 47.4 7.82% 7.66%
TOTAL 868.7 8.19% 8.19%
All properties revalued: 46% (by value) independently revalued
Total Portfolio up $9.3m, up 1.1% from FY11 • A-IFRS fair valuation movements down $1.1m
Market capitalisation rates remain unchanged at 8.19%
French portfolio value down 7.7%
Currently trading on an implied cap rate of 10.4%
Table includes The Junction, Stage 2 “As if Complete”, see Portfolio Summary for further detail 1 Converted at 31 December 2011 spot rate (0.7897)

26
Lease expiry profile
(by gross income)
1 Includes The Junction, Stage 2 “As if Complete”
Investment portfolio 92.9%1 occupied
WALE 5.01 years
0.6% 0.4%
1.7% 0.2%
0.1% 1.7%
1.5%
0.9%
1.3%
0.9%
1.5%
1.3% 1.4%
1.1%
0.9%
0.7%
1.1%
0.0%
1.0%
2.0%
3.0%
4.0%
5.0%
6.0%
7.0%
8.0%
Vacant FY 12 FY 13
Minor Expiry
187 Todd Rd
6 Foray Street
75 Talavera Rd
The Forum,
Verizon
Giffnock
Avenue
Minor Expiry
Retail Expiry
6 Foray Street
31 Queen Street
Minor
Expiry
Retail Expiry
Oz Minerals – 31
Queen St
Village Roadshow
Jam Factory
Tours (France)
Beziers (France)
Makerston Ave
7.1%
3.3%
6.9%

Summary
Jam Factory – Tenants Logos Melbourne, VIC

28 28
Summary
Operating results on target • 1H12 normalised earnings and distribution of 2.67 and 2.05 cpu delivered
• Net tangible assets (NTA): 68 cpu
• Pro forma balance sheet gearing at 28.9%
Property metrics • Investment property valuations up $9.3 million from 30 June 2011
• Occupancy: 92.9%; WALE 5.0 years
Execute on strategy - closing the gap by growing earnings
• Portfolio enhancement strategy
• Active capital management
• Improve leasing metrics
Upgraded FY12 guidance
• Normalised EPU: 5.0 cents; DPU: 4.2 cents

29
Contacts
Trevor Hardie Fund Manager
Tel: + 61 (0)2 9994 7546
Email: [email protected]
Website www.challenger.com.au/cdi
Tim Evans Assistant Fund Manager
Tel: + 61 (0)2 9994 7131
Email: [email protected]

Appendices

31 31
Distribution policy
CDI’s distribution policy is to distribute accounting profit earned from operating activities adjusted for non-cash
expenses, straight-line rent, incurred and expected: leasing costs, debt establishment fees and capital expenditure to
maintain the investment properties, subject to the ongoing objective to distribute an amount which results in CDI not
being subject to income tax.
Realised impacts from the sale of assets will be distributed on a discretionary basis which will be determined with
regard to capital management strategies, market conditions and tax consequences.
On average in any year, the income distributed will represent approximately 80-85% of operating profit earned before
write downs.

32
Management
Fee type Calculation
Base management fee
Performance fees
From 1 July 2010, 0.5% of gross assets of CDI per annum, payable in cash
5% of first 2% out performance against S&P/ASX200 property accumulation index,
and 15% of any out-performance thereafter, capped at 0.25% of gross assets per
annum (capped with no carry forward)
Transactional fees are payable only for offshore acquisitions/divestments as detailed in the PDS. No fees
are payable on domestic acquisitions/divestments.
For full details refer to the CDI PDS, Constitution and Management Agreement at
www.challenger.com.au/cdi
Management agreements published on website
Management expense ratio: 57.0 bps
Management fees:

Hedge profiles
33
Half year ending AUD/EUR
30 June 2012 0.7972
31 December 2012 0.7828
Income hedges
$ A denominated hedges
Notional Hedge rate Maturity date
$15m 4.83% April 2012
$40m 5.37% Feb 2014
$25m 5.11% April 2014
$20m 5.10% June 2014
$12.5m 5.55% Oct 2015
$12.5m 5.39% Oct 2015
$40m 5.07% Feb 2016
$10m 7.40% July 2018
€ Euro denominated hedges
Notional Hedge rate Maturity date
€10m 4.08% Sept 2012
Interest rate hedges

61% 16%
17% 6%
Office
Retail
Industrial - DC
Industrial - HT
33%
36%
3%
29%
Government
Listed
MultiInternationalPrivate
25%
14%
19%
36%
7%
AAA
AA+ → A-
BBB+ → BBB-
BB+ → B-
CCC+ → D
NR
28%
25%
27%
5%
3% 3%
2% 5%
NSW
ACT
VIC
QLD
SA
WA
TAS
France
Sector diversification (by value) Geographic diversification (by value)
Tenant credit rating (by gross income) (Challenger internal ratings based on rating agency methodology)
Tenant diversification by type (by gross income)
34
Diversification enhances portfolio
quality
As at 31 December 2011
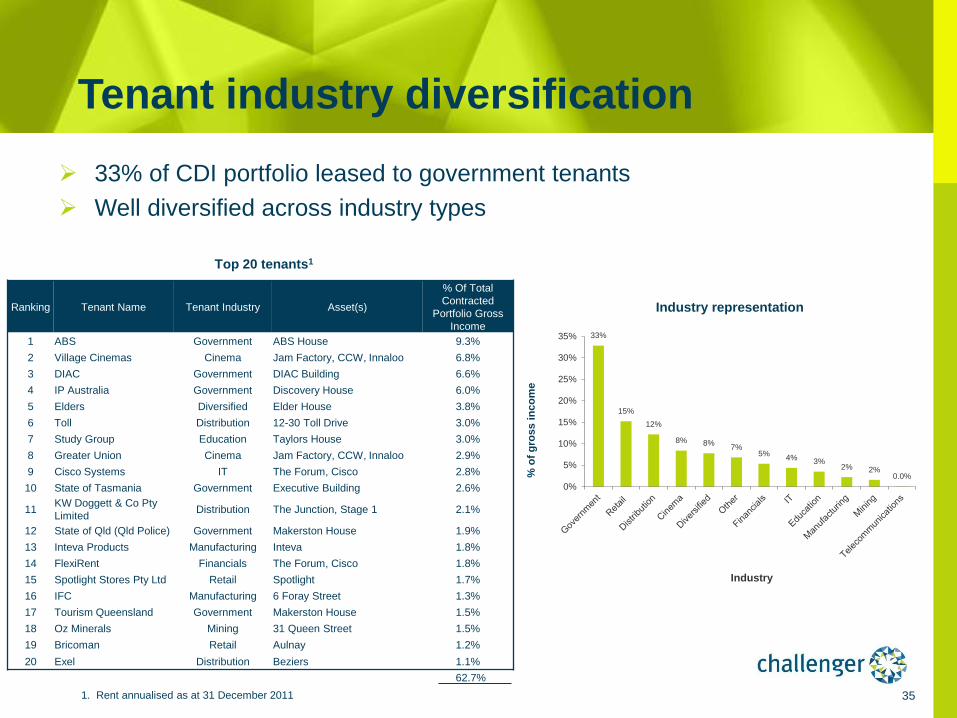
Ranking Tenant Name Tenant Industry Asset(s)
% Of Total
Contracted
Portfolio Gross
Income
1 ABS Government ABS House 9.3%
2 Village Cinemas Cinema Jam Factory, CCW, Innaloo 6.8%
3 DIAC Government DIAC Building 6.6%
4 IP Australia Government Discovery House 6.0%
5 Elders Diversified Elder House 3.8%
6 Toll Distribution 12-30 Toll Drive 3.0%
7 Study Group Education Taylors House 3.0%
8 Greater Union Cinema Jam Factory, CCW, Innaloo 2.9%
9 Cisco Systems IT The Forum, Cisco 2.8%
10 State of Tasmania Government Executive Building 2.6%
11 KW Doggett & Co Pty
Limited Distribution The Junction, Stage 1 2.1%
12 State of Qld (Qld Police) Government Makerston House 1.9%
13 Inteva Products Manufacturing Inteva 1.8%
14 FlexiRent Financials The Forum, Cisco 1.8%
15 Spotlight Stores Pty Ltd Retail Spotlight 1.7%
16 IFC Manufacturing 6 Foray Street 1.3%
17 Tourism Queensland Government Makerston House 1.5%
18 Oz Minerals Mining 31 Queen Street 1.5%
19 Bricoman Retail Aulnay 1.2%
20 Exel Distribution Beziers 1.1%
35
Tenant industry diversification
33% of CDI portfolio leased to government tenants
Well diversified across industry types
1. Rent annualised as at 31 December 2011
% o
f g
ros
s i
nc
om
e
Top 20 tenants1
Industry representation
62.7%
33%
15%
12%
8% 8% 7%
5% 4% 3%
2% 2% 0.0%
0%
5%
10%
15%
20%
25%
30%
35%
Industry

36
Lease expiry profile
(by gross income)
7.1%
3.3%
6.9% 5.7%
11.0%
65.9%
0%
10%
20%
30%
40%
50%
60%
70%
80%
Vacant Jun-12 Jun-13 Jun-14 Jun-15 FY 2016 Beyond
% E
xp
iry b
y g
ross i
nco
me

37
Review type FY12 rental
proportion
(%)
Rent reviews
Fixed 56% Average 3.5%
CPI 11% Last CPI 3.5%1
French CCI 7% Last CCI 6.84%2
Market 2% n/a
Total 76%
Rent review profile provides built-in
growth
Significant weighting to fixed and indexed rental reviews over next three years
76% of portfolio subject to rental reviews in FY12
Rent review profile (by income)
1. Sept 2011ABS All Cities
2. French Cost of Construction Index average for 12 months to Q3 2011 11% 12% 8%
56% 58% 60%
2% 2% 3%
7% 7% 7%
23% 20% 22%
0%
10%
20%
30%
40%
50%
60%
70%
80%
90%
100%
FY 11/12 FY 12/13 FY 13/14
No Review in Period (incl. New Leases) & Other
FCCI
Market Review
Fixed Review
CPI Review

38
CDI investment portfolio diversification
28% 25%
27%
5% 3%
3% 2%
5%
-
$50
$100
$150
$200
$250
$300
NSW ACT VIC QLD SA WA TAS France
Valu
e (
$m
)
Geographic Sector Diversification
Office Retail Industrial-DC Industrial - High Tech
61%
16% 17%
6%
-
$100
$200
$300
$400
$500
$600
Office Retail Industrial-DC Industrial - High Tech
Va
lue
($
m)
Sector Geographic Diversification
NSW ACT VIC QLD SA WA TAS France

39
Income statement
31 December 2011 31 December 2010
$’000 $’000
Rental income 36,811 34,375
Other property income 6,439 4,890
Income from operating business activities 3,772 3,658
Interest income 301 176
Revenue 47,323 43,099
Property related expenses (9,438) (8,371)
Expenses from operating business activities (2,607) (3,014)
Property expenses (12,045) (11,385)
Finance costs (6,920) (3,657)
Responsible Entity’s and Manager’s fees (2,189) (1,984)
Operating expenses (304) (627)
Trust expenses (9,413) (6,268)
Fair value movement of derivatives held at the end of the period (6,154) 2,909
Fair value movement of investment properties sold during the period (64) (219)
Fair value movement of investment properties held at the end of the
period (1,082) 1,947
Fair value movements (7,300) 4,637
Foreign exchange gain/(loss) (161) 69
Net loss on development property - (110)
Net profit before tax 18,404 30,042
Income tax credit 443 8
Net profit after income tax 18,847 30,050

Reconciliation of profit
40
Reconciliation of net profit after tax to profit from operating activities
31 December
2011
31 December
2010
$’000 $’000
Net profit after tax attributable to unitholders of CDI 18,847 30,050
Adjusted for:
Straight-lining of rental (income)/expense (2,020) (1,476)
Fair value movement of derivatives held at the end of the period 6,154 (2,909)
Fair value movement of investment properties sold during the period 64 219
Fair value movement of investment properties held at the end of the period 1,082 (1,947)
Fair value movements 7,300 (4,637)
Foreign exchange (gain)/loss 161 (69)
Property, plant and equipment depreciation 14 12
Net (gain)/loss on development property - 110
Income tax (credit)/expense (443) (8)
Profit from operating activities 23,859 23,982
Normalised earnings per unit (cents) 2.67 2.63

41
Distribution statement
31 December 2011 31 December 2010
$’000 $’000
Profit from operating activities 23,859 23,982
Non-cash expenses
Amortisation of borrowing costs 590 118
Other transfers per distribution policy
Debt establishment costs (1,210) (575)
Maintenance capital expenditure (1,345) (1,597)
Leasing costs (2,880) (260)
Income tax expense/(credit) (14) -
Total income available for distribution 19,000 21,668
Less: Current year undistributed income carried forward (881) (3,399)
Distribution to unitholders 18,119 18,269
Distribution per unit (cents) 2.05 2.00

Available funds from operations (AFFO)
42
Available funds from operations (AFFO)
31 December
2011
31 December
2010
$’000 $’000
Profit from operating activities 23,859 23,982
Add/(deduct):
Amortisation of borrowing costs 590 118
Leasing costs (2,880) (260)
Maintenance capital expenditure (1,345) (1,597)
Debt establishment fees (1,210) (575)
Capitalised interest (1,369) (704)
Available funds from operations 17,645 20,964
Distribution to unitholders 18,119 18,269
AFFO distribution payout ratio 102.7% 87.1%

43 43
Net property income
-
Acquisition
Australian portfolio 1H12 1H11 Variance
($'000) ($'000) ($'000) %
Office
ABS House, Belconnen, ACT 3,693 3,593 100 3
31 Queen Street, Melbourne, VIC 3,181 - 3,181 Large
DIAC Building, Belconnen, ACT 2,582 2,505 77 3
The Forum, Cisco, St Leonards, NSW 2,560 2,397 163 7
Discovery House, Woden, ACT 2,342 2,283 59 3
Makerston House, Brisbane, QLD 1,924 1,827 97 5
The Forum, Verizon, St Leonards, NSW 481 765 (284) (37)
Elder House, Adelaide, SA 1,379 1,328 51 4
Executive Building, Hobart, TAS 933 964 (31) (3)
Office total 19,075 15,662 3,413 22
Retail
Jam Factory, South Yarra, VIC 2,579 2,558 21 1
Century City Walk, Glen Waverley, VIC 1,389 1,233 156 13
Innaloo Cinema Centre, Innaloo, WA 827 902 (75) (8)
Kings Langley, Kings Langley, NSW 383 432 (49) (11)
Retail total 5,178 5,125 53 1
Industrial – Distribution Centres
The Junction Stage 1, Enfield, NSW 823 818 5 1
6 Foray Street, Fairfield, NSW 352 222 130 59
Spotlight, Laverton North, VIC 625 691 (66) (10)
12-30 Toll Drive, Altona North, VIC 642 609 33 5
2-10 Toll Drive, Altona North, VIC 315 303 12 4
1-9 Toll Drive, Altona North, VIC 169 153 16 10
Industrial – Distribution Centres total 2,926 2,796 130 5
Industrial – High-Tech
Taylors House, Waterloo, NSW 1,282 1,247 35 3
75 Talavera Road, North Ryde, NSW 600 402 198 49
187 Todd Road, Port Melbourne, VIC (80) 72 (152) (211)
Giffnock Avenue, North Ryde, NSW 623 687 (64) (9)
Industrial – High-Tech total 2,425 2,408 17 1
Sold properties
Pacific Brands, Port Melbourne, VIC 112 532 (420) (79)
478 Freeman Road, Richlands, QLD - 445 (445) (100)
Sold properties total 112 977 (865) (89)
Australia total 29,716 26,968 2,748 10

44 44
Net property income - continued
Note: All amounts exclude straight-lining of rental income.
Sold
French portfolio 1H12 1H11 Variance
(€'000) (€'000) (€'000) %
Sully, Sully sur Loire 533 521 12 2
Aulnay, Aulnay sous Bois, Paris 337 289 48 17
Beziers, Villeneuve les Beziers 357 336 21 6
Gennevillers, Gennevilliers, Paris 337 333 4 1
Tours, Parcay-Meslay, Tours 223 214 9 4
1,787 1,693 94 6
Sold properties
Toulouse, Toulouse - 67 (67) (100)
Europe total 1,787 1,760 27 2


![NetworkiE] - Bombay Stock Exchangemedia conglomerates in India and also the most diversified. Under a single unified group, we cater to diversified but synergistic interests with a](https://static.fdocuments.net/doc/165x107/5eca859b9aeafb5f637065d9/networkie-bombay-stock-exchange-media-conglomerates-in-india-and-also-the-most.jpg)