Ch.7: March 02, 2004 1 Chapter 7 Producing Data: Sampling.
33
Ch.7: March 02, 2004 1 Chapter 7 Producing Data: Sampling
-
Upload
blaze-small -
Category
Documents
-
view
216 -
download
1
Transcript of Ch.7: March 02, 2004 1 Chapter 7 Producing Data: Sampling.

Ch.7: March 02, 2004 1
Chapter 7
Producing Data: Sampling

2Ch.7: March 02, 2004
Researchers often want to answer questions about some large group of individuals (this group is called the population)
Often the researchers cannot measure (or survey) all individuals in the population, so they measure a subset of individuals that is chosen to represent the entire population (this subset is called a sample)
The researchers then use statistical techniques to make conclusions about the population based on the sample (making inferences).
Population and Sample

3Ch.7: March 02, 2004
How Data are Obtained Observational Study
Observes individuals and measures variables of interest but does not attempt to influence the responses
Describes some group or situation Ex: Sample surveys are observational studies
Experiment Deliberately imposes some treatment on
individuals in order to observe their responses Studies whether the treatment causes change in
the response.

4Ch.7: March 02, 2004
Observational Study vs. Experiment
Observational Study observe differences in the explanatory
variable and notice any related differences in the response variable (association between
variables) Experiment
create differences in the explanatory variable and examine any resulting changes in the response variable (cause-and-effect conclusion)
Both typically have the goal of detecting a relationship between the explanatory and response variables.

5Ch.7: March 02, 2004
Case Study
Weight Gain Spells
Heart Risk for Women
“Weight, weight change, and coronary heart disease in women.” W.C. Willett, et. al., vol. 273(6), Journal of the American Medical Association, Feb. 8, 1995.
(Reported in Science News, Feb. 4, 1995, p. 108)

6Ch.7: March 02, 2004
Case Study
Objective:To recommend a range of body mass index (a function of weight and height) in terms of
coronary heart disease (CHD) risk in women.
Weight Gain Spells
Heart Risk for Women

7Ch.7: March 02, 2004
Case Study
Study started in 1976 with 115,818 women aged 30 to 55 years and without a history of previous CHD.
Each woman’s weight (body mass) was determined
Each woman was asked her weight at age 18.
8Ch.7: March 02, 2004
Case Study
The cohort of women were followed for 14 years.
The number of CHD (fatal and nonfatal) cases were counted (1292 cases).
Results were adjusted for other variables (smoking, family history, menopausal status, post-menopausal hormone use).

9Ch.7: March 02, 2004
Case Study
Results: compare those who gained less than 11 pounds (from age 18 to current age) to the others.11 to 17 lbs: 25% more likely to develop heart
disease17 to 24 lbs: 64% more likely24 to 44 lbs: 92% more likelymore than 44 lbs: 165% more likely

10Ch.7: March 02, 2004
Case Study
What is the population?
What is the sample?
Weight Gain Spells
Heart Risk for Women

11Ch.7: March 02, 2004
Case Study
Is this an experimentor
an observational study?
Weight Gain Spells
Heart Risk for Women

12Ch.7: March 02, 2004
Case Study
Does weight gain in women increase their risk
for CHD?
Weight Gain Spells
Heart Risk for Women

13Ch.7: March 02, 2004
1. Voluntary Response
2. Convenience Sampling
3. Probability Samples:a) Simple Random Sample (SRS)
b) Stratified Random Sample
c) Multistage Sample
Sampling Methods

14Ch.7: March 02, 2004
Voluntary Response To prepare for her book Women and Love, Shere
Hite sent questionnaires to 100,000 women asking about love, sex, and relationships. 4.5% responded Hite used those responses to write her book
Moore (Statistics: Concepts and Controversies, 1997) noted: respondents “were fed up with men and eager to fight
them…” “the anger became the theme of the book…” “but angry women are more likely” to respond
15Ch.7: March 02, 2004
Convenience Sampling
Sampling mice from a large cage to study how a drug affects physical activity lab assistant reaches into the cage to select
the mice one at a time until 10 are chosen
Which mice will likely be chosen?could this sample yield biased results?

16Ch.7: March 02, 2004
Bad Sampling Designs Voluntary response sampling
allowing individuals to choose to be in the sample
Convenience sampling the interviewer chooses who is in the sample
Both of these techniques are biased– systematically favor certain outcomes

17Ch.7: March 02, 2004
Probability Sample
a sample chosen by chance must know what samples are possible
and what chance, or probability, each possible sample has of being selected
a SRS gives each member of the population an equal chance to be selected

18Ch.7: March 02, 2004
Simple Random Sampling Each individual in the population has the same
chance of being chosen for the sample Each group of individuals (in the population) of
the required size (n) has the same chance of being the sample actually selected
Random selection: “drawing names out of a hat” table of random digits computer software

19Ch.7: March 02, 2004
Table of Random Digits
20Ch.7: March 02, 2004
Table of Random Digits Table B on pg. 654 of text
each entry is equally likely to be any of the 10 digits 0 through 9
entries are independent of each other (knowledge of one entry gives no information about any other entries)
each pair of entries is equally likely to be any of the 100 pairs 00, 01,…, 99
each triple of entries is equally likely to be any of the 1000 values 000, 001, …, 999

21Ch.7: March 02, 2004
Choosing a Simple Random Sample (SRS)
STEP 1: Label each individual in the population
STEP 2: Use Table B to select labels at random

22Ch.7: March 02, 2004
Stratified Random Sample
first divide the population into groups of similar individuals, called strata
second, choose a separate SRS in each stratum
third, combine these SRSs to form the full sample
23Ch.7: March 02, 2004
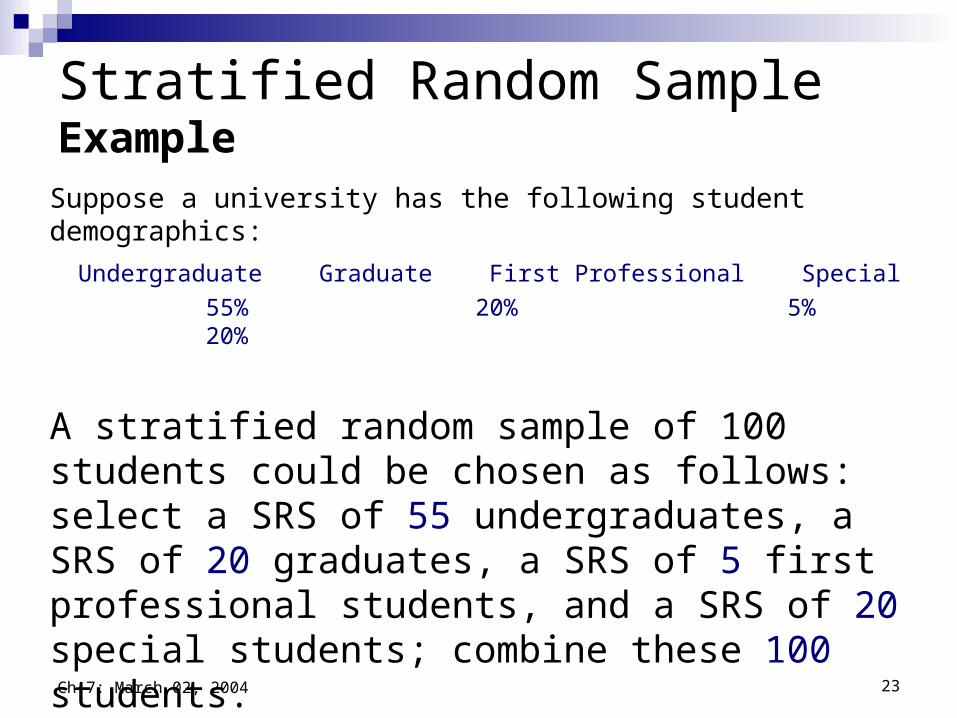
Stratified Random SampleExample
Suppose a university has the following student demographics:
Undergraduate Graduate First Professional Special
55% 20% 5% 20%
A stratified random sample of 100 students could be chosen as follows: select a SRS of 55 undergraduates, a SRS of 20 graduates, a SRS of 5 first professional students, and a SRS of 20 special students; combine these 100 students.

24Ch.7: March 02, 2004
Multistage Sample
several stages of sampling are carried out useful for large-scale sample surveys samples at each stage may be SRSs, but
are often stratified stages may involve other random sampling
techniques as well (cluster, systematic, random digit dialing, …)

25Ch.7: March 02, 2004
4 Cautions about Sample Surveys1. Undercoverage
some individuals or groups in the population are left out of the process of choosing the sample
2. Nonresponse individuals chosen for the sample cannot be
contacted or refuse to cooperate/respond3. Response bias
behavior of respondent or interviewer may lead to inaccurate answers or measurements
4. Wording of questions confusing or leading (biased) questions; words with
different meanings
26Ch.7: March 02, 2004
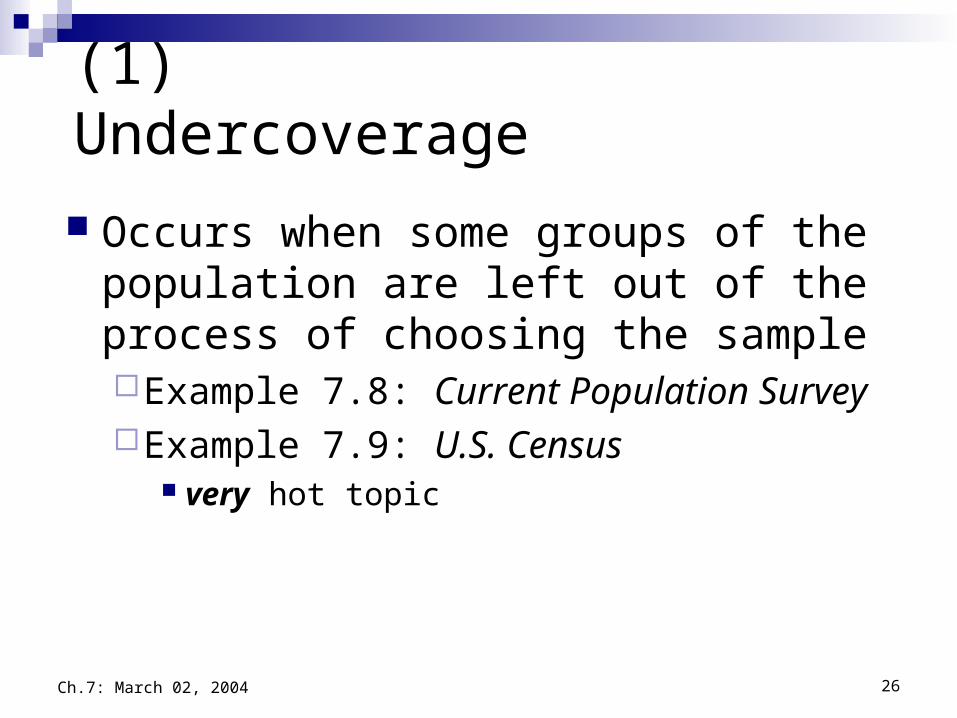
(1) Undercoverage
Occurs when some groups of the population are left out of the process of choosing the sampleExample 7.8: Current Population SurveyExample 7.9: U.S. Census
very hot topic
27Ch.7: March 02, 2004
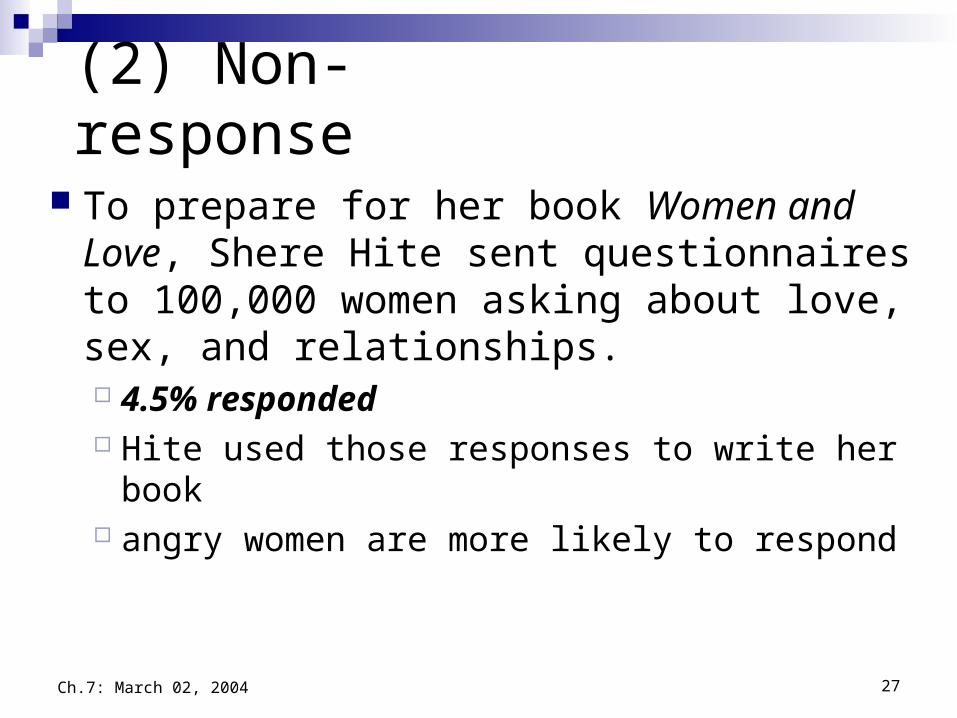
(2) Non-response
To prepare for her book Women and Love, Shere Hite sent questionnaires to 100,000 women asking about love, sex, and relationships. 4.5% responded Hite used those responses to write her book angry women are more likely to respond
28Ch.7: March 02, 2004
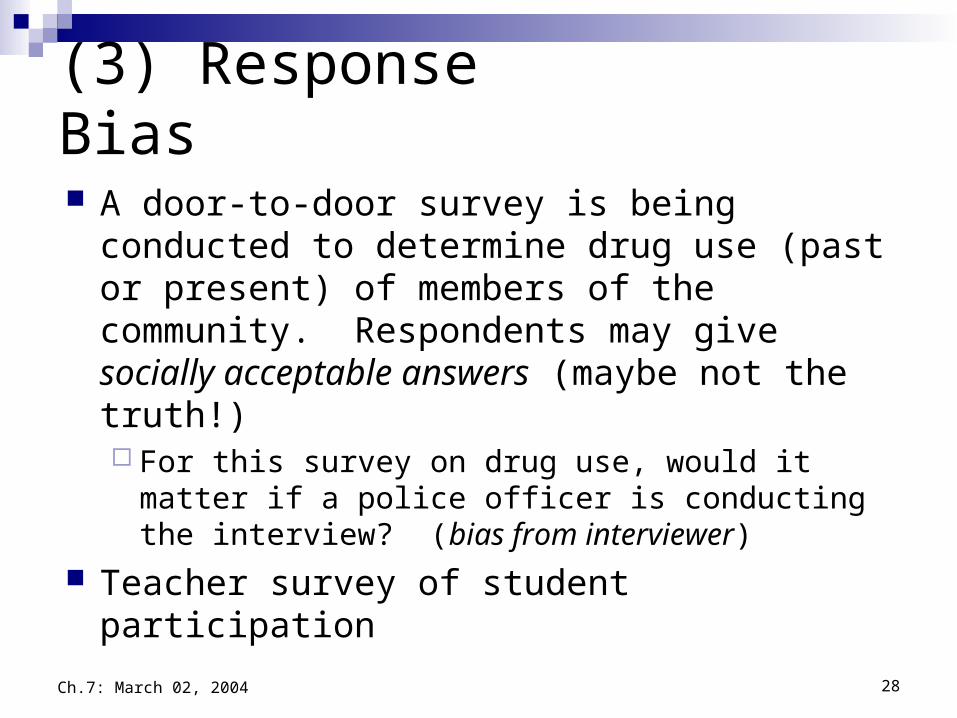
(3) Response Bias
A door-to-door survey is being conducted to determine drug use (past or present) of members of the community. Respondents may give socially acceptable answers (maybe not the truth!) For this survey on drug use, would it matter if a police
officer is conducting the interview? (bias from interviewer)
Teacher survey of student participation

29Ch.7: March 02, 2004
Asking the UninformedWashington Post National Weekly Edition (April 10-16, 1995, p. 36)
A 1978 poll done in Cincinnati asked people whether they “favored or opposed repealing the 1975 Public Affairs Act.”
(3) Response Bias
There was no such act!About one third of those asked expressed
an opinion about it.

30Ch.7: March 02, 2004
(4) Wording of QuestionsA newsletter distributed by a politician to his constituents gave the results of a “nationwide survey on Americans’ attitudes about a variety of educational issues.” One of the questions asked was,
“Should your legislature adopt a policy to assist children in failing schools to opt out of that school and attend an alternative school--public, private, or parochial--of the
parents’ choosing?”
From the wording of this question, can you speculate on what answer was desired? Explain.

31Ch.7: March 02, 2004
(4) Wording: Deliberate Bias
“If you found a wallet with $20 in it, would you return the money?”
“If you found a wallet with $20 in it, would you do the right thing and return the money?”
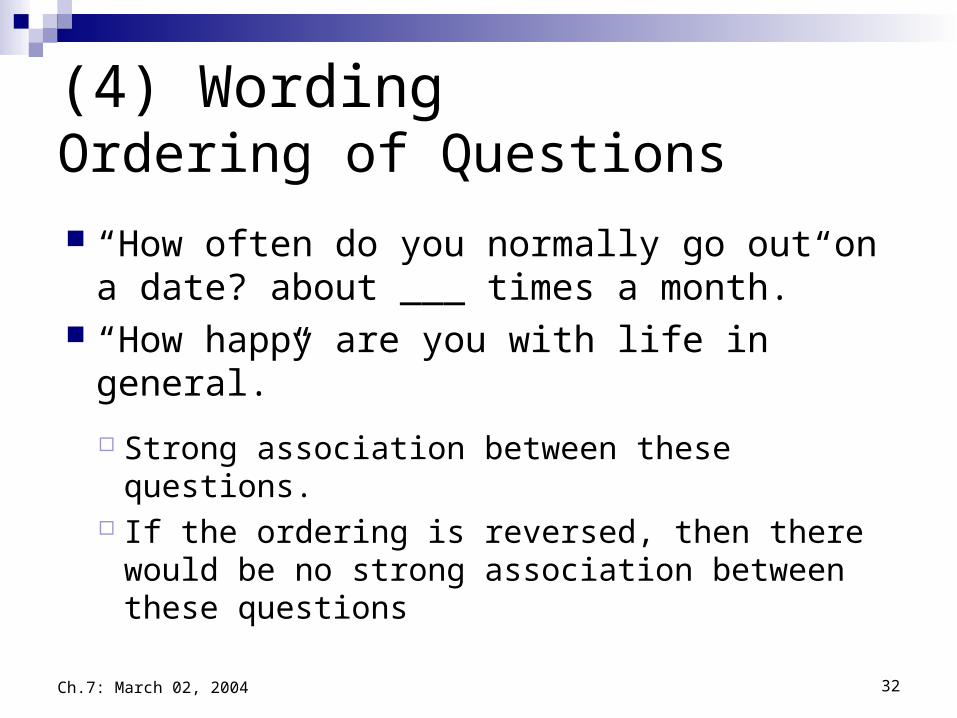
32Ch.7: March 02, 2004
(4) WordingOrdering of Questions
“How often do you normally go out on a date? about ___ times a month.”
“How happy are you with life in general.”
Strong association between these questions. If the ordering is reversed, then there would
be no strong association between these questions

33Ch.7: March 02, 2004
Inferences about the Population Values calculated from samples are used to
make conclusions (inferences) about unknown values in the population
Variability different samples from the same population may yield
different results for a particular value of interest estimates from random samples will be closer to the
true values in the population if the samples are larger
how close the estimates will likely be to the true values can be calculated -- this is called the margin of error