C.H. Robinson Reports 2018 First Quarter Results€¢ Interest and other expenses increased by $1.4...
12
1 C.H. Robinson 14701 Charlson Rd. Eden Prairie, MN 55347 www.chrobinson.com FOR INQUIRIES, CONTACT: Robert Houghton, VP of Investor Relations and Treasury Email: [email protected] FOR IMMEDIATE RELEASE C.H. Robinson Reports 2018 First Quarter Results MINNEAPOLIS, MN, May 1, 2018 - C.H. Robinson Worldwide, Inc. (“C.H. Robinson”) (NASDAQ: CHRW) today reported financial results for the quarter ended March 31, 2018. • Total revenues increased 14.9 percent to $3.9 billion • Net revenues increased 10.1 percent to $625.9 million • Aggregate transportation volume increase of 1.5 percent • Income from operations increased 1.9 percent to $191.6 million • Diluted earnings per share (EPS) increased 17.4 percent to $1.01 • Operating cash flow increased 116.4 percent to $200.6 million “In a rapidly changing freight environment, we were able to deliver double-digit net revenue growth, expand our digital capabilities, make significant investments in our Global Forwarding business and deliver increased operating income,” said John Wiehoff, Chairman and Chief Executive Officer of C.H. Robinson. “We delivered a significant improvement in operating cash flow and returned nearly $135 million to shareholders, a 23 percent increase versus the first quarter of last year.” First Quarter Results Summary • Total revenues increased 14.9 percent to $3.9 billion, driven by growth across all transportation service lines.
Transcript of C.H. Robinson Reports 2018 First Quarter Results€¢ Interest and other expenses increased by $1.4...

1
C.H. Robinson
14701 Charlson Rd.
Eden Prairie, MN 55347
www.chrobinson.com
FOR INQUIRIES, CONTACT:
Robert Houghton, VP of Investor Relations and Treasury
Email: [email protected]
FOR IMMEDIATE RELEASE
C.H. Robinson Reports 2018 First Quarter Results
MINNEAPOLIS, MN, May 1, 2018 - C.H. Robinson Worldwide, Inc. (“C.H. Robinson”) (NASDAQ:
CHRW) today reported financial results for the quarter ended March 31, 2018.
• Total revenues increased 14.9 percent to $3.9 billion
• Net revenues increased 10.1 percent to $625.9 million
• Aggregate transportation volume increase of 1.5 percent
• Income from operations increased 1.9 percent to $191.6 million
• Diluted earnings per share (EPS) increased 17.4 percent to $1.01
• Operating cash flow increased 116.4 percent to $200.6 million
“In a rapidly changing freight environment, we were able to deliver double-digit net revenue growth,
expand our digital capabilities, make significant investments in our Global Forwarding business and
deliver increased operating income,” said John Wiehoff, Chairman and Chief Executive Officer of C.H.
Robinson. “We delivered a significant improvement in operating cash flow and returned nearly
$135 million to shareholders, a 23 percent increase versus the first quarter of last year.”
First Quarter Results Summary
• Total revenues increased 14.9 percent to $3.9 billion, driven by growth across all transportation
service lines.

2
• Net revenues increased 10.1 percent to $625.9 million, driven primarily by growth in truckload, less
than truckload ("LTL"), air, ocean and customs services.
• Operating expenses increased 14.1 percent to $434.3 million. Personnel expenses increased 13.0
percent to $328.3 million, driven primarily by a 5.7 percent increase in average headcount and higher
variable compensation expense. Selling, general and administrative ("SG&A") expenses increased
17.7 percent to $106.0 million, due primarily to a favorable $8.75 million legal settlement in the prior
year and increased bad debt, occupancy and equipment maintenance and depreciation expense in the
current year.
• Income from operations totaled $191.6 million, up 1.9 percent from last year. Operating margin of
30.6 percent declined 250 basis points.
• Interest and other expenses increased by $1.4 million, driven primarily by increased debt levels and
higher variable interest rates on short-term debt.
• The effective tax rate in the quarter was 21.3 percent compared to 31.7 percent last year, driven
primarily by a $17.1 million benefit from the Tax Cuts and Jobs Act of 2017.
• Net income totaled $142.3 million, up 16.6 percent from a year ago. Diluted EPS of $1.01 increased
17.4 percent.
North American Surface Transportation ("NAST") Results
Summarized financial results of our NAST segment are as follows (dollars in thousands):
Three Months Ended March 31,
2018 2017 % change
Total revenues (1) $ 2,663,011 $ 2,259,252 17.9 %
Net revenues 414,769 372,440 11.4 %
Income from operations 174,078 155,877 11.7 %
(1) Excludes intersegment revenues.
First quarter total revenues for C.H. Robinson's NAST segment totaled $2.7 billion, an increase of 17.9
percent over the prior year, driven by increased pricing. Total NAST net revenues increased 11.4 percent
in the quarter to $414.8 million. Net revenues in truckload increased 10.1 percent driven by higher pricing.
LTL net revenues increased 14.8 percent due to higher pricing and volumes. Intermodal net revenues
decreased 13.8 percent driven by increased accessorial and dray costs. Excluding the impact of the change
in fuel prices, our average North America truckload rate per mile charged to customers increased
approximately 21 percent in the quarter, while our truckload transportation costs increased approximately

3
21.5 percent. NAST volume increased approximately 1 percent in the quarter, as a 7 percent decline in
truckload volume was more than offset by LTL and intermodal volume growth of 8 percent and 3 percent,
respectively. Operating expenses increased 11.1 percent in the quarter due to increased variable
compensation and the favorable $8.75 million legal settlement in the year-ago period. Income from
operations increased 11.7 percent in the quarter, and operating margin expanded 10 basis points to 42.0
percent. NAST average headcount was approximately flat in the quarter.
Global Forwarding Results
Summarized financial results of our Global Forwarding segment are as follows (dollars in thousands):
Three Months Ended March 31,
2018 2017 % change
Total revenues (1) $ 553,754 $ 468,788 18.1 %
Net revenues 123,037 106,546 15.5 %
Income from operations 8,221 16,206 (49.3 )%
(1) Excludes intersegment revenues.
First quarter total revenues for the Global Forwarding segment increased 18.1 percent to $553.8 million,
driven by double-digit volume growth across all service lines. Net revenues increased 15.5 percent in the
quarter to $123.0 million. Ocean net revenues increased 8.3 percent. Net revenues in air increased 27.7
percent. Customs net revenues increased 28.5 percent. The acquisition of Milgram & Company added
approximately 5 percentage points to the net revenue growth in the quarter. Income from operations
declined 49.3 percent to $8.2 million due to a 21.4 percent increase in average headcount, including
investments to build scale in air freight, and technology investments across all service lines. Milgram
added approximately 7.5 percentage points to the Global Forwarding average headcount. Operating
margin declined 850 basis points to 6.7 percent in the quarter.
4
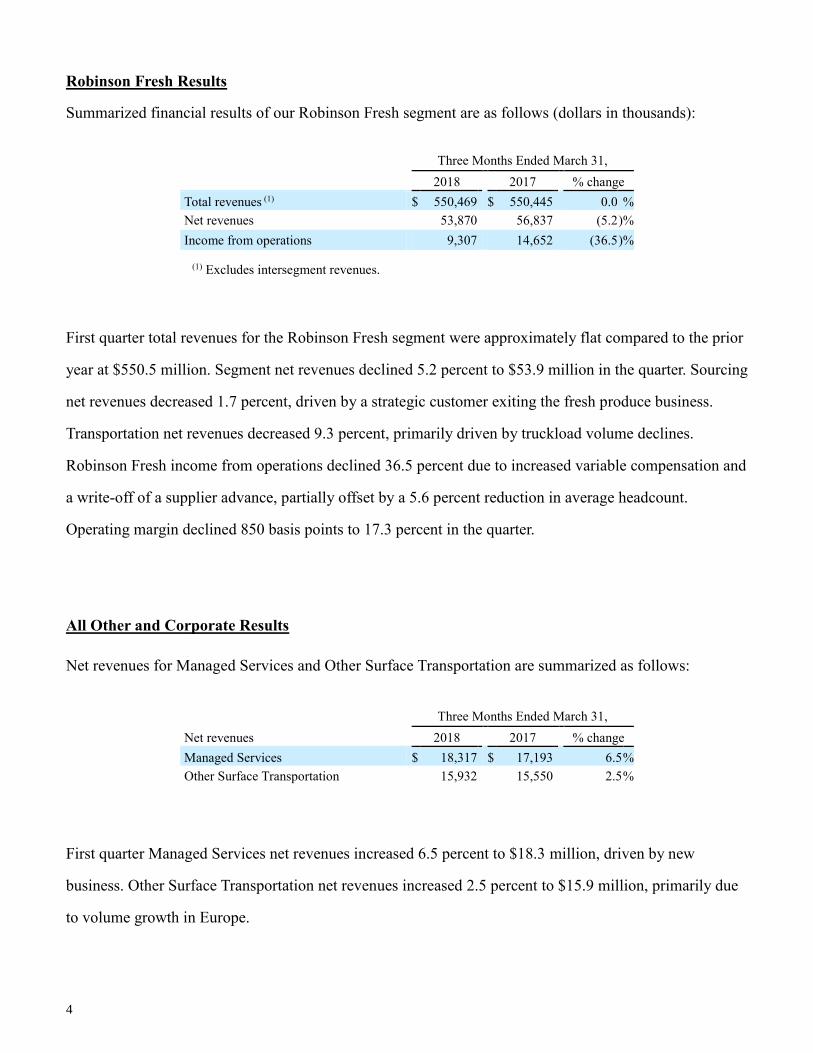
Robinson Fresh Results
Summarized financial results of our Robinson Fresh segment are as follows (dollars in thousands):
Three Months Ended March 31,
2018 2017 % change
Total revenues (1) $ 550,469 $ 550,445 0.0 %
Net revenues 53,870 56,837 (5.2 )%
Income from operations 9,307 14,652 (36.5 )%
(1) Excludes intersegment revenues.
First quarter total revenues for the Robinson Fresh segment were approximately flat compared to the prior
year at $550.5 million. Segment net revenues declined 5.2 percent to $53.9 million in the quarter. Sourcing
net revenues decreased 1.7 percent, driven by a strategic customer exiting the fresh produce business.
Transportation net revenues decreased 9.3 percent, primarily driven by truckload volume declines.
Robinson Fresh income from operations declined 36.5 percent due to increased variable compensation and
a write-off of a supplier advance, partially offset by a 5.6 percent reduction in average headcount.
Operating margin declined 850 basis points to 17.3 percent in the quarter.
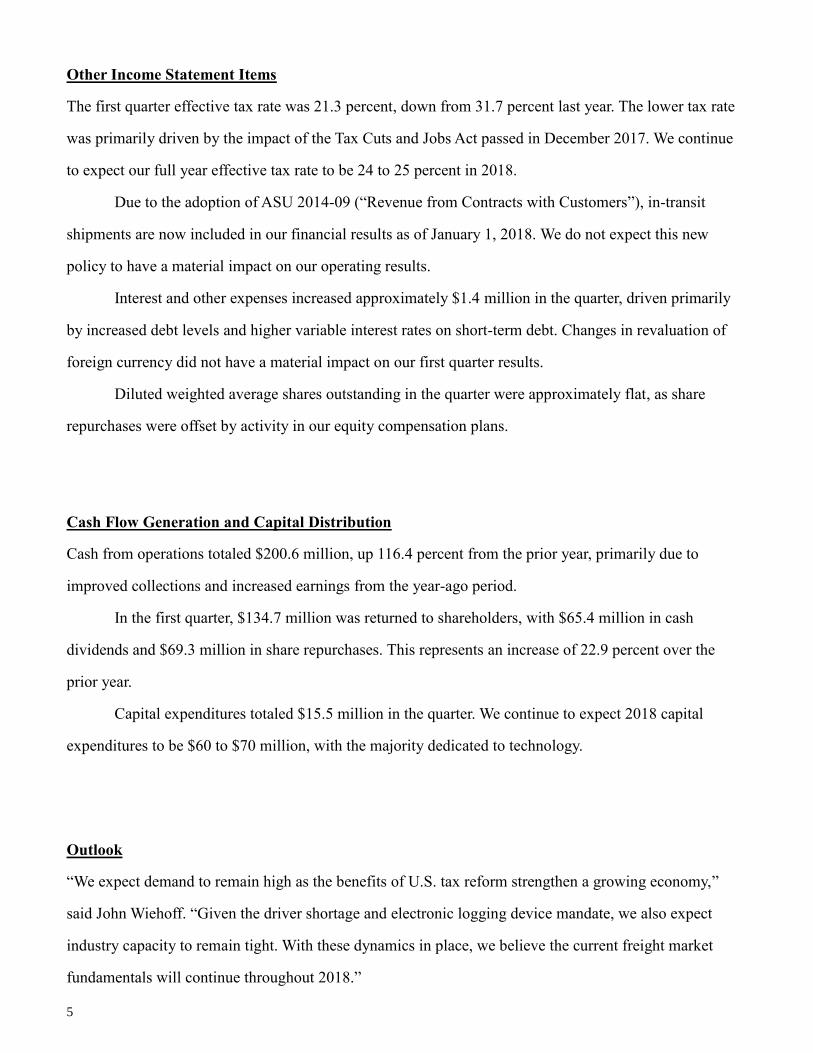
All Other and Corporate Results
Net revenues for Managed Services and Other Surface Transportation are summarized as follows:
Three Months Ended March 31,
Net revenues 2018 2017 % change
Managed Services $ 18,317 $ 17,193 6.5 %
Other Surface Transportation 15,932 15,550 2.5 %
First quarter Managed Services net revenues increased 6.5 percent to $18.3 million, driven by new
business. Other Surface Transportation net revenues increased 2.5 percent to $15.9 million, primarily due
to volume growth in Europe.
5
Other Income Statement Items
The first quarter effective tax rate was 21.3 percent, down from 31.7 percent last year. The lower tax rate
was primarily driven by the impact of the Tax Cuts and Jobs Act passed in December 2017. We continue
to expect our full year effective tax rate to be 24 to 25 percent in 2018.
Due to the adoption of ASU 2014-09 (“Revenue from Contracts with Customers”), in-transit
shipments are now included in our financial results as of January 1, 2018. We do not expect this new
policy to have a material impact on our operating results.
Interest and other expenses increased approximately $1.4 million in the quarter, driven primarily
by increased debt levels and higher variable interest rates on short-term debt. Changes in revaluation of
foreign currency did not have a material impact on our first quarter results.
Diluted weighted average shares outstanding in the quarter were approximately flat, as share
repurchases were offset by activity in our equity compensation plans.
Cash Flow Generation and Capital Distribution
Cash from operations totaled $200.6 million, up 116.4 percent from the prior year, primarily due to
improved collections and increased earnings from the year-ago period.
In the first quarter, $134.7 million was returned to shareholders, with $65.4 million in cash
dividends and $69.3 million in share repurchases. This represents an increase of 22.9 percent over the
prior year.
Capital expenditures totaled $15.5 million in the quarter. We continue to expect 2018 capital
expenditures to be $60 to $70 million, with the majority dedicated to technology.
Outlook
“We expect demand to remain high as the benefits of U.S. tax reform strengthen a growing economy,”
said John Wiehoff. “Given the driver shortage and electronic logging device mandate, we also expect
industry capacity to remain tight. With these dynamics in place, we believe the current freight market
fundamentals will continue throughout 2018.”

6
John continued, “We believe our large carrier network and proven ability to source capacity for our
customers is as important as ever in this volatile market. We will leverage our digital transformation to
expand the supply chain expertise we provide to our customers and carriers and drive operating
efficiencies in our business to increase returns to our employees and shareholders. I am confident that we
have the right people, processes and technology to continue to win in the marketplace.”
7
About C.H. Robinson
At C.H. Robinson, we believe in accelerating global trade to seamlessly deliver the products and goods that drive the world’s
economy. Using the strengths of our knowledgeable people, proven processes, and global technology, we help our customers
work smarter, not harder. As one of the world’s largest third-party logistics providers (3PL), we provide a broad portfolio of
logistics services, fresh produce sourcing and managed services for more than 120,000 customers and 73,000 active contract
carriers through our integrated network of offices and more than 15,000 employees. In addition, the company, our Foundation
and our employees contribute millions of dollars annually to a variety of organizations. Headquartered in Eden Prairie,
Minnesota, C.H. Robinson (CHRW) has been publicly traded since 1997. For more information, visit www.chrobinson.com.
Except for the historical information contained herein, the matters set forth in this release are forward-looking statements that
represent our expectations, beliefs, intentions or strategies concerning future events. These forward-looking statements are
subject to certain risks and uncertainties that could cause actual results to differ materially from our historical experience or
our present expectations, including, but not limited to such factors as changes in economic conditions, including uncertain
consumer demand; changes in market demand and pressures on the pricing for our services; competition and growth rates
within the third party logistics industry; freight levels and increasing costs and availability of truck capacity or alternative
means of transporting freight, and changes in relationships with existing truck, rail, ocean, and air carriers; changes in our
customer base due to possible consolidation among our customers; our ability to successfully integrate the operations of
acquired companies with our historic operations; risks associated with litigation and insurance coverage; risks associated with
operations outside of the U.S.; risks associated with the potential impacts of changes in government regulations; risks
associated with the produce industry, including food safety and contamination issues; fuel prices and availability; risks of
unexpected or unanticipated events or opportunities that might require additional capital expenditures; the impact of war on
the economy; and other risks and uncertainties detailed in our Annual and Quarterly Reports.
Any forward-looking statement speaks only as of the date on which such statement is made, and we undertake no
obligation to update such statement to reflect events or circumstances arising after such date. All remarks made during
our financial results conference call will be current at the time of the call, and we undertake no obligation to update the
replay.
Conference Call Information:
C.H. Robinson Worldwide First Quarter 2018 Earnings Conference Call
Wednesday, May 2, 2018; 8:30 a.m. Eastern Time
Presentation slides and a simultaneous live audio webcast of the conference call may be accessed through the Investor
Relations link on C.H. Robinson’s website at www.chrobinson.com.
To participate in the conference call by telephone, please call ten minutes early by dialing: 877-269-7756
International callers dial +1-201-689-7817
Callers should reference the conference ID, which is 13677149
We invite call participants to submit questions in advance of the conference call, and we will respond to as many of the
questions as we can in the time allowed. To submit your question(s) in advance of the call, please email

8
Summarized Financial Results
($ in thousands, except per share data)
Three Months Ended March 31,
2018 2017 % change
Total revenues $ 3,925,327 $ 3,415,125 14.9 %
Net revenues:
Transportation
Truckload $ 330,291 $ 304,122 8.6 %
LTL 112,144 97,623 14.9 %
Intermodal 6,332 7,492 (15.5 )%
Ocean 68,844 62,875 9.5 %
Air 28,883 21,817 32.4 %
Customs 20,655 16,078 28.5 %
Other logistics services 28,889 28,151 2.6 %
Total transportation 596,038 538,158 10.8 %
Sourcing 29,887 30,408 (1.7 )%
Total net revenues 625,925 568,566 10.1 %
Operating expenses 434,340 380,608 14.1 %
Income from operations 191,585 187,958 1.9 %
Net income $ 142,297 $ 122,080 16.6 %
Diluted EPS $ 1.01 $ 0.86 17.4 %
This table of summary results presents our service line net revenues consistent with our historical presentation and is on an
enterprise basis. The service line net revenues in the table differ from the service line net revenues discussed within the
segments as our segments have revenues from multiple service lines.

9
Condensed Consolidated Statements of Income
(unaudited, in thousands, except per share data)
Three Months Ended March 31,
2018 2017
Revenues:
Transportation $ 3,637,640 $ 3,102,043
Sourcing 287,687 313,082
Total revenues 3,925,327 3,415,125
Costs and expenses:
Purchased transportation and related services 3,041,602 2,563,885
Purchased products sourced for resale 257,800 282,674
Personnel expenses 328,297 290,504
Other selling, general, and administrative expenses 106,043 90,104
Total costs and expenses 3,733,742 3,227,167
Income from operations 191,585 187,958
Interest and other expense (10,700 ) (9,302 )
Income before provision for income taxes 180,885 178,656
Provisions for income taxes 38,588 56,576
Net income $ 142,297 $ 122,080
Net income per share (basic) $ 1.02 $ 0.86
Net income per share (diluted) $ 1.01 $ 0.86
Weighted average shares outstanding (basic) 140,032 141,484
Weighted average shares outstanding (diluted) 141,270 141,858

10
Business Segment Information
(unaudited, dollars in thousands)
NAST Global
Forwarding Robinson
Fresh
All
Other and Corporate Eliminations Consolidated
Three Months Ended March 31, 2018
Revenues $ 2,663,011 $ 553,754 $ 550,469 $ 158,093 $ — $ 3,925,327
Intersegment revenues (1) 123,545 9,364 48,346 6,299 (187,554 ) —
Total revenues $ 2,786,556 $ 563,118 $ 598,815 $ 164,392 $ (187,554 ) $ 3,925,327
Net revenues $ 414,769 $ 123,037 $ 53,870 $ 34,249 $ — $ 625,925
Operating income $ 174,078 $ 8,221 $ 9,307 $ (21 ) $ — $ 191,585
Depreciation and amortization $ 6,133 $ 8,909 $ 1,173 $ 8,026 $ — $ 24,241
Total Assets $ 2,383,229 $ 805,184 $ 412,415 $ 706,948 $ — $ 4,307,776
Average headcount 6,855 4,767 907 2,559 — 15,088
NAST Global
Forwarding Robinson
Fresh
All
Other and
Corporate Eliminations Consolidated
Three Months Ended March 31, 2017
Revenues $ 2,259,252 $ 468,788 $ 550,445 $ 136,640 $ — $ 3,415,125
Intersegment revenues (1) 101,154 8,143 33,340 6,878 (149,515 ) —
Total revenues $ 2,360,406 $ 476,931 $ 583,785 $ 143,518 $ (149,515 ) $ 3,415,125
Net revenues $ 372,440 $ 106,546 $ 56,837 $ 32,743 $ — $ 568,566
Operating income $ 155,877 $ 16,206 $ 14,652 $ 1,223 $ — $ 187,958
Depreciation and amortization $ 5,590 $ 8,020 $ 1,146 $ 7,675 $ — $ 22,431
Total Assets $ 2,126,900 $ 699,139 $ 409,972 $ 539,733 $ — $ 3,775,744
Average headcount 6,844 3,926 961 2,548 — 14,279
(1) Intersegment revenues represent the sales between our segments and are eliminated to reconcile to our consolidated results.

11
Condensed Consolidated Balance Sheets
(unaudited, in thousands)
March 31, 2018 December 31, 2017
Assets
Current assets:
Cash and cash equivalents $ 349,782 $ 333,890
Receivables, net 2,019,333 2,113,930
Contract assets 161,028 —
Other current assets 60,870 63,116
Total current assets 2,591,013 2,510,936
Property and equipment, net 230,609 230,326
Intangible and other assets 1,486,154 1,494,572
Total assets $ 4,307,776 $ 4,235,834
Liabilities and stockholders’ investment
Current liabilities:
Accounts payable and outstanding checks $ 1,064,961 $ 1,096,664
Accrued expenses:
Transportation expense 111,920 —
Compensation 69,723 105,316
Income taxes 42,781 12,240
Other accrued liabilities 54,025 58,229
Current portion of debt 651,000 715,000
Total current liabilities 1,994,410 1,987,449
Long term debt 750,000 750,000
Noncurrent income taxes payable 25,215 26,684
Deferred tax liability 52,883 45,355
Other long-term liabilities 596 601
Total liabilities 2,823,104 2,810,089
Total stockholders’ investment 1,484,672 1,425,745
Total liabilities and stockholders’ investment $ 4,307,776 $ 4,235,834

12
Condensed Consolidated Statements of Cash Flow
(unaudited, in thousands, except operational data)
Three Months Ended March 31,
2018 2017
Operating activities:
Net income $ 142,297 $ 122,080
Stock-based compensation 18,134 12,318
Depreciation and amortization 24,241 22,431
Provision for doubtful accounts 6,630 3,618
Deferred income taxes (26 ) (2,048 )
Excess tax benefit on stock-based compensation (6,224 ) (9,344 )
Other 323 485
Changes in operating elements, net of acquisitions:
Receivables (10,056 ) (95,204 )
Contract assets (13,264 ) —
Prepaid expenses and other 6,327 (6,049 )
Other non-current assets 1,093 (1,016 )
Accounts payable and outstanding checks 21,797 47,201
Accrued transportation expenses 17,109 —
Accrued compensation and profit-sharing contribution (37,867 ) (37,864 )
Accrued income taxes 35,184 51,949
Other accrued liabilities (5,128 ) (15,861 )
Net cash provided by operating activities 200,570 92,696
Investing activities:
Purchases of property and equipment (11,719 ) (13,537 )
Purchases and development of software (3,744 ) (3,183 )
Acquisitions, net of cash — (1,780 )
Other (726 ) 56
Net cash used for investing activities (16,189 ) (18,444 )
Financing activities:
Borrowings on line of credit 2,119,000 2,450,000
Repayments on line of credit (2,183,000 ) (2,450,000 )
Net repurchases of common stock (41,294 ) (32,131 )
Cash dividends (65,382 ) (64,597 )
Net cash used for financing activities (170,676 ) (96,728 )
Effect of exchange rates on cash 2,187 4,604
Net change in cash and cash equivalents 15,892 (17,872 )
Cash and cash equivalents, beginning of period 333,890 247,666
Cash and cash equivalents, end of period $ 349,782 $ 229,794
As of March 31,
Operational Data: 2018 2017
Employees 15,101 14,432
Source: C.H. Robinson
CHRW-IR