Ch 23 Bi Variate
66
Business Research Methods William G. Zikmund Chapter 23 Bivariate Analysis: Measures of Associations
Transcript of Ch 23 Bi Variate

7/28/2019 Ch 23 Bi Variate
http://slidepdf.com/reader/full/ch-23-bi-variate 1/66
Business
Research Methods
William G. Zikmund
Chapter 23
Bivariate Analysis: Measures of
Associations
7/28/2019 Ch 23 Bi Variate
http://slidepdf.com/reader/full/ch-23-bi-variate 2/66
Measures of Association
• A general term that refers to a number of
bivariate statistical techniques used to
measure the strength of a relationship between two variables.
7/28/2019 Ch 23 Bi Variate
http://slidepdf.com/reader/full/ch-23-bi-variate 3/66
Relationships Among Variables
• Correlation analysis
• Bivariate regression analysis
7/28/2019 Ch 23 Bi Variate
http://slidepdf.com/reader/full/ch-23-bi-variate 4/66
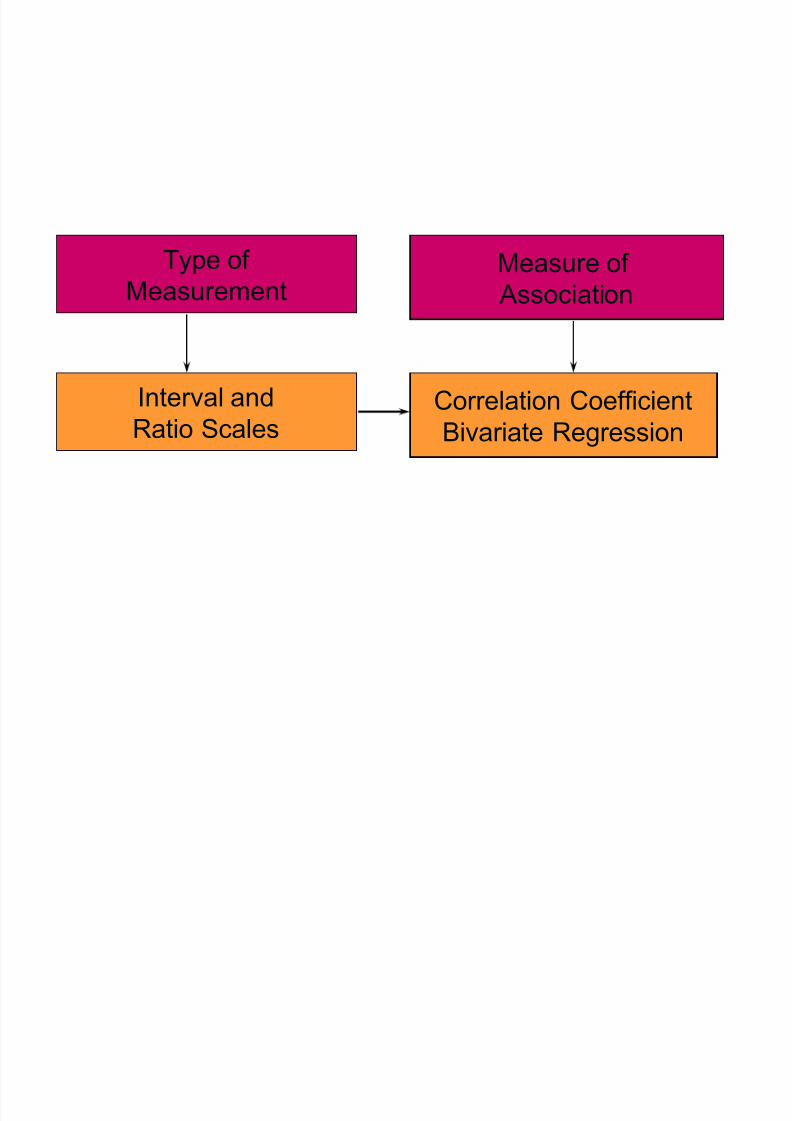
Type of
Measurement Measure of Association
Interval and
Ratio Scales Correlation CoefficientBivariate Regression

7/28/2019 Ch 23 Bi Variate
http://slidepdf.com/reader/full/ch-23-bi-variate 5/66
Type of
Measurement Measure of Association
Ordinal Scales Chi-squareRank Correlation

7/28/2019 Ch 23 Bi Variate
http://slidepdf.com/reader/full/ch-23-bi-variate 6/66
Type of
MeasurementMeasure of
Association
Nominal
Chi-Square
Phi CoefficientContingency Coefficient
7/28/2019 Ch 23 Bi Variate
http://slidepdf.com/reader/full/ch-23-bi-variate 7/66
Correlation Coefficient• A statistical measure of the covariation or
association between two variables.
• Are dollar sales associated with advertising
dollar expenditures?
7/28/2019 Ch 23 Bi Variate
http://slidepdf.com/reader/full/ch-23-bi-variate 8/66
The Correlation coefficient for two
variables, X and Y is
xyr .

7/28/2019 Ch 23 Bi Variate
http://slidepdf.com/reader/full/ch-23-bi-variate 9/66
Correlation Coefficient
• r
• r ranges from +1 to -1
• r = +1 a perfect positive linear relationship
• r = -1 a perfect negative linear relationship
• r = 0 indicates no correlation
7/28/2019 Ch 23 Bi Variate
http://slidepdf.com/reader/full/ch-23-bi-variate 10/66
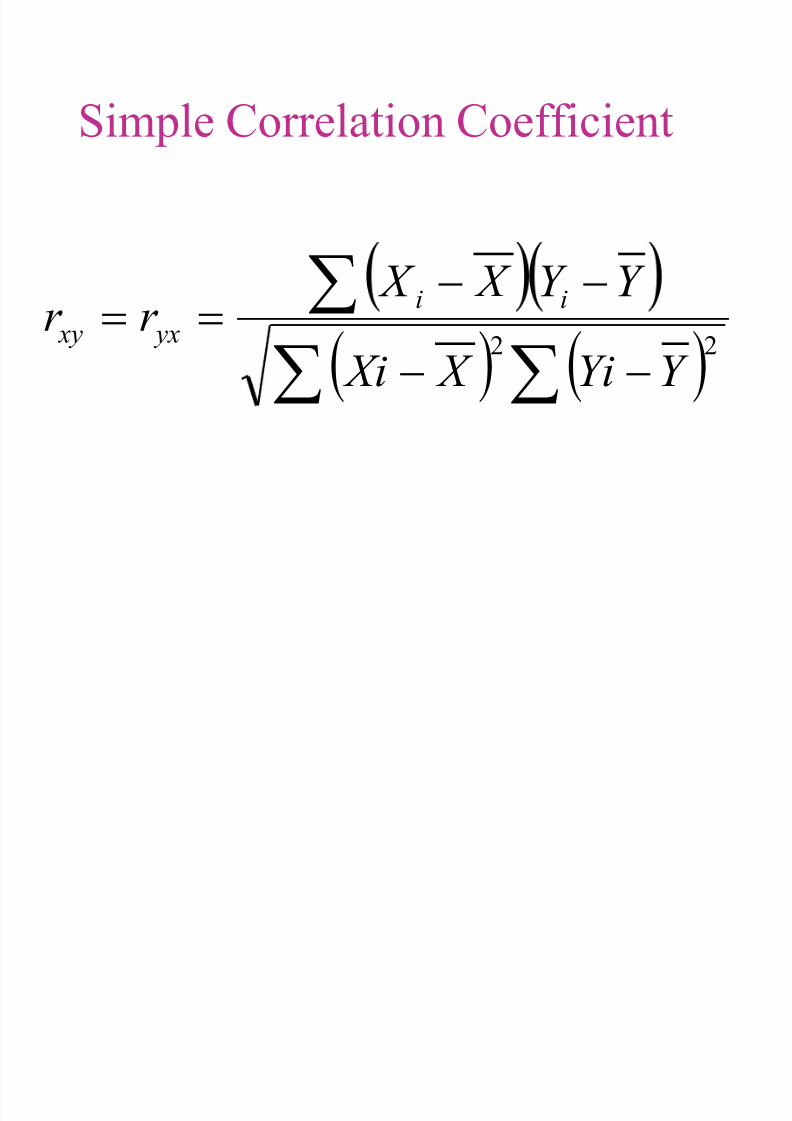
22
Y Yi X Xi
Y Y X X r r
ii
yx xy
Simple Correlation Coefficient

7/28/2019 Ch 23 Bi Variate
http://slidepdf.com/reader/full/ch-23-bi-variate 11/66
22
y x
xy yx xy r r
Simple Correlation Coefficient

7/28/2019 Ch 23 Bi Variate
http://slidepdf.com/reader/full/ch-23-bi-variate 12/66
= Variance of X
= Variance of Y
= Covariance of X and Y
2
x
2
y
xy
Simple Correlation Coefficient
Alternative Method

7/28/2019 Ch 23 Bi Variate
http://slidepdf.com/reader/full/ch-23-bi-variate 13/66
X
Y
NO CORRELATION
.
Correlation Patterns

7/28/2019 Ch 23 Bi Variate
http://slidepdf.com/reader/full/ch-23-bi-variate 14/66
X
Y
PERFECT NEGATIVE
CORRELATION -
r= -1.0
.
Correlation Patterns

7/28/2019 Ch 23 Bi Variate
http://slidepdf.com/reader/full/ch-23-bi-variate 15/66
X
Y
A HIGH POSITIVE CORRELATION
r = +.98
.
Correlation Patterns
7/28/2019 Ch 23 Bi Variate
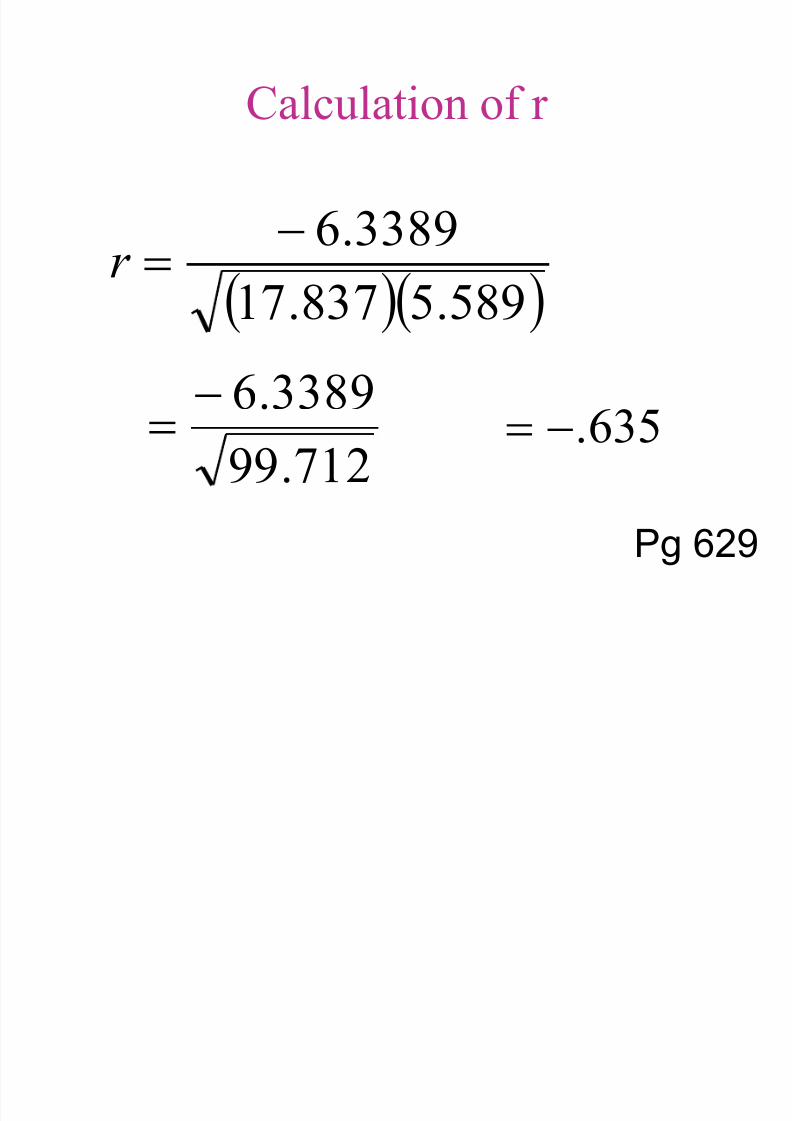
http://slidepdf.com/reader/full/ch-23-bi-variate 16/66Pg 629
589.5837.17
3389.6
r
712.99
3389.6 635.
Calculation of r
7/28/2019 Ch 23 Bi Variate
http://slidepdf.com/reader/full/ch-23-bi-variate 17/66
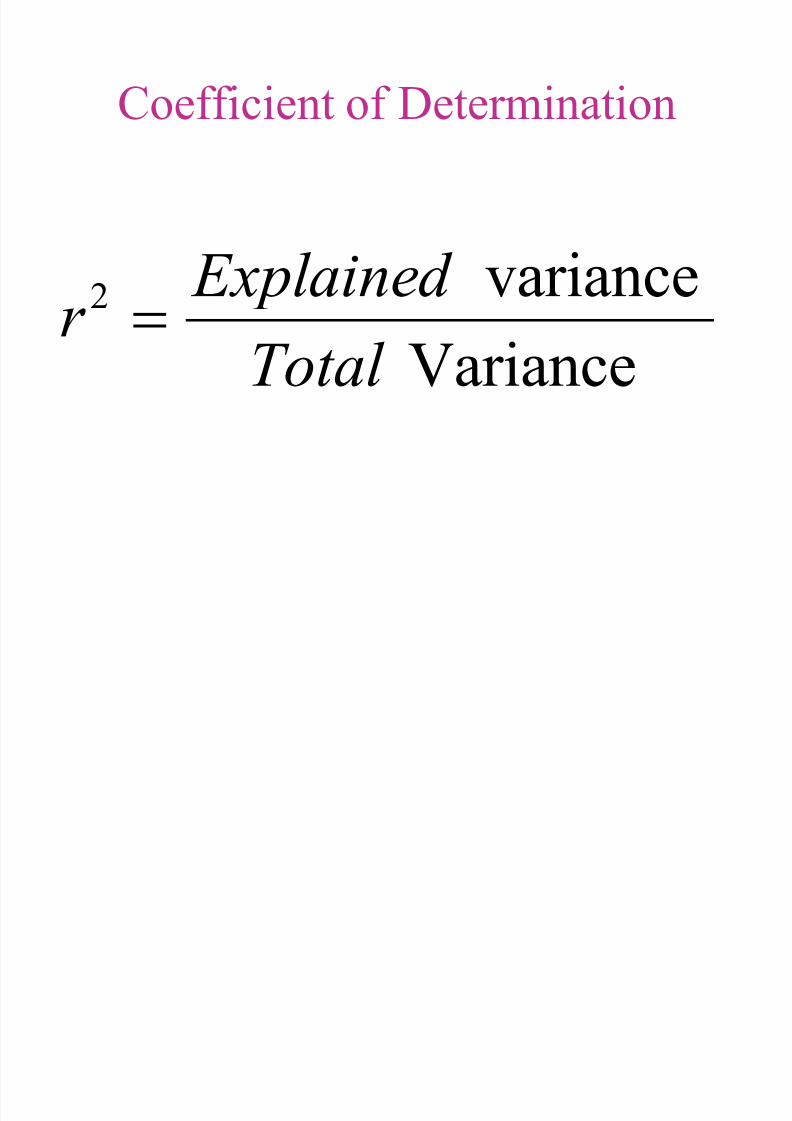
Coefficient of Determination
Variancevariance2
Total Explained r

7/28/2019 Ch 23 Bi Variate
http://slidepdf.com/reader/full/ch-23-bi-variate 18/66
Correlation Does Not Mean
Causation• High correlation
• Rooster’s crow and the rising of the sun
– Rooster does not cause the sun to rise.
• Teachers’ salaries and the consumption of
liquor
– Covary because they are both influenced by a
third variable

7/28/2019 Ch 23 Bi Variate
http://slidepdf.com/reader/full/ch-23-bi-variate 19/66
Correlation Matrix
• The standard form for reporting
correlational results.

7/28/2019 Ch 23 Bi Variate
http://slidepdf.com/reader/full/ch-23-bi-variate 20/66
Correlation Matrix
Var1 Var2 Var3
Var1 1.0 0.45 0.31
Var2 0.45 1.0 0.10
Var3 0.31 0.10 1.0

7/28/2019 Ch 23 Bi Variate
http://slidepdf.com/reader/full/ch-23-bi-variate 21/66
Walkup’s
First Laws of Statistics • Law No. 1
– Everything correlates with everything, especially
when the same individual defines the variables to be correlated.
• Law No. 2
– It won’t help very much to find a good correlation
between the variable you are interested in and some
other variable that you don’t understand any better.
7/28/2019 Ch 23 Bi Variate
http://slidepdf.com/reader/full/ch-23-bi-variate 22/66
• Law No. 3
– Unless you can think of a logical reason why
two variables should be connected as cause andeffect, it doesn’t help much to find a correlation
between them. In Columbus, Ohio, the mean
monthly rainfall correlates very nicely with the
number of letters in the names of the months!
Walkup’s
First Laws of Statistics
7/28/2019 Ch 23 Bi Variate
http://slidepdf.com/reader/full/ch-23-bi-variate 23/66
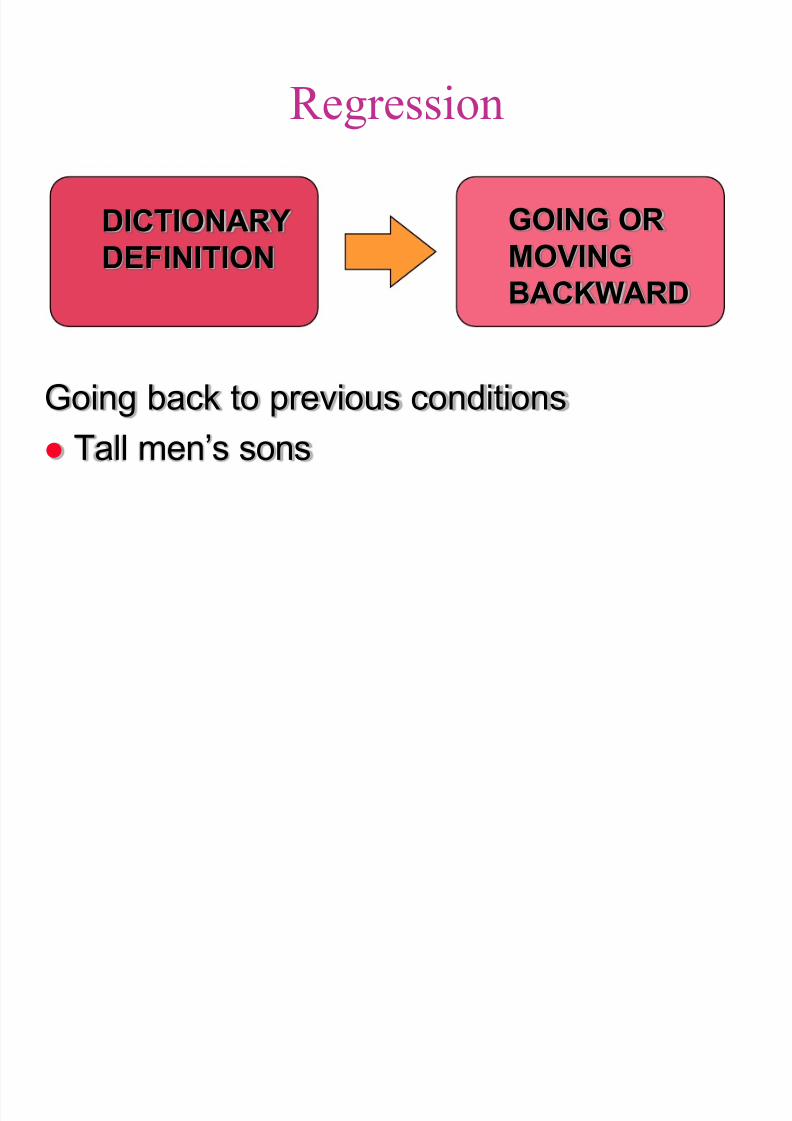
Going back to previous conditions
Tall men’s sons
DICTIONARY
DEFINITION
GOING OR
MOVING
BACKWARD
Regression

7/28/2019 Ch 23 Bi Variate
http://slidepdf.com/reader/full/ch-23-bi-variate 24/66
Bivariate Regression
• A measure of linear association that
investigates a straight line relationship
• Useful in forecasting
7/28/2019 Ch 23 Bi Variate
http://slidepdf.com/reader/full/ch-23-bi-variate 25/66
Bivariate Linear Regression
• A measure of linear association that
investigates a straight-line relationship
• Y = a + bX
• where
• Y is the dependent variable
• X is the independent variable
• a and b are two constants to be estimated

7/28/2019 Ch 23 Bi Variate
http://slidepdf.com/reader/full/ch-23-bi-variate 26/66
Y intercept
• a
• An intercepted segment of a line
• The point at which a regression line
intercepts the Y-axis

7/28/2019 Ch 23 Bi Variate
http://slidepdf.com/reader/full/ch-23-bi-variate 27/66
Slope
• b
• The inclination of a regression line as
compared to a base line
• Rise over run
• D - notation for “a change in”

7/28/2019 Ch 23 Bi Variate
http://slidepdf.com/reader/full/ch-23-bi-variate 28/66
Y
160
150
140
130
120
110
100
90
80
70 80 90 100 110 120 130 140 150 160 170 180 190
X
My line
Your line
.
Scatter Diagram
and Eyeball Forecast

7/28/2019 Ch 23 Bi Variate
http://slidepdf.com/reader/full/ch-23-bi-variate 29/66
130
120
110
100
90
80
80 90 100 110 120 130 140 150 160 170 180 190
X
Y
.
X aY ˆˆ
X
Y
Regression Line and Slope
7/28/2019 Ch 23 Bi Variate
http://slidepdf.com/reader/full/ch-23-bi-variate 30/66
X
Y
160
150
140
130
120
110
100
90
80
70 80 90 100 110 120 130 140 150 160 170 180 190
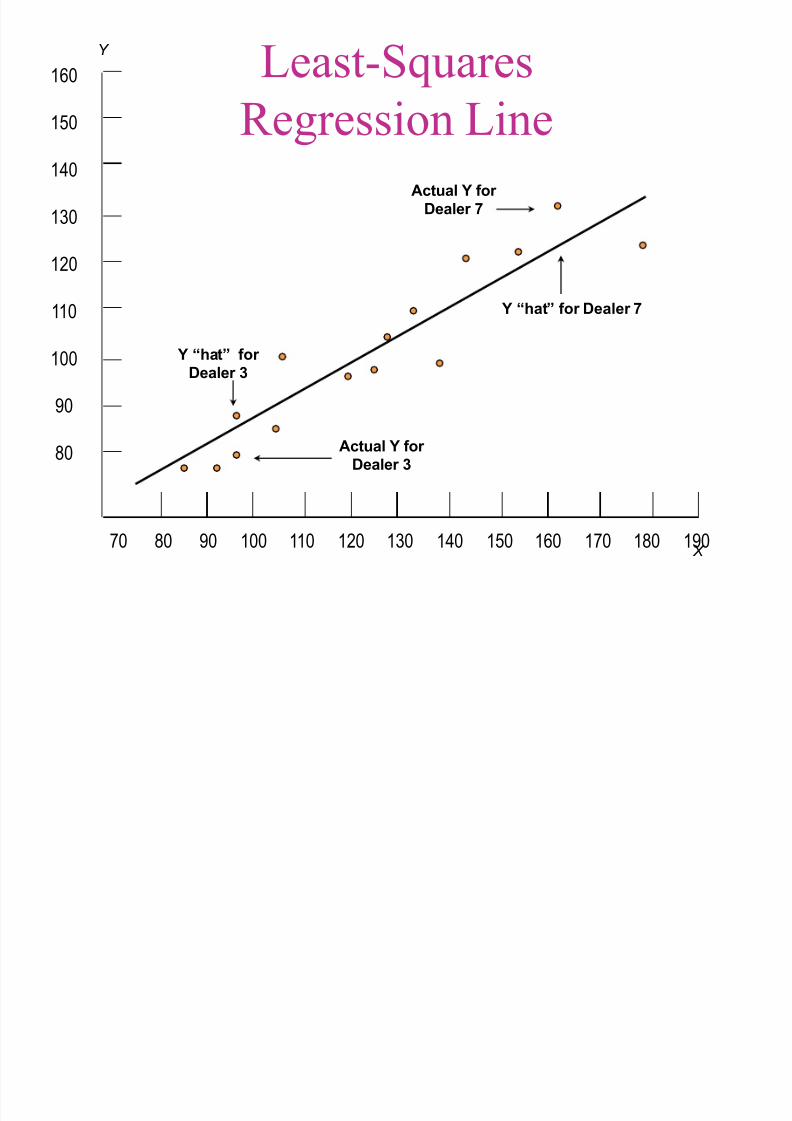
Y “hat” for
Dealer 3
Actual Y for
Dealer 7
Y “hat” for Dealer 7
Actual Y for
Dealer 3
Least-Squares
Regression Line

7/28/2019 Ch 23 Bi Variate
http://slidepdf.com/reader/full/ch-23-bi-variate 31/66
130
120
110
100
90
80
80 90 100 110 120 130 140 150 160 170 180 190
X
Y
}}
{
Deviation not explained
Total deviation
Deviation explained by the regression
Y
.
Scatter Diagram of Explained
and Unexplained Variation

7/28/2019 Ch 23 Bi Variate
http://slidepdf.com/reader/full/ch-23-bi-variate 32/66
The Least-Square Method
• Uses the criterion of attempting to make the
least amount of total error in prediction of Y
from X. More technically, the procedureused in the least-squares method generates a
straight line that minimizes the sum of
squared deviations of the actual values fromthis predicted regression line.

7/28/2019 Ch 23 Bi Variate
http://slidepdf.com/reader/full/ch-23-bi-variate 33/66
The Least-Square Method
• A relatively simple mathematical technique
that ensures that the straight line will most
closely represent the relationship between Xand Y.

7/28/2019 Ch 23 Bi Variate
http://slidepdf.com/reader/full/ch-23-bi-variate 34/66
Regression - Least-Square
Method
n
i
ie1
2 minimumis

7/28/2019 Ch 23 Bi Variate
http://slidepdf.com/reader/full/ch-23-bi-variate 35/66
= - (The “residual”)
= actual value of the dependent variable
= estimated value of the dependent variable (Y hat)
n = number of observations
i = number of the observation
ie
iY
iY ˆ
iY
iY ˆ

7/28/2019 Ch 23 Bi Variate
http://slidepdf.com/reader/full/ch-23-bi-variate 36/66
The Logic behind the Least-
Squares Technique• No straight line can completely represent
every dot in the scatter diagram
• There will be a discrepancy between mostof the actual scores (each dot) and the
predicted score
• Uses the criterion of attempting to make theleast amount of total error in prediction of Y
from X
7/28/2019 Ch 23 Bi Variate
http://slidepdf.com/reader/full/ch-23-bi-variate 37/66
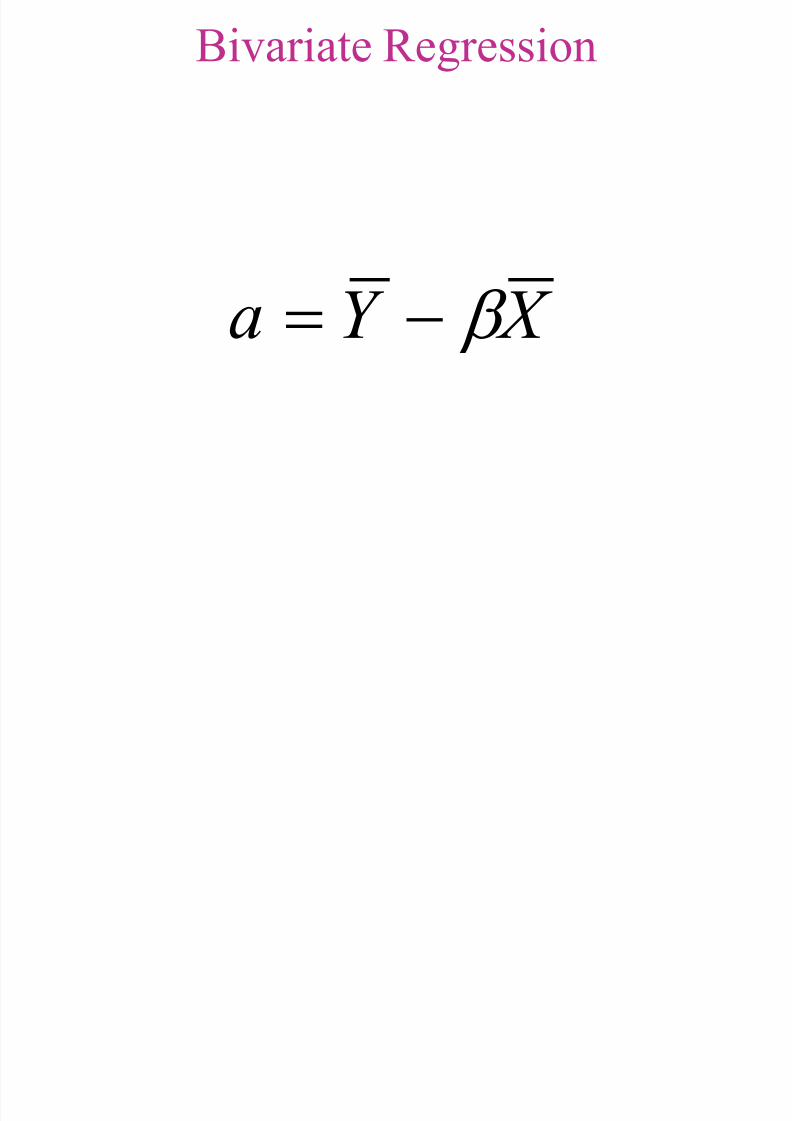
X Y a ˆˆ
Bivariate Regression
7/28/2019 Ch 23 Bi Variate
http://slidepdf.com/reader/full/ch-23-bi-variate 38/66
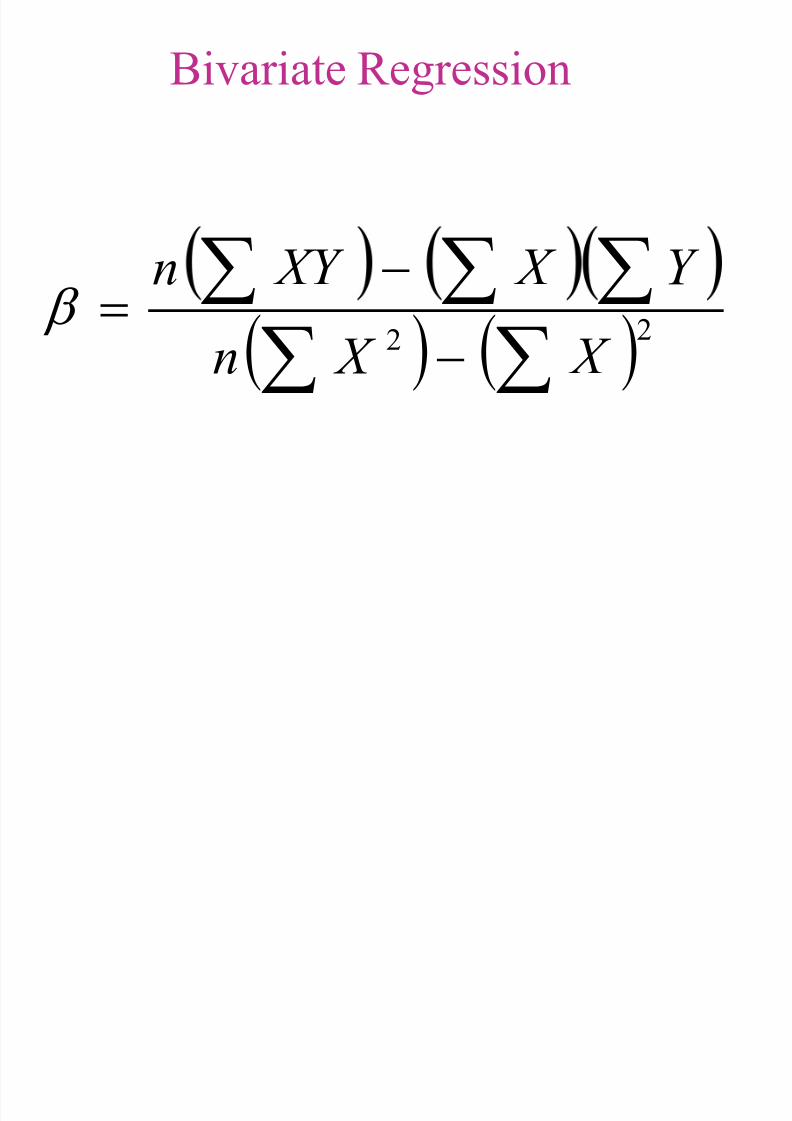
22
ˆ
X X nY X XY n
Bivariate Regression

7/28/2019 Ch 23 Bi Variate
http://slidepdf.com/reader/full/ch-23-bi-variate 39/66
= estimated slope of the line (the “regression coefficient”)
= estimated intercept of the y axis
= dependent variable
= mean of the dependent variable
= independent variable
= mean of the independent variable
= number of observations
ˆ
X
Y
n
a
Y
X

7/28/2019 Ch 23 Bi Variate
http://slidepdf.com/reader/full/ch-23-bi-variate 40/66
625,515,3759,24515
875,806,2345,19315ˆ
625,515,3385,686,3
875,806,2175,900,2
760,170
300,93 54638.

7/28/2019 Ch 23 Bi Variate
http://slidepdf.com/reader/full/ch-23-bi-variate 41/66
12554638.8.99ˆ a
3.688.99
5.31

7/28/2019 Ch 23 Bi Variate
http://slidepdf.com/reader/full/ch-23-bi-variate 42/66
12554638.8.99ˆ a
3.688.99
5.31

7/28/2019 Ch 23 Bi Variate
http://slidepdf.com/reader/full/ch-23-bi-variate 43/66
X Y 546.5.31ˆ
89546.5.31
6.485.31
1.80

7/28/2019 Ch 23 Bi Variate
http://slidepdf.com/reader/full/ch-23-bi-variate 44/66
X Y 546.5.31ˆ
89546.5.31
6.485.31
1.80

7/28/2019 Ch 23 Bi Variate
http://slidepdf.com/reader/full/ch-23-bi-variate 45/66
165546.5.31ˆ
129)valueY(Actual7Dealer
7
Y 6.121
95546.5.31ˆ
)80valueY(Actual3Dealer
3
Y
4.83

7/28/2019 Ch 23 Bi Variate
http://slidepdf.com/reader/full/ch-23-bi-variate 46/66
99ˆY Y ei
5.9697
5.0

7/28/2019 Ch 23 Bi Variate
http://slidepdf.com/reader/full/ch-23-bi-variate 47/66
165546.5.31ˆ
129)valueY(Actual7Dealer
7
Y 6.121
95546.5.31ˆ
)80valueY(Actual3Dealer
3
Y
4.83

7/28/2019 Ch 23 Bi Variate
http://slidepdf.com/reader/full/ch-23-bi-variate 48/66
99ˆY Y ei
5.9697
5.0
7/28/2019 Ch 23 Bi Variate
http://slidepdf.com/reader/full/ch-23-bi-variate 49/66
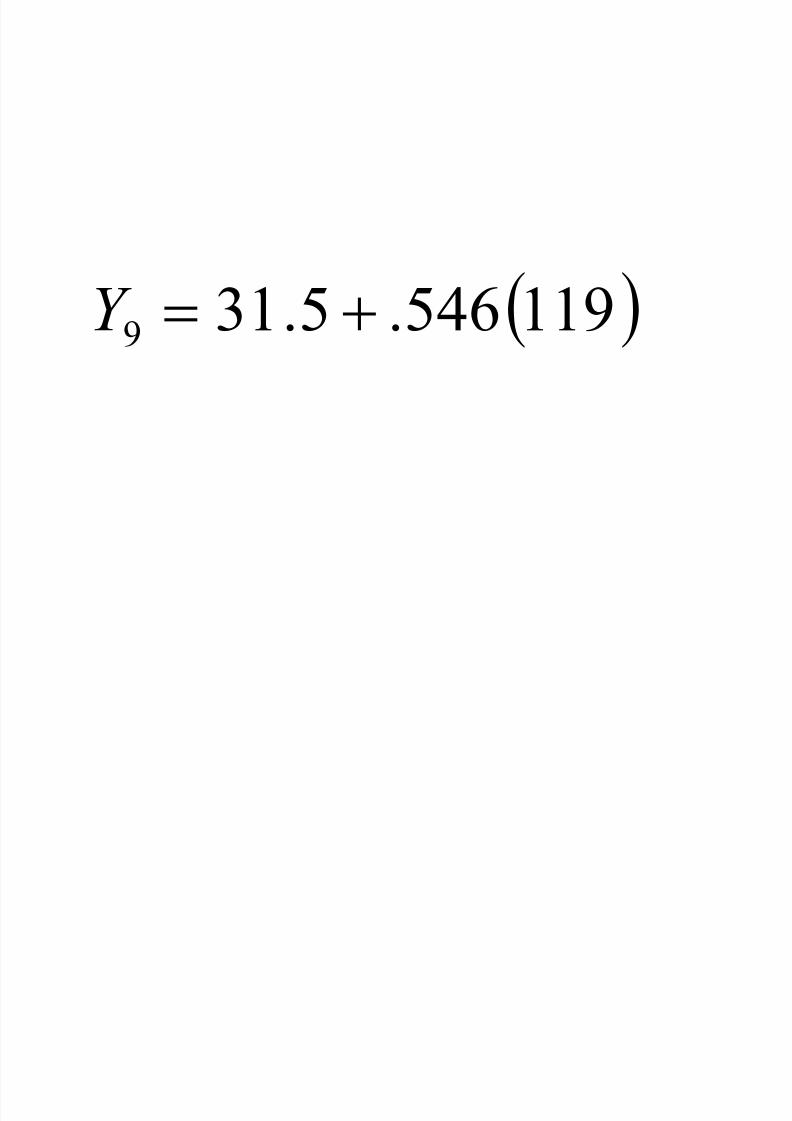
119546.5.31ˆ9 Y
7/28/2019 Ch 23 Bi Variate
http://slidepdf.com/reader/full/ch-23-bi-variate 50/66
F-Test (Regression)
• A procedure to determine whether there is
more variability explained by the regression
or unexplained by the regression.• Analysis of variance summary table

7/28/2019 Ch 23 Bi Variate
http://slidepdf.com/reader/full/ch-23-bi-variate 51/66
Total Deviation can be
Partitioned into Two Parts• Total deviation equals
• Deviation explained by the regression plus
• Deviation unexplained by the regression

7/28/2019 Ch 23 Bi Variate
http://slidepdf.com/reader/full/ch-23-bi-variate 52/66
“We are always acting on what has justfinished happening. It happened at least
1/30th of a second ago.We think we’re in
the present, but we aren’t. The present weknow is only a movie of the past.”
Tom Wolfe in
The Electric Kool-Aid Acid Test
.

7/28/2019 Ch 23 Bi Variate
http://slidepdf.com/reader/full/ch-23-bi-variate 53/66
iiii Y Y Y Y Y Y ˆ ˆ
Partitioning the Variance
Total
deviation=
Deviation
explained by the
regression
Deviation
unexplained by
the regression(Residual
error)
+

7/28/2019 Ch 23 Bi Variate
http://slidepdf.com/reader/full/ch-23-bi-variate 54/66
= Mean of the total group
= Value predicted with regression equation
= Actual value
Y
Y ˆ
iY

7/28/2019 Ch 23 Bi Variate
http://slidepdf.com/reader/full/ch-23-bi-variate 55/66
222
ˆ ˆ iiii Y Y Y Y Y Y
Total
variation
explained
=Explained
variation
Unexplained
variation
(residual)
+
7/28/2019 Ch 23 Bi Variate
http://slidepdf.com/reader/full/ch-23-bi-variate 56/66
SSeSSr SSt
Sum of Squares
Coefficient of Determination

7/28/2019 Ch 23 Bi Variate
http://slidepdf.com/reader/full/ch-23-bi-variate 57/66
Coefficient of Determination
r 2
• The proportion of variance in Y that is
explained by X (or vice versa)
• A measure obtained by squaring thecorrelation coefficient; that proportion of
the total variance of a variable that is
accounted for by knowing the value of another variable

7/28/2019 Ch 23 Bi Variate
http://slidepdf.com/reader/full/ch-23-bi-variate 58/66
Coefficient of Determination
r 2
SSt
SSe
SSt
SSr r 12

7/28/2019 Ch 23 Bi Variate
http://slidepdf.com/reader/full/ch-23-bi-variate 59/66
Source of Variation
• Explained by Regression
• Degrees of Freedom
– k-1 where k= number of estimated constants(variables)
• Sum of Squares
– SSr
• Mean Squared
– SSr/k-1

7/28/2019 Ch 23 Bi Variate
http://slidepdf.com/reader/full/ch-23-bi-variate 60/66
Source of Variation
• Unexplained by Regression
• Degrees of Freedom
– n-k where n=number of observations
• Sum of Squares
– SSe
• Mean Squared
– SSe/n-k

7/28/2019 Ch 23 Bi Variate
http://slidepdf.com/reader/full/ch-23-bi-variate 61/66
r 2 in the Example
875.4.882,3
49.398,32r

7/28/2019 Ch 23 Bi Variate
http://slidepdf.com/reader/full/ch-23-bi-variate 62/66
Multiple Regression
• Extension of Bivariate Regression
• Multidimensional when three or more
variables are involved
• Simultaneously investigates the effect of
two or more variables on a single dependent
variable• Discussed in Chapter 24

7/28/2019 Ch 23 Bi Variate
http://slidepdf.com/reader/full/ch-23-bi-variate 63/66

7/28/2019 Ch 23 Bi Variate
http://slidepdf.com/reader/full/ch-23-bi-variate 64/66

7/28/2019 Ch 23 Bi Variate
http://slidepdf.com/reader/full/ch-23-bi-variate 65/66
Correlation Coefficient, r = .75
Correlation: Player Salary and Ticket
Price
-20
-10
0
10
20
30
1995 1996 1997 1998 1999 2000 2001
Change in Ticket
Price
Change in
Player Salary

7/28/2019 Ch 23 Bi Variate
http://slidepdf.com/reader/full/ch-23-bi-variate 66/66