CFDs - Charting Basics (2.1)
13
0 1 Chapter 2.1 Charting Basics
Transcript of CFDs - Charting Basics (2.1)

8/7/2019 CFDs - Charting Basics (2.1)
http://slidepdf.com/reader/full/cfds-charting-basics-21 1/13
0
1
Chapter 2.1Charting Basics

8/7/2019 CFDs - Charting Basics (2.1)
http://slidepdf.com/reader/full/cfds-charting-basics-21 2/13
1
CHARTING BASICSCharts are a stock and CFD trader’s best friend. You will most likely
spend more time using your price charts as a stock and CFD trader than
you will any other trading tool. Since your charts are going to play such
a large part in your trading, it is imperative you become familiar with
them. The more comfortable you are with your charts, the easier it will
be to become a successful stock and CFD trader.
To help you become familiar with your charts and how you can
affectively use them, we will cover the following concepts.
We will discuss the incredible technical indicators you can add to yourcharts to improve your trading results in a later section. Take the time
now to learn the so you will be ready for more advanced material later.
Contents
Chart setup
Chart time-frames
Chart types

8/7/2019 CFDs - Charting Basics (2.1)
http://slidepdf.com/reader/full/cfds-charting-basics-21 3/13
2
CHART SETUPLet’s start from the very beginning and take a look at how a stock price
chart is set up. Once you understand the basics, you will be much more
successful applying more advanced concepts to your technical analysis.
Stock price charts are built on two axes -the X axis (the horizontal axis)
and the Y axis (the vertical axis).

8/7/2019 CFDs - Charting Basics (2.1)
http://slidepdf.com/reader/full/cfds-charting-basics-21 4/13
3
The X axis runs horizontally along the bottom of the chart providing a
timeline for everything that has happened on the chart. The most
recent price movements are shown on the right of the chart and the
most historic price action is shown on the left side of the chart.
The Y axis runs vertically along the right side of the chart providing a
scale on which to measure price movement on the chart. Lower prices
are shown towards the bottom of the chart and higher prices are
shown towards the top of the chart.
When you put the two axes together, you can see at what price a stock
was trading at a particular time in the past. For example, you can seethat the S&P 500 was trading at 13,675 on 14 March 2007.

8/7/2019 CFDs - Charting Basics (2.1)
http://slidepdf.com/reader/full/cfds-charting-basics-21 5/13
4
CHART TIME-FRAMESSaxo Forex charts give you the ability to analyze the price movement of
a stock or CFD anywhere from a minute-by-minute basis to a month-
by-month basis. You have the flexibility to choose which time-frame is
best for you.
If you are a short-term trader, you will want to use shorter time-frames
for your charts. If you are a long-term trader, you will want to use
longer time-frames for your charts. For example, a trader who is
looking to quickly jump in and out of investments for 10- to 20-cent
profits would most likely want to be watching a 1-minute or a 5-minute chart. A trader who is looking to hold onto investments for a
longer period of time to take advantage of larger price moves would
most likely want to be watching an hourly or a daily chart.
Some traders even choose to use multiple time-frames so that they can
see how the movement of a stock or CFD looks from various points of
view. We will discuss this concept in detail in a later section.
To change the time-frame on your chart to best match your trading
style, click on the button at the top of the chart. A drop-down menu
will appear, and you can select your preferred time-frame.

8/7/2019 CFDs - Charting Basics (2.1)
http://slidepdf.com/reader/full/cfds-charting-basics-21 6/13
5
CHART TYPESSaxo Forex charts give you the ability to analyze the price movement of
any stock or CFD in various formats, from line charts to candlestick
charts. You have the flexibility to choose which format is best for you.
Technical analysis is a visual, almost artistic, skill that traders develop,
and different traders like to practice their art on different types of
charts. Some traders feel they can see and analyze support and
resistance levels better on a line chart, while other traders feel they get
more information on price movement on a bar chart or a candlestick
chart.
Technical analysts tend to gravitate toward the following three chart
types:
- Line charts
- Bar charts
- Candlestick charts

8/7/2019 CFDs - Charting Basics (2.1)
http://slidepdf.com/reader/full/cfds-charting-basics-21 7/13
6
Line ChartsLine charts are the most basic type of chart. Technical analysts often
use line charts to easily identify support and resistance levels. Line
charts only have basic information plotted on the chart, which means
there is not a lot of other clutter to get in the way of analysis.
You create a line chart by plotting the closing price of each trading
period on a chart and then connecting each closing price with a line.
You can see an example of a line chart to the right.

8/7/2019 CFDs - Charting Basics (2.1)
http://slidepdf.com/reader/full/cfds-charting-basics-21 8/13
7
Bar ChartsBar charts provide more information than line charts. Technical analysts
often use bar charts to access more information about how a stock’s
price moved up and down during trading periods. Whereas line charts
only plot the closing price from each trading period, bar charts plot the
opening, high, low and closing prices from each period.
You create a bar chart by plotting a series of bars across the chart. Each
bar represents one trading period. To create a bar you plot the high
and low price of a trading period and connect them with a vertical line.
Next you plot the opening price to the left of the vertical line you have
just drawn and connect that point to the vertical line with a horizontal
line. Lastly you plot the closing price to the right of the vertical line you
have just drawn, and then connect that point to the vertical line with a
horizontal line.
8/7/2019 CFDs - Charting Basics (2.1)
http://slidepdf.com/reader/full/cfds-charting-basics-21 9/13
8
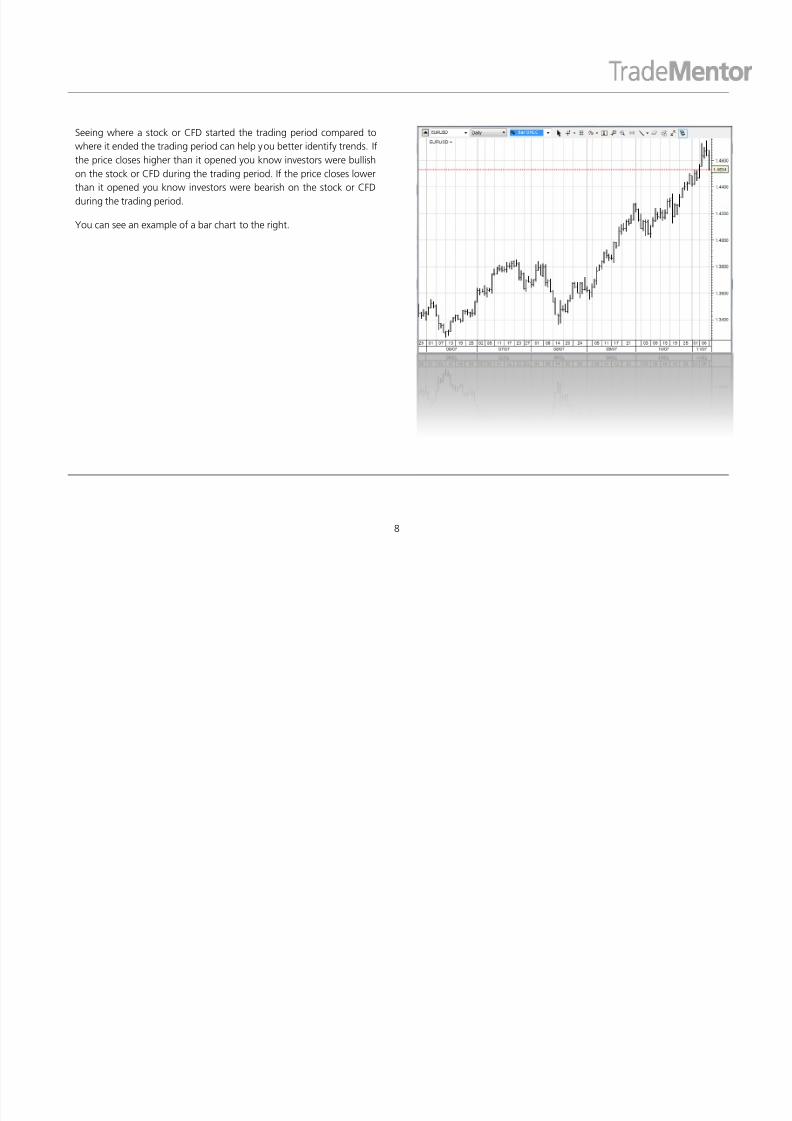
Seeing where a stock or CFD started the trading period compared to
where it ended the trading period can help you better identify trends. If
the price closes higher than it opened you know investors were bullish
on the stock or CFD during the trading period. If the price closes lower
than it opened you know investors were bearish on the stock or CFD
during the trading period.
You can see an example of a bar chart to the right.

8/7/2019 CFDs - Charting Basics (2.1)
http://slidepdf.com/reader/full/cfds-charting-basics-21 10/13
9
Candlestick Charts
Candlestick charts provide the same information as bar charts but in a
slightly different format. Technical analysts often use candlestick charts
instead of bar charts because it is easier to see and identify various
trading patterns using candlestick charts. In fact, a complete line of
technical analysis, known as Japanese candlestick-chart analysis, was
developed around these easy-to-use charts.
Candlestick analysis was developed in the 1700s in Japan. Traders in
the Japanese rice markets would use candlestick analysis to help them
make more profitable rice trades.
You create a candlestick chart by plotting a series of candlesticks across
the chart. Each candlestick represents one trading period. To create a
candlestick you plot the high and low prices for a trading period and
connect them with a vertical line. This line is called the wick of the
candle. Next you plot the opening price by drawing a horizontal line
through the vertical line or wick. After you have plotted the opening
price you plot the closing price by drawing another horizontal line
through the vertical line. Lastly you fill in the area between the opening
price and the closing price. This area is called the body of the
candlestick.

8/7/2019 CFDs - Charting Basics (2.1)
http://slidepdf.com/reader/full/cfds-charting-basics-21 11/13
10
Seeing where a stock or CFD started the trading period compared to
where it ended the trading period can help you better identify trends. If
the price closes higher than it opened you know investors were bullish
on the stock or CFD during the trading period. If the price closes lower
than it opened then you know investors were bearish on the stock or
CFD during the trading period.
You can see an example of a candlestick chart to the right.

8/7/2019 CFDs - Charting Basics (2.1)
http://slidepdf.com/reader/full/cfds-charting-basics-21 12/13
11

8/7/2019 CFDs - Charting Basics (2.1)
http://slidepdf.com/reader/full/cfds-charting-basics-21 13/13
12
Disclaimer
None of the information contained herein constitutes an offer to purchase or sell a financial instrument or to make any investments.
Saxo Bank A/S and/or its affiliates and subsidiaries (hereinafter referred to as the “Saxo Bank Group”) do not take into account your
personal investment objectives or financial situation and make no representation, and assume no liability to the accuracy or
completeness of the information provided, nor for any loss arising from any investment based on a recommendation, forecast or other
information supplied from any employee of Saxo Bank, third party, or otherwise. Trades in accordance with the recommendations in ananalysis, especially, but not limited to, leveraged investments such as foreign exchange trading and investment in derivatives, can be
very speculative and may result in losses as well as profits. You should carefully consider your financial situation and consult your
financial advisor(s) in order to understand the risks involved and ensure the suitability of your situation prior to making any investment
or entering into any transactions. All expressions of opinion are subject to change without notice. Any opinions made may be personal
to the author and may not reflect the opinions of Saxo Bank.
Please furthermore refer to Saxo Bank's full General Disclaimer: http://www.saxobank.com/?id=193