CFD Performance Analysis of a Spark Ignition Engine … · 2016-11-22 · CFD Performance Analysis...
8
Send Orders for Reprints to [email protected] 26 The Open Fuels & Energy Science Journal, 2014, 7, 26-33 1876-973X/14 2014 Bentham Open Open Access CFD Performance Analysis of a Spark Ignition Engine Fueled by Landfill Gas Daniel Swain and S.O. Bade Shrestha * Department of Mechanical and Aerospace Engineering, Western Michigan University, Kalamazoo, MI 49008, USA Abstract: Landfill gas (LFG) that is generated in an anaerobic environment in landfills and consists primarily of methane and carbondioxide with small amount of nitrogen and other non-methane gases, could be collected and used to produce energy either by extracting methane or using the landfill gas directly in an internal combustion engine or a gas turbine. It amounts to be a net-negative greenhouse gas emission process. Carbondioxide component of LFG dilutes the fuel and absorbs some of the heat of combustion, causing reduced flame temperature that decreases NOx emissions and also suppresses knock. A model was developed and validated with the experimental data available in literature, using the computation fluid dynamic (CFD) code, KIVA-4. Various engine performance parameters at various operating conditions were evaluated and the benefits of methane purification and or direct use of LFG as a fuel in the engine scenarios were compared. It was found that landfill gas used directly at higher compression ratios can be used for pure methane fuel with higher fuel efficiency than can be achieved using pure methane fuel only. Keywords: Alternative fuel, emissions, IC engine modeling, landfill gas, SI engine simulation. 1. INTRODUCTION An estimated amount of 75 billion Nm 3 of methane gas is produced in landfills annually worldwide, and less than 10% of this fuel is captured and utilized [1]. Methane is a potent greenhouse gas with 72 times the global warming potential of carbondioxide (CO 2 ) when averaged over 20 years and 24 times that of CO 2 when averaged over 100 years, if it is allowed to be released into the atmosphere [1-3]. In mega landfills in the United States, the Environmental Protection Agency (EPA) requires landfill gas to be collected and flared to prevent the release of methane into the atmosphere, but the methane fuel can profitably be collected and utilized in a landfill-gas-to-energy (LFGTE) operation to produce power or heat or both. In mega landfills, gas turbines are used to produce energy because of their high power density, but in addition to these, the US EPA has identified hundreds of additional candidate sites for LFGTE; most with smaller amounts of waste in place. For these cases, an internal combustion engine generator may present an economical attractive option. LFGTE projects are among the greenest technologies. Combusting methane in landfill gas is a net- negative greenhouse gas emission operation, and in this case energy production can be considered a “free” by-product of greenhouse gas reduction. Landfill gas (LFG) is produced in an anaerobic environment and consists primarily of methane and carbon- *Address correspondence to this author at the Department of Mechanical and Aerospace Engineering, Western Michigan University, 4601 Campus Drive, Parkview Campus Kalamazoo, MI 49008, USA; Tel: 269 276 3432; Fax: 269 276 3421; E-mail: [email protected] dioxide with small amounts of nitrogen and other non- methane organic gases. An internal combustion engine can be fueled by either purified methane or raw LFG to produce power and energy. Economic analyses have determined that LFGTE projects can be very profitable, so technologies which help to utilize this largely untapped resource will produce both economic and environmental benefits to the producers. 2. LANDFILL GAS GENERATION Landfill gas is similar in nature as swamp gas or biogas. It is generated by decomposition of organic material in an anaerobic environment by acetogenesis and methanogenesis processes [1]. The gaseous products of which are methane and carbondioxide and representative reactions are shown below: Acetogenesis: C 6 H 12 O 6 2C 2 H 5 OH + 2CO 2 Methanogenesis: CH 3 COOH CH 4 + CO 2 CO 2 + 4H 2 CH 4 + 2H 2 O The composition of landfill gas can vary significantly from site to site, but average compositions are presented in Table 1 [4]. In early days, methane gas produced in landfills was ignored and allowed to be released into the atmosphere. It is estimated that landfills account for approximately one third of the total methane emissions in the US [5]. Because of this,
-
Upload
nguyenthien -
Category
Documents
-
view
232 -
download
0
Transcript of CFD Performance Analysis of a Spark Ignition Engine … · 2016-11-22 · CFD Performance Analysis...

Send Orders for Reprints to [email protected]
26 The Open Fuels & Energy Science Journal, 2014, 7, 26-33
1876-973X/14 2014 Bentham Open
Open Access
CFD Performance Analysis of a Spark Ignition Engine Fueled by Landfill Gas
Daniel Swain and S.O. Bade Shrestha*
Department of Mechanical and Aerospace Engineering, Western Michigan University, Kalamazoo, MI 49008, USA
Abstract: Landfill gas (LFG) that is generated in an anaerobic environment in landfills and consists primarily of methane and carbondioxide with small amount of nitrogen and other non-methane gases, could be collected and used to produce energy either by extracting methane or using the landfill gas directly in an internal combustion engine or a gas turbine. It amounts to be a net-negative greenhouse gas emission process. Carbondioxide component of LFG dilutes the fuel and absorbs some of the heat of combustion, causing reduced flame temperature that decreases NOx emissions and also suppresses knock.
A model was developed and validated with the experimental data available in literature, using the computation fluid dynamic (CFD) code, KIVA-4. Various engine performance parameters at various operating conditions were evaluated and the benefits of methane purification and or direct use of LFG as a fuel in the engine scenarios were compared. It was found that landfill gas used directly at higher compression ratios can be used for pure methane fuel with higher fuel efficiency than can be achieved using pure methane fuel only.
Keywords: Alternative fuel, emissions, IC engine modeling, landfill gas, SI engine simulation.
1. INTRODUCTION
An estimated amount of 75 billion Nm3 of methane gas is produced in landfills annually worldwide, and less than 10% of this fuel is captured and utilized [1]. Methane is a potent greenhouse gas with 72 times the global warming potential of carbondioxide (CO2 ) when averaged over 20 years and 24 times that of CO2 when averaged over 100 years, if it is allowed to be released into the atmosphere [1-3]. In mega landfills in the United States, the Environmental Protection Agency (EPA) requires landfill gas to be collected and flared to prevent the release of methane into the atmosphere, but the methane fuel can profitably be collected and utilized in a landfill-gas-to-energy (LFGTE) operation to produce power or heat or both. In mega landfills, gas turbines are used to produce energy because of their high power density, but in addition to these, the US EPA has identified hundreds of additional candidate sites for LFGTE; most with smaller amounts of waste in place. For these cases, an internal combustion engine generator may present an economical attractive option. LFGTE projects are among the greenest technologies. Combusting methane in landfill gas is a net-negative greenhouse gas emission operation, and in this case energy production can be considered a “free” by-product of greenhouse gas reduction.
Landfill gas (LFG) is produced in an anaerobic environment and consists primarily of methane and carbon-
*Address correspondence to this author at the Department of Mechanical and Aerospace Engineering, Western Michigan University, 4601 Campus Drive, Parkview Campus Kalamazoo, MI 49008, USA; Tel: 269 276 3432; Fax: 269 276 3421; E-mail: [email protected]
dioxide with small amounts of nitrogen and other non-methane organic gases. An internal combustion engine can be fueled by either purified methane or raw LFG to produce power and energy. Economic analyses have determined that LFGTE projects can be very profitable, so technologies which help to utilize this largely untapped resource will produce both economic and environmental benefits to the producers.
2. LANDFILL GAS GENERATION
Landfill gas is similar in nature as swamp gas or biogas. It is generated by decomposition of organic material in an anaerobic environment by acetogenesis and methanogenesis processes [1]. The gaseous products of which are methane and carbondioxide and representative reactions are shown below:
Acetogenesis:
C6H12O6 à 2C2H5OH + 2CO2
Methanogenesis:
CH3COOH à CH4 + CO2
CO2 + 4H2 à CH4 + 2H2O
The composition of landfill gas can vary significantly from site to site, but average compositions are presented in Table 1 [4].
In early days, methane gas produced in landfills was ignored and allowed to be released into the atmosphere. It is estimated that landfills account for approximately one third of the total methane emissions in the US [5]. Because of this,

CFD Performance Analysis of a Spark Ignition Engine Fueled by Landfill Gas The Open Fuels & Energy Science Journal, 2014, Volume 7 27
the US Environmental Protection Agency now requires landfills to collect and flare landfill gas to reduce the overall global warming from landfills. Even when landfill gas is not collected, it still must be vented to prevent the gas from migrating, damaging vegetation over the landfill, or collecting beneath the impermeable layer which may cause a ‘balloon’ effect beneath the ground. Gas venting or collection is typically performed using perforated pipes installed either vertically as seen in Fig. (1) [6] or in a horizontal pipe network configuration near the surface and located just below an impermeable layer to prevent the escape of gas to the atmosphere. When a collection system is in place, the individual pipes are connected to a header and the gas is delivered to a centralized location. The gas may be collected by passive diffusion through the waste layer or actively by attaching a vacuum to the pipe to create negative pressure inside the landfill and extract the LFG more quickly and efficiently.
Table 1. Landfill gas composition.
Compound % by Volume
Methane 45-60%
Carbondioxide 40-60%
Nitrogen 2-5%
Oxygen 0.1-1%
Ammonia 0.1-1%
Non-Methane Organic Compounds 0.01-0.6%
Sulfides 0-1%
Hydrogen 0-0.2%
Carbon monoxide 0-0.2%
Fig. (1). Landfill gas collection pipe design.

28 The Open Fuels & Energy Science Journal, 2014, Volume 7 Swain and Shrestha
Because collection systems are required for large landfills, the additional cost associated with installing an LFGTE system is relatively small. Large landfills can easily justify the cost of installing LFGTE systems, but even smaller landfills can employ LFGTE profitably. As of 2007, there were over 400 LFGTE projects in operation in the United States. In addition to these, the US EPA has identified another 535 candidate sites for LFGTE projects. These candidate sites are those landfills with at least 1 million tons of waste-in-place, and represent the majority of the total land-filled waste in the US. The viability of LFGTE projects as a private venture depends on the cost of installation vs the price for which the electricity and/or heat produced can be sold. In 2005, it was estimated that the break-even price for electricity was between $0.03-0.04/kWh [7] which is far below the current price of electricity.
A hypothetical landfill of the minimum size was considered as a candidate site for LFGTE with one million tons of waste infill over a period of ten years. The amount of landfill gas produced by the landfill can be estimated by the formula presented by Jaramillo and Matthews [7]:
LFGT, x = 2kRxLoe–k(T–x)
where LFG [mmcf/yr] is the amount of landfill gas produced in year T, 2 is the ratio of LFG to methane, k [1/yr] is the rate of methane generation, Rx [lbs] is the amount of waste input in year x, and Lo [ft3/lb] is the methane generation potential of the waste. The following values are assumed for the variables:
k = 0.255 – a value representative of a wet climate.
Rx = 2 x 10⁸ for the landfill in consideration.
Lo = 2.565.
Given the values assumed above, Fig. (2) shows the rate of methane production rate decay for one year’s worth of a municipal solid waste (MSW) land-filled.
This formula gives a peak methane production rate in year 10 of 2.26 x 10⁹ mmcf/year of landfill gas, after which infill ceases and there is a sharp decline in LFG generation. Given these values, the LFG production rate for the landfill over its 10-year infill and the following ten years is shown in Fig. (3).
The power generation potential can then be estimated using Jaramillo and Matthews’ equation [7]:
𝐺𝑃𝐺𝑃! =𝐿𝐹𝐺!𝜂!"#𝐸!365 (24)𝐻!
where η col is the collection efficiency, Ec [BTU/ft3] is the energy coefficient of landfill gas, and Hr [BTU/kWh] is the heat rate of the equipment. Assuming a collection efficiency of 85%, an energy coefficient of 500 BTU/ft3, and heat rate of 9492 BTU/kWh for an internal combustion engine, the maximum power output will be 11.5 MW. Assuming the project is shut down when gas production drops to 10% of peak (after 20 years), the power generated over the life of the project would be 9.1 x 10⁸ kWh. As the average US household consumes approximately 11,040 kWh per year
[8], the electricity generated could power over 4,000 homes for the 20-year lifespan of the project.
Fig. (2). Estimated landfill gas production decay for 105 tons of municipal solid waste.
Fig. (3). Landfill Gas Production Rate Estimate for a Hypothetical 1 MTon Landfill.
Use of methane and natural gas in internal combustion engines is well-studied, but the use of landfill gas as a fuel in its unrefined state has received less attention. In general, it is desirable to increase engine compression ratio as high as possible to increase efficiency, but the limiting factor for compression ratio is the spontaneous detonation of fuel-air mixture ahead of the flame front – known as knock. This phenomenon creates extremely high temperatures and pressures and destroys the boundary layer between the burned gas region and the chamber walls causing rapid heating of the piston, cylinder head, and block. Persistent knock can cause damage to engine components and can eventually destroy an engine.
Landfill gas, when considered as a fuel, is essentially methane diluted by carbondioxide. The carbondioxide may participate in the combustion reaction; but, for complete combustion of fuel, all of the carbondioxide which enters with the fuel will leave as carbondioxide, so it has no net effect on the combustion reaction. The way in which the additional CO2 does impact the reaction is by diluting the heat capacity of the fuel and absorbing heat released in the combustion reaction, thereby lowering the flame temperature and consequently the flame speed and pressure in the
YearlyMethan
eProduction
0.00E+00
5.00E+07
1.00E+08
1.50E+08
2.00E+08
2.50E+08
Yearly M
ethan
e Production
[mmcf]
0
7
8
8
8
8
0 5 10 15
Year
20
Methan
e [mmcf/yr]
0.00E+00
5.00E+08
1.00E+09
1.50E+09
2.00E+09
2.50E+09
0
Methan
e [mmcf/yr]
5 10 1
Year
15 20
CFD Performance Analysis of a Spark Ignition Engine Fueled by Landfill Gas The Open Fuels & Energy Science Journal, 2014, Volume 7 29
cylinder. In a study by Liu et al. [9], it was predicted that the carbondioxide content in landfill gas would reduce the flame temperature by 200 K from that of pure methane fuel. In addition, flame speed was found to decline linearly from the flame speed of methane fuel to zero as the proportion of CO2 increased. Generally at some concentration of carbondioxide in the fuel, the flame temperature would reduce to such a point that the flame would no longer propagate. In general, all other operating conditions being equal, the effect of introducing CO2 into the fuel will reduce fuel efficiency and power output of an engine.
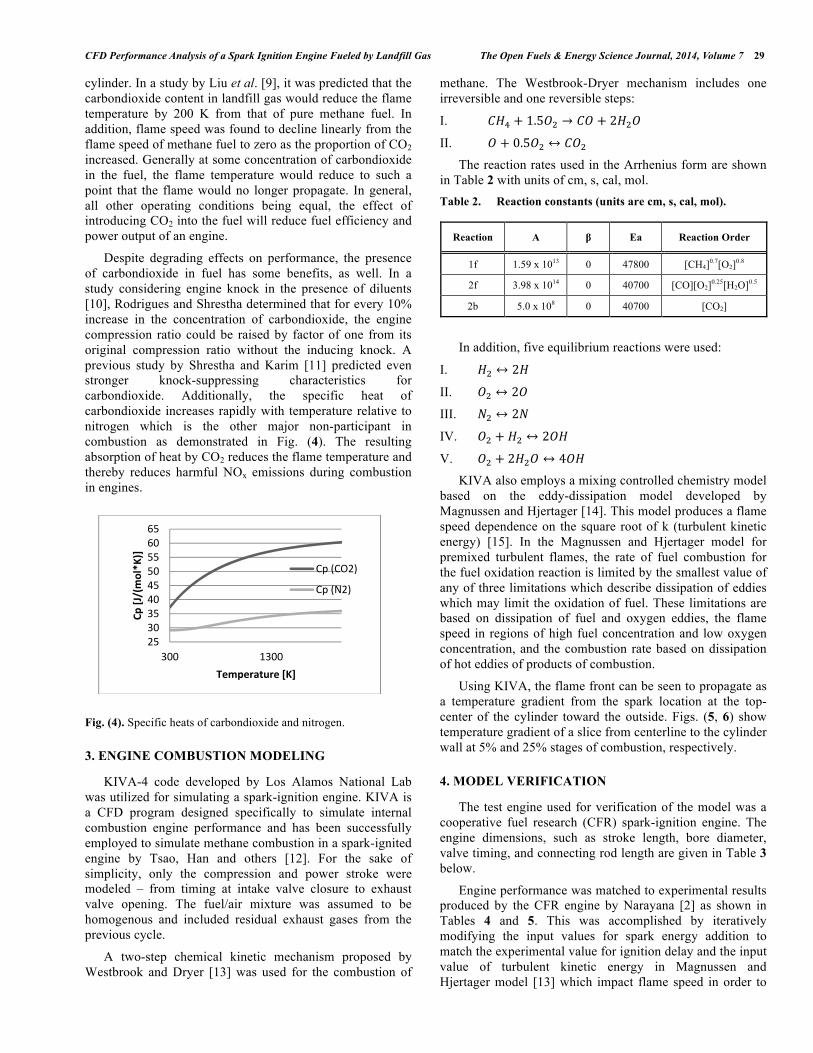
Despite degrading effects on performance, the presence of carbondioxide in fuel has some benefits, as well. In a study considering engine knock in the presence of diluents [10], Rodrigues and Shrestha determined that for every 10% increase in the concentration of carbondioxide, the engine compression ratio could be raised by factor of one from its original compression ratio without the inducing knock. A previous study by Shrestha and Karim [11] predicted even stronger knock-suppressing characteristics for carbondioxide. Additionally, the specific heat of carbondioxide increases rapidly with temperature relative to nitrogen which is the other major non-participant in combustion as demonstrated in Fig. (4). The resulting absorption of heat by CO2 reduces the flame temperature and thereby reduces harmful NOx emissions during combustion in engines.
Fig. (4). Specific heats of carbondioxide and nitrogen.
3. ENGINE COMBUSTION MODELING
KIVA-4 code developed by Los Alamos National Lab was utilized for simulating a spark-ignition engine. KIVA is a CFD program designed specifically to simulate internal combustion engine performance and has been successfully employed to simulate methane combustion in a spark-ignited engine by Tsao, Han and others [12]. For the sake of simplicity, only the compression and power stroke were modeled – from timing at intake valve closure to exhaust valve opening. The fuel/air mixture was assumed to be homogenous and included residual exhaust gases from the previous cycle.
A two-step chemical kinetic mechanism proposed by Westbrook and Dryer [13] was used for the combustion of
methane. The Westbrook-Dryer mechanism includes one irreversible and one reversible steps:
I. 𝐶𝐻! + 1.5𝑂! → 𝐶𝑂 + 2𝐻!𝑂
II. 𝑂 + 0.5𝑂! ↔ 𝐶𝑂!
The reaction rates used in the Arrhenius form are shown in Table 2 with units of cm, s, cal, mol. Table 2. Reaction constants (units are cm, s, cal, mol).
Reaction A β Ea Reaction Order
1f 1.59 x 10¹³ 0 47800 [CH4]0.7[O2]0.8
2f 3.98 x 10¹⁴ 0 40700 [CO][O2]0.25[H2O]0.5
2b 5.0 x 10⁸ 0 40700 [CO2]
In addition, five equilibrium reactions were used:
I. 𝐻! ↔ 2𝐻
II. 𝑂! ↔ 2𝑂
III. 𝑁! ↔ 2𝑁
IV. 𝑂! + 𝐻! ↔ 2𝑂𝐻
V. 𝑂! + 2𝐻!𝑂 ↔ 4𝑂𝐻
KIVA also employs a mixing controlled chemistry model based on the eddy-dissipation model developed by Magnussen and Hjertager [14]. This model produces a flame speed dependence on the square root of k (turbulent kinetic energy) [15]. In the Magnussen and Hjertager model for premixed turbulent flames, the rate of fuel combustion for the fuel oxidation reaction is limited by the smallest value of any of three limitations which describe dissipation of eddies which may limit the oxidation of fuel. These limitations are based on dissipation of fuel and oxygen eddies, the flame speed in regions of high fuel concentration and low oxygen concentration, and the combustion rate based on dissipation of hot eddies of products of combustion.
Using KIVA, the flame front can be seen to propagate as a temperature gradient from the spark location at the top-center of the cylinder toward the outside. Figs. (5, 6) show temperature gradient of a slice from centerline to the cylinder wall at 5% and 25% stages of combustion, respectively.
4. MODEL VERIFICATION
The test engine used for verification of the model was a cooperative fuel research (CFR) spark-ignition engine. The engine dimensions, such as stroke length, bore diameter, valve timing, and connecting rod length are given in Table 3 below.
Engine performance was matched to experimental results produced by the CFR engine by Narayana [2] as shown in Tables 4 and 5. This was accomplished by iteratively modifying the input values for spark energy addition to match the experimental value for ignition delay and the input value of turbulent kinetic energy in Magnussen and Hjertager model [13] which impact flame speed in order to
253035404550556065
300
Cp [J/(m
ol*K)]
Temper
1300
rature [K]
C
C
Cp (CO2)
Cp (N2)

30 The Open Fuels & Energy Science Journal, 2014, Volume 7 Swain and Shrestha
match the experimentally determined value for combustion duration [3]. The resulting model produced combustion duration, power, and peak pressure trends that compared generally favorably with experimental values except that the simulation that does not suffer from ring or valve leakage as a real engine does and so simulated values for peak pressure and power are somewhat higher than experimental values. Ignition delay did not produce good agreement or follow trends for diluted fuel; however, since a range of spark timings were examined, the model was still valid except in that actual spark timing required to produce similar results may vary from the model. Moreover, the ignition delay generally influences minimum on the performance parameter of the engine. Additionally, the simulations used for modeling were run at 1,200 rpm instead of 600 rpm used for verification, because an engine speed of 1,200 rpm
represents a common operating speed for an electrical generator. The ignition delay and combustion duration were determined as 5% and 95% of the mixture mass burned for all the calculations. Table 3. Engine characteristics.
Variable Value Units
Bore 8.26 cm
Stroke 11.43 cm
Connecting Rod Length 25.4 cm
Valve Close -146 deg ATDC
Valve Open 140 deg ATDC
Fig. (5). Temperature gradient at 5% of fuel consumed.
Fig. (6). Temperature gradient at 25% of fuel consumed.
CFD Performance Analysis of a Spark Ignition Engine Fueled by Landfill Gas The Open Fuels & Energy Science Journal, 2014, Volume 7 31
Table 4. Comparison with experimental values.
Simulated Experimental Difference
Ignition Delay [deg] 3 3 0%
Combustion Duration [deg] 25 27 8%
Peak Pressure [MPa] 6.7 5.1 24%
Indicated Power [kW] 2.86 1.9 34% Methane, CR=8.5, ER=0.9, 600 rpm, 98 kPa inlet pressure, spark timing 30 deg. before top dead center (BTDC), initial/inlet temp 303K. Table 5. Comparison with experimental values.
Simulated Experimental Difference
Ignition Delay [deg] 5 15 200%
Combustion Duration [deg] 30 33 10%
Peak Pressure [kPa] 4.89 3.9 20%
Indicated Power [kW] 2.71 2.0 26% 50% Methane, 50% CO2, CR=8.5, ER=1.0, 600 rpm, 98 kPa inlet pressure, spark timing 19 deg BTDC, initial/inlet temp 303K.
5. RESULTS AND DISCUSSION
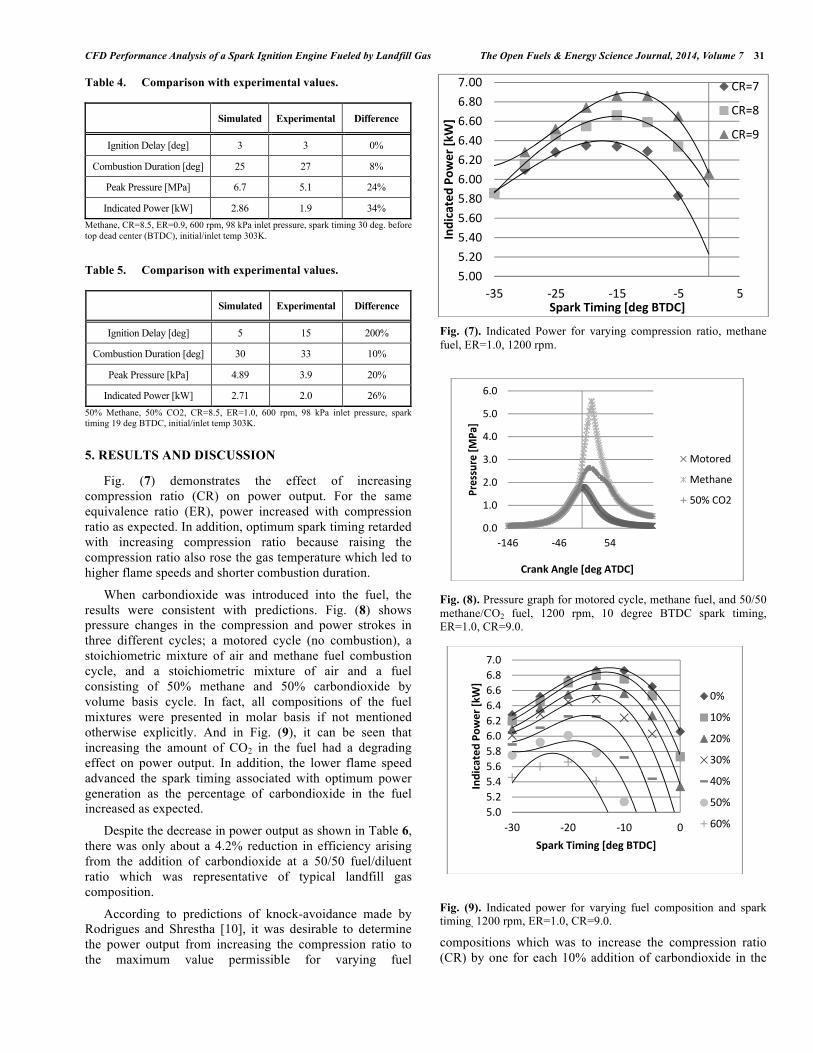
Fig. (7) demonstrates the effect of increasing compression ratio (CR) on power output. For the same equivalence ratio (ER), power increased with compression ratio as expected. In addition, optimum spark timing retarded with increasing compression ratio because raising the compression ratio also rose the gas temperature which led to higher flame speeds and shorter combustion duration.
When carbondioxide was introduced into the fuel, the results were consistent with predictions. Fig. (8) shows pressure changes in the compression and power strokes in three different cycles; a motored cycle (no combustion), a stoichiometric mixture of air and methane fuel combustion cycle, and a stoichiometric mixture of air and a fuel consisting of 50% methane and 50% carbondioxide by volume basis cycle. In fact, all compositions of the fuel mixtures were presented in molar basis if not mentioned otherwise explicitly. And in Fig. (9), it can be seen that increasing the amount of CO2 in the fuel had a degrading effect on power output. In addition, the lower flame speed advanced the spark timing associated with optimum power generation as the percentage of carbondioxide in the fuel increased as expected.
Despite the decrease in power output as shown in Table 6, there was only about a 4.2% reduction in efficiency arising from the addition of carbondioxide at a 50/50 fuel/diluent ratio which was representative of typical landfill gas composition.
According to predictions of knock-avoidance made by Rodrigues and Shrestha [10], it was desirable to determine the power output from increasing the compression ratio to the maximum value permissible for varying fuel
Fig. (7). Indicated Power for varying compression ratio, methane fuel, ER=1.0, 1200 rpm.
Fig. (8). Pressure graph for motored cycle, methane fuel, and 50/50 methane/CO2 fuel, 1200 rpm, 10 degree BTDC spark timing, ER=1.0, CR=9.0.
Fig. (9). Indicated power for varying fuel composition and spark timing, 1200 rpm, ER=1.0, CR=9.0.
compositions which was to increase the compression ratio (CR) by one for each 10% addition of carbondioxide in the
5.
5.
5.
5.
5.
6.
6.
6.
6.
6.
7.
Indicated Power [kW]
00
20
40
60
80
00
20
40
60
80
00
‐35 ‐25 ‐1Spark Timing
5 ‐5g [deg BTDC]
5
CR=7
CR=8
CR=9
Pressure [MPa]
0.0
1.0
2.0
3.0
4.0
5.0
6.0
‐146
Pressure [MPa]
Cran
‐46 5
nk Angle [deg A
54
ATDC]
Motored
Methane
50% CO2
5.0
5.2
5.4
5.6
5.8
6.0
6.2
6.4
6.6
6.8
7.0
‐30 ‐20 ‐10 0
Indicated Power [kW]
Spark Timing [deg BTDC]
0%
10%
20%
30%
40%
50%
60%
32 The Open Fuels & Energy Science Journal, 2014, Volume 7 Swain and Shrestha
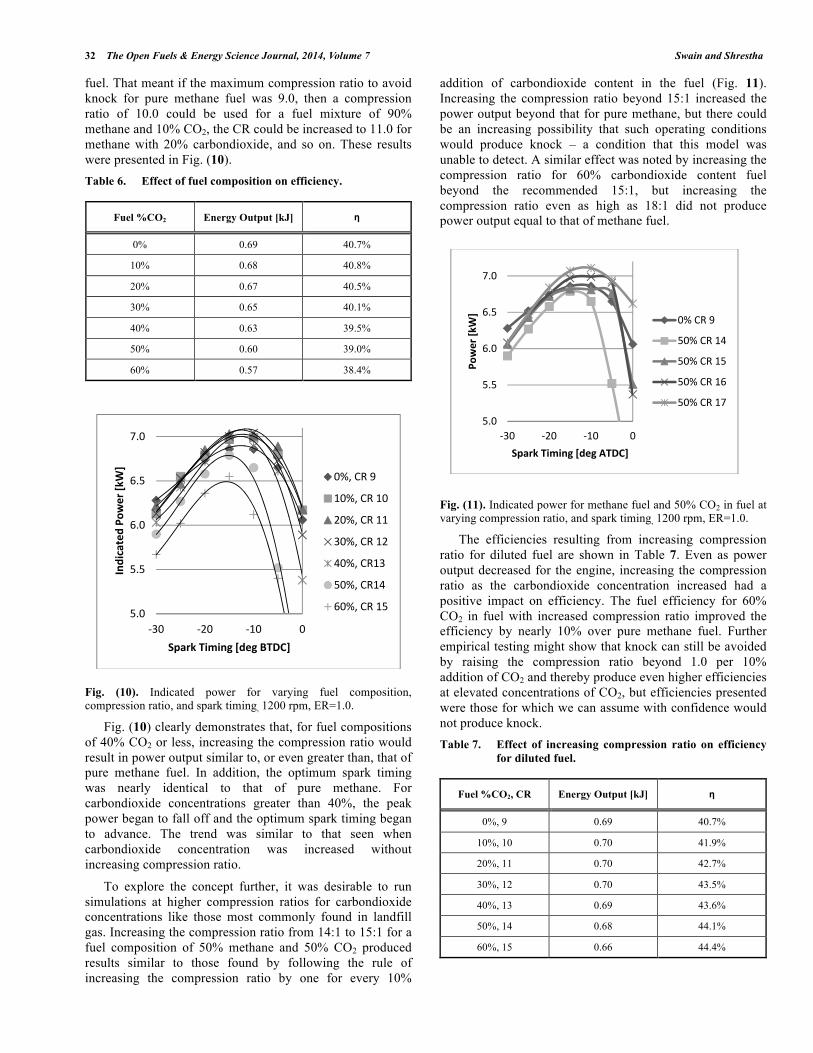
fuel. That meant if the maximum compression ratio to avoid knock for pure methane fuel was 9.0, then a compression ratio of 10.0 could be used for a fuel mixture of 90% methane and 10% CO2, the CR could be increased to 11.0 for methane with 20% carbondioxide, and so on. These results were presented in Fig. (10). Table 6. Effect of fuel composition on efficiency.
Fuel %CO2 Energy Output [kJ] η
0% 0.69 40.7%
10% 0.68 40.8%
20% 0.67 40.5%
30% 0.65 40.1%
40% 0.63 39.5%
50% 0.60 39.0%
60% 0.57 38.4%
Fig. (10). Indicated power for varying fuel composition, compression ratio, and spark timing, 1200 rpm, ER=1.0.
Fig. (10) clearly demonstrates that, for fuel compositions of 40% CO2 or less, increasing the compression ratio would result in power output similar to, or even greater than, that of pure methane fuel. In addition, the optimum spark timing was nearly identical to that of pure methane. For carbondioxide concentrations greater than 40%, the peak power began to fall off and the optimum spark timing began to advance. The trend was similar to that seen when carbondioxide concentration was increased without increasing compression ratio.
To explore the concept further, it was desirable to run simulations at higher compression ratios for carbondioxide concentrations like those most commonly found in landfill gas. Increasing the compression ratio from 14:1 to 15:1 for a fuel composition of 50% methane and 50% CO2 produced results similar to those found by following the rule of increasing the compression ratio by one for every 10%
addition of carbondioxide content in the fuel (Fig. 11). Increasing the compression ratio beyond 15:1 increased the power output beyond that for pure methane, but there could be an increasing possibility that such operating conditions would produce knock – a condition that this model was unable to detect. A similar effect was noted by increasing the compression ratio for 60% carbondioxide content fuel beyond the recommended 15:1, but increasing the compression ratio even as high as 18:1 did not produce power output equal to that of methane fuel.
Fig. (11). Indicated power for methane fuel and 50% CO2 in fuel at varying compression ratio, and spark timing, 1200 rpm, ER=1.0.
The efficiencies resulting from increasing compression ratio for diluted fuel are shown in Table 7. Even as power output decreased for the engine, increasing the compression ratio as the carbondioxide concentration increased had a positive impact on efficiency. The fuel efficiency for 60% CO2 in fuel with increased compression ratio improved the efficiency by nearly 10% over pure methane fuel. Further empirical testing might show that knock can still be avoided by raising the compression ratio beyond 1.0 per 10% addition of CO2 and thereby produce even higher efficiencies at elevated concentrations of CO2, but efficiencies presented were those for which we can assume with confidence would not produce knock. Table 7. Effect of increasing compression ratio on efficiency
for diluted fuel.
Fuel %CO2, CR Energy Output [kJ] η
0%, 9 0.69 40.7%
10%, 10 0.70 41.9%
20%, 11 0.70 42.7%
30%, 12 0.70 43.5%
40%, 13 0.69 43.6%
50%, 14 0.68 44.1%
60%, 15 0.66 44.4%
,
5.0
5.5
6.0
6.5
7.0
‐30 ‐20 ‐10 0
Indicated Power [kW]
Spark Timing [deg BTDC]
0%, CR 9
10%, CR 10
20%, CR 11
30%, CR 12
40%, CR13
50%, CR14
60%, CR 15
5.0
5.5
6.0
6.5
7.0
‐30 ‐20 ‐10 0
Power [kW]
Spark Timing [deg ATDC]
0% CR 9
50% CR 14
50% CR 15
50% CR 16
50% CR 17

CFD Performance Analysis of a Spark Ignition Engine Fueled by Landfill Gas The Open Fuels & Energy Science Journal, 2014, Volume 7 33
To state it another way, one normal cubic meter of typical landfill gas with a concentration of 50% carbondioxide and 50% methane can be used directly to fuel an internal combustion engine to produce 8033 kJ of power or it can be purified at some cost of equipment and operation and then utilized in the same engine to produce only 7413 kJ of power. In addition to the cost of purification, there is also some loss of methane that is likely to further reduce the energy output of purified methane, but the losses and costs of purification are variable and so losses are assumed to be zero for this comparison.
CONCLUSION
Alternative fuels such as landfill gas, biogas, coal gas swamp gas and other similar fuels are being used increasingly in recent years to produce power and energy, because of increased awareness of the climate change and global warming, and continuous rising of conventional fossil fuels price. In fact, the useful methane in landfill gases and biogases is often diluted by carbondioxide or other compounds, combustion is significantly different than for pure hydrocarbon fuels and a more thorough understanding of how these fuels perform is needed for engine design and operation.
The utilization of landfill gas or other similar methane-based fuel which was diluted with carbondioxide, nitrogen and others, a decision must be made whether to purify methane or to use the fuel “as-is” with the diluents present. This study has found that overall fuel efficiency can be maintained within 5% of that for pure methane fuel for methane diluted up to 1:1 with CO2 by simply adjusting the spark timing of the engine. Furthermore, if the compression ratio is increased to the maximum recommended by Rodriguez and Shrestha, fuel efficiency actually increases with increasing levels of carbondioxide. Therefore, for a given methane-based fuel diluted by carbondioxide, this study found a negative benefit to purify methane from the fuel if the compression ratio is increased appropriately. In the case of an engine that can not readily be modified, the cost of purifying the methane fuel must be weighed against the loss of efficiency that arises from the presence of diluents.
CONFLICT OF INTEREST
The authors confirm that this article content has no conflict of interest.
ACKNOWLEDGEMENTS
Declared none.
REFERENCES
[1] Themelis, N.J.; Ulloa, P.A. Methane generation in landfills. Renew. Energy, 2007, 32(7), 1243-1257.
[2] Narayanan, G. Landfill gas - A fuel for IC engine applications. M.Sc. Thesis, Department of Mechanical and Aeronautical Engineering, Western Michigan University, Michigan, USA, 2008.
[3] Swain Daniel, P. Simulation of landfill gas performance in a spark ignition engine. M.Sc. Thesis, Department of Mechanical and Aeronautical Engineering, Western Michigan University, Michigan, USA, 2010.
[4] Williams, R.C. Landfill gas primer - an overview for environmental health professionals. Agency of Toxic Substances and Disease Registry, 4770 Buford Hwy NE, Atlanta, GA 30341, 2001.
[5] EPA, A. Inventory of U.S. greenhouse gas emissions and sinks: 1990-2002. EPA Publication, 1200 Pennsylvania Ave., NW, U.S. Environmental Protection Agency, 2004.
[6] Parametrix, Inc. Solid waste landfill design manual. Olympia, WA, Washington State Department of Ecology, 1987.
[7] Matthews, S.H.; Jarmello, P. Landfill-gas-to-energy projects: Analysis of net private and social benefits. Environ. Sci. Technol., 2005, 39(19), 7365-7373.
[8] Electricity FAQs - energy information administration. (2010). http://tonto.eia.doe.gov/ask/electricity_faqs.asp [Accessed on: October 24, 2010].
[9] Liu, C.;Yan, B.; Chen, G.; Bai, X. Structures and burning velocity of biomass derived gas flames. Int. J. Hydrogen Energy, 2010, 35(2), 542-555.
[10] Shrestha, S.B.; Rodrigues, R. Effects of diluents on knock rating of gaseous fuels. Proceedings of the Institution of Mechanical Engineers, Part A. J. Power Energy, 2008, 222(6), 587-597.
[11] Shrestha, S.O.; Karim, G.A. Predicting the effects of the presence of diluents with methane on spark ignition engine performance. Appl. Therm. Eng., 2001, 21(3), 331-342.
[12] Tsao, K.; Han, Z. An Exploratory Study on Combustion Modeling and Chamber Design of Natural Gas Engines, SAE Technical Paper 930312, 1993.
[13] Westbrook, C.; Dryer, F.L. Chemical kinetics and modeling of combustion processes. Symp. (Int.) Combust., 1981, 18(1), 749-767.
[14] Magnussen, B.F.; Hjertager, B.H. On mathematical modeling of turbulent combustion with special emphasis on soot formation and combustion. Symp. (Int.) Combust., 1977, 16(1), 719-729.
[15] Amsden, A. A.KIVA-3V: A block-structured KIVA progam for engines with vertical or canted valves, Los Alamos National Laboratory, Los Alamos, NM 87545, 1997.
Received: January 17, 2014 Revised: April 12, 2014 Accepted: April 15, 2014 © Swain and Shrestha; Licensee Bentham Open.
This is an open access article licensed under the terms of the Creative Commons Attribution Non-Commercial License (http://creativecommons.org/licenses/by-nc/3.0/) which permits unrestricted, non-commercial use, distribution and reproduction in any medium, provided the work is properly cited.