CFA Society of Minnesota InvestMNt Conference€¦ · CFA Society of Minnesota InvestMNt Conference...
22
CFA Society of Minnesota InvestMNt Conference Tod Carpenter, President & CEO
Transcript of CFA Society of Minnesota InvestMNt Conference€¦ · CFA Society of Minnesota InvestMNt Conference...

CFA Society of MinnesotaInvestMNt Conference
Tod Carpenter, President & CEO

Safe Harbor Statement
This presentation includes forward-looking statements which reflect the Company’s current views with respect to future events and financial performance, but involve uncertainties that could significantly impact results.

Donaldson Company
• Technology leader in our markets
• Diversified portfolio of global businesses
We are a filtration company

Why Customers Want Our Technology
• Technology Advantages•Higher efficiency
•Small system size
•Longer filter life
•Reduced operating and maintenance costs
• Better Aftermarket Retention

Diversified Product Assortment: Engine
Air Filters
Liquid Filters
Exhaust & Emission Products

Diversified Product Assortment: Industrial
Industrial Filtration Systems Gas turbine filters
Special Applications

FY 2014 Sales Composition
Aftermarket64%
Off-Road22%
On-Road8%
Aero & Defense
6%
Engine
IndustrialFiltration
62%
SpecialApplications
20%
GasTurbine
18%
Industrial
$1.6 billion $900 million

Donaldson Core
Future Growth Plans
Geography
ExpandCore
Acquisitions
Donaldson Core
• $5 billion by FY21
• Through further diversificationExpand core products & technologies
Expand geographies
Execute acquisitions

Sales Growth Model
CreateHoles
Sell Replacements
Re-Invest
Growth
Use Innovative Technology

Innovative First-Fit Improves Aftermarket Retention
0%
20%
40%
60%
80%
100%
Yr 0 Yr 2 Yr 5 Yr 8 Yr 10 Yr 15
Legacy Innovative

PowerCore® Filtration Technology

PowerCore® Filtration Technology
•More than 20 million units sold•90% win rate•G2 is another 1/3 smaller

Fuel Filtration with Synteq® XP
•Designed for the new diesel fuels•Higher efficiency for improved engine protection•Can extend filter life•13 new OEM programs won

Sales and Earnings Growth Over Time
8%
14%
Sales Earnings
25-Year CAGR

Current Environment
Recent challenges• Challenging end markets
• Soft global GDP growth is limiting capital investment
• Significant currency headwinds
Tactics to address challenges• Strategic Growth Plans
• Continued investment in our business
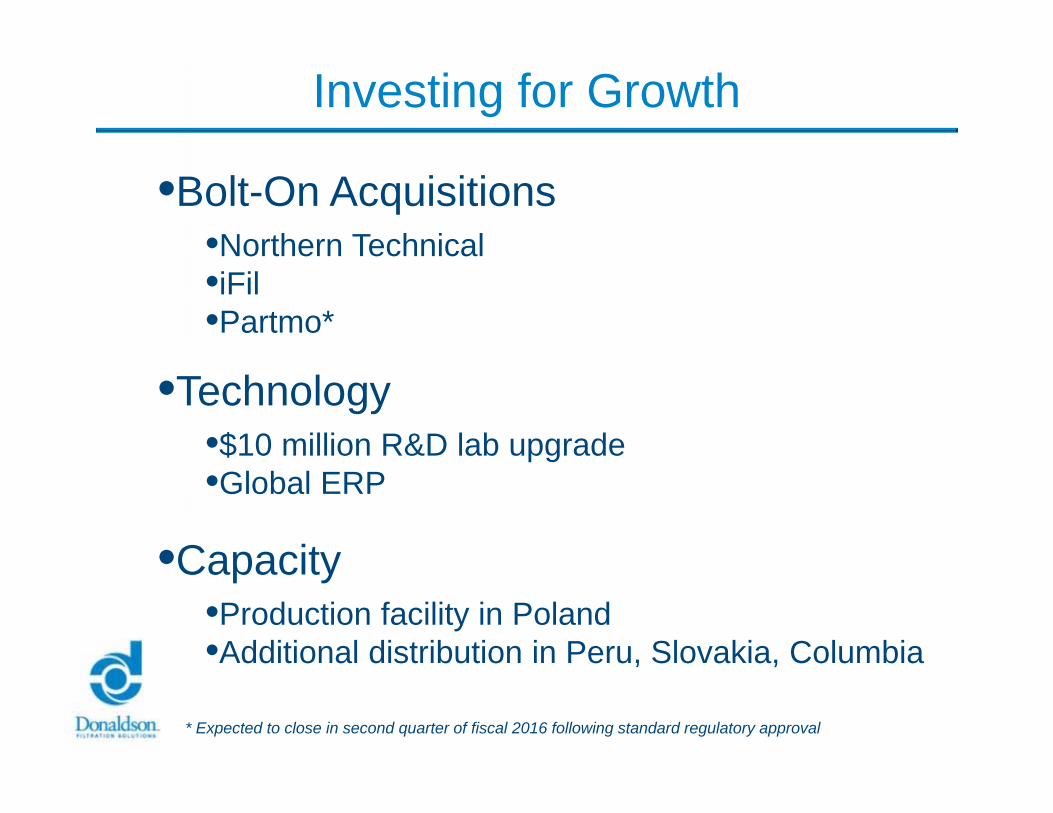
•Bolt-On Acquisitions•Northern Technical•iFil•Partmo*
•Technology•$10 million R&D lab upgrade•Global ERP
•Capacity•Production facility in Poland•Additional distribution in Peru, Slovakia, Columbia
Investing for Growth
* Expected to close in second quarter of fiscal 2016 following standard regulatory approval

High After-Tax Return on Investment
15%
0%
10%
20%
30%
1990 '92 '94 '96 '98 '00 '02 '04 '06 '08 '10 '12 '14
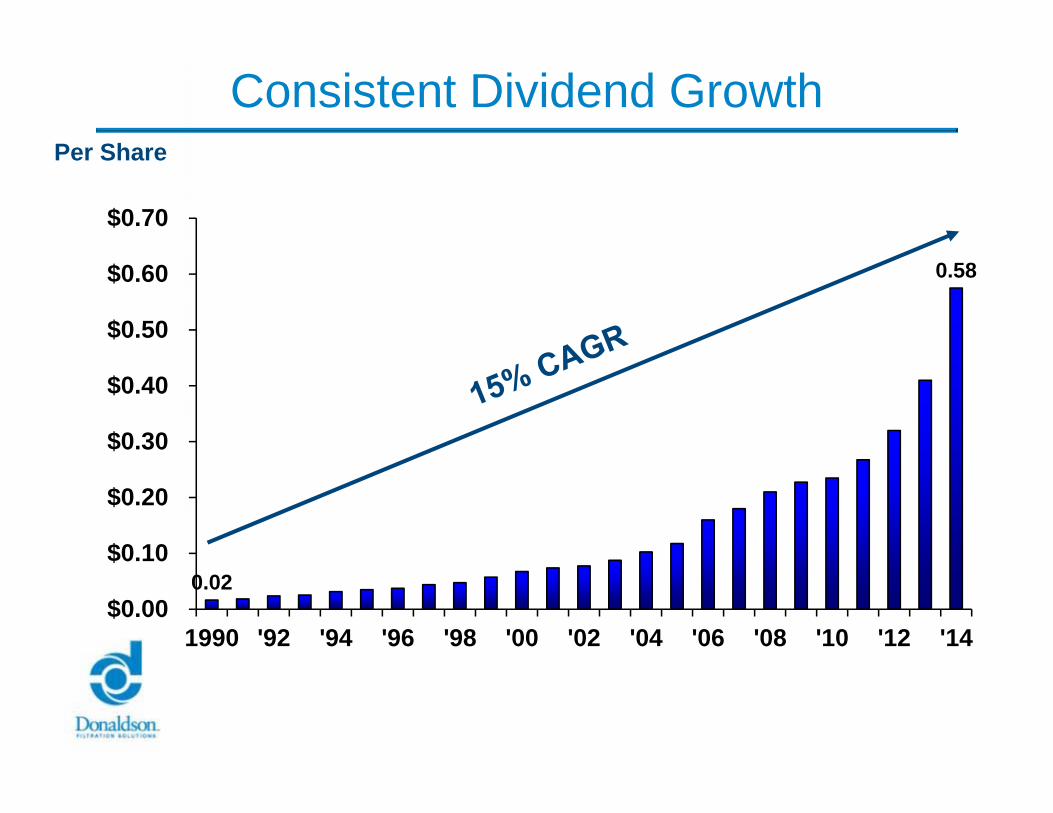
Consistent Dividend Growth
0.02
0.58
$0.00
$0.10
$0.20
$0.30
$0.40
$0.50
$0.60
$0.70
1990 '92 '94 '96 '98 '00 '02 '04 '06 '08 '10 '12 '14
Per Share

Consistent Share Repurchases
231
140
0
50
100
150
200
250
1990 '92 '94 '96 '98 '00 '02 '04 '06 '08 '10 '12 '14
Shares Outstandingin Millions
Investment Conclusion
•Diversified product lines
•Deeply integrated into global economy
•Committed to growth & financial performance
•Disciplined capital deployment

A Measure of Success:Return to Shareholders
$6,203
$100$2,055
FY89 FY91 FY93 FY95 FY97 FY99 FY01 FY03 FY05 FY07 FY09 FY11 FY13 FY15
DCI S&P 400