Centralia College · 2020-05-21 · guidebook to the geology of Mount Rainier National Park,...
58
Centralia College 2016 Comprehensive Annual Financial Report Centralia College, located in Centralia, Washington
Transcript of Centralia College · 2020-05-21 · guidebook to the geology of Mount Rainier National Park,...
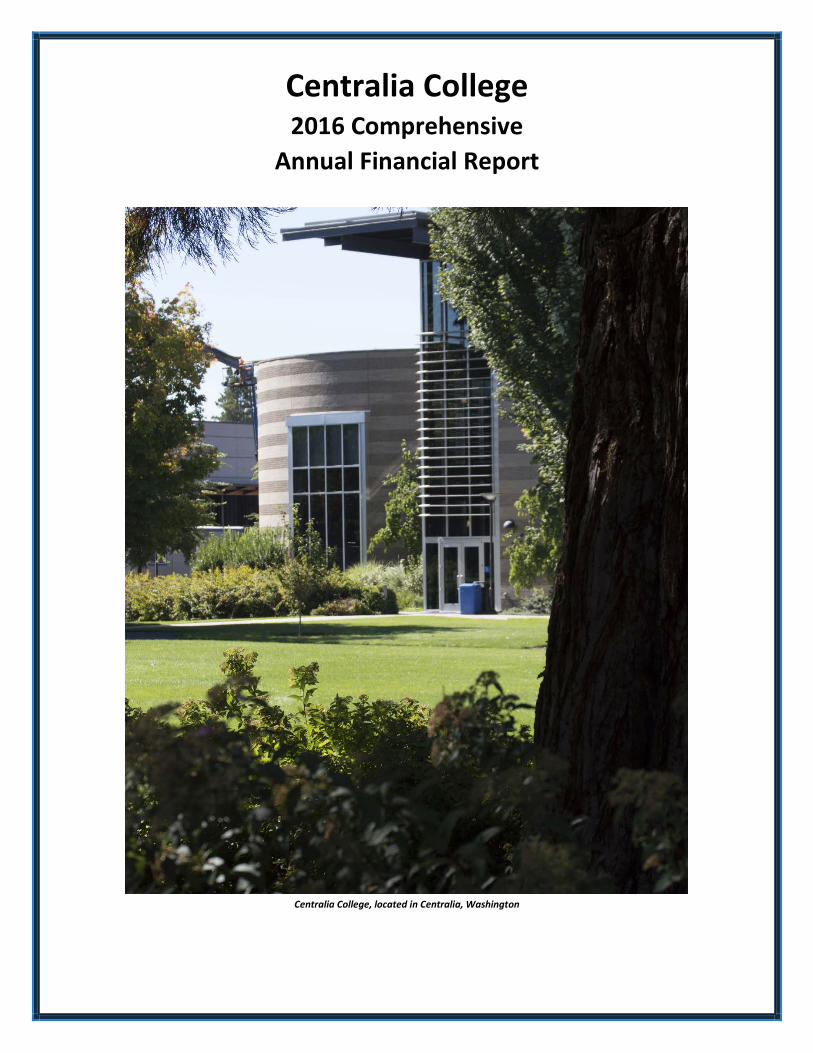
Centralia College 2016 Comprehensive
Annual Financial Report
Centralia College, located in Centralia, Washington

Centralia College 2016 Financial Report
__________________________________________________________________________________________________ centralia.edu This report was produced by the College’s Business Office staff
History of Athletics at Centralia College – The Old and the New
1952 College Football Team
2016 College Soccer Team

Page | 1
Centralia College
2016 Financial Statements
College Success Stories 2 Letter from the President 5 Board of Trustees and Administrative Officers 6 Independent Auditor’s Report 7 Management’s Discussion and Analysis 10 Statement of Net Position (College) 18 Statement of Revenues, Expenses and Changes in Net Position (College) 19 Statement of Cash Flows (College) 20 Statement of Financial Position (Foundation) 22 Statement of Activities and Changes in Net Assets (Foundation) 23 Statement of Cash Flows (Foundation) 24 Notes to the Financial Statements 25 Required Supplementary Information 47 Independent Auditor’s Report on Internal Control Over Financial Reporting and on Compliance and Other Matters Based on an Audit of Financial Statements Performed in Accordance with Government Auditing Standards 53

Centralia College 2016 Financial Report
Page | 2
Centralia College Foundation Helps Students Build Underwater Rover
At one and half feet tall, one foot wide, and two feet long, the CC Venturi looks more like a hodgepodge of plumbing parts than what it really is – a sophisticated underwater Remote Operated Vehicle (ROV) built to explore and collect visual, audio, and physical samples in deep water.
The underwater ROV is a 3D robot, controlled from the surface of the water, designed to dive, and maneuver at a depth of more than 200 feet. It’s equipped with barometric, temperature, depth, and pressure sensors, and has live video and audio that is controlled from the surface. It was designed, built, and tested over 15 months by two Centralia College engineering students, Micah Corwin and Blake Wiley, with the assistance of Centralia College’s Applied Physics and Engineering Club (APEC). This project was made possible with the vision of the Centralia College Foundation through a Capstone Grant, which provides financial support for student projects that enhance their education, research, and the college and community.
Centralia College is the only community college in Washington that provides this level of support for independent student projects.
Corwin, who finished his third year at Centralia College, plans to attend the University of Washington to earn a degree in mechanical engineering. In 2015, Wiley transferred from Centralia College to St. Martins University, where he is earning the same degree.
“I’m so proud of the hard work and dedication they’ve put in,” said Corwin’s father Jeremy. “But his mother and I will be happy to get our kitchen back, it’s been covered in parts for about 15 months now.”
The CC Venturi held its maiden voyage in November 2015 at a small private lake in Centralia during a rain storm. It was attended by a large contingency of students, members of the community, and family.
The students have plans to use the ROV to explore and collect data from local lakes and shores, including Mayfield Lake and Puget Sound. The geology department has shown great interest in using the vehicle to collect data from local ancient submerged petrified forests. There are also plans for adding additional sensors and equipment to the ROV, such as a scoop to collect soil samples.
“It took longer than we expected to complete with all of the coding and electronic work, but it was a great learning experience that I could never have received in the classroom,” Corwin said. “We are really grateful to the college and the foundation for all of their support. We would never have had this opportunity without it.”
An example of how your generous contributions to the Centralia College Foundation help students in the pursuit of their educational goals.

Centralia College 2016 Financial Report
Page | 3
College Geosciences Professor Wins State Faculty Award
The Washington State Association of College Trustees has selected Centralia College Professor Pat Pringle for the 2016 Faculty Member Award for demonstrated excellence in teaching in the community and technical college system.
“Professor Pringle is one of the most dynamic, engaging, and exciting professors I’ve ever seen in the classroom. His enthusiasm for the geosciences is infectious, and his commitment to student research at all levels is inspiring,” said Joanne Schwartz, of the Centralia College Board of Trustees. “His presence on campus is powerful – his classes are always full with many students taking everything he teaches.”
Throughout his 11 years at Centralia College, Professor Pringle has been a strong advocate of hands-on learning. He uses integrated field trips as labs and incorporates tree-ring and geologic research exercises and projects into his classes and independent research projects. He’s been able to share the insights and broad experiences of more than 23 years of geoscience research, science outreach, and public information with Centralia College students.
“Many of Pat’s students have gone on to follow in his footsteps. That is the sign of a great teacher and mentor. Pat is a very humble individual, but I can see how proud he is when his students get recognized for their accomplishments,” said Dr. Jim Walton, Centralia College president. “Pat is a great scientist in his own right, but being a teacher and mentor of community college students is the calling in which he excels above all else.”
Professor Pringle is a leader in regional geosciences, providing professional guidance and insight into the exploration and interpretive understanding of the region’s most beloved resources, including Mount St. Helens, Mount Hood, and Mount Rainier, and some of the lesser known features, such as Lake Kapowsin, which was recently nominated to be Washington State’s first freshwater aquatic reserve. His expertise on these geologic matters is widely sought by other experts and agencies, including the Department of Natural Resources, local emergency support and response groups, and the Nisqually and Chehalis Tribes.
He is widely published. His work includes the definitive guidebook to the geology of Mount Rainier National Park, Roadside Geology of Mount Rainier National Park and Vicinity. Pringle’s book details the geologic history of the mountain and all of its associated features, including the lahar patterns, glaciers, lava domes and flows, caves, lakes, and more.

Centralia College 2016 Financial Report
Page | 4
Hard Work Pays Off for Single Mom
Kaila Koons first came to Centralia College after receiving an associate degree in accounting from a for-profit college, and found that she had been misled into thinking that her degree would transfer as she pursued a bachelor degree, that wasn’t the case. Though some credits did transfer, she lost about 25 percent of them, putting her further behind and deeper in debt with student loans, but that didn’t stop her.
“I was really frustrated at first,” Kaila explained. “I had worked so hard, and they had made promises that just weren’t true. But I couldn’t let that stop me, so I transferred what I could, and spent the next year taking classes I needed to earn an accredited associate degree before entering the Bachelor of Applied Science in Applied Management (BAS-AM) degree program at Centralia College.”
Kaila also took advantage of the student worker program at the college, taking a position in the financial aid department. Over time she’s worked her way up, earning multiple promotions, and the respect of her coworkers and supervisors along the way.
“Kaila always strives to do better and looks for opportunities to make a difference, not only for students but for her coworkers,” Director of Financial Aid Tracy Dahl said. “We have had the unique opportunity to see her complete her associate and now her bachelor’s degrees while balancing motherhood and work.”
In addition to being a single mom of two, Kaila faced several challenges. Her landlord lost the apartment she was living in to foreclosure. Two weeks later, her car broke down and was beyond repair. And, during fall quarter of her final year, she gave birth to her third child. Not missing a beat, she returned to class in less than a week. In addition, she had exhausted much of her financial aid at her previous school, leaving her without a way to pay for her final quarter. Fortunately for Kaila, she had worked hard, earning a scholarship from Timber Services through the Centralia College Foundation. Kaila also had a lot of help from a very supportive family, from lodging, to financial help, to childcare, they made sure she had what she needed while striving to reach her goals.
Though the pursuit of her education has been a long and bumpy road, Kaila graduated from Centralia College with a Bachelor of Applied Science in Applied Management degree. She is now working at the financial aid office at Columbia Basin College in Pasco.
“I couldn’t have done it without help from my family and the support I received from the college,” Kaila said. “And I couldn’t be more grateful to the college, especially the friends I’ve made in the financial aid and student services departments. They’ve made my time at Centralia College much more special.”
Another example of how your generous contributions to the Centralia College Foundation helps to make life-changing differences in people’s lives.

Letter from the President Centralia College 2016 Financial Report
Page | 5
Bob Mohrbacher, Ed.D.. January 31st, 2017 Doris Wood-Brumsickle, Board Chair Board of Trustees Centralia College Centralia, WA 98531 Dear Chair Wood-Brumsickle:
In my first year as Centralia College president, I am proud to continue the tradition of submitting our 2016 Annual Financial Report of Centralia College to the Board of Trustees. Management assumes full responsibility for the content and accuracy of this report.
The College continues to report our financial information in a timely manner, being the first of the 34 community and technical colleges to complete the 2016 audit of our comprehensive annual financial report for public inspection, continuing with the high standard we set in 2015. Our 2016 report serves as a reminder of the responsibility we have as stewards of public resources to undergo a financial audit which provides the public confidence in our management of college and state resources. The State Auditor’s Office (SAO) has issued another clean (unmodified) opinion on the College’s financials. The Management Discussion and Analysis, which follows the State Auditor’s Office Independent Audit Opinion Letter, provides the reader with a better understanding of the financial position and result of operation for the College’s most recent fiscal-year.
In a few short months, we will open the doors of the TransAlta Commons Building, the single largest capital project in the College’s history, with a cost of $40 million. TransAlta will serve the needs of students, faculty, staff and the local community well into the 21st century.
Sincerely,
Bob Mohrbacher, President Stephen Ward, Vice President Finance & Administration

Centralia College 2016 Financial Report
Page | 6
CENTRALIA COLLEGE
Trustees and Administrators
Appointed Board of Trustees
Doris Wood-Brumsickle, M.A., Board Chair
Jim Lowery, Vice Chair
Dr. Joe Dolezal
Stuart Halsan, J.D.
Joanne Schwartz
Non-Voting Representatives
Dr. Sharon Mitchler, Faculty Representative
Erin Baker, Classified Staff Representative
Allie Fairall, ASCC Student Body President
College Administrators
Bob Mohrbacher, Ed.D, President
Stephen Ward, M.P.A., C.P.A. Vice President Finance and Administration
John Martens, M.S. Vice President Instruction
Julie Ledford, J.D. Vice President Human Resources
Robert Cox, M.Ed. Vice President Student Services
Marla Miller, Director of Fiscal Services

Page | 7
Office of the Washington State Auditor Pat McCarthy
Independent Auditor’s Report
Board of Trustees Centralia College Centralia, Washington
REPORT ON THE FINANCIAL STATEMENTS
We have audited the financial statements of the business-type activities and the aggregate discretely presented component units of the Centralia College, Lewis County, Washington, as of and for the year ended June 30, 2016, and the related notes to the financial statements, which collectively comprise the College’s basic financial statements.
Management’s Responsibility for the Financial Statements
Management is responsible for the preparation and fair presentation of these financial statements in accordance with accounting principles generally accepted in the United States of America; this includes the design, implementation, and maintenance of internal control relevant to the preparation and fair presentation of financial statements that are free from material misstatement, whether due to fraud or error.
Auditor’s Responsibility
Our responsibility is to express opinions on these financial statements based on our audit. We did not audit the financial statements of the Centralia College Foundation, which represents 100 percent of the assets, net position and revenues of the aggregate discretely presented component units. Those statements were audited by other auditors, whose report has been furnished to us, and our opinion, insofar as it relates to the amounts included for the Centralia College Foundation, is based solely on the report of the other auditors. We conducted our audit in accordance with auditing standards generally accepted in the United States of America and the standards applicable to financial audits contained in Government Auditing Standards, issued by the Comptroller General of the United States. Those standards require that we plan and perform the audit to obtain reasonable assurance about whether the financial statements are free from material misstatement. The financial statements of the Centralia College Foundation were not audited in accordance with Government Auditing Standards.
An audit involves performing procedures to obtain audit evidence about the amounts and disclosures in the financial statements. The procedures selected depend on the auditor’s judgment, including the assessment of the risks of material misstatement of the financial statements, whether due to fraud or error. In making those risk assessments, the auditor considers internal control relevant to the College’s preparation and fair presentation of the financial statements in order to design audit procedures that are appropriate in the circumstances, but not for

Page | 8
the purpose of expressing an opinion on the effectiveness of the College’s internal control. Accordingly, we express no such opinion. An audit also includes evaluating the appropriateness of accounting policies used and the reasonableness of significant accounting estimates made by management, as well as evaluating the overall presentation of the financial statements.
We believe that the audit evidence we have obtained is sufficient and appropriate to provide a basis for our audit opinions.
Opinion
In our opinion, based on our audit and the report of the other auditors, the financial statements referred to above present fairly, in all material respects, the respective financial position of the business-type activities and the aggregate discretely presented component units of the Centralia College, as of June 30, 2016, and the respective changes in financial position and, where applicable, cash flows thereof for the year then ended in accordance with accounting principles generally accepted in the United States of America.
Matters of Emphasis
As discussed in Note 1, the financial statements of the Centralia College, an agency of the state of Washington, are intended to present the financial position, and the changes in financial position, and where applicable, cash flows of only the respective portion of the activities of the state of Washington that is attributable to the transactions of the College and its aggregate discretely presented component units. They do not purport to, and do not, present fairly the financial position of the state of Washington as of June 30, 2016, the changes in its financial position, or where applicable, its cash flows for the year then ended in conformity with accounting principles generally accepted in the United States of America. Our opinion is not modified with respect to this matter.
Other Matters
Required Supplementary Information
Accounting principles generally accepted in the United States of America require that the management’s discussion and analysis, the Schedules of Centralia College’s Share of Net Pension Liability, Schedules of Contributions and the Notes to Required Supplementary Information be presented to supplement the basic financial statements. Such information, although not a part of the basic financial statements, is required by the Governmental Accounting Standards Board who considers it to be an essential part of financial reporting for placing the basic financial statements in an appropriate operational, economic or historical context. We have applied certain limited procedures to the required supplementary information in accordance with auditing standards generally accepted in the United States of America, which consisted of inquiries of management about the methods of preparing the information and comparing the information for consistency with management’s responses to our inquiries, the basic financial statements, and other knowledge we obtained during our audit of the basic financial statements. We do not express an opinion or provide any assurance on the information because the limited procedures do not provide us with sufficient evidence to express an opinion or provide any assurance.

Page | 9
Supplementary and Other Information Our audit was conducted for the purpose of forming an opinion on the financial statements that collectively comprise the College’s basic financial statements as a whole. The College Success Stories, Letter from the President, Board of Trustees and Administrative Officers and Photographs are presented for purposes of additional analysis and are not a required part of the basic financial statements. Such information has not been subjected to the auditing procedures applied in the audit of the basic financial statements and, accordingly, we do not express an opinion or provide any assurance on it.
OTHER REPORTING REQUIRED BY GOVERNMENT AUDITING STANDARDS
In accordance with Government Auditing Standards, we have also issued our report dated January 31, 2017 on our consideration of the College’s internal control over financial reporting and on our tests of its compliance with certain provisions of laws, regulations, contracts and grant agreements and other matters. The purpose of that report is to describe the scope of our testing of internal control over financial reporting and compliance and the results of that testing, and not to provide an opinion on internal control over financial reporting or on compliance. That report is an integral part of an audit performed in accordance with Government Auditing Standards in considering the College’s internal control over financial reporting and compliance.
Pat McCarthy
State Auditor
Olympia, WA
January 31, 2017

Management’s Discussion and Analysis
Centralia College 2016 Financial Report Page | 10
Centralia College
The objective of this Management Discussion and Analysis (MD&A) is to help readers of Centralia College’s financial statements better understand the financial position and operating activities for the year ended June 30, 2016 with comparative information for the year ended June 30, 2015. This discussion has been prepared by management and should be read in conjunction with the financial statements and accompanying notes which follow this section. Unless otherwise stated, all years refer to the fiscal year ended June 30th.
The Centralia College financial report communicates financial information for Centralia College and its’ discretely presented component unit, the Centralia College Foundation. The College is an agency of the State of Washington, and the financial information contained in this report is included in the State of Washington’s Comprehensive Annual Financial Report (CAFR) for 2016.
Reporting Entity
Centralia College is one of 34 public institutions of higher education in the State of Washington overseen by the State Board for Community and Technical Colleges (SBCTC). The College is governed by a Board of five Trustees, which has broad responsibilities to supervise, coordinate, manage and regulate the College as provided by state law. Trustees are appointed by the Governor for a term of five years, with consent of the Senate.
The College offers associate degrees and certificates in a variety of programs, and two baccalaureate degrees in Applied Science.
The College is the oldest continuously operating two-year public college in the State of Washington, was established in 1925 and currently averages approximately 3,800 full-time and part-time students per academic quarter. The College’s main campus is located in Centralia, and serves Lewis and south Thurston counties with a population of over 75,000, and has a satellite campus in Morton.
Using the Financial Statements
The College reports as a special purpose government, engaged in business-type activities as defined by Governmental Accounting Standards Board (GASB) Statement No. 35, Basic Financial Statements – Management’s Discussion and Analysis – for Public Colleges and Universities, as amended. Under this model, the financial report includes three financial statements, the Statement of Net Position, the Statement of Revenues, Expenses and Changes in Net Position and the Statement of Cash Flows. These financial statements have been prepared in accordance with accounting principles generally accepted in the United States of America. The Governmental Accounting Standards Board (GASB) is the accepted accounting standard setting body for establishing governmental accounting and financial reporting principles.
GASB Statement No. 39, Determining Whether Certain Organizations are Component Units requires a college to report an organization that raises and holds economic resources for the direct benefit of a government unit. Under this requirement, the Centralia College Foundation is a component unit of the College and their financial statements are discretely presented into this financial report.
The College’s Financial Position The statement of net position provides information about the College’s financial position at the end of the year. It displays all of the College’s assets, deferred outflows, liabilities and deferred inflows. The difference between assets, deferred outflows, liabilities and deferred inflows is net position.

Management’s Discussion and Analysis
Centralia College 2016 Financial Report Page | 11
A condensed comparison of the Statements of Net Position as of June 30, 2016 and 2015, follows:
Condensed Statements of Net Position As of June 30 (dollars in thousands) 2016 2015 ASSETS Current assets $ 15,489 $ 17,841
Capital assets 64,785 51,454
Other non-current assets 6,509 2,158
Total assets 86,783 71,453 DEFERRED OUTFLOWS 800 493 LIABILITIES
Current liabilities 4,704 1,895
Other non-current liabilities 5,923 5,043
Total liabilities 10,627 6,938 DEFERRED INFLOWS 673 1,431 NET POSITION $ 76,283 $ 63,577
Current assets consist of cash, accounts receivable and inventories. The $2.4 million decrease from 2015 to 2016 was the result of several items, 1) cash decreased $6.4 million mainly due to the purchase of a net of $5 million of investments in U.S. Government sponsored enterprise bonds, of which $1 million is classified as current investments and $4 million as non-current. This was the result of a strategic decision to improve investment income as continued historically low interest rates put a damper of investment income options, 2) a $2.1 million increase in Due from State Treasurer, from monies owed the College for capital appropriations for spending on the TransAlta Commons Project, and 3) a $1 million increase in accounts receivable associated with grants and contracts receivable most of this increase is due to increased billings on the $10 million U.S. Department of Labor WISE grant, in addition to increased billing to the Washington State Department of Early Learning ECEAP grant. ECEAP is a state grant similar to the Federal Head Start program.
Capital assets increased by a net of $13.3 million in 2016, the result of continued construction of the TransAlta Commons Project, a $40 million project that is scheduled for completion in February 2017. The college recorded $1.6 million in depreciation expense in 2016 on its capital assets. More information on the College’s capital assets can be found in footnote 7 to the financial statements.
Non-current assets increased by $4.3 million in 2016, of which $4 million is associated with the investment in bonds are discussed above and in Note 5 and the remaining $300,000 from restricted cash and cash equivalents, as fees collected in 2016 from students for their portion of funding for the TransAlta College Commons Project were unspent.
Deferred outflows for 2016 increased as a result of 1) legislatively required increases to employer contributions to state administered pension plans in 2016 and 2) changes in expected versus actual experience in the PERS 2/3 pension plan.
Current liabilities include accounts payable, accrued payroll and associated liabilities and unearned revenues. The significant increase in current liabilities for 2016 was the result of increased contractor activity and billings for construction of the TransAlta Commons Project, and reimbursement of sub recipients for spending on the $10 million U.S. Department of Labor WISE grant. Other non-current liabilities are made up of pension liabilities, vacation and sick leave balances, for which the College’s net pension liability increased by $750,000 in 2016 as the result of tepid investment returns on pension plan assets, with the resulting offset impacting deferred outflows in 2016 also.

Management’s Discussion and Analysis
Centralia College 2016 Financial Report Page | 12
To illustrate, the returns on pension plans investments went from an average of 17.02% down to 4.54% from 2014 to 2015. The College has no long-term debt, see Note 8 to the financial statements for information on other long-term liabilities.
Net position represents the difference between the College’s assets plus deferred outflows, less liabilities and deferred inflows, and measures whether the financial condition has improved or worsened during the year. The College reports its net position in three categories:
Investment in capital assets – The College’s total investment in property, plant and equipment, net of accumulated depreciation and any outstanding debt attached to its capital assets, though the College had no debt related to its capital assets in 2016 or 2015. To the extent of restricted cash and cash equivalents for capital projects collected, but not yet spent, these amounts are not included as a component of capital assets, instead are included as a component of restricted net position, expendable described below.
Restricted net position, expendable – Includes resources in which the College is legally or contractually obligated to spend in accordance with restrictions placed by the donor or external parties.
Unrestricted net position – These represent all the other resources available to the College for general and educational obligations to meet expenses for any lawful purpose. Unrestricted net positon is not subject to externally imposed stipulations, however the College has designated the majority of the unrestricted net position for various academic and support functions.
Condensed Net Position As of June 30 (dollars in thousands) 2016 2015 Investment in capital assets $ 64,785 $ 51,454 Restricted expendable 3,344 2,717 Unrestricted 8,154 9,406 Total Net Position $ 76,283 $ 63,577
Several factors are involved in the increase in overall net positon, the net increase of $13.3 million for investment in capital assets, after depreciation expense of $1.6 million, was the primary reason for the increased net position. The increase of restricted expendable is due to the increase in fees collected from students in 2016, who are funding a portion of the TransAlta project through the assessment of a dedicated fee. The $1.25 million decrease in unrestricted net position was the result of, 1) the settlement of Moore vs. Healthcare Authority in the amount of $383,000, 2) increased employer health insurance premiums totaling $600,000 in 2016, 3) continued challenges in student enrollment and 4) employee pay raises of 3% in 2016. A conservative measure of unrestricted net position is to have at least 60 to 90 days to cover operating expenses, the College has unrestricted net position at June 30, 2016 to cover operating expenses for 85 days.
Statements of Revenues, Expenses and Changes in Net Position The Statement of Revenues, Expenses, and Changes in Net Position provides information about the details of the changes in the net position of the College. The statement classifies revenues and expenses as either operating or non-operating. Generally, operating revenues are revenues that are earned by the College in exchange for providing goods or services. Operating expenses are defined as expenses incurred in the normal operation of the College, including a provision for the depreciation of property and equipment assets. The difference between the operating revenues and operating expenses, will always result in an operating loss since the College’s state operating appropriations, and Federal Pell grant revenues are shown as non-operating revenues as required by the GASB.

Management’s Discussion and Analysis
Centralia College 2016 Financial Report Page | 13
A summary of the College’s Statements of Revenue, Expenses and Changes in Net Position for the years ended June 30, 2016 and 2015, follows:
Condensed Statements of Revenues, Expenses and Changes in Net Position For the years ended June 30 (dollars in thousands) 2016 2015
Operating revenues $ 20,133 $ 16,972
Operating expenses 36,504 31,644
Net operating loss (16,371) (14,672)
Non-operating revenues 16,044 15,269
Non-operating expenses 779 819
Loss before capital appropriations (1,106) (222)
Capital appropriations 13,812 2,648
Increase in net position 12,706 2,426
Net position, beginning of year 63,577 61,151
Net position, end of year $ 76,283 $ 63,577
Operating and Non-Operating Revenues
State operating appropriations, tuition and fees (net of scholarship discounts and allowances), and grants and contracts, are the primary sources for funding the College’s academic programs.
The following table shows a comparison of operating and non-operating revenues for years ended June 30, 2016 and 2015:
Revenues by Source For the years ended June 30 (dollars in thousands) 2016 2015 Operating Student tuition and fees, net $ 3,957 $ 3,992
Grants & contracts 14,910 11,652
Auxiliary enterprise sales, net 1,243 1,144
Other revenues 23 184 Non-operating State operating appropriations 12,059 10,912
Capital appropriations 13,812 2,648
Grants & contracts 3,930 4,340
Other revenues 55 17
Total revenues $ 49,989 $ 34,889
State capital appropriations were up by more than $11 million in 2016 because of construction activity on the $40 million TransAlta Commons project. Non-Pell Federal grant revenues increased by $2 million as the result of increased activity on the U.S. Department of Labor WISE grant, a multi-year grant in the amount of $10 million. State grants and contracts revenue were up by $1 million, mainly due to an increase in the number of slots in 2016 to serve preschool children for the state’s ECEAP program. There was also a general increase in the states operating appropriation in 2016 of $1 million.

Management’s Discussion and Analysis
Centralia College 2016 Financial Report Page | 14
The following illustration showing revenue by source, both operating and non-operating used to fund the College’s programs for the year ended June 30, 2016, in percentage terms.
Operating Expenses
Operating expenses for 2016 increased by $4.9 million over 2015. Several factors were involved in this increase, 1) increased spending of $2 million on the Federal Department of Labor grant, reported in the category of supplies, materials and services. There was also a corresponding increase in this Federal revenue in 2016 discussed above, 2) salaries and wages were up by $1 million in 2016 as state employees received a 3% pay increase, and 3) employee benefits expense also increased by $1 million in 2016, the result of increased employer health insurance premiums, and the settlement of a lawsuit brought on behalf of part-time and seasonal state employees who sued the State because the denial of healthcare benefits, for which the College’s portion of the settle was about $383,000. The College has non-operating expenses, comprised solely of tuition remittances, which has been consistently around $800,000 for each of the last two years. Operating expenses, for 2016 and 2015 are noted below, by natural classification, followed by a bar chart that shows the comparative percentages:
Operating Expenses For the years ended June 30 (dollars in thousands) 2016 2015
Salaries and wages $ 16,708 $ 15,651
Supplies, materials and services 6,426 4,463
Employee benefits 5,560 4,515
Scholarships, fellowships and other aid 4,527 4,112
Depreciation 1,636 1,577
Other 891 659
Utilities 756 667
Total operating expenses $ 36,504 $ 31,644
Grants & contracts, 37.7%
Auxiliary enterprise sales, 2.5%
Student tuition and fees, net, 7.9%
State operating appropriations, 24.1%Other revenues, 0.2%
Capital appropriations, 27.6%
2016 Revenues by Source

Management’s Discussion and Analysis
Centralia College 2016 Financial Report Page | 15
Salaries and wages, supplies materials and services, benefits are the major support cost for the College’s programs, followed by scholarships, fellowships and other aid.
The following chart shows functional reporting of expenses, in percentage terms, for 2016 and 2015.
0.0%
10.0%
20.0%
30.0%
40.0%
50.0%
60.0%
Salaries and wages Employee benefits Supplies, materialsand services
Scholarships,fellowships and
other aid
Depreciation Utilities Other
Operating Expense Comparison, by Natural Classification
2016 2015
0.0%
5.0%
10.0%
15.0%
20.0%
25.0%
30.0%
35.0%
Instruction Academicsupport
Student services Scholarship,fellowships and
other aid
Institutionalsupport
Operation andmaintenance
Auxiliaryenterprises
Depreciation
Operating Expense Comparison, by Function
2016 2015

Management’s Discussion and Analysis
Centralia College 2016 Financial Report Page | 16
Capital Improvements The College spent $15 million for capital related purposes in 2016, primarily for the construction of the TransAlta Commons Project. With a total cost of $40 million and construction completion estimated in February 2017, the 70,000 square foot building will replace the student services building, provide facilities for Financial Aid, Enrollment Services, Student Programs, cashiering, bookstore, cafeteria, and classrooms.
TransAlta Commons Project nearing completion
Financial Summary and Economic Factors That Will Affect the Future The economy in Washington State continues to experience slightly stronger growth compared to the national economy, though things are contentious at best. Forecasted economic growth is projected to decline from a real growth in GDP of 2.5% in 2017 to slightly more than 2% in 2019. Consumers drive much of the economic activity, both nationally and in the state. This in turn has a direct impact on the state’s tax revenue collections. Important aspects that have helped increase tax collections are continued increases in new housing permits new vehicle sales, stronger than expected job growth and moderate wage growth. Factors that are adversely affecting economic conditions are slowing exports to the state’s major trading partners in part caused by a stronger dollar, volatile oil prices, which are expected to continue to rise in 2017, putting a dent in consumer’s disposable income, flatten personal income growth, along with continued high levels of involuntary part-time employment.
While enrollment levels have been declining over the last several years, there is optimism that enrollment may have turned the corner and is on the upswing, as preliminary enrollment figures for Fall quarter 2016 show a 2.5% increase from the previous year, though still well below the 2014 levels.

Management’s Discussion and Analysis
Centralia College 2016 Financial Report Page | 17
While the College continues to exercise fiscal caution in its overall spending and budgeting, a modified funding allocation process implemented by the SBCTC and the State’s court-ordered priority to fully fund K-12 education are potentially adverse factors on the state operating appropriations to the College. Also, as the College nears the completion of the $40 million TransAlta project, state capital funding for the college is expected to decrease dramatically in the coming 2017-19 biennium.
2016-2017 Student Government
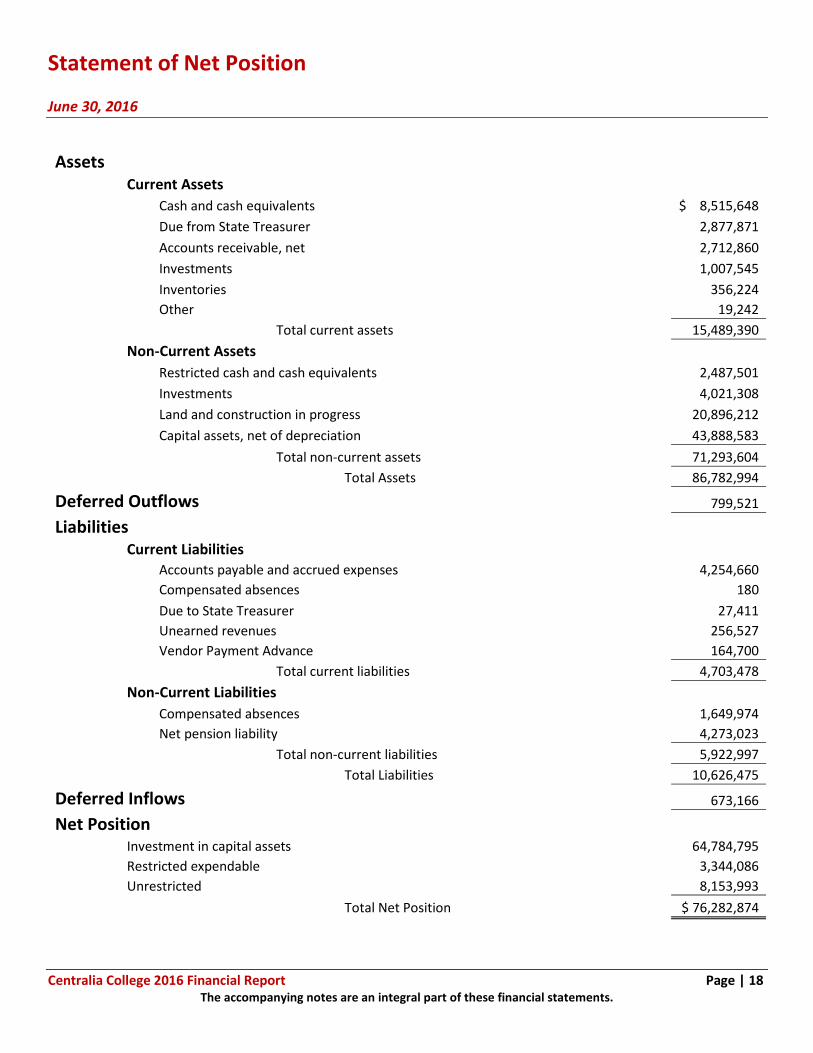
Statement of Net Position June 30, 2016
Centralia College 2016 Financial Report Page | 18 The accompanying notes are an integral part of these financial statements.
Assets Current Assets Cash and cash equivalents $ 8,515,648
Due from State Treasurer 2,877,871
Accounts receivable, net 2,712,860
Investments 1,007,545
Inventories 356,224
Other 19,242
Total current assets 15,489,390
Non-Current Assets Restricted cash and cash equivalents 2,487,501
Investments 4,021,308
Land and construction in progress 20,896,212
Capital assets, net of depreciation 43,888,583
Total non-current assets 71,293,604
Total Assets 86,782,994
Deferred Outflows 799,521
Liabilities Current Liabilities Accounts payable and accrued expenses 4,254,660
Compensated absences 180
Due to State Treasurer 27,411
Unearned revenues 256,527
Vendor Payment Advance 164,700
Total current liabilities 4,703,478
Non-Current Liabilities Compensated absences 1,649,974
Net pension liability 4,273,023
Total non-current liabilities 5,922,997
Total Liabilities 10,626,475
Deferred Inflows 673,166
Net Position Investment in capital assets 64,784,795
Restricted expendable 3,344,086
Unrestricted 8,153,993
Total Net Position $ 76,282,874
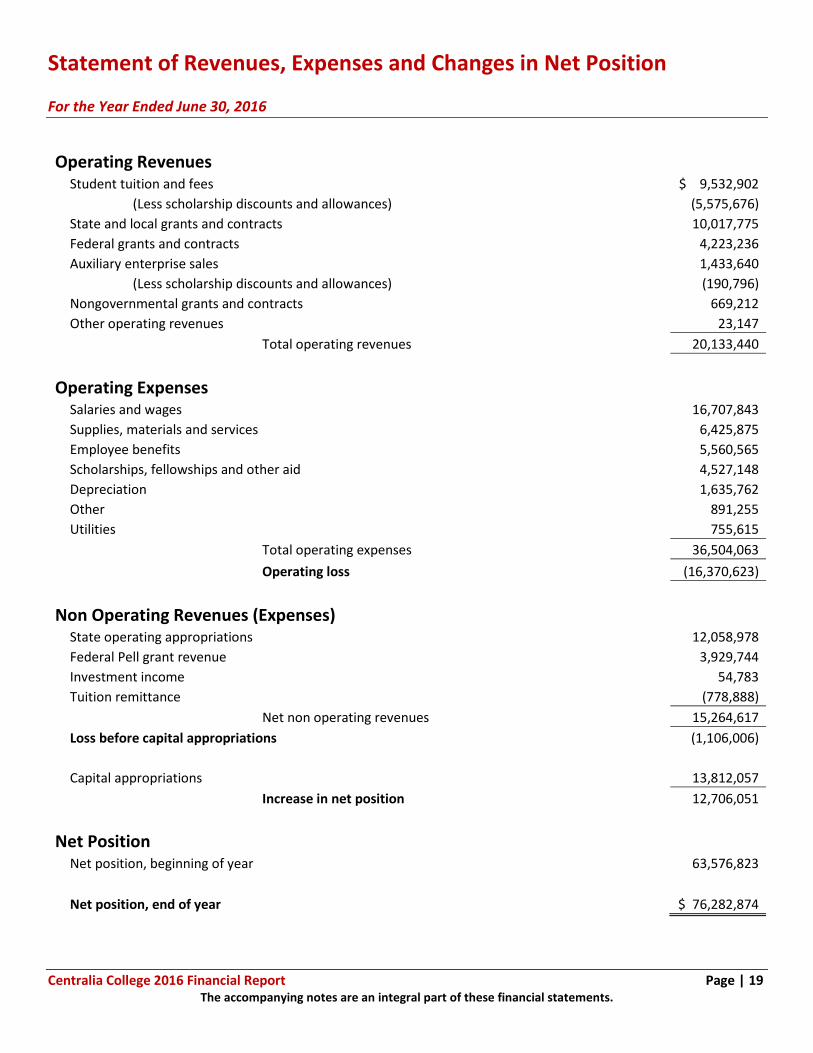
Statement of Revenues, Expenses and Changes in Net Position For the Year Ended June 30, 2016
Centralia College 2016 Financial Report Page | 19 The accompanying notes are an integral part of these financial statements.
Operating Revenues Student tuition and fees $ 9,532,902
(Less scholarship discounts and allowances) (5,575,676)
State and local grants and contracts 10,017,775
Federal grants and contracts 4,223,236
Auxiliary enterprise sales 1,433,640
(Less scholarship discounts and allowances) (190,796)
Nongovernmental grants and contracts 669,212
Other operating revenues 23,147
Total operating revenues 20,133,440
Operating Expenses Salaries and wages 16,707,843
Supplies, materials and services 6,425,875
Employee benefits 5,560,565
Scholarships, fellowships and other aid 4,527,148
Depreciation 1,635,762
Other 891,255
Utilities 755,615
Total operating expenses 36,504,063
Operating loss (16,370,623)
Non Operating Revenues (Expenses) State operating appropriations 12,058,978
Federal Pell grant revenue 3,929,744
Investment income 54,783
Tuition remittance (778,888)
Net non operating revenues 15,264,617
Loss before capital appropriations (1,106,006)
Capital appropriations 13,812,057
Increase in net position 12,706,051
Net Position Net position, beginning of year 63,576,823
Net position, end of year $ 76,282,874

Statement of Cash Flows continued For the Year Ended June 30, 2016
Centralia College 2016 Financial Report Page | 20 The accompanying notes are an integral part of these financial statements.
Cash Flows From Operating Activities Student tuition and fees, net $ 3,468,845
Grants and contracts 14,404,569
Auxiliary enterprise sales, net 1,229,002
Other revenues 23,147
Payments for employees (22,452,357)
Payments to vendors (5,203,595)
Payments for scholarships and fellowship (4,527,148)
Agency fund receipts 49,774
Agency fund disbursements (55,432)
Net cash used by operating activities (13,063,195)
Cash Flows From Noncapital Financing Activities
State appropriations 11,500,422
Federal Pell grant receipts 3,929,744
Tuition remittance to the State (764,231)
Net cash provided by noncapital financing activities 14,665,935
Cash Flows From Capital Related Financing Activities
Capital appropriations 12,240,427
Purchase of capital assets (14,966,504)
Net cash used by capital related financing activities (2,726,077)
Cash Flows From Investing Activities
Purchase of investments (6,032,528)
Sales and maturities of investments 1,000,000
Investment income 58,458
Net cash used by investing activities (4,974,070)
Decrease in Cash and Cash Equivalents (6,097,407)
Cash and Cash Equivalents, Beginning of Year 17,100,556
Cash and Cash Equivalents, End of Year $ 11,003,149

Statement of Cash Flows For the Year Ended June 30, 2016
Centralia College 2016 Financial Report Page | 21 The accompanying notes are an integral part of these financial statements.
Reconciliation of Operating Loss to Net Cash
used by Operating Activities Operating Loss $ (16,370,623)
Adjustments to reconcile operating loss to net cash used by operating activities Depreciation expense 1,635,762
Changes in assets, liabilities and deferrals Accounts receivable (980,950)
Inventories 43,244
Compensated absences 112,168
Accounts payable and accrued expenses 2,820,248
Net pension liability 768,176
Deferred resources (1,064,293)
Other assets 5,464
Unearned revenues (32,391)
Net cash used by operating activities $ (13,063,195)
Supplemental Non Cash Activities Information: Change in Due from State Treasurer (Capital related) $ 1,571,630
Change in Due from State Treasurer (Noncapital related) 563,956
Change in Due to State Treasurer (Noncapital related) 14,637
$ 2,150,223
Volunteer Income Tax Assistance (VITA) program led by
College Accounting Professor Otto Rabe IV with students
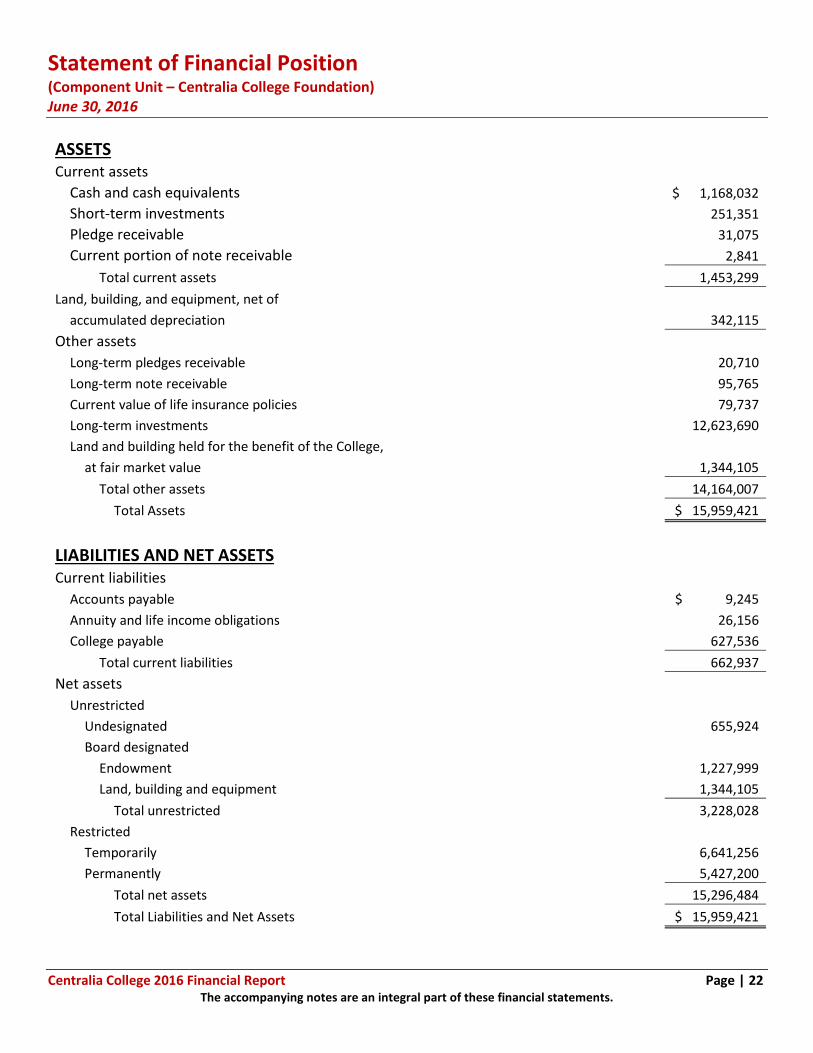
Statement of Financial Position (Component Unit – Centralia College Foundation) June 30, 2016
Centralia College 2016 Financial Report Page | 22 The accompanying notes are an integral part of these financial statements.
ASSETS Current assets Cash and cash equivalents $ 1,168,032
Short-term investments 251,351
Pledge receivable 31,075
Current portion of note receivable 2,841
Total current assets 1,453,299 Land, building, and equipment, net of accumulated depreciation 342,115 Other assets Long-term pledges receivable 20,710
Long-term note receivable 95,765
Current value of life insurance policies 79,737
Long-term investments 12,623,690
Land and building held for the benefit of the College, at fair market value 1,344,105
Total other assets 14,164,007
Total Assets $ 15,959,421
LIABILITIES AND NET ASSETS Current liabilities Accounts payable $ 9,245
Annuity and life income obligations 26,156
College payable 627,536
Total current liabilities 662,937 Net assets Unrestricted Undesignated 655,924
Board designated Endowment 1,227,999
Land, building and equipment 1,344,105
Total unrestricted 3,228,028
Restricted Temporarily 6,641,256
Permanently 5,427,200
Total net assets 15,296,484
Total Liabilities and Net Assets $ 15,959,421

Statement of Activities and Changes in Net Assets (Component Unit – Centralia College Foundation) Year Ended June 30, 2016
Centralia College 2016 Financial Report Page | 23 The accompanying notes are an integral part of these financial statements.
Temporarily Permanently Unrestricted Restricted Restricted Total Revenues, gains, and other support Contributions $ 215,694 $ 177,804 $ 89,162 $ 482,660 Interest income 114,437 197,245 - 311,682 Dividend income 43,958 2,520 - 46,478 Rental revenue 24,000 - - 24,000 Other income 3,912 1,195 - 5,107 Net assets released from restriction 357,754 (357,754) - - Total revenues, gains, and other support 759,755 21,010 89,162 869,927 Expenses Program 491,339 - - 491,339 Management and general 283,142 - - 283,142 Fundraising 26,875 - - 26,875 Total expenses 801,356 - - 801,356 Excess of revenues over expenses before realized and unrealized gains and (losses) on investments (41,601) 21,010 89,162 68,571 Unrealized and realized (losses) on investments (98,172) (140,729) - (238,901) Change in net assets (139,773) (119,719) 89,162 (170,330) Net assets, beginning of year 3,346,913 6,780,283 5,339,618 15,466,814 Reclassifications 20,888 (19,308) (1,580) - Net assets, end of year $ 3,228,028 $ 6,641,256 $ 5,427,200 $ 15,296,484

Statement of Cash Flows (Component Unit – Centralia College Foundation) Year Ended June 30, 2016
Centralia College 2016 Financial Report Page | 24 The accompanying notes are an integral part of these financial statements.
Cash Flows From Operating Activities Cash received from contributors and renters $ 518,530
Interest, dividends and realized gains 606,380
Cash used in management, program and fundraising (667,051)
Net cash provided by operating activities 457,859
Cash Flows From Investing Activities Purchase of assets (13,408)
Mortgage loan receipt 2,744
Proceeds from sale of securities 3,347,076
Purchase of securities (3,823,406)
Net cash used in investing activities (486,994)
Decrease in Cash (29,135)
Cash, Beginning of Year 1,197,167
Cash, End of Year $ 1,168,032
Reconciliation of Change in Net Assets to Net Cash
Provided by Operating Activities Change in Net Assets $ (170,330)
Adjustments to reconcile change in net assets to cash provided by operating activities Depreciation expense 15,882
Unrealized gain on property 16,405
Decrease in pledges receivable (25,980)
Increase in cash value of life insurance 2,312
Donated stock received (8,628)
Unrealized loss on investments 509,775
Increase in accounts payable 4,527 Decrease in annuity and life income obligations (5,242)
Increase in College payables 119,138
Net cash provided by operating activities $ 457,859

Notes to the Financial Statements June 30, 2016
Centralia College 2016 Financial Report Page | 25
Note 1. Summary of Significant Accounting Policies
Financial Reporting Entity
Centralia College (“College”) is a comprehensive community college offering open-door academic transfers, workforce education and basic skill programs as well as community service and continuing education courses. The College confers applied baccalaureate degrees, associate degrees, certificates and high school diplomas. The College is an agency of the State of Washington, and is governed by a five-member Board of Trustees appointed by the Governor with consent by the state Senate.
The financial activity of the College are included in the State’s Comprehensive Annual Financial Report.
Financial Statement Presentation
The financial statements of the College as of, and for the year ending June 30, 2016 have been prepared in conformity with generally accepted accounting principles (GAAP). The Governmental Accounting Standards Board (GASB) is the accepted accounting standard setting body for establishing governmental accounting and financial reporting principles. These financial statements have been prepared in accordance with GASB Statement No. 35, Basic Financial Statements and Management Discussion and Analysis for Public Colleges and Universities, and GASB Statements No. 37 and No. 38.
The Governmental Accounting Standards Board (GASB) issued Statement No. 39, Determining Whether Certain Organizations are Component Units, which amended GASB Statement No. 14, The Financial Reporting Entity. This provides additional guidance to determine whether certain organizations are component units for which the primary government is not financially accountable but should be reported based on the nature and significance of their relationship with the primary government.
Under GASB Statement No. 39 criteria, the Centralia College Foundation (“Foundation”) is considered a legally separate component unit of the College, and its financial statements are discretely presented in the College’s financial statements. Inter-entity transactions and balances between the College and Foundation are not eliminated for financial statement presentation purposes.
The Foundation is a private nonprofit organization that reports under the Financial Accounting Standards Board (FASB) Accounting Standards Codification (ASC) Topic 958 and as such, certain revenue recognition criteria and presentation features are different from GASB revenue recognition criteria and presentation features. No modifications have been made to the Foundation’s financial information in the College’s financial reporting entity for these differences.
New Accounting Pronouncements, Effective July 1, 2015
The Governmental Accounting Standards Board (GASB) issued Statement No. 72, Fair Value Measurement and Application, effective for the year ended June 30, 2016.
This Statement addresses accounting and financial reporting issues related to fair value measurements. The definition of fair value is the price that would be received to sell an asset or paid to transfer a liability in an orderly transaction between market participants at the measurement date. This Statement provides guidance for determining a fair value measurement for financial reporting purposes. This Statement also provides guidance for applying fair value to certain investments and disclosures related to all fair value measurements.
The effect of Statement No. 72 to the College requires investments be measured at fair value and is addressed in Note 5 to the financial statements.
The Governmental Accounting Standards Board (GASB) issued Statement No. 76, The Hierarchy of Generally Accepted Accounting Principles for State and Local Governments, effective for the year ended June 30, 2016.

Notes to the Financial Statements June 30, 2016
Centralia College 2016 Financial Report Page | 26
The requirements of this Statement reduces GAAP hierarchy to two categories of authoritative GAAP and addresses the use of authoritative and nonauthoritative literature in the event that the accounting treatment for a transaction or other event is not specified within a source of authoritative GAAP. This Statement supersedes Statement No. 55, The Hierarchy of Generally Accepted Accounting Principles for State and Local Governments. The first category of authoritative GAAP consists of GASB Statements of the Government Accounting Standards Board. The second category comprises GASB Technical Bulletins and Implementation Guides, as well as guidance from the American Institute of Certified Public Accountants that is cleared by the GASB.
The College has evaluated the effect of this Statement on financial reporting and has incorporated it into the College’s financial reporting control process.
The Governmental Accounting Standards Board (GASB) issued Statement No. 79, Certain External Investment Pools and Pool Participants, effective for the year ended June 30, 2016.
This Statement addresses accounting and financial reporting for certain external investment pools and pool participants. Specifically, it establishes criteria for an external investment pool to qualify for making the election to measure all its investments at amortized costs for financial reporting purposes.
The College is a participant in the state of Washington, Local Government Investment Pool (LGIP), administered by the Washington State Treasurer, and the requirements of this statement is addressed in Note 3 to the financial statements.
Basis of Accounting
For financial reporting purposes, the College is considered a special purpose government entity engaged in business type activities. Accordingly, the College’s financial statements have been presented using the economic resources measurement focus and the accrual basis of accounting. Under the accrual basis of accounting, revenues are recognized when earned and expenses are recorded when an obligation has been incurred. Grants and similar items are recognized as revenue as soon as all the eligibility requirements imposed by the provider have been met.
The College reports capital assets, net of accumulated depreciation in the Statement of Net Position, and reports depreciation expense in the Statement of Revenues, Expenses and Changes in Net Position.
Cash and Cash Equivalents
For the purposes of the statement of cash flows, the College considers all highly liquid investments with an original maturity date of 90 days or less to be cash equivalents. Funds invested through the State Treasurer’s Local Government Investment Pool are also considered cash equivalents. Cash and cash equivalents that are held with the intent to fund capital projects are classified as non-current assets.
Inventories
Inventories consist of merchandise held by auxiliary departments. Inventories are valued at cost, using the First-in First-out (FIFO) valuation method.
Accounts Receivable
Accounts receivable consists of student tuition and fees and other charges for services provided to students, faculty and staff. Accounts receivable also includes amounts due from federal, state and local governments or private sources in connection with reimbursements of allowable expenses made in accordance with sponsored agreements, and includes a provision of an amount estimated by management deemed as uncollectible.

Notes to the Financial Statements June 30, 2016
Centralia College 2016 Financial Report Page | 27
Capital Assets
Land, buildings, equipment, and library resources are stated at cost or, if acquired by gift, at fair market value at the date of the gift. Additions, replacements, major repairs and renovations are also capitalized.
The capitalization threshold is $5,000 or greater for equipment and library resources, $100,000 or greater for infrastructure, buildings and improvements other than buildings, and $1 million for intangibles. Land is capitalized regardless of cost.
Depreciation is computed using the straight-line method over the estimated useful lives of the assets, generally 3 to 7 years for equipment; 15 to 50 years for buildings and 20 to 50 years for infrastructure and improvements other than buildings.
Investments
Investments are comprised of U.S. Government sponsored enterprise bonds, with laddered maturities ranging from six months up to 42 months. When investments are purchased, a discount or premium will also be factored into the purchase price, depending on the stated or face rate of the bond, versus the market interest rate at the time of the bond purchase. Bond premiums and discounts are amortized over the life of the bond using the straight-line method and reflected in the investment balances in the statement of net position. In addition, when an investment is purchased between its semi-annual interest payment dates, the purchase price will also include the number of days of accrued interest from the date the bond is purchased and when the last bond’s last interest payment occurred. The purchase of interest is realized when the bond makes its’ next semi-annual interest payment.
Unearned Revenue
Unearned revenue occurs when funds have been collected in advance of an event, such as summer quarter tuition revenue, and unspent cash advances on certain grants.
Compensated Absences
College employees accrue annual leave at rates based on employment status and length of service and sick leave at the rate of one day (8 hours) per month for full-time employees with both recorded as liabilities. Employees are entitled to either 25% of the present value of his/her unused sick leave balance on retirement or 25% of his/her net accumulation for the year in which it exceeds 480 hours.
Scholarship Discounts and Allowances
Student tuition and fee revenue, and auxiliary revenues received from students are reported net of scholarship discounts and allowances in the Statement of Revenues, Expenses and Changes in Net Position. Scholarship discounts and allowances are the difference between the stated charges for goods and services charged by the College, and the amount that is paid by the students and/or third parties on the students’ behalf. Certain government grants, e.g. Federal Pell grant, State Need grant and other revenues are recorded as either operating or non-operating revenues from these programs in the College’s financial statement. To the extent that revenues from these programs are used to pay tuition, fees and other student charges, the College has recorded a scholarship discount and allowance.
State Appropriations
The state of Washington appropriates funds to the College on both an annual and biennial basis. These revenues are reported as non-operating revenues on the Statement of Revenues, Expenses and Changes in Net Position, and recognized as such when the related expenses are incurred.

Notes to the Financial Statements June 30, 2016
Centralia College 2016 Financial Report Page | 28
Use of Estimates
Allowances for uncollectible accounts are estimated based on aging and historical data on collection of various receivables. Actual results could differ from these estimates, though the College believes these allowances are adequate.
Operating Revenues and Expenses
Operating revenues consist of tuition and fees, grants and contracts, sales and services of educational activities and auxiliary enterprise revenues. Operating expenses include salaries, wages, fringe benefits, scholarships and fellowships, utilities, supplies, materials, purchased services and depreciation. All other revenues and expenses of the College are reported as non-operating revenues and expenses including state appropriations, Federal Pell grant revenues, investment income and tuition remittance.
Tuition Remittance
A portion of every tuition dollar collected by the College is remitted to the Washington State Treasurer to be held and appropriated in two different funds. The tuition remittance is used to fund 1) the Community and Technical College’s Capital Projects Fund “060” and 2) the Community and Technical College’s Innovation Fund “561”. Fund 060 is used to fund capital projects for the community and technical college system, while fund 561 is used to fund technological upgrades and enhancements to the community and technical college system. In 2016, the College collected $619,048 and $159,840 for funds 060 and 561, respectively, for a total of $778,888. These remittances are reported in the non-operating revenues and expenses section of the statements of revenues, expenses and changes in net positon.
Due to/from State Treasurer
Amounts due from the state treasurer are for reimbursements owed the College for spending on state operating and capital appropriations. Amounts due to state treasurer represent amounts owed for tuition remittance collected by the College, but not yet paid to the state treasurer.
Net Pension Liability
The College records an aggregate pension liability equal to the net pension liabilities for its pension plans. The net pension liability is measured as the College’s proportionate share of the total pension liabilities, less the amount of the pension plans’ fiduciary net positions.
Deferred Outflows/Deferred Inflows
Deferred outflows represent a consumption of net position by the College that is applicable to future reporting periods. Deferred inflows represent an acquisition of net position by the College that is applicable to future reporting periods.
Net Position
The College reports net position in the following three categories:
Investment in capital assets – The College’s total investment in property, plant and equipment, net of accumulated depreciation and any outstanding debt related to those capital assets. The College had no debt related to its capital assets in 2016. To the extent of restricted cash and cash equivalents for capital projects collected, but not yet spent, these amounts are not included as a component of capital assets, instead are included as a component of restricted net position, expendable described below.
Restricted net position, expendable – Includes resources in which the College is legally or contractually obligated to spend in accordance with restrictions placed by the donor or external parties.

Notes to the Financial Statements June 30, 2016
Centralia College 2016 Financial Report Page | 29
Unrestricted net position – These represent all the other resources available to the College for general and educational obligations to meet expenses for any lawful purpose. Unrestricted net positon is not subject to externally imposed stipulations, however the College has designated the majority of the unrestricted net position for various academic and support functions.
Tax Exemption
The College is a tax-exempt organization under Section 115(a) of the Internal Revenue Code and is exempt from federal income taxes on related income. The Foundation is exempt from income taxes under Section 501(c) (3) of the Internal Revenue Code.
Violations
The College does not have any material violations of finance-related legal or contractual provisions.
Note 2. Component Unit
The Centralia College Foundation (“Foundation”) is considered a legally separate component unit of the College and is discretely presented in the College’s financial statements. The Foundation reports information on its financial position and activities according to the following three classes of net assets:
Permanently restricted net assets – Net assets subject to donor-imposed stipulations they be maintained in perpetuity by the Foundation.
Temporarily restricted net assets – Net assets subject to donor-imposed stipulations that will be met either by actions of the Foundation or by passage of time.
Unrestricted net assets – Net assets not subject to donor-imposed stipulations, including certain amounts designated by the Board of Directors.
The Foundation’s financial statements can be obtained by contacting the Foundation at (360) 623-8668.
Note 3. Deposits
Deposits are comprised of cash and cash equivalents and includes bank demand deposits, money market accounts, petty cash held at the College and unit shares in the Local Government Investment Pool (LGIP), administered by the Washington State Treasurer.
Bank balances are insured through the Federal Deposit Insurance Corporation (FDIC), or by a collateral pool administered by the Washington Public Deposit Protection Commission (PDPC).
The LGIP measures its investments at amortized cost in accordance with guidance set forth by GASB, as amended by Statements No. 72 and No. 79, and the investments are limited to high quality obligations with limited and average maturities, which minimizes both credit and market risks. The College records its investment in the LGIP at the LGIP’s amortized cost-based net asset value per share, times the number of unit shares in the LGIP. The LGIP has a minimum transaction size, deposit or withdraw, of $5,000, and while there is not currently a maximum transaction size, the LGIP does request pool participants to provide them with at least a one day prior notice for deposits or withdrawals of $10 million or more. The LGIP participants are limited to one transaction per day.

Notes to the Financial Statements June 30, 2016
Centralia College 2016 Financial Report Page | 30
Deposits at year-end consists of the following:
June 30, 2016 Petty cash and change funds $ 4,200 Bank demand and time deposits 3,872,932 Local government investment pool 7,126,017
$ 11,003,149
Cash and cash equivalents includes restricted cash and cash equivalents of $2,487,501 at June 30, 2016. The majority of the restricted balances comes from the collection of student self-assessed fees for their contribution towards the construction of the TransAlta Commons Project.
Note 4. Accounts Receivable
Accounts receivable for 2016 consists of the following:
June 30, 2016 Federal, state, local and private grants $ 2,268,638 Student tuition and fees 461,689 Other operating activities 3,850
Subtotal 2,734,177 Allowance for uncollectibles (21,317)
$ 2,712,860
Note 5. Investments
There are several factors that affect the value of investments. GASB Statement No. 40 requires disclosure of College investments, through its investment policy, on how the College manages its exposure to risks, such as custodial credit risk, concentration (and quality) of credit risk, and interest rate risk. Custodial credit risk is the risk that in the event of the failure of the custodian, the investments may not be returned. All of the College’s securities are registered in the College’s name by the custodial bank. As a result, custodial credit risk for such investments is not applicable.
Concentration of credit risk is the risk associated with a lack of diversification, such as having substantial investments in a few individual issuers, thereby exposing the College to greater risks resulting from adverse economic, political, regulatory, geographic and credit developments. Fixed-income securities are subject to credit risk, which is the chance that a bond issuer will fail to pay interest or principal in a timely manner, or that negative perceptions of the issuer’s ability to make these payments will cause security prices to decline. Management believes that obligations of the U.S. government sponsored enterprise (GSE) bonds, such as Fannie Mae (FNMA), Federal Home Loan Bank, Federal Home Loan Mortgage Corporation and Federal Farm Credit Bank or those explicitly guaranteed by the U.S. government, are considered to have minimal concentrations of credit risk.
Interest rate risk is the risk that the value of fixed-income securities will decline because of changing interest rates. The prices of fixed-income securities with a longer time to maturity, measured by effective duration, tend to be more sensitive to changes in interest rates and, therefore, more volatile than those with shorter durations. The College manages its

Notes to the Financial Statements June 30, 2016
Centralia College 2016 Financial Report Page | 31
exposure to interest rate risk by limiting the duration of investment and structuring the maturity of investments to mature at various points in the year, with a maximum duration for fixed-income securities of 42 months from the time of purchase until maturity.
The College had no investments at June 30, 2015, but in 2016, purchased a net of $5 million in US Government sponsored enterprise bonds, with staggered maturities, in $500,000 amounts. The original maturities ranged from six months to 42 months. The College has assessed the effects of Statement No. 72 on its investments, and reports investments at fair value. Fair value is defined in the accounting standards as the price that would be received to sell an asset or paid to transfer a liability in an orderly transaction between market participants at the measurement date. Assets and liabilities reported at fair value are organized into a hierarchy based on the levels of inputs observable in the marketplace that are used to measure fair value. Inputs are used in applying the various valuation techniques and take into account the assumptions that market participants use to make valuation decisions. Inputs may include price information, credit data, liquidity statistics and other factors specific to the financial instrument. Observable inputs reflect market data obtained from independent sources. In contrast, unobservable inputs reflect the entity’s assumptions about how market participants would value the financial instrument.
A financial instruments level within the fair value hierarchy is based on the lowest level of any input that is significant to the fair value measurement. The following describes the hierarchy of inputs used to measure fair value and the primary valuation methodologies used for financial instruments measured at fair value on a recurring basis:
Level 1 – Prices based on unadjusted quoted prices in active markets that are accessible for identical assets or liabilities are classified as Level 1. Level 1 investments include equity securities and other publicly traded securities.
Level 2 – Quoted prices in markets that are not considered to be active, dealer quotations or alternative pricing sources for similar assets or liabilities for which all significant inputs are observable, either directly or indirectly, are classified as Level 2. Level 2 investments include fixed or variable-income securities, commingled funds, certain derivatives and other assets that are valued using market information.
Level 3 – Investments classified as Level 3 have significant unobservable inputs, as they trade infrequently or not at all. The inputs into the determination of fair value of these investments are based upon the best information in the circumstance and may require significant management judgment. Level 3 investments include private equity investments, real estate and split interest agreements.
The following table summarize the investments reported at fair value within the fair value hierarchy as of June 30, 2016:
Total Level 1 Level 2 Level 3 Fixed or variable income securities U.S. Government sponsored enterprises $ 5,028,853 $ - $ 5,028,853 $ -
The College’s investments in fixed-income securities at June 30, 2016, along with the credit quality and average duration, in years, is summarized as follows:
Investments Fair Value Duration U.S. GSE bonds $ 5,028,853 1.99

Notes to the Financial Statements June 30, 2016
Centralia College 2016 Financial Report Page | 32
Although bonds are issued with clearly defined maturities, an issuer may be able to redeem, or call, a bond earlier than its maturity date. The College must then replace the called bond with a bond that may have a lower yield than the original yield. The call feature causes the fair value to be highly sensitive to changes in interest rates. Bond maturities, not factoring in any call provision they may contain, mature over the next three and one-half years as follows:
Fair Value Investment Maturities (in months)
June 30, 2016 0-12 13-24 25-42 Investments - Operating Funds U.S. GSE bonds $ 5,028,853 $ 1,007,545 $ 1,500,324 $ 2,520,984
Note 6. Merchandise Inventories
Merchandise inventories for the College auxiliaries at year-end, stated at cost using the first-in, first-out (FIFO) method consists of the following:
June 30, 2016 Bookstore $ 356,224 Food Services -
$ 356,224
The College discontinued its internally-run food service operation at the end of 2016, and starting in 2017, contracted with an outside vendor to provide food service to College students, faculty and staff.
Note 7. Capital Assets
Capital asset activity for the year ended June 30, 2016 is summarized as follows:
June 30, 2015 Additions Retirements June 30, 2016
Non-depreciable Capital Assets Land $ 4,972,858 $ 636,190 $ - $ 5,609,048
Construction in progress 2,791,557 12,971,320 475,713 15,287,164
Total non-depreciable assets 7,764,415 13,607,510 475,713 20,896,212
Depreciable Capital Assets Buildings 62,508,362 1,364,369 - 63,872,731
Improvements other than buildings 900,327 240,144 - 1,140,471
Furniture, fixtures and equipment 3,684,390 216,743 1,319,307 2,581,826
Library resources 2,259,805 13,451 - 2,273,256
Total depreciable assets 69,352,884 1,834,707 1,319,307 69,868,284
Accumulated Depreciation Buildings 19,719,554 1,418,365 - 21,137,919
Improvements other than buildings 692,829 9,075 - 701,904
Furniture, fixtures and equipment 3,047,045 189,470 1,319,307 1,917,208
Library resources 2,203,818 18,852 - 2,222,670
Total accumulated depreciation 25,663,246 1,635,762 1,319,307 25,979,701
Capital Assets, Net of Depreciation $ 51,454,053 $ 13,806,455 $ 475,713 $ 64,784,795

Notes to the Financial Statements June 30, 2016
Centralia College 2016 Financial Report Page | 33
During 2016, the College converted to a new capital asset management system called “DirectLine”, which replaced the FAE system. As a run-up to this conversion, the College conducted a review of physical equipment inventory, which resulted in the write-off of $1.32 million of fully depreciated equipment assets. The College recorded depreciation expense of $1,635,762 for the year ending June 30, 2016.
Note 8. Long-Term Liabilities
The College has no debt outstanding at June 30, 2016. Long-term liabilities of the College are comprised entirely of compensated leave and pension plan liabilities. The following are the changes in long-term liabilities for the year ended June 30, 2016:
Balance Balance Current
June 30, 2015 Additions Reductions June 30, 2016 Portion
Sick leave $ 893,081 $ 284,287 $ 198,053 $ 979,315 $ -
Vacation leave 644,905 709,797 684,043 670,659 -
Compensatory leave - 234 54 180 180
Total leave liability 1,537,986 994,318 882,150 1,650,154 180
Net pension liability 3,504,847 1,312,966 544,790 4,273,023 -
Total long-term liabilities $ 5,042,833 $ 2,307,284 $ 1,426,940 $ 5,923,177 $ 180
At termination of employment, employees may receive a cash payment for all accumulated vacation and compensatory time. Employees who retire get 25% of the value of their accumulated sick leave credited to a Voluntary Employees’ Beneficiary Association (VEBA) account, which may be used for future medical expenses and insurance purposes. The sick leave liability is recorded as an actuarial estimate of one-fourth the total balance on the payroll records. Additional information on net pension liabilities can be found in Note 15 to these financial statements.
Note 9. Lease Obligations
The College leases copiers, printers and facilities under a variety of agreements and non-cancelable operating leases. At June 30, 2016, the future minimum payments under these lease agreements are as follows:
Year Lease Payment 2017 $ 68,804 2018 5,458 2019 3,909 2020 2,259 2021 977 Subtotal 81,407 Less present value (3,996)
Total $ 77,411
The College lease expense totaled $171,105 in 2016.

Notes to the Financial Statements June 30, 2016
Centralia College 2016 Financial Report Page | 34
Note 10. Risk Management
During the normal course of business, the College may become involved in various legal actions for which the outcome cannot be predicted. The College participates in the state’s insurance program and is indemnified and will be paid for claims from the self-insurance program. It is the opinion of management that it will not materially affect the financial statements, in addition, the College purchases insurance from the Washington State’s Department of Enterprise Services. These policies cover such areas as commercial property, athletics and medical malpractice liabilities. The College self-insures unemployment compensation for all employees, and is on a pay-as-you-go basis for paying unemployment compensation claims. Unemployment compensation claims paid totaled $20,689 for 2016.
In 2016, a settlement in the Moore vs. Health Care Authority (HCA) lawsuit was reached, with an estimated $32 million of the total liability allocated to the Community and Technical College System (System), for which the State Legislature appropriated approximately $19 million to fund the System’s portion of the liability, leaving the remaining $13 million liability to be paid collectively by the 34 community and technical colleges. The College’s portion of this $13 million liability is $383,405 and is reflected in these financial statements.
The HCA lawsuit stemmed from a denial of health care benefits to seasonal and part-time state employees, with the State’s Office of Financial Management (OFM) estimating in 2015 that total claims exceed $150 million. The SBCTC, the state’s oversight agency for the 34 community and technical colleges, is responsible for payment of this liability, with individual colleges paying their portions of the $13 million to the SBCTC, who in turn remitted the total payment on behalf of the System.
Note 11. Commitments
Goods and services for operating and capital projects, contracted for, but not yet received, are considered commitments at year-end. The College encumbers only operating items to be received through June 30, 2016, liquidating unused balances, whereas capital projects have commitments that continue into the next fiscal year. The amount of capital project commitments at June 30, 2016 is $17,768,973, of which $17,710,587 is associated with the TransAlta Commons Project.

Notes to the Financial Statements June 30, 2016
Centralia College 2016 Financial Report Page | 35
Note 12. Operating Expenses by Function
Operating expenses, by functional category, for the year ended June 30, 2016 is summarized as follows:
2016 Instruction $ 9,697,919 Academic support 6,787,105 Student services 5,381,470 Scholarship, fellowship and other aid 4,527,148 Institutional support 4,230,548 Auxiliary enterprises 2,128,719 Operation and maintenance 2,115,392 Depreciation 1,635,762
Total operating expenses $ 36,504,063
Instruction
Instruction includes expenses for all activities that are part the College’s instruction program. Expenses for credit and not credit courses; academic, vocational/technical instruction, and running start are included in this category. The College’s professional and continuing education programs are also included in this category.
Academic Support
Academic support includes expenses incurred to provide support services for the College’s primary mission of instruction. The activities of the College’s academic administration, libraries and information technology support are included in this category.
Student Services
The student services category includes the offices of registrar (enrollment), financial aid, advising and counseling and veteran services.
Scholarship, Fellowship and Other Aid
This category includes expenses for scholarship, fellowships and other financial aid not funded from existing college resources, and includes an offset to tuition revenues for scholarship discounts and allowances, which represents the difference between stated charged and the amount the student pays. Expenditures of amounts received from the Washington State Need Grant and Federal Pell Grant are also included in this category.
Institutional Support
Institutional support category includes central activities that manage long-range planning for the College, such as the office of the president, along with human resources, fiscal operations, and procurement, payroll, advancement and community relations.

Notes to the Financial Statements June 30, 2016
Centralia College 2016 Financial Report Page | 36
Auxiliary Enterprises
Auxiliary enterprises furnish goods and services to students, staff and the general public much like a for-profit business does, along with activities for student body organizations and student athletics. Operating as a self-supporting activity, the activities of the College’s Bookstore, Student Housing and Food Services are included in this category.
Operation and Maintenance
Operation and maintenance category includes administration, operation, maintenance, preservation and protection of the College’s physical plant.
Depreciation
Depreciation reflects a periodic expensing of the cost of capital assets such as building and equipment over their estimated useful lives.
Note 13. Deferred Compensation
The College, through the state of Washington, offers its employees a deferred compensation plan created under Internal Revenue Code Section 457. The plan, available to all state employees, permits individuals to defer a portion of their salary until future years. The state of Washington administers the plan on behalf of College employees. The deferred compensation is not available to employees until termination, retirement or unforeseen financial emergencies, and the College does not have access to these funds.
Note 14. Deferred Outflows and Deferred Inflows of Resources
The following represent the components of the College’s deferred outflows and inflows of resources for 2016:
Deferred Inflows (Outflows) 2016 PERS 1 PERS 2/3 TRS 1 TRS 2/3 Total Net difference between projected versus actual earnings on pension plan investments $ 126,222 $ 444,135 $ 33,521 $ 36,494 $ 640,372 Changes in proportionate share of pension liabilities - 32,794 - (35,779) (2,985) Difference between expected and actual experience - (172,076) - (13,587) (185,663) Changes in assumptions - (2,608) - (75) (2,683) Contributions to pension plans after measurement date (235,209) (268,418) (37,983) (33,786) (575,396)
Total $ (108,987) $ 33,827 $ (4,462) $ (46,733) $ (126,355)
The $575,396 reported as deferred outflows of resources for 2016 represent contributions the College made subsequent to the measurement date and will be recognized as a reduction of the net pension liability for the year ended June 30, 2017, and is detailed in the following table:
PERS 1 PERS 2/3 TRS 1 TRS 2/3 Total Deferred outflows $ 235,209 $ 268,418 $ 37,983 $ 33,786 $ 575,396

Notes to the Financial Statements June 30, 2016
Centralia College 2016 Financial Report Page | 37
Other amounts reported as deferred outflows and inflows of resources represent the sum of, 1) net difference between projected and actual earnings on pension plan investments, 2) changes in proportionate share of pension liabilities, 3) expected versus actual experience, and 4) changes in assumptions will be amortized over the next five years and recognized in pension expense as follows for each plan, followed by individual amortization schedules for, 1) net difference between projected and actual earnings on pension plan investments, 2) changes in proportionate share of pension liabilities, 3) differences between expected versus actual experience, and 4) changes in assumptions:
Net difference between projected and actual earnings on pension plan investments*: Year Ended June 30: PERS 1 PERS 2/3 TRS 1 TRS 2/3 Total
2017 $ 48,919 $ 173,389 $ 13,001 $ 14,288 $ 249,597 2018 48,919 173,389 13,001 14,288 249,597 2019 48,919 173,389 13,001 14,288 249,597 2020 (20,535) (76,032) (5,482) (6,370) (108,419) 2021 - - - - -
Total $ 126,222 $ 444,135 $ 33,521 $ 36,494 $ 640,372
*The recognition period is a closed, five-year period for all plans.

Notes to the Financial Statements June 30, 2016
Centralia College 2016 Financial Report Page | 38
Changes in proportionate liability: Recognition Period (Years)* 1.0 4.4 1.0 5.5 Year Ended June 30: PERS 1 PERS 2/3 TRS 1 TRS 2/3 Total
2017 $ - $ 9,645 $ - $ (7,951) $ 1,694 2018 - 9,645 - (7,951) 1,694 2019 - 9,645 - (7,951) 1,694 2020 - 3,858 - (7,951) (4,093) 2021 - - - (3,975) (3,975)
Total $ - $ 32,794 $ - $ (35,779) $ (2,985)
Difference between projected and actual experience: Recognition Period (Years)* 1.0 4.4 1.0 5.5 Year Ended June 30: PERS 1 PERS 2/3 TRS 1 TRS 2/3 Total
2017 $ - $ (50,611) $ - $ (3,019) $ (53,630) 2018 - (50,611) - (3,019) (53,630) 2019 - (50,611) - (3,019) (53,630) 2020 - (20,243) - (3,019) (23,262) 2021 - - - (1,511) (1,511)
Total $ - $ (172,076) $ - $ (13,587) $ (185,663)
Changes in assumptions: Recognition Period (Years)* 1.0 4.4 1.0 5.5 Year Ended June 30: PERS 1 PERS 2/3 TRS 1 TRS 2/3 Total
2017 $ - $ (767) $ - $ (17) $ (784) 2018 - (767) - (17) (784) 2019 - (767) - (17) (784) 2020 - (307) - (17) (324) 2021 - - - (7) (7)
Total $ - $ (2,608) $ - $ (75) $ (2,683)
* The recognition period for each plan is equal to the average of the expected remaining service lives of all employees provided with pensions through the pension plan, which was determined at the beginning of the measurement period.
Note 15. Pension and Retirement Plans
The College offers three contributory pension and retirement plans which cover eligible faculty, staff and administrative employees: The Washington State Public Employees’ Retirement System (PERS) plan, the Washington State Teachers’ Retirement System (TRS) plan and the State Board Retirement Plan (SBRP).

Notes to the Financial Statements June 30, 2016
Centralia College 2016 Financial Report Page | 39
PERS and TRS Plans
Plan Descriptions
PERS and TRS are multiple-employer, defined benefit pension plans administered by the state of Washington, Department of Retirement System (DRS).
PERS and TRS Plan 1
These plans provides retirement and disability benefits, and minimum benefit increases beginning at any age, with 30 years of service, or at age 55, with 25 years of service, or at age 60, with five years of service to eligible members hired prior to October 1, 1977.
PERS and TRS Plan 2
These plans provides retirement and disability benefits, and a cost-of-living allowance, beginning at age 65 with at least five years of service, or at age 55, with 20 years of service to eligible members hired on or after October 1, 1977.
PERS and TRS Plan 3
These plans are a hybrid defined benefit and defined contribution plans. The College contributions fund the defined benefit component, provides retirement and disability benefits. In addition, the plans have a defined contribution component, which is funded by employee contributions. Vesting in these plans occur if the employee has a) ten years of service credits, or b) five years of service credits and at least 12 of those months were earned after age 44, or c) five years of service credit earned in PERS Plan 2 prior to June 1, 2003 or five years of service credit earned in TRS Plan 2 prior to July 1, 1996. Once vested, the employee is eligible for full retirement benefits at age 65. If the employee has at least 10 years of service credit and are age 55 or older, they can retire early, but their benefit may be reduced. The components of the net pension liabilities for PERS 1, PERS 2/3, TRS 1 and TRS 2/3 for 2016 are as follows:
2016* PERS 1 PERS 2/3 TRS 1 TRS 2/3 Total pension liability $ 5,282,985 $14,988,639 $ 1,188,563 $ 1,141,383 Plan fiduciary net position (3,122,244) (13,369,866) (780,886) (1,055,551) Net pension liability $ 2,160,741 $ 1,618,773 $ 407,677 $ 85,832
Plan fiduciary net position as percentage of total pension liability 59.10% 89.20% 65.70% 92.48%
* Amounts reported were determined as of June 30 of the prior fiscal year.
As of June 30, 2015, the date of the latest valuation, total system membership in the PERS and TRS pension plans consists of the following:
PERS
Plan 1 PERS
Plan 2 PERS
Plan 3 TRS
Plan 1 TRS
Plan 2 TRS
Plan 3 Inactive plan members or beneficiaries currently receiving benefits 49,417 42,706 3,693 34,859 4,700 8,866 Inactive plan members entitled to but not yet receiving benefits 827 54,916 5,238 223 2,443 8,373 Active plan members 3,230 120,099 32,923 962 17,612 53,417 Total membership 53,474 217,721 41,854 36,044 24,755 70,656

Notes to the Financial Statements June 30, 2016
Centralia College 2016 Financial Report Page | 40
As of June 30, 2016, the number of participating employers in the PERS and TRS pension plans consists of the following:
PERS
Plan 1 PERS
Plan 2 PERS
Plan 3 TRS
Plan 1 TRS
Plan 2 TRS
Plan 3 Component units of the state of Washington 115 153 145 31 28 40 Counties/Municipalities 123 278 212 - - - School districts 191 - - 189 305 310 Other political subdivisions 120 515 330 - - - Total 549 946 687 220 333 350
Employers can participate in multiple systems and/or plans. Information on these retirement plans and benefits is available in a Comprehensive Annual Financial Report publicly available from the Department of Retirement Systems’ Fiscal Office, PO Box 48380, Olympia, WA 98504-8380.
Funding Policy
Each biennium, the Office of State Actuary, using funding methods prescribed by statute to determine the actuarially required contribution rates for PERS and TRS plans, except where employee contribution rates are set by statute. Employers are required to contribute at the level established by state law.
The required contribution rates, expressed as percentages for the years 2016, 2015 and 2014, are as follows:
2016 2015 2014
Retirement Plan Member College Member College Member College
PERS 1 6.00% 11.18% 6.00% 9.21% 6.00% 9.19% - 9.21%
PERS 2 6.12% 11.18% 4.92% 9.21% 4.92% 9.19% - 9.21%
PERS 3 5% -15% 11.18% 5% -15% 9.21% 5% -15% 9.19% - 9.21%
TRS 1 6.00% 10.39% - 13.13% 6.00% 10.39% 6.00% 8.05% - 10.39%
TRS 2 4.96% - 5.95% 10.39% - 13.13% 4.96% 10.39% 4.69% - 4.96% 8.05% - 10.39%
TRS 3 5% -15% 10.39% - 13.13% 5% -15% 10.39% 5% -15% 8.05% - 10.39%
The rates presented above for the College (employer) contributions, include an administrative fee of 0.18% charged by the Department of Retirement System for their administrative costs.
Investment Policy
The Washington State Investment Board (WSIB) has been authorized by statute as having the investment management responsibility for the PERS and TRS pension funds. The WSIB manages retirement fund assets to maximize the return at a prudent level of risk.
Retirement funds are invested in the Commingled Trust Fund (CTF). The CTF is a diversified pool of investments that invest in fixed income, private equity, real estate and tangible assets. Investment decisions are made within the framework of a Strategic Asset Allocation Policy and a series of WSIB-adopted investment policies for the various asset classes.

Notes to the Financial Statements June 30, 2016
Centralia College 2016 Financial Report Page | 41
For the year ended June 30, 2016, the annual money weighted rate of return on the pension investments, net of pension plan expenses are as follows:
Plan 2016
PERS Plan 1 4.45% PERS Plan 2/3 4.63% TRS Plan 1 4.41% TRS Plan 2/3 4.65%
These money-weighted rates of return express investment performance, net of pension plan investment expenses, and reflect both the size and timing of cash flows.
The PERS and TRS target asset allocation, actual asset allocation and long-term expected real rate of return are summarized in the following table as of June 30, 2016:
Asset Class Target
Allocation Actual
Allocation Long-term Expected Real Rate of Return
Fixed Income 20.00% 22.04% 1.70% Tangible Assets 5.00% 2.94% 4.40% Real estate 15.00% 15.78% 5.80% Global Equity 37.00% 37.95% 6.60% Private Equity 23.00% 20.96% 9.60% Innovation 0.00% 0.07% 0.00% Cash 0.00% 0.26% 0.00%
Total 100.00% 100.00%
The inflation component used to create the above table is 2.20% and represents WSIB’s most recent long-term estimate of broad economic inflation.
Pension Expense
Pension expense, included in “Employee benefits” expense in the statements of revenues, expenses and changes in net position, totaled $280,764 for 2016. The following tables shows the components of each years pension plan expenses:
2016 Pension Expense PERS 1 PERS 2/3 TRS 1 TRS 2/3 Total Actuarial determined pension expense $ 128,777 $ 191,832 $ 20,572 $ 24,384 $ 365,565 Amortization of change in proportionate liability (64,024) (9,645) (19,083) 7,951 (84,801)
Total pension expense $ 64,753 $ 182,187 $ 1,489 $ 32,335 $ 280,764

Notes to the Financial Statements June 30, 2016
Centralia College 2016 Financial Report Page | 42
Changes in Proportionate Shares of Pension Liabilities
The changes, increases or (decreases), to the College's proportionate share of pension liabilities from 2014 to 2015 were (0.001272%), (0.000560%), (0.000647%) and (0.000431%) for PERS 1, PERS 2/3, TRS 1 and TRS 2/3, respectively as noted in the following table:
2014 2015 PERS Plan 1 0.042578% 0.041306% PERS Plan 2/3 0.045865% 0.045305% TRS Plan 1 0.013515% 0.012868% TRS Plan 2/3 0.010603% 0.010172%
The following table shows the changes in each pension plan liability for 2016:
Net Pension Liability PERS 1 PERS 2/3 TRS 1 TRS 2/3 Total Balance, June 30, 2015 $(2,144,884) $ (927,097) $ (398,619) $ (34,247) $(3,504,847) Changes in proportionate share of liability 64,024 11,320 19,083 1,392 95,819 Difference between expected and actual experience -
(172,076) -
(13,587)
(185,663)
Changes in assumptions - (2,608) - (75) (2,683) Net difference between projected versus actual earnings on pension plan investments
(141,984)
(538,597)
(36,379)
(42,095)
(759,055)
Deferred Outflows (Employer contributions) 190,880 202,117 28,810 27,164 448,971 Pension expense (128,777) (191,832) (20,572) (24,384) (365,565)
Balance, June 30, 2016 $(2,160,741) $(1,618,773) $ (407,677) $ (85,832) $(4,273,023)
Contributions from plan members and employers are assumed to continue to be made at contractually required rates (including PERS Plan 2/3 and TRS Plan 2/3, whose rates include a component for the PERS Plan 1 and TRS Plan 1 liabilities, respectively). Based on those assumptions, the pension plan’s fiduciary net position was projected to be available to make all projected future benefit payments of current plan members. Therefore, the long-term expected rate of return of 7.5 percent on pension plan investments was applied to determine the total pension liability.
The following represents the net pension liability of the College using the discount rate of 7.5 percent, as well as what the College’s net pension liability (asset) would be if it were calculated using a discount rate that is 1-percentage-point lower (6.5 percent) or 1-percentage-point higher (8.5 percent) than the current rate.
Pension Plan 1% Decrease (6.5%) Current Discount Rate (7.5%) 1% Increase (8.5%) PERS Plan 1 2,630,707 2,160,741 1,756,612 PERS Plan 2/3 4,733,378 1,618,773 (765,962) TRS Plan 1 512,477 407,677 317,557 TRS Plan 2/3 363,164 85,832 (120,341)

Notes to the Financial Statements June 30, 2016
Centralia College 2016 Financial Report Page | 43
At June 30, 2016, the College reported a total collective liability of $4,273,023 for its proportionate shares of the net pension liability for the PERS and TRS pension plans. The total pension liabilities were determined by an actuarial valuation as of June 30, 2014 with the results rolled forward to June 30, 2015, using the following actuarial assumptions applied for both PERS and TRS plans, to all prior periods included in this measurement:
• Inflation - 3.0% total economic inflation, 3.75% salary inflation • Salary Increases - In addition to the base 3.75% salary inflation assumption, salaries are also expected to
grow by promotion and longevity • Investment Rate of Return - 7.5%
State Board Retirement Plan (SBRP)
The State Board Retirement Plan (SBRP), created for the SBCTC, the 34 community and technical colleges in the state of Washington, and the Student Achievement Council, is a tax deferred multiple-employer defined contribution plan which covers most faculty, professional and exempt staff. Contributions to the plan are invested in annuity contracts or mutual funds offered by the Teachers Insurance and Annuity Association and College Retirement Equities Fund (TIAA-CREF). Employees have at all times, a 100% vested interest in their accumulations. Benefits are available upon employee separation or retirement. The SBRP, operating under section 401(a) of the Internal Revenue Code, has a contract with the TIAA-CREF to administer records, investments and benefits.
The benefit goal for the SBRP is 2% of the employee’s average annual salary for each year of full-time service up to a maximum of 25 years of service. However, if the employee does not elect to make the 10% contribution at age 50, the benefit goal is reduced to 1.5% for each year of full-time service.
The plan has a supplemental payment plan component which guarantees a minimum retirement benefit based on a one-time calculation at each employee’s retirement date. Effective for employees hired on or after July 1, 2011, state law no longer offers this supplemental component benefit.
Effective January 1, 2012, state law establishes a higher education retirement plan supplemental benefit fund for the purpose of funding future benefit obligations of higher education retirement plan supplemental benefits which the State Investment Board has authority to manage this fund. The funding for this is an employer contribution based on a percentage of salary for active plan participants. From January 1, 2012 through June 30, 2013, the employer required contribution was one-quarter percent (0.25%) of salary. Beginning July 1, 2013, the employer required contribution increased to one-half percent (0.5%) of salary. For the year-end June 30, 2016, the College contributed $44,751 to this fund. Approximately $8,950,200 of the College’s payroll were covered under this plan for 2016. As of June 30, 2016, the SBCTC system accounted for $10,439,440 of the fund balance.
The SBCTC, on behalf of the College, will make direct payments to qualifying retirees when the retirement benefits provided by the fund sponsors do not meet the benefits goal. The unfunded actuarial accrued liability (UAAL) calculated at June 30, 2015 was $104,696,000 under the plans entry age normal method and is amortized over a 10 year period. The actuarial assumptions include an investment rate of return of 4% with projected salary increases of 3.75%. The annual required contribution (ARC) is $16,200,000 consists of the amortization of the UAAL ($10,583,000), normal cost ($5,302,000) and interest.
Funding Policy
Employee contribution rates, based on age, varies from 5% for participants under 35 years of age, 7.5% for participants 35 to 49 years of age and 10% for participants age 50 and over. Employees have, at all times, a 100% vested interest in

Notes to the Financial Statements June 30, 2016
Centralia College 2016 Financial Report Page | 44
their accumulations. Employee and employer contributions to the SBRP for the year-end June 30, 2016 were $789,415 and $789,415, respectively. All required employer and employee contributions have been made by the College.
Reported as a liability by the SBCTC, the Net Pension Obligation (NPO) is the cumulative excess of the ARC over actual benefit payments. The following table reflects the SBCTC activity of the NPO for the year ended June 30, 2016:
NET PENSION OBLIGATION 2016 Balance, beginning of year $ 81,085,439 Annual Required Contribution 16,200,000 Payments to Beneficiaries (766,692) Balance, end of year $ 96,518,747
The College does not report any of the NPO balance in their financial statements.
Note 16. Other Post-Employment Benefits (OPEB)
In addition to pension benefits as described in Note 15, the state, through the Health Care Authority (HCA) administers an agent multiple-employer defined benefit other post-employment benefit (OPEB) plan.

Notes to the Financial Statements June 30, 2016
Centralia College 2016 Financial Report Page | 45
The Public Employees’ Benefits Board (PEBB), created within HCA, is authorized to design and determined the terms and conditions of employee and retired employee participation and coverage. PEBB established eligibility criteria for both active employees and retirees. Benefits purchased by PEBB include medical, dental, life and long-term disability.
The relationship between PEBB OPEB and its member employers and their employees and retirees is not formalized in a contract or plan document. Rather, the benefits are provided in accordance with a substantive plan. A substantive plan is one in which the plan terms are understood by the employers and plan members. The understanding is based on communication between the HCA, employers and plan members, and the historical pattern of practice with regard to sharing of benefit costs.
An actuarial study performed by the Office of the State Actuary (OSA) calculated the total OPEB obligation of the State of Washington at January 1, 2015 to be $10.9 billion. The OSA allocated the statewide disclosure information for OPEB to the State Board for Community and Technical College (SBCTC) system level. The SBCTC further allocated these amounts among the individual colleges. The College’s share of the GASB Statement No. 45 actuarially accrued liability (AAL) is $9,996,981 at January 1, 2015, with an annual required contribution (ARC) of $994,820 for 2016. The ARC represents the amortization of the liability of fiscal year 2016 plus the current expense for active employees, which is reduced by the current contributions of $144,678. The College’s net OPEB obligation (NOO) is $2,305,522 This NOO amount is not included in the College’s financial statement, rather the total statewide net OPEB obligation is recorded in the State’s Comprehensive Annual Financial Report (CAFR), which is available online by going to www.ofm.wa.gov/cafr/. The College was billed and paid approximately $2.7 million for active and retiree healthcare expenses in 2016.
The PEBB calculates the premium amounts each year that are sufficient to fund the statewide health and life insurance programs on a pay-as-you-go basis. These costs are passed through to individual state agencies based on active employee headcounts; the agencies pay the premium for active employees to the HCA. Agencies may charge employees for certain higher costs options selected by the employee. Retirees may elect coverage through the HCA, for which they pay less than the full cost of the benefits, based on their age and other demographics factors. The healthcare premiums for active employees, which are paid by the agency during the employees’ working career, subsidize the “underpayments” of retirees. An additional factor in the OPEB obligation is a payment that is required by the State Legislature to reduce the premiums to retirees covered by Medicare (an “explicit” subsidy). This explicit subsidy is also passed through to state agencies via active employee rates charged to the agency. There is no formal state or College plan that underlies the subsidy of retiree health and life insurance.
The PEBB retiree OPEB plan is available to employees who elect to continue coverage and pay the administratively established premiums at the time they retire under the provisions of the retirement system to which they belong. Retirees’ access to the PEBB plan depends on the retirement eligibility of their respective retirement systems: PERS, TRS and Higher Education are the retirement plans currently used by College employees and retirees.
Retirees who are not yet eligible for Medicare benefits may continue participation in the state’s non-Medicare community-rated health insurance risk pool on a self-pay basis. Retirees in the non-Medicare risk pool receive an implicit subsidy. The implicit subsidy exists because retired members pay a premium based on a claims experience for active employees and other non-Medicare retirees. The subsidy is valued using the difference between age-base claims cost and the premium. In calendar year 2015, the average weighted implicit subsidy is projected at $308 per member per month. Retirees who are enrolled in both Part A and B of Medicare may participate in the state’s Medicare community-rated health insurance risk pool. Medicare retirees receive an explicit subsidy in the form of reduced premiums. Annually, the HCA administrator recommends an amount for next year’s explicit subsidy for inclusion in the Governor’s budget. In calendar year 2015, the explicit subsidy is $150 per member per month.

Notes to the Financial Statements June 30, 2016
Centralia College 2016 Financial Report Page | 46
Note 17. Vendor Payment Advance
In accordance with RCW 28B.50.143, the Washington State Treasurer advances the College an amount equal to 17% of the College’s general fund (001) budgeted expenditures for the biennium. This advance is returned to the state Treasurer after the final reimbursement for the biennium is requested. In July 2015, the College repaid the 13/15 biennium advance in the amount of $159,300 and was advanced $164,700 for the current 15/17 biennium.
Note 18. Related-Party Transactions
Based on their inter-relationship, the College and the Foundation have a number of transactions with each other during the course of the year. Under a formal agreement between the College and Foundation, the College provides printing, postage, office space, staff services and supplies, which the value totaled a net of $149,021 for 2016, while the Foundation provides fundraising and financial services.
For restricted and unrestricted purposes, the Foundation distributed approximately $427,214 to the College for restricted and unrestricted purposes in 2016. Inter-entity transactions and balances between the College and Foundation are not eliminated for financial statement presentation purposes.
Centralia College is the midway point for the annual Seattle to Portland (STP) Bike Ride.

Required Supplementary Information
Centralia College 2016 Financial Report Page | 47
Required Supplementary Information

Required Supplementary Information
Centralia College 2016 Financial Report Page | 48
Schedule of the College’s Proportionate Share of Net Pension Liabilities* continued
PERS Plan 1 PERS Plan 2/3 2016 2015 2014 2016 2015 2014 College's proportion of net pension liability (asset) 0.041306% 0.042578% 0.045439% 0.045305% 0.045865% 0.046802%
College proportionate share of the net pension liability $ 2,160,741 $ 2,144,884 $ 2,655,116 $ 1,618,773 $ 927,097 $ 1,998,452 College covered-employee payroll $ 316,152 $ 340,907 $ 379,797 $ 4,021,129 $ 3,891,819 $ 3,879,938
College's proportionate share of the net pension liability (asset) as a percentage of its covered-employee payroll 683.45% 629.17% 699.09% 40.26% 23.82% 51.51%
Plan's fiduciary net position as a percentage of the total pension liability 59.10% 61.19% 55.71% 89.20% 93.29% 84.60%
*These schedules are to be built prospectively until they contain ten years of data and the amounts reported for each fiscal year were determined as of June 30th of the prior fiscal year.
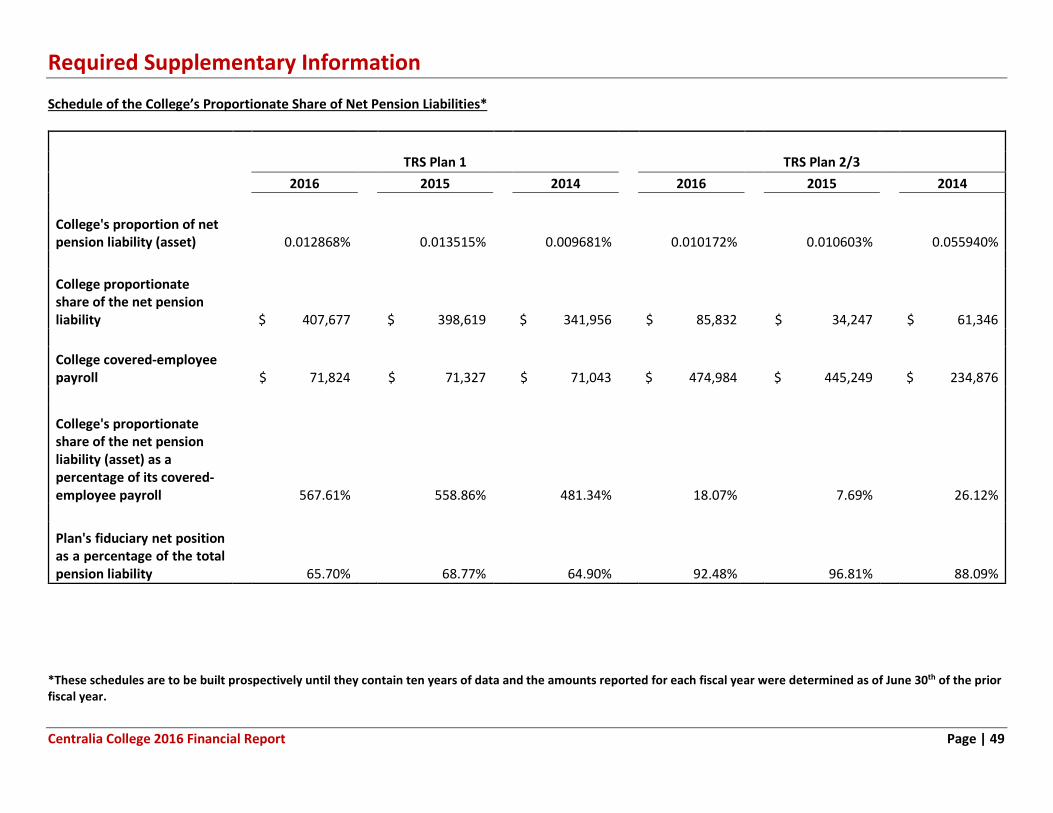
Required Supplementary Information
Centralia College 2016 Financial Report Page | 49
Schedule of the College’s Proportionate Share of Net Pension Liabilities*
TRS Plan 1 TRS Plan 2/3 2016 2015 2014 2016 2015 2014 College's proportion of net pension liability (asset) 0.012868% 0.013515% 0.009681% 0.010172% 0.010603% 0.055940%
College proportionate share of the net pension liability $ 407,677 $ 398,619 $ 341,956 $ 85,832 $ 34,247 $ 61,346 College covered-employee payroll $ 71,824 $ 71,327 $ 71,043 $ 474,984 $ 445,249 $ 234,876
College's proportionate share of the net pension liability (asset) as a percentage of its covered-employee payroll 567.61% 558.86% 481.34% 18.07% 7.69% 26.12%
Plan's fiduciary net position as a percentage of the total pension liability 65.70% 68.77% 64.90% 92.48% 96.81% 88.09%
*These schedules are to be built prospectively until they contain ten years of data and the amounts reported for each fiscal year were determined as of June 30th of the prior fiscal year.

Required Supplementary Information
Centralia College 2016 Financial Report Page | 50
Schedule of College Contributions* continued
PERS Plan 1 PERS Plan 2/3 2016 2015 2014 2016 2015 2014 Contractually required contributions $ 29,945 $ 29,118 $ 31,398 $ 481,924 $ 370,346 $ 358,437
Contributions in relation to the contractually required contributions 29,945 29,118 31,398 481,924 370,346 358,437
Contribution deficiency (excess) $ - $ - $ - $ - $ - $ - College covered-employee payroll $ 267,840 $ 316,152 $ 340,907 $ 4,310,589 $ 4,021,129 $ 3,891,819
Contributions** as a percentage of covered-employee payroll 11.18% 9.21% 9.21% 11.18% 9.21% 9.21%
*These schedules are to be built prospectively until they contain ten years of data. **Includes an administrative fee of 0.18% levied by the Washington State Department of Retirement Systems to cover administrative expenses.

Required Supplementary Information
Centralia College 2016 Financial Report Page | 51
Schedule of College Contributions*
TRS Plan 1 TRS Plan 2/3 2016 2015 2014 2016 2015 2014 Contractually required contributions $ 7,393 $ 7,462 $ 7,411 $ 65,374 $ 49,351 $ 46,261
Contributions in relation to the contractually required contributions 7,393 7,462 7,411 65,374 49,351 46,261
Contribution deficiency (excess) $ - $ - $ - $ - $ - $ - College covered-employee payroll $ 56,303 $ 7 ,824 $ 71,327 $ 497,900 $ 474,984 $ 445,249
Contributions** as a percentage of covered-employee payroll 13.13% 10.39% 10.39% 13.13% 10.39% 10.39%
*These schedules are to be built prospectively until they contain ten years of data. **Includes an administrative fee of 0.18% levied by the Washington State Department of Retirement Systems to cover administrative expenses.

Notes to Required Supplementary Information
Centralia College 2016 Financial Report Page | 52
The Washington State Investment Board (WSIB) has been authorized by statute as having the investment management responsibility for retirement (pension) funds. The WSIB may invest as provided by statute (chapter 43.33A RCW) and WSIB policy in the following:
• U.S. Treasury Bills • Discount notes • Repurchase agreements • Reverse repurchase agreements • Bankers’ acceptances • Commercial paper • Guaranteed investment contracts • U.S. government and agency securities • Non-U.S. dollar bonds • Investment grade corporate bonds • Noninvestment grade corporate bonds • Publicly traded mortgage-backed securities • Privately placed mortgages • Private placements of corporate debt • U.S. and foreign common stock • U.S. preferred stock • Convertible securities • Private equity, not limited to investment corporations, partnerships and limited liability corporations for venture
capital, leveraged buyouts, real estate and other tangible assets, or other forms of private equity • Asset backed securities • Derivative securities, including futures, options and options on futures, forward contracts and swap transactions
For pension investment purposes, the PERS and TRS target asset allocation and actual asset allocations made by the WSIB are summarized in the following table for 2016 and 2015:
Asset Class Target
Allocation 2016 Actual Allocation
2015 Actual Allocation
Fixed Income 20.00% 22.04% 23.76% Tangible Assets 5.00% 2.94% 1.95% Real estate 15.00% 15.78% 14.45% Global Equity 37.00% 37.95% 37.27% Private Equity 23.00% 20.96% 22.04% Innovation 0.00% 0.07% 0.32% Cash 0.00% 0.26% 0.21%
Total 100.00% 100.00% 100.00%

Page | 53
INDEPENDENT AUDITOR’S REPORT ON INTERNAL CONTROL OVER FINANCIAL REPORTING AND ON COMPLIANCE AND OTHER MATTERS BASED ON AN AUDIT OF FINANCIAL STATEMENTS PERFORMED IN
ACCORDANCE WITH GOVERNMENT AUDITING STANDARDS
Centralia College July 1, 2015 through June 30, 2016
Board of Trustees Centralia College Centralia, Washington
We have audited, in accordance with auditing standards generally accepted in the United States of America and the standards applicable to financial audits contained in Government Auditing Standards, issued by the Comptroller General of the United States, the financial statements of the business-type activities and the aggregate discretely presented component units of the Centralia College, Lewis County, Washington, as of and for the year ended June 30, 2016, and the related notes to the financial statements, which collectively comprise the College’s basic financial statements, and have issued our report thereon dated January 31, 2017.
Our report includes a reference to other auditors who audited the financial statements of the Centralia College Foundation, as described in our report on the College’s financial statements. This report includes our consideration of the results of the other auditor’s testing of internal control over financial reporting and compliance and other matters that are reported on separately by those other auditors. However, this report, insofar as it relates to the results of the other auditors, is based solely on the reports of the other auditors. The financial statements of the Centralia College Foundation were not audited in accordance with Government Auditing Standards and accordingly this report does not include reporting on internal control over financial reporting or instances of reportable noncompliance associated with the Centralia College Foundation.
The financial statements of the Centralia College, an agency of the state of Washington, are intended to present the financial position, and the changes in financial position, and where applicable, cash flows of only the respective portion of the activities of the state of Washington that is attributable to the transactions of the College and its aggregate discretely presented component units. They do not purport to, and do not, present fairly the financial position of the state of Washington as of June 30, 2016, the changes in its financial position, or where applicable, its cash flows for the year then ended in conformity with accounting principles generally accepted in the United States of America. Our opinion is not modified with respect to this matter.
INTERNAL CONTROL OVER FINANCIAL REPORTING
In planning and performing our audit of the financial statements, we considered the College’s internal control over financial reporting (internal control) to determine the audit procedures that are appropriate in the circumstances for the purpose of expressing our opinion on the financial statements, but not for the purpose of expressing an opinion on the effectiveness of the College’s internal control. Accordingly, we do not express an opinion on the effectiveness of the College’s internal control.
A deficiency in internal control exists when the design or operation of a control does not allow management or employees, in the normal course of performing their assigned functions, to prevent, or detect and correct, misstatements on a timely basis. A material weakness is a deficiency, or a combination of deficiencies, in internal control such that there is a reasonable possibility that a material misstatement of the College's financial statements will not be prevented, or detected and corrected on a timely basis. A significant deficiency is a deficiency, or a combination of deficiencies, in internal control that is less severe than a material weakness, yet important enough to merit attention by those charged with governance.

Page | 54
Our consideration of internal control was for the limited purpose described in the first paragraph of this section and was not designed to identify all deficiencies in internal control that might be material weaknesses or significant deficiencies. Given these limitations, during our audit we did not identify any deficiencies in internal control that we consider to be material weaknesses. However, material weaknesses may exist that have not been identified.
COMPLIANCE AND OTHER MATTERS
As part of obtaining reasonable assurance about whether the College’s financial statements are free from material misstatement, we performed tests of the College’s compliance with certain provisions of laws, regulations, contracts and grant agreements, noncompliance with which could have a direct and material effect on the determination of financial statement amounts. However, providing an opinion on compliance with those provisions was not an objective of our audit, and accordingly, we do not express such an opinion.
The results of our tests disclosed no instances of noncompliance or other matters that are required to be reported under Government Auditing Standards.
PURPOSE OF THIS REPORT
The purpose of this report is solely to describe the scope of our testing of internal control and compliance and the results of that testing, and not to provide an opinion on the effectiveness of the College’s internal control or on compliance. This report is an integral part of an audit performed in accordance with Government Auditing Standards in considering the College’s internal control and compliance. Accordingly, this communication is not suitable for any other purpose. However, this report is a matter of public record and its distribution is not limited. It also serves to disseminate information to the public as a reporting tool to help citizens assess government operations.
Pat McCarthy
State Auditor
Olympia, WA
January 31, 2017

2016 Graduation Day
2016 Centralia College Annual Financial Report

Centralia College Centralia College 600 Centralia College Blvd. Centralia, WA 98531
centralia.edu