Graciela Lubertino, Ph.D. H-GAC Joe Zietsman, TTI Tara Ramani, TTI
Upload
princess-roadsCategory
view
216download
0
Center for Air Quality Studies
SmartWay℠ Applications for Cross-Border Drayage Trucks
By
Monica Beard-Raymond, Carlos Duran, Joe Zietsman, Reza Farzaneh, Doh-Won Lee, Tara Ramani
Acknowledgements
Ed Moderow and Ross Pumfrey of TCEQ
Eduardo Calvo of TxDOT
Manuel Sotelo of Fletes Sotelo
Hector Mendoza of STIL
1

CENTER FOR AIR QUALITY STUDIES
Cross-Border Drayage Operation (1)
U.S.-Mexico trade: over $350 billion in 2008 Majority by freight transport (truck and rail) 90% of truck traffic at border: drayage
Cross-border drayage trucks Typically older and less well maintained Operating daily across the border A significant source of emissions in the region
2
In-Land Mexico
Drayage Company
In-Land USA
Drayage Company
Lo
ng
Hau
l
Lo
ng
Hau
lDrayage (Short Haul)

CENTER FOR AIR QUALITY STUDIES
Cross-Border Drayage Operation (2)
Approximately 200 miles per day
No overnight idling Border crossing by
drayage trucks:Long delays at the
borderStop-and-go driving
conditions 3

CENTER FOR AIR QUALITY STUDIES
Cross-Border Drayage Operation (3)
El Paso commercial ports of entries (POEs) Bridge of the Americas (BOTA); andYsleta-Zaragoza Bridge
Idling and creep-idling: close to 70% of NB drayage activity – 20 minutes
4

CENTER FOR AIR QUALITY STUDIES
EPA’s SmartWay Program
SmartWay℠ An innovative brand that represents environmentally
cleaner, more fuel efficient transportation options Identifies products and services that reduce transportation-
related emissions
SmartWay Transport Partnership℠ A collaboration between EPA and the freight sector Goal: improve energy efficiency and reduce emissions
through the use of technologies and best practices. SmartWay strategies: primarily for long-haul trucking
5

CENTER FOR AIR QUALITY STUDIES SmartWay Strategies (1)
Engine, tire and truck modifications low rolling resistance tires, auto-tire
inflation, aerodynamic improvements, low-viscosity lubricants, lighter tractors and trailers, and SmartWay certified trailers
Idle reduction technologiesbunker heaters, auxiliary power units
(APUs), automatic shut down and start up systems, and electrified parking spaces.
6

CENTER FOR AIR QUALITY STUDIES SmartWay Strategies (2)
Diesel retrofit and advanced technologieshybrid power-train technology, DOC, DPF,
SCR, and engine and truck replacement Cleaner fuels
Biodiesel and CNG Operational strategies
speed reduction, driver education, and improved freight logistics
7

CENTER FOR AIR QUALITY STUDIES Approach
Identify SmartWay technologies
Workshops with drayage companies
Shortlist technologies
Develop testing plan Implement testing
plan
8

CENTER FOR AIR QUALITY STUDIES Testing Approach
On-road emissions measurement PEMS equipment
CO2, CO, THC, NOx, and PM Pre-determined test drive cycles 5 test vehicles 3 SmartWay strategies
Diesel Oxidation Catalyst (DOC) Light trailer (2000 lbs. lighter) Driver training (eco driving)
VSP-based analysis9

CENTER FOR AIR QUALITY STUDIES VSP-Based Analysis
EPA MOVES: Vehicle Specific Power (VSP)For a specific vehicle
• VSP = F (speed, acceleration)• Emissions = G (VSP, speed)
Data collectionCovering combinations of speeds and
acceleration rates Data Analysis
Applying emissions rates to drive schedules
10

CENTER FOR AIR QUALITY STUDIES Methodology
11
VehicleSelection
Test Drive Cycles
On-
Roa
d Te
stin
g
Sec-by-secEmissions
EmissionsFor Each Modal Bin
ActualDrive Schedules
Total Emissions
0
20
40
60
80
100
120
0 100 200 300 400 500 600 700 800
Time (s)
Sp
ee
d (
mp
h)
Fast Acceleration - Slow Deceleration
Normal Acceleration - Normal Deceleration
Slow Acceleration - Fast Deceleration
0
20
40
60
80
100
0 100 200 300 400 500 600 700
Time (s)
Sp
eed
(mp
h)
0
15
30
45
60
75
CO
2 (g
/s)
Speed
Observed CO2
0
0.1
0.2
0.3
0.4
0.5
0 100 200 300 400 500 600 700
Time (s)
NO
x (g
/s)
Observed
Estimated
TTI-HDV High Speed 2Average Speed 69.3 mph
0
20
40
60
80
100
0 200 400 600 800 1000 1200Time (s)
Speed
(mph
)
CENTER FOR AIR QUALITY STUDIES
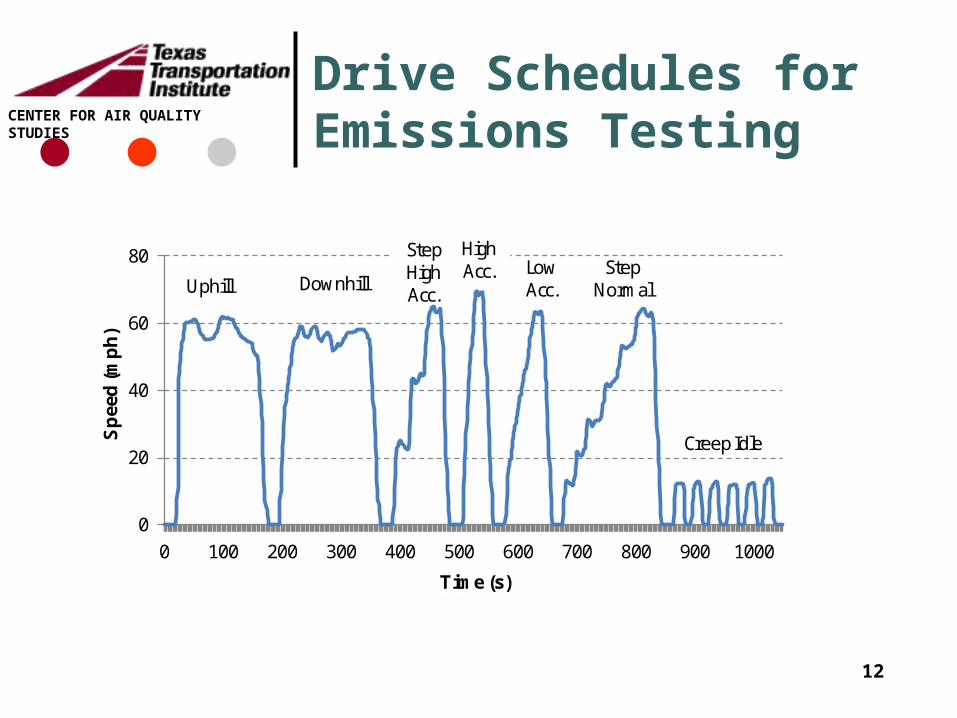
Drive Schedules for Emissions Testing
12
0
20
40
60
80
0 100 200 300 400 500 600 700 800 900 1000
Sp
eed
(mp
h)
Time (s)
Uphill Downhill
Step High Acc.
HighAcc. Low
Acc.Step
Normal
Creep Idle

CENTER FOR AIR QUALITY STUDIES
Cross-Border Drive Schedules
13
0
5
10
15
20
25
30
35
0 500 1000 1500 2000 2500
Sp
eed
(mp
h)
Time (s)
South Bound Border Crossing
0
5
10
15
20
0 500 1000 1500
Sp
eed
(mp
h)
Time (s)
North Bound Border Crossing
0
10
20
30
40
50
60
0 500 1000
Sp
eed
(mp
h)
Time (s)
U.S. Driving
0
10
20
30
40
50
60
0 500 1000 1500 2000
Sp
eed
(mp
h)
Time (s)
Mexico Driving

CENTER FOR AIR QUALITY STUDIES Test Vehicles
14
Model Model Year
Engine Manufacturer
Engine Model
Engine HP
International 1986 Cummins Big Cam 300 White GMC 1994 Detroit S-60 360 Volvo 1996 Cummins M11 330 International 1996 Detroit S-60 330 Freightliner 1999 Cummins ISM 330
Selected based on the observed distribution of the drayage trucks from 270 observations

CENTER FOR AIR QUALITY STUDIES Test Equipment
15
SEMTECH-DS Axion

CENTER FOR AIR QUALITY STUDIES Test Load
Single loaded trailer for all testsNormal load 20,000 lbsLight Trailer 18,000 lbs
16
CENTER FOR AIR QUALITY STUDIES
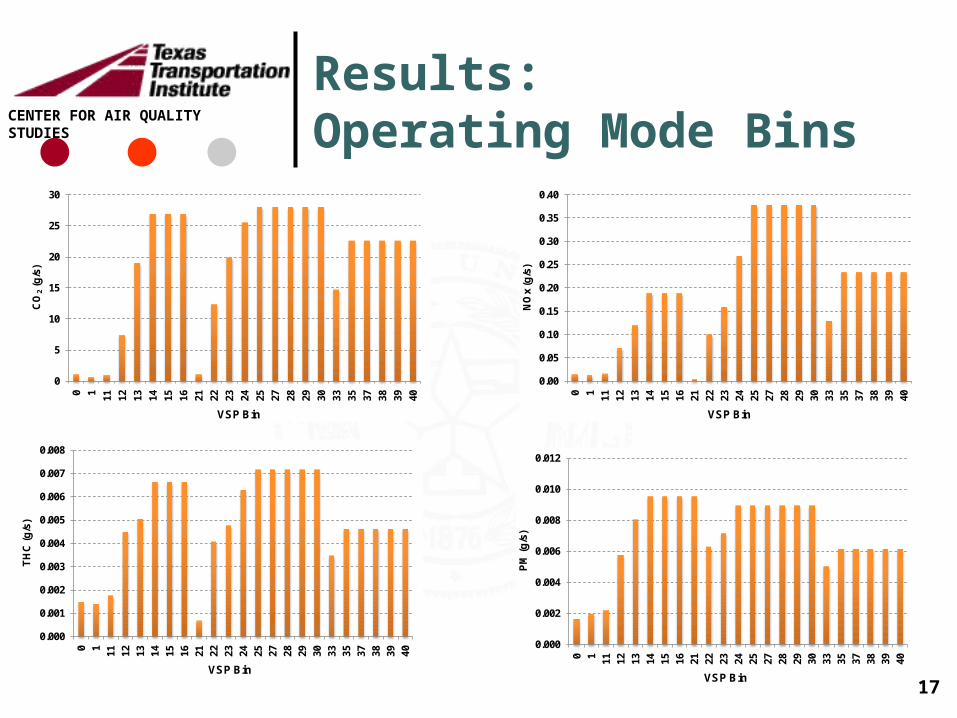
Results:Operating Mode Bins
17
0
5
10
15
20
25
30
0 1 11 12 13 14 15 16 21 22 23 24 25 27 28 29 30 33 35 37 38 39 40
CO
2(g
/s)
VSP Bin
0.00
0.05
0.10
0.15
0.20
0.25
0.30
0.35
0.40
0 1 11 12 13 14 15 16 21 22 23 24 25 27 28 29 30 33 35 37 38 39 40
NO
x (g
/s)
VSP Bin
0.000
0.001
0.002
0.003
0.004
0.005
0.006
0.007
0.008
0 1 11 12 13 14 15 16 21 22 23 24 25 27 28 29 30 33 35 37 38 39 40
TH
C (g
/s)
VSP Bin
0.000
0.002
0.004
0.006
0.008
0.010
0.012
0 1 11 12 13 14 15 16 21 22 23 24 25 27 28 29 30 33 35 37 38 39 40
PM
(g/s
)
VSP Bin

CENTER FOR AIR QUALITY STUDIES
ResultsAverage Total Emissions
18Base
Light Trailer
DOC80% Eco Driving
50% Eco Driving
NOx (kg) 5.2 5.2 5.5 5.1 4.9
0
1
2
3
4
5
6
NO
x (k
g)
-6.0
9 %
-2.0
%
+ 5.
3 %
+ 0.
3 %
BaseLight
TrailerDOC
80% Eco Driving
50% Eco Driving
CO (kg) 11.0 9.5 2.8 9.5 11.2
0
2
4
6
8
10
12
CO
(kg)
-78.
2 %
-13.
9 % + 1.
3 %
-13.
6 %

CENTER FOR AIR QUALITY STUDIES
ResultsAverage Total Emissions
19
BaseLight
TrailerDOC
80% Eco Driving
50% Eco Driving
CO2 (kg) 427.1 428.1 435.7 426.8 392.7
0
100
200
300
400
500
CO
2(k
g)
+0.
2 %
+ 2.
0 %
-0.1
%
-8.
1 %
BaseLight
TrailerDOC
80% Eco Driving
50% Eco Driving
THC (kg) 0.57 0.53 0.27 0.53 0.57
0
0.1
0.2
0.3
0.4
0.5
0.6
0.7
TH
C (k
g)
+ 0.
4 %
-7.9
%
-52.
6 %
-8.0
%
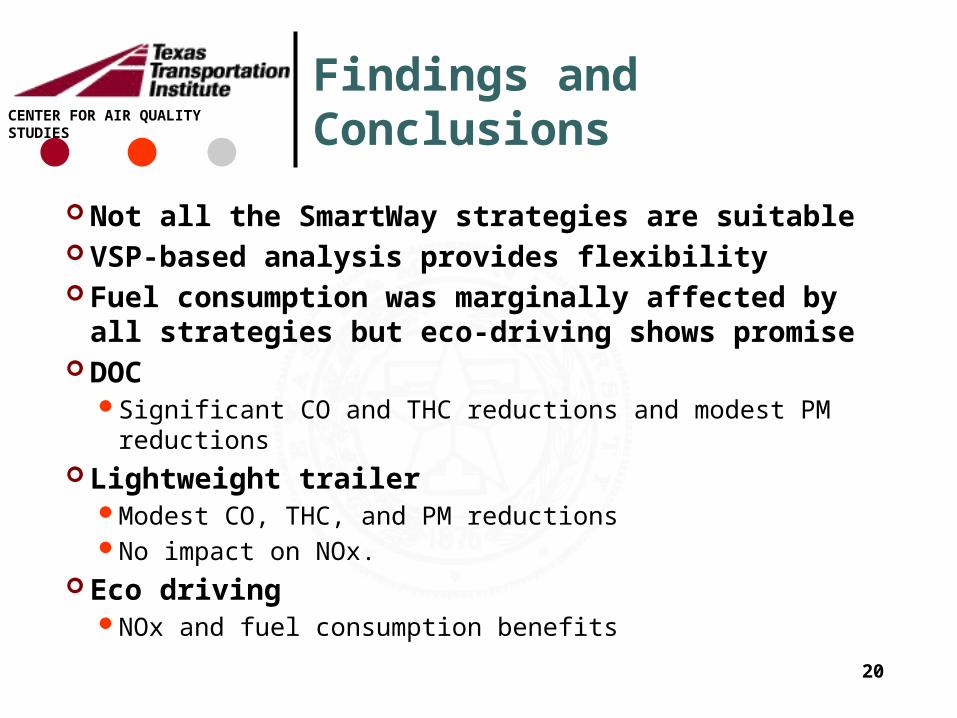
CENTER FOR AIR QUALITY STUDIES Findings and Conclusions
Not all the SmartWay strategies are suitable VSP-based analysis provides flexibility Fuel consumption was marginally affected by all
strategies but eco-driving shows promise DOC
Significant CO and THC reductions and modest PM reductions Lightweight trailer
Modest CO, THC, and PM reductions No impact on NOx.
Eco driving NOx and fuel consumption benefits
20