
CENTER CITY DISTRICT Center City District Street Cleaning · Customer Satisfaction Survey noted...
9
62 CENTER CITY DISTRICT & CENTRAL PHILADELPHIA DEVELOPMENT CORPORATION | CENTERCITYPHILA.ORG Center City District (CCD) started in 1991 with a mission to make downtown Philadelphia clean, safe and attractive. In the last 28 years, CCD has broadened its services to include physical, streetscape enhancements, park renovation and management and programming year-round to enhance the vitality of Center City. CLEAN: CCD deploys 147 uniformed sidewalk cleaners and supervisors in two overlapping shifts seven days a week, sweeping litter manually and mechanically, no less than three times per day from each sidewalk in the district. Walkways with heavier pedestrian volumes are cleaned more frequently. The first CCD cleaners appear on the street at 6 a.m. and teams are deployed throughout the day, with crews working in prime retail and entertainment areas until 7:30 p.m. in warm weather months and until 5:30 p.m. in winter. Pressure washing crews remove stains and grime from sidewalks in warm weather months, Sunday through Thursday from 5 a.m. to 1:30 p.m. Crews also maintain all CCD parks, remove graffiti from the ground-floor façades of buildings in the district and scrape thousands of stickers, posters and tags from light poles, directional signs, and other street furniture including City- owned Big Belly trashcans and Philadelphia Parking Authority fare kiosks. Nearly two-thirds of respondents to CCD’s 2018 Customer Satisfaction Survey rated Center City as ‘much cleaner’ than other Philadelphia neighborhoods. Besides litter, two-thirds of respondents note that overflowing municipal trash cans detract from the appearance of Center City sidewalks, while 56% express concern about commercial and residential trash placed out inappropriately. SAFE: CCD also deploys 46 uniformed Community Service Representatives (CSRs) who work in partnership with the Philadelphia Police Department, serve as eyes on the street, offer information and directions to visitors, workers and residents, and provide outreach services to those experiencing homelessness. CSRs are deployed from 8 a.m. to 11 p.m. Tuesday through Saturday, and 10 a.m. to 6 p.m. on Sundays and Mondays. Since 1993, the number of serious crimes has dropped by 36% in the district, including a 90% drop in thefts from autos. But in the last year, there has an uptick in the number of crimes reported within the CCD and a significant increase in the last several years in the number of individuals who are homeless and panhandling on Center City streets. Respondents to CCD’s CENTER CITY DISTRICT Center City District Street Cleaning | Matt Stanley
Transcript of CENTER CITY DISTRICT Center City District Street Cleaning · Customer Satisfaction Survey noted...

62 CENTER CITY DISTRICT & CENTRAL PHILADELPHIA DEVELOPMENT CORPORATION | CENTERCITYPHILA.ORG
Center City District (CCD) started in 1991 with a mission to make downtown Philadelphia clean, safe and attractive. In the last 28 years, CCD has broadened its services to include physical, streetscape enhancements, park renovation and management and programming year-round to enhance the vitality of Center City.
CLEAN: CCD deploys 147 uniformed sidewalk cleaners and supervisors in two overlapping shifts seven days a week, sweeping litter manually and mechanically, no less than three times per day from each sidewalk in the district. Walkways with heavier pedestrian volumes are cleaned more frequently. The first CCD cleaners appear on the street at 6 a.m. and teams are deployed throughout the day, with crews working in prime retail and entertainment areas until 7:30 p.m. in warm weather months and until 5:30 p.m. in winter. Pressure washing crews remove stains and grime from sidewalks in warm weather months, Sunday through Thursday from 5 a.m. to 1:30 p.m.
Crews also maintain all CCD parks, remove graffiti from the ground-floor façades of buildings in the district and scrape thousands of stickers, posters and tags from light poles, directional signs, and other street furniture including City-owned Big Belly trashcans and Philadelphia Parking Authority
fare kiosks. Nearly two-thirds of respondents to CCD’s 2018 Customer Satisfaction Survey rated Center City as ‘much cleaner’ than other Philadelphia neighborhoods.
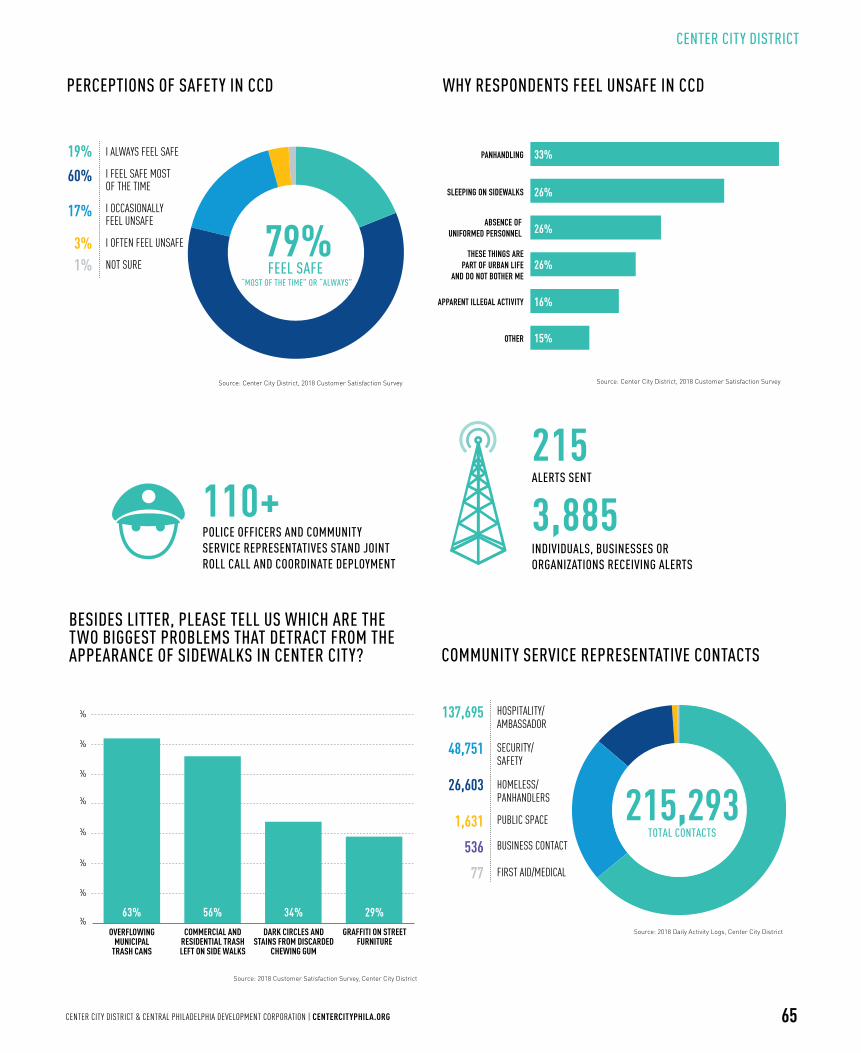
Besides litter, two-thirds of respondents note that overflowing municipal trash cans detract from the appearance of Center City sidewalks, while 56% express concern about commercial and residential trash placed out inappropriately.
SAFE: CCD also deploys 46 uniformed Community Service Representatives (CSRs) who work in partnership with the Philadelphia Police Department, serve as eyes on the street, offer information and directions to visitors, workers and residents, and provide outreach services to those experiencing homelessness. CSRs are deployed from 8 a.m. to 11 p.m. Tuesday through Saturday, and 10 a.m. to 6 p.m. on Sundays and Mondays.
Since 1993, the number of serious crimes has dropped by 36% in the district, including a 90% drop in thefts from autos. But in the last year, there has an uptick in the number of crimes reported within the CCD and a significant increase in the last several years in the number of individuals who are homeless and panhandling on Center City streets. Respondents to CCD’s
CENTER CITY DISTRICT Cent
er C
ity
Dis
tric
t Str
eet C
lean
ing
| Mat
t Sta
nley
63CENTER CITY DISTRICT & CENTRAL PHILADELPHIA DEVELOPMENT CORPORATION | CENTERCITYPHILA.ORG
Customer Satisfaction Survey noted that a reduction in the number of panhandlers and individuals sleeping on the street is their top priorities to enhance safety downtown.
To respond to the rise of homelessness and panhandling and better address those in need, the CCD in 2018 funded and launched a homeless outreach pilot program in partnership with Project Home, the Philadelphia Police Department and the city’s Department of Behavioral Health. Combined teams from Project Home, the Philadelphia Police and CCD CSRs succeeded during 30 weeks in persuading 134 people to come off the street and enter social service, mental health and housing programs. CCD provided transportation for more than half, easing the connection to service for many who were previously reluctant to accept help. No citations nor arrests were made.
CCD is doubling the number of teams for 2019, enabling more trained outreach workers to help connect more people on the street each day to the services they need to achieve recovery.
CSRs routinely survey Center City sidewalks, reporting deteriorated conditions and quality-of-life concerns to the responsible public agencies and following up to ensure resolution. CSRs also engaged in 215,293 extended conversations with pedestrians in 2018 – mostly to provide point-of-interest information and directions, although nearly one-fourth involved public safety and security issues.
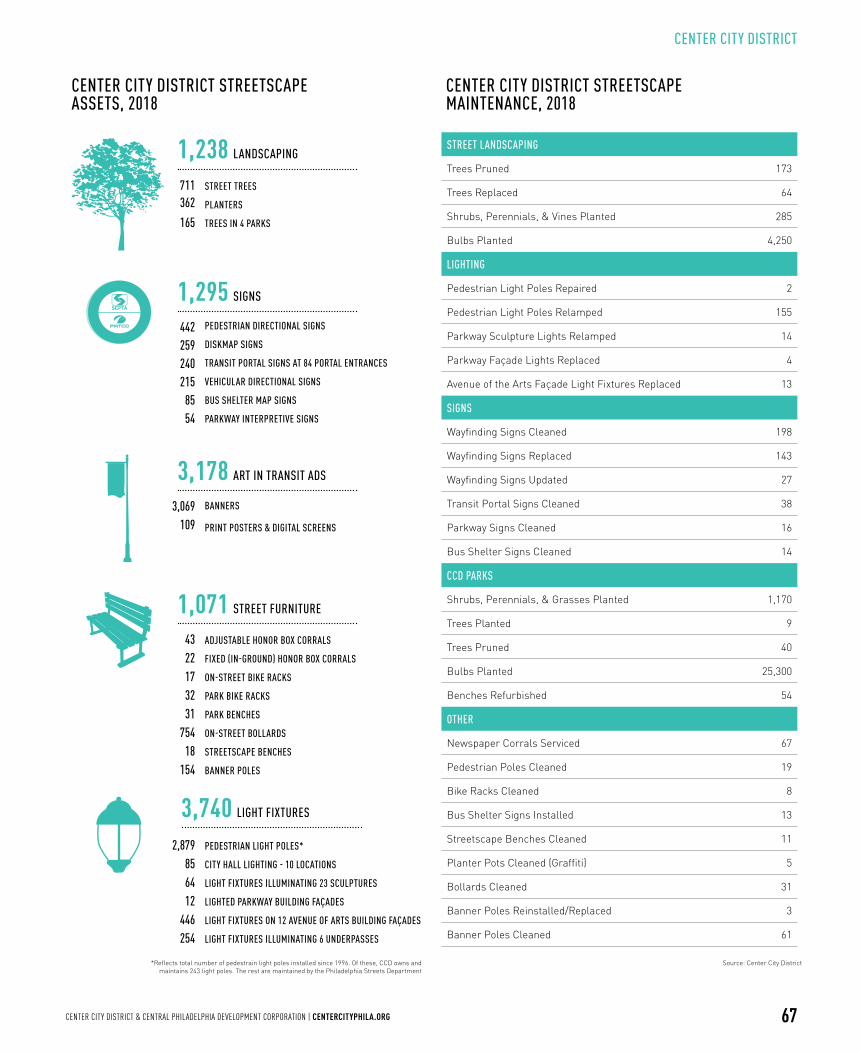
ATTRACTIVE: CCD continues to maintain and update the $148.5 million in capital improvements we have made in the district during the last two decades. This includes cleaning and updating 442 pedestrian directional signs, 240 transit portal signs, 85 bus shelter maps and 54 interpretative signs along the Benjamin Franklin Parkway. CCD maintains 243 of the 2,879 pedestrian light poles we installed in the district (the Philadelphia Streets Department services the remainder). Twenty-three sculptures, 12 Parkway building façades, and 12 Avenue of the Arts building façades are all lit through CCD capital investment.
CCD has planted 876 trees, including 165 in the four parks we manage. In 2018 alone, CCD planted 285 vines, shrubs and perennials, along with 4,250 bulbs. To further enhance the downtown streetscape, the Center City District Foundation (CCDF) has launched a new fundraising initiative, Plant Center City, to add 200 more trees in the central business district during the next two years. For more information on CCDF’s initiatives, visit www.supportccdf.org.
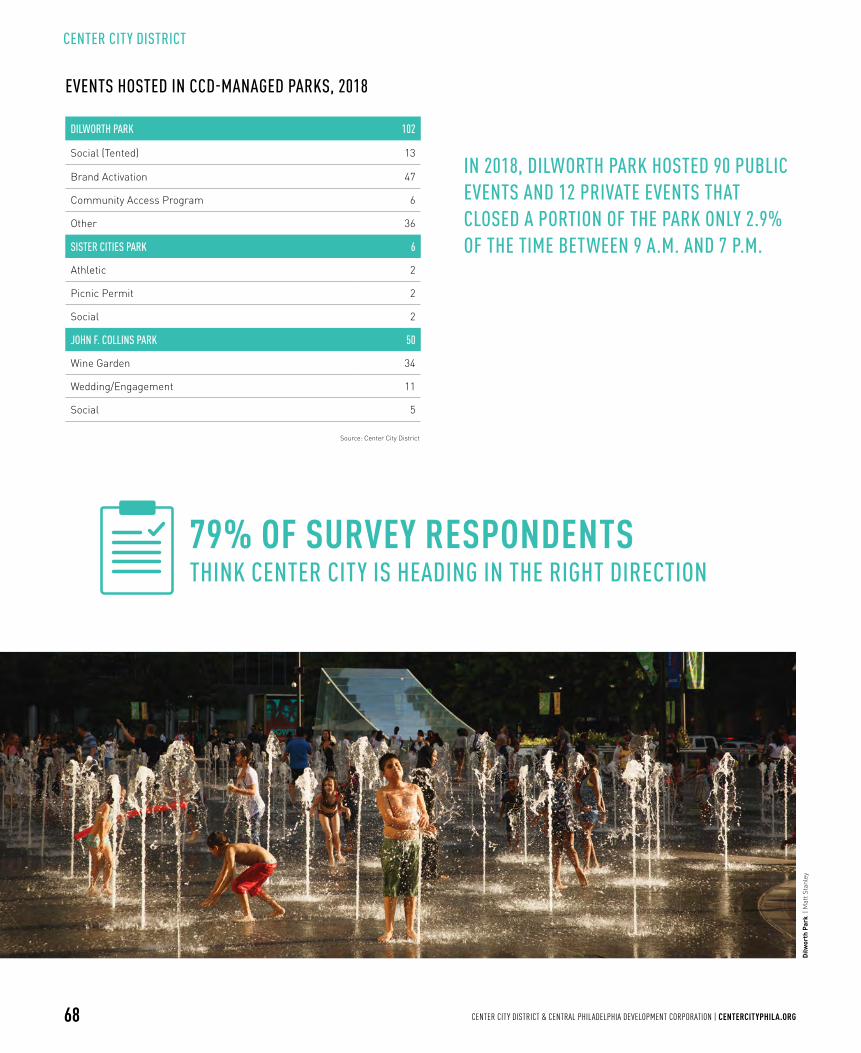
The number of events held in CCD’s four parks grew in 2018. John F. Collins Park experienced the largest jump in attendance from its summer-long Friday evening wine garden events. Dilworth Park hosted more than 100 events in 2018, ranging from programming for nonprofit organizations, free ice skating and group fitness sessions, free movies and musical performances, an arts fair, several craft markets featuring local artisans and brand activations. In December 2018, a record-breaking 1.3 million people visited Dilworth Park, the Rothman Orthopaedics Ice Rink, Wintergarden, Deck the Hall Light Show presented by Independence Blue Cross with 6abc, and Made in Philadelphia Holiday Market, pushing total annual attendance to 10.8 million.
The first phase of Pulse, a colorful and interactive public art installation by Janet Echelman, was activated within Dilworth Park’s fountain in 2018. The work became an instant hit with adults and children, earning widespread media attention locally and internationally. Phase I – the green line – follows the SEPTA trolley route beneath the park. In 2019, CCDF is actively fundraising for the final phases of the work that correspond to the Market-Frankford Line (blue) and the Broad Street Line (orange).
CCD also completed construction of the first phase of the Rail Park in 2018, transforming a blighted section of the former Reading Railroad Viaduct into an elevated park with walking paths, swinging benches, and expansive city views. CCD oversaw all planning, design and construction for this $10.8 million construction project, which is spurring growth in the Callowhill and Chinatown North neighborhoods, providing residents with an attractive new amenity.
Throughout the year, CCD promotes Center City as the region’s premier shopping and dining destination. During typically slow weeks in midwinter and early fall, Center City District Restaurant Week attracts thousands of city and suburban residents with specially-priced menus at more than 100 restaurants. The summer-long Center City District Sips campaign is similarly designed to encourage Philadelphia’s young professionals to patronize Center City restaurants and bars after work.
Shop Center City, a year-round campaign, promotes Center City’s unique retail mix to local shoppers through a diverse group of influencers and a robust social media campaign highlighting the eclectic mix of merchants and the unique shopping experience only found in Center City.
CENTER CITY DISTRICT
Each year, the Center City District conducts a Customer Satisfaction Survey. In October and November 2018, more than 6,000 postcards with an online link were distributed: 2,000 to pedestrians in Center City, 1,000 mailed to downtown commercial property owners and 3,200 to residential owners in the District. An ad for the survey appeared in the fall Digest, mailed to 9,632 business owners, workers and residents. A social media and email campaign through several CCD social media accounts spanned the eight-week period; four “special edition” emails were sent to all 93,000 of our email subscribers throughout the region. In addition, we conducted five days of on-street interviews at nine locations (Dilworth Park, 18th & Walnut, 13th & Sansom, 19th & Market, Comcast Center, 10th & Chestnut, 12th & Market, Collins Park, Sister Cities Park). In all, the CCD received 5,816 responses.

64 CENTER CITY DISTRICT & CENTRAL PHILADELPHIA DEVELOPMENT CORPORATION | CENTERCITYPHILA.ORG
0
5
10
15
20
20182017201620152014201320122011201020092008200720062005200420032002200120001999199819971996199519941993
NONVIOLENT CRIMES TOTAL PART 1 CRIMES
16.0 16.4
13.8 13.6
11.712.6
11.1 11.010.3 10.7
11.6 11.5 12.010.8 11.2 11.7 11.4
10.79.6 9.5 9.8
8.41.1
8.61.2
9.9
11.3
8.91.0
10.11.3
8.70.9
9.71.0
10.21.2
10.71.0
10.21.1
9.81.0
10.91.2
10.21.3
10.2
1.49.51.2
9.11.2
9.91.1
9.91.2
11.41.1
10.41.3
12.2
1.412.81.0
15.21.2
14.6
1.4
18.2
16.8
1.3
16.8
15.3
1.6
17.7
15.9
1.9
VIOLENT CRIMES
Source: Philadelphia Police Department
PART 1 CRIMES PER DAY IN THE CENTER CITY DISTRICT, 1993–2018
CENTER CITY HAS EXPERIENCED A SIGNIFICANT REDUCTION IN CRIME IN THE LAST 25 YEARS
(25-YEAR CHANGE, 1993-2018)
-90% THEFT FROM AUTO
-32% RETAIL THEFT
-36% SERIOUS CRIMES
CLEANLINESS OF CENTER CITY SIDEWALKS VS. OTHER PARTS OF PHILADELPHIA
Source: Center City District, 2018 Customer Satisfaction Survey
63%‘MUCH CLEANER’
MUCH CLEANER
ABOUT THE SAME
SOMEWHAT DIRTIER
MUCH DIRTIER
NOT SURE
63%26%
3%1%6%
147UNIFORMED CLEANING PERSONNEL AND SUPERVISORS
535BUILDING FACADES CLEANED OF GRAFFITI TAGS
CENTER CITY DISTRICT
65CENTER CITY DISTRICT & CENTRAL PHILADELPHIA DEVELOPMENT CORPORATION | CENTERCITYPHILA.ORG
Source: Center City District, 2018 Customer Satisfaction Survey
79%FEEL SAFE
“MOST OF THE TIME” OR “ALWAYS”
I ALWAYS FEEL SAFE
I FEEL SAFE MOST OF THE TIME
I OCCASIONALLYFEEL UNSAFE
I OFTEN FEEL UNSAFE
NOT SURE
19%
60%
17%
3%1%
PERCEPTIONS OF SAFETY IN CCD
CENTER CITY DISTRICT
WHY RESPONDENTS FEEL UNSAFE IN CCD
PANHANDLING
SLEEPING ON SIDEWALKS
33%
26%
26%
26%
16%
15%
Source: Center City District, 2018 Customer Satisfaction Survey
ABSENCE OF UNIFORMED PERSONNEL
THESE THINGS AREPART OF URBAN LIFE
AND DO NOT BOTHER ME
APPARENT ILLEGAL ACTIVITY
OTHER
COMMUNITY SERVICE REPRESENTATIVE CONTACTS
BESIDES LITTER, PLEASE TELL US WHICH ARE THE TWO BIGGEST PROBLEMS THAT DETRACT FROM THE APPEARANCE OF SIDEWALKS IN CENTER CITY?
215,293TOTAL CONTACTS
HOSPITALITY/AMBASSADOR
SECURITY/SAFETY
HOMELESS/PANHANDLERS
PUBLIC SPACE
BUSINESS CONTACT
FIRST AID/MEDICAL
Source: 2018 Daily Activity Logs, Center City District
137,695
48,751
26,603
1,631
536
77
215 ALERTS SENT
110+POLICE OFFICERS AND COMMUNITY SERVICE REPRESENTATIVES STAND JOINT ROLL CALL AND COORDINATE DEPLOYMENT
3,885INDIVIDUALS, BUSINESSES OR ORGANIZATIONS RECEIVING ALERTS
0%
10%
20%
30%
40%
50%
60%
70%
56% 34% 29%63%
Source: 2018 Customer Satisfaction Survey, Center City District
OVERFLOWING MUNICIPAL
TRASH CANS
COMMERCIAL AND RESIDENTIAL TRASH LEFT ON SIDE WALKS
DARK CIRCLES AND STAINS FROM DISCARDED
CHEWING GUM
GRAFFITI ON STREET FURNITURE

66 CENTER CITY DISTRICT & CENTRAL PHILADELPHIA DEVELOPMENT CORPORATION | CENTERCITYPHILA.ORG
CENTER CITY DISTRICT
AVERAGE SURVEY COUNT
JAN FEB MAR APR JUNMAY JUL AUG SEPT OCT NOV DEC
2018LAST 10 YEARS (AVG)
Source: Philadelphia Police Department
0
100
200
300
400
500
600
CENTER CITY PANHANDLING SURVEY, 2009–2018 (AVERAGE NUMBER OBSERVED PANHANDLING IN DAYTIME SURVEYS WITHIN CCD BOUNDARY)
CENTER CITY HOMELESS SURVEY (DAYTIME), 2009–2018 (AVERAGE NUMBER OBSERVED IN DAYTIME SURVEYS WITHIN CCD BOUNDARY)
HOMELESS SURVEY DATA (OVERNIGHT) (AVERAGE NUMBER OBSERVED IN OVERNIGHT SURVEYS WITHIN 6TH & 9TH POLICE DISTRICTS)
MONTH 2009 2010 2011 2012 2013 2014 2015 2016 2017 2018 10 YEAR AVERAGE
January 22 18 12 20 23 17 22 14 29 45 22
February 19 9 12 18 20 22 21 25 31 64 26
March 20 19 14 16 20 21 25 30 26 56 25
April 23 17 21 31 26 26 25 34 35 55 29
May 23 16 20 18 25 31 35 35 31 69 30
June 22 15 21 18 21 38 28 33 34 82 31
July 20 20 20 23 27 32 30 36 42 74 32
August 25 21 23 21 28 30 32 44 48 87 36
September 28 21 21 27 31 32 28 49 77 71 39
October 21 22 22 21 32 36 27 48 60 80 37
November 21 19 19 24 22 36 33 39 54 57 32
December 16 13 20 28 22 33 24 39 54 60 31
Yearly Average 22 18 19 22 25 29 27 35 44 66 31
MONTH 2009 2010 2011 2012 2013 2014 2015 2016 2017 2018 10 YEAR AVERAGE
January 27 36 19 26 29 22 17 26 39 58 27
February 38 19 44 61 16 61 16 39 50 62 38
March 36 48 33 74 42 23 25 43 62 62 43
April 49 62 53 42 50 65 32 59 50 102 51
May 63 68 69 59 46 63 33 55 44 111 55
June 61 89 84 43 66 101 35 55 47 127 64
July 74 49 71 66 58 95 46 71 73 108 67
August 75 63 72 95 92 125 67 91 181 137 95
September 72 69 60 88 76 46 56 81 136 115 76
October 72 61 56 95 61 78 45 75 152 90 77
November 66 26 44 48 76 28 53 78 81 46
December 27 24 29 41 37 22 54 64 84 79 42
Yearly Average 54 53 50 63 51 67 38 60 86 94 62
* No survey data for November 2010.
Source: Center City District
Source: Center City District
67CENTER CITY DISTRICT & CENTRAL PHILADELPHIA DEVELOPMENT CORPORATION | CENTERCITYPHILA.ORG
CENTER CITY PANHANDLING SURVEY, 2009–2018 (AVERAGE NUMBER OBSERVED PANHANDLING IN DAYTIME SURVEYS WITHIN CCD BOUNDARY) CENTER CITY DISTRICT STREETSCAPE ASSETS, 2018
*Reflects total number of pedestrain light poles installed since 1996. Of these, CCD owns and maintains 243 light poles. The rest are maintained by the Philadelphia Streets Department
711362
165
STREET TREES
PLANTERS
TREES IN 4 PARKS
1,238 LANDSCAPING
PEDESTRIAN DIRECTIONAL SIGNS
DISKMAP SIGNS
TRANSIT PORTAL SIGNS AT 84 PORTAL ENTRANCES
VEHICULAR DIRECTIONAL SIGNS
BUS SHELTER MAP SIGNS
PARKWAY INTERPRETIVE SIGNS
442259240215
8554
1,295 SIGNS
BANNERS
PRINT POSTERS & DIGITAL SCREENS
3,069 109
3,178 ART IN TRANSIT ADS
ADJUSTABLE HONOR BOX CORRALS
FIXED (IN-GROUND) HONOR BOX CORRALS
ON-STREET BIKE RACKS
PARK BIKE RACKS
PARK BENCHES
ON-STREET BOLLARDS
STREETSCAPE BENCHES
BANNER POLES
4322173231
75418
154
1,071 STREET FURNITURE
PEDESTRIAN LIGHT POLES*
CITY HALL LIGHTING - 10 LOCATIONS
LIGHT FIXTURES ILLUMINATING 23 SCULPTURES
LIGHTED PARKWAY BUILDING FAÇADES
LIGHT FIXTURES ON 12 AVENUE OF ARTS BUILDING FAÇADES
LIGHT FIXTURES ILLUMINATING 6 UNDERPASSES
2,879856412
446254
3,740 LIGHT FIXTURES
CENTER CITY DISTRICT STREETSCAPE MAINTENANCE, 2018
STREET LANDSCAPING
Trees Pruned 173
Trees Replaced 64
Shrubs, Perennials, & Vines Planted 285
Bulbs Planted 4,250
LIGHTING
Pedestrian Light Poles Repaired 2
Pedestrian Light Poles Relamped 155
Parkway Sculpture Lights Relamped 14
Parkway Façade Lights Replaced 4
Avenue of the Arts Façade Light Fixtures Replaced 13
SIGNS
Wayfinding Signs Cleaned 198
Wayfinding Signs Replaced 143
Wayfinding Signs Updated 27
Transit Portal Signs Cleaned 38
Parkway Signs Cleaned 16
Bus Shelter Signs Cleaned 14
CCD PARKS
Shrubs, Perennials, & Grasses Planted 1,170
Trees Planted 9
Trees Pruned 40
Bulbs Planted 25,300
Benches Refurbished 54
OTHER
Newspaper Corrals Serviced 67
Pedestrian Poles Cleaned 19
Bike Racks Cleaned 8
Bus Shelter Signs Installed 13
Streetscape Benches Cleaned 11
Planter Pots Cleaned (Graffiti) 5
Bollards Cleaned 31
Banner Poles Reinstalled/Replaced 3
Banner Poles Cleaned 61
Source: Center City District
CENTER CITY DISTRICT
68 CENTER CITY DISTRICT & CENTRAL PHILADELPHIA DEVELOPMENT CORPORATION | CENTERCITYPHILA.ORG
CENTER CITY DISTRICT
Source: Center City District
DILWORTH PARK 102
Social (Tented) 13
Brand Activation 47
Community Access Program 6
Other 36
SISTER CITIES PARK 6
Athletic 2
Picnic Permit 2
Social 2
JOHN F. COLLINS PARK 50
Wine Garden 34
Wedding/Engagement 11
Social 5
EVENTS HOSTED IN CCD-MANAGED PARKS, 2018
Dilw
orth
Par
k |
Mat
t Sta
nley
IN 2018, DILWORTH PARK HOSTED 90 PUBLIC EVENTS AND 12 PRIVATE EVENTS THAT CLOSED A PORTION OF THE PARK ONLY 2.9% OF THE TIME BETWEEN 9 A.M. AND 7 P.M.
79% OF SURVEY RESPONDENTSTHINK CENTER CITY IS HEADING IN THE RIGHT DIRECTION
69CENTER CITY DISTRICT & CENTRAL PHILADELPHIA DEVELOPMENT CORPORATION | CENTERCITYPHILA.ORG
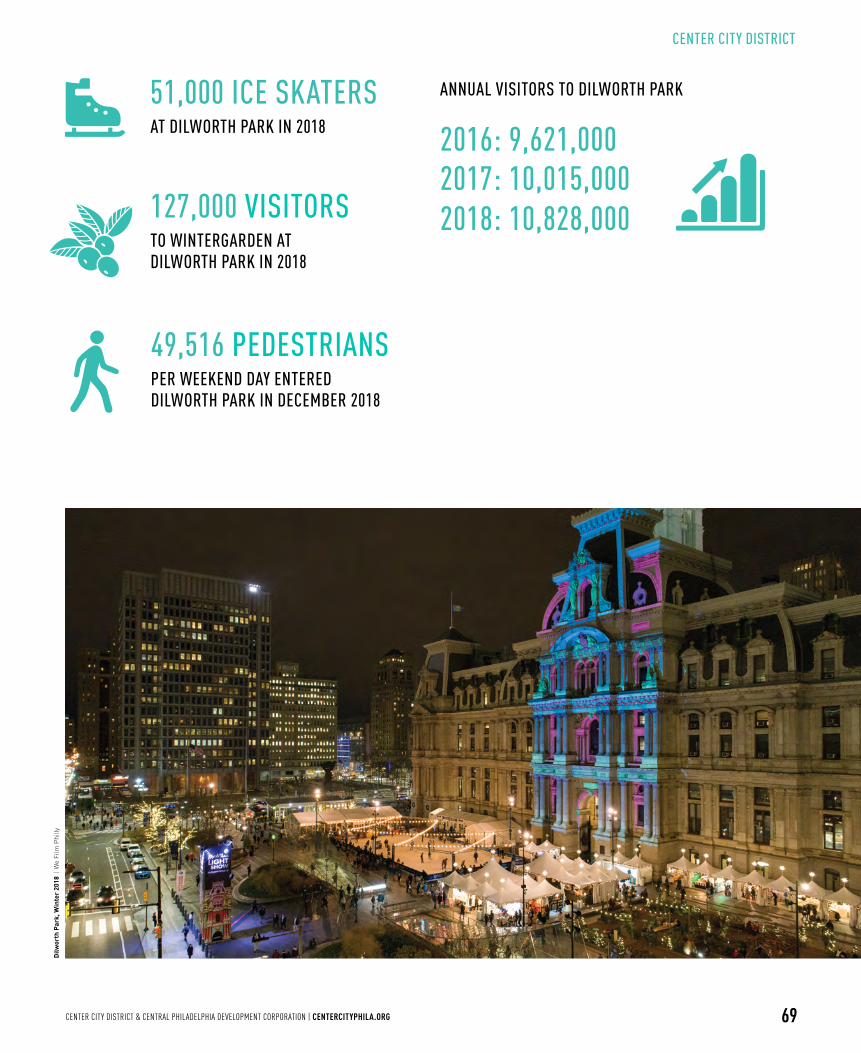
ANNUAL VISITORS TO DILWORTH PARK
2016: 9,621,000 2017: 10,015,000 2018: 10,828,000
51,000 ICE SKATERS AT DILWORTH PARK IN 2018
49,516 PEDESTRIANS PER WEEKEND DAY ENTERED DILWORTH PARK IN DECEMBER 2018
127,000 VISITORS TO WINTERGARDEN AT DILWORTH PARK IN 2018
CENTER CITY DISTRICTD
ilwor
th P
ark,
Win
ter
2018
| W
e Fi
lm P
hilly
70 CENTER CITY DISTRICT & CENTRAL PHILADELPHIA DEVELOPMENT CORPORATION | CENTERCITYPHILA.ORG
CENTER CITY DISTRICT
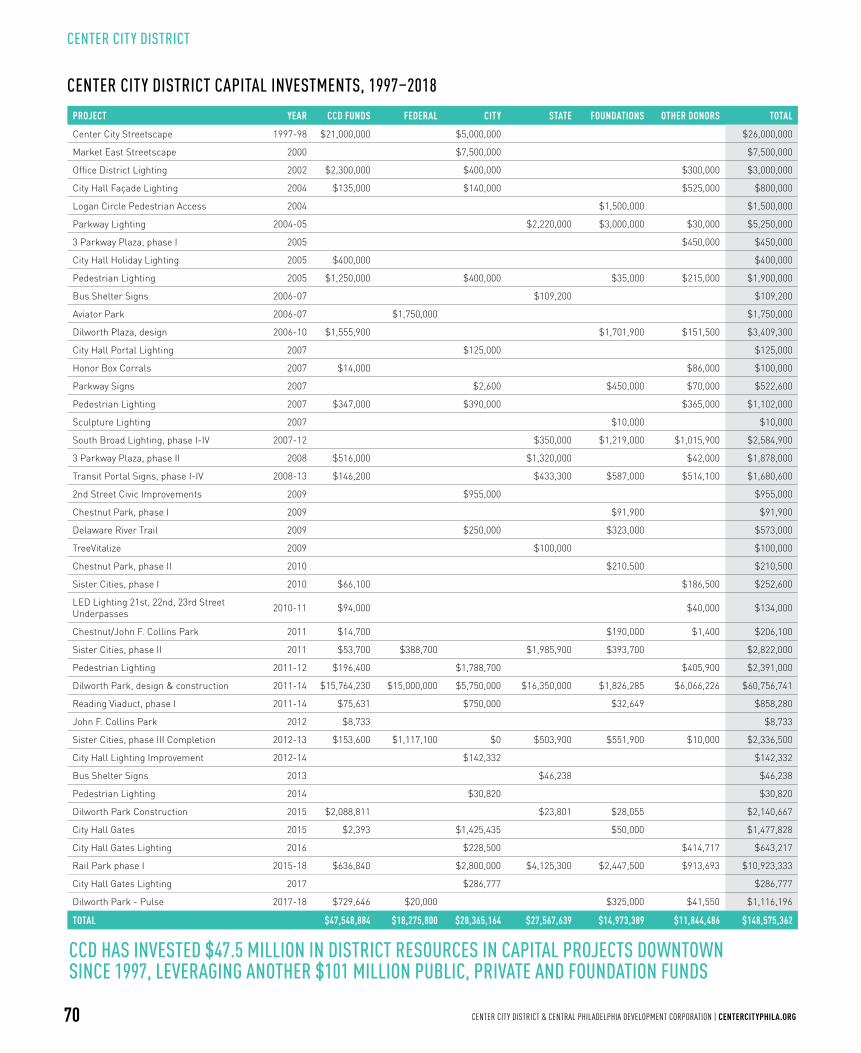
PROJECT YEAR CCD FUNDS FEDERAL CITY STATE FOUNDATIONS OTHER DONORS TOTAL
Center City Streetscape 1997-98 $21,000,000 $5,000,000 $26,000,000
Market East Streetscape 2000 $7,500,000 $7,500,000
Office District Lighting 2002 $2,300,000 $400,000 $300,000 $3,000,000
City Hall Façade Lighting 2004 $135,000 $140,000 $525,000 $800,000
Logan Circle Pedestrian Access 2004 $1,500,000 $1,500,000
Parkway Lighting 2004-05 $2,220,000 $3,000,000 $30,000 $5,250,000
3 Parkway Plaza, phase I 2005 $450,000 $450,000
City Hall Holiday Lighting 2005 $400,000 $400,000
Pedestrian Lighting 2005 $1,250,000 $400,000 $35,000 $215,000 $1,900,000
Bus Shelter Signs 2006-07 $109,200 $109,200
Aviator Park 2006-07 $1,750,000 $1,750,000
Dilworth Plaza, design 2006-10 $1,555,900 $1,701,900 $151,500 $3,409,300
City Hall Portal Lighting 2007 $125,000 $125,000
Honor Box Corrals 2007 $14,000 $86,000 $100,000
Parkway Signs 2007 $2,600 $450,000 $70,000 $522,600
Pedestrian Lighting 2007 $347,000 $390,000 $365,000 $1,102,000
Sculpture Lighting 2007 $10,000 $10,000
South Broad Lighting, phase I-IV 2007-12 $350,000 $1,219,000 $1,015,900 $2,584,900
3 Parkway Plaza, phase II 2008 $516,000 $1,320,000 $42,000 $1,878,000
Transit Portal Signs, phase I-IV 2008-13 $146,200 $433,300 $587,000 $514,100 $1,680,600
2nd Street Civic Improvements 2009 $955,000 $955,000
Chestnut Park, phase I 2009 $91,900 $91,900
Delaware River Trail 2009 $250,000 $323,000 $573,000
TreeVitalize 2009 $100,000 $100,000
Chestnut Park, phase II 2010 $210,500 $210,500
Sister Cities, phase I 2010 $66,100 $186,500 $252,600
LED Lighting 21st, 22nd, 23rd Street Underpasses 2010-11 $94,000 $40,000 $134,000
Chestnut/John F. Collins Park 2011 $14,700 $190,000 $1,400 $206,100
Sister Cities, phase II 2011 $53,700 $388,700 $1,985,900 $393,700 $2,822,000
Pedestrian Lighting 2011-12 $196,400 $1,788,700 $405,900 $2,391,000
Dilworth Park, design & construction 2011-14 $15,764,230 $15,000,000 $5,750,000 $16,350,000 $1,826,285 $6,066,226 $60,756,741
Reading Viaduct, phase I 2011-14 $75,631 $750,000 $32,649 $858,280
John F. Collins Park 2012 $8,733 $8,733
Sister Cities, phase III Completion 2012-13 $153,600 $1,117,100 $0 $503,900 $551,900 $10,000 $2,336,500
City Hall Lighting Improvement 2012-14 $142,332 $142,332
Bus Shelter Signs 2013 $46,238 $46,238
Pedestrian Lighting 2014 $30,820 $30,820
Dilworth Park Construction 2015 $2,088,811 $23,801 $28,055 $2,140,667
City Hall Gates 2015 $2,393 $1,425,435 $50,000 $1,477,828
City Hall Gates Lighting 2016 $228,500 $414,717 $643,217
Rail Park phase I 2015-18 $636,840 $2,800,000 $4,125,300 $2,447,500 $913,693 $10,923,333
City Hall Gates Lighting 2017 $286,777 $286,777
Dilworth Park - Pulse 2017-18 $729,646 $20,000 $325,000 $41,550 $1,116,196
TOTAL $47,548,884 $18,275,800 $28,365,164 $27,567,639 $14,973,389 $11,844,486 $148,575,362
CENTER CITY DISTRICT CAPITAL INVESTMENTS, 1997–2018
CCD HAS INVESTED $47.5 MILLION IN DISTRICT RESOURCES IN CAPITAL PROJECTS DOWNTOWN SINCE 1997, LEVERAGING ANOTHER $101 MILLION PUBLIC, PRIVATE AND FOUNDATION FUNDS


