Cell targeting and imaging using magnetic nanoparticlesdiscovery.ucl.ac.uk/20179/1/20179.pdf ·...
228
Cell targeting and imaging using magnetic nanoparticles Panagiotis Kyrtatos Submitted for the degree of Doctor of Philosophy in Biophysics September 2009 Royal College of Surgeons Unit of Biophysics, Institute of Child Health and Centre for Advanced Biomedical Imaging, Department of Medicine & Institute of Child Health University College London
Transcript of Cell targeting and imaging using magnetic nanoparticlesdiscovery.ucl.ac.uk/20179/1/20179.pdf ·...

Cell targeting and imaging
using magnetic nanoparticles
Panagiotis Kyrtatos
Submitted for the degree of
Doctor of Philosophy in Biophysics
September 2009
Royal College of Surgeons Unit of Biophysics,
Institute of Child Health
and
Centre for Advanced Biomedical Imaging,
Department of Medicine & Institute of Child Health
University College London

- 2 -
DDEECCLLAARRAATTIIOONN
I, Panagiotis Kyrtatos, confirm that the work presented in this thesis is my own work,
except where acknowledged in the text. This work is based on research that was
undertaken by me at University College London, during the period 1st January 2006 to
20th September 2009.
Panagiotis Kyrtatos
7th June 2010

- 3 -
AABBSSTTRRAACCTT
BACKGROUND AND AIMS. The success of stem cell therapies partly depends on the
ability to deliver the cells to the site of injury. Circulating endothelial progenitor cells
(EPCs) are involved in physiological processes such as vascular re-endothelialisation
and post-ischaemic neovascularisation and have been utilised in several clinical trials.
Superparamagnetic iron oxide particles have previously been used to label and track
cells using magnetic resonance imaging (MRI), as well as to magnetically attract drugs
and cells to desired sites. The aim of this PhD was to develop a methodology to
magnetically attract EPCs, labelled with a clinically approved iron oxide agent, to a site
of arterial injury using magnetic fields originating outside the body.
METHODS AND RESULTS. Human EPCs were cultured in the presence of iron oxide
superparamagnetic nanoparticles. A labelling method was developed that retained cell
survival and differentiation, as indicated by metabolic activity and flow cytometry
assays, as well as MRI visibility. Finite element modelling (FEM) computer simulations
were performed to investigate the interaction of magnetic forces with hydrodynamic
drag forces. FEM indicated successful external magnetic cell targeting from a vessel
with flow rate similar to a rat common carotid artery; correspondingly there was a 6-
fold increase in cell capture in an in vitro flow system. Angioplasty was performed on
rat common carotid arteries to denude the endothelium and EPCs were administered
with and without the presence of the external magnetic device during a 10 minute period
of flow cessation. Targeting enhanced cell retention at the site of injury by 5-fold.
CONCLUSIONS. Using an externally applied magnetic device, it is possible to enhance
EPC localisation in a flowing sytem in vitro and to a flow-isolated site of common
carotid artery injury in vivo, without affecting cell viability or differentiation in culture.
This technology could be more widely adapted to localise and monitor cells in other
organs and may provide a useful tool for systemic injection of cell therapies.

- 4 -
AACCKKNNOOWWLLEEDDGGEEMMEENNTTSS
First and foremost I am indebted to my close collaborators on this project, Dr Ana
Garcia-Prieto and Dr Manfred Junemann-Ramirez. Their presence opened up new
frontiers in the development of this truly multi-disciplinary work. Without their help
and support, some the studies presented here would have been impossible to surmount.
My supervisors Dr Mark Lythgoe, Professor Quentin Pankhurst and Dr Pauliina
Lehtolainen, as well as Professor David Gadian, have provided endless support
throughout the project, and have made my PhD studies a truly enjoyable experience,
both in and outside of the lab. They have provided a working environment that would
be envied by many, such that I will always miss being their student.
Many thanks also go to all the students and post-docs that I had the pleasure to meet and
work with throughout my studies, in particular (but in no particular order!) Mankin
Choy, Ken Cheung, Jon Orlando Solas Hawke Cleary, Rachael Dobson, Jack Wells,
Michael Loebinger, Mathew Kallumadil, Paul Southern, Tamsin Langley, Kim Vigor,
Bernard Siow, Martin King, Anthony Price Tatjana Holland and Johannes Riegler.
Special thanks to Stuart Ings for his endless help in acquiring blood samples.
I am also especially thankful to Sally Dowsett and Sati Sahota at the RCS Unit of
Biophysics in ICH, whose endless assistance has accompanied me since my first hours
at the department. There was never a day they did not greet me with a smile.
I am grateful for the financial support provided from the Institute of Child Health Child
Health Research Appeal Trust (CHRAT) and the Alexander S. Onassis Public Benefit
Foundation, as well as the Biotechnology and Biomedical Sciences Research Council
grant. Without them, my endeavours in academic medicine would have been in vain.
Finally, my eternal gratitude to my family, for I am who they made me be.

- 5 -
PPUUBBLLIICCAATTIIOONNSS AARRIISSIINNGG FFRROOMM TTHHIISS TTHHEESSIISS
Kyrtatos PG, Lehtolainen P, Junemann-Ramirez M, Garcia-Prieto A, Price AN, Martin
JF, Gadian DG, Pankhurst QA, Lythgoe MF. Magnetic tagging increases delivery of
circulating progenitors in vascular injury. JACC Cardiovasc Interv. 2009; 2(8):794-802.
Published abstracts:
Kyrtatos P et al. Magnetic targeting of stem cells to a site of vascular injury using an
MRI contrast agent. 16th Annual Meeting of the International Society for Magnetic
Resonance in Medicine (ISMRM). May 2008. Toronto, Canada
Kyrtatos P et al. Magnetic targeting of stem cells to a site of vascular injury using an
MRI contrast agent. 13th Annual Meeting of the British Chapter of the ISMRM.
September 2007. Birmingham, United Kingdom
Kyrtatos P et al. Ferumoxide labelling of CD133+ cells for targeted re-
endothelialisation. 15th Annual Meeting of the ISMRM. May 2007. Berlin, Germany
Kyrtatos P et al. Magnetic targeting of stem cells for endothelial regeneration using an
MRI contrast agent. 16th Annual Nuclear Magnetic Resonance Symposium. March
2007. Oxford, United Kingdom

- 6 -
TTHHEESSIISS OOUUTTLLIINNEE
This thesis deals with the development of a method for magnetic attraction of cells to a
desired site in the body, using external magnetic fields. Specifically, endothelial
progenitor cells are investigated, as they are thought to play an important role in the
vascular healing process. The thesis is comprised of three introductory chapters and four
experimental chapters.
Chapter 1 is an introduction to stem cells and cardiovascular disease, in particular
atherosclerosis and the role of the endothelial progenitor cells in maintaining the
vasculature. Here I present animal studies and clinical trials that investigate the utility of
these cells, as well as the need for specific cell targeting and current targeting strategies.
Chapter 2 deals with the current use of superparamagnetic iron oxide particles for cell
labelling, particularly in the context of magnetic resonance imaging. In this section I
describe the basics of magnetic resonance imaging and generation of image contrast,
and review cell labelling methodologies.
Chapter 3 starts with a review of the utility of magnetic targeting in the medical
sciences, after which I deal with the basic concepts of magnetism and fluid dynamics
used in within the thesis.
In Chapters 4 and 5 I present the development of a labelling methodology, called
“differential labelling”, which is particularly concerned with the maintenance of cell
viability after magnetic attraction.
Chapter 6 describes my studies on the development of a suitable magnetic device,
computer modelling and in vitro testing, in both static and flowing scenarios.
In Chapter 7 an animal study is presented, which was designed to mimic the current
methodology used in clinical trials for the administration of progenitor cells in the heart.
In this study I investigated whether magnetic targeting can enhance cell delivery in vivo.

- 7 -
TTAABBLLEE OOFF CCOONNTTEENNTTSS
Declaration _________________________________________________________ - 2 -
Abstract____________________________________________________________ - 3 -
Acknowledgements___________________________________________________ - 4 -
Publications arising from this thesis _____________________________________ - 5 -
Thesis outline _______________________________________________________ - 6 -
Table of contents ____________________________________________________ - 7 -
List of figures ______________________________________________________ - 11 -
List of tables _______________________________________________________ - 13 -
Abbreviations ______________________________________________________ - 14 -
CHAPTER 1 _______________________________________________________ - 15 -
Stem cells and cardiovascular disease___________________________________ - 15 - 1.1 Introduction ________________________________________________________- 16 - 1.2 Stem cells – an overview ______________________________________________- 18 -
1.2.1 Embryonic stem cells_____________________________________________________ - 18 - 1.2.2 Adult stem cells _________________________________________________________ - 19 -
1.3 Cardiovascular disease _______________________________________________- 24 - 1.3.1 The burden of cardiovascular diseases _______________________________________ - 24 - 1.3.2 Atherosclerosis _________________________________________________________ - 24 -
1.4 Endothelial progenitor cells in cardiovascular disease _____________________- 37 - 1.4.1 Introduction ____________________________________________________________ - 37 - 1.4.2 Emergence of the term ‘EPC’ ______________________________________________ - 38 - 1.4.3 Identifying the EPC ______________________________________________________ - 38 - 1.4.4 Role of the EPC _________________________________________________________ - 42 - 1.4.5 Mobilisation and homing of EPCs to sites of injury _____________________________ - 43 - 1.4.6 Enhancing recruitment, homing and retention of EPCs___________________________ - 45 -
1.5 Summary __________________________________________________________- 48 -
CHAPTER 2 _______________________________________________________ - 50 - 2.1 Introduction ________________________________________________________- 51 - 2.2 Basic principles of MRI_______________________________________________- 52 -
2.2.1 The source of the signal that produces the image _______________________________ - 52 - 2.2.2 Nuclear magnetic resonance _______________________________________________ - 52 - 2.2.3 Relaxation _____________________________________________________________ - 55 - 2.2.4 Acquiring the signal______________________________________________________ - 57 - 2.2.5 Spatial localisation of the MR signal_________________________________________ - 58 -
2.3 Superparamagnetic MRI contrast agents ________________________________- 60 - 2.3.1 Introduction ____________________________________________________________ - 60 - 2.3.2 Endorem for in vivo contrast enhancement in humans ___________________________ - 62 -

- 8 -
2.3.3 SPIOs for cellular tracking in vivo___________________________________________ - 62 - 2.3.4 In vitro SPIO labelling methods ____________________________________________ - 65 -
2.4 Summary __________________________________________________________- 66 -
CHAPTER 3 _______________________________________________________ - 67 - 3.1 Introduction ________________________________________________________- 68 - 3.2 Magnetic targeting in medicine ________________________________________- 69 -
3.2.1 Laboratory uses of magnetic targeting________________________________________ - 69 - 3.2.2 Magnetic drug targeting___________________________________________________ - 69 - 3.2.3 Magnetic cell targeting ___________________________________________________ - 70 -
3.3 Basics of magnetics __________________________________________________- 76 - 3.3.1 Magnetic fields _________________________________________________________ - 76 - 3.3.2 Magnetisation of materials_________________________________________________ - 78 - 3.3.3 Magnetic forces _________________________________________________________ - 82 -
3.4 Fluid dynamics______________________________________________________- 86 - 3.4.1 Introduction ____________________________________________________________ - 86 - 3.4.2 Basic concepts __________________________________________________________ - 86 - 3.4.3 Turbulent vs laminar flow _________________________________________________ - 87 - 3.4.4 Hydrodynamic drag on a sphere ____________________________________________ - 91 -
3.5 Summary __________________________________________________________- 93 -
CHAPTER 4 _______________________________________________________ - 94 - 4.1 Chapter overview____________________________________________________- 95 - 4.2 – Part I: Labelling CD133 cells with Endorem® __________________________- 96 -
4.2.1 Background and aims ____________________________________________________ - 96 - 4.2.2 Methods _______________________________________________________________ - 98 - 4.2.3 Results _______________________________________________________________ - 104 - 4.2.4 Discussion ____________________________________________________________ - 109 - 4.2.5 Conclusions ___________________________________________________________ - 112 -
4.3 – Part II: Magnetic attraction and viability _____________________________- 113 - 4.3.1 Background and aims ___________________________________________________ - 113 - 4.3.2 Methods ______________________________________________________________ - 115 - 4.3.3 Results _______________________________________________________________ - 117 - 4.3.4 Discussion ____________________________________________________________ - 126 - 4.3.5 Conclusions ___________________________________________________________ - 127 -
CHAPTER 5 ______________________________________________________ - 128 - 5.1 Introduction _______________________________________________________- 129 - 5.2 Methods __________________________________________________________- 130 -
5.2.1 Cell culture and labelling_________________________________________________ - 130 - 5.2.2 Viability assay after 10min attraction with stacked magnets______________________ - 130 - 5.2.3 Water evaporation ______________________________________________________ - 131 - 5.2.4 Growth assay post DfL and magnetic attraction _______________________________ - 131 -

- 9 -
5.2.5 Apoptosis assays _______________________________________________________ - 131 - 5.2.6 Flow cytometry for cell differentiation ______________________________________ - 132 - 5.2.7 SQUID for iron quantification_____________________________________________ - 133 - 5.2.8 In vitro MRI___________________________________________________________ - 133 - 5.2.9 Statistical analyses______________________________________________________ - 134 -
5.3 Results____________________________________________________________- 135 - 5.3.1 Viability assay after 10min attraction with stacked magnets______________________ - 135 - 5.3.2 Cellular growth after DfL and magnetic attraction _____________________________ - 136 - 5.3.3 Cellular apoptosis after differential labelling__________________________________ - 137 - 5.3.4 Cellular apoptosis after magnetic attraction___________________________________ - 138 - 5.3.5 Cell differentiation after differential labelling_________________________________ - 140 - 5.3.6 Iron quantification using SQUID___________________________________________ - 142 - 5.3.7 Estimation of a cell-safe magnetic force _____________________________________ - 145 - 5.3.8 In vitro MRI___________________________________________________________ - 146 -
5.4 Discussion _________________________________________________________- 147 - 5.4.1 Main findings__________________________________________________________ - 147 - 5.4.2 Magnetic forces ________________________________________________________ - 147 - 5.4.3 Cell viability and differentiation ___________________________________________ - 148 -
5.5 Conclusions _______________________________________________________- 150 -
CHAPTER 6 ______________________________________________________ - 151 - 6.1 Introduction _______________________________________________________- 152 - 6.2 Methods __________________________________________________________- 153 -
6.2.1 Cell culture ___________________________________________________________ - 153 - 6.2.2 In vitro actuation in a static liquid __________________________________________ - 154 - 6.2.3 Magnetic actuator (Halbach array) _________________________________________ - 154 - 6.2.4 Computer simulations ___________________________________________________ - 154 - 6.2.5 In vitro flow system_____________________________________________________ - 155 - 6.2.6 Statistical analyses______________________________________________________ - 155 -
6.3 Results____________________________________________________________- 156 - 6.3.1 Cell actuation in a static liquid ____________________________________________ - 156 - 6.3.2 Design and construction of the magnetic actuator ______________________________ - 158 - 6.3.3 Effect of the SPIO magnetisation saturation __________________________________ - 161 - 6.3.4 Consideration of the ‘cell-safe’ force _______________________________________ - 163 - 6.3.5 Finite element modelling of cell targeting ____________________________________ - 165 - 6.3.6 In vitro flow system_____________________________________________________ - 167 -
6.4 Discussion _________________________________________________________- 173 - 6.4.1 Main findings__________________________________________________________ - 173 - 6.4.2 Fluid dynamics simulations _______________________________________________ - 173 - 6.4.3 In vitro flow system_____________________________________________________ - 174 -
6.5 Conclusions _______________________________________________________- 177 -
CHAPTER 7 ______________________________________________________ - 178 -

- 10 -
7.1 Introduction _______________________________________________________- 179 - 7.2 Methods __________________________________________________________- 180 -
7.2.1 Cell culture and Endorem® labelling _______________________________________ - 180 - 7.2.2 Vascular injury ________________________________________________________ - 180 - 7.2.3 Cell administration and magnetic targeting ___________________________________ - 180 - 7.2.4 Confocal microscopy____________________________________________________ - 181 - 7.2.5 Quantification of cell engraftment__________________________________________ - 181 - 7.2.6 Statistical analyses______________________________________________________ - 181 -
7.3 Results____________________________________________________________- 182 - 7.3.1 Methodological setup____________________________________________________ - 182 - 7.3.2 CD133 cell engraftment to the rat common carotid artery _______________________ - 184 -
7.4 Discussion _________________________________________________________- 188 - 7.5 Conclusions _______________________________________________________- 190 -
Thesis summary ___________________________________________________ - 191 -
Bibliography ______________________________________________________ - 195 -
Appendix A - Methodological developments_____________________________ - 216 -
Appendix B - Full Tables____________________________________________ - 222 -
Appendix C - MTS assay ____________________________________________ - 226 -
- 11 -
LLIISSTT OOFF FFIIGGUURREESS
Figure 1.1 – Prometheus and Atlas, ca. 550 BC _________________________________- 17 - Figure 1.2 – Stem cells and their progeny in adult tissue __________________________- 20 - Figure 1.3 – Anatomy of the artery ___________________________________________- 26 - Figure 1.4 – Lesion initiation ________________________________________________- 28 - Figure 1.5 – Development of the ‘fatty streak’ __________________________________- 28 - Figure 1.6 – Advanced lesion ________________________________________________- 30 - Figure 1.7 – Unstable lesion_________________________________________________- 30 - Figure 1.8 – PCI. a) PTCA b) PTCA + stenting _________________________________- 33 - Figure 1.9 – In-stent stenosis due to NI formation _______________________________- 35 - Figure 1.10 – Origin and differentiation of the EPC _____________________________- 41 - Figure 1.11 – Mobilisation and homing of EPCs in neo-vascularisation _____________- 44 - Figure 2.1 – The source of net magnetisation ___________________________________- 54 - Figure 2.2 – Precession and application of a 90o RF pulse ________________________- 54 - Figure 2.3 – T1 relaxation___________________________________________________- 56 - Figure 2.4 – T2 relaxation___________________________________________________- 56 - Figure 2.5 – Endorem® structure and superparamagnetism _______________________- 61 - Figure 2.6 – Contrast enhancement of liver lesions using Endorem®________________- 63 - Figure 2.7 – MR visualisation of CD34+ cells in the mouse bone marrow ____________- 64 - Figure 2.8 – MRI of CD133+ cells trafficking to a site of tumour angiogenesis ________- 64 - Figure 3.1 – Magnetic cell spelling ___________________________________________- 72 - Figure 3.2 – Star formations with magnetic cells ________________________________- 72 - Figure 3.3 – Magnetic field around a moving electron____________________________- 77 - Figure 3.4 – Magnetic field around a permanent magnet__________________________- 77 - Figure 3.5 – Magnetisation vs magnetic field strength (M-H) curves ________________- 81 - Figure 3.6 – SQUID M-H curve of a sample of Endorem® ________________________- 85 - Figure 3.7 – Laminar and turbulent flow visualisation ___________________________- 88 - Figure 3.8 – Choice of velocity and length scales used in calculating Re _____________- 88 - Figure 3.9 – Parabolic flow between two parallel plates___________________________- 90 - Figure 3.10 – The relationship between CD and Re_______________________________- 92 - Figure 3.11 – The Khan and Richardson prediction for CD ________________________- 92 - Figure 4.1 – PrB stain of whole d11-CD133 population__________________________- 100 - Figure 4.2 – PrB stain of adherent d11-CD133s. _______________________________- 100 - Figure 4.3 – PrB positivity of CD133 cell subtypes ______________________________- 104 - Figure 4.4 – Bland-Altman plot of two counts__________________________________- 106 - Figure 4.5 – Labelling timecourse - cellular iron content_________________________- 108 - Figure 4.6 – Design and construction of the magnetic plate ______________________- 118 - Figure 4.7 – Particle attraction toward the magnet edges_________________________- 119 - Figure 4.8 – Placement of cell samples on top of disk magnets ____________________- 120 - Figure 4.9 – Increase in applied force with stacked configuration _________________- 121 - Figure 4.10 – Viability of StL cells following 24h magnetic attraction ______________- 122 - Figure 4.11 – Viability following 24h magnetic attraction ________________________- 124 - Figure 4.12 – Photomicrographs of cells following magnetic actuation _____________- 125 -

- 12 -
Figure 5.1– MTS assays following 10 min magnetic attraction of DfL cells __________- 135 - Figure 5.2 – Cell proliferation post DfL and magnetic attraction __________________- 136 - Figure 5.3 – Apoptosis rates after differential labelling __________________________- 137 - Figure 5.4 – Apoptosis differences after differential labelling _____________________- 137 - Figure 5.5 – Apoptosis rates after magnetic attraction ___________________________- 138 - Figure 5.6 – Apoptosis difference after magnetic attraction_______________________- 138 - Figure 5.7 – Sample cytometry scatterplots for the apoptosis assays ________________- 139 - Figure 5.8 – Surface marker expression after DfL ______________________________- 140 - Figure 5.9 – Sample cytometry scatterplots for the CD14 surface marker analysis_____- 141 - Figure 5.10 – SQUID loop of an Endorem® sample at 300K. _____________________- 142 - Figure 5.11 – Close up of SQUID loop for Endorem® at 300K ____________________- 142 - Figure 5.12 – Close up of SQUID loop for Endorem® at 10K _____________________- 143 - Figure 5.13 – Close up of SQUID loop for 5x10⁵ DfL cells at 10K _________________- 143 - Figure 5.14 – In vitro MRI phantom of DfL-CD133s ____________________________- 146 - Figure 6.1 – Actuation of Endorem®-labelled MNC in a static suspension __________- 157 - Figure 6.2 – Halbach array ________________________________________________- 159 - Figure 6.3 - Halbach array versus disk magnets _______________________________- 160 - Figure 6.4 – Magnetic field strength and magnetisation saturation_________________- 161 - Figure 6.5 – Selection of force expression_____________________________________- 162 - Figure 6.6 – Switch in force expression_______________________________________- 162 - Figure 6.7 – Magnetic force on cells: Halbach vs disk magnets____________________- 164 - Figure 6.8 – The constructed 5-magnet array __________________________________- 164 - Figure 6.9 – FEM simulation: cell capture at 1mm _____________________________- 165 - Figure 6.10 – Cell capture simulations at 1mm and 5mm ________________________- 166 - Figure 6.11 – In vitro flow system setup ______________________________________- 167 - Figure 6.12 – Cell capture at 1mm, 1ml/min ___________________________________- 168 - Figure 6.13 – Forces along 1mm horizontal line _______________________________- 170 - Figure 6.14 – Cell capture at 1mm with 10ml/min flow __________________________- 170 - Figure 6.15 – Cell capture counts at 1mm with 10ml/min flow ____________________- 171 - Figure 6.16 – Targeting at 5mm_____________________________________________- 172 - Figure 7.1 – Methodological setup___________________________________________- 183 - Figure 7.2 – Representative CCA confocal scans _______________________________- 185 - Figure 7.3 – Confocal image of a single DfL-CD133 ____________________________- 186 - Figure 7.4 – Count of cells adherent on rat CCA lumen__________________________- 187 - Figure A.1 - Absorbance profile of Prussian Blue ______________________________- 217 - Figure A.2 - Prussian blue with lysis buffer ___________________________________- 218 - Figure A.3 – Labelling timecourse - absorbance at 690nm _______________________- 219 - Figure A.4 – Standard curve for iron quantification ____________________________- 220 - Figure A.5 – Water evaporation in 96-well plates _______________________________- 221 - Figure C.1 – MTS assay absorbance at 490nm _________________________________- 227 -

- 13 -
LLIISSTT OOFF TTAABBLLEESS
Table 4.1 – Count-recount of PrB positive cells ________________________________- 106 - Table 4.2 – Comparison of viability after magnetic attraction: StL vs DfL ___________- 124 - Table 5.1 – FACS settings__________________________________________________- 132 - Table 5.2 – Cell proliferation post DfL and magnetic attraction ___________________- 136 - Table A.1 – Prussian blue with lysis buffer ____________________________________- 218 - Table A.2 – Labelling timecourse - absorbance at 690nm ________________________- 219 - Table A.3 - Labelling timecourse - estimation of cellular iron content ______________- 220 - Table A.4 – Water evaporation in 96-well plates ________________________________- 221 - Table B.1 – Full table for Figure 4.5 _________________________________________- 223 - Table B.2 – Full table for Figure 5.3 _________________________________________- 224 - Table B.3 – Full table for Figure 5.5 _________________________________________- 224 - Table B.4 – Full table for Figure 5.8 _________________________________________- 225 -

- 14 -
AABBBBRREEVVIIAATTIIOONNSS
AAD Aminoactinomycin-D AMI Acute myocardial infarction BM Bone marrow BMS Bare metal stent BSA Bovine serum albumin CABG Coronary artery bypass graft CCA Common carotid artery CD Cluster of differentiation CEC Circulating endothelial cell EBM Endothelial basal medium EGM Endothelial growth medium EPC Endothelial progenitor cell ESC Embryonic stem cell FcR Crystallisable fragment receptor FDA Food and Drug Administration FEM Finite element modelling FePro Endorem® + Protamine sulphate FGF Fibroblast growth factor FITC Fluorescein isothiocyanate FSC Forward scatter GA Gentamicin amphotericin antibiotic G-CSF Granulocyte colony stimulating factor HCl Hydrochloric acid HSC Haematopoietic stem cell IGF Insulin-like growth factor IL-3 Interleukin 3 ISR In-stent restenosis KCN Potassium ferrocyanide LDL Low density lipoprotein MDT Magnetic drug targeting MNC Mononuclear cell MRI Magnetic resonance imaging NI Neointima NO Nitric oxide oxLDL Oxidised LDL PB-MNC Peripheral blood MNC PBS Phosphate buffered saline PCI Percutaneous coronary intervention PFA Paraformaldehyde PLL Poly-L-lysine PTCA Percutaneous transluminal coronary angioplasty RF Radio frequency SCF Stem cell factor SDF Stromal derived factor SMC Smooth muscle cell SPIO Superparamagnetic iron oxide SSC Side scatter UV Ultraviolet VEGF Vascular endothelial growth factor

- 15 -
CCHHAAPPTTEERR 11
SSTTEEMM CCEELLLLSS AANNDD CCAARRDDIIOOVVAASSCCUULLAARR DDIISSEEAASSEE
Chapter 1 Stem cells and cardiovascular disease
- 16 -
11..11 IInnttrroodduuccttiioonn
This chapter will provide a relevant synopsis of stem cells in cardiovascular disease.
Stem cells and their properties are briefly presented, followed by a description of
atherosclerotic disease processes. The specific relevance of stem cells in cardiovascular
disease will be outlined along with a more detailed description of the cells thought to
regenerate vascular endothelium, which are the main focus of the thesis.
In ancient Greek mythology, Prometheus, known for his wit, stole fire from the Gods to
give it to man. It is said that in so doing he played a critical part in the evolution of
humankind. To his demise, he was chain-bound to a rock and condemned to daily
attacks by Zeus’ eagle, who preyed on his liver (Figure 1.1). However, his liver would
regenerate overnight, thus granting Zeus’ eagle with limitless food and Prometheus with
eternal torture.
In modern medicine, an experimental model that closely resembles this myth is the one
developed by Higgins and Anderson in 1931, in which two-thirds of the rat liver are
removed. The remaining liver re-grows to full size within one week (Michalopoulos &
DeFrances 1997). To date, we are still unsure whether the regenerative capabilities of
the liver were known to ancient Greeks, although the evidence tends to point in the
opposite direction (Power & Rasko 2008). Despite this, the myth of Prometheus and the
notion of on demand tissue regeneration remains a very fascinating concept in medicine.
It offers a radically expanded range of possibilities for the treatment of human illness,
including cardiovascular disease, and a multitude of basic experimental and clinical
studies have sought this goal in recent years. Still, the efficacy and feasibility of stem
cell therapy remains controversial.
Chapter 1 Stem cells and cardiovascular disease
- 17 -
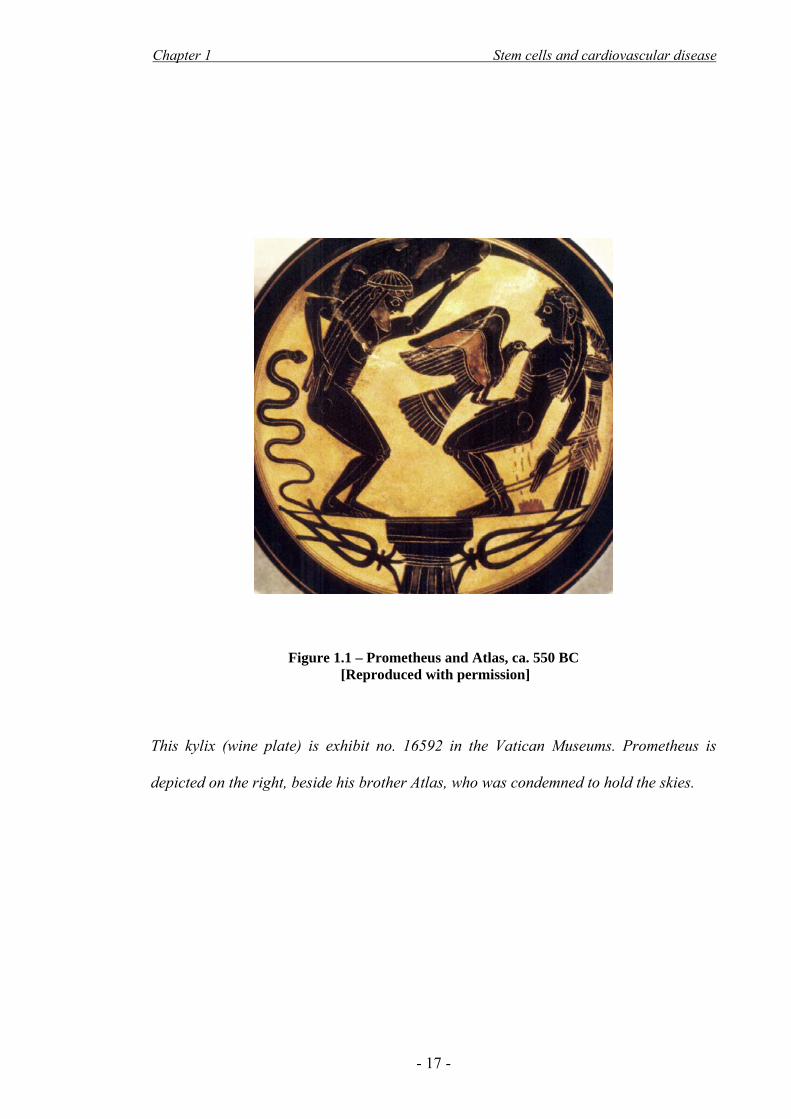
Figure 1.1 – Prometheus and Atlas, ca. 550 BC [Reproduced with permission]
This kylix (wine plate) is exhibit no. 16592 in the Vatican Museums. Prometheus is
depicted on the right, beside his brother Atlas, who was condemned to hold the skies.

Chapter 1 Stem cells and cardiovascular disease
- 18 -
11..22 SStteemm cceellllss –– aann oovveerrvviieeww
1.2.1 Embryonic stem cells
Stem cells are immature cells with no specific identity, which are capable of
differentiating into mature cell stages of a variety of tissue types, whilst being able to
self-regenerate without losing this differentiation potential (Brehm, Zeus, & Strauer
2002; McKay 2000). During early development certain cells in the embryo have been
identified that are pluripotent and can form all three germ layers (endoderm, mesoderm,
ectoderm), these are known as embryonic stem cells (ESCs). ESCs are channelled down
distinct differentiation pathways and eventually lead to the formation of the organism.
Human ESCs were first described by Thomson in 1998, and this has been followed by
ten years of considerable research and debate regarding their use.
Possibly the most appealing aspect of ESCs is that, given the appropriate cues, they can
be induced to differentiate into an array of cell types in vitro. For example, human ESCs
have been differentiated into cardiomyocytes, haematopoietic cells, endothelial cells,
hepatocytes, osteoblasts and several types of neural tissue (Lerou & Daley 2005;
Rippon & Bishop 2004). Indicatively, there have been a number of studies showing that
ESCs can be differentiated into functional neural cells, integrate into the host tissue and
in some cases have improved symptoms of neurodegenerative diseases in animal
models (Goldman & Windrem 2006; Lindvall & Kokaia 2006). However, we are still
unclear of the exact molecular pathways that define the fate of the cells. Moreover, a lot
of investigations have focused on the immune response generated by the host tissue,
which may lead to graft rejection, as well as the potential for the transplants to form
tumours (Nussbaum et al. 2007; Swijnenburg et al. 2005). Some of these issues can be
overcome with the use of immunosuppressants and specific differentiation protocols,

Chapter 1 Stem cells and cardiovascular disease
- 19 -
however concerns regarding safety remain. This was exemplified in a recent case of
donor-cell derived tumourigenesis in a patient who was treated experimentally with
foetal stem cells (Amariglio et al. 2009).
ESC research remains under inquiry also due to the ethical, religious and political
dimension of using unwanted human embryos (McKay 2000; Orive et al. 2003). For
this reason, researchers are in the search of stem cells that remain in the body following
embryonic development and reside within the adult tissues. Harvesting these cells
would be more widely accepted than using embryos, with the added benefit of being
autologous, thus eliminating the host immune response to transplanted cells.
1.2.2 Adult stem cells
Some cells with regenerative capacity are known to be retained in adulthood and are
thought to aid in the restoration of damaged tissue; these are known as adult stem cells
and are traditionally thought to be more limited in their differentiation potential. They
serve as a local cell pool for the maintenance of adult tissue, such as the haematopoietic
system, the cells of the skin and gut, and also part of the nervous system (Bajada et al.
2008). A representative ‘differentiation tree’ is shown in Figure 1.2.

Chapter 1 Stem cells and cardiovascular disease
- 20 -
Figure 1.2 – Stem cells and their progeny in adult tissue
[Adapted from Asahara & Kawamoto 2004]

Chapter 1 Stem cells and cardiovascular disease
- 21 -
As in most areas of medicine, the sheer existence of adult stem cells has been
highlighted by diseases affecting these cells. Probably the most investigated are the
haematopoietic stem cells (HSCs), which reside mainly in the bone marrow and give
rise to haematopoietic progenitor cells. These in turn differentiate into the cell lineages
of the haematopoietic system: erythrocytes (red cells), megakaryocytes (platelet-
forming cells) and leukocytes [white cells, i.e. granulocytes (neutro-, baso- and
eosinophils), lymphocytes (T-, B-, and natural killer-cells) and monocytes/
macrophages] (Smith 1990). Malignancy in the HSC pool leads to uncontrolled
proliferation and diseases such as leukemia, in which there are abnormally high levels
of white cells in the blood. Similarly, a complete eradication of the HSC pool, will lead
to aplastic anemia, in which case there are insufficient numbers of circulating red and
white cells (Lerou & Daley 2005).
The regenerative potential of HSCs is the basis of a well established stem cell therapy
regime, bone marrow transplantation. This is the preferred therapy for certain types of
immunodeficiency disorders and leukemias (Duncombe 1997). During the procedure,
bone marrow cells, including ~1 in 10,000 HSCs, are infused in a patient who has had a
complete eradication of their bone marrow cells using chemo/radio-therapy. The infused
HSCs then reconstitute the entire haematopoietic system. The success of this treatment
clearly exemplifies the main characteristics of stem cells; self renewal and ability to
form multilineage progeny.
In addition to HSCs, a multitude of other stem cells exist in the adult body. For
example, mesenchymal stem cells in the bone marrow can give rise to cartilage, bone
and adipose tissue; neural stem cells in the nervous system differentiate into neurones,
oligodendrocytes and astrocytes (Alison & Islam 2009). In fact, most organs such as the

Chapter 1 Stem cells and cardiovascular disease
- 22 -
musculoskeletal system, the heart, the lung, kidney, digestive tract, gonads and skin are
believed to have some residing progenitor cell that aids in tissue regeneration.
Recent evidence shows that adult stem cells may, in fact, have more potential to trans-
differentiate between tissue types, and behave like embryonic stem cells if given the
right cues. This has resulted in a lot of hype (McKay 2000), because an adult pluripotent
cell, being autologous, would diminish the immunocompatibility issues found with
ESCs and also bypass the ethical obstacle of using human embryos. For example, there
are several reports on subsets of HSCs that can form tissues from all three germ layers
(Ratajczak et al. 2008). Several names have been coined for these cells, such as
multipotent adult progenitor cells (MAPC), marrow-isolated adult multilineage
inducible cells (MIAMI), multipotent adult stem cells (MACS) and very small
embryonic-like cells (VESL). It is likely that these recent studies are describing
overlapping cell populations, and that the pluripotent adult stem cell is yet to be defined.
In addition, recently a methodology was described, whereby pluripotency is induced in
somatic adult cells through the overexpression of certain transcription factors
(Klimanskaya, Rosenthal, & Lanza 2008; Ratajczak et al. 2008). This has been achieved
both for mouse and human cells, with different combinations of transcription factors
such as Oct4, Sox2, Nanog and Lin28. In mouse models, these induced pluripotent (iPS)
cells could generate cells from all three germ lines and form chimeric mice.
However, the use of viruses in iPS cell formation, as well as the yet unknown fate of
these cells, are likely to be obstacles in clinical translation. In addition, even if success
with adult pluripotent cells is shown in animal models, it is believed that these cells will
be rare and difficult to isolate, which may, practically and economically, hamper

Chapter 1 Stem cells and cardiovascular disease
- 23 -
expansion to large cell numbers for transplantation and organ regeneration. The success
of cellular therapies will therefore require strategies to ‘accurately deliver and/or home
the cells or their derivatives to the injury site’ (Stocum & Zupanc 2008). Meanwhile, it
is important to keep in mind that, despite any possible excitement in the media and the
possibility of business opportunities for stem cell therapy companies, the
characterisation of stem cells still remains in its infancy. The following sections will
focus on the current role of cellular therapies in cardiovascular disease, and in particular
the capacity of the cells thought to regenerate endothelium, the ‘endothelial progenitor
cells’, for vascular repair.

Chapter 1 Stem cells and cardiovascular disease
- 24 -
11..33 CCaarrddiioovvaassccuullaarr ddiisseeaassee
1.3.1 The burden of cardiovascular diseases
Cardiovascular diseases are the number one cause of death globally (W.H.O. 2007).
They comprise a group of diseases of the heart and vasculature, including coronary
artery disease (the vessels that ‘crown’ the heart and supply it with blood),
cerebrovascular disease and peripheral arterial disease. Coronary artery disease and
stroke alone were the cause of one quarter of all deaths in 2005.
The primary cause of coronary artery disease and stroke is atherosclerosis, a disease of
the large arteries. There are several major risk factors for the development of
atherosclerosis, which include a high-fat diet, lack of exercise and smoking tobacco.
These risk factors are descriptive of the lifestyle of Westernised world, which has led
atherosclerosis to be the cause for half of the deaths in these societies (Lusis 2000).
1.3.2 Atherosclerosis
1.3.2.1 Etymology
Atheroma in Greek means lump of groat, essentially porridge; sclerosis means
hardening. Atherosclerosis thus describes a condition in which the arteries are hardened
due to the presence of a porridge-like lump. This section will outline the normal
anatomy and physiology of the artery, along with the pathophysiology and the
management of atherosclerosis.
1.3.2.2 Anatomy and physiology of the artery
The arterial system is a high-pressure tubing system that carries the blood from the heart
to the various organs in the body (Oliver, Entman, & Jacob 2009). The wall of these

Chapter 1 Stem cells and cardiovascular disease
- 25 -
tubes is a very complex structure; it provides elasticity and mechanical support, active
contractile control and a smooth non-thrombogenic surface. At the same time there are
mechanisms in place for the timely plugging and repair of this wall in case of a breach
(such as in trauma). Due to their vast cellular and molecular complexity, only a brief
account of these functions will be considered here.
The arterial wall is comprised of three major layers (Figure 1.3); the innermost and
thinnest is the intima, which is made of extracellular connective tissue matrix. This is
covered with a layer of tightly joined endothelial cells on the luminal side and bound by
a layer of elastic fibres, the internal elastic lamina, around its periphery. The
endothelium normally serves multiple roles. For example, apart from a non-adherent
surface for circulating cells, it provides a permeability barrier for nutrients and fluid,
regulates the vascular tone by release of constrictive or dilatory molecules (such as the
dilatory nitric oxide, NO) and also forms and maintains the matrix on which it lies
(Ross 1995). This intimal matrix contains collagen and is pro-thombogenic; which is
essential for the prompt termination of bloodflow in case of injury.
Surrounding the intima is the media, made of smooth muscle cells (SMCs), which
control the contractility of the vessel. It has been shown that with age SMCs slowly
migrate into the intima of some areas and create small thickenings. It is in these areas
that atherosclerotic lesions develop further (Ross 1995).

Chapter 1 Stem cells and cardiovascular disease
- 26 -
Figure 1.3 – Anatomy of the artery [Adapted from Lusis 2000]

Chapter 1 Stem cells and cardiovascular disease
- 27 -
The whole structure is bound by the adventitia, a connective tissue layer containing
SMCs and fibroblasts, the role of which is mainly to provide structural support and
protect the artery from over-expansion. Traditionally, the pathophysiology of
atherosclerosis is not thought to be associated with this layer, which is also evident by
its name; adventicius in Latin means foreign, thus the adventitial layer is, at least by
nomenclature, thought to be unrelated to the rest of the artery. However, there is
emerging evidence for the importance of the adventitia in atherosclerosis (Maiellaro &
Taylor 2007).
1.3.2.3 Pathophysiology of atherosclerosis
Atherosclerosis is considered to be a chronic, progressive, inflammatory response to
endothelial injury or dysfunction (Goldschmidt-Clermont et al. 2005; Ross 1999). It is
characterised by the accumulation of lipids and fibrous components, recruitment of
circulating lymphocytes and monocytes, and SMC proliferation. Possible factors that
can be insulting to the endothelium include high blood cholesterol levels, in particular
the cholesterol-carrying molecule low density lipoprotein (LDL), free radicals produced
by cigarette smoking, high blood pressure, raised blood glucose such as in diabetes
mellitus, infectious agents such as herpesviruses and several genetic factors. Of
importance is also the blood flow pattern; the structure and function of endothelial cells
is dependent on the stresses experienced, and arterial branching points, having high
turbulence and low shear stress, are prone to atherogenesis (Gimbrone et al. 2000).
The notion that endothelial injury, followed by inflammation and a proliferative
response within the artery, precedes the degeneration found in advanced atherosclerotic
lesions, was first suggested by Rudolph Virchow in the mid-1850s (Ross, Glomset, &
Harker 1977). This progression can be divided in four arbitrary stages (Figures 1.4-1.7).

Chapter 1 Stem cells and cardiovascular disease
- 28 -
Figure 1.4 – Lesion initiation [From Ross 1999]
Figure 1.5 – Development of the ‘fatty streak’ [From Ross 1999]

Chapter 1 Stem cells and cardiovascular disease
- 29 -
During lesion initiation, the insulted endothelium becomes more permeable to
macromolecules such as LDL, which accumulate in the sub-endothelial space and
become oxidised (oxLDL). This causes an insult to the endothelium and an
inflammatory response is initiated; the endothelium exhibits increased adhesiveness to
leukocytes (Figure 1.4). The leukocytes migrate to the intima, T-cells become activated
and monocytes differentiate into macrophages, ingesting the accumulated oxLDL and
forming lipid-rich ‘foam cells’. Thus a ‘fatty streak’ is developed (Figure 1.5). The
removal of oxLDL by macrophages is a normal response that protects the endothelium
and underlying SMCs. Fatty streaks are not clinically significant and are normally
present in most adults from adolescence onwards.
Continued accumulation of oxLDL causes an increase in the size of the lesion, as more
foam cells are formed, get trapped and begin to form a necrotic core. Continued insult to
the endothelial cells, coupled with insufficient endogenous repair of the endothelial
layer, causes endothelial dysfunction; this includes increased adhesiveness to platelets
and reduced production of NO with a corresponding increase in vascular tone. In
addition, as a result of the inflammatory mediators released by the endothelium and
activated leukocytes, SMCs start to migrate into the intima and proliferate, depositing
extracellular matrix and forming a fibrous cap which protrudes in the lumen of the
vessel (Figure 1.6). The stability of this fibrous plaque is a complex interplay between
the strength of the fibrous cap, calcification and neovascularisation within the core. If
there is plaque rupture, the pro-thrombotic matrix of the intima becomes exposed to the
blood, and a thrombus forms (Figure 1.7). This results in partial or total occlusion of the
vessel and tissue ischaemia, such as myocardial ischaemia, acute myocardial infarction
(AMI) or stroke.

Chapter 1 Stem cells and cardiovascular disease
- 30 -
Figure 1.6 – Advanced lesion [From Ross 1999]
Figure 1.7 – Unstable lesion
[From Ross 1999]
Chapter 1 Stem cells and cardiovascular disease
- 31 -
1.3.2.4 Non-surgical management of atherosclerosis
Pharmacological and lifestyle management is aimed at reducing the risk factors in those
at high-risk, those with recognised arterial atherosclerotic stenoses and those who have
already had a cardiovascular episode (ischaemia, AMI, stroke etc).
Statins are a class of commonly used drugs that are particularly helpful in reducing
blood LDL levels by inhibiting LDL production in the liver; they are associated with a
30% reduction in clinical events and mortality from atherosclerosis (Vaughan, Gotto, &
Basson 2000). Anti-hypertensive drugs are used to control blood pressure; lifestyle
changes include cessation of cigarette smoking, increased levels of exercise, a low-
cholesterol diet and better diabetes management.
1.3.2.5 Surgical management of atherosclerosis
1.3.2.5.1 Introduction
In the heart, surgical management takes the form of either percutaneous coronary
intervention (PCI), or coronary artery bypass graft surgery (CABG) (Gunn & Taggart
2003). In PCI, a catheter is inserted in a peripheral artery and advanced to the coronary
arteries under radiological guidance. The catheter is tipped with a inflatable balloon that
is used to open up the stenosed section. This may be accompanied by intraluminal
implantation of a metallic mesh (a stent) to act as a supporting scaffold. In CABG, the
diseased coronary vessels are replaced with vein grafts, usually from the leg. CABG,
which will not be discussed further, is reserved for either chronic total occlusions or
multiple vessel disease; in other cases PCI is preferred.

Chapter 1 Stem cells and cardiovascular disease
- 32 -
1.3.2.5.2 Balloon angioplasty
PCI is a general term that encompasses percutaneous transluminal coronary angioplasty
(PTCA, balloon angioplasty, Figure 1.8a), with the further use of stents (Figure 1.8b) or
other atheroma-cutting devices. The term angioplasty literally means moulding of the
arteries in Greek. The first PTCA procedures were performed in the late 1970s
(Serruys, Kutryk, & Ong 2006). PTCA is associated with restenosis, defined as the
arterial healing response after injury incurred during transluminal coronary
revascularisation (Lowe, Oesterle, & Khachigian 2002). This restenosis is attributable to
elastic recoil, constrictive remodelling (arterial shrinkage), thrombus at the site of
injury, proliferation of SMCs and deposition of extracellular matrix. The latter two
processes contribute to the formation of a thick layer known as the neo-intima (NI)
(Hoffmann & Mintz 2000; Lowe, Oesterle, & Khachigian 2002). The endothelium plays
a role in the modulation of this NI formation: with injury and denudation of only a small
area of endothelium, minimal NI is observed, which is increased when larger areas are
affected (Kipshidze et al. 2004). In the rat for example, SMCs appear in the intima only
in areas that are not re-endothelialised seven days after injury (Haudenschild &
Schwartz 1979).
1.3.2.5.3 Stent implantation following PTCA
Metallic stents were introduced in 1986 to reduce the acute recoil and post-injury
arterial shrinkage associated with PTCA, and the BENESTENT and STRESS clinical
trials in 1994 showed a reduction in restenosis rates by approximately 30% with the use
of a stent (Fischman et al. 1994; Serruys et al. 1994). By 1999, stenting comprised 85%
of all PCI and in 2006 this figure had risen to 90-95% (Serruys, Kutryk, & Ong 2006).
Interestingly, PTCA is now sometimes performed where pharmacological treatment
alone could produce the same result (Fox 2009).
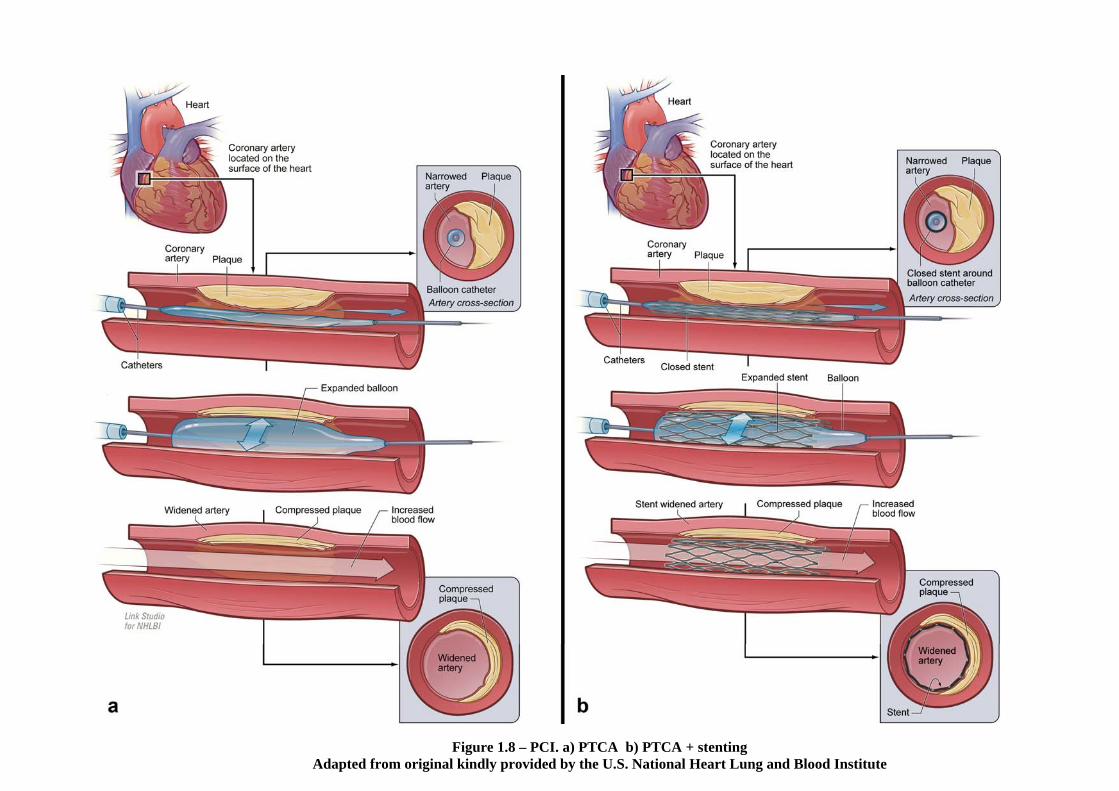
Figure 1.8 – PCI. a) PTCA b) PTCA + stenting Adapted from original kindly provided by the U.S. National Heart Lung and Blood Institute

Chapter 1 Stem cells and cardiovascular disease
- 34 -
Even though stents eliminated vessel remodelling and recoil, they were associated with
thrombogenicity and did not abolish re-stenosis attributable to NI formation. Dual
antiplatelet therapy consisting of aspirin and a thienopyridine such as clopidrogel
resulted in reduction of stent thrombosis; in addition, stents coated with heparin
provided a further reduction (Gupta et al. 2004). However, in-stent-restenosis (ISR,
Figure 1.9a) due to NI hyperplasia remained a considerable problem, occurring in 10%-
50% of cases (Hoffmann & Mintz 2000; Lowe, Oesterle, & Khachigian 2002). This
may be explained by the endothelial damage caused by the metallic stent, which would
be associated with increased endothelial dysfunction (van Beusekom et al. 1998). The
treatment of choice for ISR in 2000 was repeat PTCA; however, despite temporary
dilatation of the vessel and amelioration of symptoms, it was commonly associated with
re-invasion with NI and decreased lumen diameter.
As attempts to deliver systemic medications to limit proliferation of SMCs at the lesion
site were not successful (Takahashi, Letourneur, & Grainger 2007), in the last few years
there have been efforts to develop stents that can locally and slowly release anti-
proliferative agents to inhibit NI hyperplasia and ISR; these are known as drug-eluting
stents (DES). The two main drugs used are sirolimus (Cypher® stent) and paclitaxel
(Taxus® stent) in various stent strut forms; they act by arresting the cell cycle and thus
reducing the proliferation and migration of SMCs. Because they markedly decreased NI
hyperplasia (Figure 1.9) compared with the previously used bare-metal stents (BMS),
they gained Food and Drug Administration (FDA) approval in 2003 and 2004
respectively (Serruys, Kutryk, & Ong 2006).

Chapter 1 Stem cells and cardiovascular disease
- 35 -
Figure 1.9 – In-stent stenosis due to NI formation a) BMS and b) sirolimus DES 30, days after implantation in porcine coronary arteries
[Adapted from Carter et al. 2004]

Chapter 1 Stem cells and cardiovascular disease
- 36 -
However, in the last two years there has been increasing concern regarding the safety of
DES, particularly regarding the occurrence of late stent thrombosis, which can occur
months or years following implantation (Lemesle et al. 2008; Stahli, Camici, & Tanner
2009). Although the rate of thrombosis is only about 0.5% per year higher than BMS, it
is associated with 20% - 30% mortality and 60% non-fatal MI (Jaffe & Strauss 2007).
Since sirolimus and paclitaxel do not act in a cell-specific manner, it was assumed that
re-endothelialisation may be impaired in the presence of a DES, exposing the pro-
thrombogenic stent strut to the blood for prolonged periods of time. There is evidence
for delayed endothelial function as late as 2 years post-implantation (van Beusekom et
al. 2007) and human autopsy studies have confirmed impaired re-endothelialisation at
sites of DES compared with BMS (Stahli, Camici, & Tanner 2009).
Thus, despite their differences in causality, de novo atherosclerotic lesions, ISR
following PCI, and possibly DES thrombosis, share a common pathophysiological
feature: endothelial cell damage with subsequent delay or impairment in re-
endothelialisation. There is, therefore, a need for the development of strategies that
enhance vascular endothelialisation following injury. The next section will focus on the
cells that are thought to give rise to endothelium in the adult, the endothelial progenitor
cells, and their relationship with cardiovascular disease.

Chapter 1 Stem cells and cardiovascular disease
- 37 -
11..44 EEnnddootthheelliiaall pprrooggeenniittoorr cceellllss iinn ccaarrddiioovvaassccuullaarr ddiisseeaassee
1.4.1 Introduction
Apart from the recognised benefit of PTCA, stenting with/out DES, in parallel with
pharmacological therapy with anti-thrombotic drugs and statins, recent years have seen
increased interest in the usage of various types of BM-derived stem cells in ischaemic
heart disease (Dimmeler, Zeiher, & Schneider 2005). This interest was partly sparked
by reports concluding that there is significant contribution of donor stem cells in the
muscle of transplanted hearts (Quaini et al. 2002) and that BM-derived cells can
regenerate the heart muscle (Orlic et al. 2001).
A large number of pilot clinical trials have since been conducted; these have shown a
small but consistent increase in cardiac function following cell transplantation and, most
importantly, the safety of the procedure in the case of the human heart (Abdel-Latif et
al. 2007). However, the exact mechanism underlying the observed changes became
disputed (Chien 2004; Orlic 2005). For example, several reports have shown that BM
cells do not differentiate into heart muscle (Balsam et al. 2004; Murry et al. 2004) or
improve heart function (Carr et al. 2008). It has been suggested that, depending on the
particular cell type used, augmentation of the function of existing cells via paracrine
mechanisms or neovascularisation leading to increased oxygen delivery to the ischaemic
area may play an important role (Hristov & Weber 2006; Welt & Losordo 2006). Yet
the cellular and molecular basis of the functional improvement remain incompletely
understood despite the numerous types of cells, isolation and implantation procedures
implemented (Segers & Lee 2008) –or, perhaps, precisely because of this diversity.

Chapter 1 Stem cells and cardiovascular disease
- 38 -
What is of particular relevance to this thesis is the paradigm of some clinical trials, that
the administered endothelial progenitor cells (EPCs) would aid in neovascularisation of
the ischaemic tissue. The identity and role of these cells in both the neovascularisation
of ischaemic areas and arterial re-endothelialisation will be the focus of the last sections
of this chapter.
1.4.2 Emergence of the term ‘EPC’
Traditionally, despite circumstantial evidence dating to 1932 (Ribatti 2007), it was
thought that the repair of injured arteries is dependent on proliferation of neighbouring
mature, differentiated endothelial cells (Ross, Glomset, & Harker 1977). Similarly, in
contrast with stem-cell mediated blood vessel formation in the embryo (vasculogenesis),
postnatal neovascularisation (angiogenesis) was believed to be dependent on the
proliferation of pre-existing endothelium (Murohara 2001). However, following the
differentiation of endothelial cells from circulating cells in vitro (Asahara et al. 1997;
Shi et al. 1998), in the last decade the concept of the adult ‘endothelial progenitor’ cell
has arisen, which is thought to reside in the bone marrow and circulate in small numbers
in the circulation, playing an important role in processes such as post-ischaemic
neovascularisation, tumour angiogenesis, and re-endothelialisation (Gulati, Lerman, &
Simari 2005). For example, observational investigations in humans have shown that
mobilisation of EPCs is a natural response in myocardial injury (Shintani et al. 2001)
and the clinical outcome is correlated to the degree of mobilisation (Werner et al. 2005).
1.4.3 Identifying the EPC
The term ‘EPC’ has been used widely to represent a variety of cells that can form
endothelial-like cells in vitro, and the true identity of the EPC remains elusive, as there

Chapter 1 Stem cells and cardiovascular disease
- 39 -
is no marker specific to this cell type (Roncalli et al. 2008). Initially the term was
assigned to an unknown population of cells within the peripheral blood mononuclear
cell (PB-MNC) fraction, which consists of leukocytes with a single nuclear lobe
(lymphocytes and monocytes/ macrophages, but not granulocytes). The PB-MNC
fraction was enriched for CD34 -a HSC cluster of differentiation marker also expressed
on some mature cells- and cultured from 7 to 10 days on fibronectin-coated plates.
Adherent cells with characteristics similar to mature endothelial cells formed, which
incorporated into sites of angiogenesis in a hindlimb ischemia model (Asahara et al.
1997). Similar results were published shortly after for CD34+ purified cells (Shi et al.
1998).
Culture of the whole PB-MNC fraction in endothelial–promoting medium, without
CD34 enrichment or isolation, was proposed as an alternative method for deriving EPCs
(Kalka et al. 2000) and was adopted by other groups (Murohara et al. 2000; Vasa et al.
2001b). These EPCs were subsequently shown to express markers of the monocytic
lineage such as CD14 (Rehman et al. 2003). It was considered that these were
monocytic cells with capacity to differentiate into endothelial cells under the pressure of
the cultivation media; they were called culture-modified mononuclear cells (CMMC).
To further complicate matters, in the same year as the initial description by Asahara, a
novel differentiation marker was found, CD133 (Yin et al. 1997). This marker
recognises a form of the membrane protein prominin-1, which is only expressed in
undifferentiated, pluripotent-like cell types such as HSCs, fetal brain stem cells,
myogenic stem cells and certain tumours (Shmelkov et al. 2005); it was therefore
postulated that it would constitute a better marker for identification of true progenitors.
EPCs were eventually characterised on the basis of CD133 expression (Gehling et al.

Chapter 1 Stem cells and cardiovascular disease
- 40 -
2000; Peichev et al. 2000; Quirici et al. 2001; Reyes et al. 2002) and were shown to be
upregulated by 50-fold within 12h after vascular trauma secondary to burn injury or
CABG surgery (Gill et al. 2001).
Longer term culture was also proposed to select for more proliferative EPCs from whole
PB-MNC fractions and included a pre-plating step to remove differentiated monocytes
and mature endothelial cells, which rapidly adhere to culture plates (Hill et al. 2003;
Lin et al. 2000). Extended MNC culture for 2-4 weeks resulted in an outgrowth of cells
(termed endothelial outgrowth cells, EOC) that were distinctly more proliferative than
CMMC and had an endothelial-like phenotype (Khakoo & Finkel 2005). These EOCs
have also recently been shown to include cells of monocytic origin (Rohde et al. 2006;
Rohde et al. 2007). Both CMMCs and EOCs have the capacity to incorporate into the
vasculature and enhance neovascularisation and re-endothelialisation (Hristov & Weber
2004).
The actual identity of circulating EPCs may cross the boundaries of pure ‘endothelial’
or ‘monocytic’ populations. That is, if an identifiable, single, specific ‘EPC’ exists at
all. Monocytes have been shown to express both endothelial and macrophagocytic
markers (Schmeisser et al. 2001) and incorporate in newly formed blood vessels in vivo
(Urbich et al. 2003). CD14+ cells can also re-endothelialise denuded arteries and inhibit
neointimal hyperplasia (Fujiyama et al. 2003). Thus EPC populations are heterogeneous
and may express an array of progenitor markers such as CD133 / CD34, monocytic
markers such as CD11b / CD14 and endothelial markers such as VE-cadherin (Hristov
& Weber 2008; Urbich & Dimmeler 2004). The mainstay is that, in vivo, EPCs
originate in the BM from a CD133+/CD34+ cell, which is released in the circulation in
small numbers and can differentiate into endothelial cells in vitro under endothelial-
Chapter 1 Stem cells and cardiovascular disease
- 41 -
specific media; thus state-of-the-art protocols necessitate isolation from peripheral
blood using CD133 antigens (Zammaretti & Zisch 2005).
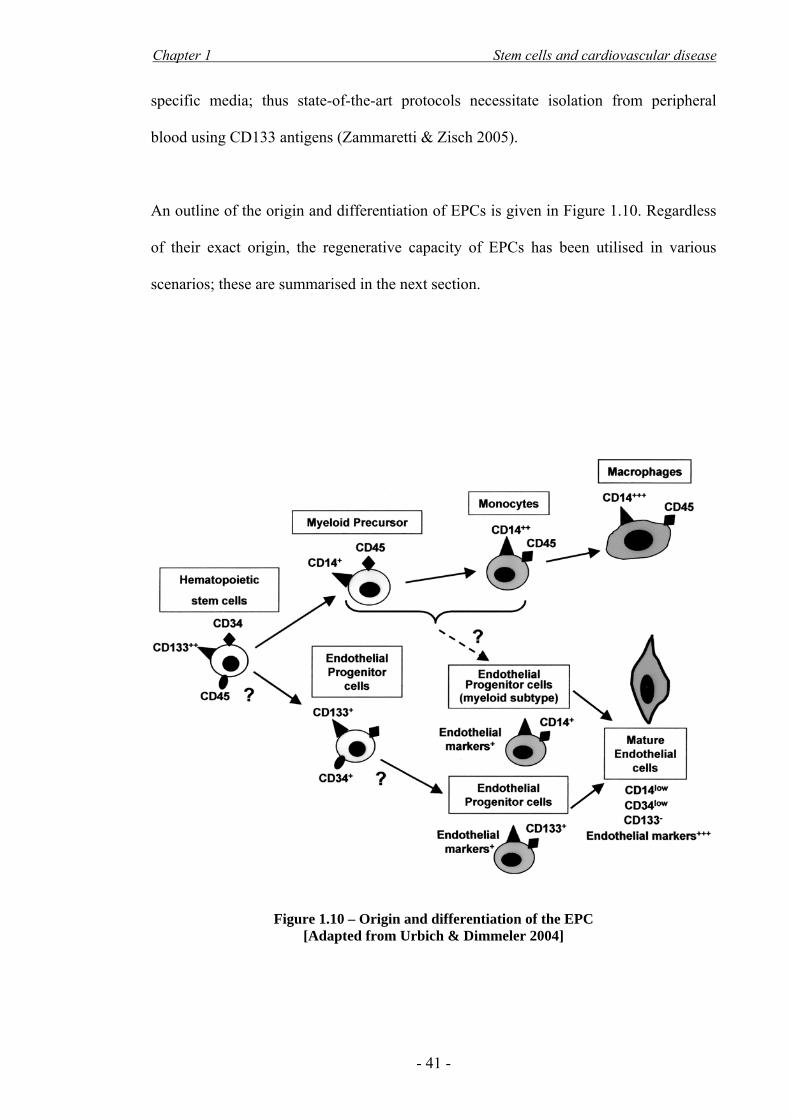
An outline of the origin and differentiation of EPCs is given in Figure 1.10. Regardless
of their exact origin, the regenerative capacity of EPCs has been utilised in various
scenarios; these are summarised in the next section.
Figure 1.10 – Origin and differentiation of the EPC
[Adapted from Urbich & Dimmeler 2004]

Chapter 1 Stem cells and cardiovascular disease
- 42 -
1.4.4 Role of the EPC
EPCs were originally used in the context of neovascularisation for ischemia; a number
of studies focused on the improvement in perfusion in ischaemic hindlimbs in animal
models (Asahara et al. 1999; Asahara et al. 1997; Kalka et al. 2000; Murohara et al.
2000) and humans (Inaba, Egashira, & Komori 2002; Tateishi-Yuyama et al. 2002).
Evidence for beneficial involvement of EPCs in myocardial ischaemia (Kawamoto et al.
2001; Kocher et al. 2001) eventually led to the first clinical trials in humans (Erbs et al.
2005; Losordo et al. 2007; Schachinger et al. 2004; Stamm et al. 2007).
It is also well established that EPCs play a significant role in the pathogenesis of
atherosclerosis. They have been shown to re-endothelialise artificial grafts (Shi et al.
1998) and sites of injury caused by balloon angioplasty in animal models, reducing
neointima formation (Friedrich et al. 2006; Fujiyama et al. 2003; Griese et al. 2003;
Gulati et al. 2003; Kong et al. 2004; Walter et al. 2002; Wang et al. 2008; Werner et al.
2003; Werner et al. 2002). To date there have not been any clinical trials investigating
the potential of EPCs to reduce post-PTCA NI hyperplasia and ISR (Kawamoto &
Losordo 2008), although some preliminary trials are underway (see section 1.4.6)
Most of the risk factors for atherosclerosis have been related to circulating EPC
availability and function (Hill et al. 2003; Urbich & Dimmeler 2005; Vasa et al. 2001b;
Werner & Nickenig 2006). This is in concordance with the notion that the balance of
endothelial damage versus re-endothelialisation is impaired in the development of
atherosclerotic lesions (section 1.3.2.3). Furthermore, there has been a number of
studies indicating that statins augment EPC mobilisation from the bone marrow,
enhance their proliferation and differentiation and prevent their apoptosis, increasing re-
endothelialisation and decreasing NI formation in animal models and humans

Chapter 1 Stem cells and cardiovascular disease
- 43 -
(Dimmeler et al. 2001; Vasa et al. 2001a; Walter et al. 2002; Walter, Zeiher, &
Dimmeler 2004; Werner et al. 2002).
1.4.5 Mobilisation and homing of EPCs to sites of injury
EPCs are mobilised from the bone marrow, where they are normally in a quiescent state
and associated with the stromal tissue (Khakoo & Finkel 2005; Urbich & Dimmeler
2004). Cytokines such as vascular endothelial growth factor (VEGF) and stromal cell
derived factor 1 alpha (SDF-1α), which are upregulated in response to hypoxia or
arterial injury (Gill et al. 2001; Hristov & Weber 2008), are thought to activate matrix
metalloproteinases in the bone marrow. These proteinases cleave the adhesions between
stem cells and stromal tissue, increasing their mobility; this allows the cells to transfer
to the more vascular sinusoidal zone of the bone marrow, favouring mobilisation into
the peripheral circulation and the initiation of differentiation (Zampetaki, Kirton, & Xu
2008). A potent mobiliser is granulocyte-colony stimulating factor (G-CSF) (Korbling
et al. 2006), which mobilises the whole HSC pool and has been used clinically for HSC
mobilisation in the context of BM transplantation (section 1.2.2). Other mobilisers
include erythropoietin, exercise, estrogens and statins (section 1.4.4).
The recruitment, adhesion, transmigration and final differentiation of EPCs at sites of
damage or ischaemia is an interplay between attractive chemokines such as VEGF or
SDF-1α and adhesion molecules (Figure 1.11). For example, the receptor for SDF-1α is
expressed in EPCs and promotes homing along hypoxic gradients; in addition, blockade
of this receptor reduces their adhesion to sites of arterial injury (Hristov et al. 2007a).

Chapter 1 Stem cells and cardiovascular disease
- 44 -
Figure 1.11 – Mobilisation and homing of EPCs in neo-vascularisation [Adapted from Dimmeler, Zeiher & Schneider 2005]

Chapter 1 Stem cells and cardiovascular disease
- 45 -
Adherence of platelets on the exposed subendothelial matrix of the injured vessel wall
has recently been shown to be an important part of this SDF-1α-mediated recruitment
(Massberg et al. 2006; Rafii et al. 2008). Firm attachment of EPCs is thought to be
mediated by adhesion molecules, initially E- and P-selectin and subsequently integrins
(Hristov et al. 2007b); one such example is the α1β4 integrin, the most common integrin
on CD34+ cells, which mediates attachment to vascular endothelial adhesion molecule
1 (VCAM-1, expressed on inflamed endothelium ) and cellular fibronectin (Jin et al.
2006). Final differentiation into mature ECs is the result of interactions which are still
poorly understood; these include circulating growth factors as well as locally secreted
factors by SMCs, platelets, and the existing endothelium. VEGF, SDF-1α and the
mechanical force of blood flow (shear stress) are thought to play a primary role here
(Zampetaki, Kirton, & Xu 2008).
1.4.6 Enhancing recruitment, homing and retention of EPCs
1.4.6.1 Introduction
Prior to the discovery of endothelial progenitors, there had been attempts to enhance re-
endothelialisation by seeding the vessels with mature ECs. These methods were faced
with weak adherence of the cells to the vessel wall, which necessitated prolonged
seeding time and cessation of flow. Clinically, an important problem was the sourcing
of sufficient numbers of non-proliferative autologous ECs, which would require
sacrifice of other vessels (Gulati, Lerman, & Simari 2005; Gulati & Simari 2004;
Kipshidze et al. 2004).
Studies attempting to enhance re-endothelialisation and neovascularisation have also
been faced with some of these issues; namely the low availability of these cells, which

Chapter 1 Stem cells and cardiovascular disease
- 46 -
can be improved by expansion in culture (although this may be an issue for subsequent
administration to humans), and the low uptake at the site of injury. For example, based
on animal experiments it has been estimated that in the context of critical limb
ischaemia in humans, 12 litres of blood would be necessary to harvest sufficient
numbers of EPCs for an effective intravenous infusion (Iwaguro et al. 2002). There
have been attempts with several techniques to overcome these hurdles; these include
local delivery, increasing mobilisation and potency by gene therapy, seeding of grafts
prior to implantation and recruitment of endogenous EPCs. Some of these techniques
are considered next.
1.4.6.2 Local delivery of EPCs to sites of injury
Most of the clinical trials aiming neovascularisation in the heart have implemented
delivery in the form of intracoronary injection, delivering the cells where they are most
likely to be effective in their role (Hristov & Weber 2006). To increase adherence and
extravasation of the cells, the arterial flow is halted for multiple periods of 2-4 minutes,
alternated with short periods of reflow to avoid ischaemia. However, even in these
favourable conditions, very few of the administered cells actually remain on site; for
example, following intracoronary PB-MNC injection with 3 minutes flow-stop, 2.6% of
cells remain in the heart of rats (Hou et al. 2005). The vast majority escape and get
trapped in the lung, liver and spleen. Similar results have been shown in humans
(Hofmann et al. 2005).
1.4.6.3 EPC mobilising agents
A way to increase the yield of EPCs for cell culture is to amplify the numbers of
circulating cells by use of exogenous mobilising agents (section 1.4.5). This has been
implemented successfully. The next logical step was to increase the endogenous EPC

Chapter 1 Stem cells and cardiovascular disease
- 47 -
numbers and attempt neovascularisation with the infusion of a mobilising agent, but
without harvesting the EPCs. Although there were some positive results with cytokines
such as GCSF and SDF-1α in animals (Laflamme & Murry 2005; Orlic 2005; Srinivas,
Anversa, & Frishman 2009) the improvement was not coherent among animal models
and, despite successful CD34+ mobilisation, did not work in humans (Abdel-Latif et al.
2008; Ince et al. 2008; Zohlnhofer et al. 2008). The exact reasons for which this
treatment was not effective has not been elucidated; possibly part of the cause is that G-
CSF mobilised cells are mainly committed monocytes and granolocytes, rather than
EPCs, so selection for EPCs and expansion in culture may be necessary. Futhermore, G-
CSF is known to be involved in the cleavage of the SDF-1α receptor on EPCs, which
may lead to impairment of their homing capacity (Zohlnhofer et al. 2008).
1.4.6.4 Gene transfer
An alternative strategy is to artificially enhance the numbers or the repair capacity of
EPCs using gene transfer protocols. Plasmids encoding for VEGF successfully
increased circulating EPC levels in humans after intramuscular injection in ischaemic
lower limbs (Freedman 2002). Furthermore, ex vivo VEGF gene transfer into EPCs not
only increased their integration in vasculature of ischaemic mouse hindlimbs, but also
increased the endogenous neovascularisation, leading to increased limb salvation
(Iwaguro et al. 2002). In an attempt to increase re-endothelialisation and prevent ISR,
VEGF-eluting stents have been developed (Walter et al. 2004). However, recently it has
been shown that local over-expression of VEGF can recruit leukocytes and cause plaque
vulnerability in advanced atherosclerotic plaques (Lucerna et al. 2007).

Chapter 1 Stem cells and cardiovascular disease
- 48 -
1.4.6.5 EPC-capturing stents
Finally, the most recent advance aiming to increase EPC recruitment has been the
clinical implementation of a stent coated with anti-CD34 antibodies, which causes rapid
attachment of EPCs and re-endothelialisation following stent placement (Aoki et al.
2005; Co et al. 2008). Nonetheless, in a manner analogous to G-CSF-induced
mobilisation (section 1.4.6.3), this approach non-specifically recruits all HSCs bearing
the CD34 antigen, including potential progenitors for SMCs. This may lead to increased
NI formation (Rotmans et al. 2005). Indeed, CD34-capturing stents have not managed
to resolve the ISR seen after BMS implantation (Pompilio et al. 2009), and only after a
handful of small trials, the first reports of CD34-stent thrombosis have started to emerge
(Rossi et al. 2009).
Overall, these approaches, despite some of their negative aspects, serve to stimulate
further research into the exact characteristics of EPCs and improved targeting strategies.
11..55 SSuummmmaarryy
Atherosclerosis is an inflammatory process that affects a massive part of the population
on a clinical level (1.3.1). Although the ageing of the arteries is a natural phenomenon,
several factors serve to increase the risk of further complications, which eventually lead
to occlusive events such as stroke and myocardial infarction, with considerable
associated morbidity and mortality. The human body has an innate repair mechanism to
fight the progression of atherosclerosis, the malfunction of which is linked to
atherosclerotic progression (1.3.2.3). This repair mechanism may involve vascular
progenitors that can accelerate or decelerate the progression of the lesions; these include
the endothelial progenitor cells, which play a fundamental role in the repair of

Chapter 1 Stem cells and cardiovascular disease
- 49 -
endothelium and formation of new blood vessels, and have received considerable
attention in the last decade (1.4.2). A rapid response by endothelial progenitors with
complete re-endothelialisation is thought to be a primary factor in vessel protection after
injury (1.3.2.5.2), which can be either endogenous or iatrogenic, such as after balloon
angioplasty and stenting (1.3.2.5.3). Finally, although multiple strategies have focused
on targeting these cells to the sites of damage (1.4.6), arterial stenosis is still a
significant problem, the Achilles’ tendon of interventional cardiology. Quoting Roncalli
(2008):
Although the role of EPCs […] is well established, the challenge for the next decade is
to identify and evaluate methods that increase EPC homing and incorporation, thereby
enabling targeted delivery of EPCs to a site of interest.

- 50 -
CCHHAAPPTTEERR 22
MMRRII AANNDD SSUUPPEERRPPAARRAAMMAAGGNNEETTIICC IIRROONN OOXXIIDDEE

Chapter 2 MRI and superparamagnetic iron oxide
- 51 -
22..11 IInnttrroodduuccttiioonn
Magnetic resonance imaging (MRI) is an imaging technique based on the nuclear
magnetic resonance phenomenon. It has gained popularity in the last 20 years, due to its
ability to non-invasively image living beings with good tissue contrast and minimal
energy deposition; this in contrast to modalities such as computed tomography, which
utilises x-rays. These benefits are further enhanced by the use of contrast agents, that
not only allow improved tissue contrast, but can also give information on pathological
and metabolic states. As increasing numbers of MRI scanners are being used in
hospitals and research laboratories around the world, it is a field that engages physicists,
computer programmers, electrical and electronic engineers, clinicians, basic biologists
and people across many more scientific disciplines.
With the recent advances in stem cell therapies, in the last ten years there has also been
much interest in the use of iron oxide contrast agents for tracking the fate of
transplanted cells in the body. It is these iron particles that have also been used in
magnetic targeting applications, as described in Chapter 3. A great advantage of iron
oxide particles is their multimodality, which allows for both magnetic targeting and
imaging with a single agent. This chapter will therefore provide a background necessary
to understand the basis of MRI and how superparamagnetic iron oxide particles help
improve image contrast, as well as cell labelling techniques and the utility of MRI-
based cell tracking.

Chapter 2 MRI and superparamagnetic iron oxide
- 52 -
22..22 BBaassiicc pprriinncciipplleess ooff MMRRII
2.2.1 The source of the signal that produces the image
In conventional MR imaging, the actual source of the signal comes from the magnetic
moment of hydrogen nuclei inside a sample and is picked up by the receiving coil,
which can be thought of as a radio antenna. Hydrogen is the predominant source of the
MRI signal because of its high magnetic moment and relative abundance in living tissue
such as water and fat. For example, an animal is comprised of tissue, which contains
water molecules (Figure 2.1a). These water molecules have one oxygen and two
hydrogen atoms. In simple terms, the hydrogen nucleus is comprised of a single
unpaired charged proton possessing a spin; this moving charge creates a magnetic
moment which behaves like a small dipole magnet (Westbrook, Roth, & Talbot 2005).
In the absence of any applied external magnetic field, the magnetic moments are
randomly orientated and cancel each other out (Figure 2.1b), but in the presence of a
large external field, such as that of an MRI scanner (B0), they align parallel to it, and
either with or against its direction. A higher percentage align with B0 than against it,
giving the tissue a small net magnetisation in the direction of the external field.
2.2.2 Nuclear magnetic resonance
Although the net magnetisation is parallel to and in the direction of B0, the individual
moments that comprise it are actually rotating around the axis of B0, which is arbitrarily
said to be the ‘z’ axis (Figure 2.2a). This rotation is called precession and has a specific
frequency, the Larmor frequency (ω0), for a given B0 and a given atom:
Equation 2.1 ,00 Bγω =

Chapter 2 MRI and superparamagnetic iron oxide
- 53 -
where γ is a property of the specific nucleus and is called the gyromagnetic ratio. This is
also called the resonance frequency, because energy can be transferred to the precessing
moments if applied at this frequency.
The net tissue magnetisation cannot be measured directly. It is parallel to and much
smaller than B0. However, it is possible to give it energy and ‘flip’ it to the side
using a radiofrequency (RF) pulse at Larmor frequency, so that it transiently
points toward a plane transverse to the external magnetic field (the ‘xy’ plane),
in which case it can be picked up by the receiver coil (Figure 2.2b). If the RF
pulse has exactly enough energy to tip the magnetisation from Mz to Mxy , it is
called a 90o RF pulse. The instant after the pulse is applied, Mz is zero and Mxy
is at its maximum, precessing around the xy plane. The receiver coil can only
measure the magnetisation along this xy plane. Once the RF pulse is turned off,
the magnetisation gradually returns to its previous state, or relaxes, and the
received signal decays over time. There are two distinct processes during this
relaxation period, the T1 or ‘spin-lattice’ relaxation, and the T2 or ‘spin-spin’
relaxation; these will be described in the next section.

Chapter 2 MRI and superparamagnetic iron oxide
- 54 -
Figure 2.1 – The source of net magnetisation
Figure 2.2 – Precession and application of a 90o RF pulse
Application of B0 results in alignment and precession of the magnetic moments with the
axis of B0, creating a net tissue magnetisation Mz (Figure 2.1b, Figure 2.2a).
Application of an RF pulse leads to precession phase coherence and tilting of the
precession axis, causing a drop in Mz and an increase in Mxy (Figure 2.2b). This is
represented as tilting of the magnetisation from the z axis to the xy plane (Figure 2.2c).
The rotating magnetisation causes a sinusoidal current in the receiver coil. This is the
signal, whose intensity depends on the magnitude of the net xy magnetisation.

Chapter 2 MRI and superparamagnetic iron oxide
- 55 -
2.2.3 Relaxation
The so-called T1 relaxation is the gradual increase in longitudinal magnetisation Mz
following the RF pulse, as the magnetic moments reach equilibrium again; this
commonly takes between 1 and 5 seconds to occur. The time constant T1 is the time it
takes for 63% of the recovery to occur; following a 90o pulse, Mz at time (t) is given by
the following equation (Figure 2.3):
Equation 2.2
where Mz,eq is the equilibrium magnetisation in the z axis (100%). For t=T1:
T2 relaxation is the decrease in Mxy following the RF pulse; this process occurs faster
than T1; T2 < T1. T2 is less that T1 because the net magnetisation in the xy plane, as
described in the previous section, is also dependent on the phase coherence of the
individual magnetic moments in that voxel. The RF pulse causes the moments to
precess in phase with each other as a single magnetic moment, resulting in a measurable
Mxy. Once the RF is switched off, each magnetic moment is free to precess at its own
Larmor frequency, which is affected by the magnetic field it is experiencing. Due to
local field inhomogeneities, the magnetic moments start to lose their phase coherence,
eventually cancelling each other out and bringing Mxy to zero, even before Mz is has
reached its maximum. Thus T2 is shorter than T1. The time after which Mxy has reached
37% of its original value is called T2; following a 90o pulse, Mxy at time (t) is given by
the following equation (Figure 2.4):
Equation 2.3
where Mxy,0 is the magnetisation in the xy plane immediately after the RF application.
( ) ( ) ,1 1,
Tteqzz eMtM −−=
( ) ( ) 63.0)11(1 ,,,111 ×≅−=−= −
eqzeqzTT
eqzz MeMeMTM
( ) ,20,
Ttxyxy eMtM −×=

Chapter 2 MRI and superparamagnetic iron oxide
- 56 -
Figure 2.3 – T1 relaxation
Figure 2.4 – T2 relaxation

Chapter 2 MRI and superparamagnetic iron oxide
- 57 -
For t=T2:
Assuming perfect 90o tilting Mxy,0 is also equal to Mz,eq.
In a system with no field inhomogeneities and if the magnetic moments experience the
same external field over time, T2 would be equal to T1. However, this does not occur in
practice. The are differences in the local field of each moment, which occur due to: i)
any spatial variations in B0 ii) any local magnetic source in the tissue iii) the interaction
with neighbouring magnetic moments. The tissue compartment affects (iii); a more
fluidic environment will cause random interactions between the moments and a slower
decrease in Mxy; therefore a longer T2.
Presence of SPIO causes a local magnetic field and affects the moments in its vicinity,
causing a lot of variation in the frequency with which they precess and thus a drop in
Mxy, a decrease in T2, and faster loss of signal.
The differences in T1 and T2 within the tissue are what provides tissue contrast in MRI,
by employing specific imaging techniques like T2-weighted sequences, which are
sensitive to differences in T2.
2.2.4 Acquiring the signal
As previously discussed, only the magnetisation in the xy plane can be measured by the
receiver coil. However, the dephasing of the magnetic moments can cause the signal to
drop within microseconds. This is commonly overcome with the use of an additional
180o pulse, which flips the spins across to the other side of the xy plane, so that they
( ) ( ) 37.0)1( 0,0,0,222 ×≅== −
xyxyTT
xyxy MeMeMTM

Chapter 2 MRI and superparamagnetic iron oxide
- 58 -
start to ‘travel back’ along the path they had travelled since the 90o pulse. Eventually
they become coherent again (before dephasing in the other direction), giving a
measurable signal, the echo. The time after the 90o pulse at which the echo occurs is the
time-to-echo (TE), which is double the time between the 90o and 180o pulse. More 180o
pulses can be applied to get multiple echoes from one 90o excitation, before all of the
magnetisation on the xy plane has diminished. This happens due to two reasons: the
return of the magnetisation to the z axis (which occurs slowly), and the presence of local
field inhomogeneities that are varying in time, and thus affect the frequency of the
magnetic moments differently between the pulses, causing a less accurate re-phasing
and a decrease in the net xy magnetisation at the time of the echo.
The magnitude of Mxy when the echo occurs is directly correlated to the current induced
in the receiver coil and the signal intensity (SI) that is attributed to the specific voxel. If
TE is long, time-varying field inhomogeneities have more opportunity to affect the
phase coherence of the moments in an irreversible way, and SI is lower. In general, SI is
related to TE according to the following equation:
Equation 2.4
which is essentially the same as Equation 2.3; SI=Mxy at t=TE.
T2-weighted sequences have long TE’s to give the time-varying inhomogeneities more
chance to affect the magnetic moments, producing lower signal intensities from tissues
with shorter T2 values.
2.2.5 Spatial localisation of the MR signal
In the absence of any additional intervention, all the above processes would produce a
concurrent echo from all the voxels in the sample, which would not be of interest for
,20,
TTExy eMSI −×=

Chapter 2 MRI and superparamagnetic iron oxide
- 59 -
imaging. To discriminate between the voxels, additional magnetic fields are
superimposed on B0 on all three axes. These fields are not homogeneous like B0; instead
they have a known spatial field gradient (usually linear) and are applied at specific times
throughout the RF excitation and acquisition cycle. The slice-select gradient is applied
during the 90o pulse. It works by inducing a range of Larmor frequencies along its
direction, allowing the RF pulse to couple with and tilt the magnetisation of only the
required plane of voxels, the slice.
The phase- and frequency-encoding gradients are applied in the other two directions
before and during acquisition. These gradients change the precession frequency of
magnetic moments along one axis, and timing of the echo along the other axis. Thus,
the signal from each region in a sample will have a specific frequency, depending on the
particular location of that voxel in the plane of the excited slice. The acquired signal is
decoded using a mathematical process called Fourrier transform, and the image
corresponding to the particular slice of tissue is reconstructed. The intensity of each
pixel in the image, usually in grayscale, is defined by the average signal intensity that
originated in that region. Thus, the MR image is generated.

Chapter 2 MRI and superparamagnetic iron oxide
- 60 -
22..33 SSuuppeerrppaarraammaaggnneettiicc MMRRII ccoonnttrraasstt aaggeennttss
2.3.1 Introduction
Superparamagnetic materials are magnetised when in a magnetic field, but lose this
magnetisation once the field is removed. Superparamagnetic iron oxide (SPIO)
nanoparticles can be used as MRI contrast agents because they acquire a magnetic
moment inside the MRI scanner. This causes a lot of local field inhomogeneity in the
tissue surrounding the particles, leading to loss of phase coherence of the magnetic
moments of the tissue following RF excitation and a decrease in SI (section 2.2.4). In
this way, tissues containing SPIOs appear darker on T2 and T2* MR images (Fahlvik,
Klaveness, & Stark 1993; Nelson & Runge 1995).
Several SPIO particles exist for MR imaging applications, each exhibiting different
biodistribution. A well-known SPIO nanoparticle is AMI-25, commercially known as
Endorem® in Europe and Feridex® in the U.S.A, whose diameter is 80-150nm and it is
comprised of magnetite crystals (each 4.8-5.6 nm in diameter) enclosed in dextran, a
glucose polysaccharide (Wang, Hussain, & Krestin 2001) (Figure 2.5).

Chapter 2 MRI and superparamagnetic iron oxide
- 61 -
Figure 2.5 – Endorem® structure and superparamagnetism [Adapted from Wang, Hussain & Krestin 2001]
Each Endorem® particle is 80-150 nm in diameter and consists of iron crystals
enclosed in dextran (a). In the absence of an external magnetic field, the magnetic
domains of SPIO are orientated randomly (b), but will align parallel to the Bo field
once inside an MRI scanner and thus give the particle its own magnetisation (c).

Chapter 2 MRI and superparamagnetic iron oxide
- 62 -
2.3.2 Endorem for in vivo contrast enhancement in humans
Endorem® has been licensed by the Food and Drug Administration (FDA) for MRI of
the liver. Following injection in the peripheral circulation, the iron particles are rapidly
phagocytosed by the reticuloendothelial system in the liver (blood half-life: 6h), causing
a decrease in signal intensity of the liver parenchyma. The signal intensity of lesions
that do not contain phagocytic cells, such as metastatic tumours, remains unaffected;
this increases tumour-to-liver contrast and lesion detectability (Reimer & Tombach
1998)(Figure 2.6). Endorem® has been shown to be fully biocompatible following
intravenous injection; the particles are broken down intracellularly in the liver and the
iron is eventually incorporated in erythrocyte haemoglobin (Weissleder et al. 1989).
2.3.3 SPIOs for cellular tracking in vivo
Apart from the usual usage of SPIOs, with the advent of cell therapies it is becoming
ever more important to be able to monitor stem cell migration and trafficking (Bulte &
Kraitchman 2004). In the cardiovascular system, SPIO-labelled MSCs have been
tracked in the heart of rats, pigs and dogs for up to 7 weeks after peripheral or
intracardiac injection (Chemaly et al. 2005). Following peripheral injection, MSCs have
also been tracked in the spleens of rats (Arbab et al. 2004a). These are only a few
examples of the multitude of research that has focused on SPIO-based cell tracking.
More importantly for this thesis, CD34+ cells (Figure 2.7) and CD133+ cells (Figure
2.8) have been previously labelled with SPIO. This has allowed single CD34+ cell
visualisation in the bone marrow of immunodeficient mice (Lewin et al. 2000) and
CD133+ cell incorporation into sites of neovascularisation of tumours implanted in
mice (Arbab et al. 2008; Arbab et al. 2006; Rad et al. 2009). For a discussion of the
latter studies with CD133+ cells see section 4.2.4.2.

Chapter 2 MRI and superparamagnetic iron oxide
- 63 -
Figure 2.6 – Contrast enhancement of liver lesions using Endorem® a: pre-contrast, b: post-contrast [Adapted from Lee et al. 2003]

Chapter 2 MRI and superparamagnetic iron oxide
- 64 -
Figure 2.7 – MR visualisation of CD34+ cells in the mouse bone marrow [Adapted from Lewin et al. 2000]
Ex vivo MR images of immunodeficient mouse bone marrow 24 hours after injection of
(a) SPIO-labelled and (b) unlabelled CD34+ cells. Acquired at 14T.
Figure 2.8 – MRI of CD133+ cells trafficking to a site of tumour angiogenesis [Adapted from Arbab et al, 2006]
Approximately 2 weeks after peripheral injection, SPIO-labelled CD133+ cells were
visualised as a diffuse hypointensity at the tumour site (a). Only a dark central area of
necrosis can be seen in the control tumours (b).

Chapter 2 MRI and superparamagnetic iron oxide
- 65 -
2.3.4 In vitro SPIO labelling methods
The first reports on labelling non-phagocytic cells with MR contrast agents in vitro date
to the early 1990’s, in which mouse neural transplants were labelled with iron oxide
(Hawrylak et al. 1993). SPIOs have since been used to label a variety of cells, including
lymphocytes, leucocytes, monocytes and neural, mesenchymal and haematopoietic stem
cells (Bulte & Kraitchman 2004). Several groups used SPIOs without modifying the
dextran coating, thus depending on non-specific endocytosis-mediated uptake, which
generally resulted in low iron uptake in non-phagocytic cells. Initial efforts to increase
uptake, which included enclosing the iron oxide in liposomes (Bulte et al. 1993) or
using lectins (Bulte et al. 1996), led to moderate success.
Markedly increased intracellular incorporation was first achieved in 1999 by
modification of the dextran coating of the particles to utilise specific receptor-mediated
endocytosis pathways. One method involved conjugating the dextran with the HIV tat-1
peptide (Josephson et al. 1999; Lewin et al. 2000). This peptide contains a signal that
causes membrane translocation, thus aiding the incorporation of the particles into the
cell. The other method involved conjugation of the mouse antibody for transferring
receptor ‘OX-26’ with the dextran coating, which caused receptor-mediated endocytosis
via the transferrin receptor situated on the cell membrane (Bulte et al. 1999). Other
attempts included conjugating particles with polymeric dendrimers, producing
‘magneto-dendrimers’ (Bulte et al. 2001) or manufacturing dextran-free anionic
particles (Billotey et al. 2003; Wilhelm et al. 2003a).
A method that has gained in popularity is the combination of SPIOs with transfection
agents through electrostatic interactions (Kalish et al. 2003). Promising results have
been obtained using high molecular weight poly-L-lysine (PLL) (Anderson et al. 2004;
Arbab et al. 2003b; Arbab et al. 2003a; Cahill et al. 2004; Frank et al. 2003; Frank et al.

Chapter 2 MRI and superparamagnetic iron oxide
- 66 -
2002; Kraitchman et al. 2003) and SPIO-protamine sulphate complexes (FePro). The
latter has been shown to yield better results, both in terms of labelling efficiency and
cell viability (Arbab et al. 2005; Arbab et al. 2004b; Panizzo et al. 2009). Despite being
efficient in labelling, all of the above methods have the obvious disadvantage of being
custom-made in the laboratories, not commercially available, and lacking FDA
approval. For example, there have been reports of impaired differentiation capacity
following labelling with the combination of Feridex® and PLL (Kostura et al. 2004).
However, there are no reports of decreased viability or differentiation when Endorem®
(or Feridex®) alone were used. To date, there has been only one clinical study of MR-
based cell tracking in humans using MRI (de Vries et al. 2005). In this study, the cells
were labelled with Endorem® alone.
Previous work with haematopoietic cells has included labelling with micron-sized iron
oxide particles (Hinds et al. 2003), SPIO-PLL (Arbab et al. 2003a) and SPIO-protamine
sulphate complexes (Arbab et al. 2008; Arbab et al. 2006; Arbab et al. 2005; Arbab et
al. 2004b; Rad et al. 2009). Cellular iron content in these experiments ranged from 10-
30pg/cell. All studies reported good cell viability using preliminary assays such as
trypan blue exclusion and metabolic activity assays and undisturbed differentiation. In
general, adherent cells are easier to label than cells in suspension; the mechanism
responsible for this observation has not been elucidated (Arbab et al. 2003a).
22..44 SSuummmmaarryy
MRI is an anatomical imaging technique based on the magnetisation of tissue. This
magnetisation can be disturbed by the presence of iron, and this effect has been utilised
to non-invasively track cells labelled with iron oxide agents. Despite the numerous
labelling protocols available, their clinical use has possibly been hampered by the
implementation of non-approved manufacturing protocols and transfection agents.

- 67 -
CCHHAAPPTTEERR 33
MMAAGGNNEETTIICC TTAARRGGEETTIINNGG

Chapter 3 Magnetic targeting
- 68 -
33..11 IInnttrroodduuccttiioonn
This chapter will provide an outline of the current state of magnetic targeting in
medicine. Following that, I will present the essential background to magnetism and
fluid dynamics for the understanding of the studies within the thesis.
The Greek philosopher Thales of Miletus (600BC) described magnetic rocks as stones
with a soul, in one of the first written accounts of magnetism (Meyer 1972; Mourino
1991). This remote force has opened a new frontier for targeted delivery of magnetically
tagged molecules and cells in modern medicine. The ability to localise the desired entity
to a specific site from the peripheral circulation could offer increased efficiency due to a
decrease in initial dosage, a decrease in non-specific distribution and side-effects, and
maximum delivery to the target site (Lübbe, Alexiou, & Bergemann 2001).
As concluded in Chapter 1, there is a need for stem cell targeting strategies. Although
magnetic drug targeting has been extensively studied in the last two decades, cell
targeting has only just picked up and is still very much in its infancy.

Chapter 3 Magnetic targeting
- 69 -
33..22 MMaaggnneettiicc ttaarrggeettiinngg iinn mmeeddiicciinnee
3.2.1 Laboratory uses of magnetic targeting
Since the 1980s there has been an increase in the use of magnetic carriers for
biomedical applications. Perhaps the most widespread use is found in cell sorting
equipment, where a magnetic bead conjugated to an antibody is used to separate the
desired cell type by application of a magnetic force (Chalmers et al. 1998); for example,
this immunomagnetic separation method has been used to select CD133+ cells from
peripheral blood or bone marrow aspirates for EPC cultivation. Magnetic plates are also
commonly used to increase transfection of cells with magnetically labelled DNA
(Schillinger et al. 2005).
3.2.2 Magnetic drug targeting
Drug targeting to specific locations would be of great interest, particularly in the case of
cancer, as anti-cancer medications have considerable side-effects. Magnetic drug
targeting (MDT) was first suggested in the late 1970s. Since then many research groups
have attempted MDT for cancer in various animal models, including mice and rats, with
promising results such as enhanced tumour regression (Dobson 2006). Two Phase I/II
clinical trials have been conducted so far, which confirmed the feasibility and safety of
targeting magnetic carriers bound to anti-cancer medication (Lübbe, Alexiou, &
Bergemann 2001; Wilson et al. 2004).
An important issue that has hampered the transition from animal models to humans is
the scale-up of the magnetic forces, which have to be sufficient to withstand the fluid
forces in the circulation. The majority of investigations have considered the application
of external magnets; in humans this translates to very weak forces in deeper regions.

Chapter 3 Magnetic targeting
- 70 -
There have been several attempts to model and ascertain the relationship between
particle size, iron content, and magnetic and fluid forces, for iron oxide particles ranging
from 10nm to 2µm (Chen et al. 2008; Cregg, Murphy, & Mardinoglu 2008; Furlani &
Furlani 2007; Grief & Richardson 2005; Min-Cheol et al. 2006; Ritter et al. 2004;
Voltairas, Fotiadis, & Michalis 2002). The details of these reports are beyond the scope
of this text as they have dealt with relatively small carriers with high iron content,
which is a scenario not applicable to targeting of cells. However, the consensus is that
magnetic targeting using external magnets will be most effective in regions close to the
surface of the body. It is not possible to ‘focus’ the force to a deeper region; the area
closer to the magnetic source will always experience a stronger force.
To allow for targeting of deeper regions within the body, there have been some invasive
attempts to embed metallic implants in the tissue that cause a local magnetic force; these
take the form of needles, stent-like wires and seeds (Avilés, Ebner, & Ritter 2008;
Forbes et al. 2003; Forbes et al. 2008; Iacob et al. 2004; Yellen et al. 2005). For
example, in vivo studies have suggested that magnetic implants can successfully target
drugs in deep regions of the body. In 2000, Kubo and colleagues showed that
implantaion of a permanent magnet to a tumour site increased magnetic liposome
delivery by four-fold (Kubo et al. 2000). In addition, magnetic stent-like structures have
been shown to enhance drug delivery in flowing circulations, both in vitro (Avilés,
Ebner, & Ritter 2008) and in vivo (Forbes et al. 2008).
3.2.3 Magnetic cell targeting
Targeting cells from the peripheral circulation to a site of interest would have the
obvious advantage of decreasing the number of cells needed for treatment and

Chapter 3 Magnetic targeting
- 71 -
concentrating the cells to the injury site. It has now been a decade since the first
magnetic cell targeting report (Consigny, Silverberg, & Vitali 1999). In this time, few
studies have looked into the possibility of targeting cells to specific locations within the
body. However, the increasing interest in stem cells has caused a rise in cell targeting
investigations, particularly in the last two years.
In vitro application of a magnetic field on cells via small magnets under the culture
plate has been shown to concentrate cells in the area directly above the magnet. This has
been shown using mature ECs labelled with 4.5μm-diameter beads (Consigny,
Silverberg, & Vitali 1999), SPIO-PLL labelling of MSCs (Arbab et al. 2004a) and
extracellular labelling of neural progenitor cells with integrin-binding microbeads
(Hamasaki et al. 2005). Movement of macrophages in a field gradient has also been
recorded with speeds up to 40μm/sec (Wilhelm, Gazeau, & Bacri 2002). Perhaps the
most unusual aspect of the recent interest in magnetic cell targeting is creating cell
patterns (Frasca, Gazeau, & Wilhelm 2009; Ho et al. 2009; Ino, Ito, & Honda 2007)
(Figure 3.1 and Figure 3.2).
There have been limited in vivo cell targeting studies to date. In 1999, Consigny and co-
workers used labelled and unlabelled mature circulating endothelial cells (CECs) in a
rabbit iliac artery injury model. In their hands, catheter-delivered unlabelled CECs are
pulled by gravity and only attach to the lower side of the lumen in the absence of flow.
By using a combination of labelled and unlabelled CECs, an external magnet attached
on top of the artery, and axial rotation of the animal, they achieved near-circumferential
attachment of CECs.
Although this study by Consigny is a proof of concept, there are several issues that
could be improved upon. Firstly, mature, non-proliferative CECs were used, which
would possibly fail to multiply and re-endothelialise the artery following attachment.

Chapter 3 Magnetic targeting
- 72 -
Figure 3.1 – Magnetic cell spelling [From Ino, Ito and Honda 2007]
A metallic strip was embedded in a laser cut block (A) to spell out M,A,G (B-D).
Figure 3.2 – Star formations with magnetic cells [Adapted from Ho et al 2009]
A star-shaped magnetic device under the culture plate resulted in formation of a star-
shaped cell colony (a), which did not form in the absence of the magnetic device (b).
Interestingly, the stars formed even in the absence of iron oxide in the cells! (c and d).

Chapter 3 Magnetic targeting
- 73 -
A long-term investigation of re-endothelialisation was not performed; on the contrary
the arteries were excised immediately after cell delivery and were investigated in only
two animals. Finally, the beads used were micron-sized and not biodegradable; in
addition was no investigation of the effect of the beads themselves, or of magnetic
attraction, on cell viability. Later studies improved on some of these issues.
A few years later, SPIO-PLL labelled MSCs were targeted to the rat liver by using an
external magnet (Arbab et al. 2004a). The doubling in cell number was attributed to the
magnet and confirmed using histology and MRI. Although stem cells were used in this
study, the clinical applicability of MSC targeting to the liver is limited and not
discussed in the paper. SPIO labelling was shown not to affect the cell’s viability;
however any effect of the magnetic forces was not examined. Finally, the authors used
PLL to transfect the cells, which is not optimal with regard to cell safety (section 2.3.4).
In 2006, endothelial outgrowth cells (EOCs) labelled with non-biodegradable micron-
sized SPIO beads were injected in a carotid/femoral artery injury model in the absence
of flow. In an attempt to increase the magnetic force locally, a magnetic wire (in the
form of a stent) was implanted and this increased cell adhesion following 24h of
reperfusion (Pislaru et al. 2006b). Although adhesion at 24h is, in effect, an indication
of good viability after the application of the magnetic force, again this was not
thoroughly examined in this study. Furthermore, attraction was not performed by using
an external magnet but required an insertion of a custom-made permanent device.
Two more reports appeared in 2008. In the first, monocytes were labelled with magnetic
particles available from the company Sigma-Aldrich, and targeted to the post-capillary
venules of tumours using external magnets; the authors suggested that in the future this

Chapter 3 Magnetic targeting
- 74 -
may be used to deliver genes that can cause tumour cell death (Muthana et al. 2008).
The other study used a magnetisable intravascular stent and external magnetic fields to
generate high forces and target mature endothelial cells, labelled with custom-made iron
particles, to carotid arteries (Polyak et al. 2008). For the first time, in these two studies
the in vivo data were accompanied with in vitro data showing magnetic capture of cells
within a flowing vessel at the appropriate flow speeds.
Finally, since the beginning of 2009, another two studies have been published. The first
successfully targeted lentiviral vectors and umbilical vein endothelial cells to murine
large arteries by implanting small strong magnets adjacent to the vessel wall (Hofmann
et al. 2009). In the second, the authors managed to increase the numbers of hepatoma
cells trafficking to murine livers by using an external magnet (Luciani et al. 2009). The
clinical applicability of targeting cancer cells to the liver is questionable; despite this, as
with Arbab (2004), this shows it is possible to target deeper regions in the body.
In summary, magnetic cell targeting is still limited to animal models. This may be
attributable to two factors: 1) the problems associated with scaling up the magnetic
forces to human distances, and 2) the widespread use of non-approved agents and
devices, which make targeting easier due to higher iron content and applied magnetic
forces, but at the same time may well be an obstacle to clinical translation. For
structures close to the skin and slower flow speeds, external magnets are generally used,
which would not require approval. Efforts on cell targeting in the arterial circulation
have necessitated the use of large non-biodegradable micron-sized beads (Consigny,
Silverberg, & Vitali 1999; Pislaru et al. 2006b; Pislaru et al. 2006a) or nanoparticle
composites fabricated in-house (Polyak et al. 2008), and in most cases the additional

Chapter 3 Magnetic targeting
- 75 -
introduction of permanent metallic devices not currently approved for human use
(Hofmann et al. 2009; Pislaru et al. 2006b; Pislaru et al. 2006a; Polyak et al. 2008).
Furthermore, the effect of applying a magnetic field or force on the viability of labelled
cells remains largely unknown; interestingly, it has been observed that under a magnetic
field, endosomes containing SPIOs elongate, align along the field lines and may fuse,
due to the acquisition of magnetic dipole moment (Wilhelm et al. 2003b). Whether such
organelle re-arrangements are harmful is not known.

Chapter 3 Magnetic targeting
- 76 -
33..33 BBaassiiccss ooff mmaaggnneettiiccss
3.3.1 Magnetic fields
The source of all magnetic fields is a moving electrical charge (Schmitt 2002). This can
be the spatial movement of a charged particle such as an electron (Figure 3.3), or the
spin of a particle around its axis (as it happens in the case of the hydrogen protons that
give the MRI signal, section 2.2.1). Permanent magnets have an ordered crystalline
structure with aligned magnetic moments, giving the material a magnetic field (Figure
3.4). One of the strongest magnetic materials for permanent magnet design are ‘rare
earth’ alloys such as neodymium iron boron (Nd2Fe14B) magnets, which are available
commercially at various grades.
Using mathematical notation, the magnetic field at a specific location can be
represented by a vector, which has both a magnitude and a direction (polarity). In this
thesis vectors are represented by a bold character. The magnitude of the vector is
represented by a non-bold character (e.g. H=||H||). Two notations used to describe
magnetic fields are the magnetic field strength H (in amperes per meter, A/m), and the
magnetic induction B (in Tesla, T). B can be thought of as the magnetic field induced in
(and felt by) a material, when an external field H is applied to the material. B and H are
the same only in free space, and connected by the equation B = µ0H, where µ0 = 4π x
10-7 (in Tm/A, SI units) is the magnetic permeability of free space. However, the atomic
structure of matter responds to H, changing the field B within the material; this effect
will be considered next.

Chapter 3 Magnetic targeting
- 77 -
Figure 3.3 – Magnetic field around a moving electron [Adapted from Schmitt 2002]
Figure 3.4 – Magnetic field around a permanent magnet [From Schmitt 2002]
Permanent magnets tend to align with the Earth’s magnetic field; they have a ‘North’
and a ‘South’ pointing pole. The material’s magnetic field is due to the ordered
crystalline structure with aligned magnetic moments (e.g. ferromagnetic materials).

Chapter 3 Magnetic targeting
- 78 -
3.3.2 Magnetisation of materials
When a material is placed in an applied magnetic field, a magnetic dipole moment m (in
Am2, SI units) is induced in the material. The way the material reacts, i.e. the direction
and magnitude of the dipole moment, depends on the structure of the material.
According to the way materials react, they can be classified into diamagnetic,
paramagnetic, ferromagnetic and superparamagnetic (Pankhurst et al. 2003; Schmitt
2002).
The vector sum of the dipole moments in a volume of the material (Vm, in m3) is the
magnetisation M, given by M = m/Vm (A/m). If a material is placed in a magnetic field
of strength H, the magnetic field induced within the material (B) is given by
Equation 3.1
In turn, M is dependent on H; for moderate magnetic field strengths, the change in
magnetisation is proportional to the material’s magnetic susceptibility (χ), which is
dimensionless in SI units:
Equation 3.2 In diamagnetic materials (e.g. copper), a very weak magnetisation is induced that
opposes the applied magnetic field. This is an intrinsic phenomenon in nature, whereby
the motion of electrons orbiting around the nucleus changes in order to oppose the
effect of the applied magnetic field. Although all materials have this diamagnetic
component, only materials with no unpaired electrons exhibit diamagnetism.
In paramagnetic materials (e.g. aluminium), unpaired electrons exist. The spin of these
electrons around their own axis creates an additional magnetisation, which in this case
aligns with H so that B is now increased within the material; this magnetisation over
( ) .0 MHB += μ
.HM χ=

Chapter 3 Magnetic targeting
- 79 -
comes the diamagnetic component but is also quite weak, so paramagnetic materials
have a small positive susceptibility.
Ferromagnetism is responsible for the existence of permanent magnets. Ferromagnetic
materials (e.g. iron) have ordered clusters of magnetic dipole moments (domains),
which align with the applied H-field. The difference between paramagnetic materials
and ferromagnetic materials, is that in ferromagnetic materials the entire domain will
align with application of an external H-field. As a result, the susceptibility of these
materials is much higher; M can typically be 104 times higher than in paramagnetic
materials, and the resulting B-field is correspondingly increased. These materials
exhibit memory (hysteresis); once the H-field is removed the domains remain partly
aligned, giving the materials a remanent magnetisation (Mr). Another thing to note is
that at H-fields of high magnitude, M reaches a saturation value (Ms) as the domains are
maximally aligned with the H-field; in this case
Equation 3.3
For the sake of simplicity, it is common to define two limiting scenarios (Hayden &
Hafeli 2006):
i) the unsaturated response, in which M changes proportionally to H (M = χH)
ii) the saturated response, in which M is independent of H (M = Ms H/H)
Two classes of material similar to ferromagnets are ferrimagnets and antiferromagnets;
these materials have more complex structures and magnetic ordering within the
material. One example is magnetite (Fe3O4), in which the Fe ions occupy two distinct
interlaced sublattices. The magnetic Fe atoms in the two sublattices point in opposite
directions and they are slightly different in size. Thus there is a net magnetisation
.HM s HM =

Chapter 3 Magnetic targeting
- 80 -
overall and magnetite behaves similarly to a ferromagnetic material. In antiferromagnets
such as haematite (α-Fe2O3), the magnetic moments on the two sublattices are the same
size and cancel each other, thus there is no net magnetisation.
Superparamagnetic materials behave similarly to ferro/ferrimagnetic materials and
attain large M values; however the particle size allows for the magnetic moment of the
entire particle to rapidly fluctuate between energy minima in the absence of an H-field,
so that they do not show hysteresis and thus do not remain magnetised once the H-field
is removed. This property of superparamagnetic materials is dependent on the size of
the particle and a critical temperature, the blocking temperature TB, below which the
material exhibits hysteresis.
M-H curves of materials (e.g. iron oxide solutions) and biological samples (e.g. cells)
can be obtained using a superconducting quantum interference device (SQUID) (Hautot,
Pankhurst, & Dobson 2005). The susceptibility χ, remanent magnetisation Mr and
saturation magnetisation Ms can be derived from these curves (Figure 3.5).

Chapter 3 Magnetic targeting
- 81 -
Figure 3.5 – Magnetisation vs magnetic field strength (M-H) curves [From Pankhurst et al 2003]
Diamagnetic (DM) materials exhibit a very weak net magnetisation in the opposite
direction of the applied H-field. Paramagnetic (PM) materials exhibit a weak
magnetisation in the direction of the H-field. Note that since M = χH, the magnetic
susceptibility χ is the slope of the M-H curve. Ferromagnetic (FM) materials have much
increased net magnetisation and exhibit hysteresis; following removal of the H-field
these materials remain magnetised with M=Mr. At high field strengths, the
magnetisation reaches a saturation value M=Ms. Superparamagnetic (SPM) materials
do not exhibit hysteresis.

Chapter 3 Magnetic targeting
- 82 -
3.3.3 Magnetic forces
Magnetic actuation of an element refers to movement of that element under the
influence of a magnetic force. This force is the result of the presence of a magnetic field
and also a gradient in that field, i.e. the rate at which the field strength is changing in
space (Jiles 1998; Pankhurst et al. 2003). The force Fm (measured in Newtons, N) acting
on a magnetic particle with point-like dipole moment m in a static, non-homogeneous
field B is defined as (Pankhurst et al. 2003):
Equation 3.4
where kjiz∂
+∂
+=∂
y∂
x∂
∂∇ is the gradient operator, m=mxi + myj + mzk, B=Bxi +
Byj + Bzk and i, j and k are unit vectors in 3-dimensional Cartesian coordinate system.
Within this thesis, the magnetic forces on SPIO-labelled cells have been modelled using
computer software. Due to the way these programs operate, it is necessary to express the
force in terms of magnetic susceptibility of the cells. The forces on each axis must also
be calculated in terms of the xyz components of the H-field vector, before calculating
the total magnitude of the force. This is achieved as follows:
Assuming the cells are suspended in water, the magnetisation of the water is negligible
and B = µ0H (from Equation 3.1) Also, mc = VcMc (the ‘c’ subscript denotes ‘cell’).
In the unsaturated case, Mc = χcH (Equation 3.2) and Equation 3.4 becomes:
Equation 3.5 Thus the force is higher with higher magnetic susceptibility of the cell (more iron
content), and is dependent both on the magnetic field strength and also its gradient, i.e.
( ) ,BmFm ∇⋅=
( ) .Vccunsat, HHFm ∇⋅= χμ0

Chapter 3 Magnetic targeting
- 83 -
the rate with which the magnitude of H ( ||H||=H ) is changing. The fast drop-off of
magnetic field and field gradient at increasing distances is the main reason the scale-up
of magnetic drug targeting from small animal models to humans has been so
challenging, so magnetic devices have to be designed carefully.
To define the force in terms of the xyz components of the H-field vector, we have
( ) zHyHxH zyx ∂∂∂∂∂∂∇ ++=⋅H and kjiH zyx HHH ++= . Thus:
( )
⎟⎟⎠
⎞⎜⎜⎝
⎛
∂∂
+∂
∂+
∂∂
+⎟⎟⎠
⎞⎜⎜⎝
⎛∂∂
+∂
∂+
∂∂
+⎟⎟⎠
⎞⎜⎜⎝
⎛∂∂
+∂
∂+
∂∂
=∇⋅
kji
kjikjiHH
zH
zH
zH
H
yH
yH
yH
Hx
Hx
Hx
HH
zyxz
zyxy
zyxx
Because kjiF zyx FFF ++= , the force component of each of the three axes is:
⎟⎟⎠
⎞⎜⎜⎝
⎛∂∂
+∂∂
+∂∂
=
⎟⎟⎠
⎞⎜⎜⎝
⎛∂∂
+∂∂
+∂∂
=
⎟⎟⎠
⎞⎜⎜⎝
⎛∂∂
+∂∂
+∂∂
=
zHH
yHH
xHHVχμF
zH
Hy
HH
xH
HVχμF
zHH
yHH
xHHVχμF
zz
zy
zxccunsat,z
yz
yy
yxccunsat,y
xz
xy
xxccunsat,x
0
0
0
The magnitude of the force vector is then 222
zyxunsat,munsat,m FFFF ++==F . In the case of 2-dimensional modelling 0== zz FH . In the saturated case, the magnetic force is independent of the magnitude of H (but still
dependent on the gradient of H). From Equation 3.3 and Equation 3.4 it follows that
Equation 3.6
( ) ( ) ,H
VMHVM cc,scc,ssat,HHHHFm ∇⋅=∇⋅= 00 μμ

Chapter 3 Magnetic targeting
- 84 -
where Ms,c is the saturation magnetisation of the cell and 222
111
zyx HHHH ++==
H.
The forces in each direction then become:
⎟⎟⎠
⎞⎜⎜⎝
⎛∂∂
+∂∂
+∂∂
=
⎟⎟⎠
⎞⎜⎜⎝
⎛∂∂
+∂∂
+∂∂
=
⎟⎟⎠
⎞⎜⎜⎝
⎛∂∂
+∂∂
+∂∂
=
zHH
yHH
xHH
HMsVμF
zH
Hy
HH
xH
HH
MsVμF
zHH
yHH
xHH
HMsVμF
zz
zy
zxsat,z
yz
yy
yxsat,y
xz
xy
xxsat,x
1
1
1
0
0
0
These forces will be more accurate in cases where the cells are in a magnetic field of
high magnitude.
The susceptibility of the cell χc is the susceptibility of the iron oxide the with which it is
loaded χ(Fe3O4) scaled to the volumetric amount of Fe3O4 in a single cell. The
susceptibility of the iron oxide χ(Fe3O4) can be estimated from SQUID M-H curve of a
sample (Figure 3.6). The susceptibility of the cell χc can be estimated from the M-H
curve of a cell sample or calculated from the volume-per-volume loading of the cell
with Fe3O4 (Lc), if χ(Fe3O4) is known:
Equation 3.7
Equation 3.8
where m is the mass of Fe3O4 in the cell, ρ is the Fe3O4 density and Dc the cell diameter.
The saturation magnetisation Ms,c can be estimated from the SQUID M-H curve of a cell
sample or scaled volumetrically from the saturation of Fe3O4.
,
63
434343
c
OFeOFe
c
OFec
D
ρmV
V L
π==
,Lχχ cOFec ×=43

Chapter 3 Magnetic targeting
- 85 -
Figure 3.6 – SQUID M-H curve of a sample of Endorem®
The measured magnetisation is shown in black. For force calculations it is common to
distinguish between two limiting approximate cases (green). That for which M increases
in proportion to H (M=χH) and that in which the magnetisation reaches a saturation
value Ms. The saturation limit is defined arbitrarily. Here χ=0.789 up to H=398 kA/m
(B=0.5T in free space or weakly diamagnetic medium such as water). For H>398 kA/m
(B>0.5T), the forces should be calculated using the expressions for the saturated case.
Note that because the calculation of χ for Endorem® is made based on the arbitrary
selection of the saturation limit, all further calculations are based on this
approximation. This data was acquired by Dr Ana Garcia-Prieto as part of this project.

Chapter 3 Magnetic targeting
- 86 -
33..44 FFlluuiidd ddyynnaammiiccss
3.4.1 Introduction
Fluid dynamics is the study of flowing liquids and gases (fluids). In the case of
magnetic targeting, it is easy to appreciate that the success of cell capture within a
flowing circulation will depend on the ability of the magnetic force to drag the cells
through the moving liquid, overcoming the drag forces acting on the cells from the
liquid. This relationship is considered in Chapter 6 of this thesis. This introductory
section will briefly describe the theory on which Chapter 6 is based (Fay 1994;
Nakayama & Boucher 1999; Shaughnessy, Katz, & Schaffer 2005).
3.4.2 Basic concepts
While the classification of a substance into a gas or a liquid is straightforward, the
boundary between liquids and solids is less clear. For example, materials such as
porridge, paint and toothpaste lie somewhere between a solid and a liquid, and behave
in a complex way when a force is applied on their surface. Such semi-fluids are called
non-Newtonian. In contrast, all gases and most common liquids, such as water, are
called Newtonian.
The governing equations that describe the behaviour of a Newtonian fluid are called the
Navier-Stokes equations. These equations are complicated, but can be simplified in a
number of ways that make them easier to solve in each specific application
(Shaughnessy, Katz, & Schaffer 2005). One such simplification is the case of fluid that
is incompressible (i.e. has constant density), which is a valid approximation for all
liquids. The Navier-Stokes equations can be applied to a large number of fluid
dynamics problems under turbulent or laminar flow.

Chapter 3 Magnetic targeting
- 87 -
3.4.3 Turbulent vs laminar flow
Turbulent flow is the chaotic behaviour of the fluid that results from large inertial
forces. Whether fluid flow is turbulent or laminar (Figure 3.7) depends on the
dimensionless Reynolds number, which is essentially a ratio of the inertial versus
viscous forces in the fluid:
Equation 3.9
where ρ is the fluid density (kg/m3), u is flow velocity (m/s), L is a characteristic length
scale (m) and µ is the fluid viscosity (kg/ms) (Figure 3.8). Thus higher Re results in
more turbulence.
Low Re values result in laminar flow; this means that the flow occurs in parallel layers
(laminae) that do not get disturbed (Figure 3.7). For example, pipe flows with Re<2300
are almost always laminar. Flow with Re<1 is called creeping or Stokes flow. It has to
be noted that the transition Re, above which flow starts to become turbulent, can be very
different depending on whether the flow under consideration is internal (e.g. flow in a
pipe) or external (e.g. flow around a sphere); see Figure 3.8.
Only laminar flows will be considered from this point onwards.
,uLReμρ
=

Chapter 3 Magnetic targeting
- 88 -
Figure 3.7 – Laminar and turbulent flow visualisation [From Shaughnessy, Katz, & Schaffer 2005]
Side view a parallel chamber with flow from left to right. Dye injected in slow, laminar
flow travels in a single streamline (top image). The flow becomes turbulent with
increasing fluid velocity (middle and bottom).
Figure 3.8 – Choice of velocity and length scales used in calculating Re a: internal flow, b: external flow
[Adapted from Shaughnessy, Katz, & Schaffer 2005]

Chapter 3 Magnetic targeting
- 89 -
At boundaries with solids, the surface is so rough at a molecular level that there is no
relative motion between the fluid and solid particles. This creates a boundary layer with
zero velocity and what is known as a “no-slip” condition. In laminar flow, the velocity
then progressively increases, so that at the centre of the flow field the velocity reaches a
maximum (Figure 3.9). The velocity across a pipe has a parabolic flow profile; at any
point of the pipe radius r, the velocity u is given by:
Equation 3.10
where R is the radius of the pipe. The average velocity uav related to the average flow
rate Q and the tube cross-sectional area A: uav=Q/A. In computer modelling, it is
simpler to model the flow through parallel plates in 2 dimensions. The velocity field is
then given by:
Equation 3.11
where h is the distance between the plates and y=0 is the mid-plane between the plates
(Figure 3.9).
Laminar flow with a parabolic profile is the model of choice in magnetic drug targeting
simulations (Avilés, Ebner, & Ritter 2008; Chen et al. 2008; Cregg, Murphy, &
Mardinoglu 2008; Forbes et al. 2003; Furlani & Furlani 2007; Grief & Richardson
2005; Voltairas, Fotiadis, & Michalis 2002; Wang, Liu, & Xu 2008).
avmaxmax ,Rr)r( uuuu 21
2
=⎥⎥⎦
⎤
⎢⎢⎣
⎡⎟⎠⎞
⎜⎝⎛−=
2231
2 ha,,ay)y( avmaxmax ==
⎥⎥⎦
⎤
⎢⎢⎣
⎡⎟⎠⎞
⎜⎝⎛−= uuuu

Chapter 3 Magnetic targeting
- 90 -
Figure 3.9 – Parabolic flow between two parallel plates [From Shaughnessy, Katz, & Schaffer 2005]

Chapter 3 Magnetic targeting
- 91 -
3.4.4 Hydrodynamic drag on a sphere
Hydrodynamic drag is the force that a moving fluid exerts on an immersed body. For a
sphere of radius r (m), in a fluid of density ρ and velocity u this force is given by:
Equation 3.12
where A=πr2 (m2) is the maximum cross-sectional area of the sphere and CD is a drag
coefficient. This drag coefficient is a function of the Reynolds number around the
sphere, and thus depends on the fluid velocity and density, as well as the sphere
diameter. From Equation 3.9:
Equation 3.13
The relationship between CD and Re is not straightforward and is based on experimental
observations (Figure 3.10). For Stokes flow around the sphere (Re<1), the relationship
is linear, and CD ≈ 24/Re. The drag on a sphere with such low Re values is known as
Stokes drag, and Equation 3.12 can be simplified to:
Equation 3.14
This is an acceptable approximation, given that Re<1, and is therefore acceptable for
spheres in slow fluid velocity. Indeed, the above equation is used in the vast majority of
MDT simulations in the literature. However, from Re values of 1 and more, significant
error exists; for example at Re=0.2 the error is already 4% (Khan & Richardson 1987).
There have been several attempts to derive a single function that describes CD across a
wide range of Re numbers. One such function is that calculated by Khan and
Richardson (1987), according to which:
Equation 3.15 This function approximates CD for a range of Re values between 10-2 and 105 with
average error of 5% (Figure 3.11).
,ACDd2
21 uF ρ=
spheresphere rD,uDRe 2==μ
ρ
.rd uF μπ6=
( ) .Re.Re.C ...D
453060310 360841 += −

Chapter 3 Magnetic targeting
- 92 -
Figure 3.10 – The relationship between CD and Re [Adapted from Shaughnessy, Katz, & Schaffer 2005]
Figure 3.11 – The Khan and Richardson prediction for CD [Adapted from Khan and Richardson 1987]

Chapter 3 Magnetic targeting
- 93 -
33..55 SSuummmmaarryy
The properties of magnets have been known to humans for thousands of years.
Advances in drug technology have required more specific targeting, particularly in the
context of cancer treatment, where a decrease in non-specific distribution and side
effects is desirable. Drug targeting via magnetic interactions with an applied magnet or
implanted magnetic material is being considered in clinical trials as a way to physically
guide the drug to a desired site. In the context of stem cell therapy, a similar approach
could be employed to increase cell homing and retention at a desired site. This notion
seems to be gaining in popularity, however there have been limited investigations and
the effect of magnetic forces on cells has not been elucidated.
Magnetic drug targeting investigations have commonly been accompanied by some
form of theoretical analysis; however this has largely been absent from the cell targeting
field. The success of targeting will depend on the ability of a magnetic source to apply a
force large enough to withstand fluid forces or at least deflect the cells in a flowing
circulation. Therefore, the characteristics of the magnetic source, the cells and those of
the flowing medium need to be considered, and theoretical calculations can inform the
design of the targeting system.

- 94 -
CCHHAAPPTTEERR 44
DDEEVVEELLOOPPMMEENNTT OOFF DDIIFFFFEERREENNTTIIAALL LLAABBEELLLLIINNGG

Chapter 4 Development of differential labelling
- 95 -
44..11 CChhaapptteerr oovveerrvviieeww
This chapter deals with my initial studies on CD133 cell labelling and magnetic
attraction. For clarity, I have divided the chapter in two parts, each with separate
methods, results, discussion and conclusions.
The first part deals with cell labelling. As CD133 cells in culture can be either adherent
to the culture plate or in suspension, the primary objective was to ascertain any
differences in SPIO uptake between the adherent and suspension cell fractions. The
second undertaking in this part of the chapter was to investigate the relationship
between the time of incubation with SPIO and the amount of iron uptake.
Part II deals with cell viability following magnetic attraction. First, the development of
a magnetic device to perform viability tests is described. This is followed by the results
of these tests, and the subsequent development of the “differential labelling” method.

Chapter 4 Development of differential labelling
- 96 -
44..22 –– PPaarrtt II:: LLaabbeelllliinngg CCDD113333 cceellllss wwiitthh EEnnddoorreemm®®
4.2.1 Background and aims
CD133s remain in suspension when freshly isolated but become adherent over time in
culture (Gehling et al. 2000; Quirici et al. 2001). As mentioned in the introduction
(2.3.4), some reports have documented a decreased labelling efficiency with premature
and non-adherent cell types. We have also seen in section 2.3.4 that various conjugation
methods have previously been used in the past to increase SPIO uptake in such
problematical situations. Near 100% labelling has been achieved with CD133 cells
using FePro conjugates (Arbab et al. 2008; Arbab et al. 2006; Rad et al. 2009).
However, these customised methods may be an obstacle to clinical translation; to date
there has only been one clinical cell tracking study, which used the SPIO agent
Endorem® without any transfection agents (de Vries et al. 2005).
In this study, the aim was to:
i) Label CD133 cells with Endorem® and investigate if there are differences in
iron uptake between adherent and suspension cells.
ii) Investigate the ability of CD133 cells to be magnetically attracted.
iii) Investigate the relationship of labelling time to iron oxide uptake.
The main findings of this study were as follows:
i) Adherent cells label more readily than suspension cells.
ii) 65% of suspension cells can be magnetically separated following labelling,
which means they can be magnetically attracted.
iii) SPIO uptake is time-dependent. It is faster during the first hours of labelling.

Chapter 4 Development of differential labelling
- 97 -
The main purpose of this study was to confirm previous results regarding the ability
of cultured EPCs to be labelled with Endorem®. In the literature there are also
unclear suggestions that adherent cells incorporate Endorem®, as well as the notion
that uptake slows down as time progresses. Importanly, this was the first attempt to
quantify the difference in uptake between suspension and andherent cells.
Furthermore, the suggestion regarding time-varying rate of uptake was confirmed;
this effect was used in the development of the differential labelling method.

Chapter 4 Development of differential labelling
- 98 -
4.2.2 Methods
4.2.2.1 Cell culture
Human mononuclear cells (MNCs) were collected by leukapheresis from peripheral
blood of G-CSF-stimulated donors (Korbling et al. 2006). Blood samples were obtained
under consent and approval by the local ethics committee. CD133+ cells were isolated
using anti-human CD133 (epitope 1) magnetic microbeads (Miltenyi Biotech GmbH).
These beads are biodegradable and typically disintegrate after a few days in culture.
Each isolation provided approximately 5x10⁵ cells. The culture medium was based on
previous studies on EPC differentiation from CD133+ cells (Gehling et al. 2000; Quirici
et al. 2001). 2-6x10⁵ cryopreserved or fresh CD133+ cells per well were cultured in
fibronectin-coated 24-well plates (BD) for 3 days in EGM-2 medium (EBM-2 with
EGF, IGF, FGF, GA, ascorbic acid and heparin, Lonza) containing 20% FBS, 20mM
HEPES and supplemented with FLT-3 ligand 50ng/ml, IL-3 10ng/ml, SCF 100ng/ml
and rhVEGF165 25µg/ml (R&D systems). The cells were then cultured in similar FLT-
3 / IL-3 / SCF free medium for a further 7 days. Fresh medium (200uL) and VEGF was
added every 2-3 days for the duration of the culture.
4.2.2.2 Cell labelling
For labelling with Endorem® [Guerbet Laboratories Ltd, 11.2mg/ml iron (Fe)], the
whole cell population was incubated for 1, 12 or 24 hours in the presence of the
Endorem® suspension, as stated in sections 4.2.2.3 and 4.2.2.6.3, using 500 µg/ml Fe
(equivalent to 690 µg/ml Fe3O4). Day9-CD133s were used unless otherwise stated.
After labelling, cells were dissociated with 300µL dissociation buffer (Sigma) for
15mins and washed 3 times in 15mL PBS by centrifuging 12mins (250g, low brake).

Chapter 4 Development of differential labelling
- 99 -
4.2.2.3 Prussian Blue stain for microscopy
Iron uptake was visualised with Prussian Blue (PrB) staining. D9-CD133 cells were
labelled with Endorem® for 24 hours. Three samples of 2.5x10⁴ labelled d10-CD133s
were then incubated for 24hours in 100µL medium in wells of a 96-well plate, to allow
the adherent fraction to adhere to bottom of the wells. Control wells contained
unlabelled cells. After adherence, the whole d11-CD133 population was washed in situ
(see below), fixed in 4% PFA for 20 mins, washed again, incubated in PrB staining
solution (1% w/v KCN and 100mM HCl) for 30mins, washed and stored in PBS. The in
situ washing step in each case involved filling the wells to the top (300µL) with PBS,
spinning the whole 96-well plate at 200g for 2 minutes with no break to bring the
suspension cells to the bottom of the well, carefully removing the top 260µL from the
wells and repeating 4 times. There was no dissociation/trypsinisation step. Thus both
adherent and suspension fractions were stained without removing them from their
original wells.
4.2.2.4 Microscopy
Following PrB staining, the plate was spun one final time to bring all suspension cells to
the bottom. Phase contrast microscopy images were taken using a 20x objective, a 10x
eyepiece and a standard grayscale CCD camera; four random fields from each of the six
wells were captured (e.g. Figure 4.1). The wells were then rinsed with PBS to remove
the suspension cells, and images of the adherent cells alone were captured after finding
the same fields of view (Figure 4.2). Cells that stained dark with PrB throughout were
regarded ‘Prb positive’. Partially dark cells were regarded ambiguous and counted as
negative. The counts of PrB positive cells of four fields from each well were averaged
and the percentage of PrB positive cells was calculated for each of the three groups
(suspension population, adherent population, unlabelled control).

Chapter 4 Development of differential labelling
- 100 -
Figure 4.1 – PrB stain of whole d11-CD133 population. Partially dark cells (arrows) were regarded ambiguous and counted as negative.
Figure 4.2 – PrB stain of adherent d11-CD133s. This figure and Figure 4.1 on the
left are the same field of view.
Whole population Adherent population

Chapter 4 Development of differential labelling
- 101 -
A second count of PrB positive cells was repeated on images from 6 wells, at least 4
weeks later, to assess the repeatability of the counting method.
4.2.2.5 Magnetic separation
For a better estimation of the labelling efficiency of suspension cells, suspension d10-
CD133s, labelled for 24h, were passed through a magnetic separation column (Miltenyi
Biotech GmbH). Retained and non-retained cells were counted and expressed as a
percentage. The experiment was repeated 3 times.
4.2.2.6 Dependence of iron oxide uptake on incubation time
In these experiments the aim was to investigate whether SPIO uptake is dependent on
the time of incubation. Cellular iron content was quantified based on staining the cell
lysate for iron using prussian blue, and measuring a peak absorbance photometrically
(4.2.2.6). This method has been used previously (Rad et al. 2007) and was optimised
here for the specific available equipment. The results of this methodological
optimisation are given in Appendix A.
4.2.2.6.1 Method optimisation - absorbance spectrum of Prussian Blue
To determine the absorbance at which the PrB stain exhibits increased absorbance using
the available microplate reader and filters (GENios, Tecan), the following three 100µL
samples were analysed in triplicate. i) PrB staining solution + SPIO: 0.4µg Fe3O4
were mixed with 100µL PrB staining solution, resulting in a light-blue mixture. ii)
SPIO only: 0.4µg Fe3O4 in PBS. iii) PrB staining solution only. The absorbance of
these samples was then measured at the wavelength of the available filters (405, 450,
490, 560, 595, 690 and 900nm). The expected maximum is ~700nm (Rad et al. 2007).

Chapter 4 Development of differential labelling
- 102 -
4.2.2.6.2 Method optimisation - effect of the cell lysis buffer on the PrB reaction
To determine whether the cell lysis buffer, used to dissolve the cells and release the
iron, has itself an effect on the PrB reaction, mixture (i) above was prepared in the
presence of 10µL of the buffer (7M urea, 2M thiourea, 4% 3(-[(3-cholamidopropyl)-
dimethylammonio]-1-propanesulfonate) or 10µL PBS as a control, in triplicate.
Absorbance at 690nm (defined by the experiment above) was measured every 14
seconds for 6 minutes. The maximum absorbance reached was recorded. A 400-segment
cubic spline curve was fitted to interpolate the data and the time to reach the half-
maximum was estimated.
4.2.2.6.3 SPIO labelling timecourse
To determine whether cellular SPIO uptake is dependent on time length of labelling,
samples of 4.5x10⁵ d10-CD133 adherent cells were labelled with 0.5mg/ml SPIO for
24h, 12h, 1 hour or were left unlabelled. Specifically, d9 cells were labelled for 24h,
d9.5 for 12h and d10 for 1h. Samples were dissociated and washed twice in 15mL PBS,
pelleted and lysed in 10µL lysis buffer. The lysate was suspended in 300uL PBS
containing 1% KCN and 1.7% 6M HCl. The mixture was transferred to a 96-well plate
in triplicate 100µL aliquots. The final contents of each well were a mixture of lysate
from 1.5x10⁵ cells, 3.3µL lysis buffer and 100µL PrB staining solution. Three extra
wells contained 100µL PrB and 3.3µL lysis buffer, without cells, as a control.
Absorbance at 690nm was measured after 5 minutes.
4.2.2.6.4 Method optimisation – derivation of a standard curve
Five wells in triplicate were prepared containing dilutions of Endorem® (0, 3.4, 6.7,
13.4, 26.9 µg Fe3O4 / ml ) in 100µL PrB staining solution and 3.3µL lysis buffer. The

Chapter 4 Development of differential labelling
- 103 -
absorbance at 690nm was measured after 5 minutes and a 400-segment cubic spline
curve was fitted to interpolate the mean data.
4.2.2.7 Statistical analyses
Data were processed with SPSS for Windows v11.5.1 (SPSS Inc) or with Prism for
Windows v4.02 (GraphPad Software Inc). All p-values reported are two-tailed and
were considered statistically significant at the 5% level (p<0.05). Data were inspected
visually and with the Shapiro-Wilk test for small samples to test for normality. The
homogeneity of variance assumption was evaluated with Levene's test. When ANOVA
was performed and significant differences were found between groups, Tukey’ test was
used when comparing all groups between them and Dunnett’s multiple comparison test
was used when it was sufficient to compare all groups to a single control group. Other
statistical tests are identified in context.

Chapter 4 Development of differential labelling
- 104 -
4.2.3 Results
4.2.3.1 SPIO uptake and PrB staining of adherent and suspension cells
The majority of adherent cells (80.3%) were PrB positive (Figure 4.3). On the contrary,
the majority of the suspension cells were PrB negative (86.6%). No cells stained in
unlabelled controls (cell count = 0). In addition, in studies unrelated to this project, PrB
staining was not positive when ferritin expression was upregulated, indicating that
endogenous iron storage is not sufficient to cause false-positive results.
Figure 4.3 – PrB positivity of CD133 cell subtypes
The mean percentage of PrB positive adherent cells was 80.3 ± 4.7%, whereas that of
suspension cells was 13.4 ± 4.7%. The mean difference between the suspension and
adherent populations was 66.9% (95% CI for the difference 48.4% to 84.3%, p<0.001,
unpaired t-test). SEM: standard error of the mean, n=6.

Chapter 4 Development of differential labelling
- 105 -
4.2.3.2 Repeatability of the cell counting method
To assess the repeatability of the cell count, PrB positive cells in images from six
random wells were re-counted at least 4 weeks after the first count. Only these six wells
were re-counted.
Table 4.1 is a summary of the repeatability analysis. Figure 4.4 is the Bland-Altmann
plot.
The first and second counts were within the 95% limits of agreement (approximately ±
7%) and had a small negative bias (-1%). These values are small compared to the actual
differences between the groups (66.9%, section 4.2.3.1). Therefore, the cell count was
considered repeatable.

Chapter 4 Development of differential labelling
- 106 -
Table 4.1 – Count-recount of PrB positive cells
1st count 2nd count Difference
157 160 3
72 75 3
199 195 -4
107 102 -5
172 168 -4
86 83 -3
Bias -1.67
SD of bias 3.67 95% limits of agreement -8.86 to 5.53
Figure 4.4 – Bland-Altman plot of two counts
Figure 4.4 is a Bland-Altman plot of the two counts used to test repeatability. The solid
line is the bias (average difference). The dotted lines are the 95% limits of agreement
(bias ± 1.96 SD). All the differences between the counts fall inside the 95% limits of
agreement (-8.86 to 5.53). There was a negative average bias (-1.67).

Chapter 4 Development of differential labelling
- 107 -
4.2.3.3 Ability of CD133 cells to be magnetically attracted
The ability of CD133 cells to be magnetically attracted was tested based on their ability
to be retained inside a magnetic separation column.
On visual inspection of Prussian Blue staining, the majority of suspension cells (86.6%)
did not stain positively (section 4.2.3.1). However, 64% (±5.6) of suspension cells were
retained in the separation column. This means that, despite the decreased SPIO uptake
compared with adherent cells, the majority of suspension cells have enough iron oxide
to be pulled with a magnet inside the separation column.
Adherent cells stained positively throughout the cell with Prussian Blue. It was assumed
that this level of iron content would be sufficient to keep them retained in the separation
column, therefore the magnetic separation experiment was not performed on adherent
cells.
4.2.3.4 Dependence of iron oxide uptake on incubation time
4.2.3.4.1 Methodological developments
For a full description of the methodological developments that were necessary for the
derivation of the following results, please refer to Appendix A.
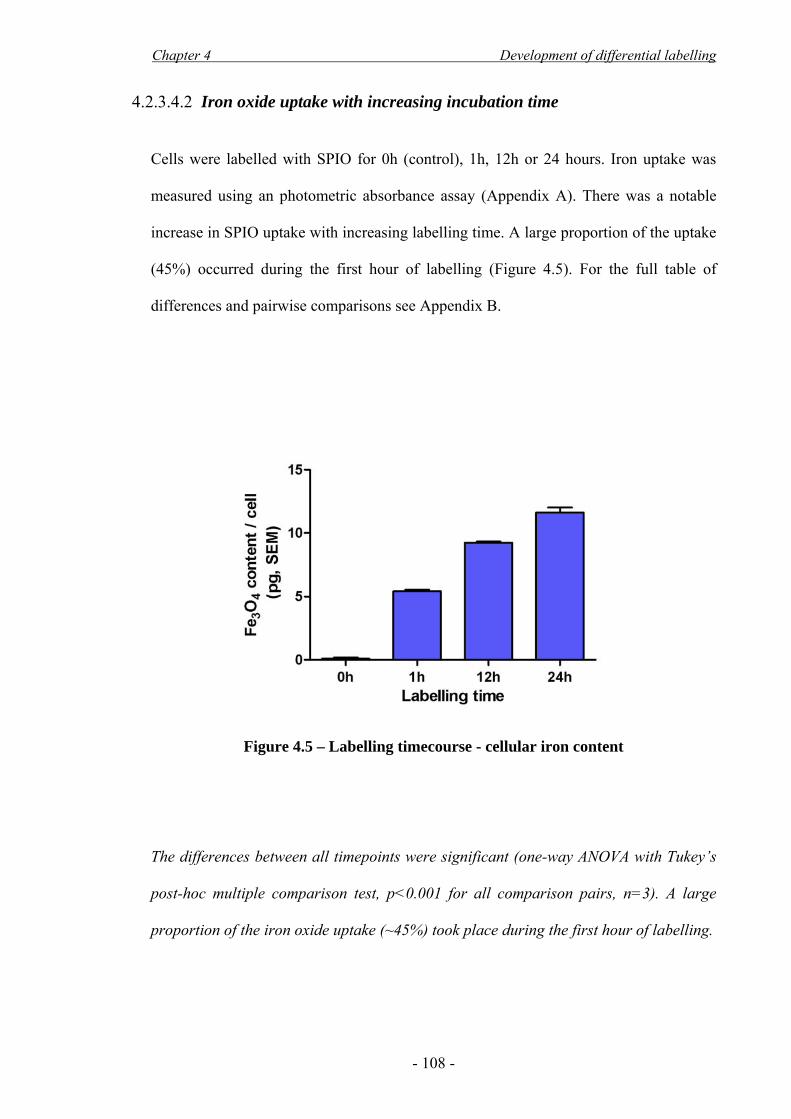
Chapter 4 Development of differential labelling
- 108 -
4.2.3.4.2 Iron oxide uptake with increasing incubation time
Cells were labelled with SPIO for 0h (control), 1h, 12h or 24 hours. Iron uptake was
measured using an photometric absorbance assay (Appendix A). There was a notable
increase in SPIO uptake with increasing labelling time. A large proportion of the uptake
(45%) occurred during the first hour of labelling (Figure 4.5). For the full table of
differences and pairwise comparisons see Appendix B.
Figure 4.5 – Labelling timecourse - cellular iron content
The differences between all timepoints were significant (one-way ANOVA with Tukey’s
post-hoc multiple comparison test, p<0.001 for all comparison pairs, n=3). A large
proportion of the iron oxide uptake (~45%) took place during the first hour of labelling.

Chapter 4 Development of differential labelling
- 109 -
4.2.4 Discussion
4.2.4.1 Main findings
i) Adherent cells label more readily than suspension cells.
ii) Even though suspension cells do not label readily and are hard to visualise
with the prussian blue stain, approximately 65% of suspension cells
incorporate enough iron oxide to be magnetically attracted.
iii) SPIO uptake is time-dependent. It is faster during the first hours of labelling.
4.2.4.2 Adherent cells label more readily than suspension cells
In these experiments it was found that adherent d10-CD133s take up iron oxide more
readily than suspension cells (Figure 4.3).
One possible explanation for such a difference could be that the adherent cells have an
inherent increased ability to take up SPIO. During the presented experiments it was
noted that adherent cells have more proliferative capacity than suspension cells. It has
previously been reported that SPIO particles are endocytosed faster by rapidly dividing
cell types (Arbab et al. 2003a). Therefore, the increased activity of the cells may
account for the increase in uptake. Furthermore, receptor-mediated endocytosis via the
scavenger receptor SR-A1 has been shown to be involved in SPIO uptake in
macrophages (Raynal et al. 2004). Interestingly, CD133 cells may express this receptor
as they become more differentiated (Voo et al. 2008). The transition from suspension to
adherent cells may thus coincide with an upregulation of this receptor.
A second factor that may contribute to an increased uptake by adherent cells is the
higher concentration of particles at the bottom of the wells, sedimenting under the

Chapter 4 Development of differential labelling
- 110 -
influence of gravity. It has been noted that an increased concentration of particles in the
medium will lead to higher uptake rate (Sun et al. 2005).
The SPIO uptake of suspension CD133 cells in this study was quite low, compared to
other studies that have labelled CD133 cells with 100% efficiency (Arbab et al. 2008;
Arbab et al. 2006; Rad et al. 2009). The important finding regarding suspension cells
was that, although they do not stain strongly with Prussian Blue, the majority contain
enough iron to keep them inside a magnetic separation column. Therefore they can be
magnetically attracted, which is a prerequisite for the purposes of this project. Thus both
adherent and suspension cells were used in future studies.
The lower labelling efficiency observed in this study compared to the literature may be
attributed to several factors. First, the use of a transfection agent in published studies is
likely to have increased the labelling efficiency, by increasing cell-particle interactions
and promoting endocytosis (Arbab et al. 2003a; Panizzo et al. 2009). Secondly, the
specific culture conditions used in some previous reports (Arbab et al. 2008; Arbab et
al. 2006; Rad et al. 2009) are likely to have increased the inherent endocytototic ability
of the cells: the StemSpan and Stemline II media used in these studies are normally
aimed at numeric expansion of the entire HSC pool and can lead to differentiation
towards the erythroid and myeloid lineages (Lam et al. 2001; Schipper et al. 1998).
More importantly, the media in these studies were supplemented with thrombopoietin,
which upregulates adhesion molecules (Cui et al. 1997; Gotoh et al. 1997). This would
render the majority of the cells adherent, increasing the labelling efficiency.

Chapter 4 Development of differential labelling
- 111 -
4.2.4.3 Dependency of iron uptake on incubation time with the particles
The dependency of iron uptake on the concentration of iron oxide in the culture medium
is well established in the literature (Bulte & Kraitchman 2004; Matuszewski et al. 2005;
Sun et al. 2005) and was not investigated as part of this study. Higher iron concentration
in the culture medium leads to faster uptake rate. It is also generally accepted that longer
incubation time leads to higher intracellular iron concentration; however, few
investigations explicitly report on this time dependency (Arbab et al. 2003a; Arbab et al.
2004b; Sun et al. 2005).
Within the literature available, there exist observations of higher iron uptake rate during
the first hours of incubation. Specifically, Sun and co-workers (2005) report that i) their
cells were clearly labelled after 20 minutes of incubation with SPIO, ii) the cellular iron
content rose sharply during the first 2h and iii) continued to increase, however at a
slower rate. In the presented data, it was observed that a large proportion (~45%) of the
iron uptake of adherent CD133 cells occurs during the first hour of labelling (Figure
4.5). The cells continued to endocytose iron for the next 24h, however this occurred at a
slower rate. This finding, which is in accordance with Sun (2005), was fundamental to
the development of the differential labelling method, as described in Part II of this
chapter.
4.2.4.4 Choice of iron quantification assay
The photometric assay employed in this chapter was a relatively simple method of
assessing iron content. It has been previously used by Rad (2007), who dried the cells
instead of using a lysis buffer. In my hands, cell drying resulted in an inhomogeneous
mixture with high non-specific absorbance (data not included in thesis). Instead, a lysis
buffer was used, which may also have introduced some measurement error (see

Chapter 4 Development of differential labelling
- 112 -
Appendix A for details). To avoid these errors, in future studies a more accurate method
for iron quantification was used; this will be introduced in Chapter 5.
4.2.5 Conclusions
From this study it can be concluded that:
i) Adherent cells label more readily than suspension cells. Suspension cells do
not take up enough iron to be easily visualised with prussian blue stain but
ii) 65% of suspension cells can be magnetically separated following labelling,
which means they can be magnetically attracted.
iii) SPIO uptake is time-dependent. It is faster during the first hours of labelling.

Chapter 4 Development of differential labelling
- 113 -
44..33 –– PPaarrtt IIII:: MMaaggnneettiicc aattttrraaccttiioonn aanndd vviiaabbiilliittyy
4.3.1 Background and aims
Magnetic forces can affect intracellular structures (Wilhelm et al. 2003b). However,
there have not been any studies to ascertain whether a magnetic force is sufficient to
affect cell viability (3.2.3). Furthermore, as described in section 3.3.3, the magnetic
force depends on both the magnitude of the applied magnetic field and also the gradient
of this field. The force distribution around a magnet will therefore be dependent not
only on the magnetic material, but also on magnet shape. Therefore, to perform
magnetic attraction viability experiments, it was necessary to design a magnetic device
for the application of a magnetic force on cells. This force should be applied uniformly
across a population of cells, in order to achieve reproducible viability results.
The design and construction of such a device, named “magnetic plate”, was the first
aim of this study. Cell viability tests were then conducted using this plate. The results of
these tests led to the development of the “differential labelling” method (DfL).
In this study, the aim was to:
i) Build a magnetic plate to apply a homogeneous force on a cell sample.
ii) Investigate the effect of magnetic force on cell viability.
It was found that:
i) Using the magnetic plate, it is possible to apply a force with limited variation
(15%) in magnitude across a cell sample.
ii) An excessive magnetic force can cause cell death, but by using DfL the
amount of iron in the cell is decreased and cell viability can be maintained.

Chapter 4 Development of differential labelling
- 114 -
Two important findings were established with the studies of Part II of this chapter.
Firstly, for the first time, a custom-made magnetic plate was designed and constructed
in order to perform viability tests. The selected design decreased the applied force
variation across a cell sample to 15%, as compared to 755% that would otherwise be
encountered.
Secondly, using this magnetic plate it was found that magnetic attraction of cells for
prolonged periods of time has the potential to compromise viability. This has not been
reported before. A novel labelling method (DfL) was used to solve this problem and
maintain cell viability.

Chapter 4 Development of differential labelling
- 115 -
4.3.2 Methods
4.3.2.1 Magnet modelling
Opera 2d (Vectorfields) was used to model Nd2Fe14B N35SH magnets (Magnetic
Applications Ltd) for the design of a suitable platform. Dr Ana Garcia-Prieto provided
initial models and guidance on how to use the software. For the purposes of this study,
forces were modelled for an arbitrary 100nm iron particle with susceptibility χ = 0.2;
this was an arbitrary value and does not compare with the forces on cells. Conformity of
the magnets chosen (see section 4.3.3.1 below) to the computer model was tested by
placing a modelled magnet directly beneath a 3cm culture plate containing 250µg/ml
Endorem® in PBS for 15 minutes, to allow the particles to sediment at the area of
maximum force. The effect of vertical piling of two magnets was also considered, in an
attempt to increase the magnitude of the applied force.
4.3.2.2 Platform and magnetic attraction
Following computer modelling of magnets (Results, section 4.3.3.1), the purpose-built
platform base was constructed by aligning four of the chosen Nd2Fe14B grade N35SH
disk magnets (1.195T, 22mm diameter x 8mm height) on top of the four corners of a
96-well plate. The 96-well plate containing the cells to be examined was placed on top
of this base, so that the bottom of each corner well, i.e. the cells, was 1mm from the
magnet surface (1mm is the thickness of the plastic of the plate base). Magnetic cell
attraction (against the restraint of the well bottom) was preceded by centrifugation of
the cell-containing plate at 200g for 2mins with no brake to bring all the cells to the
bottom of the plate. The attraction lasted 24 hours and was followed by the viability
assays in the same 96-well plate.

Chapter 4 Development of differential labelling
- 116 -
4.3.2.3 Cell culture and labelling
Cells were cultured as previously described (4.2.2.1); d9-CD133s were used. For
standard labelling (StL) the whole cell population was labelled for 24h with Endorem®
(500 µg/ml Fe). For differential labelling (DfL), the suspension d9-CD133 fraction was
separated and labelled for 22h followed by additional labelling for 2h with the adherent
fraction (24:2 DfL) or 23h and 1h respectively (24:1 DfL). Cells were washed three
times in 15mL PBS to remove unbound iron.
4.3.2.4 Viability assay
The CellTiter 96® AQueous One Solution Assay (Promega) was performed after 24h of
magnetic attraction of labelled CD133+ cells. The tetrazolium compound in this assay
undergoes reduction to a coloured formazan product by viable cells, primarily mediated
by NAD(P)H (Berridge & Tan 1993). Spectrophotometric quantification of viability of
samples of 3x10⁴ CD133+ cells was performed using the same microplate reader as in
Part I (GENios, Tecan) (490 nm, at 4h). Absorbance at 690nm was measured as a
reference for non-specific absorbance and subtracted from the 490nm value as per
manufacturer guidelines. For the assay, cells were cultured in medium lacking ascorbic
acid (see Appendix C for rationale). Sample activity was normalised to the mean
absorbance of control (no magnet). Four experimental groups were examined: i)
standard labelling (StL) without magnetic attraction, ii) StL with 24h attraction, iii) 24:2
DfL with 24h attraction, iv) 24:1 DfL with 24h attraction. Values were normalised by
setting the mean of the control as 100% viability. For positive controls see Appendix C.
Phase contrast microscopy photographs for (i), (ii) and (iv) were taken to assess any
differences in the visual appearance of the cells.

Chapter 4 Development of differential labelling
- 117 -
4.3.2.5 Statistical analyses
The results were analysed as described in 4.2.2.7. Tamhane’s T2 post hoc test for
ANOVA was used when the variances were not homogeneous (Levene’s test, p<0.05).
4.3.3 Results
4.3.3.1 Design and construction of the magnetic plate
The magnetic plate was constructed using disk magnets 22mm in diameter (11mm
radius) and 8mm in height (Figure 4.6). According to the computer model, the force
maximum of these 22mm x 8mm magnets were predicted to occur at the magnet edges.
The forces were predicted to be most homogeneous above the magnet central area. This
prediction was confirmed by placing SPIO particles on top of the magnet and leaving
them to accumulate at the area of maximum force (Figure 4.7).
Therefore, the cells under investigation should be confined to the central area of the
magnet, where the forces are more homogeneous. To achieve this, the magnets were
placed so that they were centered beneath a culture well of a 96-well plate, which is
6mm in diameter (3mm radius) (Figure 4.8). The force variation across the cell sample
in this well was calculated to be 15%.
Finally, an alternative magnet configuration was modelled, in an attempt to increase the
applied magnetic force without increasing the variation across the cell sample. Disk
magnets 22mm in diameter and 8mm in height were stacked vertically, to produce a
magnet stack 22mm in diameter and 16mm in height. This doubled the applied force,
and also decreased the variation across the cell sample from 15% to 7% (Figure 4.9).

Chapter 4 Development of differential labelling
- 118 -
Figure 4.6 – Design and construction of the magnetic plate
Four disk magnets, 22mm in diameter and 8mm in height were used to construct the
magnetic plate (a). The cell-containing 96-well plate was placed on top of the magnetic
plate (b). There are four wells that contain cell samples (arrows). A photograph of one
of these magnets is shown in (c). The yellow rectangle represents the modelled area,
seen in (d). The computer model shows colour-coding of the force magnitude (Equation
3.5) increasing from blue to white. The black dotted line signifies the 1mm distance
from the magnet surface, the distance where the cell samples are placed (the well
bottom). This distance was used for the force calculations in Figure 4.8.
(a) (b) (c) (d)

Chapter 4 Development of differential labelling
- 119 -
Figure 4.7 – Particle attraction toward the magnet edges
To confirm the computer model prediction for the areas of maximum force, SPIO
particles were placed in a culture dish, 1mm from the magnet surface. a) side view of
culture dish with magnet on its underside (force model superimposed). The particles
were allowed to accumulate at the area of maximum attractive force from the magnet.
b,c) top views showing particles attracted toward the the upper rim of the magnet (dark
ring, arrows), which is in accordance with the computer model.

Chapter 4 Development of differential labelling
- 120 -
Figure 4.8 – Placement of cell samples on top of disk magnets
a) Photograph of 22mm diameter disk magnet beneath 96-well plate. The cells under
investigation are confined to the central area of the magnet, up to 3mm away from the
magnet centre (yellow line). The force magnitude was investigated to ascertain the
homogeneity of the forces at 1mm distance above the magnet surface (b). This distance
is denoted with a black dotted line on Figure 4.6-d. The force maximum occurs at the
magnet edge (11mm from the centre). The cells under investigation are confined to the
area bounded by the yellow square. The variation in force magnitude in this area was
15%. In contrast, the variation in force along the entire face of the magnet is 755%.
Force magnitude was calculated for an arbitrary SPIO particle with χ=0.2.
forces at well bottom
(a) (b)

Chapter 4 Development of differential labelling
- 121 -
Figure 4.9 – Increase in applied force with stacked configuration
The effect of stacking magnets on top of each other was investigated in an attempt to
increase the force magnitude without decreasing the homogeneity of the force. Placing
two magnets on top of each other increased the maximum force experienced per particle
by 2.3-fold, from 7.74x10⁻¹⁶ to 1.76x10⁻¹⁵ N, at 3mm from the centre (black arrows). It
also decreased the ‘0mm 3mm’ variability across each well from 15% to 7%. This
stacked configuration was used in the studies presented in Chapter 5.

Chapter 4 Development of differential labelling
- 122 -
4.3.3.2 Viability after magnetic attraction (single magnet configuration)
Cells were labelled with Endorem for 24 hours (‘standard labelling’, StL). After a
further 24 hours of magnetic attraction, there was a 72.5% decrease in cell viability
(Figure 4.10).
Figure 4.10 – Viability of StL cells following 24h magnetic attraction
Figure 4.10 displays the viability of magnetically attracted StL-CD133 cells compared
to control cells (standard labelling, no magnetic force). There was a significant
decrease in viability (p<0.001, unpaired t-test). Viability was investigated using the
MTS assay, normalised to the control cells and expressed as a percentage.
SEM: standard error of the mean, n=4.

Chapter 4 Development of differential labelling
- 123 -
4.3.3.3 Development of the differential labelling method (DfL)
It has already been mentioned that i) adherent cells take up iron more readily than
suspension cells, and more notably in the first hours of labelling (Part I of this chapter)
and ii) endocytosed SPIO can induce a force and change the shape of endosomes when
an external magnetic field is applied (Wilhelm et al. 2003b). Based on these facts I
hypothesised that the observed decrease in viability was due to mechanical damage of
the adherent cell fraction, due to excessive magnetic forces. The differential labelling
method was devised to solve this problem, whereby adherent cells were only labelled
for 1 hour (24:1 DfL) or 2 hours (24:2 DfL). The suspension cells were labelled for 24
hours to preserve their SPIO content.
Figure 4.11 displays the comparison of cell viability after magnetic attraction for
standard labelling (StL), 2 hours differential labelling (24:2 DfL) and 1 hour differential
labelling (24:1 DfL). Both differential labelling methods increased viability.
With StL there was a 72.5% decrease in viability following 24h of magnetic attraction
(reproduction of the data in Figure 4.10). With 24:2 DfL there was a 20.8% decrease in
viability. For 24:1 DfL there was no evidence to support a decrease in viability. Table
4.2 summarizes these results.

Chapter 4 Development of differential labelling
- 124 -
Figure 4.11 – Viability following 24h magnetic attraction:
StL vs DfL
Table 4.2 – Comparison of viability after magnetic attraction: StL vs DfL
Group (n=4)
Mean viability % (SEM)
Compared groups1
Mean % difference
95% CI difference1 p-value1
(i) StL no magnet (control) 100 (1.8) (i) vs (ii) 72.5 62.1 to 82.9 <0.001
(ii) StL magnet 27.5 (2.0) (i) vs (iii) 20.8 -37.8 to 79.4 0.551
(iii) 24:2 DfL magnet 79.2 (9.9) (i) vs (iv) 2.0 -13.1 to 17.0 0.996
(iv) 24:1 DfL magnet 98.1 (3.0) (iii) vs (iv) 13.4 -73.7 to 35.9 0.627
1 One-way ANOVA with Tamhane’s T2 multiple comparison test
Differential labelling improved viability after magnetic attraction, compared to
standard labelling. With StL there was a 72.5% significant decrease in viability
(p<0.001). With 24:2 DfL there was a non-significant 20.8% decrease in viability. With
24:1 DfL there was no evidence to support a difference to the control samples (StL
without magnet). Viability was analysed using an MTS assay and is normalised to the
the control samples. SEM: standard error of the mean, n=4 for each group.

Chapter 4 Development of differential labelling
- 125 -
4.3.3.4 Histology following magnetic attraction
The cells’ visual appearance was different between the labelling methods after the cells
had been magnetically attracted (Figure 4.12). With standard labelling and magnetic
attraction, the cells did not look normal. With differential labelling, the cell appearance
was similar to the control.
Figure 4.12 – Photomicrographs of cells following magnetic actuation
a) StL (no magnet), b) StL + magnet, c) 24:1 DfL + magnet
Cells labelled with the standard method (a) appeared normal when no magnet was
used. Cell fragments were observed in the ‘StL + magnet’ samples (b), which paralleled
the observed decrease in viability. 24:1 DfL cells appeared normal following magnetic
attraction (c). Scale: each cell is approximately 10µm in diameter.
Chapter 4 Development of differential labelling
- 126 -
4.3.4 Discussion
4.3.4.1 Main findings
i) Using the magnetic plate, it is possible to apply a force with limited variation
(15%) in magnitude across a cell sample.
ii) An excessive magnetic force can cause cell death, but by using DfL the
amount of iron in the cell is decreased and cell viability can be maintained.
4.3.4.2 Design of the magnetic plate
In the first part of this study, a magnetic plate was designed for subsequent use in
viability experiments. The plate was designed to provide homogeneity of the applied
force across the diameter of a well. As shown in Figure 4.6, disk magnets have an
inhomogeneous force distribution around them, which could influence reproducibility
of results and subsequent interpretation. Using the magnetic plate presented there was
15% variation in force across a cell sample. This variation was, arbitrarily, considered
sufficient for the purposes of the study. It was not investigated whether a decrease in
variation would give better reproducibility of results. In Chapter 5, the stacked
configuration was used i) to increase the applied force and ii) decrease the force
magnitude variation to 7%. An additional advantage of the 96-well plate design was the
possibility of direct use in the microplate reader for the MTS viability assay. This
helped to decrease variation in the results that may be caused by additional cell handling
and pipetting between the magnetic attraction phase and the MTS assay.
An alternative design would be the construction of an electromagnetic plate, in which
case the forces applied could be varied, allowing a broader range of force application.
However, this option was not considered practical at this stage, as alterations to an
incubator would be necessary in order to provide power supply to the platform.
Chapter 4 Development of differential labelling
- 127 -
4.3.4.3 Cell viability after magnetic attraction
The effect of magnetic attraction of cells has not previously been examined, apart from
investigations on non-fatal deformations of endosomes (Wilhelm et al. 2003b). In this
study it was found that that a magnetic force can cause cell death. This result, in
conjuction with the observed increased uptake of iron oxide by adherent cells as found
in Part I, meant that decreasing the amount of iron in adherent cells alone could restore
viability. Differential labelling was developed in an attempt to decrease the amount of
iron in adherent cells, without compromising the suspension cell SPIO uptake. This
restored viability, and 24:1 DfL was selected as the labelling method of choice for
magnetic attraction experiments, as it did not cause a decrease in viability.
For the computer modelling in this study, an arbitrary iron particle was modelled to
compare the different magnets and the force variation near the magnet surface. The
actual magnitude of the magnetic forces on cells were not calculated as part of this
study. Such a calculation would require knowledge of the magnetic susceptibility of the
cells in each group examined, which was not estimated at this stage. However, the
maximum force that can be exerted on 24:1 DfL cells without effects on viability would
be a necessary ‘safety’ marker for the design of subsequent experiments. This ‘cell-safe’
maximum force will be dealt with in Chapter 5.
4.3.5 Conclusions
From this study it can be concluded that:
i) Using disk magnets with diameter four times larger than the cell sample, it is
possible to apply a force with 15% variation in magnitude across the sample.
ii) An excessive magnetic force can cause cell death, but by decreasing the
amount of iron in the cell, cell viability can be maintained.

- 128 -
CCHHAAPPTTEERR 55
FFUURRTTHHEERR IINNVVEESSTTIIGGAATTIIOONN OOFF DDIIFFFFEERREENNTTIIAALL LLAABBEELLLLIINNGG

Chapter 5 Further investigation of differential labelling
- 129 -
55..11 IInnttrroodduuccttiioonn
In Chapter 4, we saw how the concept of differential labelling was developed in order to
maintain viability after magnetic attraction. In this chapter I will describe some steps
that I considered necessary for the validation of this labelling method. In short, the post-
attraction viability had to be confirmed at later timepoints. I also quantified the amount
of iron in the cells for magnetic force calculations, and confirmed that the cells can be
visualised using MRI.
By the time these experiments were conducted, there was a plan in place for some in
vivo work (Chapter 7). This entailed application of a magnet for only 10 minutes.
Therefore, the magnetic attraction period was reduced from 24h to 10min in the studies
presented here, to be directly applicable to the in vivo experiments. Because of the
decreased magnet application time, the cells would possibly withstand a higher force, so
I used stacked instead of single magnets (Figure 4.9) to increase the force magnitude in
all of the magnetic attraction experiments presented in this chapter. Finally, water
evaporation from the culture plate affected the viability results of preliminary
experiments (not presented here). The method used to minimise evaporation is
presented in the methods of this chapter and the validation is outlined in Appendix A.
In this study, the aim was to:
i) Investigate cell viability, growth and apoptosis following DfL and magnetic
attraction using stacked magnets.
ii) Investigate cell differentiation following DfL.
iii) Quantify the iron content per cell and calculate the magnetic forces.
iv) Verify visibility of cells using MRI.

Chapter 5 Further investigation of differential labelling
- 130 -
It was found that:
i) Cell viability, growth and apoptosis is normal following DfL and magnetic
attraction using stacked magnets.
ii) Cell differentiation is normal 10 days post-labelling.
iii) Cells contain on average 3.9pg iron oxide / cell. A force of 9.3pN per cell is
safe with regard to (i) above.
iv) Cells are visible using MRI and readily create signal voids in vitro.
The studies in this chapter concentrated on validating the differential labelling method.
This was achieved with analysis of cell viability, growth, apoptosis and differentiation.
In addition, in order to calculate ‘safe’ magnetic forces, the amount of iron oxide per
cell was calculated. This calculation of safe forces has not been attempted in the past.
Finally, visibility of cells with MRI was confirmed; although this is not a novel finding,
I considered it a necessary step in validating the labelling method.
55..22 MMeetthhooddss
5.2.1 Cell culture and labelling
Cells were obtained and cultured as previously described (4.2.2.1) and were labelled
using the 24:1 DfL method (4.3.2.3). For simplicity, ‘DfL’ alone will refer to 24:1 DfL
of day10 cells, which was the labelling method of choice (Chapter 4). 24:2 DfL was not
investigated further.
5.2.2 Viability assay after 10min attraction with stacked magnets
The MTS assay was repeated as described before (4.3.2.4), on cells that had been on
stacked magnets for 10 minutes, 24h after the magnetic attraction.

Chapter 5 Further investigation of differential labelling
- 131 -
5.2.3 Water evaporation
These experiments (Appendix A) were performed to investigate if there is significant
water evaporation from 96-well plates despite the plate cover, which would affect
viability results. Two 96-well plates were kept in an incubator for 48h. In each plate, the
4 corner wells and the 4 centre wells were filled with 100µL PBS. In one of the plates,
the inter-well spaces were flooded with PBS to saturate the atmosphere around the wells
with water vapour and attempt to decrease evaporation (total=10mL). Subsequent to the
results of this experiment, all culture plates were flooded in the same way.
5.2.4 Growth assay post DfL and magnetic attraction
Sixteen samples of either (i) control, unlabelled d10-CD133s or (ii) DfL-CD133s
magnetically attracted for 10 minutes with stacked magnets, were plated in a 96-well
plate (total wells= 32). 5x10³ cells cultured in each well with 100µL medium. The
growth of the cells was investigated by performing the MTS assay as previously
described (4.3.2.4) on quadruplicate samples at four timepoints (24h, 48h, 96h, 192h).
Data was normalised to the control samples at 24h and is presented as relative
absorbance units. 10µL fresh medium was added to the wells every two days. A PBS-
filled well served as an evaporation gauge to adjust the addition of fresh medium, so
that wells contained 100µL medium when the MTS assay was to be performed.
5.2.5 Apoptosis assays
Cell apoptosis was analysed using an Annexin-V-FITC/Propidium Iodide (A-V/PI) flow
cytometric assay (ApoTarget™, Invitrogen). In combination with propidium iodide,
Annexin-V can distinguish between normal, early apoptotic, late apoptotic and necrotic
cells (Vermes et al. 1995). 3-4x10⁴ cells were incubated in 150µL medium in wells of a

Chapter 5 Further investigation of differential labelling
- 132 -
96-well plate for 24, 48 or 120 hours. On the day of the measurement, cells were
collected, washed once in warm PBS, resuspended in 100µL of the supplied buffer and
incubated with 5µL Annexin-V and 10µL PI for 15mins before another 400µL buffer
was added. FACS analysis was done on the FACScan cytometer (BD) with the starting
settings shown in Table 5.1. The % apoptotic and necrotic cells was calculated.
Table 5.1 – FACS settings
PARAMETER VOLTAGE GAIN SCALE
FSC E-1 7.01 Lin
SSC 287 3.17 Lin
FL1 (A-V) 509 1 Log
FL2 (PI) 498 1 Log
Threshold: 35 - FL1 Comp: 5.3% FL2 - FL2 Comp: 29% FL1
Three groups were examined: (i) unlabelled, control d10-CD133s, (ii) DfL-CD133s and
(iii) DfL-CD133s with magnetic attraction.
5.2.6 Flow cytometry for cell differentiation
The immunophenotypic characteristics of d21-DfL-CD133 cells labelled with SPIO at
day 10, were analysed using flow cytometry (FACSCalibur, BD). Cells pre-treated with
FcR blocking reagent (Miltenyi Biotech) were stained using the following anti-human
antibodies: phycoerythrin (PE)-CD304 BDCA-4/Neuropilin-1(n=6)(Fons et al. 2004),
biotin-CD144 / VE-Cadherin (n=6) (Bender MedSystems) with Streptavidin-FITC for
endothelial differentiation; PE-CD14 (n=6) and CD11b (n=3) (BD Pharmingen) for
monocytic differentiation. Fluorochrome- and dose-matched isotypes were used as
controls. Cells were suspended in 20mM HEPES/0.5% BSA/PBS containing 10µg/ml

Chapter 5 Further investigation of differential labelling
- 133 -
7-aminoactinomycin D (7-AAD, Sigma Aldrich). 7-AAD positive, nonviable cells were
excluded and 1x10⁴ viable cells were scored per analysis (CellQuestPro, BD).
5.2.7 SQUID for iron quantification
A superconducting quantum interference device (SQUID) (Hautot, Pankhurst, &
Dobson 2005) was used to measure the amount of Fe3O4 in the cells. The data
acquisition was performed by Dr Ana Garcia-Prieto. 5x10⁵ DfL cells were placed in a
glycine capsule. 15µL of 11.2mgFe/ml Endorem® were measured for standardisation
(15µL = 168µg Fe = 233µg Fe3O4). To separate SPIO signal from background signal
coming from the cells and media, measurements were performed at 10K (-263oC). This
is below the blocking temperature of Endorem® (60K). The cell sample was saturated
in an applied field of 2 Tesla, which was subsequently removed to leave the SPIO
particles in a remanently magnetised state. Comparison of this remanent signal with that
of the undiluted Endorem® sample allowed quantification of Fe3O4 per cell. This then
allowed calculation of the magnetic force acting on the cells in the viability assays.
5.2.8 In vitro MRI
DfL-CD133 cells were embedded in low melting point agarose (0.5%, 37°C) at
concentrations of approximately 750, 166, 50, 16 and 0 cells x103/ml in 250µL
eppendorf tubes and were cooled to 4°C. Suspension in agarose allowed for
homogeneous distribution of the cells. The tubes were secured in a 4% agarose phantom
and were imaged in a 9.4T horizontal bore Varian (VNMRS) MRI system using a
39mm RF coil (RAPID Biomedical GmbH, Germany). T2* weighted images were
acquired using a spoiled gradient echo sequence (TE=25ms, TR=200ms, FA=30, 5122
matrix, 0.5mm slice). T2* maps were obtained from 20 echo times (TE 2.5-30ms,

Chapter 5 Further investigation of differential labelling
- 134 -
TR=200ms, FA=30, 2562 matrix, 0.5mm slice). These were produced using the ImageJ
MRI Analysis Calculator plugin (Schmidt, K., ImageJ, U. S. National Institutes of
Health, MA USA) by fitting the decay of signal intensity with increasing echo time
(Equation 2.4) on a pixel-by-pixel basis.
5.2.9 Statistical analyses
For the repeated MTS assays, two-way ANOVA was used with no post hoc test. For the
growth, and differentiation assays, the null hypothesis was that there would not be a
difference. A qualitative comparison was considered sufficient for the purposes of these
studies. In the apoptosis assays it was possible to employ equivalence testing. The two
one-sided t-test (TOST, Schuirmann’s test) approach was used with a 3% equivalence
limit at the 0.05 level (Cribbie, Gruman, & Arpin-Cribbie 2004). A maximum
acceptable difference of 3% was set a priori based on 24hr serum deprived positive
control cells (3% mean increase in early apoptosis, 16% increase in late apoptosis).

Chapter 5 Further investigation of differential labelling
- 135 -
55..33 RReessuullttss
5.3.1 Viability assay after 10min attraction with stacked magnets
Stacked magnets were used to double the applied force, compared to the force used in
Chapter 4 (Figure 4.10). Cell viability following 24:1 differential labelling and 10
minutes of magnetic attraction was investigated in triplicate. Figure 5.1 displays the
results from these experiments. Cell vability was similar between the non-magnet
control and the magnet groups, for all three experiments.
Figure 5.1– MTS assays following 10 min magnetic attraction of DfL cells
Three experiments (1-3) were conducted comparing no-magnet control (C) to 10
minutes of magnetic attraction (M). The effect of standard labelling is shown for
reference (from Figure 4.10). There was no evidence to support a difference between
control and magnet groups (C1 vs M1, C2 vs M2 ,C3 vs M3, p=0.557, two-way
ANOVA). SEM: standard error of the mean, n=4 per group.

Chapter 5 Further investigation of differential labelling
- 136 -
5.3.2 Cellular growth after DfL and magnetic attraction
There were no differences in cellular growth rate between the unlabelled control and
DfL + magnet cells. The data from the MTS assay is presented in Table 5.2 and Figure
5.2 as absorbance units relative to unlabelled control at 24h. The increase in cell number
as the cells multiply leads to higher absorbance values.
Table 5.2 – Cell proliferation post DfL and magnetic attraction
Relative absorbance units (SEM)
24h 48h 96h 192h Unlabelled
control 1.0 (0.09) 1.3 (0.06) 1.9 (0.09) 2.7 (0.04)
DfL+ magnet 1.1 (0.08) 1.3 (0.05) 1.9 (0.05) 2.8 (0.10)
Figure 5.2 – Cell proliferation post DfL and magnetic attraction
Increased cell number due to proliferation leads to more formazan product produced in
the 4 hours the MTS assay is allowed to react with the cells. This leads to higher
absorbance values. Figure 5.2 shows the increase in absorbance over a period of 8
days (192 hours) for unlabelled control (blue) and cells that were differentially labelled
and exposed to the stacked magnets for 10 minutes (red), with n=4 at each timepoint.

Chapter 5 Further investigation of differential labelling
- 137 -
5.3.3 Cellular apoptosis after differential labelling
Figure 5.3 displays the early apoptosis (EA), late apoptosis (LA) and necrosis (N) rates
of unlabelled control and DfL cells, at 24 and 72 hours after labelling. There were no
differences in cellular apoptosis between unlabelled control and DfL cells. All groups
passed equivalence testing, apart from early apoptosis at 24hrs, in which apoptosis was
less for the labelled group (mean difference = 1.6%, p<0.05). For a full table see
Appendix B. These results can be further summarised by calculating the mean
difference ‘labelled minus control’ and 95% confidence interval (CI) for this difference,
for each timepoint pair (Figure 5.4).
Figure 5.3 – Apoptosis rates after differential labelling
Figure 5.4 – Apoptosis differences after differential labelling

Chapter 5 Further investigation of differential labelling
- 138 -
5.3.4 Cellular apoptosis after magnetic attraction
Figure 5.5 displays the apoptosis/necrosis rates at 24h, 48h and 120h after 10min
magnetic attraction. Figure 5.6 displays the mean difference and 95% CI for each group
pair. There was no increase in cellular apoptosis after magnetic attraction. All groups
passed equivalence testing. For a full table see Appendix B. Figure 5.7 displays sample
flow cytometry data from the apoptosis assays below and the previous section (5.3.3).
Figure 5.5 – Apoptosis rates after magnetic attraction
Figure 5.6 – Apoptosis difference after magnetic attraction

Chapter 5 Further investigation of differential labelling
- 139 -
Figure 5.7 – Sample cytometry scatterplots for the apoptosis assays
All cells were included on the analysis, apart from cell fragments based on FSC and
SSC (a). (b) and (c) show representative scatterplots for Propidium Iodide and
Annexin-V negative controls, respectively. Early apoptotic cells (EA) are only positive
for A-V. Doubly positive cells are late apoptotic (LA). Necrotic cells (N) stain only with
PI. Unlabelled (d), differentially labelled (e) and DfL cells exposed to the magnetic
force (f) had similar rates of apoptosis.

Chapter 5 Further investigation of differential labelling
- 140 -
5.3.5 Cell differentiation after differential labelling
Figure 5.8 displays the surface marker expression ten days post-labelling. There was
similar expression of endothelial (VE-Cadherin, CD304/NP-1) and monocytic (CD14,
CD11b) markers of differentiation between labelled and non-labelled cells. For a full
table of the surface marker expression values see Appendix B. Figure 5.9 displays
sample flow cytometry data for the CD14 marker analysis.
Figure 5.8 – Surface marker expression after DfL
Graph displays the percentage of live cells expessing the markers VE-Cadherin (VE-
Cad), neuropilin-1 (CD304), CD14 and CD11b. Unlabelled samples are shown in blue,
labelled samples are shown in brown. Suspension cells (clear bars) and adherent cells
(dotted bars) were analysed separately. CS: Control non-labelled Suspension fraction;
LS: SPIO-Labelled Suspension fraction; CA: Control non-labelled Adherent fraction;
LA: SPIO-Labelled Adherent fraction. There was similar expression of differentiation
markers between unlabelled and labelled cells (CS vs LS, CA vs LA). SEM: standard
error of the mean. CD11b: n=3, all others: n=6.

Chapter 5 Further investigation of differential labelling
- 141 -
Figure 5.9 – Sample cytometry scatterplots for the CD14 surface marker analysis
Live cells were selected based on gating forward and side scatter (a) and 7-
aminoactinomycin D (7-AAD) (b). Laser intensity adjustments were based on dose-
matched negative controls (c). In these samples, unlabeled control (d) and Endorem®-
labelled cells (e) had similar amounts of CD14 expression.
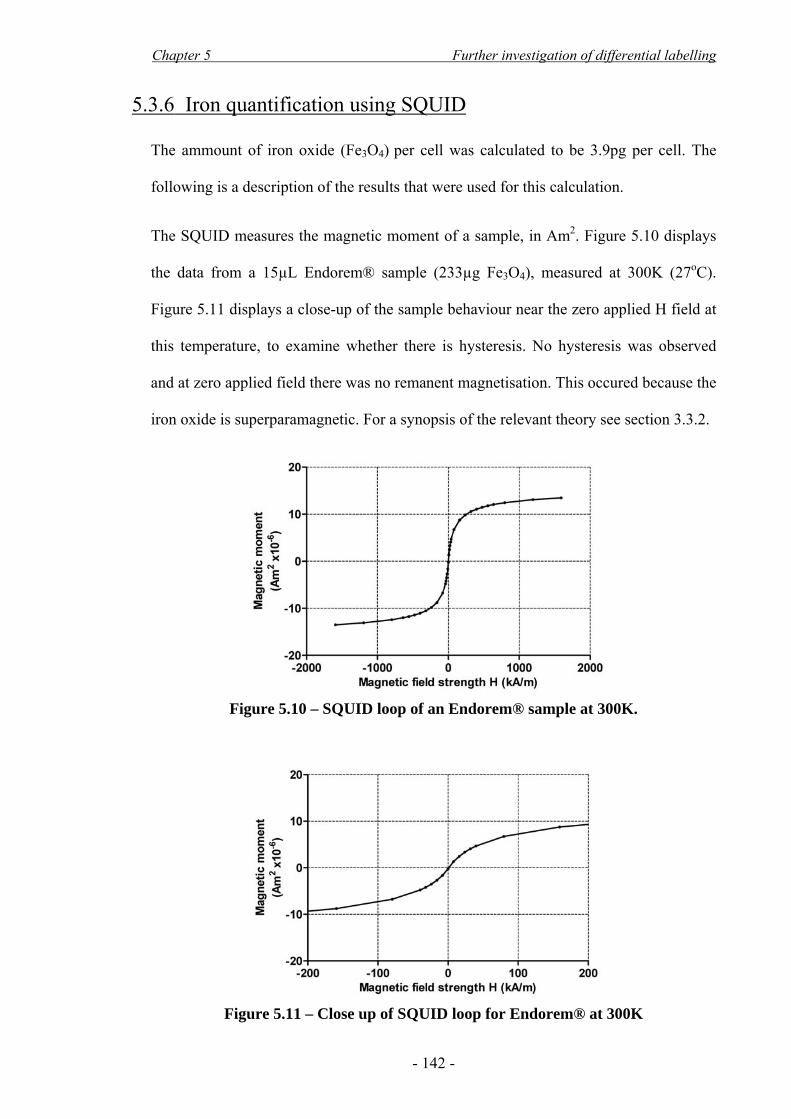
Chapter 5 Further investigation of differential labelling
- 142 -
5.3.6 Iron quantification using SQUID
The ammount of iron oxide (Fe3O4) per cell was calculated to be 3.9pg per cell. The
following is a description of the results that were used for this calculation.
The SQUID measures the magnetic moment of a sample, in Am2. Figure 5.10 displays
the data from a 15µL Endorem® sample (233µg Fe3O4), measured at 300K (27oC).
Figure 5.11 displays a close-up of the sample behaviour near the zero applied H field at
this temperature, to examine whether there is hysteresis. No hysteresis was observed
and at zero applied field there was no remanent magnetisation. This occured because the
iron oxide is superparamagnetic. For a synopsis of the relevant theory see section 3.3.2.
Figure 5.10 – SQUID loop of an Endorem® sample at 300K.
Figure 5.11 – Close up of SQUID loop for Endorem® at 300K

Chapter 5 Further investigation of differential labelling
- 143 -
At 10K the sample lost its superparamagnetism and exhibited hysteresis (Figure 5.12).
There was remanence at zero field. A sample of 5x10⁵ DfL cells was measured in the
same way (Figure 5.13). This remanence was used to quantify the amount of iron oxide
per cell.
Figure 5.12 – Close up of SQUID loop for Endorem® at 10K
Figure 5.13 – Close up of SQUID loop for 5x10⁵ DfL cells at 10K

Chapter 5 Further investigation of differential labelling
- 144 -
Knowing the amount of iron oxide in the Endorem® sample (15µL = 233µg Fe3O4) the
the remanence of Fe3O4 per gram was calculated:
./gAm10871410233
10473 2366
−−
×=×× ..
The remanence attributable to each cell is: ./cellAm1084510510922 214
5
8−
−
×=×× ..
Thus from the ratio of the two remanences, the ammount of Fe3O4 per cell was found:
cell / pg923content OFe 43 .]g/mA[ remanence OFe
]cell/mA[ remanencecell2
43
2
== .
The cell sample examined in these experiments were heterogeneous; thus the iron
content quoted above is likely to be an underestimate for adherent cells and an
overestimate for suspension cells.

Chapter 5 Further investigation of differential labelling
- 145 -
5.3.7 Estimation of a cell-safe magnetic force
The maximum force that was applied on DfL-CD133+s during the viability tests in this
chapter, with which there were no notable cellular effects was calculated to be 9.3 pN
per cell. This is the ‘cell-safe’ magnetic force, and was calculated as follows.
As described in Figure 3.6, a linear magnetisation response for |H| ≤ 398 A/m (|B| ≤
0.5T) can be assumed. From the Endorem® M-H loop the magnetic susceptibility of
Fe3O4 can be approximated [χ(Fe3O4)=0.789]. The susceptibility of the cell χc will
depend on the susceptibility of the iron oxide with which it is loaded χ(Fe3O4)
(Equation 3.6) and can be calculated from the volume-per-volume loading of the cell
with Fe3O4 (Lc) (Equation 3.7):
Based on the 3.9pg loading of a 10μm-diameter cell, Lc was calculated:
0.14% or1044110245
102151093 3316
3153
.m.
.kg.L m
kg
c−
−
+−
×=×
××=
The susceptibility of each cell (χc), necessary for the calculation of the force, is:
... OFec33 1013110441
43
−− ×=××= χχ
Given a CD133+ cell diameter of 10μm (confocal data, Chapter 7) and viability tests at
maximum tested ( )HH ∇⋅ = 1.25x10¹³ A2/m3 at H=350kA/m (stacked magnets for 10
minutes), the cell-safe force is calculated using the unsaturated force expression
(Equation 3.5) and is: HH )(VF ccmax ∇⋅= χμ0 = 9.3pN per cell, against the restraint
of the culture plate. Magnetic forces will be considered in more detail in Chapter 6.
L OFecc 43χχ ×= .
D
ρmassV
V L
c
OFeOFe
c
OFec
3
6
434343
×==
π

Chapter 5 Further investigation of differential labelling
- 146 -
5.3.8 In vitro MRI
At this stage I also investigated whether the cells contain enough iron to be visualised
using MRI in vitro (Figure 5.14). Cells were visible as areas of hypointensity (signal
voids) on T2*-weighted images from 25 cells/mm2 (a, tube C) and caused a decrease in
T2* from 8 cells/mm2 (b and c, tube B).
Figure 5.14 – In vitro MRI phantom of DfL-CD133s
Tubes A to E contain increasing amounts of cells. The cell concentration in ml was
divided by 2 to give the in-plane cell content of the 0.5mm slice in mm2. T2*-weighted
images are shown in (a). T2* maps and the corresponding T2* values are shown in (b)
and (c).

Chapter 5 Further investigation of differential labelling
- 147 -
55..44 DDiissccuussssiioonn
5.4.1 Main findings
In these studies, it was found that:
i) Cell viability, growth and apoptosis is normal following DfL and magnetic
attraction using stacked magnets.
ii) Cell differentiation is normal 10 days post-labelling.
iii) Cells contain on average 3.9pg iron oxide / cell. A force of 9.3pN per cell is
safe with regard to (i) above.
iv) Cells are visible using MRI and readily create signal voids in vitro.
5.4.2 Magnetic forces
This chapter focused on the validation of the differential labelling method, mostly with
regard to cell safety with SPIO labelling and magnetic attraction. As we saw in Chapter
4, a magnetic force has the potential to cause cell damage; this effect can be controlled
by decreasing SPIO uptake. In this chapter, the force was applied for a shorter period of
time (10 minutes instead of 24 hours), to match the in vivo scenario (Chapter 7). It was
hypothesised that the force could correspondingly be increased. Subsequent to iron
quantification, a cell-safe force was estimated to be 9.3pN per cell. Even with this force,
in Figure 5.1 there is an insignificant decrease in viability in groups M1 and M2.
However, no difference was observed on the growth and apoptosis assays. The effect of
an even higher force, applied for 10 minutes, was not considered a priority at this stage
and was not investigated further.
Regarding the iron quantification itself, the SQUID is a precise instrument that can
allow detection of down to 1ng of iron oxide without the need for a chemical assay

Chapter 5 Further investigation of differential labelling
- 148 -
(Hautot, Pankhurst, & Dobson 2005). Because it is relatively easy to use, it was
considered a better option than the chemical assay used in Chapter 4. The 3.9pg/cell
iron oxide estimated using SQUID compares well with the 5.4pg/cell seen for adherent
cells in Chapter 4 (Figure 4.12). An important drawback with SQUID was the large
number of CD133 cells that were needed for measurements. For this reason, only the
mean cell content of a mixture of suspension and adherent cells was estimated. This is
likely to have led to an underestimation of the magnetic force applied on adherent cells.
There are limited studies that have investigated the magnitude of the force necessary to
rupture a cell membrane; these mainly focus on the force needed to withdraw molecules
from the membrane, and estimates between 100pN and 800pN are quoted (Afrin,
Yamada, & Ikai 2004; Benoit et al. 2000). These forces are larger than the observed
9.3pN force that is regarded as the maximum safe force in the presented studies.
However, in the above studies investigating rupture, forces are applied for a timespan of
seconds to minutes, and it is noted that the rupture force decreases with increasing force
application time (Marrink et al. 1998). Moreover, forces as low as 2pN can distort the
intracellular cytoskeleton (Jiang et al. 2003). These facts, together with the likely
underestimation of the forces applied on adherent cells, can explain the fact that in my
experiments, above average forces 9.3pN per cell, some cell death was observed.
5.4.3 Cell viability and differentiation
I could not find any reported cell toxicity when Endorem® or Feridex® have been used
to label cells without additional transfection agents. Although the general consensus is
that SPIO labelling in general is not harmful (Bulte & Kraitchman 2004), adding a
transfection agent has been reported to affect the cell differentiation (Kostura et al.

Chapter 5 Further investigation of differential labelling
- 149 -
2004). In MRI studies where a transfection agent has been used, typically 20-30pg of
iron oxide per cell is achieved (Bulte & Kraitchman 2004). In this study, the iron
content was lower than that. However, as previously discussed, adding a transfection
agent may be an obstacle to clinical translation, and more importantly, was not
necessary in the context of these studies, as it would increase the force. However,
because of the lower iron content, the visibility of the cells using MRI needed to be
investigated. Using a T2*-weighted sequence, it was possible to visualise the cells, at
least in vitro. This indicates that the multi-modality of using an SPIO agent, both for
targeting and imaging, is retained.
A variety of assays were used to confirm that the labelling method itself, i.e. the process
of separating the cells as well as the uptake of SPIO, does not increase apoptosis (Figure
5.3) or affect differentiation in culture (Figure 5.8). Furthermore, immediate (Figure
5.1) post-attraction viability was shown to be normal, as well as cell growth up to 192h
(Figure 5.2) and apoptosis up to 120h after attraction (Figure 5.5). The success of these
assays was very dependent on the amount of water evaporation. This effect of
evaporation was only recently reported in the literature, in a study that showed the same
spatial differences within the plate as described in the Appendix (Figure A.5), and also
concluded that the plate should be filled with water to limit the evaporation (Patel,
Tuckerman, & Dong 2005).

Chapter 5 Further investigation of differential labelling
- 150 -
55..55 CCoonncclluussiioonnss
In these studies, it was found that:
i) Cell viability, growth and apoptosis is normal following DfL and magnetic
attraction using stacked magnets.
ii) Cell differentiation is normal 10 days post-labelling.
iii) Cells contain on average 3.9pg iron oxide / cell. A force of 9.3pN per cell is safe
with regard to (i) above.
iv) Cells are visible using MRI and readily create signal voids in vitro.

- 151 -
CCHHAAPPTTEERR 66
MMAAGGNNEETTIICC AACCTTUUAATTIIOONN IINN VVIITTRROO

Chapter 6 Magnetic actuation in vitro
- 152 -
66..11 IInnttrroodduuccttiioonn
Magnetic actuation refers to the movement of an entity under the influence of a
magnetic force. This chapter will focus on theoretical modelling and in vitro
experiments of CD133-derived, Endorem®-labelled cells. The aim of these experiments
was to examine the feasibility of external targeting of cells to a site of rat common
carotid artery (CCA) injury. Results using an in vivo rat CCA injury model are
presented in Chapter 7. Here, static and fluid dynamic problems will be considered in
simulations and in vitro.
As outlined in section 3.2.2, magnetic targeting has mainly been exploited in the context
of drug targeting. Several theoretical models have been developed, which focus on
laminar flows in liquids such as water. Targeting of cells only recently gained interest
alongside the advent of stem cell therapies. A variety of magnetic targeting methods
have been utilised for cells (section 3.2.3). As previously mentioned, these are not
directly applicable to a clinical scenario. Moreover, so far there have not been any
theoretical models of cell targeting.
An important consideration in the common carotid artery (CCA) model is that the artery
is a non-superficial structure approximately 5mm from the skin, in which there are large
hydrodynamic forces acting on the cells, with peak systolic blood flow rate up to
10mL/min (maximum velocity 40cm/s) (Garcia-Villalon et al. 1992; Miyashiro, Poppa,
& Berk 1997). However, there is a rapid decline of magnetic force at increased target
tissue distances, which in general poses a challenge to magnetic targeting using external
devices in vivo (Dobson 2006; Pankhurst et al. 2003). To overcome this issue, a
permanent magnetic actuator configuration was chosen which increases the force
magnitude at large distances (Halbach array) (Häfeli et al. 2007; Mallinson 1973).

Chapter 6 Magnetic actuation in vitro
- 153 -
In this study, the aim was to:
i) Magnetically actuate cells in the absence of external flow in vitro.
ii) Model and construct an external magnetic actuator for in vivo targeting,
which would not exceed the cell-safe force.
iii) Model magnetic targeting of cells in a flowing vessel using this actuator.
iv) Magnetically attract cells from a flowing vessel in vitro using this actuator.
It was found that:
i) Endorem®-labelled cells are readily actuated in a static liquid.
ii) The Halbach array constructed leads to higher forces than single or stacked
disk magnets, without exceeding the cell-safe force at 5mm distance.
iii) Cells can be theoretically captured from a 10mL/min flow using the array.
iv) Cells can be captured in vitro. The capture efficiency is less than predicted
using the theoretical model.
66..22 MMeetthhooddss
6.2.1 Cell culture
Because of the limited availability of CD133 cells, in these experiments human
mononuclear cells (MNCs) were used. These were collected by leukapheresis from
peripheral blood of G-CSF-stimulated donors. MNCs were grown for 2h in serum-free
DMEM medium (Gibco) followed by removal of non-adherent cells and culture of
adherent fraction in 10%FBS/DMEM. MNCs were labelled by incubating 12 hours in

Chapter 6 Magnetic actuation in vitro
- 154 -
0.5 mg/ml Endorem® or 36 hours in 0.1 mg/ml, resulting in 7.9pg Fe3O4/cell or 3.5pg
Fe3O4/cell, respectively, as measured using the SQUID (see section 5.2.7).
6.2.2 In vitro actuation in a static liquid
To investigate whether the forces applied on Endorem®-labelled cells are in the order
of magnitude necessary to move them through a liquid, 1x10⁴ MNCs (7.9pg iron oxide
per cell) were placed in a suspension of PBS on a glass slide under a phase contrast
microscope. The movement of the cells were captured on video using a 20x objective
and a standard CCD camera, while a single 22mm x 8mm disk magnet was placed 5mm
away from the suspension edge.
6.2.3 Magnetic actuator (Halbach array)
The array was constructed using five 10x10x25mm3 Nd2Fe14B grade N35 magnet
blocks in a configuration of rotating magnetisation, whereby the magnetisation direction
rotates 90o for every block. This type of configuration exhibits destructive and
constructive superposition of magnetisation on its two sides, resulting in a preferentially
one-sided flux and force higher than that of a single magnet (Hafeli et al. 2007;
Mallinson 1973). Because of the repulsive forces between the blocks, they were
attached together inside a machined aluminium casing.
6.2.4 Computer simulations
Magnet designs were modelled using Opera 2D and 3D (Vector Fields Inc, IL USA)
and COMSOL Multiphysics 3.1 (COMSOL Inc, MA USA). The single and stacked
magnets used in Chapter 4 were compared to the Halbach array. Fluid dynamics
simulations were run using COMSOL, on a 4x2GHz quad-core MacPro workstation

Chapter 6 Magnetic actuation in vitro
- 155 -
with 8Gb RAM. The Khan and Richardson force and the magnetic force from the array
were considered, in parabolic non-pulsatile laminar flow of water (density=997kg/m3,
viscosity=8.9x10⁻⁴ Pa·s) with maximum velocity 40cm/s. This is equivalent to
10mL/min flow in a 1mm diameter vessel. Simulated cells were 10μm in diameter,
3.9pg Fe3O4 / cell. Cell capture was defined as approximation and contact with the
vessel wall within the 50mm length of the array. Theoretical capture efficiency for a 3-
dimensional vessel was based on capture toward the 1/3 of the vessel periphery closest
to the magnet, taking in account the parabolic flow profile in the vessel.
6.2.5 In vitro flow system
The array described above was assessed in an in vitro flow system by placing 1x10⁶/ml
SPIO-labelled blood MNCs (3.5pg Fe3O4/cell) in peristaltic pump - driven flow (1-10
ml/min, max velocity 40 cm/s) using biocompatible (ISO 10993) 1mm internal diameter
Tygon® S-54 elastic microtubing (Saint-Gobain Performance Plastics, France). The
array was placed at 1mm and 5mm distance from the tubing. Cells were washed using
cell dissociation buffer (Sigma), stained with Trypan Blue, and the mean of 5
haemocytometer counts of captured cells was calculated for each experiment. Digital
images were acquired using a standard dissection microscope and a digital camera.
6.2.6 Statistical analyses
As in 4.2.2.7. The homogeneity of variance assumption was evaluated with Levene's
test, and Welch’s correction for two-sample t-tests was used where the variances were
significantly different (Levene’s test for equality of variance p<0.05).

Chapter 6 Magnetic actuation in vitro
- 156 -
66..33 RReessuullttss
6.3.1 Cell actuation in a static liquid
Magnetic attraction caused movement of SPIO-labelled MNC (Figure 6.1). As well as
being attracted to the magnet, the cells experienced inter-cell attraction, and entered the
field of view in aggregates. This led to an increase in cell count rate between 5s – 10s.
The cell count rate subsequently decreased (10s - 20s) as the suspension volume closest
to the magnet was depleted of cells. The average velocity of two single cells was
150µm/sec.
To compare the actual cell velocity to the theoretical velocity these cells could achieve,
the force on these cells was calculated using Equation 3.5. The force when the cells are
5mm away from the magnet corner was 19pN. Substituting this value in Equation 3.12
and ignoring friction with the glass slide, the theoretical velocity of single spherical
cells in a suspension of water is 215µm/sec. As the cells move closer to the magnet, this
theoretical velocity increases. For example, within the 200µm distance travelled in
Figure 6.1, the magnetic force per cell would increase to 19.5pN and the velocity to
220µm/sec. Given that these values ignore friction with the glass slide, they compare
well with the measured velocity of 150µm/sec.

Chapter 6 Magnetic actuation in vitro
- 157 -
Figure 6.1 – Actuation of Endorem®-labelled MNC in a static suspension
(a) Video frames for t=0 (application of magnet), 5, 10 and 15 seconds after exposure
to the magnet. Relative position of a 22mm diameter x 8mm height disk magnet is
displayed for t=0 (not to scale). (b) Count of cells in field of view.

Chapter 6 Magnetic actuation in vitro
- 158 -
6.3.2 Design and construction of the magnetic actuator
An actuator design of rotating magnetisation was chosen (Halbach array) (Figure 6.2).
The rotating magnetisation should result in a preferentially one-sided magnetic field
density and magnetic force magnitude (Hafeli et al. 2007). This was confirmed in the
computer modelling (Figure 6.2-a). The force maxima were predicted to occur at the
junctions between the magnet blocks and at the corners of the array. Figure 6.2-b is an
orientation summary for the modelling and in vitro studies presented in this chapter; it
describes the two distances along the length of the array (1mm and 5mm horizontal
lines), as well as the vertical central and junction lines used for analysis of the forces.
In order to compare the field strength and gradient of the Halbach array to the single and
stacked magnets used in Chapter 4 and 5, ( )HH ∇⋅ was calculated for the central line of
these disk magnets. Assuming constant cell iron content, the magnetic force on the cells
will be directly proportional to ( )HH ∇⋅ (section 3.3.3). A shorter 3-magnet Halbach
array was also simulated. The data for the central line of the disk magnets and the
Halbach arrays is presented in Figure 6.3. Note that the Halbach arrays have higher
( )HH ∇⋅ at the junctions (Figure 6.2-b); the force on top of these junctions is
considered later.
The Halbach array was predicted to have higher ( )HH ∇⋅ than the disk magnets. At
1mm along the central line, the ( )HH ∇⋅ of the 5-magnet array is approximately
double that of the stacked disk magnets, and 10% higher than a 3-magnet array. From
the data in Figure 6.3 it can also be observed that stacking the disk magnets effectively
doubles the available ( )HH ∇⋅ at 1mm; this in turn doubles the force, which was
discussed in Chapter 4 (Figure 4.9).

Chapter 6 Magnetic actuation in vitro
- 159 -
Figure 6.2 – Halbach array
a) Computer model of the Halbach array, with lines of equal magnetic flux density
(white lines) and colour coding of force magnitude increasing from blue to white. Black
arrows display the magnetisation direction of each magnet block. b) Orientation image
showing the two distances (1mm and 5mm) and the central line and junction line
referred to in this chapter. Yellow mark in left-most block placed for orientation (also in
Figure 6.9).
(a) (b)
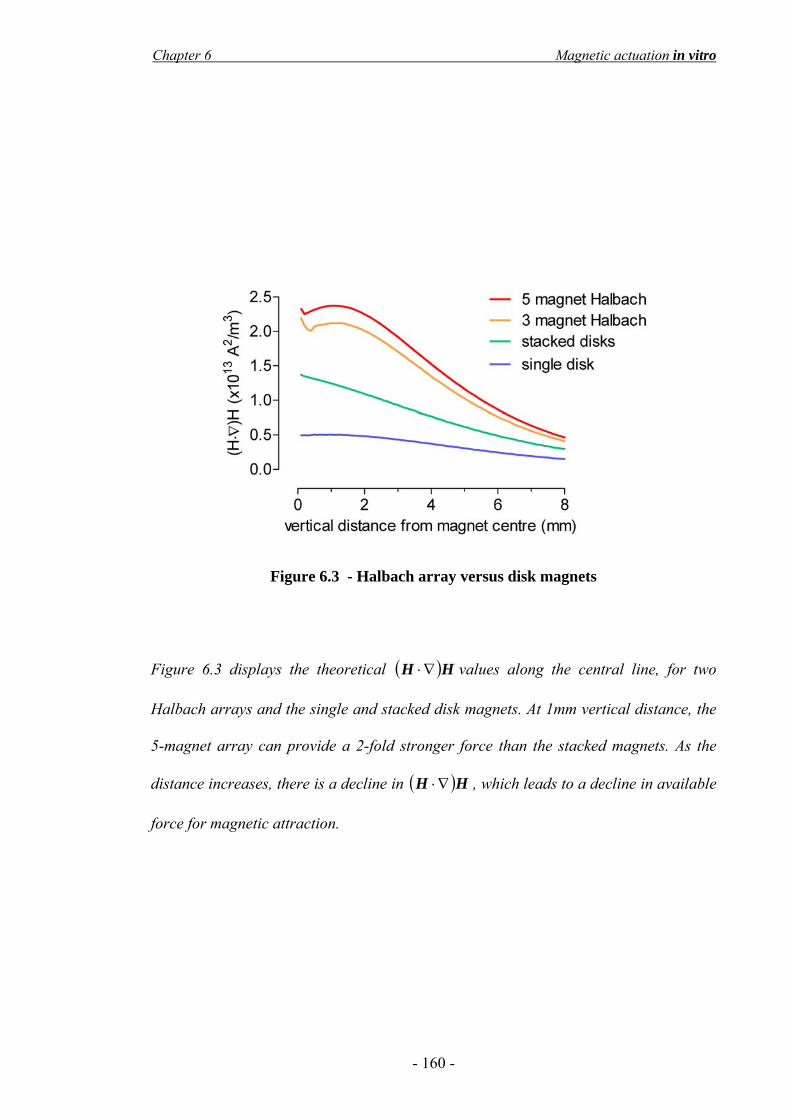
Chapter 6 Magnetic actuation in vitro
- 160 -
Figure 6.3 - Halbach array versus disk magnets
Figure 6.3 displays the theoretical ( )HH ∇⋅ values along the central line, for two
Halbach arrays and the single and stacked disk magnets. At 1mm vertical distance, the
5-magnet array can provide a 2-fold stronger force than the stacked magnets. As the
distance increases, there is a decline in ( )HH ∇⋅ , which leads to a decline in available
force for magnetic attraction.

Chapter 6 Magnetic actuation in vitro
- 161 -
6.3.3 Effect of the SPIO magnetisation saturation A more detailed comparison of the magnetic forces created by these magnets requires
consideration of the saturation of the SPIO magnetisation, because the forces are
calculated with a different expression if the magnetisation is saturated (section 3.3.3).
As shown in Figure 3.6, for the case of Endorem® a saturation limit can be selected at
398 kA/m based on SQUID data. Below 398 kA/m, the magnetic force was calculated
using Equation 3.5; above 398 kA/m, Equation 3.6 was used. As seen in Figure 6.4,
only the Halbach arrays exceed this limit. For example, for the 5-magnet array, the 398
kA/m limit is reached 2.4mm vertical distance from the magnet centre. Using the
unsaturated force expression when H>398 kA/m would thus result in an overestimation
of the applicable force (Figure 6.5), so the force expressions were ‘switched’ at the
SPIO saturation limit (Figure 6.6).
Figure 6.4 – Magnetic field strength and magnetisation saturation
For the 5-magnet array, the 398 kA/m limit is reached at 2.4mm vertical distance from
the magnet centre. For the 3-magnet array, this limit is reached at 2mm distance. With
the disk magnets, the limit is not reached; the magnetisation of the SPIO particles does
not become saturated. Thus the unsaturated force expression was used for the disk
magnets.
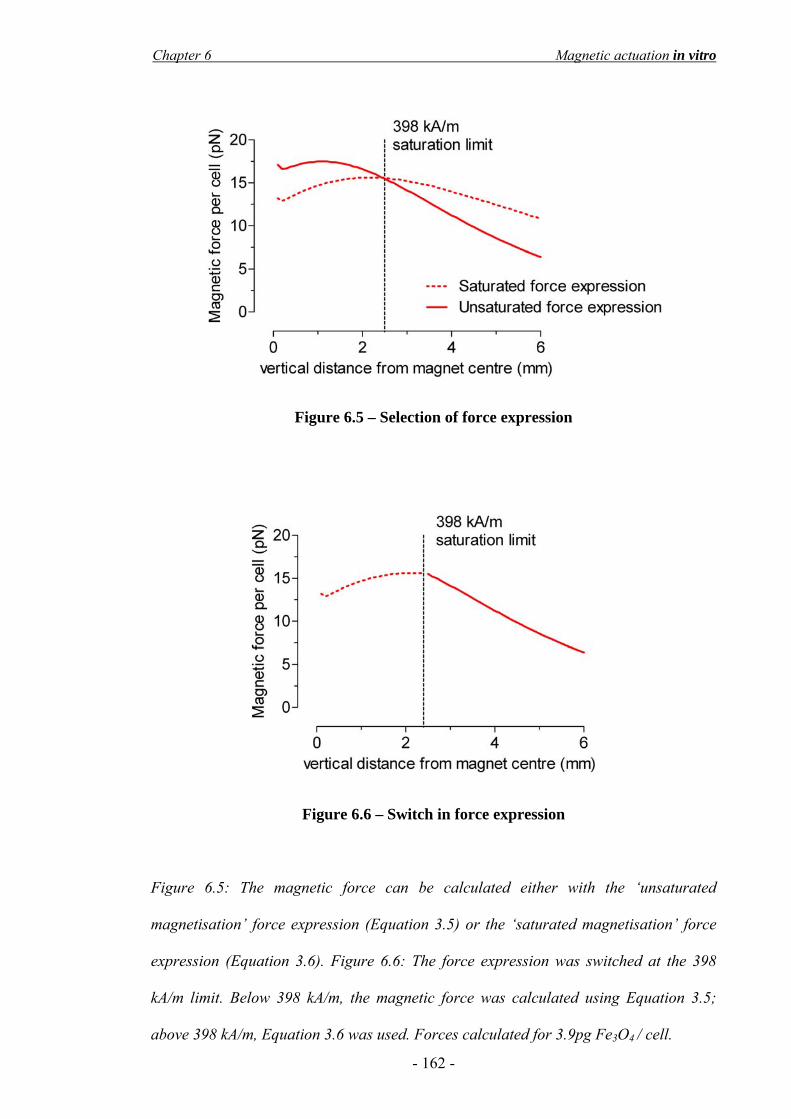
Chapter 6 Magnetic actuation in vitro
- 162 -
Figure 6.5 – Selection of force expression
Figure 6.6 – Switch in force expression
Figure 6.5: The magnetic force can be calculated either with the ‘unsaturated
magnetisation’ force expression (Equation 3.5) or the ‘saturated magnetisation’ force
expression (Equation 3.6). Figure 6.6: The force expression was switched at the 398
kA/m limit. Below 398 kA/m, the magnetic force was calculated using Equation 3.5;
above 398 kA/m, Equation 3.6 was used. Forces calculated for 3.9pg Fe3O4 / cell.
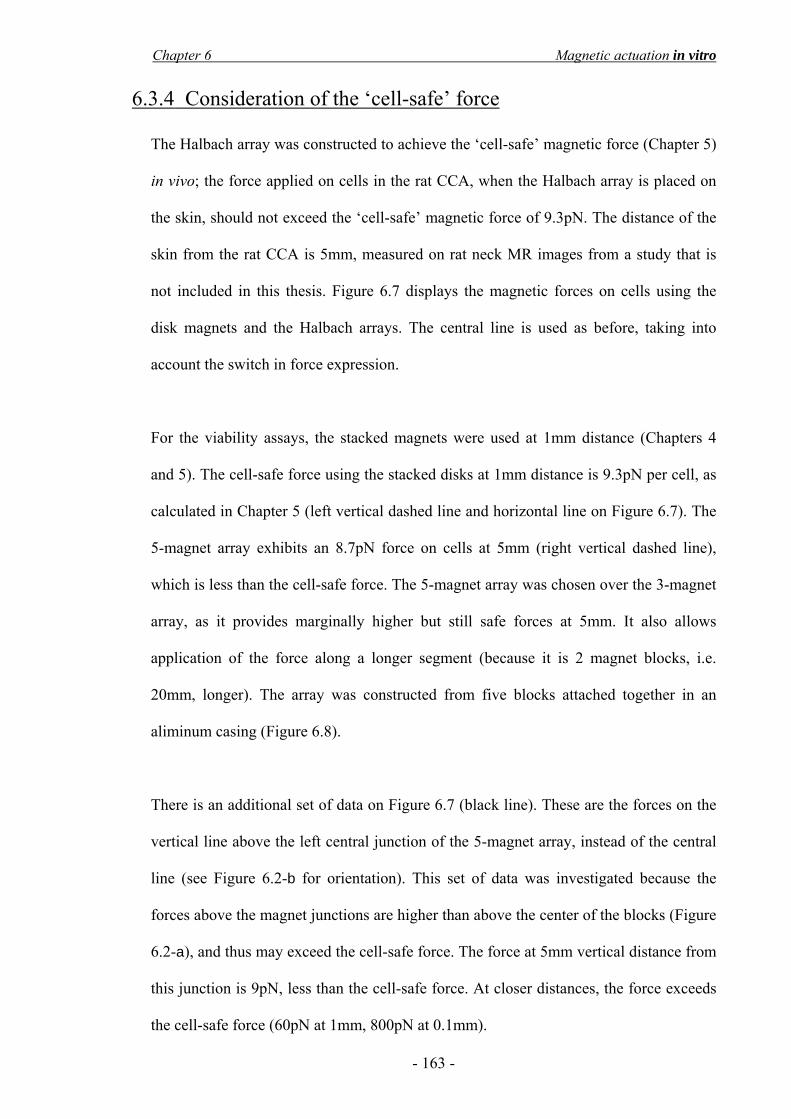
Chapter 6 Magnetic actuation in vitro
- 163 -
6.3.4 Consideration of the ‘cell-safe’ force
The Halbach array was constructed to achieve the ‘cell-safe’ magnetic force (Chapter 5)
in vivo; the force applied on cells in the rat CCA, when the Halbach array is placed on
the skin, should not exceed the ‘cell-safe’ magnetic force of 9.3pN. The distance of the
skin from the rat CCA is 5mm, measured on rat neck MR images from a study that is
not included in this thesis. Figure 6.7 displays the magnetic forces on cells using the
disk magnets and the Halbach arrays. The central line is used as before, taking into
account the switch in force expression.
For the viability assays, the stacked magnets were used at 1mm distance (Chapters 4
and 5). The cell-safe force using the stacked disks at 1mm distance is 9.3pN per cell, as
calculated in Chapter 5 (left vertical dashed line and horizontal line on Figure 6.7). The
5-magnet array exhibits an 8.7pN force on cells at 5mm (right vertical dashed line),
which is less than the cell-safe force. The 5-magnet array was chosen over the 3-magnet
array, as it provides marginally higher but still safe forces at 5mm. It also allows
application of the force along a longer segment (because it is 2 magnet blocks, i.e.
20mm, longer). The array was constructed from five blocks attached together in an
aliminum casing (Figure 6.8).
There is an additional set of data on Figure 6.7 (black line). These are the forces on the
vertical line above the left central junction of the 5-magnet array, instead of the central
line (see Figure 6.2-b for orientation). This set of data was investigated because the
forces above the magnet junctions are higher than above the center of the blocks (Figure
6.2-a), and thus may exceed the cell-safe force. The force at 5mm vertical distance from
this junction is 9pN, less than the cell-safe force. At closer distances, the force exceeds
the cell-safe force (60pN at 1mm, 800pN at 0.1mm).

Chapter 6 Magnetic actuation in vitro
- 164 -
Figure 6.7 – Magnetic force on cells: Halbach vs disk magnets
Figure 6.7 displays the estimated force per cell (3.9pg Fe3O4 per cell) for the disk
magnets and the Halbach arrays. The horizontal dashed line is the cell-safe magnetic
force; this is reached at 1mm using the stacked magnets, which is the distance the cells
were placed from the magnets during the viability tests (left vertical dashed line). Using
the 5-magnet Halbach array, this force is not exceeded at 5mm distance (right vertical
dashed line) from the 5-magnet array centre (red line) or junction (black line).
Figure 6.8 – The constructed 5-magnet array
The 5-magnet Halbach array was constructed using 5 magnet blocks in a configuration
of rotating magnetisation, inside an aluminium casing. The black arrows represent the
magnetisation direction of each block.

Chapter 6 Magnetic actuation in vitro
- 165 -
6.3.5 Finite element modelling of cell targeting This section will describe the computer simulations of cell targeting from a flowing
vessel using the 5-magnet Halbach array. Two scenarios were considered for the finite
element modelling (FEM) fluid dynamics simulations; the vessel was placed either
1mm away or 5mm away from the Halbach array. The purpose of these simulations was
to investigate the theoretical feasibility of targeting cells with 3.9pg iron oxide / cell,
from a 10mL/min flow. Cell capture was possible at both distances. Figure 6.9 displays
FEM of cell targeting to the wall of a vessel placed 1mm from the actuator. As the fluid
drag force diminished near the vessel wall, the cells approached with increasing angle.
Figure 6.9 – FEM simulation: cell capture at 1mm
The fluid velocity is colour-coded and increases from blue to red. The laminar flow
model resulted in a parabolic velocity profile with velocity highest at the centre of the
vessel (red, 40cm/s) and minimal near the vessel wall (blue). Targeted cells (black
spheres, not to scale) are shown on the vessel wall; the thin yellow lines (bottom image,
arrow) are the cells’ predicted intraluminal trajectories.

Chapter 6 Magnetic actuation in vitro
- 166 -
Cell capture was defined as contact with the vessel wall within the 50mm length of the
actuator. Due to the laminar flow, successful targeting was dependent on the initial
vertical distance of the cells from the vessel wall (Figure 6.10). Cells close to the vessel
wall adjacent to the array were captured. Cells near the centre of the vessel, and those
near the far side of the vessel, did not get captured within the 50mm length of the array.
Furthermore, the cell capture was dependent on the distance of the vessel from the
magnetic array. Cell capture was theoretically possible at both distances. When the
array was placed 1mm away from the vessel, cells initially up to 170µm away from the
vessel wall were captured. This represents 11% capture efficiency of flowing cells at
each pass. At 5mm, cells up to 70µm were targeted, which represents a capture
efficiency of 2.3%.
Figure 6.10 – Cell capture simulations at 1mm and 5mm
The graph is a plot of the initial vertical distance of the cells from the vessel wall upon
release, against the distance travelled prior to capture. Cells near the centre of the
vessel move faster than those near the wall and did not get captured within the 50mm
length of the array.

Chapter 6 Magnetic actuation in vitro
- 167 -
6.3.6 In vitro flow system
6.3.6.1 System setup
Subsequent to the finite element modelling simulations, the targeting ability of the 5-
magnet Halbach array was investigated in vitro at the two distances (1mm and 5mm, see
Figure 6.2), using a 10mL/min flow system (Figure 6.11).
Figure 6.11 – In vitro flow system setup
Figure 6.11 is a photograph of the in vitro flow system setup. The system was comprised
of a reservoir containing a suspension of cells, a peristaltic pump, the Halbach array at
1mm or 5mm and a tube segment above the array that could be removed to quantify the
capture. The tubing was attached to a cork ring, which could be elevated with spacers
to increase the distance of the tube to the Halbach array.

Chapter 6 Magnetic actuation in vitro
- 168 -
6.3.6.2 Proof of principle – cell capture at 1ml/min
As a proof of principle, cells were circulated in the system at a flow rate of 1ml/min and
1mm distance from the Halbach array. The slow flow rate and 1mm distance were
chosen in order to decrease the hydrodynamic drag force and increase the magnetic
force for this proof of principle experiment. A large number of cells accumulated on top
of the array within 5 minutes (Figure 6.12).
Figure 6.12 – Cell capture at 1mm, 1ml/min
Figure 6.12-a is a photograph taken from the side of the cork ring. Cell aggregates
were readily visible inside the tube (black arrows). The flow direction was from left to
right; correspondingly, the aggregates formed first on the left side. Aggregation was
more pronounced on top of the magnet array junction points. The area bounded by the
red box is magnified in (b).
(a) (b)
Chapter 6 Magnetic actuation in vitro
- 169 -
6.3.6.3 Cell capture at 10ml/min
Subsequent to the proof of principle experiment and because of the preferential
accumulation of the cells above the junction points, it was considered appropriate to
examine the forces on the cells along the length of the Halbach array in more detail (see
horizontal lines on Figure 6.2 for orientation). The forces along the 1mm and 5mm
distances were investigated.
Figure 6.13 shows the forces on cells along the 1mm horizontal line above the array.
There are sharp force peaks on top of the magnet junction points. Cells accumulated
above these points of predicted maximum force within 1 minute after initiation of
10ml/min flow; Figure 6.14 is a top view photograph of the cell aggregation.

Chapter 6 Magnetic actuation in vitro
- 170 -
Figure 6.13 – Forces along 1mm horizontal line
Figure 6.14 – Cell capture at 1mm with 10ml/min flow
Figure 6.13 shows the forces on cells using the saturated force expression (because
H>398 kA/m from -30mm to +30mm). The force peaks correspond to the magnet block
junctions. Figure 6.14 is a photograph of the cell aggregation (black arrows and
magnification inset) 1 minute after initiation of 10ml/min flow. Only three of the six
aggregates are visible due to limited field of view. It is important to note that the cell
aggregates dissociated a few seconds after removal of the array.

Chapter 6 Magnetic actuation in vitro
- 171 -
Targeting with the array for 15 minutes at 1mm resulted in 252-fold increase in capture
(Figure 6.15). The mean cell count with targeting was 41 x103 ± 6 x10³ cells, compared
to 163 ± 41 cells without targeting. Given a circulating cell number of 1x10⁶ cells, the
capture efficiency with targeting was 4%. The capture efficiency without targeting was
0.02%. Notably, the Trypan Blue dye did not detect any decrease in viability, despite
the higher forces. This is discussed later.
Figure 6.15 – Cell capture counts at 1mm with 10ml/min flow
The graph shows the captured cell count (in 1000s) following 15 minutes of targeting at
1mm distance and 10ml/min flow rate. There was a 252-fold increase in targeting
(mean = 41 x103 ± 6 x10³ cells) compared to control (mean = 163 ± 41 cells). The mean
difference was 41x103 cells with 95% CI for the difference 24 x103 to 58 x103 cells
(p=0.003, n=3, unpaired t-test). Error bars are the standard error of the mean.

Chapter 6 Magnetic actuation in vitro
- 172 -
Finally, the forces along the 5mm horizontal line were examined; these were 5.5-fold
weaker than at 1mm and did not have prominent peaks (Figure 6.16-a). At this distance,
no cell aggregates were visualised. However, there was a 6-fold increase cell count after
1 hour of flow (Figure 6.16-b). The mean cell count with targeting was 1630 ± 276
cells, compared to 281 ± 21 cells without targeting. The capture efficiency with
targeting was 0.2%.
Figure 6.16 – Targeting at 5mm
a) Unsaturated forces on cells at the 5mm line. b) Increase in capture with targeting at
5mm distance compared to non-targeted controls after 1 hour of 10ml/min flow. The
mean difference was 1350 cells, with 95% CI for the difference 468 to 2230 cells
(p=0.017, n=4, unpaired t-test with Welch’s correction). Error bars are the SEM.
(a) (b)

Chapter 6 Magnetic actuation in vitro
- 173 -
66..44 DDiissccuussssiioonn
6.4.1 Main findings
In this study, it was found that:
i) Endorem®-labelled cells are readily actuated in a static liquid.
ii) The Halbach array constructed leads to higher forces at large distances,
without exceeding the cell-safe force at 5mm distance.
iii) Cells can be theoretically captured from a 10ml/min flow using the array at
1mm and 5mm distance.
iv) Cells can be captured in vitro at both distances. The capture efficiency is less
than predicted using the theoretical model.
6.4.2 Fluid dynamics simulations
Despite the recent interest in magnetic cell targeting applications (3.2.3), to date there
has not been an attempt to develop a theoretical model. The models that exist are
focused on drug targeting, as outlined in section 3.2.2 (Chen et al. 2008; Cregg,
Murphy, & Mardinoglu 2008; Furlani & Furlani 2007; Grief & Richardson 2005; Min-
Cheol et al. 2006; Ritter et al. 2004; Voltairas, Fotiadis, & Michalis 2002). These
reports have focused on small magnetic carriers, and are not directly applicable to cells.
For example, the assumption of Stokes drag, which is universally used in drug targeting
models (Re<1, see section 3.4.4), may be violated when considering a cell moving in
arterial flow rates (e.g. maximum Re=4 for water). For this reason, the Khan and
Richardson (1987) approximation was used in the FEM simulation (Equation 3.15).
The model presented here is simplified in comparison to the real scenario of cell
targeting from flowing blood. It does not take into account the blood plasma viscosity

Chapter 6 Magnetic actuation in vitro
- 174 -
(which is higher than water) and collisions with blood cells, both of which increase the
effective drag from the blood and will decrease capture efficiency. It also assumes that
cells are captured upon contact with the vessel wall, and does not take into account the
rolling of the cells on the artery and their potential to escape the magnetic field in this
manner. This would also lead to overestimation of the capture efficiency.
On the other hand, the presented model simulated a continuous 10ml/min flow, which is
an extreme scenario, given that the rat CCA has peak systolic flow up to 10ml/min
(Garcia-Villalon et al. 1992; Miyashiro, Poppa, & Berk 1997). During the diastolic
phase the hydrodynamic drag would decrease, and thus in a pulsating circulation with
10ml/min peak flow, the capture efficiency will be higher than in the modelled
continuous 10ml/min flow. Moreover, the model ignores changes in hydrodynamic drag
force due to perturbation of the flow by the cells and interactions between the cells and
the vessel wall, which are expected to increase the capture efficiency by creating a
vertical lift toward the wall (Forbes et al. 2003). The model also ignores magnetic
interactions between cells, which as seen in Figure 6.1 are quite marked, and are also
expected to increase the capture efficiency (Forbes et al. 2003). This is because the
hydrodynamic drag force scales with surface area and the magnetic force scales with
volume; cell aggregation changes the ratio of these two forces in favour of magnetic
targeting.
6.4.3 In vitro flow system
In this study, an external magnet array was used to capture cells in a 1mm tube with
10ml/min flow, giving an average fluid velocity 20cm/sec and maximum fluid velocity
at the tube centre 40cm/sec. Cell targeting was possible at both 1mm and 5mm
distances, but was more pronounced at 1mm. The capture efficiency was less than

Chapter 6 Magnetic actuation in vitro
- 175 -
predicted by the theoretical model. It was 3-fold lower at 1mm (4% actual versus 11%
theoretical) and 10-fold lower at 5mm (0.2% actual versus 2.3% theoretical). These
differences can be attributed to one of the assumptions in the theoretical model that
cannot be applied to the in vitro system:
The theoretical model assumes cell capture upon contact with the vessel wall.
Immediate cell capture is unlikely to happen in a plastic tube in vitro, unless the
magnetic force is large enough to withstand the fluid force. This is more likely to occur
at closer distances and on top of the magnet junctions. Indeed, the cells were visualised
to completely arrest on top of the magnet junctions at the closer 1mm distance (Figure
6.14). The cells that are found at increased distances from the actuator, experience
smaller magnetic forces and may roll on the tube wall and escape. In vivo, this capture
process could be amplified by adhesive ligands at the site of injury (1.4.5), which would
help arrest the targeted cells on the vessel wall.
In the literature, only two studies have explicitly investigated magnetic capture of cells
in flow. Previous in vitro flowing experiments using external magnets have only been
attempted by Muthana et al (2008). Using a single magnet and a flow rate of 1.9ml/min
in parallel plates to match the flow speed of post-capillary venules, the authors
increased cell adherence to an endothelial monolayer by approximately 50-100 fold.
These results are hard to compare to the current study, because the iron oxide
concentration per cell is not presented in the paper, and there is no clear description of
the strength of the disk magnet; therefore the magnetic forces on the cells cannot be
calculated. The average flow velocity in a venule is 0.1-0.2cm/sec (Embury et al. 1999).
This is ten times lower than the average flow velocity used in my studies; yet the
capture efficiency in the studies by Muthana et al is less. Assuming the cellular iron

Chapter 6 Magnetic actuation in vitro
- 176 -
oxide content in my studies is less than those of Muthana, the remaining explanation is
that the decreased capture efficiency is attributable to weaker magnetic forces as a result
of using a single magnet with weak field strength and gradients, and possibly also due
to a larger distance of their magnet to the flowing cells.
In another study, Polyak (2008) could capture up to 20% of circulating cells using an
intravascular metallic mesh in a 30ml/min flow system. The captured cells in this study
are reported to contain 200pg of particles made in-house; this was calculated using
fluorescence of a cell sample. However, based on their presented SQUID data, it can be
estimated that the cells contain aproximately 25pg of particles instead. Given this
disparity, and the unknown iron oxide content of their particles, it was not possible to
estimate the iron oxide content of the cells for comparison. Furthermore, the magnetic
forces acting on the cells are not presented, and neither is the size of the vessel for the
flow system. Given the additional fundamental difference of using an intravascular
device for the capture, it was not possible to compare the current study to that of Polyak
et al.
A point to be made regarding the presented flow system is that at 1mm the forces far
exceed the ‘cell-safe’ magnetic force (Figure 6.13). Cell viability post-capture was not
investigated in depth as part of this study, although the cells appeared normal on visual
assessment of the Trypan Blue dye during the haemocytometer counting (images not
presented). It is possible that such high forces will be detrimental to the cells; in contrast
these forces need only be applied for a very brief amount of time (<15mins) to achieve
significant cell capture, so viability may remain unaffected. Indeed, it may be the case
in the presented experiments. Additional studies using more sensitive viability tests
were not performed because the 1mm distance would not be considered in vivo.

Chapter 6 Magnetic actuation in vitro
- 177 -
Finally, the presented results give some insight to a key issue regarding external
targeting; invariably, cells flowing in vessels closer to the magnetic source than the
target tissue will also be targeted (section 3.2.2). However, such cells should be released
following removal of the magnetic source in the absence of an underlying biological
mechanism to keep them engrafted, as visually observed with the cell aggregates after
removal of the magnetic array.
66..55 CCoonncclluussiioonnss
In this study, it was found that:
i) Endorem®-labelled cells are readily actuated in a static liquid.
ii) The Halbach array constructed leads to higher forces at large distances,
without exceeding the cell-safe force at 5mm distance.
iii) Cells can be theoretically captured from a 10ml/min flow using the array at
1mm and 5mm distance.
iv) Cells can be captured in vitro at both distances. The capture efficiency is less
than predicted using the theoretical model.

- 178 -
CCHHAAPPTTEERR 77
MMAAGGNNEETTIICC TTAARRGGEETTIINNGG IINN AANN AANNIIMMAALL MMOODDEELL

Chapter 7 Magnetic targeting in an animal model
- 179 -
77..11 IInnttrroodduuccttiioonn
There is a pressing need for stem cell targeting strategies (section 1.5). Limited studies
have investigated the possibility of magnetic targeting of cells to specific locations in
vivo (3.2.3). Despite the fact that drug targeting moved quickly into the clinic for
feasibility and safety studies (3.2.2) and that SPIO agents have previously been used to
track cells in humans (2.3.4), magnetic cell targeting has remained a laboratory
endeavour. This could be due to the use of iron oxide preparations not approved by the
FDA or the use of customised internal devices, also not approved for clinical use.
The aim of this study was to combine the knowledge obtained from the studies in
Chapters 4-6 and demonstrate magnetic targeting of Endorem®-labelled CD133-derived
EPCs to a site of rat CCA injury using and an externally applied force obtained with the
Halbach array. The targeting was assisted by a 10-minute flow stasis period, similar to
the ‘flow-stop’ protocols used in clinical trials (1.4.6.2).
It was found that magnetic targeting can increase cell adherence to the injured arteries
by 5-fold. Targeting did not increase adherence to non-injured arteries.
The study presented in this chapter is a collaboration between Dr Manfred Junemann-
Ramirez and myself. Dr Ramirez developed the animal model and confocal microscopy
protocols and performed the tissue microscopy. Tissue preparation and analysis of
results was done jointly, however with less input on my part. I was responsible for cell
culture/ labelling and the development and use of reflectance confocal imaging.

Chapter 7 Magnetic targeting in an animal model
- 180 -
77..22 MMeetthhooddss
7.2.1 Cell culture and Endorem® labelling
Day 10 CD133s were cultured and labelled using 24:1 DfL as previously described.
7.2.2 Vascular injury
Male Sprague-Dawley rats (n=15, Charles River UK, 380-420g) were anaesthetised
using midazolam (625µg/100g) and fentanyl (40µg/100g) supported by halothane at
0.5-2% at 2 L/min oxygen. The left CCA was exposed at the bifurcation to the external
and internal carotid artery and a 2F embolectomy catheter (Edwards Lifesciences Corp,
CA USA) was advanced proximally through an arteriotomy into the CCA. The catheter
was inflated with 100µl of air and rotated while retracting to denude the endothelium
(Santiago et al. 2007).
7.2.3 Cell administration and magnetic targeting
SPIO-labelled CD133+ cells were labelled with 5µM CellTracker Green CMFDA
(Invitrogen-Molecular Probes). This dye is activated by intracellular esterases and only
stains viable cells. 5x10⁵ cells were administered in the injured CCA, which was
temporarily clamped for 10 minutes with the Halbach array placed at approximately
5mm distance from the CCA on the ventral aspect of the animal. The circulation was
restored and the array was removed after a further 2 minutes of magnetic attraction
(n=5). Two types of controls were used: i) CCA injury was performed and labelled cells
were injected without magnetic actuation (n=6) and ii) magnetic attraction of labelled
cells was performed on uninjured vessels (n=2). Tissues were retrieved 24h later and
fixed with 1% PFA/PBS. All experimental procedures complied with the institutional
guidelines for animal experiments.

Chapter 7 Magnetic targeting in an animal model
- 181 -
7.2.4 Confocal microscopy
Arteries were opened longitudinally, counterstained with DAPI (Vector Labs, CA) and
mounted on glass slides with anti-fading media (CitiFluor, Leicester, UK). Total arterial
surface confocal microscope images were acquired using a Leica TCS SP2 confocal
microscope equipped with an automated movable stage, an 488nm laser and a UV
348nm laser. Reflectance scanning was used to detect intracellular SPIO (Green,
Holloway, & Walker 2001). The 488nm excitation laser was used and the pinhole
closed to Airy 0.75. The light collection was adjusted to 10nm above and below the
excitation line, to acquire signal reflected by the iron oxide nanoparticles.
7.2.5 Quantification of cell engraftment
Image processing was performed using the Volocity® software (Improvision). A
rolling ball algorithm (ImageJ, National Institutes of Health, MA USA) was used for
background correction. Signal outliers were removed by application of a despeckle
median filter (Rasband, W.S., ImageJ). To analyze cell engraftment, xyz scans were
rendered into a 3D vector graphic format; this enabled quantification of the total
volume of adherent CellTracker-labelled cells per artery. Cell counts were calculated
based on a 10μm cell diameter and are presented per mm2 of arterial surface area.
7.2.6 Statistical analyses
As previously described. Data were inspected visually and with the Shapiro-Wilk test
for small samples to assess normality. Medians are quoted with the interquartile range
(IQR). The Wilcoxon-Mann-Whitney exact test was used. P-values reported are two-
tailed and were considered statistically significant at the 5% level (p<0.05).

Chapter 7 Magnetic targeting in an animal model
- 182 -
77..33 RReessuullttss
7.3.1 Methodological setup
SPIO-labelled CD133+ cells were labelled with 5µM CellTracker Green CMFDA. Cells
were administered in the injured CCA, which was temporarily clamped for 10 minutes
with the Halbach array placed at approximately 5mm distance from the CCA on the
ventral aspect of the animal (Figure 7.1-a). After 24 hours, the arteries were excised and
stained for confocal microscopy (Figure 7.1-b).
The entire face of the luminal side of the artery was scanned using an automatic
movable stage, by acquiring 72 separate images and tiling them together. A sample
single tile is shown in Figure 7.1-c. For the quantification of cell engraftment, the total
volume of CellTracker label was estimated for each artery. A sample screenshot from
the volume quantification is shown in Figure 7.1-d.

Chapter 7 Magnetic targeting in an animal model
- 183 -
Figure 7.1 – Methodological setup a) Halbach array on ventral aspect of animal’s neck. b) Arterial specimen preparation,
series of photographs taken through an operating microscope. The specimen is
approximately 2cm long. The specimen was first cleared of all surrounding tissue (1-4).
The specimen was then cut longitudinally (5) and opened with the luminal side facing
upward (6). This side was stained with DAPI and scanned with a confocal microscope.
c) Sample confocal image. SPIO-labelled cells are green (CellTracker dye); cells of the
arterial wall are blue (DAPI). SPIO-labelled cells also stained with DAPI (not visible at
this magnification). The image size is 750µm2. d) Sample 3D volume render used for
quantification of cell engraftment. The selected volumes are shown in purple. The
yellow rectangle is placed for orientation with Figure 7.2.
(a) (b) (c) (d)

Chapter 7 Magnetic targeting in an animal model
- 184 -
7.3.2 CD133 cell engraftment to the rat common carotid artery
On visual inspection of the entire injured arterial specimens, SPIO-CD133 cells had
engrafted to the CCA lumen, both in the absence of magnetic targeting (injured control)
and following magnetic targeting (Figure 7.2). There were notably more engrafted cells
in the targeted group. The cell engraftment in both groups was non-preferential and was
distributed throughout the entire vessel.
Following magnetic targeting without CCA injury (non-injured control), no SPIO-
CD133 cells were visualised.
High power 3D scans confirmed that the green signal originated from nucleated cells
and also confirmed the presence of intracellular clusters of iron oxide (Figure 7.3).

Figure 7.2 – Representative CCA confocal scans Representative 2D tiled confocal scans of the entire luminal arterial surface 24 hours after cell delivery. The blue signal is DAPI staining of cell
nuclei. The green signal is the CellTracker dye in the cytoplasm of SPIO-CD133s. The yellow square is placed for orientation with Figure 7.1-d.

Chapter 7 Magnetic targeting in an animal model
- 186 -
Figure 7.3 – Confocal image of a single DfL-CD133
High magnification confocal scan of an SPIO-labelled CD133 cell (green cytoplasm,
CellTracker dye). The cell nucleus is visible (blue, DAPI stain). Clusters of SPIO
nanoparticles (yellow) were visualised using reflectance scanning.

Chapter 7 Magnetic targeting in an animal model
- 187 -
Following quantification of the cellular engraftment, there was a notable increase in
cell retention with magnetic targeting. Application of an external magnetic force using
the magnet array during and after cell delivery increased d10-DfL-CD133 cell
engraftment to the injured vascular surface by a factor of 5.4 (Figure 7.4). Targeted
samples had median cell count 134 cells/mm2. Non-targeted samples had median cell
count 25 cells/mm2. In the absence of vascular injury (non-injured control) no cells
engrafted to the endothelial surface when the magnetic force was applied (cell count=0).
Figure 7.4 – Count of cells adherent on rat CCA lumen
Targeted samples had median cell count = 134 cells/mm2 (IQR 47 to 362, n=5). Non-
targeted samples had median cell count = 25 cells/mm2 (IQR 17 to 42, n=6). This
represented a 5.4-fold increase in cell count (p=0.017, Wilcoxon-Mann-Whitney exact
test). Medians are highlighted in red. Boxes represent the quartiles and whiskers extend
to the last value within 1.5 IQR from the quartiles. Cross represents a value at 581
cells/mm2.

Chapter 7 Magnetic targeting in an animal model
- 188 -
77..44 DDiissccuussssiioonn
To investigate the in vivo feasibility of magnetic targeting using external magnets, this
study aimed to increase Endorem®-labelled CD133 cell engraftment to a site of rat
CCA injury by placing an external magnet adjacent to the ventral aspect of the animal’s
neck. The increase in engraftment was 5-fold compared to control (non-targeted)
arteries.
EPCs have recently been utilised for cardiac neovascularisation in clinical trials
(Bartunek et al. 2005; Erbs et al. 2005; Losordo et al. 2007; Schachinger et al. 2004;
Stamm et al. 2007). In the majority of these and other studies on cardiac regeneration,
cells were administered via intracoronary injection with ‘flow-stop’ periods of several
minutes to increase engraftment; yet it has been shown that despite this manoeuvre only
1-3% of the cells remain on site (Charwat et al. 2008; Hristov & Weber 2006), and there
is a pressing need for targeting strategies (Roncalli et al. 2008). In contrast to the
presented study, previous investigations on magnetic cell targeting have used methods
not directly applicable to a clinical setting, as they have used materials not approved for
human use.
A flow interruption period was implemented in the present study, similar to those
employed in clinical trials. Despite this manoeuvre, the increase in cell engraftment
following magnetic targeting was only 5-fold, from 25 cells/mm2 to 134/mm2. This is
attributable to the successful cell engraftment on the non-targeted control specimens,
which is a result of the flow interruption period. Future studies aiming to assess EPC
engraftment in a variety of flowing conditions following peripheral intravenous
injection in vivo are likely to observe less cellular engraftment in both in control and
targeted specimens. In the presence of high flow rates at the target area, few cells should

Chapter 7 Magnetic targeting in an animal model
- 189 -
be captured under non-targeted conditions, as suggested by the computer simulations
and in vitro data presented in Chapter 6. This could amplify the increase in capture
efficiency observed with magnetic targeting.
One advantage of the quatification method used in this study is that, although the cell
count is somewhat arbitrary (as it is based on an average cell volume), it is possible to
compare this count to other studies investigating EPC targeting strategies to injured
vessels that present sufficient data for such a comparison. For example, Werner found
that following intravenous infusion of EPCs the cell count was 100 cells / mm2 (Werner
et al. 2003). Gulati observed a 1.2-fold increase in adherent EPCs at 4 weeks post local
delivery (Gulati et al. 2003). It has also been found that statin administration enhances
endogenous EPC homing by 5-fold, from 4 EPCs/mm2 to 20/mm2, resulting in
acceleration in re-endothelialisation (Walter et al. 2002). Oestrogen delivery enhanced
EPC delivery by 2-fold (Strehlow et al. 2003). Finally, the use of an intravascular
metallic mesh, has led to a relative 7-fold increase in EPC adhesion (Polyak et al. 2008).
All of these numbers compare very favourably with the data presented in this study.
Furthermore, from Figure 7.1-a it is evident that the magnetic force was not applied
circumferentially; in one external targeting investigation this problem was partially
circumvented by axial rotation of the animal (Consigny, Silverberg, & Vitali 1999).
Despite this fact, in the presented results there was no consistent preferential targeting
of the cells to one side of the arterial specimens. This may be due to a combination of
factors.
Firstly, the broad distribution of magnetic targeting forces due to the large size of the
magnetic actuator compared to the artery (at least 100o arc of the arterial

Chapter 7 Magnetic targeting in an animal model
- 190 -
circumeference) is likely to disperse the targeted cells. Small within-vessel variations in
the extent of damage, unrelated of the direction of the magnetic force, could further
facilitate non-directional engraftment. The role of gravity is also important here; some
cells on the far side of the artery may experience a small net downward force, despite
the presence of the magnetic actuator on the opposite side (based on force calculations,
not shown). This will be particularly pronounced in cells that have not taken up a lot of
Endorem®. Finally, the flow during the 24-hour recirculation period may enable cells to
migrate away from the targeted regions, possibly to areas of more pronounced damage.
Indeed, in one recent magnetic targeting study, despite the presence of an intravascular
permanently magnetised device for 24 hours, iron-labelled cells were present in the
damaged areas adjacent to the device, as well as on it (Pislaru et al. 2006b).
The results from the magnetically targeted, non-injured control group (zero cell count)
also complement those from Chapter 6 regarding the fate of targeted cells in the absence
of an innate adherence mechanism to keep them in place after removal of the magnetic
force. Therefore, the perceived problem regarding accumulation of cells in unwanted
areas is not a serious issue in this context, unless it leads to total occlusion of the vessel
with targeted cells and subsequent infarction.
77..55 CCoonncclluussiioonnss
In this study, it was demonstrated that magnetic targeting can increase EPC engraftment
to a site of rat CCA injury in the absence of flow. Targeting does not increase cell
engraftment in non-injured vessels.

- 191 -
TTHHEESSIISS SSUUMMMMAARRYY

Thesis summary
- 192 -
Atherosclerosis is a disease with considerable morbidity and mortality and can lead to
occlusive events such as myocardial infarction or stroke (Chapter 1). The human body
has an innate repair mechanism, the endothelial progenitor cells, which play an
important role both in the progression of the disease and in the revascularisation of
infarcted tissue. A rapid response by endothelial progenitors with complete re-
endothelialisation is thought to be a central factor in vessel protection after injury. At
the same time, clinical studies on stem cell transplantation for myocardial infarction
have been faced with poor retention of the administered cells. Therefore, there exists a
need to develop strategies for targeting and monitoring cell trafficking.
Superparamagnetic iron oxide nanoparticles (SPIO) offer an attractive possibility in this
realm as they can be incorporated into cells affording a controllable means of ‘tagging’.
These particles can be visualised non-invasively using MRI, and cell monitoring using
the FDA-approved SPIO Endorem® has already entered the clinic (Chapter 2).
Furthermore, SPIO particles can be manipulated by a magnetic field, which opens up
the potential of remote spatial control of the living cells. To date, the focus has mainly
been on drug delivery, including drug targeting in humans (Chapter 3). Cell targeting
has been limited to animal studies; to achieve cell capture these studies have
necessitated the use of large non-biodegradable micron-sized beads (Consigny,
Silverberg, & Vitali 1999; Pislaru et al. 2006b; Pislaru et al. 2006a) or nanoparticle
composites fabricated in-house (Polyak et al. 2008), and in most cases the additional
introduction of permanent intravascular metallic devices not currently approved for
human use (Pislaru et al. 2006b; Pislaru et al. 2006a; Polyak et al. 2008). The targeted
delivery of progenitor cells using external magnetic devices and clinically approved
iron-bearing agents has not yet been accomplished.

Thesis summary
- 193 -
In the presented studies, CD133-derived EPCs were labelled with Endorem® (Chapter
4, Part I). The particular agent was chosen to facilitate the possibility of transition to
clinical work. During initial work, I noted that the application of a large magnetic force
for 24 hours had the potential to compromise cell viability, an effect that was dependent
on the extent of iron loading (Chapter 4, Part II). By controlling iron uptake, viability
was restored. The differential labelling method was developed, which did not affect cell
growth, apoptosis, differentiation, or the ability to visualise the cells using MRI, at least
in vitro (Chapter 5).
A rat CCA injury model was selected, as localisation of EPCs to sites of vascular
damage, whether primary or post-PCI (iatrogenic), is considered a key event in the
prevention of atherosclerosis progression and neointima formation. To test the
feasibility of targeting the Endorem®-DfL-labelled cells to such a high flow vessel,
both mathematical simulations and in vitro flow models were developed (Chapter 6). A
magnetic device was constructed to allow increased forces at the large distances
expected in the animal, between the external magnet and the CCA. The results of these
studies indicated that targeting is feasible despite the high blood flow of a rat CCA.
Finally, in Chapter 7, an attempt was made to target cells within an injured rat artery.
This study only went as far as to demonstrate increased adherence of cells in a flow-stop
scenario, similar to those utilised in clinical studies. However, the results from Chapter
6 indicate that targeting in a flowing carotid artery should be possible.
Long-term animal studies beyond 24 hours were not conducted within the studies
presented in this thesis; these will eventually be necessary to investigate the retention of
the cells at the site of engraftment, their ability to survive in the longer term, proliferate

Thesis summary
- 194 -
and cover the artery with a functional endothelium, and thus bolster the fact that
magnetic targeting can lead to a functionally beneficial acceleration in healing.
The magnetic control of cells inside the vasculature is a fascinating and promising
concept. This thesis has outlined the studies on the feasibility of external targeting of
EPCs using a clinical-grade agent. However, the implications of magnetic control of
cells stretch far beyond EPCs and arterial repair; this technology can encompass the
entire premise of stem cell therapeutic strategies and I hope that the work presented
herein will, in one way or another, one day prove useful in human applications.

- 195 -
BBIIBBLLIIOOGGRRAAPPHHYY

Bibliography
- 196 -
Abdel-Latif, A., Bolli, R., Tleyjeh, I. M., Montori, V. M., Perin, E. C., Hornung, C. A., Zuba-Surma, E. K., Al-Mallah, M., & Dawn, B. 2007, "Adult bone marrow-derived cells for cardiac repair: a systematic review and meta-analysis", Arch.Intern.Med., vol. 167, no. 10, pp. 989-997.
Abdel-Latif, A., Bolli, R., Zuba-Surma, E. K., Tleyjeh, I. M., Hornung, C. A., & Dawn, B. 2008, "Granulocyte colony-stimulating factor therapy for cardiac repair after acute myocardial infarction: a systematic review and meta-analysis of randomized controlled trials", Am.Heart J., vol. 156, no. 2, pp. 216-226.
Afrin, R., Yamada, T., & Ikai, A. 2004, "Analysis of force curves obtained on the live cell membrane using chemically modified AFM probes", Ultramicroscopy, vol. 100, no. 3-4, pp. 187-195.
Alison, M. R. & Islam, S. 2009, "Attributes of adult stem cells", J.Pathol., vol. 217, no. 2, pp. 144-160.
Amariglio, N., Hirshberg, A., Scheithauer, B. W., Cohen, Y., Loewenthal, R., Trakhtenbrot, L., Paz, N., Koren-Michowitz, M., Waldman, D., Leider-Trejo, L., Toren, A., Constantini, S., & Rechavi, G. 2009, "Donor-Derived Brain Tumor Following Neural Stem Cell Transplantation in an Ataxia Telangiectasia Patient", PLoS.Med., vol. 6, no. 2, p. e29.
Anderson, S. A., Shukaliak-Quandt, J., Jordan, E. K., Arbab, A. S., Martin, R., McFarland, H., & Frank, J. A. 2004, "Magnetic resonance imaging of labeled T-cells in a mouse model of multiple sclerosis", Ann.Neurol., vol. 55, no. 5, pp. 654-659.
Aoki, J., Serruys, P. W., van, B. H., Ong, A. T., McFadden, E. P., Sianos, G., van der Giessen, W. J., Regar, E., de Feyter, P. J., Davis, H. R., Rowland, S., & Kutryk, M. J. 2005, "Endothelial progenitor cell capture by stents coated with antibody against CD34: the HEALING-FIM (Healthy Endothelial Accelerated Lining Inhibits Neointimal Growth-First In Man) Registry", J.Am.Coll.Cardiol., vol. 45, no. 10, pp. 1574-1579.
Arbab, A. S., Bashaw, L. A., Miller, B. R., Jordan, E. K., Bulte, J. W., & Frank, J. A. 2003a, "Intracytoplasmic tagging of cells with ferumoxides and transfection agent for cellular magnetic resonance imaging after cell transplantation: methods and techniques", Transplantation., vol. 76, no. 7, pp. 1123-1130.
Arbab, A. S., Bashaw, L. A., Miller, B. R., Jordan, E. K., Lewis, B. K., Kalish, H., & Frank, J. A. 2003b, "Characterization of biophysical and metabolic properties of cells labeled with superparamagnetic iron oxide nanoparticles and transfection agent for cellular MR imaging", Radiology., vol. 229, no. 3, pp. 838-846.
Arbab, A. S., Frenkel, V., Pandit, S. D., Anderson, S. A., Yocum, G. T., Bur, M., Khuu, H. M., Read, E. J., & Frank, J. A. 2006, "Magnetic resonance imaging and confocal microscopy studies of magnetically labeled endothelial progenitor cells trafficking to sites of tumor angiogenesis", Stem Cells, vol. 24, no. 3, pp. 671-678.
Arbab, A. S., Janic, B., Knight, R. A., Anderson, S. A., Pawelczyk, E., Rad, A. M., Read, E. J., Pandit, S. D., & Frank, J. A. 2008, "Detection of migration of locally implanted AC133+ stem cells by cellular magnetic resonance imaging with histological findings", FASEB J., vol. 22, no. 9, pp. 3234-3246.

Bibliography
- 197 -
Arbab, A. S., Jordan, E. K., Wilson, L. B., Yocum, G. T., Lewis, B. K., & Frank, J. A. 2004a, "In vivo trafficking and targeted delivery of magnetically labeled stem cells", Hum.Gene Ther., vol. 15, no. 4, pp. 351-360.
Arbab, A. S., Yocum, G. T., Kalish, H., Jordan, E. K., Anderson, S. A., Khakoo, A. Y., Read, E. J., & Frank, J. A. 2004b, "Efficient magnetic cell labeling with protamine sulfate complexed to ferumoxides for cellular MRI", Blood., vol. 104, no. 4, pp. 1217-1223.
Arbab, A. S., Yocum, G. T., Rad, A. M., Khakoo, A. Y., Fellowes, V., Read, E. J., & Frank, J. A. 2005, "Labeling of cells with ferumoxides-protamine sulfate complexes does not inhibit function or differentiation capacity of hematopoietic or mesenchymal stem cells", NMR Biomed., vol. 18, no. 8, pp. 553-559.
Asahara, T. & Kawamoto, A. 2004, "Endothelial progenitor cells for postnatal vasculogenesis", Am.J.Physiol Cell Physiol, vol. 287, no. 3, p. C572-C579.
Asahara, T., Masuda, H., Takahashi, T., Kalka, C., Pastore, C., Silver, M., Kearne, M., Magner, M., & Isner, J. M. 1999, "Bone marrow origin of endothelial progenitor cells responsible for postnatal vasculogenesis in physiological and pathological neovascularization", Circ.Res., vol. 85, no. 3, pp. 221-228.
Asahara, T., Murohara, T., Sullivan, A., Silver, M., van der, Z. R., Li, T., Witzenbichler, B., Schatteman, G., & Isner, J. M. 1997, "Isolation of putative progenitor endothelial cells for angiogenesis", Science, vol. 275, no. 5302, pp. 964-967.
Avilés, M. O., Ebner, A. D., & Ritter, J. A. 2008, "Implant assisted-magnetic drug targeting: Comparison of in vitro experiments with theory", Journal of Magnetism and Magnetic Materials, vol. 320, no. 21, pp. 2704-2713.
Bajada, S., Mazakova, I., Richardson, J. B., & Ashammakhi, N. 2008, "Updates on stem cells and their applications in regenerative medicine", J.Tissue Eng Regen.Med., vol. 2, no. 4, pp. 169-183.
Balsam, L. B., Wagers, A. J., Christensen, J. L., Kofidis, T., Weissman, I. L., & Robbins, R. C. 2004, "Haematopoietic stem cells adopt mature haematopoietic fates in ischaemic myocardium", Nature, vol. 428, no. 6983, pp. 668-673.
Bartunek, J., Vanderheyden, M., Vandekerckhove, B., Mansour, S., De, B. B., De, B. P., Van, H., I, Lootens, N., Heyndrickx, G., & Wijns, W. 2005, "Intracoronary injection of CD133-positive enriched bone marrow progenitor cells promotes cardiac recovery after recent myocardial infarction: feasibility and safety", Circulation, vol. 112, no. 9 Suppl, pp. I178-183.
Benoit, M., Gabriel, D., Gerisch, G., & Gaub, H. E. 2000, "Discrete interactions in cell adhesion measured by single-molecule force spectroscopy", Nat.Cell Biol., vol. 2, no. 6, pp. 313-317.
Berridge, M. V. & Tan, A. S. 1993, "Characterization of the cellular reduction of 3-(4,5-dimethylthiazol-2-yl)-2,5-diphenyltetrazolium bromide (MTT): subcellular localization, substrate dependence, and involvement of mitochondrial electron transport in MTT reduction", Arch.Biochem.Biophys., vol. 303, no. 2, pp. 474-482.
Bibliography
- 198 -
Billotey, C., Wilhelm, C., Devaud, M., Bacri, J. C., Bittoun, J., & Gazeau, F. 2003, "Cell internalization of anionic maghemite nanoparticles: quantitative effect on magnetic resonance imaging", Magn Reson.Med., vol. 49, no. 4, pp. 646-654.
Brehm, M., Zeus, T., & Strauer, B. E. 2002, "Stem cells--clinical application and perspectives", Herz, vol. 27, no. 7, pp. 611-620.
Bulte, J. W., Douglas, T., Witwer, B., Zhang, S. C., Strable, E., Lewis, B. K., Zywicke, H., Miller, B., van, G. P., Moskowitz, B. M., Duncan, I. D., & Frank, J. A. 2001, "Magnetodendrimers allow endosomal magnetic labeling and in vivo tracking of stem cells", Nat.Biotechnol., vol. 19, no. 12, pp. 1141-1147.
Bulte, J. W. & Kraitchman, D. L. 2004, "Iron oxide MR contrast agents for molecular and cellular imaging", NMR Biomed., vol. 17, no. 7, pp. 484-499.
Bulte, J. W., Laughlin, P. G., Jordan, E. K., Tran, V. A., Vymazal, J., & Frank, J. A. 1996, "Tagging of T cells with superparamagnetic iron oxide: uptake kinetics and relaxometry", Acad.Radiol., vol. 3 Suppl 2:S301-3., p. S301-S303.
Bulte, J. W., Ma, L. D., Magin, R. L., Kamman, R. L., Hulstaert, C. E., Go, K. G., The, T. H., & de, L. L. 1993, "Selective MR imaging of labeled human peripheral blood mononuclear cells by liposome mediated incorporation of dextran-magnetite particles", Magn Reson.Med., vol. 29, no. 1, pp. 32-37.
Bulte, J. W., Zhang, S., van, G. P., Herynek, V., Jordan, E. K., Duncan, I. D., & Frank, J. A. 1999, "Neurotransplantation of magnetically labeled oligodendrocyte progenitors: magnetic resonance tracking of cell migration and myelination", Proc.Natl.Acad.Sci.U.S.A., vol. 96, no. 26, pp. 15256-15261.
Cahill, K. S., Gaidosh, G., Huard, J., Silver, X., Byrne, B. J., & Walter, G. A. 2004, "Noninvasive monitoring and tracking of muscle stem cell transplants", Transplantation., vol. 78, no. 11, pp. 1626-1633.
Carr, C. A., Stuckey, D. J., Tatton, L., Tyler, D. J., Hale, S. J., Sweeney, D., Schneider, J. E., Martin-Rendon, E., Radda, G. K., Harding, S. E., Watt, S. M., & Clarke, K. 2008, "Bone marrow-derived stromal cells home to and remain in the infarcted rat heart but fail to improve function: an in vivo cine-MRI study", Am.J.Physiol Heart Circ.Physiol, vol. 295, no. 2, p. H533-H542.
Carter, A. J., Aggarwal, M., Kopia, G. A., Tio, F., Tsao, P. S., Kolata, R., Yeung, A. C., Llanos, G., Dooley, J., & Falotico, R. 2004, "Long-term effects of polymer-based, slow-release, sirolimus-eluting stents in a porcine coronary model", Cardiovasc.Res., vol. 63, no. 4, pp. 617-624.
Chalmers, J. J., Zborowski, M., Sun, L., & Moore, L. 1998, "Flow through, immunomagnetic cell separation", Biotechnol.Prog., vol. 14, no. 1, pp. 141-148.
Charwat, S., Gyongyosi, M., Lang, I., Graf, S., Beran, G., Hemetsberger, R., Nyolczas, N., Sochor, H., & Glogar, D. 2008, "Role of adult bone marrow stem cells in the repair of ischemic myocardium: current state of the art", Exp.Hematol., vol. 36, no. 6, pp. 672-680.

Bibliography
- 199 -
Chemaly, E. R., Yoneyama, R., Frangioni, J. V., & Hajjar, R. J. 2005, "Tracking stem cells in the cardiovascular system", Trends Cardiovasc.Med., vol. 15, no. 8, pp. 297-302.
Chen, H., Kaminski, M. D., Pytel, P., Macdonald, L., & Rosengart, A. J. 2008, "Capture of magnetic carriers within large arteries using external magnetic fields", Journal of Drug Targeting, vol. 16, no. 4, pp. 262-268.
Chien, K. R. 2004, "Stem cells: lost in translation", Nature, vol. 428, no. 6983, pp. 607-608.
Co, M., Tay, E., Lee, C. H., Poh, K. K., Low, A., Lim, J., Lim, I. H., Lim, Y. T., & Tan, H. C. 2008, "Use of endothelial progenitor cell capture stent (Genous Bio-Engineered R Stent) during primary percutaneous coronary intervention in acute myocardial infarction: intermediate- to long-term clinical follow-up", Am.Heart J., vol. 155, no. 1, pp. 128-132.
Consigny, P. M., Silverberg, D. A., & Vitali, N. J. 1999, "Use of endothelial cells containing superparamagnetic microspheres to improve endothelial cell delivery to arterial surfaces after angioplasty", J.Vasc.Interv.Radiol., vol. 10, no. 2 Pt 1, pp. 155-163.
Cregg, P. J., Murphy, K., & Mardinoglu, A. 2008, "Calculation of nanoparticle capture efficiency in magnetic drug targeting", Journal of Magnetism and Magnetic Materials, vol. 320, no. 23, pp. 3272-3275.
Cribbie, R. A., Gruman, J. A., & Arpin-Cribbie, C. A. 2004, "Recommendations for applying tests of equivalence", J.Clin.Psychol., vol. 60, no. 1, pp. 1-10.
Cui, L., Ramsfjell, V., Borge, O. J., Veiby, O. P., Lok, S., & Jacobsen, S. E. 1997, "Thrombopoietin promotes adhesion of primitive human hemopoietic cells to fibronectin and vascular cell adhesion molecule-1: role of activation of very late antigen (VLA)-4 and VLA-5", J.Immunol., vol. 159, no. 4, pp. 1961-1969.
de Vries, I., Lesterhuis, W. J., Barentsz, J. O., Verdijk, P., van Krieken, J. H., Boerman, O. C., Oyen, W. J., Bonenkamp, J. J., Boezeman, J. B., Adema, G. J., Bulte, J. W., Scheenen, T. W., Punt, C. J., Heerschap, A., & Figdor, C. G. 2005, "Magnetic resonance tracking of dendritic cells in melanoma patients for monitoring of cellular therapy", Nat.Biotechnol., vol. 23, no. 11, pp. 1407-1413.
Dimmeler, S., Aicher, A., Vasa, M., Mildner-Rihm, C., Adler, K., Tiemann, M., Rutten, H., Fichtlscherer, S., Martin, H., & Zeiher, A. M. 2001, "HMG-CoA reductase inhibitors (statins) increase endothelial progenitor cells via the PI 3-kinase/Akt pathway", J.Clin.Invest, vol. 108, no. 3, pp. 391-397.
Dimmeler, S., Zeiher, A. M., & Schneider, M. D. 2005, "Unchain my heart: the scientific foundations of cardiac repair", J.Clin.Invest, vol. 115, no. 3, pp. 572-583.
Dobson, J. 2006, "Magnetic nanoparticles for drug delivery", Drug Development Research, vol. 67, no. 1, pp. 55-60.
Duncombe, A. 1997, "ABC of clinical haematology. Bone marrow and stem cell transplantation", BMJ, vol. 314, no. 7088, pp. 1179-1182.

Bibliography
- 200 -
Embury, S. H., Mohandas, N., Paszty, C., Cooper, P., & Cheung, A. T. 1999, "In vivo blood flow abnormalities in the transgenic knockout sickle cell mouse", J.Clin.Invest, vol. 103, no. 6, pp. 915-920.
Erbs, S., Linke, A., Adams, V., Lenk, K., Thiele, H., Diederich, K. W., Emmrich, F., Kluge, R., Kendziorra, K., Sabri, O., Schuler, G., & Hambrecht, R. 2005, "Transplantation of blood-derived progenitor cells after recanalization of chronic coronary artery occlusion: first randomized and placebo-controlled study", Circ.Res., vol. 97, no. 8, pp. 756-762.
Fahlvik, A. K., Klaveness, J., & Stark, D. D. 1993, "Iron oxides as MR imaging contrast agents", J.Magn Reson.Imaging, vol. 3, no. 1, pp. 187-194.
Fay, J. A. 1994, Introduction to fluid mechanics, 2nd edn, MIT Press.
Fischman, D. L., Leon, M. B., Baim, D. S., Schatz, R. A., Savage, M. P., Penn, I., Detre, K., Veltri, L., Ricci, D., Nobuyoshi, M., & . 1994, "A randomized comparison of coronary-stent placement and balloon angioplasty in the treatment of coronary artery disease. Stent Restenosis Study Investigators", N.Engl.J.Med., vol. 331, no. 8, pp. 496-501.
Fons, P., Herault, J. P., Delesque, N., Tuyaret, J., Bono, F., & Herbert, J. M. 2004, "VEGF-R2 and neuropilin-1 are involved in VEGF-A-induced differentiation of human bone marrow progenitor cells", J.Cell Physiol, vol. 200, no. 3, pp. 351-359.
Forbes, Z. G., Yellen, B. B., Barbee, K. A., & Friedman, G. 2003, "An approach to targeted drug delivery based on uniform magnetic fields", Magnetics, IEEE Transactions on, vol. 39, no. 5, pp. 3372-3377.
Forbes, Z. G., Yellen, B. B., Halverson, D. S., Fridman, G., Barbee, K. A., & Friedman, G. 2008, "Validation of high gradient magnetic field based drug delivery to magnetizable implants under flow", IEEE Trans.Biomed.Eng, vol. 55, no. 2, pp. 643-649.
Fox, K. A. 2009, "COURAGE to change practice? Revascularisation in patients with stable coronary artery disease", Heart.
Frank, J. A., Miller, B. R., Arbab, A. S., Zywicke, H. A., Jordan, E. K., Lewis, B. K., Bryant, L. H., Jr., & Bulte, J. W. 2003, "Clinically applicable labeling of mammalian and stem cells by combining superparamagnetic iron oxides and transfection agents", Radiology., vol. 228, no. 2, pp. 480-487.
Frank, J. A., Zywicke, H., Jordan, E. K., Mitchell, J., Lewis, B. K., Miller, B., Bryant, L. H., Jr., & Bulte, J. W. 2002, "Magnetic intracellular labeling of mammalian cells by combining (FDA-approved) superparamagnetic iron oxide MR contrast agents and commonly used transfection agents", Acad.Radiol., vol. 9 Suppl 2:S484-7., p. S484-S487.
Frasca, G., Gazeau, F., & Wilhelm, C. 2009, "Formation of a three-dimensional multicellular assembly using magnetic patterning", Langmuir, vol. 25, no. 4, pp. 2348-2354.

Bibliography
- 201 -
Freedman, S. B. 2002, "Clinical trials of gene therapy for atherosclerotic cardiovascular disease", Curr.Opin.Lipidol., vol. 13, no. 6, pp. 653-661.
Friedrich, E. B., Walenta, K., Scharlau, J., Nickenig, G., & Werner, N. 2006, "CD34-/CD133+/VEGFR-2+ endothelial progenitor cell subpopulation with potent vasoregenerative capacities", Circ.Res., vol. 98, no. 3, p. e20-e25.
Fujiyama, S., Amano, K., Uehira, K., Yoshida, M., Nishiwaki, Y., Nozawa, Y., Jin, D., Takai, S., Miyazaki, M., Egashira, K., Imada, T., Iwasaka, T., & Matsubara, H. 2003, "Bone marrow monocyte lineage cells adhere on injured endothelium in a monocyte chemoattractant protein-1-dependent manner and accelerate reendothelialization as endothelial progenitor cells", Circ.Res., vol. 93, no. 10, pp. 980-989.
Furlani, E. J. & Furlani, E. P. 2007, "A model for predicting magnetic targeting of multifunctional particles in the microvasculature", Journal of Magnetism and Magnetic Materials, vol. 312, no. 1, pp. 187-193.
Garcia-Villalon, A. L., Roda, J. M., Alvarez, F., Gomez, B., & Dieguez, G. 1992, "Carotid blood flow in anesthetized rats: effects of carotid ligation and anastomosis", Microsurgery, vol. 13, no. 5, pp. 258-261.
Gehling, U. M., Ergun, S., Schumacher, U., Wagener, C., Pantel, K., Otte, M., Schuch, G., Schafhausen, P., Mende, T., Kilic, N., Kluge, K., Schafer, B., Hossfeld, D. K., & Fiedler, W. 2000, "In vitro differentiation of endothelial cells from AC133-positive progenitor cells", Blood., vol. 95, no. 10, pp. 3106-3112.
Gill, M., Dias, S., Hattori, K., Rivera, M. L., Hicklin, D., Witte, L., Girardi, L., Yurt, R., Himel, H., & Rafii, S. 2001, "Vascular trauma induces rapid but transient mobilization of VEGFR2(+)AC133(+) endothelial precursor cells", Circ.Res., vol. 88, no. 2, pp. 167-174.
Gimbrone, M. A., Topper, J. N., Nagel, T., Anderson, K. R., & Garcia-Cardena, G. 2000, "Endothelial dysfunction, hemodynamic forces, and atherogenesis", Ann.N.Y.Acad.Sci., vol. 902, pp. 230-239.
Goldman, S. A. & Windrem, M. S. 2006, "Cell replacement therapy in neurological disease", Philos.Trans.R.Soc.Lond B Biol.Sci., vol. 361, no. 1473, pp. 1463-1475.
Goldschmidt-Clermont, P. J., Creager, M. A., Losordo, D. W., Lam, G. K., Wassef, M., & Dzau, V. J. 2005, "Atherosclerosis 2005: recent discoveries and novel hypotheses", Circulation, vol. 112, no. 21, pp. 3348-3353.
Gotoh, A., Ritchie, A., Takahira, H., & Broxmeyer, H. E. 1997, "Thrombopoietin and erythropoietin activate inside-out signaling of integrin and enhance adhesion to immobilized fibronectin in human growth-factor-dependent hematopoietic cells", Ann.Hematol., vol. 75, no. 5-6, pp. 207-213.
Green, C. R., Holloway, H., & Walker, M. M. 2001, "Detection of submicroscopic magnetite particles using reflectance mode confocal laser scanning microscopy", Cell Biol.Int., vol. 25, no. 10, pp. 985-990.

Bibliography
- 202 -
Grief, A. D. & Richardson, G. 2005, "Mathematical modelling of magnetically targeted drug delivery", Journal of Magnetism and Magnetic Materials, vol. 293, no. 1, pp. 455-463.
Griese, D. P., Ehsan, A., Melo, L. G., Kong, D., Zhang, L., Mann, M. J., Pratt, R. E., Mulligan, R. C., & Dzau, V. J. 2003, "Isolation and transplantation of autologous circulating endothelial cells into denuded vessels and prosthetic grafts: implications for cell-based vascular therapy", Circulation, vol. 108, no. 21, pp. 2710-2715.
Gulati, R., Jevremovic, D., Peterson, T. E., Witt, T. A., Kleppe, L. S., Mueske, C. S., Lerman, A., Vile, R. G., & Simari, R. D. 2003, "Autologous culture-modified mononuclear cells confer vascular protection after arterial injury", Circulation, vol. 108, no. 12, pp. 1520-1526.
Gulati, R., Lerman, A., & Simari, R. D. 2005, "Therapeutic uses of autologous endothelial cells for vascular disease", Clin.Sci.(Lond), vol. 109, no. 1, pp. 27-37.
Gulati, R. & Simari, R. D. 2004, "Autologous cell-based therapies for vascular disease", Trends Cardiovasc.Med., vol. 14, no. 7, pp. 262-267.
Gunn, J. & Taggart, D. P. 2003, "Revascularisation for acute coronary syndromes: PCI or CABG?", Heart, vol. 89, no. 9, pp. 967-970.
Gupta, V., Aravamuthan, B. R., Baskerville, S., Smith, S. K., Gupta, V., Lauer, M. A., & Fischell, T. A. 2004, "Reduction of subacute stent thrombosis (SAT) using heparin-coated stents in a large-scale, real world registry", J.Invasive.Cardiol., vol. 16, no. 6, pp. 304-310.
Hafeli, U. O., Gilmour, K., Zhou, A., Lee, S., & Hayden, M. E. 2007, "Modeling of magnetic bandages for drug targeting: Button vs. Halbach arrays", Journal of Magnetism and Magnetic Materials, vol. 311, no. 1, pp. 323-329.
Häfeli, U. O., Gilmour, K., Zhou, A., Lee, S., & Hayden, M. E. 2007, "Modeling of magnetic bandages for drug targeting: Button vs. Halbach arrays", Journal of Magnetism and Magnetic Materials, vol. 311, no. 1, pp. 323-329.
Hamasaki, T., Tanaka, N., Ishida, O., Yanada, S., Kamei, N., Fujiwara, Y., Nishida, K., Nakanishi, K., Sharman, P., Kawamata, S., & Ochi, M. 2005, "Characterization of labeled neural progenitor cells for magnetic targeting", Neuroreport, vol. 16, no. 15, pp. 1641-1645.
Haudenschild, C. C. & Schwartz, S. M. 1979, "Endothelial regeneration. II. Restitution of endothelial continuity", Lab Invest, vol. 41, no. 5, pp. 407-418.
Hautot, D., Pankhurst, Q. A., & Dobson, J. 2005, "Superconducting quantum interference device measurements of dilute magnetic materials in biological samples", Rev.Sci.Instrum., vol. 76, no. 4, p. 045101.
Hawrylak, N., Ghosh, P., Broadus, J., Schlueter, C., Greenough, W. T., & Lauterbur, P. C. 1993, "Nuclear Magnetic Resonance (NMR) Imaging of Iron Oxide-Labeled Neural Transplants", Experimental Neurology, vol. 121, no. 2, pp. 181-192.

Bibliography
- 203 -
Hayden, M. E. & Hafeli, U. O. 2006, "'Magnetic bandages' for targeted delivery of therapeutic agents", Journal of Physics: Condensed Matter, vol. 18, no. 38, p. S2877-S2891.
Hill, J. M., Zalos, G., Halcox, J. P., Schenke, W. H., Waclawiw, M. A., Quyyumi, A. A., & Finkel, T. 2003, "Circulating endothelial progenitor cells, vascular function, and cardiovascular risk", N.Engl.J.Med., vol. 348, no. 7, pp. 593-600.
Hinds, K. A., Hill, J. M., Shapiro, E. M., Laukkanen, M. O., Silva, A. C., Combs, C. A., Varney, T. R., Balaban, R. S., Koretsky, A. P., & Dunbar, C. E. 2003, "Highly efficient endosomal labeling of progenitor and stem cells with large magnetic particles allows magnetic resonance imaging of single cells", Blood., vol. 102, no. 3, pp. 867-872.
Ho, V. H., Muller, K. H., Darton, N. J., Darling, D. C., Farzaneh, F., & Slater, N. K. 2009, "Simple magnetic cell patterning using streptavidin paramagnetic particles", Exp.Biol.Med.(Maywood.), vol. 234, no. 3, pp. 332-341.
Hoffmann, R. & Mintz, G. S. 2000, "Coronary in-stent restenosis - predictors, treatment and prevention", Eur.Heart J., vol. 21, no. 21, pp. 1739-1749.
Hofmann, A., Wenzel, D., Becher, U. M., Freitag, D. F., Klein, A. M., Eberbeck, D., Schulte, M., Zimmermann, K., Bergemann, C., Gleich, B., Roell, W., Weyh, T., Trahms, L., Nickenig, G., Fleischmann, B. K., & Pfeifer, A. 2009, "Combined targeting of lentiviral vectors and positioning of transduced cells by magnetic nanoparticles", Proc.Natl.Acad.Sci.U.S.A, vol. 106, no. 1, pp. 44-49.
Hofmann, M., Wollert, K. C., Meyer, G. P., Menke, A., Arseniev, L., Hertenstein, B., Ganser, A., Knapp, W. H., & Drexler, H. 2005, "Monitoring of bone marrow cell homing into the infarcted human myocardium", Circulation, vol. 111, no. 17, pp. 2198-2202.
Hou, D., Youssef, E. A., Brinton, T. J., Zhang, P., Rogers, P., Price, E. T., Yeung, A. C., Johnstone, B. H., Yock, P. G., & March, K. L. 2005, "Radiolabeled cell distribution after intramyocardial, intracoronary, and interstitial retrograde coronary venous delivery: implications for current clinical trials", Circulation, vol. 112, no. 9 Suppl, p. I150-I156.
Hristov, M. & Weber, C. 2006, "The therapeutic potential of progenitor cells in ischemic heart disease--Past, present and future", Basic Res.Cardiol., vol. 101, no. 1, pp. 1-7.
Hristov, M. & Weber, C. 2008, "Endothelial progenitor cells in vascular repair and remodeling", Pharmacol.Res., vol. 58, no. 2, pp. 148-151.
Hristov, M. & Weber, C. 2004, "Endothelial progenitor cells: characterization, pathophysiology, and possible clinical relevance", J.Cell Mol.Med., vol. 8, no. 4, pp. 498-508.
Hristov, M., Zernecke, A., Bidzhekov, K., Liehn, E. A., Shagdarsuren, E., Ludwig, A., & Weber, C. 2007a, "Importance of CXC chemokine receptor 2 in the homing of human peripheral blood endothelial progenitor cells to sites of arterial injury", Circ.Res., vol. 100, no. 4, pp. 590-597.

Bibliography
- 204 -
Hristov, M., Zernecke, A., Liehn, E. A., & Weber, C. 2007b, "Regulation of endothelial progenitor cell homing after arterial injury", Thromb.Haemost., vol. 98, no. 2, pp. 274-277.
Iacob, G., Rotariu, O., Strachan, N. J., & Hafeli, U. O. 2004, "Magnetizable needles and wires--modeling an efficient way to target magnetic microspheres in vivo", Biorheology, vol. 41, no. 5, pp. 599-612.
Inaba, S., Egashira, K., & Komori, K. 2002, "Peripheral-blood or bone-marrow mononuclear cells for therapeutic angiogenesis?", Lancet, vol. 360, no. 9350, p. 2083.
Ince, H., Valgimigli, M., Petzsch, M., de Lezo, J. S., Kuethe, F., Dunkelmann, S., Biondi-Zoccai, G., & Nienaber, C. A. 2008, "Cardiovascular events and re-stenosis following administration of G-CSF in acute myocardial infarction: systematic review and meta-analysis", Heart, vol. 94, no. 5, pp. 610-616.
Ino, K., Ito, A., & Honda, H. 2007, "Cell patterning using magnetite nanoparticles and magnetic force", Biotechnology and Bioengineering, vol. 97, no. 5, p. 1309.
Iwaguro, H., Yamaguchi, J., Kalka, C., Murasawa, S., Masuda, H., Hayashi, S., Silver, M., Li, T., Isner, J. M., & Asahara, T. 2002, "Endothelial progenitor cell vascular endothelial growth factor gene transfer for vascular regeneration", Circulation, vol. 105, no. 6, pp. 732-738.
Jaffe, R. & Strauss, B. H. 2007, "Late and very late thrombosis of drug-eluting stents: evolving concepts and perspectives", J.Am.Coll.Cardiol., vol. 50, no. 2, pp. 119-127.
Jiang, G., Giannone, G., Critchley, D. R., Fukumoto, E., & Sheetz, M. P. 2003, "Two-piconewton slip bond between fibronectin and the cytoskeleton depends on talin", Nature, vol. 424, no. 6946, pp. 334-337.
Jiles, D. 1998, "Magnetization and magnetic moment," in Magnetism and magnetic materials, 2nd edn, Chapman & Hall, London.
Jin, H., Aiyer, A., Su, J., Borgstrom, P., Stupack, D., Friedlander, M., & Varner, J. 2006, "A homing mechanism for bone marrow-derived progenitor cell recruitment to the neovasculature", J.Clin.Invest, vol. 116, no. 3, pp. 652-662.
Josephson, L., Tung, C. H., Moore, A., & Weissleder, R. 1999, "High-efficiency intracellular magnetic labeling with novel superparamagnetic-Tat peptide conjugates", Bioconjug.Chem., vol. 10, no. 2, pp. 186-191.
Kalish, H., Arbab, A. S., Miller, B. R., Lewis, B. K., Zywicke, H. A., Bulte, J. W., Bryant, L. H., Jr., & Frank, J. A. 2003, "Combination of transfection agents and magnetic resonance contrast agents for cellular imaging: relationship between relaxivities, electrostatic forces, and chemical composition", Magn Reson.Med., vol. 50, no. 2, pp. 275-282.
Kalka, C., Masuda, H., Takahashi, T., Kalka-Moll, W. M., Silver, M., Kearney, M., Li, T., Isner, J. M., & Asahara, T. 2000, "Transplantation of ex vivo expanded endothelial progenitor cells for therapeutic neovascularization", Proc.Natl.Acad.Sci.U.S.A, vol. 97, no. 7, pp. 3422-3427.

Bibliography
- 205 -
Kawamoto, A., Gwon, H. C., Iwaguro, H., Yamaguchi, J. I., Uchida, S., Masuda, H., Silver, M., Ma, H., Kearney, M., Isner, J. M., & Asahara, T. 2001, "Therapeutic potential of ex vivo expanded endothelial progenitor cells for myocardial ischemia", Circulation, vol. 103, no. 5, pp. 634-637.
Kawamoto, A. & Losordo, D. W. 2008, "Endothelial progenitor cells for cardiovascular regeneration", Trends Cardiovasc.Med., vol. 18, no. 1, pp. 33-37.
Khakoo, A. Y. & Finkel, T. 2005, "Endothelial progenitor cells", Annu.Rev.Med., vol. 56, pp. 79-101.
Khan, A. R. & Richardson, J. F. 1987, "The resistance to motion of a solid sphere in a fluid", Chemical Engineering Communications, vol. 62, no. 1, pp. 135-150.
Kipshidze, N., Dangas, G., Tsapenko, M., Moses, J., Leon, M. B., Kutryk, M., & Serruys, P. 2004, "Role of the endothelium in modulating neointimal formation: vasculoprotective approaches to attenuate restenosis after percutaneous coronary interventions", J.Am.Coll.Cardiol., vol. 44, no. 4, pp. 733-739.
Klimanskaya, I., Rosenthal, N., & Lanza, R. 2008, "Derive and conquer: sourcing and differentiating stem cells for therapeutic applications", Nat.Rev.Drug Discov., vol. 7, no. 2, pp. 131-142.
Kocher, A. A., Schuster, M. D., Szabolcs, M. J., Takuma, S., Burkhoff, D., Wang, J., Homma, S., Edwards, N. M., & Itescu, S. 2001, "Neovascularization of ischemic myocardium by human bone-marrow-derived angioblasts prevents cardiomyocyte apoptosis, reduces remodeling and improves cardiac function", Nat.Med., vol. 7, no. 4, pp. 430-436.
Kong, D., Melo, L. G., Mangi, A. A., Zhang, L., Lopez-Ilasaca, M., Perrella, M. A., Liew, C. C., Pratt, R. E., & Dzau, V. J. 2004, "Enhanced inhibition of neointimal hyperplasia by genetically engineered endothelial progenitor cells", Circulation, vol. 109, no. 14, pp. 1769-1775.
Korbling, M., Reuben, J. M., Gao, H., Lee, B. N., Harris, D. M., Cogdell, D., Giralt, S. A., Khouri, I. F., Saliba, R. M., Champlin, R. E., Zhang, W., & Estrov, Z. 2006, "Recombinant human granulocyte-colony-stimulating factor-mobilized and apheresis-collected endothelial progenitor cells: a novel blood cell component for therapeutic vasculogenesis", Transfusion, vol. 46, no. 10, pp. 1795-1802.
Kostura, L., Kraitchman, D. L., Mackay, A. M., Pittenger, M. F., & Bulte, J. W. 2004, "Feridex labeling of mesenchymal stem cells inhibits chondrogenesis but not adipogenesis or osteogenesis", NMR Biomed., vol. 17, no. 7, pp. 513-517.
Kraitchman, D. L., Heldman, A. W., Atalar, E., Amado, L. C., Martin, B. J., Pittenger, M. F., Hare, J. M., & Bulte, J. W. 2003, "In vivo magnetic resonance imaging of mesenchymal stem cells in myocardial infarction", Circulation., vol. 107, no. 18, pp. 2290-2293.
Kubo, T., Sugita, T., Shimose, S., Nitta, Y., Ikuta, Y., & Murakami, T. 2000, "Targeted delivery of anticancer drugs with intravenously administered magnetic liposomes in osteosarcoma-bearing hamsters", Int J.Oncol., vol. 17, no. 2, pp. 309-315.

Bibliography
- 206 -
Laflamme, M. A. & Murry, C. E. 2005, "Regenerating the heart", Nat.Biotechnol., vol. 23, no. 7, pp. 845-856.
Lam, A. C., Li, K., Zhang, X. B., Li, C. K., Fok, T. F., Chang, A. M., James, A. E., Tsang, K. S., & Yuen, P. M. 2001, "Preclinical ex vivo expansion of cord blood hematopoietic stem and progenitor cells: duration of culture; the media, serum supplements, and growth factors used; and engraftment in NOD/SCID mice", Transfusion., vol. 41, no. 12, pp. 1567-1576.
Lee, J. M., Kim, C. S., Youk, J. H., & Lee, M. S. 2003, "Characterization of focal liver lesions with superparamagnetic iron oxide-enhanced MR imaging: value of distributional phase T1-weighted imaging", Korean J.Radiol., vol. 4, no. 1, pp. 9-18.
Lemesle, G., Delhaye, C., Bonello, L., de, L. A., Waksman, R., & Pichard, A. 2008, "Stent thrombosis in 2008: definition, predictors, prognosis and treatment", Arch.Cardiovasc.Dis., vol. 101, no. 11-12, pp. 769-777.
Lerou, P. H. & Daley, G. Q. 2005, "Therapeutic potential of embryonic stem cells", Blood Rev., vol. 19, no. 6, pp. 321-331.
Lewin, M., Carlesso, N., Tung, C. H., Tang, X. W., Cory, D., Scadden, D. T., & Weissleder, R. 2000, "Tat peptide-derivatized magnetic nanoparticles allow in vivo tracking and recovery of progenitor cells", Nat.Biotechnol., vol. 18, no. 4, pp. 410-414.
Lin, Y., Weisdorf, D. J., Solovey, A., & Hebbel, R. P. 2000, "Origins of circulating endothelial cells and endothelial outgrowth from blood", J.Clin.Invest, vol. 105, no. 1, pp. 71-77.
Lindvall, O. & Kokaia, Z. 2006, "Stem cells for the treatment of neurological disorders", Nature, vol. 441, no. 7097, pp. 1094-1096.
Losordo, D. W., Schatz, R. A., White, C. J., Udelson, J. E., Veereshwarayya, V., Durgin, M., Poh, K. K., Weinstein, R., Kearney, M., Chaudhry, M., Burg, A., Eaton, L., Heyd, L., Thorne, T., Shturman, L., Hoffmeister, P., Story, K., Zak, V., Dowling, D., Traverse, J. H., Olson, R. E., Flanagan, J., Sodano, D., Murayama, T., Kawamoto, A., Kusano, K. F., Wollins, J., Welt, F., Shah, P., Soukas, P., Asahara, T., & Henry, T. D. 2007, "Intramyocardial transplantation of autologous CD34+ stem cells for intractable angina: a phase I/IIa double-blind, randomized controlled trial", Circulation, vol. 115, no. 25, pp. 3165-3172.
Lowe, H. C., Oesterle, S. N., & Khachigian, L. M. 2002, "Coronary in-stent restenosis: current status and future strategies", J.Am.Coll.Cardiol., vol. 39, no. 2, pp. 183-193.
Lübbe, A. S., Alexiou, C., & Bergemann, C. 2001, "Clinical Applications of Magnetic Drug Targeting", Journal of Surgical Research, vol. 95, no. 2, pp. 200-206.
Lucerna, M., Zernecke, A., de, N. R., de Jager, S. C., Bot, I., van der, L. C., Kholova, I., Liehn, E. A., van Berkel, T. J., Yla-Herttuala, S., Weber, C., & Biessen, E. A. 2007, "Vascular endothelial growth factor-A induces plaque expansion in ApoE knock-out mice by promoting de novo leukocyte recruitment", Blood, vol. 109, no. 1, pp. 122-129.

Bibliography
- 207 -
Luciani, A., Wilhelm, C., Bruneval, P., Cunin, P., Autret, G., Rahmouni, A., Clement, O., & Gazeau, F. 2009, "Magnetic targeting of iron-oxide-labeled fluorescent hepatoma cells to the liver", Eur.Radiol., vol. 19, no. 5, pp. 1087-1096.
Lusis, A. J. 2000, "Atherosclerosis", Nature, vol. 407, no. 6801, pp. 233-241.
Maiellaro, K. & Taylor, W. R. 2007, "The role of the adventitia in vascular inflammation", Cardiovasc.Res., vol. 75, no. 4, pp. 640-648.
Mallinson, J. 1973, " One-sided fluxes - A magnetic curiosity?", IEEE Transactions on Magnetics, vol. 9, no. 4, pp. 678-682.
Marrink, S. J., Berger, O., Tieleman, P., & Jahnig, F. 1998, "Adhesion forces of lipids in a phospholipid membrane studied by molecular dynamics simulations", Biophys.J., vol. 74, no. 2 Pt 1, pp. 931-943.
Massberg, S., Konrad, I., Schurzinger, K., Lorenz, M., Schneider, S., Zohlnhoefer, D., Hoppe, K., Schiemann, M., Kennerknecht, E., Sauer, S., Schulz, C., Kerstan, S., Rudelius, M., Seidl, S., Sorge, F., Langer, H., Peluso, M., Goyal, P., Vestweber, D., Emambokus, N. R., Busch, D. H., Frampton, J., & Gawaz, M. 2006, "Platelets secrete stromal cell-derived factor 1alpha and recruit bone marrow-derived progenitor cells to arterial thrombi in vivo", J.Exp.Med., vol. 203, no. 5, pp. 1221-1233.
Matuszewski, L., Persigehl, T., Wall, A., Schwindt, W., Tombach, B., Fobker, M., Poremba, C., Ebert, W., Heindel, W., & Bremer, C. 2005, "Cell tagging with clinically approved iron oxides: feasibility and effect of lipofection, particle size, and surface coating on labeling efficiency", Radiology, vol. 235, no. 1, pp. 155-161.
McKay, R. 2000, "Stem cells--hype and hope", Nature., vol. 406, no. 6794, pp. 361-364.
Meyer, H. W. 1972, A history of electricity anf magnetism Burndy Library.
Michalopoulos, G. K. & DeFrances, M. C. 1997, "Liver regeneration", Science, vol. 276, no. 5309, pp. 60-66.
Min-Cheol, K., Do-Kyung, K., Se-Hee, L., Amin, M. S., Il-Han, P., Charn-Jung, K., & Zahn, M. 2006, "Dynamic characteristics of superparamagnetic iron oxide nanoparticles in a viscous fluid under an external magnetic field", Magnetics, IEEE Transactions on, vol. 42, no. 4, pp. 979-982.
Miyashiro, J. K., Poppa, V., & Berk, B. C. 1997, "Flow-induced vascular remodeling in the rat carotid artery diminishes with age", Circ.Res., vol. 81, no. 3, pp. 311-319.
Mourino, M. R. 1991, "From Thales to Lauterbur, or from the lodestone to MR imaging: magnetism and medicine", Radiology, vol. 180, no. 3, pp. 593-612.
Murohara, T. 2001, "Therapeutic vasculogenesis using human cord blood-derived endothelial progenitors", Trends Cardiovasc.Med., vol. 11, no. 8, pp. 303-307.
Murohara, T., Ikeda, H., Duan, J., Shintani, S., Sasaki, K., Eguchi, H., Onitsuka, I., Matsui, K., & Imaizumi, T. 2000, "Transplanted cord blood-derived endothelial

Bibliography
- 208 -
precursor cells augment postnatal neovascularization", J.Clin.Invest, vol. 105, no. 11, pp. 1527-1536.
Murry, C. E., Soonpaa, M. H., Reinecke, H., Nakajima, H., Nakajima, H. O., Rubart, M., Pasumarthi, K. B., Virag, J. I., Bartelmez, S. H., Poppa, V., Bradford, G., Dowell, J. D., Williams, D. A., & Field, L. J. 2004, "Haematopoietic stem cells do not transdifferentiate into cardiac myocytes in myocardial infarcts", Nature, vol. 428, no. 6983, pp. 664-668.
Muthana, M., Scott, S. D., Farrow, N., Morrow, F., Murdoch, C., Grubb, S., Brown, N., Dobson, J., & Lewis, C. E. 2008, "A novel magnetic approach to enhance the efficacy of cell-based gene therapies", Gene Ther., vol. 15, no. 12, pp. 902-910.
Nakayama, Y. & Boucher, R. F. 1999, Introduction to fluid mechanics Butterworth-Heinemann.
Nelson, K. L. & Runge, V. M. 1995, "Basic principles of MR contrast", Top.Magn Reson.Imaging, vol. 7, no. 3, pp. 124-136.
Nussbaum, J., Minami, E., Laflamme, M. A., Virag, J. A., Ware, C. B., Masino, A., Muskheli, V., Pabon, L., Reinecke, H., & Murry, C. E. 2007, "Transplantation of undifferentiated murine embryonic stem cells in the heart: teratoma formation and immune response", FASEB J., vol. 21, no. 7, pp. 1345-1357.
Oliver, M., Entman, M., & Jacob, S. The human cardiovascular system. Encyclopedia Britannica Online . 2009. 14-3-2009. Ref Type: Electronic Citation
Orive, G., Hernandez, R. M., Gascon, A. R., Igartua, M., & Pedraz, J. L. 2003, "Controversies over stem cell research", Trends Biotechnol., vol. 21, no. 3, pp. 109-112.
Orlic, D. 2005, "BM stem cells and cardiac repair: where do we stand in 2004?", Cytotherapy., vol. 7, no. 1, pp. 3-15.
Orlic, D., Kajstura, J., Chimenti, S., Jakoniuk, I., Anderson, S. M., Li, B., Pickel, J., McKay, R., Nadal-Ginard, B., Bodine, D. M., Leri, A., & Anversa, P. 2001, "Bone marrow cells regenerate infarcted myocardium", Nature, vol. 410, no. 6829, pp. 701-705.
Panizzo, R. A., Kyrtatos, P. G., Price, A. N., Gadian, D. G., Ferretti, P., & Lythgoe, M. F. 2009, "In vivo magnetic resonance imaging of endogenous neuroblasts labelled with a ferumoxide-polycation complex", Neuroimage., vol. 44, no. 4, pp. 1239-1246.
Pankhurst, Q., Connoly, J., Jones, S., & Dobson, J. 2003, "Applications of magnetic particles in biomedicine", J.Phys.D: Appl.Phys., vol. 36, pp. 167-181.
Patel, M. I., Tuckerman, R., & Dong, Q. 2005, "A Pitfall of the 3-(4,5-dimethylthiazol-2-yl)-5(3-carboxymethonyphenol)-2-(4-sulfophenyl)-2H-tetra zolium (MTS) assay due to evaporation in wells on the edge of a 96 well plate", Biotechnol.Lett., vol. 27, no. 11, pp. 805-808.
Peichev, M., Naiyer, A. J., Pereira, D., Zhu, Z., Lane, W. J., Williams, M., Oz, M. C., Hicklin, D. J., Witte, L., Moore, M. A., & Rafii, S. 2000, "Expression of VEGFR-2 and

Bibliography
- 209 -
AC133 by circulating human CD34(+) cells identifies a population of functional endothelial precursors", Blood, vol. 95, no. 3, pp. 952-958.
Pislaru, S. V., Harbuzariu, A., Agarwal, G., Witt, T., Gulati, R., Sandhu, N. P., Mueske, C., Kalra, M., Simari, R. D., & Sandhu, G. S. 2006a, "Magnetic forces enable rapid endothelialization of synthetic vascular grafts", Circulation, vol. 114, no. 1 Suppl, p. I314-I318.
Pislaru, S. V., Harbuzariu, A., Gulati, R., Witt, T., Sandhu, N. P., Simari, R. D., & Sandhu, G. S. 2006b, "Magnetically targeted endothelial cell localization in stented vessels", J.Am.Coll.Cardiol., vol. 48, no. 9, pp. 1839-1845.
Polyak, B., Fishbein, I., Chorny, M., Alferiev, I., Williams, D., Yellen, B., Friedman, G., & Levy, R. J. 2008, "High field gradient targeting of magnetic nanoparticle-loaded endothelial cells to the surfaces of steel stents", Proc.Natl.Acad.Sci.U.S.A, vol. 105, no. 2, pp. 698-703.
Pompilio, G., Capogrossi, M. C., Pesce, M., Alamanni, F., DiCampli, C., Achilli, F., Germani, A., & Biglioli, P. 2009, "Endothelial progenitor cells and cardiovascular homeostasis: clinical implications", Int J.Cardiol., vol. 131, no. 2, pp. 156-167.
Power, C. & Rasko, J. E. 2008, "Whither prometheus' liver? Greek myth and the science of regeneration", Ann.Intern.Med., vol. 149, no. 6, pp. 421-426.
Quaini, F., Urbanek, K., Beltrami, A. P., Finato, N., Beltrami, C. A., Nadal-Ginard, B., Kajstura, J., Leri, A., & Anversa, P. 2002, "Chimerism of the transplanted heart", N.Engl.J.Med., vol. 346, no. 1, pp. 5-15.
Quirici, N., Soligo, D., Caneva, L., Servida, F., Bossolasco, P., & Deliliers, G. L. 2001, "Differentiation and expansion of endothelial cells from human bone marrow CD133(+) cells", Br.J.Haematol., vol. 115, no. 1, pp. 186-194.
Rad, A. M., Iskander, A., Janic, B., Knight, R. A., Arbab, A. S., & Soltanian-Zadeh, H. 2009, "AC133+ progenitor cells as gene delivery vehicle and cellular probe in subcutaneous tumor models: a preliminary study", BMC.Biotechnol., vol. 9, no. 1, p. 28.
Rad, A. M., Janic, B., Iskander, A. S., Soltanian-Zadeh, H., & Arbab, A. S. 2007, "Measurement of quantity of iron in magnetically labeled cells: comparison among different UV/VIS spectrometric methods", Biotechniques, vol. 43, no. 5, pp. 627-8, 630, 632.
Rafii, D. C., Psaila, B., Butler, J., Jin, D. K., & Lyden, D. 2008, "Regulation of vasculogenesis by platelet-mediated recruitment of bone marrow-derived cells", Arterioscler.Thromb.Vasc.Biol., vol. 28, no. 2, pp. 217-222.
Ratajczak, M. Z., Zuba-Surma, E. K., Wysoczynski, M., Wan, W., Ratajczak, J., Wojakowski, W., & Kucia, M. 2008, "Hunt for pluripotent stem cell -- regenerative medicine search for almighty cell", J.Autoimmun., vol. 30, no. 3, pp. 151-162.
Raynal, I., Prigent, P., Peyramaure, S., Najid, A., Rebuzzi, C., & Corot, C. 2004, "Macrophage endocytosis of superparamagnetic iron oxide nanoparticles: mechanisms and comparison of ferumoxides and ferumoxtran-10", Invest Radiol., vol. 39, no. 1, pp. 56-63.

Bibliography
- 210 -
Rehman, J., Li, J., Orschell, C. M., & March, K. L. 2003, "Peripheral blood "endothelial progenitor cells" are derived from monocyte/macrophages and secrete angiogenic growth factors", Circulation, vol. 107, no. 8, pp. 1164-1169.
Reimer, P. & Tombach, B. 1998, "Hepatic MRI with SPIO: detection and characterization of focal liver lesions", Eur.Radiol., vol. 8, no. 7, pp. 1198-1204.
Reyes, M., Dudek, A., Jahagirdar, B., Koodie, L., Marker, P. H., & Verfaillie, C. M. 2002, "Origin of endothelial progenitors in human postnatal bone marrow", J.Clin.Invest, vol. 109, no. 3, pp. 337-346.
Ribatti, D. 2007, "The discovery of endothelial progenitor cells. An historical review", Leuk.Res., vol. 31, no. 4, pp. 439-444.
Rippon, H. J. & Bishop, A. E. 2004, "Embryonic stem cells", Cell Prolif., vol. 37, no. 1, pp. 23-34.
Ritter, J. A., Ebner, A. D., Daniel, K. D., & Stewart, K. L. 2004, "Application of high gradient magnetic separation principles to magnetic drug targeting", Journal of Magnetism and Magnetic Materials, vol. 280, no. 2-3, pp. 184-201.
Rohde, E., Bartmann, C., Schallmoser, K., Reinisch, A., Lanzer, G., Linkesch, W., Guelly, C., & Strunk, D. 2007, "Immune cells mimic the morphology of endothelial progenitor colonies in vitro", Stem Cells, vol. 25, no. 7, pp. 1746-1752.
Rohde, E., Malischnik, C., Thaler, D., Maierhofer, T., Linkesch, W., Lanzer, G., Guelly, C., & Strunk, D. 2006, "Blood monocytes mimic endothelial progenitor cells", Stem Cells, vol. 24, no. 2, pp. 357-367.
Roncalli, J. G., Tongers, J., Renault, M. A., & Losordo, D. W. 2008, "Endothelial progenitor cells in regenerative medicine and cancer: a decade of research", Trends Biotechnol., vol. 26, no. 5, pp. 276-283.
Ross, R. 1995, "Cell biology of atherosclerosis", Annu.Rev.Physiol, vol. 57, pp. 791-804.
Ross, R. 1999, "Atherosclerosis--an inflammatory disease", N.Engl.J.Med., vol. 340, no. 2, pp. 115-126.
Ross, R., Glomset, J., & Harker, L. 1977, "Response to injury and atherogenesis", Am.J.Pathol., vol. 86, no. 3, pp. 675-684.
Rossi, M. L., Zavalloni, D., Gasparini, G. L., Mango, R., Belli, G., & Presbitero, P. 2009, "The first report of late stent thrombosis leading to acute myocardial infarction in patient receiving the new endothelial progenitor cell capture stent", Int J.Cardiol.
Rotmans, J. I., Heyligers, J. M., Verhagen, H. J., Velema, E., Nagtegaal, M. M., de Kleijn, D. P., de Groot, F. G., Stroes, E. S., & Pasterkamp, G. 2005, "In vivo cell seeding with anti-CD34 antibodies successfully accelerates endothelialization but stimulates intimal hyperplasia in porcine arteriovenous expanded polytetrafluoroethylene grafts", Circulation, vol. 112, no. 1, pp. 12-18.

Bibliography
- 211 -
Santiago, F. S., Ishii, H., Shafi, S., Khurana, R., Kanellakis, P., Bhindi, R., Ramirez, M. J., Bobik, A., Martin, J. F., Chesterman, C. N., Zachary, I. C., & Khachigian, L. M. 2007, "Yin Yang-1 inhibits vascular smooth muscle cell growth and intimal thickening by repressing p21WAF1/Cip1 transcription and p21WAF1/Cip1-Cdk4-cyclin D1 assembly", Circ.Res., vol. 101, no. 2, pp. 146-155.
Schachinger, V., Assmus, B., Britten, M. B., Honold, J., Lehmann, R., Teupe, C., Abolmaali, N. D., Vogl, T. J., Hofmann, W. K., Martin, H., Dimmeler, S., & Zeiher, A. M. 2004, "Transplantation of progenitor cells and regeneration enhancement in acute myocardial infarction: final one-year results of the TOPCARE-AMI Trial", J.Am.Coll.Cardiol., vol. 44, no. 8, pp. 1690-1699.
Schillinger, U., Brill, T., Rudolph, C., Huth, S., Gersting, S., Krötz, F., Hirschberger, J., Bergemann, C., & Plank, C. 2005, "Advances in magnetofection--magnetically guided nucleic acid delivery", Journal of Magnetism and Magnetic Materials, vol. 293, no. 1, pp. 501-508.
Schipper, L. F., Brand, A., Reniers, N. C., Melief, C. J., Willemze, R., & Fibbe, W. E. 1998, "Effects of thrombopoietin on the proliferation and differentiation of primitive and mature haemopoietic progenitor cells in cord blood", Br.J.Haematol., vol. 101, no. 3, pp. 425-435.
Schmeisser, A., Garlichs, C. D., Zhang, H., Eskafi, S., Graffy, C., Ludwig, J., Strasser, R. H., & Daniel, W. G. 2001, "Monocytes coexpress endothelial and macrophagocytic lineage markers and form cord-like structures in Matrigel under angiogenic conditions", Cardiovasc.Res., vol. 49, no. 3, pp. 671-680.
Schmitt, R. 2002, "Fundamentals of Magnetic Fields," in Electromagnetics Explained, S. Ron, ed., Newnes, Burlington, pp. 51-74.
Segers, V. F. & Lee, R. T. 2008, "Stem-cell therapy for cardiac disease", Nature, vol. 451, no. 7181, pp. 937-942.
Serruys, P. W., de, J. P., Kiemeneij, F., Macaya, C., Rutsch, W., Heyndrickx, G., Emanuelsson, H., Marco, J., Legrand, V., Materne, P., & . 1994, "A comparison of balloon-expandable-stent implantation with balloon angioplasty in patients with coronary artery disease. Benestent Study Group", N.Engl.J.Med., vol. 331, no. 8, pp. 489-495.
Serruys, P. W., Kutryk, M. J., & Ong, A. T. 2006, "Coronary-artery stents", N.Engl.J.Med., vol. 354, no. 5, pp. 483-495.
Shaughnessy, E. J., Katz, I. M., & Schaffer, J. P. 2005, Introduction to fluid dynamics Oxford University Press.
Shi, Q., Rafii, S., Wu, M. H., Wijelath, E. S., Yu, C., Ishida, A., Fujita, Y., Kothari, S., Mohle, R., Sauvage, L. R., Moore, M. A., Storb, R. F., & Hammond, W. P. 1998, "Evidence for circulating bone marrow-derived endothelial cells", Blood, vol. 92, no. 2, pp. 362-367.
Shintani, S., Murohara, T., Ikeda, H., Ueno, T., Honma, T., Katoh, A., Sasaki, K., Shimada, T., Oike, Y., & Imaizumi, T. 2001, "Mobilization of endothelial progenitor

Bibliography
- 212 -
cells in patients with acute myocardial infarction", Circulation, vol. 103, no. 23, pp. 2776-2779.
Shmelkov, S. V., St, C. R., Lyden, D., & Rafii, S. 2005, "AC133/CD133/Prominin-1", Int.J.Biochem.Cell Biol., vol. 37, no. 4, pp. 715-719.
Smith, B. R. 1990, "Regulation of hematopoiesis", Yale J.Biol.Med., vol. 63, no. 5, pp. 371-380.
Srinivas, G., Anversa, P., & Frishman, W. H. 2009, "Cytokines and myocardial regeneration: a novel treatment option for acute myocardial infarction", Cardiol.Rev., vol. 17, no. 1, pp. 1-9.
Stahli, B. E., Camici, G. G., & Tanner, F. C. 2009, "Drug-eluting stent thrombosis", Ther.Adv.Cardiovasc.Dis., vol. 3, no. 1, pp. 45-52.
Stamm, C., Kleine, H. D., Choi, Y. H., Dunkelmann, S., Lauffs, J. A., Lorenzen, B., David, A., Liebold, A., Nienaber, C., Zurakowski, D., Freund, M., & Steinhoff, G. 2007, "Intramyocardial delivery of CD133+ bone marrow cells and coronary artery bypass grafting for chronic ischemic heart disease: safety and efficacy studies", J.Thorac.Cardiovasc.Surg., vol. 133, no. 3, pp. 717-725.
Stocum, D. L. & Zupanc, G. K. 2008, "Stretching the limits: stem cells in regeneration science", Dev.Dyn., vol. 237, no. 12, pp. 3648-3671.
Strehlow, K., Werner, N., Berweiler, J., Link, A., Dirnagl, U., Priller, J., Laufs, K., Ghaeni, L., Milosevic, M., Bohm, M., & Nickenig, G. 2003, "Estrogen increases bone marrow-derived endothelial progenitor cell production and diminishes neointima formation", Circulation, vol. 107, no. 24, pp. 3059-3065.
Sun, R., Dittrich, J., Le-Huu, M., Mueller, M. M., Bedke, J., Kartenbeck, J., Lehmann, W. D., Krueger, R., Bock, M., Huss, R., Seliger, C., Grone, H. J., Misselwitz, B., Semmler, W., & Kiessling, F. 2005, "Physical and biological characterization of superparamagnetic iron oxide- and ultrasmall superparamagnetic iron oxide-labeled cells: a comparison", Invest Radiol., vol. 40, no. 8, pp. 504-513.
Swijnenburg, R. J., Tanaka, M., Vogel, H., Baker, J., Kofidis, T., Gunawan, F., Lebl, D. R., Caffarelli, A. D., de Bruin, J. L., Fedoseyeva, E. V., & Robbins, R. C. 2005, "Embryonic stem cell immunogenicity increases upon differentiation after transplantation into ischemic myocardium", Circulation, vol. 112, no. 9 Suppl, p. I166-I172.
Takahashi, H., Letourneur, D., & Grainger, D. W. 2007, "Delivery of large biopharmaceuticals from cardiovascular stents: a review", Biomacromolecules., vol. 8, no. 11, pp. 3281-3293.
Tateishi-Yuyama, E., Matsubara, H., Murohara, T., Ikeda, U., Shintani, S., Masaki, H., Amano, K., Kishimoto, Y., Yoshimoto, K., Akashi, H., Shimada, K., Iwasaka, T., & Imaizumi, T. 2002, "Therapeutic angiogenesis for patients with limb ischaemia by autologous transplantation of bone-marrow cells: a pilot study and a randomised controlled trial", Lancet, vol. 360, no. 9331, pp. 427-435.

Bibliography
- 213 -
Thomson, J. A., Itskovitz-Eldor, J., Shapiro, S. S., Waknitz, M. A., Swiergiel, J. J., Marshall, V. S., & Jones, J. M. 1998, "Embryonic stem cell lines derived from human blastocysts", Science, vol. 282, no. 5391, pp. 1145-1147.
Urbich, C. & Dimmeler, S. 2005, "Risk factors for coronary artery disease, circulating endothelial progenitor cells, and the role of HMG-CoA reductase inhibitors", Kidney Int., vol. 67, no. 5, pp. 1672-1676.
Urbich, C. & Dimmeler, S. 2004, "Endothelial progenitor cells: characterization and role in vascular biology", Circ.Res., vol. 95, no. 4, pp. 343-353.
Urbich, C., Heeschen, C., Aicher, A., Dernbach, E., Zeiher, A. M., & Dimmeler, S. 2003, "Relevance of monocytic features for neovascularization capacity of circulating endothelial progenitor cells", Circulation, vol. 108, no. 20, pp. 2511-2516.
van Beusekom, H. M., Saia, F., Zindler, J. D., Lemos, P. A., Swager-Ten Hoor, S. L., van Leeuwen, M. A., de Feijter, P. J., Serruys, P. W., & van der Giessen, W. J. 2007, "Drug-eluting stents show delayed healing: paclitaxel more pronounced than sirolimus", Eur.Heart J., vol. 28, no. 8, pp. 974-979.
van Beusekom, H. M., Whelan, D. M., Hofma, S. H., Krabbendam, S. C., van, H., V, Verdouw, P. D., & van der Giessen, W. J. 1998, "Long-term endothelial dysfunction is more pronounced after stenting than after balloon angioplasty in porcine coronary arteries", J.Am.Coll.Cardiol., vol. 32, no. 4, pp. 1109-1117.
Vasa, M., Fichtlscherer, S., Adler, K., Aicher, A., Martin, H., Zeiher, A. M., & Dimmeler, S. 2001a, "Increase in circulating endothelial progenitor cells by statin therapy in patients with stable coronary artery disease", Circulation, vol. 103, no. 24, pp. 2885-2890.
Vasa, M., Fichtlscherer, S., Aicher, A., Adler, K., Urbich, C., Martin, H., Zeiher, A. M., & Dimmeler, S. 2001b, "Number and migratory activity of circulating endothelial progenitor cells inversely correlate with risk factors for coronary artery disease", Circ.Res., vol. 89, no. 1, p. E1-E7.
Vaughan, C. J., Gotto, A. M., & Basson, C. T. 2000, "The evolving role of statins in the management of atherosclerosis", J.Am.Coll.Cardiol., vol. 35, no. 1, pp. 1-10.
Vermes, I., Haanen, C., Steffens-Nakken, H., & Reutelingsperger, C. 1995, "A novel assay for apoptosis. Flow cytometric detection of phosphatidylserine expression on early apoptotic cells using fluorescein labelled Annexin V", J.Immunol.Methods., vol. 184, no. 1, pp. 39-51.
Voltairas, P. A., Fotiadis, D. I., & Michalis, L. K. 2002, "Hydrodynamics of magnetic drug targeting", Journal of Biomechanics, vol. 35, no. 6, pp. 813-821.
Voo, S., Rats, R., Donners, M., & Waltenberger, J. Circulating progenitor cells differentiate into 'foam-cell'-like cells under the influence of oxidized LDL: evidence for a causal involvement of progenitor cells in atherosclerosis development. European Society of Cardiology Congress , 4612. 2008. Ref Type: Abstract

Bibliography
- 214 -
W.H.O. Cardiovascular Disease Fact Sheet 317. http://www.who.int/mediacentre/factsheets/fs317/en/index.html . 2007. 14-3-2009. Ref Type: Electronic Citation
Walter, D. H., Cejna, M., az-Sandoval, L., Willis, S., Kirkwood, L., Stratford, P. W., Tietz, A. B., Kirchmair, R., Silver, M., Curry, C., Wecker, A., Yoon, Y. S., Heidenreich, R., Hanley, A., Kearney, M., Tio, F. O., Kuenzler, P., Isner, J. M., & Losordo, D. W. 2004, "Local gene transfer of phVEGF-2 plasmid by gene-eluting stents: an alternative strategy for inhibition of restenosis", Circulation, vol. 110, no. 1, pp. 36-45.
Walter, D. H., Rittig, K., Bahlmann, F. H., Kirchmair, R., Silver, M., Murayama, T., Nishimura, H., Losordo, D. W., Asahara, T., & Isner, J. M. 2002, "Statin therapy accelerates reendothelialization: a novel effect involving mobilization and incorporation of bone marrow-derived endothelial progenitor cells", Circulation, vol. 105, no. 25, pp. 3017-3024.
Walter, D. H., Zeiher, A. M., & Dimmeler, S. 2004, "Effects of statins on endothelium and their contribution to neovascularization by mobilization of endothelial progenitor cells", Coron.Artery Dis., vol. 15, no. 5, pp. 235-242.
Wang, C. H., Cherng, W. J., Yang, N. I., Kuo, L. T., Hsu, C. M., Yeh, H. I., Lan, Y. J., Yeh, C. H., & Stanford, W. L. 2008, "Late-outgrowth endothelial cells attenuate intimal hyperplasia contributed by mesenchymal stem cells after vascular injury", Arterioscler.Thromb.Vasc.Biol., vol. 28, no. 1, pp. 54-60.
Wang, S., Liu, H., & Xu, W. 2008, "Hydrodynamic modelling and CFD simulation of ferrofluids flow in magnetic targeting drug delivery", International Journal of Computational Fluid Dynamics, vol. 22, no. 10, pp. 659-667.
Wang, Y. X., Hussain, S. M., & Krestin, G. P. 2001, "Superparamagnetic iron oxide contrast agents: physicochemical characteristics and applications in MR imaging", Eur.Radiol., vol. 11, no. 11, pp. 2319-2331.
Weissleder, R., Stark, D. D., Engelstad, B. L., Bacon, B. R., Compton, C. C., White, D. L., Jacobs, P., & Lewis, J. 1989, "Superparamagnetic iron oxide: pharmacokinetics and toxicity", AJR Am.J.Roentgenol., vol. 152, no. 1, pp. 167-173.
Welt, F. G. & Losordo, D. W. 2006, "Cell therapy for acute myocardial infarction: curb your enthusiasm?", Circulation, vol. 113, no. 10, pp. 1272-1274.
Werner, N., Junk, S., Laufs, U., Link, A., Walenta, K., Bohm, M., & Nickenig, G. 2003, "Intravenous transfusion of endothelial progenitor cells reduces neointima formation after vascular injury", Circ.Res., vol. 93, no. 2, p. e17-e24.
Werner, N., Kosiol, S., Schiegl, T., Ahlers, P., Walenta, K., Link, A., Bohm, M., & Nickenig, G. 2005, "Circulating endothelial progenitor cells and cardiovascular outcomes", N.Engl.J.Med., vol. 353, no. 10, pp. 999-1007.
Werner, N. & Nickenig, G. 2006, "Influence of cardiovascular risk factors on endothelial progenitor cells: limitations for therapy?", Arterioscler.Thromb.Vasc.Biol., vol. 26, no. 2, pp. 257-266.

Bibliography
- 215 -
Werner, N., Priller, J., Laufs, U., Endres, M., Bohm, M., Dirnagl, U., & Nickenig, G. 2002, "Bone marrow-derived progenitor cells modulate vascular reendothelialization and neointimal formation: effect of 3-hydroxy-3-methylglutaryl coenzyme a reductase inhibition", Arterioscler.Thromb.Vasc.Biol., vol. 22, no. 10, pp. 1567-1572.
Westbrook, C., Roth, C. K., & Talbot, J. 2005, "Basic Principles," in MRI in Practice, 3rd edn, Blackwell Publishing Ltd, Oxford.
Wilhelm, C., Billotey, C., Roger, J., Pons, J. N., Bacri, J. C., & Gazeau, F. 2003a, "Intracellular uptake of anionic superparamagnetic nanoparticles as a function of their surface coating", Biomaterials., vol. 24, no. 6, pp. 1001-1011.
Wilhelm, C., Cebers, A., Bacri, J. C., & Gazeau, F. 2003b, "Deformation of intracellular endosomes under a magnetic field", Eur.Biophys.J., vol. 32, no. 7, pp. 655-660.
Wilhelm, C., Gazeau, F., & Bacri, J. C. 2002, "Magnetophoresis and ferromagnetic resonance of magnetically labeled cells", Eur.Biophys.J., vol. 31, no. 2, pp. 118-125.
Wilson, M. W., Kerlan, R. K., Jr., Fidelman, N. A., Venook, A. P., LaBerge, J. M., Koda, J., & Gordon, R. L. 2004, "Hepatocellular carcinoma: regional therapy with a magnetic targeted carrier bound to doxorubicin in a dual MR imaging/ conventional angiography suite--initial experience with four patients", Radiology, vol. 230, no. 1, pp. 287-293.
Yellen, B. B., Forbes, Z. G., Halverson, D. S., Fridman, G., Barbee, K. A., Chorny, M., Levy, R., & Friedman, G. 2005, "Targeted drug delivery to magnetic implants for therapeutic applications", Journal of Magnetism and Magnetic Materials, vol. 293, no. 1, pp. 647-654.
Yin, A. H., Miraglia, S., Zanjani, E. D., meida-Porada, G., Ogawa, M., Leary, A. G., Olweus, J., Kearney, J., & Buck, D. W. 1997, "AC133, a novel marker for human hematopoietic stem and progenitor cells", Blood, vol. 90, no. 12, pp. 5002-5012.
Zammaretti, P. & Zisch, A. H. 2005, "Adult 'endothelial progenitor cells'. Renewing vasculature", Int.J.Biochem.Cell Biol., vol. 37, no. 3, pp. 493-503.
Zampetaki, A., Kirton, J. P., & Xu, Q. 2008, "Vascular repair by endothelial progenitor cells", Cardiovasc.Res., vol. 78, no. 3, pp. 413-421.
Zohlnhofer, D., Dibra, A., Koppara, T., de, W. A., Ripa, R. S., Kastrup, J., Valgimigli, M., Schomig, A., & Kastrati, A. 2008, "Stem cell mobilization by granulocyte colony-stimulating factor for myocardial recovery after acute myocardial infarction: a meta-analysis", J.Am.Coll.Cardiol., vol. 51, no. 15, pp. 1429-1437.

- 216 -
AAPPPPEENNDDIIXX AA
MMEETTHHOODDOOLLOOGGIICCAALL DDEEVVEELLOOPPMMEENNTTSS

Appendix A Methodological developments
- 217 -
AA..11 -- AAbbssoorrbbaannccee ssppeeccttrruumm ooff PPrruussssiiaann BBlluuee There was an increase in absorbance between 560 and 900nm when the PrB solution
reacted with the iron in SPIO, with peak absorbance at 690nm, 0.21 absorbance units
(au). This was 4-fold higher than PrB (peak = 0.07 au) or SPIO alone (peak = 0.09 au).
Figure A.1 is a summary of the absorbance profile within the range 405-900nm of i)
PrB staining solution + SPIO, ii) SPIO only and iii) PrB staining solution only, using
the microplate spectrophotometer and available filters.
Figure A.1 - Absorbance profile of Prussian Blue

Appendix A Methodological developments
- 218 -
AA..22 EEffffeecctt ooff cceellll llyyssiiss bbuuffffeerr oonn tthhee PPrruussssiiaann BBlluuee rreeaaccttiioonn Addition of lysis buffer slowed down the production of the PrB colour and led to an
approximately 14% decrease in maximum absorbance at 690nm. Figure A.2
demonstrates the increase in absorbance with time immediately following the addition
of PrB staining solution to i) SPIO + lysis buffer and ii) SPIO + PBS. Table A.1 is a
summary of the maximum absorbance values and time to reach half-maximum, as
estimated from the spline curve coordinates.
Figure A.2 - Prussian blue with lysis buffer The solid lines are cubic spline curves connecting the data points.
Table A.1 – Prussian blue with lysis buffer
(i) PrB / SPIO + lysis buffer (SEM, n=3)
(ii) PrB / SPIO + PBS (SEM, n=3)
Max absorbance units 0.167 (0.003) 0.191 (0.007)
Time to reach max/2 105 seconds 75 seconds
To reduce the resulting error in subsequent experiments, cell lysis buffer was added in
equal amounts even in the absence of cells.

Appendix A Methodological developments
- 219 -
Figure A.3 illustrates the absorbance at 690nm following PrB staining of cell lysates.
The data is summarised in Table A.2.
Figure A.3 – Labelling timecourse - absorbance at 690nm
Table A.2 – Labelling timecourse - absorbance at 690nm
Labelling time
Mean absorbance units (SEM x10-3), n=3
No cells* 0.045 (0.4)
0 h* 0.065 (1)
1 h 0.159 (5)
12 h 0.332 (5)
24 h 0.447 (18)
In the control group (0h), the presence of cells caused a small increase in absorbance by
0.02 au above the no-cells baseline (0.065-0.045 = 0.02).

Appendix A Methodological developments
- 220 -
Figure A.4 displays a standard curve for the absorbance of Endorem® following the
PrB reaction.
Figure A.4 – Standard curve for iron quantification
The coordinates of the spline curve were used to estimate the Fe3O4 content of each
well. For a more accurate quantification, the excess 0.02 au due to the presence of the
cells was first subtracted to produce a corrected absorbance value. This was then used to
estimate the Fe3O4 content of each well and, assuming 1.5x10⁵ cells / well, the average
iron content of adherent cells. These results are summarised in Table A.3 and Figure
4.5.
Table A.3 - Labelling timecourse - estimation of cellular iron content
Labelling time
Corrected absorbance units (SEM), n=3
Fe3O4 content / well Mean, µg (SEM), n=3
Fe3O4 content / cell Mean, pg (SEM), n=3
0 h 0.045 (0.001) 0.013 (0.013) 0.09 (0.09)
1 h 0.139 (0.005) 0.815 (0.019) 5.4 (0.12)
12 h 0.312 (0.005) 1.384 (0.014) 9.2 (0.09)
24 h 0.427 (0.018) 1.744 (0.059) 11.6 (0.39)

Appendix A Methodological developments
- 221 -
AA..33 WWaatteerr eevvaappoorraattiioonn ffrroomm 9966--wweellll ppllaatteess There was marked evaporation of water from 96-well plates. This evaporation was
increased in corner wells (exactly where the magnets are placed in the magnetic plate)
than centre wells. Filling the rest of the plate with PBS minimised evaporation. Table
A.4 and Figure A.5 display the amount of water evaporation in 48h, from 4 corner or 4
centre wells, in the two 96-well plates with/without flooding with PBS.
Table A.4 – Water evaporation in 96-well plates
At 48h Corner wells (Mean µL ± SEM)
Centre wells (Mean µL ±SEM)
Without flooding 56.4 (1.6) 28.7 (0.9)
With flooding 5.5 (2.7) 6 (2.1)
Figure A.5 – Water evaporation in 96-well plates

- 222 -
AAPPPPEENNDDIIXX BB
FFUULLLL TTAABBLLEESS

Appendix B Full tables
- 223 -
BB..11 FFuullll ttaabblleess ffoorr FFiigguurreess 44..55,, 55..33 aanndd 55..55..
Table B.1 – Full table for Figure 4.5
Labelling time (n=3)
Mean Fe3O4 (pg, SEM)
Comparison groups1
Mean difference
95% CI difference p-value
0h 0.1 (0.1) 0h vs 1h -5.4 -6.3 to -4.4 <0.001
1h 5.4 (0.1) 0h vs 12h -9.1 -10.1 to -8.2 <0.001
12h 9.3 (0.1) 0h vs 24h -11.5 -12.5 to -10.6 <0.001
24h 11.6 (0.4) 1h vs 12h -3.8 -4.8 to -2.8 <0.001
1h vs 24h -6.2 -7.2 to -5.2 <0.001
12h vs 24h -2.4 -3.4 to -1.4 <0.001
1 One-way ANOVA with Tukey’s post-hoc multiple comparison test

Table B.2 – Full table for Figure 5.3
Early apoptosis Late apoptosis Necrosis 24 h 72 h 24 h 72 h 24 h 72 h control DfL control DfL control DfL control DfL control DfL control DfL
Mean % 6.49 5.70 3.74 4.12 2.13 2.01 2.37 2.23 0.04 0.05 0.09 0.09 SEM (n=8) 0.78 0.90 0.50 0.65 0.41 0.44 0.41 0.41 0.01 0.02 0.03 0.02
Table B.3 – Full table for Figure 5.5
Early apoptosis Late apoptosis Necrosis 24 h 48 h 120 h 24 h 48 h 120 h 24 h 48 h 120 h
DfL DfL + magnet DfL DfL +
magnet DfL DfL + magnet DfL DfL +
magnet DfL DfL + magnet DfL DfL +
magnet DfL DfL + magnet DfL DfL +
magnet DfL DfL + magnet
Mean % 9.39 9.03 4.85 5.36 3.14 3.40 3.42 3.27 3.13 3.65 1.54 1.51 0.08 0.05 0.06 0.06 0.08 0.31
SEM (n=6) 1.35 1.73 1.22 1.24 0.37 0.75 0.29 0.30 0.52 0.74 0.18 0.23 0.01 0.01 0.01 0.00 0.01 0.27

Appendix B Full tables
- 225 -
Table B.4 – Full table for Figure 5.8
Mean marker expression (%, SEM)
Suspension Adherent
control DfL control DfL
VE-Cad (n=6) 1.82 (0.57) 2.30 (0.89) 10.40 (3.88) 5.70 (1.67)
CD304 (n=6) 4.36 (1.69) 5.08 (1.95) 38.47 (4.95) 29.34 (4.59)
CD14 (n=6) 8.95 (0.99) 12.24 (2.34) 43.78 (5.93) 44.82 (5.54)
CD11b (n=3) 16.26 (10.52) 17.03 (9.99) 3.37 (0.54) 3.21 (0.30)

- 226 -
AAPPPPEENNDDIIXX CC
MMTTSS AASSSSAAYY
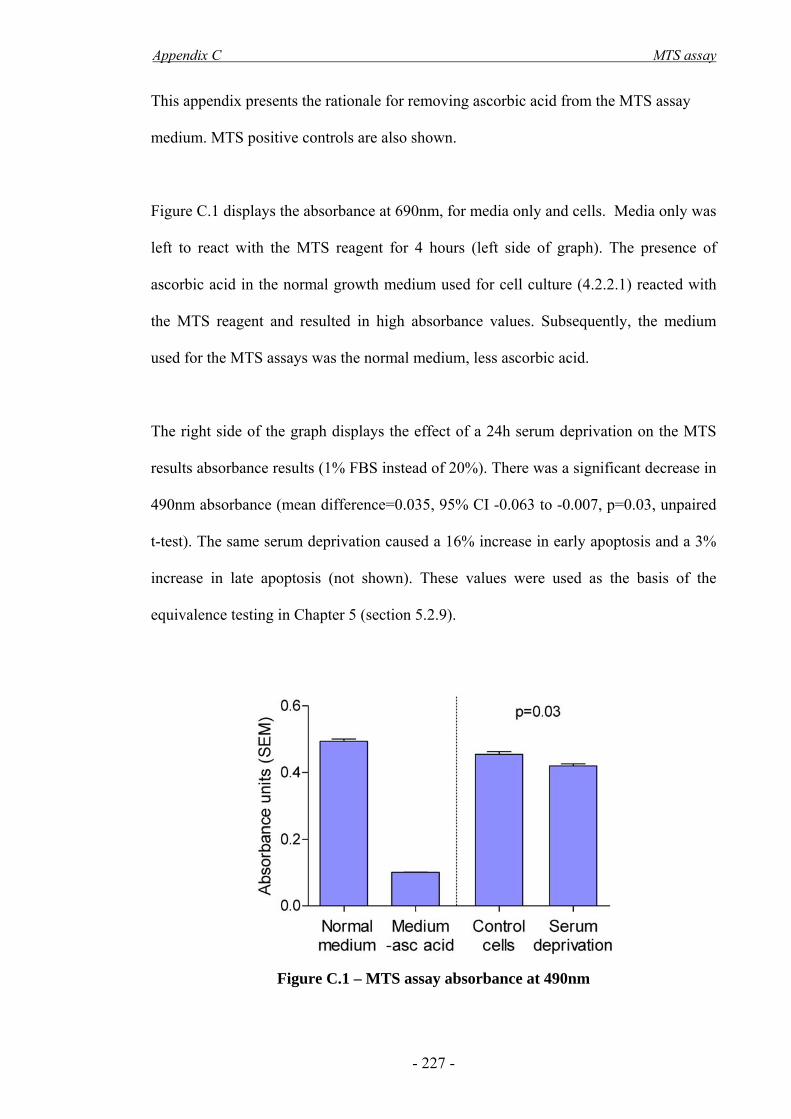
Appendix C MTS assay
- 227 -
This appendix presents the rationale for removing ascorbic acid from the MTS assay
medium. MTS positive controls are also shown.
Figure C.1 displays the absorbance at 690nm, for media only and cells. Media only was
left to react with the MTS reagent for 4 hours (left side of graph). The presence of
ascorbic acid in the normal growth medium used for cell culture (4.2.2.1) reacted with
the MTS reagent and resulted in high absorbance values. Subsequently, the medium
used for the MTS assays was the normal medium, less ascorbic acid.
The right side of the graph displays the effect of a 24h serum deprivation on the MTS
results absorbance results (1% FBS instead of 20%). There was a significant decrease in
490nm absorbance (mean difference=0.035, 95% CI -0.063 to -0.007, p=0.03, unpaired
t-test). The same serum deprivation caused a 16% increase in early apoptosis and a 3%
increase in late apoptosis (not shown). These values were used as the basis of the
equivalence testing in Chapter 5 (section 5.2.9).
Figure C.1 – MTS assay absorbance at 490nm

Appendix C MTS assay
- 228 -
(Asahara & Kawamoto 2004) for Figure 1.2 (Carter et al. 2004) for Figure 1.9 (Thomson et al. 1998) (Lee et al. 2003) for Figure 2.6

![Ley%20 impuesto%20a%20la%20renta%20 %20ds%20179-2004-ef[1]](https://static.fdocuments.net/doc/165x107/55837cfed8b42aef748b498e/ley20-impuesto20a20la20renta20-20ds20179-2004-ef1.jpg)