Cell Supplemental Information Photoswitchable Inhibitors of … · Supplemental Information...
62
Cell Supplemental Information Photoswitchable Inhibitors of Microtubule Dynamics Optically Control Mitosis and Cell Death Malgorzata Borowiak, Wallis Nahaboo, Martin Reynders, Katharina Nekolla, Pierre Jalinot, Jens Hasserodt, Markus Rehberg, Marie Delattre, Stefan Zahler, Angelika Vollmar, Dirk Trauner, Oliver Thorn-Seshold
Transcript of Cell Supplemental Information Photoswitchable Inhibitors of … · Supplemental Information...
Cell
Supplemental Information
Photoswitchable Inhibitors of Microtubule Dynamics
Optically Control Mitosis and Cell Death
Malgorzata Borowiak, Wallis Nahaboo, Martin Reynders, Katharina Nekolla, Pierre
Jalinot, Jens Hasserodt, Markus Rehberg, Marie Delattre, Stefan Zahler, Angelika
Vollmar, Dirk Trauner, Oliver Thorn-Seshold
Borowiak, et al., Trauner* and Thorn-Seshold* 2015 Supp. Page 2 Photoswitchable inhibitors of microtubule dynamics optically control mitosis and cell death
Supplemental Information
This paper is dedicated to Dr Michael Bishop, who was an outstanding mentor, and is a lasting
inspiration.
Authorship Statement: Following the ICMJE guidelines, the authors declare their roles in this work as
follows: M. Borowiak: proposed, designed, ran and analysed cell biology experiments and in vitro
assays; wrote the cell biology portions of the manuscript; W. Nahaboo: designed and ran C. elegans
microscopy experiments; wrote the C. elegans portion of the manuscript; M. Reynders: performed
chemical synthesis; K. Nekolla: ran mouse cremaster microscopy experiments and wrote the mouse
cremaster portion of the manuscript; P. Jalinot: supervised initial cell biology evaluation of CA4CL;
J. Hasserodt: supervised synthesis of CA4CL; M. Rehberg: designed and supervised mouse
cremaster microscopy experiments; M. Delattre: designed and supervised C. elegans experiments;
S. Zahler: supervised in cellulo immunofluorescence microscopy; A. Vollmar: supervised
cytotoxicity assays and cell cycle analysis; D. Trauner: supervised syntheses of Photostatins and in
vitro and in cellulo assays, and proposed further applications; O. Thorn-Seshold: invented the design
of Photostatins as light-controllable cytotoxins; proposed, designed and performed syntheses and
photochemical analyses; designed, built and programmed the LED-array lighting system; wrote the
design, chemistry, photocharacterisation portions of the manuscript. MB, DT and OTS conceived the
study; coordinated research; and wrote the manuscript with support from all authors.
Thanks: The authors express their gratitude for project financial support from the European Research
Council (ERC Advanced Grant No. 268795 “CARV” to DT), the Deutsche Forschungsgemeinschaft
(SFB 1032 funding to KN, M. Rehberg, SZ, and DT), and the Comité de la Recherche Académique,
Rhône-Alpes, (funding call ARC1-Santé 2013, project PHOTO-CAN to OTS, MB, JH and PJ); and to
the Canceropôle Lyon Auvergne Rhône-Alpes for facilitating collaborations (CLARA Mobilité
Jeunes 2013 awarded to MB and OTS). We thank Herbert Bachmeier and Axel Gersdorf (LMU
Elektrotechnik) for prototyping manual LED arrays and expanding the computerised LED-array cell
culture system; Dr Georg Höfner (LMU) for help with radioligand assays; Dr. Jean-Christophe
Mulatier (ENS-Lyon) for synthesis of combretastatin A-4; Peter Mayer for X-ray structure
determination (LMU); the PLATIM (UMS Biosciences Lyon) and CALM (LMU) imaging facilities;
L. de la Osa de la Rosa for cell culture assistance (LMU); V. Small (IMBA, Vienna) for EB3-
mCherry plasmid; and the Caenorhabditis Genetics Center (supported by the NIH NCRR) for
nematode strains. OTS and MB are grateful to the ENS-Lyon Fonds Recherche 2013 for additional
financial support (salary grant). WN was supported by a French Government PhD fellowship. OTS
thanks Bob Pettit for inspiration; Andrew Haines for sage advice on electrical circuit design; and
Robert Zimmerman and Anthony Wainman for discussions on the design of the LED system.
Borowiak, et al., Trauner* and Thorn-Seshold* 2015 Supp. Page 3 Photoswitchable inhibitors of microtubule dynamics optically control mitosis and cell death
Table of Contents
Part A: Chemical Synthesis and Characterisation ............................................................................ 5 Conventions ........................................................................................................................................................... 5 Standard Procedures .............................................................................................................................................. 6 PST-1: “azocombretastatin A-4”; route using TBS protecting group ................................................................... 8 PST-1: alternative route using tosyl protecting group ........................................................................................ 12 PST-2: meta-amino analogue (azoombrabulin’s active core) ............................................................................. 13 PST-3: meta-fluoro analogue .............................................................................................................................. 15 PST-4: meta-hydro analogue ............................................................................................................................... 16 PST-5: meta-hydro, ortho-fluoro analogue ......................................................................................................... 17 PST-1P: “azo-CA4P”, a water-soluble phosphate prodrug of PST-1 ................................................................ 18 PST-2S: “azoombrabulin” – a water-soluble serine prodrug of PST-2 .............................................................. 20 PST-1CL and CA4CL: peptide prodrugs of PST-1 and CA4 ........................................................................... 21
Part B: Photocharacterisation in vitro .............................................................................................. 26 Spectrophotometry equipment ............................................................................................................................. 26 B.1: trans- and cis- absorption spectra ................................................................................................................ 26 B.2: Calculated φ(λ) and E(λ) .............................................................................................................................. 27 B.3: Reversible trans↔cis photoisomerisation ................................................................................................... 27 B.4: Thermal cis→trans reversion halflives ........................................................................................................ 28
ASSAYS in vitro, in cellulo, & in vivo Materials and Methods ....................................................................................................................... 28
Safety Precautions ............................................................................................................................................... 28 Biochemical Assays in vitro ................................................................................................................................ 28 Cell Culture .......................................................................................................................................................... 29 Cell Biology Assays ............................................................................................................................................ 31 C. elegans experiments ........................................................................................................................................ 34 Mouse cremaster muscle experiments ................................................................................................................. 34
RESULTS Part C: Cell Biology ............................................................................................................................ 36
C.1: Toxicity dependency on pulse frequency and illumination wavelength ...................................................... 36 C.2. Photoactuated cytotoxicity of PSTs ............................................................................................................. 38 C.3: G2/M phase cell cycle arrest (PST-1 and PST-1P) ..................................................................................... 38 C.4: Membrane permeability induced by PST-1 ................................................................................................. 39 C.5: Nuclear fragmentation (PST-1) ................................................................................................................... 39 C.6: IF staining of tubulin in fixed cells .............................................................................................................. 39
Part D: C. elegans experiments .......................................................................................................... 40 Part E: Mouse cremaster muscle experiment ................................................................................... 41 Appendix 1: Photoisomerisation parameter space .......................................................................... 42
Rationale for the quantities to be measured by in vitro studies: .......................................................................... 42 Defining and determining εE(λ) and εZ(λ), PSS(λ), τ, and E(λ): .......................................................................... 44 A note on photoisomerisations at wavelengths above 530 nm ............................................................................ 46

Borowiak, et al., Trauner* and Thorn-Seshold* 2015 Supp. Page 4 Photoswitchable inhibitors of microtubule dynamics optically control mitosis and cell death
Appendix 2: PhotoCan “Disco” cell culture lighting system ........................................................... 47 Disco system – in practice ................................................................................................................................... 47 Disco system – Switchboards .............................................................................................................................. 47 Disco system – LED arrays ................................................................................................................................. 48 Disco system – Arduino program 1 ..................................................................................................................... 49 Disco system – Arduino program 2 ..................................................................................................................... 51
Appendix 3: PST design and handling .............................................................................................. 54 Choice of Prodrug Strategies for PSTs ................................................................................................................ 54 Solubility and Handling ....................................................................................................................................... 55
Appendix 4: Photopharmacology: design, rationale, applications ................................................. 57 From Principles to Biological Assay Design: Rationale ..................................................................................... 57 cis-activity, dual targeting and other advantages for spatial precision ................................................................ 58 Temporal modulation of photopharmaceuticals .................................................................................................. 59
Supplemental References ................................................................................................................... 62
Borowiak, et al., Trauner* and Thorn-Seshold* 2015 Supp. Page 5 Photoswitchable inhibitors of microtubule dynamics optically control mitosis and cell death
Part A: Chemical Synthesis and Characterisation
Conventions Diazene geometry and nomenclature: Azobenzenes are drawn by default in their Z-isomeric form in
these Part A synthetic descriptions. This is intended to enable easier comparison with the SAR
literature of their isosteric antitubulin stilbenes and stilbenoids such as the combretastatins. However,
this should be understood to imply either or both of the E & Z forms constituting a given sample
depending on light exposure, therefore by default they are also named without E/Z-designations.
Abbreviations: The following nonstandard abbreviations are used: Hx – distilled isohexanes, Cy –
cyclohexane, EA – ethyl acetate, peth – petroleum ether (40-60° fraction), DCM – dichloromethane,
TFA – 2,2,2-trifluoroacetic acid, Et – ethyl, Ac – acetyl, Me – methyl, MeCN – acetonitrile, iPr –
isopropyl, iPen – iso-pentyl, Bu – butyl, DMAP – 4-(dimethylamino)pyridine, DBU – 1,8-
diazabicycloundec-7-ene, DMAP – 4-dimethylaminopyridine, iPenONO – isopentyl nitrite, HOBt –
1-hydroxybenzotriazole, DCC – dicyclohexylcarbodiimide, DMF – dimethylformamide, brsm – based
on recovered starting material, TBS – tert-butyldimethylsilyl, PBS – phosphate buffer saline, Ts or
tosyl – para-toluenesulfonyl, Boc – tert-butoxycarbonyl, Ser – L-serinyl, Leu – L-leucyl, CA4 -
combretastatin A-4, CA4P – combretastatin A-4 phosphate ester disodium salt, brsm – based on
recovered starting material, wt% - percentage by weight.
Reagents and Conditions: Unless stated otherwise, (1) all reactions and characterisations were
performed with unpurified, undried, non-degassed solvents and reagents, used as obtained, under
closed air atmosphere without special precautions; (2) “hexane” used for chromatography was
distilled from commercial crude isohexane fraction on rotavap; (3) “column” and “chromatography”
refer to flash column chromatography, which was performed on Merck silica gel Si-60 (40-63 µm);
(4) procedures and yields are unoptimised; (5) yields refer to isolated chromatographically and
spectroscopically pure materials, corrected for residual solvent content; (6) all eluent and solvent
mixtures are given as volume ratios unless otherwise specified, thus “1:1 Cy:EA” indicates a 1:1
mixture (by volume) of cyclohexane and ethyl acetate.
Thin-layer chromatography (TLC) was run on 0.25 mm Merck silica gel plates (60, F-254). UV light
(254 nm) was used as a visualising agent, and standard TLC dips based on p-anisaldehyde (Anis),
Hanessian’s cerium ammonium molybdate formulation (Han), 0.6% methanolic FeCl3 (FeCl3), basic
KMnO4 (KMnO4), phosphomolybdic acid (PMA), Dragendorff’s reagent (Drag), vanillin (Van) and
ninhydrin (Nin) - followed by heating where necessary - were used as developing agents. Rf values
were usually determined in hexane:ethyl acetate (Hx:EA) or cyclohexane:ethyl acetate (Cy:EA)
eluents. TLC characterisations are thus abbreviated as per (Rf = 0.09 on 6:1 Hx:EA, Anis).
NMR: Standard NMR characterisation was by 1H- and 13C-NMR spectra. Known compounds were
checked against literature data and their spectral analysis is not detailed unless necessary.
Borowiak, et al., Trauner* and Thorn-Seshold* 2015 Supp. Page 6 Photoswitchable inhibitors of microtubule dynamics optically control mitosis and cell death
Spectrometers used were Bruker DPX 200 (200 MHz & 50 MHz for 1H and 13C respectively), Varian
VNMRS 300 (300 MHz, 75 MHz and 282 MHz for 1H, 13C and 19F respectively), Bruker Ascend 400
(400 MHz & 100 MHz for 1H and 13C respectively), Bruker AVANCE 500 (500 MHz & 125 MHz for 1H and 13C respectively), as indicated, at 300K. Where not indicated otherwise, the NMR solvent was
CDCl3. Chemical shifts (δ) are reported in ppm calibrated to residual non-perdeuterated solvent as an
internal reference (Gottlieb et al., 1997). The following peak descriptions are used: singlet (s), doublet
(d), triplet (t), quartet (q), multiplet (m), broad (br); apparent multiplicities (resolved by 2D
experiments or determined by complete spectral assignment) are denoted by a tilde, eg. “doublet of
doublets, appears as a triplet with apparent coupling constant J = 3 Hz” is denoted (~t, 3 Hz).
Mass Spectra: Unit mass measurements were performed on AGILENT 1100 SL and AGILENT 1200
SL coupled LC-MS systems with ESI mode ionisation, with binary eluent mixtures of water-
acetonitrile, with the water containing sodium/ammonium formate or formic acid. Both direct
injection of the sample (abbreviated DIMS) and LCMS were performed as specified. For LCMS,
standard run conditions used an Eclipse Plus 3.5 µm / 4.6×100 mm C18 column, maintained at 25 °C,
with a 2 mL/min flow rate, whereby the solvent front eluted at tret = 0.76 min. A linear gradient of
eluent composition from 90:10→10:90 water:acetonitrile was applied over the first 4.5 min, then
10:90 maintained until all peaks of interest had been observed (typically a further 3 min). Ion peaks
from (positive/negative mode) are reported as (+/-) with units Th (m/z). Thus “LCMS(+): tret = 5.60 &
5.82 min, each 419 Th = [MH]+” indicates LCMS under the standard run conditions with ESI
ionisation giving two positive ion peaks eluting at 5.60 and 5.82 min retention times, each at
m/z = 419 Th, attributed as the protonated molecular ion. Unless stated otherwise, all reported peaks
in the positive mode were [MH]+ peaks, and all observed peaks in the negative mode were [M-H]-
peaks. HRMS was carried out by the Service Central d’Analyse du CNRS, Solaize, France, and by the
Zentrale Analytik of the LMU, Munich using ESI or EI ionisation as specified.
Standard Procedures Where Standard Procedures were used in synthesis, unless stated otherwise, the amounts of
reactants/reagents employed were implicitly adjusted to maintain the same molar ratios as in the given
Procedure, and no other alterations from the Standard Procedure (eg reaction time, extraction solvent,
temperature) were made, unless stated otherwise.
Standard Procedure A: Diazo Coupling using isopentyl nitrite
To the aniline (1 mmol) were added MeOH (5 mL) and conc. HCl (0.25 mL), and the mixture cooled
in an icebath. A solution of isopentyl nitrite (1.02 mmol) in methanol (0.6 mL) was added dropwise
and the reaction stirred for 30 min in the cold. A cold solution of the phenol (1.05 mmol) in methanol
(2 mL) and NaOH (2.0 M, 1.8 mL) was prepared, and to it was added the solution of the diazonium,
Borowiak, et al., Trauner* and Thorn-Seshold* 2015 Supp. Page 7 Photoswitchable inhibitors of microtubule dynamics optically control mitosis and cell death
dropwise over 1 minute. After typically 30 minutes stirring in the cold, the pH was adjusted to 7 with
phosphate buffer, chloroform (10 mL) was added, and the aqueous phase was extracted with CHCl3
(2×10 mL). The combined organic layers were washed with water (15 mL) and brine (10 mL), dried
on Na2SO4, filtered and concentrated. Chromatography with a Hx:EA gradient was used to separate
the para-phenolic azobenzene product which typically ran as a single isomer during chromatography.
Standard Procedure B: Phenol methylation in acetone
To the phenol (1 mmol) were added K2CO3 (3 mmol), technical grade acetone (10 mL), and MeI
(2 mmol), and the mixture stirred at RT for 2-12 h, until TLC showed satisfactory conversion. TLC
often separated the E/Z azobenzene isomers, with the major spot being the faster-running E isomer;
the Z isomer typically appeared at near-identical Rf to that of the phenol starting material. The
volatiles were evaporated on the rotavap, then the crude mixture was separated by chromatography
with a Hx:EA gradient. Since the para-O-methylated E and Z product isomers typically were
separable by chromatography, the crude product could be kept in the dark overnight and protected
from light during loading and chromatography (eg wrapping the column with aluminium foil) to
ensure cleaner separation of the desired product (as the E isomer) from other impurities, though this
was typically not necessary.
Standard Procedure C: Phenol methylation using MeI and Ag2CO3 in toluene
To the phenol (1 mmol) in a screw-cap pressure tube were added toluene (6 mL), Ag2CO3 (1 mmol,
supported on Celite or not), and MeI (1.5 mmol). The tube was sealed, protected from light, and the
reaction heated to 110ºC overnight with stirring. After cooling, the crude reaction mixture was
filtered, the residue washed with chloroform (2 mL), and the combined filtrates concentrated and
separated on column as for Standard Procedure B.
Standard Procedure D: Diazo Coupling using HNO2
The aniline (1 mmol) was dissolved in aqueous HCl (1.2 M, 0.95 mL), diluted with water (3 mL) and
cooled in an icebath while a cold aqueous solution of NaNO2 (0.85 M, 1 mL, 1.2 eq) was added
dropwise with stirring. Stirring in the icebath was continued for 6 min, then a cold aqueous solution of
NaOH (1.0 M, 0.65 mL) was added dropwise followed by a cold solution of the phenol (1.05 mmol)
in THF (4 mL). After four minutes stirring, the pH was adjusted to 8 with phosphate buffer, and
stirring in the cold continued for 5 min before chloroform (4 mL) was added. The aqueous phase was
extracted with CHCl3 (2×8 mL), then the combined organic layers were washed with water (12 mL)
and brine (10 mL), dried on Na2SO4, filtered and concentrated. Chromatography with a Hx:EA
gradient was used to separate the azobenzene product; significant quantities of byproducts were
usually obtained.
Borowiak, et al., Trauner* and Thorn-Seshold* 2015 Supp. Page 8 Photoswitchable inhibitors of microtubule dynamics optically control mitosis and cell death
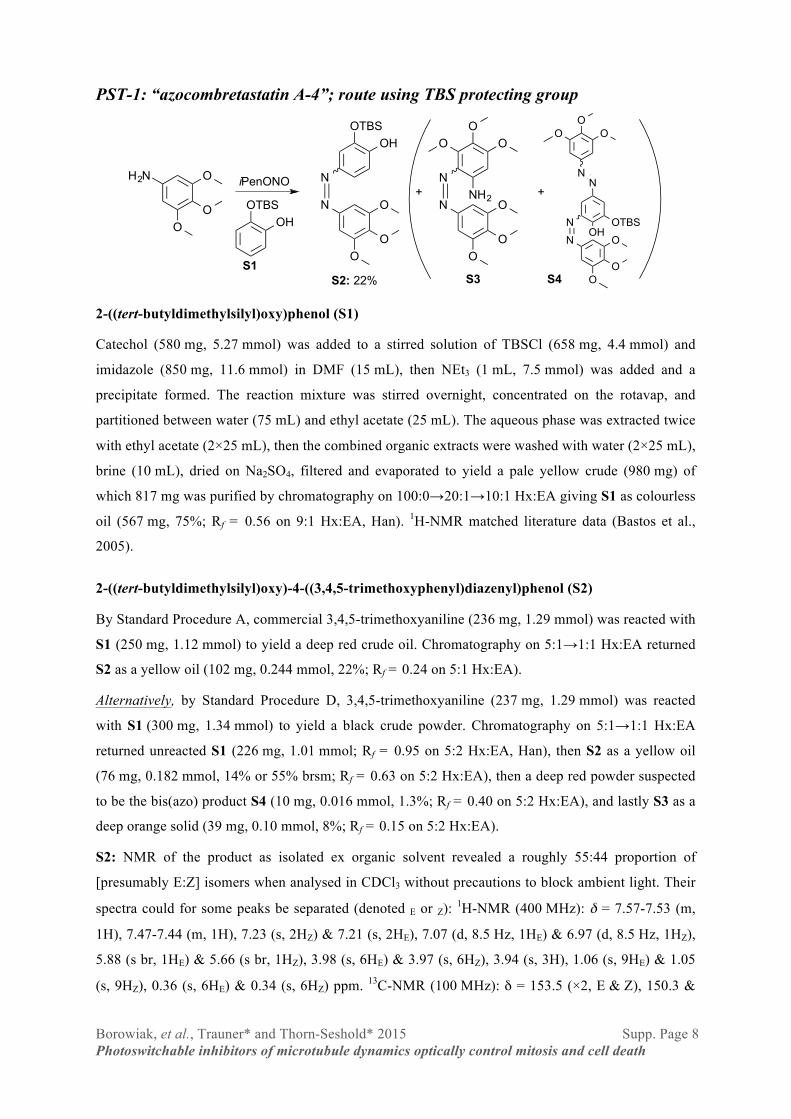
PST-1: “azocombretastatin A-4”; route using TBS protecting group
2-((tert-butyldimethylsilyl)oxy)phenol (S1)
Catechol (580 mg, 5.27 mmol) was added to a stirred solution of TBSCl (658 mg, 4.4 mmol) and
imidazole (850 mg, 11.6 mmol) in DMF (15 mL), then NEt3 (1 mL, 7.5 mmol) was added and a
precipitate formed. The reaction mixture was stirred overnight, concentrated on the rotavap, and
partitioned between water (75 mL) and ethyl acetate (25 mL). The aqueous phase was extracted twice
with ethyl acetate (2×25 mL), then the combined organic extracts were washed with water (2×25 mL),
brine (10 mL), dried on Na2SO4, filtered and evaporated to yield a pale yellow crude (980 mg) of
which 817 mg was purified by chromatography on 100:0→20:1→10:1 Hx:EA giving S1 as colourless
oil (567 mg, 75%; Rf = 0.56 on 9:1 Hx:EA, Han). 1H-NMR matched literature data (Bastos et al.,
2005).
2-((tert-butyldimethylsilyl)oxy)-4-((3,4,5-trimethoxyphenyl)diazenyl)phenol (S2)
By Standard Procedure A, commercial 3,4,5-trimethoxyaniline (236 mg, 1.29 mmol) was reacted with
S1 (250 mg, 1.12 mmol) to yield a deep red crude oil. Chromatography on 5:1→1:1 Hx:EA returned
S2 as a yellow oil (102 mg, 0.244 mmol, 22%; Rf = 0.24 on 5:1 Hx:EA).
Alternatively, by Standard Procedure D, 3,4,5-trimethoxyaniline (237 mg, 1.29 mmol) was reacted
with S1 (300 mg, 1.34 mmol) to yield a black crude powder. Chromatography on 5:1→1:1 Hx:EA
returned unreacted S1 (226 mg, 1.01 mmol; Rf = 0.95 on 5:2 Hx:EA, Han), then S2 as a yellow oil
(76 mg, 0.182 mmol, 14% or 55% brsm; Rf = 0.63 on 5:2 Hx:EA), then a deep red powder suspected
to be the bis(azo) product S4 (10 mg, 0.016 mmol, 1.3%; Rf = 0.40 on 5:2 Hx:EA), and lastly S3 as a
deep orange solid (39 mg, 0.10 mmol, 8%; Rf = 0.15 on 5:2 Hx:EA).
S2: NMR of the product as isolated ex organic solvent revealed a roughly 55:44 proportion of
[presumably E:Z] isomers when analysed in CDCl3 without precautions to block ambient light. Their
spectra could for some peaks be separated (denoted E or Z): 1H-NMR (400 MHz): δ = 7.57-7.53 (m,
1H), 7.47-7.44 (m, 1H), 7.23 (s, 2HZ) & 7.21 (s, 2HE), 7.07 (d, 8.5 Hz, 1HE) & 6.97 (d, 8.5 Hz, 1HZ),
5.88 (s br, 1HE) & 5.66 (s br, 1HZ), 3.98 (s, 6HE) & 3.97 (s, 6HZ), 3.94 (s, 3H), 1.06 (s, 9HE) & 1.05
(s, 9HZ), 0.36 (s, 6HE) & 0.34 (s, 6HZ) ppm. 13C-NMR (100 MHz): δ = 153.5 (×2, E & Z), 150.3 &
N
N
OH
OO
O
OTBS
H2N
OHOO
O
OTBS
iPenONO
S1S2: 22%
N
N
O
OO
O
OO
NH2+
S3 S4
OO
O
N
OH
N
OTBS
O
OO
N
N
+
Borowiak, et al., Trauner* and Thorn-Seshold* 2015 Supp. Page 9 Photoswitchable inhibitors of microtubule dynamics optically control mitosis and cell death
148.6 (E & Z), 148.5 & 142.9 (E & Z), 147.9 (E & Z), 146.5 & 145.4 (E & Z), 140.2 & 140.1
(E & Z), 119.6 & 118.1 (E & Z), 117.5 & 114.6 (Z & E), 110.7 & 106.9 (E & Z), 100.2 & 100.1 (×2,
E & Z), 61.0 (E & Z), 56.2 & 56.2 (×2, E & Z), 25.8 & 25.7 (×3, E & Z), 18.3 & 18.2 (E & Z), -4.2
& -4.3 (×3, E & Z) ppm. LCMS(+): tret = 5.60 & 5.82 min, each 419 Th = [MH]+: these peaks were
assigned to the Z & E isomers respectively since the UV absorption profile of the first peak showed
an absorption shoulder between 450-510 nm (Z), while the second peak was more intense especially
between 320-380 nm (E) but without a shoulder. HRMS (ESI+) calcd for
[C21H33N2O6Si]+ = [M·H3O+]: m/z 437.210, found 437.236.
3,4,5-trimethoxy-2-((3,4,5-trimethoxyphenyl)diazenyl)aniline (S3)
S3 was isolated as a deep orange solid (39 mg, 0.103 mmol, 8%; Rf = 0.15 on 5:2 Hx:EA) during
Standard Procedure D for S2. Its formation might be due either to direct attack of the aniline on the
diazonium with Nietzki rearrangement of the triazene product, or else to ortho-attack of the aniline on
the diazonium. 1H-NMR (400 MHz): δ = 7.14 (s, 2H), 6.83 (s br, 2H), 5.96 (s, 1H), 4.08 (s, 3H), 3.96
(s, 6H), 3.92 (s, 3H), 3.89 (s, 3H), 3.88 (s, 3H) ppm. 13C-NMR (100 MHz): δ = 157.3, 153.7, 153.6
(×2), 149.5, 139.0 (×2), 134.1, 124.9, 98.9 (×2), 93.7, 63.1, 61.6, 61.0, 56.1 (×2), 55.8 ppm.
LCMS(+): tret = 4.0 min, 378 Th = [MH]+. HRMS (ESI+) calcd for [C18H24N3O6]+ = [MH+]: m/z
378.1660, found 378.1657. S3 crystallised from slow evaporation of a chloroform solution; single
crystal X-ray diffraction confirmed the structural assignment (full data are available through the
CCDC, with deposition #1028006).
2-((tert-butyldimethylsilyl)oxy)-4-((3,4,5-trimethoxyphenyl)diazenyl)-6-((3,4,5-
trimethoxyphenyl)diazenyl)phenol (S4)
Trace S4 was isolated as a deep red powder (10 mg, 0.016 mmol, 1.3%; Rf = 0.40 on 5:2 Hx:EA)
during Standard Procedure D for S2, and assigned the given structure on the basis of its HRMS and 1H-NMR. 1H-NMR (400 MHz): δ = 7.42 (s, 1H), 7.38 (s, 1H), 7.32 (s, 2H), 7.29 (s, 2H), 3.96 (s, 3H),
3.95 (s, 3H), 3.95 (s, 6H), 3.94 (s, 6H), 1.08 (s, 9H), 0.40 (s, 6H). HRMS (ESI+) calcd for
[C30H41N4O8]+ = [MH+]: m/z 613.2688, found 613.2693.
Borowiak, et al., Trauner* and Thorn-Seshold* 2015 Supp. Page 10 Photoswitchable inhibitors of microtubule dynamics optically control mitosis and cell death
2-methoxy-5-((3,4,5-trimethoxyphenyl)diazenyl)phenol (“azocombretastatin A-4”, PST-1)
By Standard Procedure B, S2 (100 mg, 0.23 mmol) was methylated in acetone (5 mL) using MeI
(80 mg, 0.56 mmol) and K2CO3 (420 mg, 3 mmol). After evaporation of the volatiles, the residue was
partitioned between CHCl3 (10 mL) and aqueous phosphate buffer (pH=3), extracted with CHCl3
(2×10 mL), and pad filtered on silica using 2.4:1 Hx:EA eluent, yielding 94 mg crude red oil. To this
under nitrogen atmosphere were added MeCN (6 mL) and HF (70% in pyridine, 165 mg), and the
reaction stirred for 15 minutes. CaCO3 (1.0 g), CaCl2 (0.5 g) and water (10 mL) were added to quench
excess HF, the pH adjusted to 3 with KH2PO4, then the mixture was extracted with CHCl3 (3×10 mL).
The combined organic layers were washed with brine (10 mL), dried on Na2SO4, filtered and
concentrated to a black crude powder (70 mg). Flash chromatography with 5:1→2.4:1 Hx:EA in the
dark (aluminium foil wrapped around the column) separated the three crude components cleanly
without problems due to the different Rf values of their E and Z isomers, giving S5 (6 mg,
0.014 mmol, 6%), then S6 (5 mg, 0.015 mmol, 6%), then PST-1 (14 mg, 0.044 mmol, 19 % over 2
steps).
Alternatively, to S2 (73 mg, 0.175 mmol) were added K2CO3 (44 mg, 0.32 mmol), dry DMF (2 mL),
and MeI (1.37 g of a 4.3 wt% solution in DMF, 0.43 mmol), and the mixture stirred at RT for 2 h until
TLC (5:1 Hx:EA) showed complete conversion of the starting material to a faster-running product,
presumably S5. The volatiles were evaporated at 60 °C and 5 mbar, then THF (8 mL) and an aqueous
solution of KF (1 M, 5 mL) were added to the residue and the mixture stirred at RT for 3h 30 min.
The bulk of the THF was removed on the rotavap, then water (15 mL), brine (2 mL), and
KH2PO4/K2HPO4 buffer (2 M, pH=6.8, 4 mL) were added and the aqueous phase extracted with
dichloromethane (3×15 mL). The combined organic layers were washed with water (15 mL) and brine
(10 mL) and dried on Na2SO4, filtered and concentrated to a crude oil. Flash chromatography with a
very gentle gradient covering 5:1→2.4:1 Hx:EA returned protected S5 (12.0 mg, 0.028 mmol, 16%),
then S6 (8.0 mg, 0.024 mmol, 14%), then PST-1 (19.7 mg, 0.062 mmol, 35% over 2 steps).
PST-1: Rf (E/Z)= 0.36 and 0.18 on 1.7:1 Hx:EA (Anis), orange solid. NMR of the product as isolated
with blocking ambient light revealed a single geometric isomer. 1H-NMR (400 MHz): δ = 7.59-7.53
(m, 1H), 7.24 (s, 2H), 7.00 (d, 8.4 Hz, 1H), 5.84-5.66 (s br, 1H), 4.01 (s, 3H), 3.99 (s, 6H), 3.95 (s,
N
N
OH
OO
O
OTBS
S2
N
N
OMe
OO
O
OTBS
S5
N
N
OMe
OO
O
OH
PST-1"azocombretastatin A-4"
MeIK2CO3
DMF or Me2CO
KF or HFN
N
OMe
OO
O
OMe
S6
+
Borowiak, et al., Trauner* and Thorn-Seshold* 2015 Supp. Page 11 Photoswitchable inhibitors of microtubule dynamics optically control mitosis and cell death
3H) ppm. 13C-NMR (100 MHz): δ = 153.5 (×2), 149.2, 148.5, 147.3, 146.2, 140.2, 119.0, 110.1,
106.0, 100.2 (×2), 61.0, 56.2 (×2), 56.2 ppm. LCMS(+): tret = 3.12 & 3.89 min, each 319 Th = [MH]+:
these peaks were assigned to the cis & trans isomers respectively since the first peak had a secondary
absorption band at 445 nm. HRMS (EI+) calcd for [C16H18N2O5]+ = [M+]: m/z 318.1288, found
318.1287. PST-1 crystallised from slow evaporation of a chloroform/ethyl acetate solution; single
crystal X-ray diffraction confirmed the structural assignment (full data are available through the
CCDC, with deposition #1053581).
1-(4-((tert-butyldimethylsilyl)oxy)-3-methoxyphenyl)-2-(3,4,5-trimethoxyphenyl)diazene (S5)
S5 was isolated as a yellow solid (Rf (E/Z)= 0.65 and 0.45 on 2.4:1 Hx:EA (Anis)) during the above
procedures for PST-1. NMR of the product taken with precautions to block ambient light revealed a
single geometric isomer. 1H-NMR (400 MHz): δ = 7.61 (dd, 8.6 & 2.4 Hz, 1H), 7.48 (d, 2.4 Hz, 1H),
7.23 (s, 2H), 6.99 (d, 8.7 Hz, 1H), 3.99 (s, 6H), 3.95 (s, 3H), 3.92 (s, 3H), 1.05 (s, 9H), 0.23 (s, 6H)
ppm. 13C-NMR (100 MHz): δ = 154.1, 153.6 (×2), 148.6, 146.9, 145.7, 140.3, 119.7, 113.5, 111.3,
100.3 (×2), 61.2, 56.4 (×2), 55.7, 25.9 (×3), 18.7, -4.4, -4.5 ppm. LCMS(+): tret = 5.40 & 6.75 min,
each 433.1 Th = [MH]+: these peaks were assigned to the Z & E isomers respectively since the UV
absorption profile from 350-390 nm of the first peak (Z) was far weaker than that of the second peak
(E) although the integrals on the MSD were almost identical. HRMS (ESI+) calcd for
[C22H33N2O5Si]+ = [MH+]: m/z 433.21533, found 433.21532.
1-(3,4-dimethoxyphenyl)-2-(3,4,5-trimethoxyphenyl)diazene (S6)
S6 was isolated as a yellow solid (Rf (E/Z)= 0.34 and 0.14 on 2.4:1 Hx:EA; Rf (E/Z)= 0.53 and 0.28
on 1.7:1 Hx:EA (Anis)) during the above procedures for PST-1. NMR of the product taken with
precautions to block ambient light revealed a single geometric isomer. 1H-NMR (400 MHz): δ = 7.65
(dd, 8.5 & 2.2 Hz, 1H), 7.54 (d, 2.2 Hz, 1H), 7.26 (s, 2H), 7.03 (d, 8.5 Hz, 1H), 4.02 (s, 3H), 4.01 (s,
3H), 4.00 (s, 6H), 3.95 (s, 3H) ppm. 13C-NMR (100 MHz, CD3CN): δ = 154.3 (×2), 152.8, 150.4,
149.1, 147.1, 140.8, 120.9, 111.6, 102.4, 100.5, 60.6, 56.3 (×2), 56.2, 55.9 ppm. LCMS(+): tret = 3.45
& 4.35 min, each 333.1 Th = [MH]+: these peaks were assigned to the Z & E isomers respectively
since the first peak had a secondary absorption band at 440 nm. HRMS (ESI+) calcd for
[C17H21N2O5]+ = [MH+]: m/z 333.1445, found 333.1443.
Borowiak, et al., Trauner* and Thorn-Seshold* 2015 Supp. Page 12 Photoswitchable inhibitors of microtubule dynamics optically control mitosis and cell death
PST-1: alternative route using tosyl protecting group An alternative synthesis gave PST-1 without byproduct S6.
2-hydroxy-5-((3,4,5-trimethoxyphenyl)diazenyl)phenyl 4-methylbenzenesulfonate (S7)
Commercial 3,4,5-trimethoxyaniline (1.045 g, 5.71 mmol) was reacted with known 2-hydroxyphenyl
4-para-toluenesulfonate (Bailey et al., 2004) (1.508 g, 5.71 mmol) by Standard Procedure A except
that stirring of the mixture of phenolate and diazonium was continued for 5 h at 0 °C to for greater
conversion. Following workup, the deep red crude oil was chromatographed on 5:1→1:1 Hx:EA
returning S7 as a yellow oil (1.130 g, 2.47 mmol, 43%; Rf = 0.43 on 1:1 Hx:EA). 1H-NMR
(400 MHz): δ = 7.76 (d, 8.4 Hz, 2H), 7.72 (dd, 8.7 & 2.3 Hz, 1H), 7.51 (d, 2.3 Hz, 1H), 7.29 (dd, 8.5
& 0.8 Hz, 2H), 7.11 (s, 2H), 7.04 (d, 8.7 Hz, 1H), 3.89 (s, 6H), 3.86 (s, 3H), 2.39 (s, 3H) ppm. 13C-NMR (100 MHz): δ = 153.5 (×2), 150.7, 148.1, 146.4, 146.4, 140.7, 137.3, 131.2, 130.1 (×2),
128.7 (×2), 124.0, 118.1, 117.4, 100.4 (×2), 61.1, 56.2 (×2), 21.8 ppm. LCMS(+): tret = 4.60 min,
459 Th = [MH]+. HRMS (ESI+) calcd for [C22H23N2O7S]+ = [MH+]: m/z 459.12205, found
459.12168.
2-methoxy-5-((3,4,5-trimethoxyphenyl)diazenyl)phenyl 4-methylbenzenesulfonate (S8)
By Standard Procedure B, S7 (700 mg, 1.53 mmol) was methylated overnight. Chromatography of the
red crude solid on 5:1→1:1 Hx:EA returned S8 (712 mg, 1.51 mmol, 99%; Rf = 0.62 and 0.46 on 1:1
Hx:EA, FeCl3; E and Z isomers) as a red oil. 1H-NMR (400 MHz, DMSO-d6): δ = 7.93 (dd, 8.8 &
2.4 Hz, 1H), 7.75 (d, 8.4 Hz, 2H), 7.63 (d, 2.4 Hz, 1H), 7.49 (d, 8.5 Hz, 2H), 7.28 (d, 8.9 Hz, 1H),
7.23 (s, 2H), 3.91 (s, 6H), 3.77 (s, 3H), 3.61 (s, 3H), 2.44 (s, 3H) ppm. 13C-NMR (100 MHz, DMSO-
d6): δ = 154.2, 153.8 (×2), 148.0, 146.3, 145.6, 140.7, 138.5, 132.3, 130.4 (×2), 128.8 (×2), 126.2,
115.6, 113.9, 100.7 (×2), 60.7, 56.6, 56.5 (×2), 21.6 ppm. LCMS(+): tret = 4.48 & 5.17 min, 473 Th =
[MH]+: these peaks were assigned to the cis & trans isomers respectively since the UV absorption
profile of the first peak (cis) featured a shoulder centred around 450 nm. HRMS (ESI+) calcd for
[C23H25N2O7S]+ = [MH+]: m/z 473.13770, found 473.13730.
N
N
OH
OO
O
OTs
S7
N
N
OMe
OO
O
OH
PST-1
MeIKOH,
MeOH, ΔH2N
OO
O
1) ONO
2)OH
OTs
43 %
N
N
OMe
OO
O
OTs
S8
99 % 92 %
Borowiak, et al., Trauner* and Thorn-Seshold* 2015 Supp. Page 13 Photoswitchable inhibitors of microtubule dynamics optically control mitosis and cell death
2-methoxy-5-((3,4,5-trimethoxyphenyl)diazenyl)phenol, “azocombretastatin A-4” (PST-1)
To S8 (525 mg, 1.10 mmol) were added KOH (1.25 g) and MeOH (25 mL) and the solution heated to
80 °C for 1 hour. After evaporation of the volatiles, the residue was partitioned between EtOAc
(20 mL) and aqueous KH2PO4 solution (10%, 30 mL), then the aqueous layer was extracted with
EtOAc (2×10 mL). The combined organic layers were washed with water (20 mL), brine (10 mL),
dried on Na2SO4, filtered and concentrated. The crude oil was chromatographed on 5:1→1:1 Hx:EA,
giving PST-1 (320 mg, 1.01 mmol, 92%) as an orange solid, identical by NMR and LCMS to that
synthesised previously from S2.
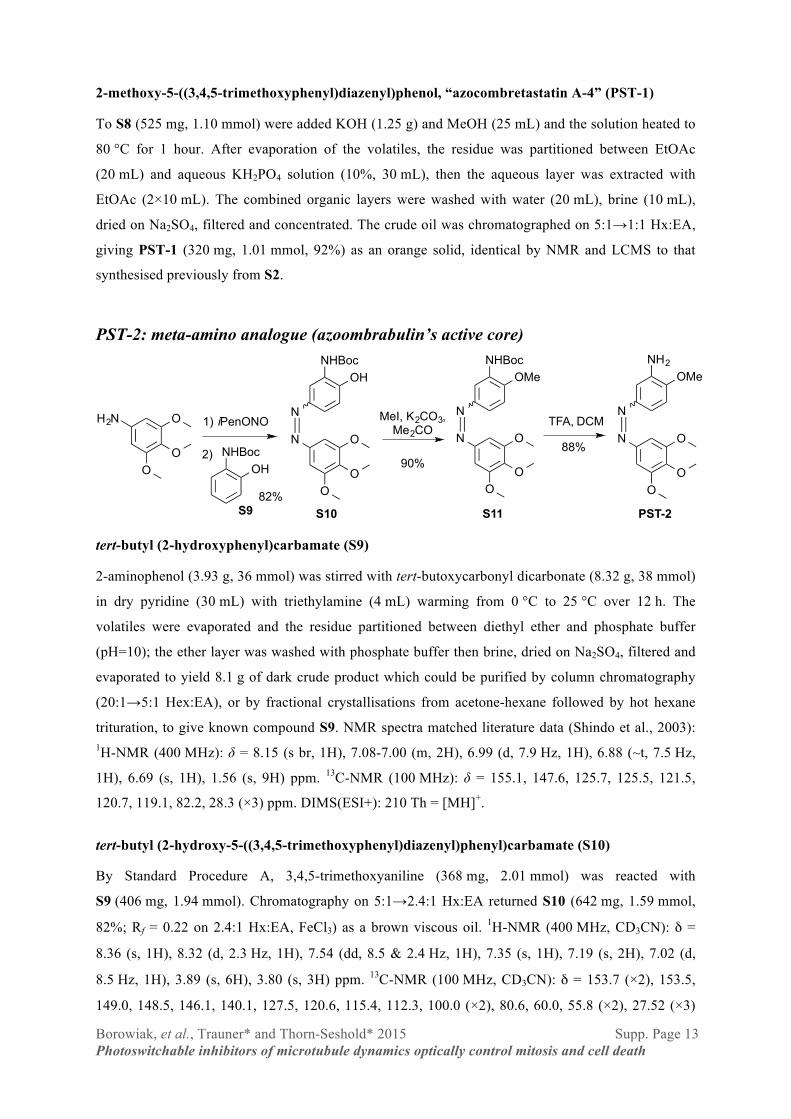
PST-2: meta-amino analogue (azoombrabulin’s active core)
tert-butyl (2-hydroxyphenyl)carbamate (S9)
2-aminophenol (3.93 g, 36 mmol) was stirred with tert-butoxycarbonyl dicarbonate (8.32 g, 38 mmol)
in dry pyridine (30 mL) with triethylamine (4 mL) warming from 0 °C to 25 °C over 12 h. The
volatiles were evaporated and the residue partitioned between diethyl ether and phosphate buffer
(pH=10); the ether layer was washed with phosphate buffer then brine, dried on Na2SO4, filtered and
evaporated to yield 8.1 g of dark crude product which could be purified by column chromatography
(20:1→5:1 Hex:EA), or by fractional crystallisations from acetone-hexane followed by hot hexane
trituration, to give known compound S9. NMR spectra matched literature data (Shindo et al., 2003): 1H-NMR (400 MHz): δ = 8.15 (s br, 1H), 7.08-7.00 (m, 2H), 6.99 (d, 7.9 Hz, 1H), 6.88 (~t, 7.5 Hz,
1H), 6.69 (s, 1H), 1.56 (s, 9H) ppm. 13C-NMR (100 MHz): δ = 155.1, 147.6, 125.7, 125.5, 121.5,
120.7, 119.1, 82.2, 28.3 (×3) ppm. DIMS(ESI+): 210 Th = [MH]+.
tert-butyl (2-hydroxy-5-((3,4,5-trimethoxyphenyl)diazenyl)phenyl)carbamate (S10)
By Standard Procedure A, 3,4,5-trimethoxyaniline (368 mg, 2.01 mmol) was reacted with
S9 (406 mg, 1.94 mmol). Chromatography on 5:1→2.4:1 Hx:EA returned S10 (642 mg, 1.59 mmol,
82%; Rf = 0.22 on 2.4:1 Hx:EA, FeCl3) as a brown viscous oil. 1H-NMR (400 MHz, CD3CN): δ =
8.36 (s, 1H), 8.32 (d, 2.3 Hz, 1H), 7.54 (dd, 8.5 & 2.4 Hz, 1H), 7.35 (s, 1H), 7.19 (s, 2H), 7.02 (d,
8.5 Hz, 1H), 3.89 (s, 6H), 3.80 (s, 3H) ppm. 13C-NMR (100 MHz, CD3CN): δ = 153.7 (×2), 153.5,
149.0, 148.5, 146.1, 140.1, 127.5, 120.6, 115.4, 112.3, 100.0 (×2), 80.6, 60.0, 55.8 (×2), 27.52 (×3)
N
N
OH
OO
O
NHBoc
H2N
OO
O
S10
N
N
OMe
OO
O
NH2
PST-2
N
N
OMe
OO
O
NHBoc
MeI, K2CO3,Me2CO
S1182%
90%88%
TFA, DCM
2)OH
NHBoc
S9
1) iPenONO
Borowiak, et al., Trauner* and Thorn-Seshold* 2015 Supp. Page 14 Photoswitchable inhibitors of microtubule dynamics optically control mitosis and cell death
ppm. LCMS(+): tret = 4.65 min, 404 Th = [MH]+. HRMS (ESI+) calcd for [C20H26N3O6]+ = [MH+]:
m/z 404.1816, found 404.1817.
tert-butyl (2-methoxy-5-((3,4,5-trimethoxyphenyl)diazenyl)phenyl)carbamate (S11)
By Standard Procedure B, S10 (637 mg, 1.58 mmol) was methylated overnight with MeI (448 mg,
3.13 mmol) and K2CO3 (873 mg, 6.32 mmol). Chromatography of the black crude solid on 5:1→2.4:1
Hx:EA returned S11 (593 mg, 1.42 mmol, 90%; Rf = 0.41 on 2.4:1 Hx:EA, FeCl3) as a red oil. 1H-NMR (400 MHz): δ = 8.64 (s br, 1H), 7.58 (dd, 8.7 & 2.4 Hz, 1H), 7.20 (s, 2H), 7.09 (s, 1H), 6.90
(d, 8.7 Hz, 1H), 3.90 (s, 9H), 3.86 (s, 3H), 1.49 (s, 9H) ppm. 13C-NMR (100 MHz): δ = 153.4 (×2),
152.6, 149.8, 148.4, 146.7, 140.2, 128.8, 119.1, 111.2, 109.6, 100.4 (×2), 80.7, 61.0, 56.2 (×2), 56.0,
28.4 (×3) ppm. LCMS(+): tret = 4.57 & 5.42 min, 418 Th = [MH]+: these peaks were assigned to the Z
& E isomers respectively since the UV absorption profile of the first peak (Z) featured a shoulder
centred around 440 nm. HRMS (ESI+) calcd for [C21H28N3O6]+ = [MH+]: m/z 418.19726, found
418.19718.
2-methoxy-5-((3,4,5-trimethoxyphenyl)diazenyl)aniline (PST-2)
To S11 (590 mg, 1.41 mmol) were added CH2Cl2 (6 mL) and CF3COOH (5 mL) and the purple
solution stirred overnight at room temperature. The volatiles were removed under high vacuum, the
residual TFA neutralised with addition of CHCl3 (10 mL) and K2CO3 (618 mg) and the residue
chromatographed on 1:1:0→1:1:1 Hx:EA:MeOH, giving PST-2 as a green-black powder (394 mg,
1.24 mmol, 88 %; Rf = 0.56 on 1:1 Hx:EA (Van)). NMR when analysed in CDCl3 without precautions
to block ambient light showed two isomers in approximately 2:1 ratio [presumably trans and cis
forms, attributed by HSQC, denoted E and Z]. 1H-NMR (400 MHz): δ = 8.84 (s br, ‘1H’, NH2), 7.72
(dd, 8.5 & 1.9 Hz, 1HE), 7.58 (d, 2.2 Hz, 1HZ), 7.56 (d, 1.9 Hz, 1HE), 7.53 (dd, 8.6 & 2.4 Hz, 1HZ),
7.26 (d, 8.5 Hz, 1HE), 7.19 (s, 2HE), 7.16 (s, 2HZ), 6.90 (d, 8.6 Hz, 1HZ), 3.92-3.84 (m, 12HE & 12HZ)
ppm. 13C-NMR (100 MHz): δ = 153.6 & 153.5 (×2, E&Z), 151.6 & 149.4 (×1, E&Z), 148.5 & 148.1
(×1, E&Z), 146.8 & 145.7 (×1, E&Z), 140.8 & 140.2 (×1, E&Z), 130.0 (×1, E&Z), 121.7 & 120.7
(×1, E&Z), 110.4 & 110.3 (×1, E&Z), 110.1 & 101.3 (×1, E&Z), 100.5 & 100.2 (×2, E&Z), 61.1 &
61.0 (×1, E&Z), 56.2 & 56.2 (×2, E&Z), 56.1 (×1, E&Z) ppm. LCMS(+): tret = 3.04 & 3.94 min, each
318 Th = [MH]+: these peaks were assigned to the cis & trans isomers respectively as the first peak
featured an absorption shoulder at 450 nm which was absent in the second peak (trans). HRMS
(ESI+) calcd for [C16H20N3O4]+ = [MH+]: m/z 318.1448, found 318.1449.
Borowiak, et al., Trauner* and Thorn-Seshold* 2015 Supp. Page 15 Photoswitchable inhibitors of microtubule dynamics optically control mitosis and cell death
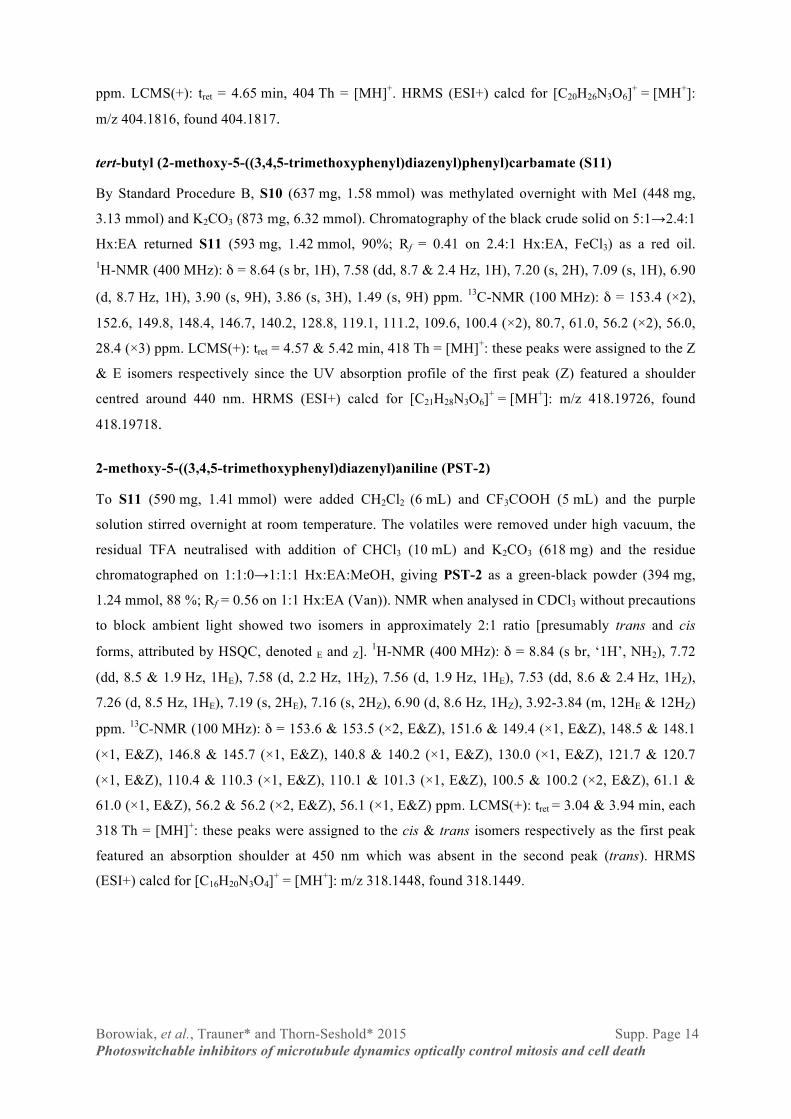
PST-3: meta-fluoro analogue
2-fluoro-4-((3,4,5-trimethoxyphenyl)diazenyl)phenol (S12)
By Standard Procedure A, 3,4,5-trimethoxyaniline (183 mg, 1.00 mmol) was reacted with 2-
fluorophenol (116 mg, 1.04 mmol). Chromatography on 5:1→2.5:1 Hx:EA returned S12 (198 mg,
0.65 mmol, 65%; Rf = 0.25 on 2.4:1 Hx:EA, KMnO4) as a yellow oil. 1H-NMR (400 MHz,
DMSO-d6): δ = 10.77 (s, 1H), 7.68 (∼t, 8.9 Hz, 1H), 7.18 (s, 2H), 6.80 (dd, 12.7 & 2.5 Hz, 1H), 6.74
(dd, 8.9 & 2.5 Hz, 1H), 3.88 (s, 6H), 3.76 (s, 3H) ppm. 13C-NMR (100 MHz, DMSO-d6) showed the
expected C-F couplings: δ = 162.8 (d, 12.1 Hz), 161.2 (d, 255.7 Hz), 153.8 (×2), 148.6, 140.3, 133.4
(d, 6.9 Hz), 119.0 (d, 2.0 Hz), 112.9 (d, 2.4 Hz), 103.8 (d, 21.8 Hz), 100.4 (×2), 60.7, 56.4 (×2) ppm.
HRMS (ESI-) calcd for [C15H14N2O4F]- = [M-H]-: m/z 305.09431, found 305.09433.
1-(3-fluoro-4-methoxyphenyl)-2-(3,4,5-trimethoxyphenyl)diazene (PST-3)
By Standard Procedure B, S17 (190 mg, 0.62 mmol) was methylated overnight. Chromatography on
10:1→4:1 Hx:EA cleanly returned S20 (173 mg, 0.54 mmol, 91%; Rf = 0.42 and 0.25 on 2.4:1
Hx:EA, FeCl3 : E and Z isomers) as fine orange crystals. 1H-NMR (400 MHz, DMSO-d6): δ = 7.75
(∼t, 9.0 Hz, 1H), 7.22 (s, 2H), 7.12 (dd, 13.0 & 2.6 Hz, 1H), 6.92 (ddd, 9.2 & 2.7 & 0.9 Hz, 1H), 3.89
(s, 6H), 3.89 (s, 3H), 3.77 (s, 3H) ppm. 13C-NMR (100 MHz, DMSO-d6) showed the expected C-F
couplings: δ = 163.8 (d, 11.2 Hz), 161.1 (d, 255.9 Hz), 153.8 (×2), 148.5, 140.6, 134.3 (d, 7.2 Hz),
118.8 (d, 2.1 Hz), 112.0 (d, 2.6 Hz), 102.7 (d, 23.4 Hz), 100.6 (×2), 60.7, 56.7, 56.4 (×2) ppm. 19F-NMR (282 MHz, DMSO-d6): δ = -121.31 (ddd, 13.2 & 8.8 & 1.1 Hz) ppm. LCMS(+): tret = 3.96
& 4.82 min, each 321 Th = [MH]+: these peaks were assigned to the Z & E isomers respectively since
the UV absorption profile of the first peak (Z) featured a shoulder centred at 445 nm which was
absent in the first peak. HRMS (EI+) calcd for [C16H17N2O4F]+ = [M]+: m/z 320.1172, found
320.1167.
N
N
OH
OO
O
F
H2N
OHO
O
O
F
S12
N
N
OMe
OO
O
F
MeI, K2CO3
Me2CO
PST-3
ONO
1)
2)
65%91%

Borowiak, et al., Trauner* and Thorn-Seshold* 2015 Supp. Page 16 Photoswitchable inhibitors of microtubule dynamics optically control mitosis and cell death
PST-4: meta-hydro analogue PST-4 was actually reported in 1949 (Friedman et al., 1949). However, this was 15 years before the
identification of tubulin, the compound was never photoswitched, and no subsequent research has
returned to it until now.
4-((3,4,5-trimethoxyphenyl)diazenyl)phenol (S13) (Friedman et al., 1949)
By Standard Procedure A, 3,4,5-trimethoxyaniline (174 mg, 0.95 mmol) was reacted with phenol
(102 mg, 1.08 mmol). Chromatography of the red crude oil on 5:1→2.4:1 Hx:EA returned S13
(227 mg, 0.78 mmol, 82%; Rf = 0.64 on 1:1 Hx:EA, FeCl3) as a red oil. 1H-NMR (400 MHz): δ = 7.81
(d, 8.8 Hz, 2H), 7.19 (s, 2H), 6.89 (d, 8.9 Hz, 2H), 3.89 (s, 6H), 3.86 (s, 3H) ppm. 13C-NMR
(100 MHz): δ = 159.1, 153.5 (×2), 148.2, 146.6, 140.2, 125.1 (×2), 116.0 (×2), 100.1 (×2), 61.1, 56.2
(×2) ppm. HRMS (ESI+) calcd for [C15H17N2O4]+ = [MH]+: m/z 289.11828, found 289.11813.
1-(4-methoxyphenyl)-2-(3,4,5-trimethoxyphenyl)diazene (PST-4) (Friedman et al., 1949)
By Standard Procedure B, S13 (226 mg, 0.77 mmol) was methylated overnight. Chromatography on
5:1→3:1 Hx:EA returned PST-4 (231 mg, 0.76 mmol, 97%; Rf = 0.76 and 0.60 on 1:1 Hx:EA, E and
Z isomers, FeCl3) as a red oil. 1H-NMR (400 MHz): δ = 7.85 (∼d, 8.9 Hz, 2H), 7.16 (s, 2H), 6.95 (d,
9.0 Hz, 2H), 3.90 (s, 6H), 3.86 (s, 3H), 3.83 (s, 3H) ppm. 13C-NMR (100 MHz): δ = 162.0, 153.5
(×2), 148.5, 146.7, 140.2, 124.7 (×2), 114.3 (×2), 100.1 (×2), 61.1, 56.2 (×2), 55.6 ppm. LCMS(+): tret
= 3.80 & 4.78 min, each 303 Th = [MH]+: these peaks were assigned to the Z & E isomers
respectively since the UV absorption profile of the first peak (Z) featured a shoulder centred around
440 nm which was absent in the first peak. HRMS (ESI+) calcd for [C16H19N2O4]+ = [MH]+: m/z
303.13393, found 303.13371.
N
N
OH
OO
O
H2N
OHO
O
O
N
N
O
OO
O
MeI, K2CO3
AcetoneiPenONO
S13 PST-482%
97%

Borowiak, et al., Trauner* and Thorn-Seshold* 2015 Supp. Page 17 Photoswitchable inhibitors of microtubule dynamics optically control mitosis and cell death
PST-5: meta-hydro, ortho-fluoro analogue
3-fluoro-4-((3,4,5-trimethoxyphenyl)diazenyl)phenol (S14)
By Standard Procedure A, 3,4,5-trimethoxyaniline (196 mg, 1.07 mmol) was reacted with 3-
fluorophenol (120 mg, 1.07 mmol), and the product was extracted with ethyl acetate. Chromatography
on 5:1→2.5:1 Hx:EA returned S16 (161 mg, 0.53 mmol, 49%; Rf = 0.20 on 2.4:1 Hx:EA, KMnO4) as
a yellow oil only sparingly soluble in CH2Cl2 or CHCl3. 1H-NMR (400 MHz): δ = 7.68 – 7.60 (m,
2H), 7.14 (s, 2H), 7.07 (∼t, 8.8 Hz, 1H), 5.47 (d br, 4.2 Hz, 1H), 3.89 (s, 6H), 3.86 (s, 3H) ppm. 13C-NMR (100 MHz) showed the expected C-F couplings: δ = 153.5 (×2), 151.3 (d, 240.1 Hz), 148.2,
146.7 (d, 5.2 Hz), 146.1 (d, 15.3 Hz), 140.5, 122.6 (d, 2.9 Hz), 117.0 (d, 2.2 Hz), 107.8 (d, 19.3 Hz),
100.3 (×2), 61.1, 56.2 (×2) ppm. HRMS (ESI-) calcd for [C15H14N2O4F]- = [M-H]-: m/z 305.09431,
found 305.09427.
1-(2-fluoro-4-methoxyphenyl)-2-(3,4,5-trimethoxyphenyl)diazene (PST-5)
By Standard Procedure B, S14 (159 mg, 0.52 mmol) was methylated overnight in a mixture of
acetone (15 mL), EA (0.6 mL), CHCl3 (0.7 mL) and DMSO (0.7 mL). Chromatography on 10:1→4:1
Hx:EA cleanly returned S19 (158 mg, 0.49 mmol, 94%; Rf = 0.44 and 0.20 on 2.4:1 Hx:EA, FeCl3 : E
and Z isomers) as a red oil. 1H-NMR (400 MHz, DMSO-d6): δ = 7.83 (ddd, 8.7 & 2.4 & 1.2 Hz, 1H),
7.69 (dd, 12.4 & 2.3 Hz, 1H), 7.39 (∼t, 8.9 Hz, 1H), 7.24 (s, 2H), 3.96 (s, 3H), 3.89 (s, 6H), 3.77 (s,
3H) ppm. 13C-NMR (100 MHz, DMSO-d6) showed the expected C-F couplings: δ = 153.85 (×2),
152.3 (d, 247.1 Hz), 150.3 (d, 11.1 Hz), 148.0, 146.0 (d, 5.1 Hz), 140.6, 123.3 (d, 2.9 Hz), 114.1 (d,
2.2 Hz), 107.4 (d, 19.1 Hz), 100.6 (×2), 60.7, 56.8, 56.5 (×2) ppm. 19F-NMR (282 MHz, DMSO-d6): δ
= -133.45 (ddd, 12.2 & 10.2 & 1.3 Hz) ppm. LCMS(+): tret = 3.86 & 4.80 min, each 321 Th = [MH]+:
these peaks were assigned to the Z & E isomers respectively since the UV absorption profile of the
first peak (Z) featured a shoulder centred at 440 nm which was absent in the first peak. HRMS (EI+)
calcd for [C16H17N2O4F]+ = [M]+: m/z 320.1172, found 320.1170.
N
N
OH
OO
OH2N
OH
OO
O
S14
N
N
OMe
OO
OMeI, K2CO3
Me2CO
PST-5
ONO
1)
2)49% 94%
F F
F
Borowiak, et al., Trauner* and Thorn-Seshold* 2015 Supp. Page 18 Photoswitchable inhibitors of microtubule dynamics optically control mitosis and cell death
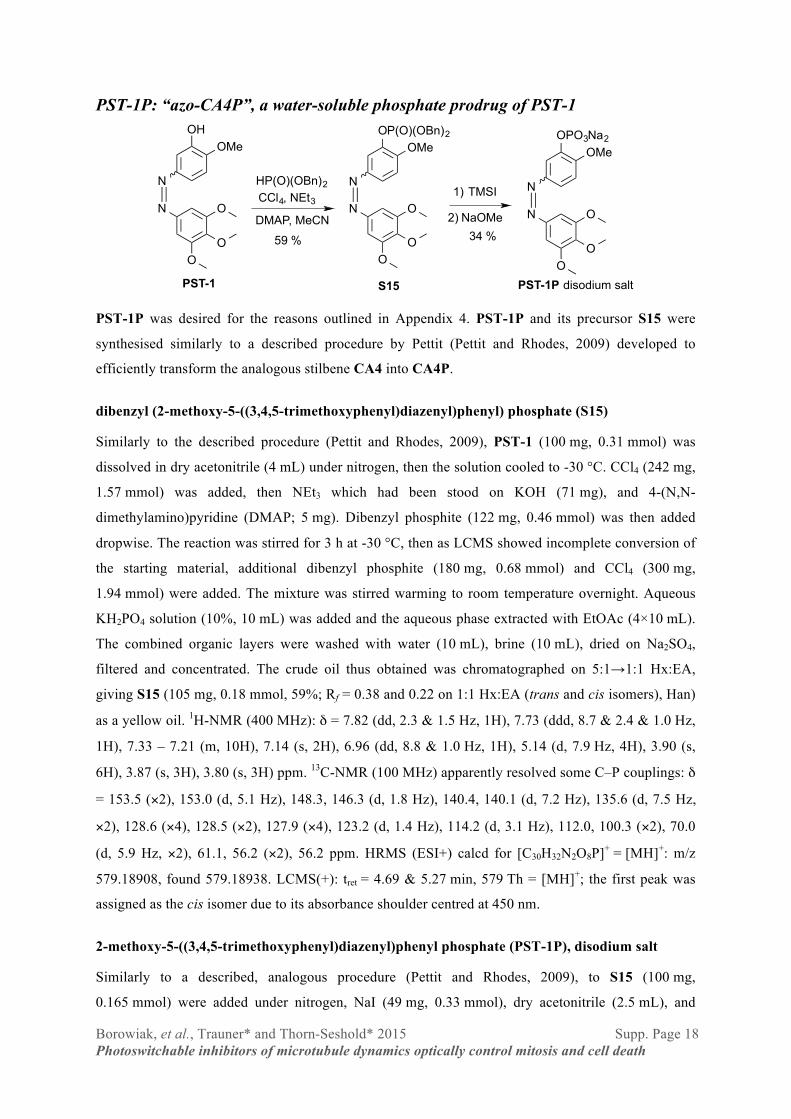
PST-1P: “azo-CA4P”, a water-soluble phosphate prodrug of PST-1
PST-1P was desired for the reasons outlined in Appendix 4. PST-1P and its precursor S15 were
synthesised similarly to a described procedure by Pettit (Pettit and Rhodes, 2009) developed to
efficiently transform the analogous stilbene CA4 into CA4P.
dibenzyl (2-methoxy-5-((3,4,5-trimethoxyphenyl)diazenyl)phenyl) phosphate (S15)
Similarly to the described procedure (Pettit and Rhodes, 2009), PST-1 (100 mg, 0.31 mmol) was
dissolved in dry acetonitrile (4 mL) under nitrogen, then the solution cooled to -30 °C. CCl4 (242 mg,
1.57 mmol) was added, then NEt3 which had been stood on KOH (71 mg), and 4-(N,N-
dimethylamino)pyridine (DMAP; 5 mg). Dibenzyl phosphite (122 mg, 0.46 mmol) was then added
dropwise. The reaction was stirred for 3 h at -30 °C, then as LCMS showed incomplete conversion of
the starting material, additional dibenzyl phosphite (180 mg, 0.68 mmol) and CCl4 (300 mg,
1.94 mmol) were added. The mixture was stirred warming to room temperature overnight. Aqueous
KH2PO4 solution (10%, 10 mL) was added and the aqueous phase extracted with EtOAc (4×10 mL).
The combined organic layers were washed with water (10 mL), brine (10 mL), dried on Na2SO4,
filtered and concentrated. The crude oil thus obtained was chromatographed on 5:1→1:1 Hx:EA,
giving S15 (105 mg, 0.18 mmol, 59%; Rf = 0.38 and 0.22 on 1:1 Hx:EA (trans and cis isomers), Han)
as a yellow oil. 1H-NMR (400 MHz): δ = 7.82 (dd, 2.3 & 1.5 Hz, 1H), 7.73 (ddd, 8.7 & 2.4 & 1.0 Hz,
1H), 7.33 – 7.21 (m, 10H), 7.14 (s, 2H), 6.96 (dd, 8.8 & 1.0 Hz, 1H), 5.14 (d, 7.9 Hz, 4H), 3.90 (s,
6H), 3.87 (s, 3H), 3.80 (s, 3H) ppm. 13C-NMR (100 MHz) apparently resolved some C–P couplings: δ
= 153.5 (×2), 153.0 (d, 5.1 Hz), 148.3, 146.3 (d, 1.8 Hz), 140.4, 140.1 (d, 7.2 Hz), 135.6 (d, 7.5 Hz,
×2), 128.6 (×4), 128.5 (×2), 127.9 (×4), 123.2 (d, 1.4 Hz), 114.2 (d, 3.1 Hz), 112.0, 100.3 (×2), 70.0
(d, 5.9 Hz, ×2), 61.1, 56.2 (×2), 56.2 ppm. HRMS (ESI+) calcd for [C30H32N2O8P]+ = [MH]+: m/z
579.18908, found 579.18938. LCMS(+): tret = 4.69 & 5.27 min, 579 Th = [MH]+; the first peak was
assigned as the cis isomer due to its absorbance shoulder centred at 450 nm.
2-methoxy-5-((3,4,5-trimethoxyphenyl)diazenyl)phenyl phosphate (PST-1P), disodium salt
Similarly to a described, analogous procedure (Pettit and Rhodes, 2009), to S15 (100 mg,
0.165 mmol) were added under nitrogen, NaI (49 mg, 0.33 mmol), dry acetonitrile (2.5 mL), and
N
N
OMe
OO
O
OH
PST-1
N
N
OMe
OO
O
OPO3Na2
PST-1P disodium salt
N
N
OMe
OO
O
OP(O)(OBn)2
S15
59 % 34 %
1) TMSIHP(O)(OBn)2CCl4, NEt3
DMAP, MeCN 2) NaOMe
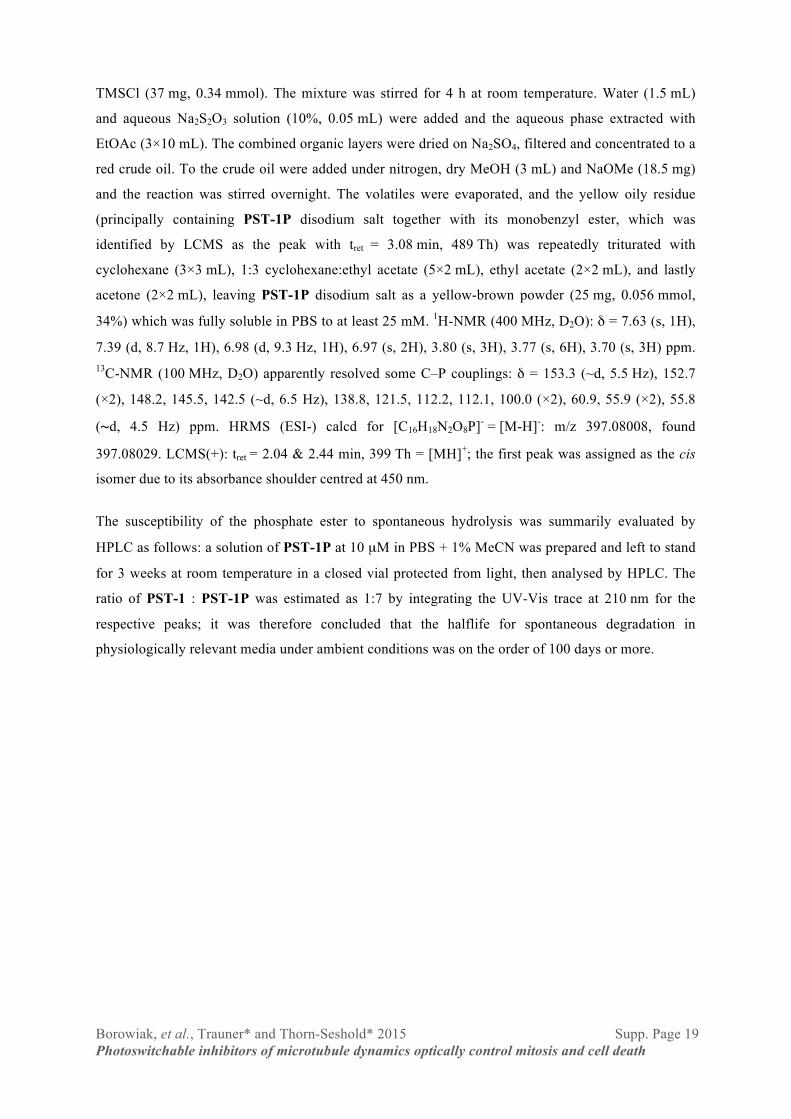
Borowiak, et al., Trauner* and Thorn-Seshold* 2015 Supp. Page 19 Photoswitchable inhibitors of microtubule dynamics optically control mitosis and cell death
TMSCl (37 mg, 0.34 mmol). The mixture was stirred for 4 h at room temperature. Water (1.5 mL)
and aqueous Na2S2O3 solution (10%, 0.05 mL) were added and the aqueous phase extracted with
EtOAc (3×10 mL). The combined organic layers were dried on Na2SO4, filtered and concentrated to a
red crude oil. To the crude oil were added under nitrogen, dry MeOH (3 mL) and NaOMe (18.5 mg)
and the reaction was stirred overnight. The volatiles were evaporated, and the yellow oily residue
(principally containing PST-1P disodium salt together with its monobenzyl ester, which was
identified by LCMS as the peak with tret = 3.08 min, 489 Th) was repeatedly triturated with
cyclohexane (3×3 mL), 1:3 cyclohexane:ethyl acetate (5×2 mL), ethyl acetate (2×2 mL), and lastly
acetone (2×2 mL), leaving PST-1P disodium salt as a yellow-brown powder (25 mg, 0.056 mmol,
34%) which was fully soluble in PBS to at least 25 mM. 1H-NMR (400 MHz, D2O): δ = 7.63 (s, 1H),
7.39 (d, 8.7 Hz, 1H), 6.98 (d, 9.3 Hz, 1H), 6.97 (s, 2H), 3.80 (s, 3H), 3.77 (s, 6H), 3.70 (s, 3H) ppm. 13C-NMR (100 MHz, D2O) apparently resolved some C–P couplings: δ = 153.3 (~d, 5.5 Hz), 152.7
(×2), 148.2, 145.5, 142.5 (~d, 6.5 Hz), 138.8, 121.5, 112.2, 112.1, 100.0 (×2), 60.9, 55.9 (×2), 55.8
(∼d, 4.5 Hz) ppm. HRMS (ESI-) calcd for [C16H18N2O8P]- = [M-H]-: m/z 397.08008, found
397.08029. LCMS(+): tret = 2.04 & 2.44 min, 399 Th = [MH]+; the first peak was assigned as the cis
isomer due to its absorbance shoulder centred at 450 nm.
The susceptibility of the phosphate ester to spontaneous hydrolysis was summarily evaluated by
HPLC as follows: a solution of PST-1P at 10 µM in PBS + 1% MeCN was prepared and left to stand
for 3 weeks at room temperature in a closed vial protected from light, then analysed by HPLC. The
ratio of PST-1 : PST-1P was estimated as 1:7 by integrating the UV-Vis trace at 210 nm for the
respective peaks; it was therefore concluded that the halflife for spontaneous degradation in
physiologically relevant media under ambient conditions was on the order of 100 days or more.
Borowiak, et al., Trauner* and Thorn-Seshold* 2015 Supp. Page 20 Photoswitchable inhibitors of microtubule dynamics optically control mitosis and cell death
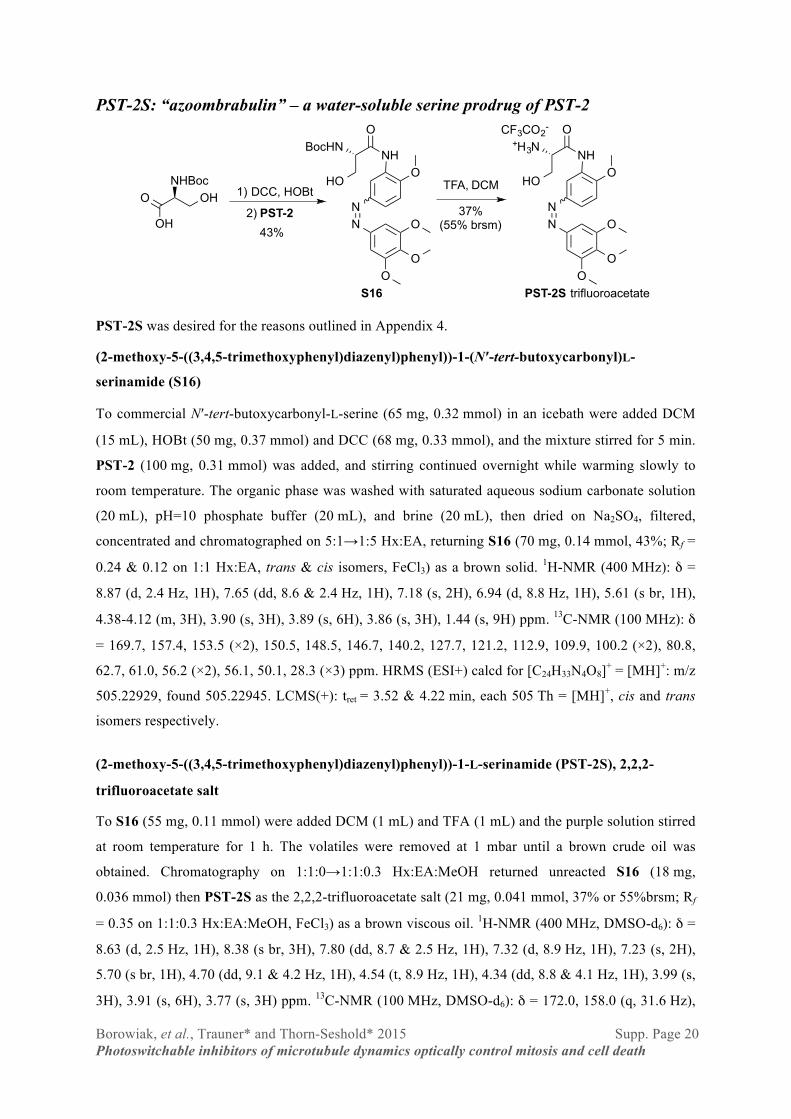
PST-2S: “azoombrabulin” – a water-soluble serine prodrug of PST-2
PST-2S was desired for the reasons outlined in Appendix 4.
(2-methoxy-5-((3,4,5-trimethoxyphenyl)diazenyl)phenyl))-1-(Nʹ-tert-butoxycarbonyl)L-
serinamide (S16)
To commercial Nʹ-tert-butoxycarbonyl-L-serine (65 mg, 0.32 mmol) in an icebath were added DCM
(15 mL), HOBt (50 mg, 0.37 mmol) and DCC (68 mg, 0.33 mmol), and the mixture stirred for 5 min.
PST-2 (100 mg, 0.31 mmol) was added, and stirring continued overnight while warming slowly to
room temperature. The organic phase was washed with saturated aqueous sodium carbonate solution
(20 mL), pH=10 phosphate buffer (20 mL), and brine (20 mL), then dried on Na2SO4, filtered,
concentrated and chromatographed on 5:1→1:5 Hx:EA, returning S16 (70 mg, 0.14 mmol, 43%; Rf =
0.24 & 0.12 on 1:1 Hx:EA, trans & cis isomers, FeCl3) as a brown solid. 1H-NMR (400 MHz): δ =
8.87 (d, 2.4 Hz, 1H), 7.65 (dd, 8.6 & 2.4 Hz, 1H), 7.18 (s, 2H), 6.94 (d, 8.8 Hz, 1H), 5.61 (s br, 1H),
4.38-4.12 (m, 3H), 3.90 (s, 3H), 3.89 (s, 6H), 3.86 (s, 3H), 1.44 (s, 9H) ppm. 13C-NMR (100 MHz): δ
= 169.7, 157.4, 153.5 (×2), 150.5, 148.5, 146.7, 140.2, 127.7, 121.2, 112.9, 109.9, 100.2 (×2), 80.8,
62.7, 61.0, 56.2 (×2), 56.1, 50.1, 28.3 (×3) ppm. HRMS (ESI+) calcd for [C24H33N4O8]+ = [MH]+: m/z
505.22929, found 505.22945. LCMS(+): tret = 3.52 & 4.22 min, each 505 Th = [MH]+, cis and trans
isomers respectively.
(2-methoxy-5-((3,4,5-trimethoxyphenyl)diazenyl)phenyl))-1-L-serinamide (PST-2S), 2,2,2-
trifluoroacetate salt
To S16 (55 mg, 0.11 mmol) were added DCM (1 mL) and TFA (1 mL) and the purple solution stirred
at room temperature for 1 h. The volatiles were removed at 1 mbar until a brown crude oil was
obtained. Chromatography on 1:1:0→1:1:0.3 Hx:EA:MeOH returned unreacted S16 (18 mg,
0.036 mmol) then PST-2S as the 2,2,2-trifluoroacetate salt (21 mg, 0.041 mmol, 37% or 55%brsm; Rf
= 0.35 on 1:1:0.3 Hx:EA:MeOH, FeCl3) as a brown viscous oil. 1H-NMR (400 MHz, DMSO-d6): δ =
8.63 (d, 2.5 Hz, 1H), 8.38 (s br, 3H), 7.80 (dd, 8.7 & 2.5 Hz, 1H), 7.32 (d, 8.9 Hz, 1H), 7.23 (s, 2H),
5.70 (s br, 1H), 4.70 (dd, 9.1 & 4.2 Hz, 1H), 4.54 (t, 8.9 Hz, 1H), 4.34 (dd, 8.8 & 4.1 Hz, 1H), 3.99 (s,
3H), 3.91 (s, 6H), 3.77 (s, 3H) ppm. 13C-NMR (100 MHz, DMSO-d6): δ = 172.0, 158.0 (q, 31.6 Hz),
NN
O
OO
O2) PST-2
1) DCC, HOBtNHBoc
O OH
OH
BocHNO
HO
NH
TFA, DCM
NN
O
OO
O
+H3NO
HO
NH
CF3CO2-
S16 PST-2S trifluoroacetate
43%
37%(55% brsm)
Borowiak, et al., Trauner* and Thorn-Seshold* 2015 Supp. Page 21 Photoswitchable inhibitors of microtubule dynamics optically control mitosis and cell death
153.4 (×2), 152.1, 147.8, 145.4, 139.9, 127.2, 122.5, 117.1 (q, 294 Hz), 113.7, 111.4, 99.9 (×2), 60.5,
60.2, 56.4, 56.0 (×2), 54.5 ppm. HRMS (ESI+) calcd for [C19H25N4O6]+ = [MH]+: m/z 405.17686,
found 405.17695. LCMS(+): tret = 2.30 - 2.65 min (broad), 405 Th = [MH]+.
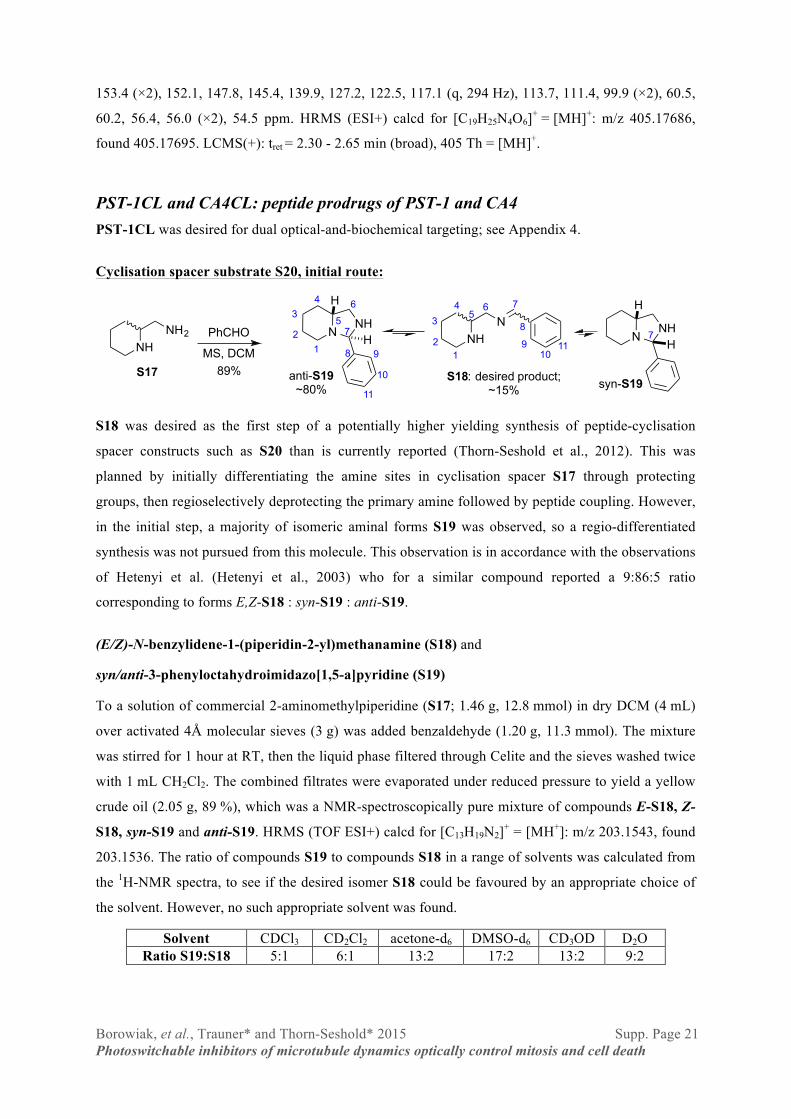
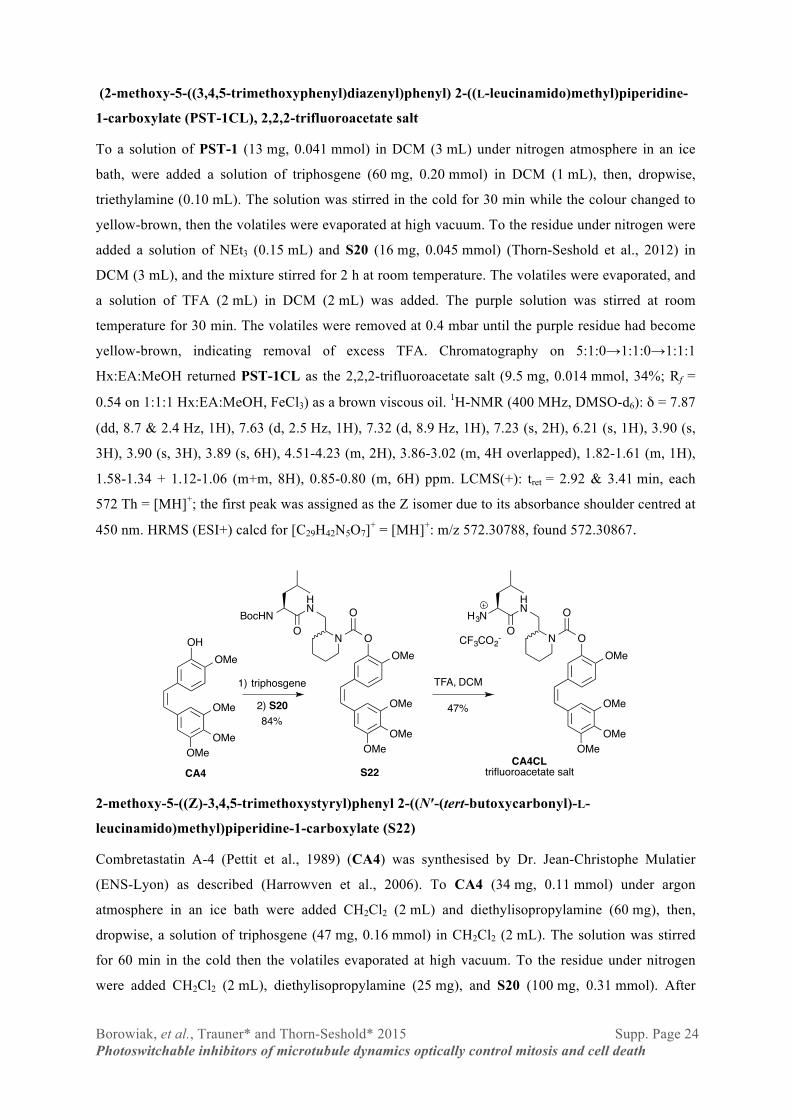
PST-1CL and CA4CL: peptide prodrugs of PST-1 and CA4 PST-1CL was desired for dual optical-and-biochemical targeting; see Appendix 4.
Cyclisation spacer substrate S20, initial route:
S18 was desired as the first step of a potentially higher yielding synthesis of peptide-cyclisation
spacer constructs such as S20 than is currently reported (Thorn-Seshold et al., 2012). This was
planned by initially differentiating the amine sites in cyclisation spacer S17 through protecting
groups, then regioselectively deprotecting the primary amine followed by peptide coupling. However,
in the initial step, a majority of isomeric aminal forms S19 was observed, so a regio-differentiated
synthesis was not pursued from this molecule. This observation is in accordance with the observations
of Hetenyi et al. (Hetenyi et al., 2003) who for a similar compound reported a 9:86:5 ratio
corresponding to forms E,Z-S18 : syn-S19 : anti-S19.
(E/Z)-N-benzylidene-1-(piperidin-2-yl)methanamine (S18) and
syn/anti-3-phenyloctahydroimidazo[1,5-a]pyridine (S19)
To a solution of commercial 2-aminomethylpiperidine (S17; 1.46 g, 12.8 mmol) in dry DCM (4 mL)
over activated 4Å molecular sieves (3 g) was added benzaldehyde (1.20 g, 11.3 mmol). The mixture
was stirred for 1 hour at RT, then the liquid phase filtered through Celite and the sieves washed twice
with 1 mL CH2Cl2. The combined filtrates were evaporated under reduced pressure to yield a yellow
crude oil (2.05 g, 89 %), which was a NMR-spectroscopically pure mixture of compounds E-S18, Z-
S18, syn-S19 and anti-S19. HRMS (TOF ESI+) calcd for [C13H19N2]+ = [MH+]: m/z 203.1543, found
203.1536. The ratio of compounds S19 to compounds S18 in a range of solvents was calculated from
the 1H-NMR spectra, to see if the desired isomer S18 could be favoured by an appropriate choice of
the solvent. However, no such appropriate solvent was found.
Solvent CDCl3 CD2Cl2 acetone-d6 DMSO-d6 CD3OD D2O Ratio S19:S18 5:1 6:1 13:2 17:2 13:2 9:2
NHNH2 PhCHO NH
NN
NH
S18: desired product;~15% syn-S19
H
H NNH
H
HMS, DCM 1
4 76
85
210
3
9 111
4
7
6
8
52
10
3
9
11
89%
7
anti-S19~80%
S17
Borowiak, et al., Trauner* and Thorn-Seshold* 2015 Supp. Page 22 Photoswitchable inhibitors of microtubule dynamics optically control mitosis and cell death
Complete NMR characterisation of the mixture of isomers was performed in CDCl3, and spectra were
completely assigned for the majority species E-S18 and syn-S19; characteristic peaks could be
assigned for each of the minority species Z-S18 and anti-S19 enabling analysis of the proportion of
each form in the equilibrium mixture. The ratio E-S18 : Z-S18 : syn-S19 : anti-S19 in this solvent
was determined by 1H-NMR integration of the distinctive peaks for each isomer, and was calculated
as 15:0.5:80:2.5. HSQC supported the spectral assignments.
E-S18 (15 %): 1H-NMR (500 MHz): δ = 8.22 (s, 1H, H7), 7.65-7.64 (m, 2H, 2×H9), 7.31-7.28 (m,
3H, 2×H10 + H11), 3.61 (dd, 11.8 Hz & 3.2 Hz, 1H, H6), 3.34 (dd, 11.6 & 8.5 Hz, 1H, H6ʹ),
2.96-2.95 (m, 1H, H1), 2.80-2.79 (m, 1H, H5), 2.55 (td, 11.9 Hz & 2.3 Hz, H1ʹ), 1.61 (d, 12.5 Hz, 1H,
H4), 1.53-1.50 (m, 1H, H2), 1.40-1.33 (m, 1H, H2ʹ), 1.31-1.26 (m, 2H, 2×H3), 1.18-1.16 (m, 1H, H4ʹ)
ppm. 13C-NMR (125 MHz): δ = 162.2 (C7), 136.1 (C8), 130.7 (C11), 128.6 (2×C9), 128.2 (2×C10),
67.8 (C6), 56.9 (C5), 46.8 (C1), 30.8 (C4), 26.3 (C2), 24.7 (C3) ppm.
syn-S19 (80 %): 1H-NMR (500 MHz): δ = 7.38 (d, 7.8 Hz, 2H, 2×H9), 7.25 (~t, 7.4Hz, 2H, 2×H10),
7.22-7.20 (m, 1H, H11), 3.91 (s, 1H, H7), 3.00 (dd, 9.2 Hz & 6.5 Hz, 1H, H6), 2.73 (~t, 9.5 Hz, 1H,
H6ʹ), 2.66-2.65 (m, 1H, H1), 2.22-2.21 (m, 1H, H5), 1.85 (td, 11.2 Hz & 3.1 Hz, 1H, H1ʹ), 1.79-1.70
(m, 2H, H3 + H4), 1.52-1.40 (m, 2H, 2×H2), 1.30-1.26 (m, 1H, H4’), 1.22-1.16 (dt, 12.8 Hz &
3.6 Hz, 1H, H3ʹ) ppm. 13C-NMR (125 MHz): δ = 141.0 (C8), 128.5 (2×C10), 128.3 (C11), 127.9
(2×C9), 82.7 (C7), 63.8 (C5), 50.6 (C6), 48.8 (C1), 29.1 (C4), 25.2 (C2), 24.2 (C3) ppm.
Z-S18 (0.5 %): 1H-NMR (500 MHz) characteristic peak: δ = 8.00 (d, 7.9 Hz, 2H, 2×H9) ppm. 13C-NMR (125 MHz) characteristic peaks: δ = 165.0 (C7), 129.6 (2×C9) ppm.
anti-S19 (2.5 %): 1H-NMR (500 MHz) characteristic peak: δ = 4.89 (s, 1H, H7) ppm. 13C-NMR
(125 MHz) characteristic peaks: δ = 141.5 (C8), 77.9 (C7) ppm.
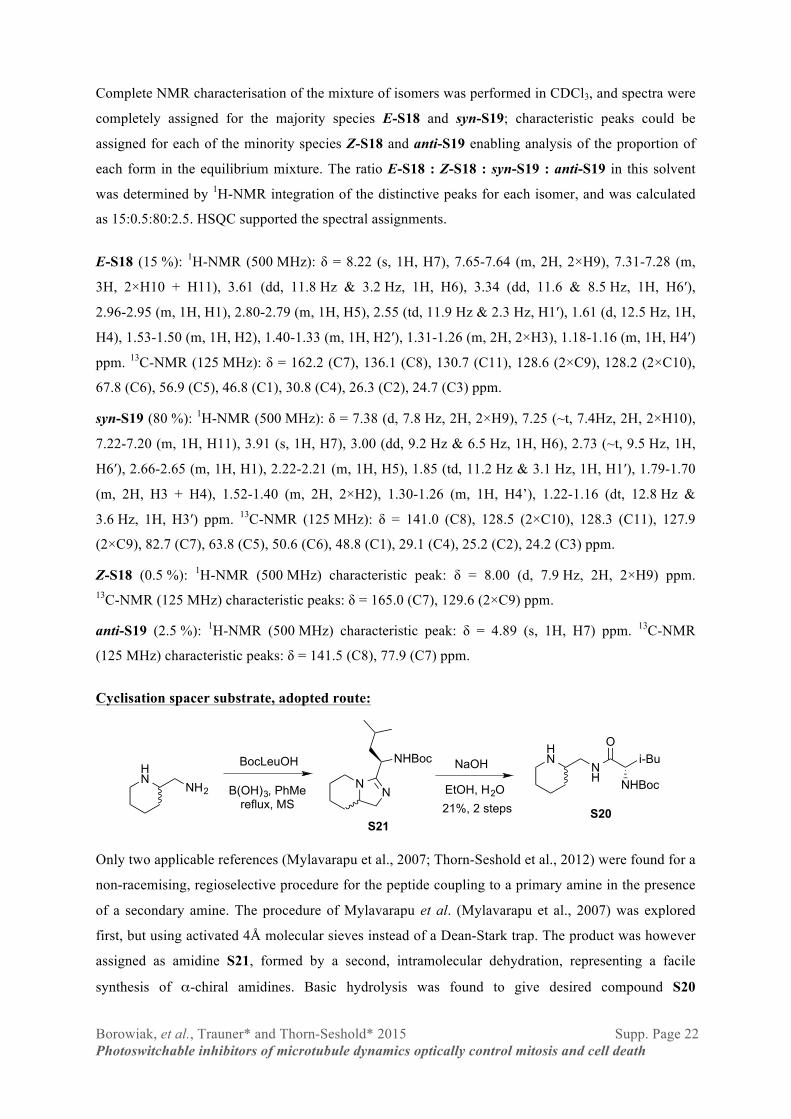
Cyclisation spacer substrate, adopted route:
Only two applicable references (Mylavarapu et al., 2007; Thorn-Seshold et al., 2012) were found for a
non-racemising, regioselective procedure for the peptide coupling to a primary amine in the presence
of a secondary amine. The procedure of Mylavarapu et al. (Mylavarapu et al., 2007) was explored
first, but using activated 4Å molecular sieves instead of a Dean-Stark trap. The product was however
assigned as amidine S21, formed by a second, intramolecular dehydration, representing a facile
synthesis of α-chiral amidines. Basic hydrolysis was found to give desired compound S20
HN
NH2 B(OH)3, PhMereflux, MS
NN
S21
NHBocBocLeuOH NaOH
EtOH, H2O
HN
NH
Oi-Bu
NHBoc
21%, 2 steps S20
Borowiak, et al., Trauner* and Thorn-Seshold* 2015 Supp. Page 23 Photoswitchable inhibitors of microtubule dynamics optically control mitosis and cell death
regioselectively. Although this procedure was found to give a lower yield than the DCC-mediated
coupling previously reported for S20 (Thorn-Seshold et al., 2012), it is both more atom-economical
and environmentally-friendly, and is therefore reported here.
Nʹ-tert-butoxycarbonyl-L-leucyl-(piperidin-2-ylmethyl)amide (S20) (Thorn-Seshold et al., 2012)
Nʹ-tert-butoxycarbonyl-L-leucine (2.08 g, 8.99 mmol) was added to a flask containing dry toluene
(60 mL) and activated 4Å molecular sieves (10.6 g). The mixture was heated to 60 °C until the amino
acid had dissolved, then boric acid (67 mg, 1.1 mmol, 0.1 eq) and 2-aminomethylpiperidine (1.027 g,
9.00 mmol) were added. The solution yellowed and was stirred for 16 h at 113 °C under a condenser
with a closed air atmosphere. The mixture was then filtered, washed with sat. aq. Na2CO3 to eliminate
the unreacted acid, and evaporated under reduced pressure yielding a crude red oil containing a
majority of S21 (ESI(+): m/z = 310 Th, [MH]+). To the crude oil were added EtOH (30 mL), H2O
(20 mL) and NaOH (6 g, 250 mmol), and the solution was stirred overnight at RT. The basic solution
was extracted with DCM (3×30 mL) and the combined organic extracts rinsed with brine (20 mL) and
dried over Na2SO4, filtered and evaporated to yield a crude yellow oil which was filtered through a
silica pad using 1:1:0 → 1:1:1 EA:Cy:MeOH to give S20 as a yellow oil (630 mg, 1.92 mmol, 21 %),
identical by NMR to that produced by the reported method (Thorn-Seshold et al., 2012).
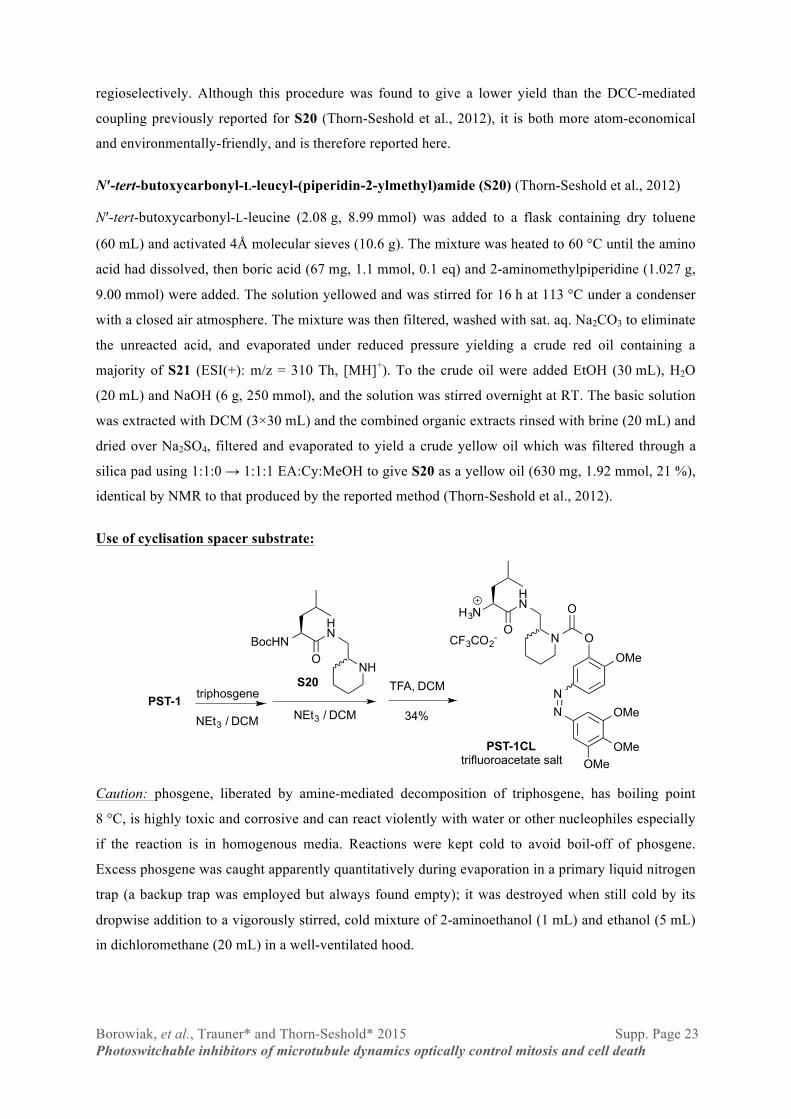
Use of cyclisation spacer substrate:
Caution: phosgene, liberated by amine-mediated decomposition of triphosgene, has boiling point
8 °C, is highly toxic and corrosive and can react violently with water or other nucleophiles especially
if the reaction is in homogenous media. Reactions were kept cold to avoid boil-off of phosgene.
Excess phosgene was caught apparently quantitatively during evaporation in a primary liquid nitrogen
trap (a backup trap was employed but always found empty); it was destroyed when still cold by its
dropwise addition to a vigorously stirred, cold mixture of 2-aminoethanol (1 mL) and ethanol (5 mL)
in dichloromethane (20 mL) in a well-ventilated hood.
O
O
N
HN
OH3N
PST-1 triphosgene
NEt3 / DCM
NN
OMe
OMe
OMe
OMe
TFA, DCM
PST-1CL trifluoroacetate salt
CF3CO2-
NH
HN
OBocHN
NEt3 / DCM
S20
34%
Borowiak, et al., Trauner* and Thorn-Seshold* 2015 Supp. Page 24 Photoswitchable inhibitors of microtubule dynamics optically control mitosis and cell death
(2-methoxy-5-((3,4,5-trimethoxyphenyl)diazenyl)phenyl) 2-((L-leucinamido)methyl)piperidine-
1-carboxylate (PST-1CL), 2,2,2-trifluoroacetate salt
To a solution of PST-1 (13 mg, 0.041 mmol) in DCM (3 mL) under nitrogen atmosphere in an ice
bath, were added a solution of triphosgene (60 mg, 0.20 mmol) in DCM (1 mL), then, dropwise,
triethylamine (0.10 mL). The solution was stirred in the cold for 30 min while the colour changed to
yellow-brown, then the volatiles were evaporated at high vacuum. To the residue under nitrogen were
added a solution of NEt3 (0.15 mL) and S20 (16 mg, 0.045 mmol) (Thorn-Seshold et al., 2012) in
DCM (3 mL), and the mixture stirred for 2 h at room temperature. The volatiles were evaporated, and
a solution of TFA (2 mL) in DCM (2 mL) was added. The purple solution was stirred at room
temperature for 30 min. The volatiles were removed at 0.4 mbar until the purple residue had become
yellow-brown, indicating removal of excess TFA. Chromatography on 5:1:0→1:1:0→1:1:1
Hx:EA:MeOH returned PST-1CL as the 2,2,2-trifluoroacetate salt (9.5 mg, 0.014 mmol, 34%; Rf =
0.54 on 1:1:1 Hx:EA:MeOH, FeCl3) as a brown viscous oil. 1H-NMR (400 MHz, DMSO-d6): δ = 7.87
(dd, 8.7 & 2.4 Hz, 1H), 7.63 (d, 2.5 Hz, 1H), 7.32 (d, 8.9 Hz, 1H), 7.23 (s, 2H), 6.21 (s, 1H), 3.90 (s,
3H), 3.90 (s, 3H), 3.89 (s, 6H), 4.51-4.23 (m, 2H), 3.86-3.02 (m, 4H overlapped), 1.82-1.61 (m, 1H),
1.58-1.34 + 1.12-1.06 (m+m, 8H), 0.85-0.80 (m, 6H) ppm. LCMS(+): tret = 2.92 & 3.41 min, each
572 Th = [MH]+; the first peak was assigned as the Z isomer due to its absorbance shoulder centred at
450 nm. HRMS (ESI+) calcd for [C29H42N5O7]+ = [MH]+: m/z 572.30788, found 572.30867.
2-methoxy-5-((Z)-3,4,5-trimethoxystyryl)phenyl 2-((Nʹ-(tert-butoxycarbonyl)-L-
leucinamido)methyl)piperidine-1-carboxylate (S22)
Combretastatin A-4 (Pettit et al., 1989) (CA4) was synthesised by Dr. Jean-Christophe Mulatier
(ENS-Lyon) as described (Harrowven et al., 2006). To CA4 (34 mg, 0.11 mmol) under argon
atmosphere in an ice bath were added CH2Cl2 (2 mL) and diethylisopropylamine (60 mg), then,
dropwise, a solution of triphosgene (47 mg, 0.16 mmol) in CH2Cl2 (2 mL). The solution was stirred
for 60 min in the cold then the volatiles evaporated at high vacuum. To the residue under nitrogen
were added CH2Cl2 (2 mL), diethylisopropylamine (25 mg), and S20 (100 mg, 0.31 mmol). After
O
O
N
HN
OH3N
CA4
1) triphosgene
2) S20
OMe
OMe
OMe
OMe
TFA, DCM
CA4CL trifluoroacetate salt
CF3CO2-
47%
O
O
N
HN
OBocHN
OMe
OMe
OMe
OMe
S22
OHOMe
OMe
OMe
OMe
84%
Borowiak, et al., Trauner* and Thorn-Seshold* 2015 Supp. Page 25 Photoswitchable inhibitors of microtubule dynamics optically control mitosis and cell death
stirring for 1 h warming to room temperature, the volatiles were evaporated and the crude
chromatographed on 5:1→1:1 Cy:EA, yielding S22 (61 mg, 0.09 mmol, 84%; Rf = 0.25 on 1:1
Cy:EA, Han) as a colourless oil. 1H-NMR (500 MHz, CD3OD): δ = 7.15-7.07 (m, 2H), 6.88-6.83 (dd,
8.3 & 3.4 Hz, 1H), 6.53 (s, 1H), 6.53 (s, 1H), 6.45 (∼s, 2H), 5.08 (s br, 1H, carbamate), 4.55-4.33 (m,
1H), 4.18-4.02 (m, 2H), 3.84 (∼s, 6H), 3.72 (s, 3H), 3.72 (s, 3H), 3.76-3.42 (m, 2H), 3.14-2.85 (m,
1H), 1.75-1.38 (m overlapped, 9H), 1.42+1.41 (s+s, 9H, rotamers), 0.95-0.86 (m, 6H) ppm. 13C-NMR
(125 MHz, CD3OD): δ = 172.9, 155.6, 155.5, 152.9 (×2), 150.6, 140.3, 137.1, 132.5, 130.2, 129.4,
128.7, 127.1, 123.6, 112.3, 105.9 (×2), 79.8, 60.9, 56.3, 55.9 (×2), 53.1, 51.2, 41.7, 40.4, 39.3, 28.3
(×3), 26.2, 25.1, 24.7, 22.9, 21.9, 19.2 ppm. DIMS(+): 670 Th = [MH]+. MS (ESI+) calcd for
[C36H52N3O9]+ = [MH]+: m/z 670.4, found 670.4.
(Z)-1-(((1-((2-methoxy-5-(3,4,5-trimethoxystyryl)phenyl 2-((L-leucinamido)methyl)piperidine-1-
carboxylate (CA4CL), 2,2,2-trifluoroacetate salt
To S22 (53 mg, 0.079 mmol) were added DCM (1 mL) and TFA (1 mL) and the mixture stirred at
room temperature under argon for 1 h. After evaporation of the volatiles, chromatography on
1:1:0→1:1:1 Cy:EA:MeOH returned CA4CL (25 mg, 0.035 mmol, 47%; Rf = 0.32 on 2:2:1
Cy:EA:MeOH, Nin) as a colourless solid. As reported for similar molecules (Thorn-Seshold et al.,
2012), NMR resolved some peak sets resulting from diastereomers/rotamers/conformers; these are
reported by group as eg. “X+X” to highlight which structural group is responsible for which peak set. 1H-NMR (400 MHz, CD3OD): δ = 7.03 (dd, 8.5 & 2.1 Hz, 1H), 6.95-6.88 (m, 2H), 6.48 (s, 1H), 6.46
(s, 1H), 6.40 (s, 1H), 6.39 (s, 1H), 4.45-4.31 (m, 1H), 4.08-3.90 (m, 1H), 3.72 + 3.72 (each s, total
3H), 3.65 + 3.64 (each s, total 3H), 3.62-3.55 (m, 1H), 3.58 + 3.57 (each s, total 6H), 3.47-3.40 (m,
1H), 3.28-3.22 (m, 1H), 3.15-2.93 (m, 1H), 1.68-1.10 (m, 9H), 0.91-0.78 (m, 6H). 13C-NMR
(100 MHz, CD3OD): δ = 170.8, 161.80 (q, 33.8 Hz), 154.5, 152.8 + 152.8 (×2), 150.7, 140.1, 136.9 +
136.8, 132.8 + 132.8, 130.0, 129.3 + 129.1, 128.2, 127.2, 122.9, 116.7 (q, 292 Hz), 112.0, 105.9,
105.8, 59.8, 55.1 + 55.1, 55.1 + 55.0 (×2), 52.0 + 51.8, 50.9, 41.0, 40.2, 38.0, 25.8+25.1, 24.1 + 24.0,
22.1, 21.9 + 21.8, 20.7 + 20.5, 18.6 ppm. DIMS(+): 570 Th = [MH]+. HRMS (ESI+) calcd for
[C31H44N3O7]+ = [MH]+: m/z 570.3174, found 570.3156.
Borowiak, et al., Trauner* and Thorn-Seshold* 2015 Supp. Page 26 Photoswitchable inhibitors of microtubule dynamics optically control mitosis and cell death
Part B: Photocharacterisation in vitro The rationale for the choice of isomerisation parameters to determine, and the methods for their
measurement / modelling, are explained in Appendix 1. Photocharacterisations were performed only
for the non-prodrug compounds, as the prodrugs could be expected to function as slow-release
sources of these active cores and so to have similar photoisomerisation requirements. Important
quantities determined are εE(λ) and εZ(λ) [the molar absorptivities of the trans and cis species
respectively], φ(λ) [the simulated fraction of cis at the photostationary state], E(λ) [a parameter
estimating the bulk efficiency of photoisomerisation as a function of irradiating wavelength], and τ
[the halflife of spontaneous thermal cis→trans reversion].
Spectrophotometry equipment Absorption spectra in cuvette (“UV-Vis”) were acquired on a Varian CaryScan 50 (1 cm, 100 µL or
1 mL volume) with Peltier cell temperature control unit maintained at 37 °C, in PBS at pH∼7.4
containing 20% MeCN. A TILL Photonics Polychrome V monochromator with a fibre optic cable
output directed into the cuvette was used to perform photoisomerisation studies by UV-Vis
spectrophotometry although even single low-power LEDs were equally successful in providing
repeatable monochromatic photoisomerisation. Separated spectra of trans and cis forms were acquired
from the inline Diode Array Detector on the AGILENT 1260 SL coupled LC-MS system after HPLC
separation as described in Part A.
B.1: trans- and cis- absorption spectra The trans- and cis-isomers of each for the non-prodrug compound were separated by HPLC and
ε*E(λ) and ε*Z(λ) were measured on the inline ultraviolet/visible Diode Array Detector; these were
then scaled as outlined in Appendix 1 to derive the molar absorptivities εE(λ) and εZ(λ) (Figure S1A).
The parameters λstrong (peak absorption wavelength of the trans form), εE(λstrong) and λiso (the isosbestic
point) were also determined, in PBS containing 20% MeCN, at pH = 7.4 unless indicated otherwise
(Figure S1B; see also Appendix 1). This illustrates the PST compounds’ large single-photon
absorption coefficients within the in vivo compatible wavelength range, which especially distinguish
them from the prior art in stilbene tubulin inhibitors. Such strong absorption coefficients, coupled
with the high quantum efficiencies known to be typical of azobenzene photoisomerisation (Beharry
and Woolley, 2011a; Knoll, 2003), enable efficient single-photon photoisomerisation of the PST
compounds in both directions cis → trans and trans → cis, with low power irradiation as is in vivo
compatible, cheap and practical.

Borowiak, et al., Trauner* and Thorn-Seshold* 2015 Supp. Page 27 Photoswitchable inhibitors of microtubule dynamics optically control mitosis and cell death
B.2: Calculated φ(λ) and E(λ) φ(λ) and E(λ) were calculated as per Appendix 1 and are presented in Figure S1A. These indicate
that even small structural variations may substantially alter both the proportion of the cis form in the
photostationary state at different wavelengths, and the relative efficiency of approaching those
photostationary states. This illustrates the possibility of structural modifications within this scope
being used to give spectral tuning, eg. for better biological light penetration by red-shifting so that
both trans→cis and (especially) cis→trans photoisomerisations may be conducted more efficiently
and to a greater extent at longer wavelengths.
B.3: Reversible trans↔cis photoisomerisation A(λstrong) was measured over time, while the monochromator applied λirrad alternating between two
values λ1 and λ2, chosen to induce bulk trans→cis and bulk cis→trans isomerisation respectively.
Typical results were presented for PST-1 in Figure 1D, measuring the absorbance of PST-1 (18 µM)
at λstrong=378 nm, while the irradiating wavelength was held alternately at λ1=388 nm (50 s; bulk
trans→cis) then λ2=508 nm (180 s, bulk cis→trans). Higher absorbance corresponds to a greater
amount of trans isomer: an absorbance of 0.27 corresponds to ~5:1 trans:cis isomeric ratio in the
sample, and an absorbance of 0.12 corresponds to ~1:2. Note that this bulk trans→cis isomerisation at
388 nm is significantly faster than the bulk cis→trans isomerisation at 508 nm, although the
monochromator equipment used delivers light at 508 nm with approximately 1.5 times the intensity of
the light delivered at 388 nm. This is consistent with the expectation that photoisomerisation toward
the respective photostationary states should be significantly more efficient at 388 nm than at 508 nm
for this compound, since E(388)/E(508) = 0.04.
PST compounds were bulk-photoisomerised hundreds of times over a timescale of hours (50
representative cycles are summarised in Figure 1D), such that the majority species in a sample was
alternated between the trans-isomer and the cis-isomer. This proceeded without any detectable
photobleaching, or decreases in photoswitching speed, or photoswitching efficiency or limiting
isomeric percentage obtained, despite the fact that measurements were conducted in non-degassed
PBS solution (10% MeCN) under open air atmosphere at 37 °C. This highlights the extreme
robustness of the PST compounds towards photochemical reaction or damage in an aqueous
environment. This robustness is a key advantage of the azobenzene PST compounds when compared
to the prior art advancing stilbene photoisomerisation (Bisby et al., 2013), a process known to give
extensive and rapid degradation (eg to phenanthrenes via 6π-electrocyclisation-oxidation) when
biologically relevant conditions (eg. presence of dissolved oxygen) are used (Mallory and Mallory,
2004). These results thus demonstrate that photocontrolled trans↔cis isomerisation of the PSTs is
fully reversible, in a highly robust fashion, which is practical to implement under biologically relevant
conditions.
Borowiak, et al., Trauner* and Thorn-Seshold* 2015 Supp. Page 28 Photoswitchable inhibitors of microtubule dynamics optically control mitosis and cell death
B.4: Thermal cis→trans reversion halflives Thermal reversion halflives τ were measured as per Appendix 1, in PBS at pH = 7.4 unless indicated
otherwise, containing 20% MeCN to ensure solubility (Figure S1B). These reversion halflives show
that structural variations within the scope of photoswitchably bioactive PST designs can greatly alter
the timescale of spontaneous cis→trans reversion. Therefore we anticipate that different PSTs will be
suited to maintain cis/trans gradients on different spatial scales, e.g. for subcellular, cellular and tissue
level studies, or for experiments carried out over significantly different time scales (eg. seconds to
minutes for experimental biology applications, or hours to days for biomedical applications).
ASSAYS in vitro, in cellulo, & in vivo Materials and Methods
Safety Precautions The photoswitchable compounds examined here are cytotoxic and should be treated cautiously as for
standard chemotherapeutics. In case of spills or splashes, ethyl acetate might be used to remove the
compounds from the affected areas without favouring their percutaneous transport; traces or waste
may be destroyed if necessary by KMnO4.
Biochemical Assays in vitro Radioligand scintillation proximity assay (SPA): The competitive tubulin-binding assay was
modified from literature procedure (Tahir et al., 2000). The assay uses porcine brain tubulin, where
random surface lysines have been covalently modified with long chain biotin linkers, in conjunction
with streptavidin-coated yttrium silicate SPA beads, so that only the tritiated colchicine which is
bound to tubulin (at the CDI site) is held in close proximity to the SPA bead and gives rise to a
scintillation signal upon radioactive decay. Briefly, a tritiated colchicine solution was prepared by
diluting commercial tritiated colchicine stock (Perkin-Elmer, specific activity 83.5 Ci/mmol) threefold
with “cold” colchicine (Sigma). SPA assays were then performed in clear-bottom, white 96-well
plates by mixing 0.5 µg of biotinylated tubulin (Cytoskeleton, Tebu-Bio), 0.08 mg streptavidin-coated
yttrium silicate SPA beads (Perkin Elmer), and the inhibitor (PST-1 or combretastatin A4 (CA4,
Sigma)), in General Tubulin Buffer (80 mM PIPES pH=6.8, 0.5 mM EGTA, 2 mM MgCl2)
supplemented with 1 mM GTP (final volume 100 µL), containing 1% acetonitrile and 0.22% ethanol
for inhibitor solubility. To initiate the assay tritiated colchicine solution (0.08 µM final concentration)
was added and plates were incubated at 37 °C, with shaking for 70 min, then without shaking for 15
minutes to allow the beads to settle. The radioactive counts were then directly measured using a

Borowiak, et al., Trauner* and Thorn-Seshold* 2015 Supp. Page 29 Photoswitchable inhibitors of microtubule dynamics optically control mitosis and cell death
Wallac Microbeta 1450 scintillation counter. The nonspecific background signal (determined using
controls without tubulin) was subtracted, and as the SPA photons can be appreciably absorbed by
PST-1 in bulk solution at higher concentrations, we also applied an experimentally determined colour
quenching correction to the PST-1 data. The CDI site occupation by 3H-colchicine was calculated as a
percentage relative to the positive control (counts determined without competitive inhibitor). Dark
conditions were achieved by preparing the assay under red-light conditions and running it inside light-
shielded boxes. In our hands, permanent assay illumination at 390 nm resulted in almost total loss of
specific binding signal, presumably by 4π electrocyclisation of colchicine to non-binding
lumicolchicine. Therefore appropriate “390 nm” conditions were achieved using pulsed irradiations at
390 nm (75 ms every 45 s), applied by the Disco timed illumination system using a 96-LED array (see
below); the control signal under these conditions was almost indistinguishable from that obtained
under dark conditions, indicating no significant photodegradation of the radioligand. Results are
expressed as mean percentage of colchicine binding relative to the positive control (without
inhibitors), +/- standard deviation, calculated from 3 experiments performed in quadruplicates.
Graphical representations and statistical analysis of the data were performed using GraphPad Prism
(GraphPad Software, La Jolla, CA, USA). Four-parameter curve fitting for sigmoidal dose–response
curves with a variable slope was used to determine the EC50 values for CA4 and for PST-1 under
390 nm illumination. Results obtained for trans-PST-1 (dark conditions) did not fit a sigmoidal model
(indicating no strong competition for CDI site binding), so a second order polynomial was fitted
instead.
In vitro tubulin polymerisation assay: Tubulin from porcine brain with 30% MAPs (Microtubule-
associated proteins) was obtained from Cytoskeleton Inc. (Cat. # ML116, Denver, CO, USA). The
polymerisation reaction was performed at 2 mg/mL tubulin, in polymerisation buffer (80 mM
piperazine-N,N′-bis(2-ethanesulfonic acid) (PIPES) pH=6.9, 0.5 mM EGTA, 2 mM MgCl2), in a
cuvette (100 µL, 1 cm path length) in a Varian CaryScan 50 with Peltier cell temperature control unit
maintained at 37 °C. Tubulin was first incubated for 10 min at 37 °C with PST (in 1 % MeCN to
ensure solubility) in buffer without GTP. Then GTP was added to 1 mM final concentration with
mixing, and the change in absorbance at 340 nm (Lin et al., 1988) was monitored for 15 min.
Throughout the whole experiment samples were kept shielded from ambient light ("dark") or exposed
to illumination at 390 nm using the monochromator-fibre optic setup described in Part B.
Cell Culture MDA-MB-231, HeLa and HEK-293T cells were grown in Dulbecco’s modified Eagle’s medium
(DMEM, PAN-Biotech P04-03550), and Jurkat cells were maintained in Roswell Park Memorial
Institute medium (RPMI 1640, PAN-Biotech P04-16500). Medium was supplemented with 10% heat-
inactivated fetal calf serum, 100 U/mL penicillin and 100 µg/mL streptomycin (Sigma Aldrich,
Borowiak, et al., Trauner* and Thorn-Seshold* 2015 Supp. Page 30 Photoswitchable inhibitors of microtubule dynamics optically control mitosis and cell death
P4333) and additionally with 1% pyruvate (Merck) for Jurkat cell culture. Cells were grown at 37°C
in a 10% CO2 atmosphere. Prior to assays, cells were transferred to phenol red free medium (DMEM,
PAN-Biotech P04-03591 or RPMI 1640, PAN-Biotech P04-16515). One day post plating, PSTs were
applied and cells were exposed to lighting regimes as indicated.
Use of Photoswitchable Compounds in Cell Culture: Long-term experiments were prepared under
ambient light (pipetting, dilutions, dosage etc.). For short-term experiments such as video microscopy,
PSTs were stored in the dark prior to use, and red light/dark-room conditions were used when setting
and running experiments. Irradiated cell culture was performed using a cheap, easily self-built
computer-controlled system of arrays of LEDs, which achieved parallel throughput (eg. >30 plates)
for repeatable screening of irradiation conditions (Figure S6). Each array irradiated a standard 24-
well or 96-well cell culture plate, and these were kept in separate light-proof gas-permeable cardboard
boxes in the incubator. The choice of LEDs plugged into each array determined the wavelength at
which its well plate was irradiated. The timing sequences (defined by light pulse length tIR, and
interval tpause between pulses) were defined by a programmed microcomputer (Arduino Uno Mega),
and actuated to power the arrays via a multichannel switchboard. Either one or two arrays were used
per well plate (eg. one illuminating from the bottom, and an optional second array illuminating from
the top down at a different wavelength, on a synchronised but different timing sequence if desired),
thus enabling pulsed or continuous implementation of eg. toxic regime, strong rescue regime, weak
rescue regime, or dark rescue regime protocols (see Appendix 4). Typical settings for the toxic
regime were 390 nm with tIR = 75 ms, tpause = 15 s; typical settings for the rescue regime were twin
pulses with the first pulse component being 390 nm with eg. tIR = 75 ms, tpause = 30 s administered
from a 390 nm array below the well plate, and synchronously with the end of this component, starting
a second pulse component at 515 nm with tIR = 375 ms, tpause = 30 s from a 515 nm array above the
well plate (see setup represented in Figure S6A). Arrays and switchboards were assembled by hand
from components bought at a home improvement hardware store (Conrad). The Arduino programs
used, circuit designs, parts lists, schematics and build guide for both arrays and switchboards are
given in full in Appendix 2. The following central-wavelengths of LEDs were used in this study (in
nm): 370, 380, 390, 400, 410, 425, 435, 450, 465, 475, 490, 505, 515, 525, and 535 nm; all LEDs
were bought from Roithner Lasertechnik GmbH, as 4V / 20 mA / 5 mm units, and the corresponding
Roithner part numbers are VL370-5-15, RLS-UV380, VL390-5-15, RLS-UV400, VL410-5-15,
VL425-5-15, LED435-12-30, LED450-04, RLS-B465, B56L5111P, LED490-03, B5-433-B505,
LED515-10-30, B5-433-B525, and LED535-01 respectively. The LEDs were removably plugged into
sockets, to give maximum modularity to the equipment. Only one wavelength of LED was used per
array, and arrays at different wavelengths were kept in separate boxes (save for the rescue protocols).
We consider this crucial since with standard, clear well plates, light scattering from one well across
the whole plate was often observed to be significant enough to compromise results. For the same
Borowiak, et al., Trauner* and Thorn-Seshold* 2015 Supp. Page 31 Photoswitchable inhibitors of microtubule dynamics optically control mitosis and cell death
reasons, for microscopy, Photostatins were applied only in the moment of imaging (by contrast to
e.g. applying the PST to all wells, then imaging them one-by-one) to avoid similarly compromising
results by light scattering.
Cell Biology Assays Crystal violet staining was adapted from standard protocol (Saotome et al., 1989). Briefly, MDA-
MB-231 cells were seeded on 96-well microtitre plates at 5000 cells/well. After 24 h, cells were
treated with the test compounds, shielded from ambient light inside light-proof boxes, and exposed to
the appropriate light regimes; here, the toxic regime was defined as 390 nm pulses of 75 ms every
15 s. In these experiments, 0.1% DMSO and 3% MeCN were present as cosolvents for all compounds
at all the concentrations tested, to ensure full solubility of all compounds and intercomparability of the
data. Following 48 h of treatment, cells were stained with crystal violet solution (0.5% crystal violet
in 20% methanol) for 10 min at room temperature. Unbound crystal violet was removed by rinsing
with distilled water and cells were subsequently air-dried. Crystal violet was then eluted from cells
with 0.05 M sodium citrate in 50% ethanol. The absorbance of crystal violet is proportional to the cell
number and was determined at 590 nm with a FLUOstar Omega microplate reader (BMG Labtech).
For statistical analysis, the absorbance readings for untreated controls (cosolvent only) were set as
100% of viable cells. Results are given as the mean percentage of viable cells relative to these
controls, +/- standard deviation (SD) from 4 representative experiments performed in triplicates.
Graphical representations and statistical analysis of the data were performed using GraphPad Prism
(GraphPad Software, La Jolla, CA, USA). Four-parameter curve fitting for sigmoidal dose–response
curves with a variable slope was used and the EC50 values and Hill coefficient were calculated.
MTT assay: Mitochondrial dehydrogenase activity in HEK-293T or HeLa cell lines was quantified
by spectrophotometrically measuring the reduction of 3-(4,5-dimethylthiazol-2-yl)-2,5-diphenyl
tetrazolium bromide (MTT) to formazan, according to standard protocol (Cushman et al., 1991). Cells
were seeded on 96-well microtitre plates. After 24 h, cells were treated with PSTs, shielded from
ambient light with light-proof boxes, and exposed to the appropriate light regimes. Following 48 h of
treatment, cells were incubated with 0.5 mg/mL MTT for 3 hours at 37 °C. The formazan crystals
were dissolved in DMSO, and absorbance at 550 nm was measured using a FLUOstar Omega
microplate reader (BMG Labtech). Results represent mean +/- SD, which are proportional to the cell
number.
Nuclear fragmentation and cell cycle analysis: Following treatment with PST under the indicated
light regime, cells were harvested on ice and incubated in a hypotonic buffer [0.1% sodium citrate,
0.1% Triton X-100 and 50 µg/mL propidium iodide (PI)] for 30 min at 4 °C. Following the PI staining
cells were analysed by flow cytometry using a FACSCalibur flow cytometer (Becton Dickinson,

Borowiak, et al., Trauner* and Thorn-Seshold* 2015 Supp. Page 32 Photoswitchable inhibitors of microtubule dynamics optically control mitosis and cell death
Heidelberg, Germany) run by Cell Quest Pro Software (Becton Dickinson). The cell cycle analysis
was subsequently performed using FlowJo software (Tree Star Inc., Ashland, OR, USA) employing
the Watson (Pragmatic) fitting model. Cells with subdiploid DNA content (inferior to G1 phase
content) were considered as apoptotic in accordance with Nicoletti (Nicoletti et al., 1991). Results
represent means +/- SD calculated for triplicates from one representative experiment out of three
independent trials.
Propidium iodide exclusion assay: Membrane integrity was assessed as a marker of cellular
viability, via examining the uptake of propidium iodide (PI) in non-permeabilised cells. Following
treatment with PST under the appropriate light regime, cells were harvested, stained with 5 µg/mL PI
in PBS containing 2% FCS (foetal calf serum), and immediately analysed by flow cytometry using a
FACSCalibur flow cytometer (Becton Dickinson, Heidelberg, Germany) with Cell Quest Pro
Software (Becton Dickinson). Data are expressed as means +/- SD of one representative experiment
out of three independent trials performed in triplicates.
Western Blot: Following 48 h of treatment with PST-1P in the dark or under 390 nm pulsed
illuminations, HeLa cells were lysed using RIPA buffer (50 mM Tris-HCl pH=7.5, 150 mM NaCl,
1% SDS, 0.5% Na-deoxycholate, 1% Triton X 100, protease inhibitor cocktail). Protein concentration
in the cell lysates was determined using Roti Quant Universal (Carl Roth) colorimetric protein
concentration detection kit according to the manufacturer’s instructions. For immunoblotting, equal
amounts of protein extracts were resolved by SDS-PAGE in 12% polyacrylamide gel and transferred
onto a PVDF membrane. The membranes were blocked with Roti Block solution (Carl Roth) and
probed with anti-PARP-1 (Cell Signaling) and anti-β-actin (Millipore) primary antibodies and
subsequently with HRP goat anti-rabbit (Cell Signaling) and HRP goat anti-mouse (Santa Cruz
Biotechnology) secondary antibodies. The immunoreactive bands were detected by the ECL method
and visualized using Fujifilm LAS-3000 Luminescent Image Analyzer.
Confocal microscopy, fixed cell imaging: MDA-MB-231 cells were seeded on coverslips and
incubated with PST-1 under dark or toxic regime (390 nm pulses of 200 ms every 2 min) for 20 h.
Then, cells were washed with pre-warmed PBS, and cell extraction buffer (80 mM PIPES pH 6.8;
1 mM MgCl2, 5 mM ethylene glycol tetraacetic acid (EGTA) dipotassium salt and 0.5% Triton X-
100) was added to remove monomeric and dimeric tubulin subunits. After 30 s of extraction, cells
were fixed for 10 min with 0.5% glutaraldehyde. Following glutaraldehyde quenching with 0.1%
NaBH4 in PBS for 7 min, coverslips were blocked with PBS containing 0.2% bovine serum albumin.
Immunostaining was performed using anti-α-tubulin antibody (ab18251) and AlexaFluor 488
secondary antibody (A 11008), purchased from Abcam (Cambridge, UK) and Invitrogen (Darmstadt,
Germany), respectively. Hoechst 33342 (bisbenzimide), purchased from Sigma Aldrich (Taufkirchen,
Germany), was used at a concentration of 1 µg/mL for nuclear staining. Cells were mounted with

Borowiak, et al., Trauner* and Thorn-Seshold* 2015 Supp. Page 33 Photoswitchable inhibitors of microtubule dynamics optically control mitosis and cell death
FluorSave reagent (Calbiochem) and analysed with a Zeiss LSM 510 Meta confocal microscope
(Jena, Germany). Acquired images were processed using ImageJ open-source software (National
Institutes of Health). Representative images are shown. White scale bars correspond to 20 µm.
Confocal microscopy, live cell imaging: HeLa cells were plated on 8-well ibiTreat µ ibidi slides
(ibidi, Martinsried, Germany) 24 h prior to transfection. Cells were transiently transfected with EB3-
mCherry plasmid using jetPRIME reagent (Polyplus) according to manufacturer’s indications. Cells
were imaged twenty-four hours later using an UltraVIEW VOX spinning disk confocal microscope
(PerkinElmer) operated with the Volocity software. During imaging cells were maintained at 37°C in
a 5% CO2 atmosphere. Cells were imaged briefly prior to the application of the test solution, in order
to establish a reference point for basal EB3 dynamics, then treated either with PST-1 (final
concentration 10 µM, with 0.5 % MeCN cosolvent) or else with cosolvent only, and incubated for
10 min in the dark. Then, cells were imaged at 561 nm at a rate of 17 frames per minute, with
alternating phases of pulsed photoisomerisation illuminations at 514 nm and 405 nm (one 100 ms
pulse every 3.53 s) in between of the imaging, with each phase lasting for 2 min (34 frames). EB3
comets were tracked using the MATLAB program u-track (Applegate et al., 2011). For each cell, we
selected two to three regions of interest (ROI) of 0.22 x 0.22 µm for tracking. This increases the
efficiency and accuracy of comet detection by allowing us to exclude the region around the
centrosome, where the fluorescent signal background is too strong to allow a correct detection of the
comets. We chose conservative parameters for tracking to avoid detecting false positive signals
(confirmed by visual inspection of the tracked movies; parameters are shown in the table below);
consequently, the number of EB3 dots detected by the program can be somewhat underestimated (as
in Movie S3).
Detection parameters
Gaussian filter parameters Min (pix) 1 Max (pix) 4
Watershed segmentation parameters Min (std) 6 Step size (std) 1
Tracking parameters
Parameters Max gap to close (frame) 3
Min length of track segments from 1st step (frame) 2
Frame-to-frame linking
Brownian search radius (pix) 1-13 Multiplication factor for Brownian search
radius 2
Number of frames for nearest neighbor distance calculation 3
Gap closing, merging and
splitting
Max forward angle (°) 30 Min backward angle (°) 10
Max shrinkage factor 1 Fluctuation radius 1
For each ROI, at each illumination phase, we measured the number of EB3 dots, their average
lifetime, average travelled distance and average speed (distance/lifetime). The number of EB3 dots
was expressed as a percentage of the initial, 561 nm phase comet number, to enable comparison
Borowiak, et al., Trauner* and Thorn-Seshold* 2015 Supp. Page 34 Photoswitchable inhibitors of microtubule dynamics optically control mitosis and cell death
between ROIs covering different cell areas; other quantities were kept as original values since the
561 nm phase values for these parameters were almost identical between different cells and movies.
For each illumination phase, the mean phase values across multiple experiments were then calculated
by averaging the values from multiple ROIs from several cells (in total 10 ROI per condition). During
405 nm phases with PST-1, EB3 dots were most often entirely undetectable by visual inspection as
well as using the u-track program, therefore in such phases the comet parameters were set to 0.
C. elegans experiments PST-1 experiment: The C. elegans fluorescent strain ANA090 (unc-119(ed3)III, ltIs44[pAA173;pie-
1::mCherry::PH(PLC1delta1)+unc-119(+)]V ; ltIs37[pAA64;pie-1::mCherry::his-58 + unc-
119(+)]IV) was cultured using standard protocols and maintained at 25 °C. This strain allows the
visualisation of the cell membrane and histones in the same channel with excitation at 561 nm. To
permeabilise the embryo shell and allow the entry of PST-1 into cells, RNAi against perm-1 was
performed by feeding ANA090 L4 larva on HT115 bacteria for at least 24 h (Carvalho et al., 2011).
Embryos were mounted with 40 µM PST-1 diluted in physiological worm buffer M9 containing 2%
MeCN, onto a 2% agarose pad between slide and coverslip. Embryos were imaged using an inverted
Zeiss LSM 710 confocal microscope controlled by the ZEN software with a 40× objective.
Fluorescence imaging was conducted with 561 nm laser excitation pulses every 968.14 ms using a 3×
digital zoom. Photoisomerisations were performed within defined ROIs using 405 nm and 514 nm
lasers, with appropriate pulses applied every 30 s. The exposure area was chosen as a circle of
diameter between 60—90 pixels (8.3—13 µm), and area irradiation time per pulse varied between
2—5 ms.
Colchicine control experiments: The C. elegans fluorescent strain, ANA058 (oxIs279[pie-
1::GFP::histone] II; ItIs25[pAZ132, pie-1:GFP::tba-2]) was cultured using standard protocols and
maintained at 25°C. This strain allows the visualisation of microtubules and histones in the same
channel with excitation at 491 nm. Embryo shells were permeabilised as per the above procedure.
Embryos were placed on a polylysine-coated coverslip and covered with M9 buffer, and 25 µL of
colchicine (100 mM) were added. Embryos were imaged using an inverted spinning disc confocal
microscope (Leica DMI400, Leica Microsystems, Mannheim, Germany) equipped with a 100×
immersion objective and controlled by Metamorph software (version 7.5.6). Images were acquired
with an EMCCD Camera (Andor, iXion3 897) every 0.5 s.
Mouse cremaster muscle experiments Animals: Male C57BL/6 mice at the age of 10-12 weeks were purchased from Charles River
(Sulzfeld, Germany). Animals were housed under standard laboratory conditions with free access to

Borowiak, et al., Trauner* and Thorn-Seshold* 2015 Supp. Page 35 Photoswitchable inhibitors of microtubule dynamics optically control mitosis and cell death
food and water ad libitum. All experiments were performed according to German legislation for the
protection of animals.
Surgical procedure: The microsurgical preparation of the cremaster muscle was performed as
described by Baez with minor modifications (Baez, 1973). Briefly, mice were anesthetised with an
intraperitoneal injection of ketamine/xylazine mixture (100 mg/kg ketamine and 10 mg/kg xylazine).
The right cremaster muscle was exposed through a ventral incision of the scrotum. The muscle was
opened ventrally in a relatively avascular zone, using careful electrocautery to stop any bleeding, and
spread over the pedestal of a custom-made microscopy stage. Epididymis and testicle were detached
from the cremaster muscle and placed into the abdominal cavity. Throughout the experiment, the
muscle was superfused with phosphate buffered saline (PBS) and was kept at 35°C by using a heating
lamp. The body temperature was maintained at 37°C using a heating pad placed under the mouse. At
the end of the experiment, the cremaster muscle was excised and processed for
immunohistochemistry. Anaesthetised animals were then euthanised by an overdose of pentobarbital
(Narcoren, Merial, Hallbergmoos, Germany).
In vivo light-dependent microtubule disruption experiment: Following the cremaster muscle
preparation, PST-1P (50 µM) was added to the superfusion solution. For activation of PST-1P, a
single 390 nm LED (VL390-5050, Roithner Lasertechnik, photon output est. 10 mW with cone angle
120°) centered 2 cm above the cremaster was used to supply constant illumination for 40 min. For the
dark control, the mouse was kept in the dark. As controls, PBS superfusion was maintained and the
mouse was kept in the dark or was irradiated for 40 min using the same 390 nm LED setup.
Replicates performed: Active experiment (PST-1P + 390 nm): n=3, dark control (PST-1P, no
illumination, protection from ambient light): n=2, illumination control (PBS + 390 nm): n=2, negative
control (PBS only, no illumination, protection from ambient light): n=3.
Immunostaining and Imaging: Immediately after the treatment, the muscle was superfused with
microtubule stabilising buffer (80 mM PIPES pH 6.8, 1 mM MgCl2, 1 mM EGTA, 0.5% Triton X-
100 (Sigma Aldrich, Munich, Germany)). Glutaraldehyde was added to a final concentration of 0.5%,
to rapidly fix the tissue, and after 10 min, the cremaster muscle was dissected and incubated in 0.1%
NaBH4 in PBS to quench unreacted glutaraldehyde, following standard protocols (Desai et al., 2012).
After washing the tissue with PBS, it was blocked for 30 min at room temperature using PBS
supplemented with 0.5% Triton X-100 and 2% bovine serum albumin (Sigma Aldrich, Munich,
Germany). Staining was performed using anti-α-tubulin antibody YL1/2 (Chemicon, Hofheim,
Germany) and Alexa Fluor 546 goat anti-rat secondary antibody. Subsequent nuclear staining was
performed using TO-PRO-3 Iodide (642/661) (both from Life Technologies, Carlsbad, CA, USA).
The immunostained cremaster muscle was mounted between a glass slide and a coverslip using
PermaFluor (Beckman Coulter, Krefeld, Germany). Samples were analysed using a Leica SP5
confocal laser-scanning microscope with an oil-immersion lens (63×; NA 1.40; Leica Microsystems,
Borowiak, et al., Trauner* and Thorn-Seshold* 2015 Supp. Page 36 Photoswitchable inhibitors of microtubule dynamics optically control mitosis and cell death
Wetzlar, Germany), as described previously (Rehberg et al., 2010). Images were processed with
Imaris 7 software (Bitplane, Zurich, Switzerland).
RESULTS Part C: Cell Biology
Details and build guide for the cell culture “Disco” setup constructed to deliver pulsed light sequences
were given in Materials and Methods and Appendix 2. Discussion of the cell biology assay design
is presented in Appendix 4.
C.1: Toxicity dependency on pulse frequency and illumination wavelength Examination of light pulse timing parameters in HEK-293T cell line: Controls for the pulse
timings in the toxic regime at 390 nm were performed using MTT assay in HEK-293T cell line over
72 h incubation (in 0.04% MeCN) with PST-1. A range of low concentrations of PST-1 (τ≈7 min)
were tested, with varied pulse timings. Sequences used were: 1) 50 ms ON / 15 s OFF; 2) 200 ms ON
/ 60 s OFF; 3) 1 s ON / 5 min OFF; 4) 1 s ON / 25 min OFF; and also 5) a double-cycling sequence
where a phase of (2 s ON / 7 s OFF) lasting 90 seconds was followed by 120 min without light. These
sequences are designed to apply roughly identical time-average photon flux to the samples. Results
are given in Figure S2O, and show (a) that the timing pattern, and not the total photon flux, is the
main determinant of cytotoxicity, and (b) that the interval tpause between pulses should be on the order
of, or less than, the in vitro-determined τ for best cytotoxic effects. This experiment therefore
indicates that PST-1 is not acting as a phototoxin, as phototoxicity should not depend on the tpause but
only on total irradiation dose. Instead the PST-1-induced cytotoxicity is correlated to the time-average
concentration of cis-PST: due to its spontaneous reversion kinetics, only illuminations with τ ≥ tpause
maintain high time-average cis-PST levels for potent toxicity (see too Appendices 2 & 4).
Wavelength-dependency of cytotoxicity in HeLa cell line: Detailed examination of the wavelength-
dependency of PST toxicity was performed using MTT assay in HeLa cell line over 44 h incubation
with PST-1P (no cosolvents). Our hypotheses were that (1) PSS is established at all strongly absorbed
wavelengths; (2) only the cis isomer is responsible for cytotoxicity at biologically relevant doses
(<100 µM), therefore the toxicity profiles should be primarily determined by the PSS’s cis content,
and should not depend on the total (cis+trans) PST content. Under these hypotheses, the dose-
response curves for different wavelengths would be translated on the horizontal axis [total (cis+trans)
PST content] by a factor corresponding to the %cis which is actually contained in the PSS; and the
experimental EC50 values [EC50(λ)] should thus correspond to the EC50 for a hypothetical pure-cis
sample [EC50(cis)] as follows:
[EC50(λ) × PSSexp(λ)] = EC50(cis)

Borowiak, et al., Trauner* and Thorn-Seshold* 2015 Supp. Page 37 Photoswitchable inhibitors of microtubule dynamics optically control mitosis and cell death
Dose-response curves were established by MTT assay following PST treatment under exposure to
light at varying wavelengths (370-535 nm and dark) under constant pulse timing (75 ms ON / 15 s
OFF) that was intended to establish PSS even at the weakly-absorbed wavelengths (tpause is much
smaller than τ). Results are given in Figure 2C-D and Figure S1C, showing representative dose-
response curves and tabulating all the corresponding EC50 values. We had already modelled the PSS
by deriving φ(λ) in the Photocharacterisation section (see Part B and Figure S1A; the relevant curve
is the φ(λ) of PST-1 since this is the bioactive metabolite of the PST-1P prodrug). Therefore, to test
our hypothesis, we postulated a reasonable fit as EC50(cis)=0.68 µM; and we back-calculated
PSSexp(λ) values, which in Figure S1C are tabulated side-by-side with the corresponding PSSmodel
values [=φ(λ)] from Part B.
These results indeed show: (A) that the dose-response curves at 370-525 nm are essentially horizontal
translations of each other, while the dark curve has a markedly flatter gradient, and the curve at
535 nm has an intermediate form between the two possibilities; (B) for all wavelengths 370-525 nm,
the values of PSSexp(λ) derived under our twin hypotheses are close to the PSSmodel(λ) values that we
calculated in the Photocharacterisation section, despite the many differences of assay conditions and
even of readout, and despite that the EC50(λ) values occupy nearly a ten-fold concentration range; (C)
the differences between PSSexp(λ) and PSSmodel(λ) do not reveal a systematic drift which might argue
for systematic error (eg, consistent underestimation of the observed toxicity at the UV wavelengths
could argue for biochemical photodamage).
We interpret these results as follows: (1) our LED system was appropriate to achieve and maintain
PSS at all wavelengths 370-525 nm; and for these wavelengths, (2) the fraction of the cis isomer at
PSS is appropriately modelled by φ(λ) with λ taken as the nominal peak emission wavelength of the
LED type used (despite the known significant bandwidth of LED sources and its variation with
voltage and temperature), and (3) for these wavelengths the concentration of cis form as reflected in
the PSS is the only significant determinant of cytotoxicity since the form of the dose-response curves
depends entirely on the cis concentration (curve translation according to the %cis) and does not
change with the trans concentration. (4) The dark case, with 100% trans isomer, shows that the trans
form’s toxicity (EC50>200 µM) is more than 250× lower than that seen for the cis isomer
(EC50<0.70 µM), and (6) the trans form’s primary mechanism of toxicity is different from the cis,
since the form of the trans dose-response curve is substantially different (much flatter curve). (7) The
shape of the 535 nm curve is intermediate between the cis and trans curves, and its PSSexp(λ) is far
from our modelled prediction; we hypothesise that the 535 nm LEDs were not intense enough to
compensate for the very weak light absorption at this wavelength (cf. Figure S1A) therefore the true
PSS was not reached, and that the toxicity arising from the small percentage of cis generated was
comparable to overall toxicity of the remaining percentage of trans: so one might estimate
approximately 1% cis established.
Borowiak, et al., Trauner* and Thorn-Seshold* 2015 Supp. Page 38 Photoswitchable inhibitors of microtubule dynamics optically control mitosis and cell death
Together with the results presented above and below, these combined data argue that the toxicity
resulting from inhibition of tubulin polymerization induced by PSTs may be modulated by the
combination of (a) the total dose of PST applied, (b) the wavelength(s) applied (with regards to their
E(λ) and PSS(λ)), (c) the chronological order of the applied wavelength(s), (d) the time-average
photon flux and the pulse frequency relative to τ. As E(λ), PSS(λ) and τ depend intrinsically on
molecular design, this highlights the need for rational design to achieve satisfactory light control of
PSTs’ bioactivity. It also shows that lighting and dose conditions can be chosen and tuned to respond
to experimental constraints, in a predictive manner, by considering the key isomerisation parameters
which can be influenced by chemical design (Beharry et al., 2011a; Beharry and Woolley, 2011b) and
then measured experimentally in vitro.
C.2. Photoactuated cytotoxicity of PSTs The cytotoxicities of the PSTs under both dark and toxic regimes were assessed using crystal violet
staining in MDA-MB-231 cells (Figure S2A-I) as detailed in the Materials and Methods. For all the
PST compounds tested, strong dose-dependent toxicity was observed with activating irradiation (toxic
regime). Importantly for the rationale of our design of this optically controlled OFF↔ON tubulin
polymerisation inhibitor / cytotoxin, the large toxicity enhancement upon irradiation (up to 100× in
this cosolvent-containing assay), combined with the steepness (nonlinearity) of the dose-response
relationships, promises a wide “therapeutic window” of concentrations. For example, up to 10 μM
trans-PST-1P generates nearly no toxicity, whereas above 200 nM cis-PST-1P strongly reduces cell
viability. One could therefore consider an “optical therapeutic window” of between 200 nM—10 μM:
inside this 50-fold concentration range, PST-1P can be applied globally but photoisomerised locally,
to give strong localised cytotoxicity without effects in non-irradiated cells.
MTT assays performed in HeLa cells (Figure S2J-N) confirmed our results from crystal violet
staining performed in MDA-MB-231 cells (Figure S2A-I), indicating therefore potent cytotoxic
properties of PSTs across different cell types.
C.3: G2/M phase cell cycle arrest (PST-1 and PST-1P) The effect of PSTs on cell cycle progression was assessed by flow cytometry as described in the
Materials and Methods. Results for PST-1 were shown in Figure 3D-E; additional results are
shown in Figure S3F-H (MDA-MB-231 cells with PST-1 and PST-1P), Figure S3I (HEK-293T
cells, PST-1) and Figure S3J (HeLa cells, PST-1). The toxic regime was set here as 390 nm pulses of
350 ms every 5 min; in the rescue regime each 390 nm pulse was immediately followed by 515 nm
light pulses of 800 ms; and a 515 nm-only regime with that timing was used as a reference.
Borowiak, et al., Trauner* and Thorn-Seshold* 2015 Supp. Page 39 Photoswitchable inhibitors of microtubule dynamics optically control mitosis and cell death
No changes in the repartition of the cell cycle phases were observed in the dark regime despite
treatment with even up to 100 µM PST-1 (Figure S3F). This indicates, in accordance with the
hypothesis of the study, that trans-PSTs do not interact potently with tubulin and that their
mechanism of cytotoxicity at very high concentrations is also not related to tubulin. By contrast, cis-
PSTs showed strong G2/M phase arrest under the toxic regime mirroring the effect of the PSTs’
parent compound CA4 (Figure 3D-E and Figure S3G-J). Moreover this effect was reduced under the
rescue protocol (Figure S3H). This reduction of G2/M phase arrest under the rescue regime reinforces
the hypotheses that [cis-PST] is the main determining factor for the PSTs’ biological effects in
practical settings, and that in our experiments, [cis-PST] is determined by the applied dose of PST
multiplied by a scaling factor for the PSS(λ). The similarity of the results in Figures S3G-I-J again
indicates that the cytotoxicity of cis-PST-1 is generalizable across cell lines of different origins.
C.4: Membrane permeability induced by PST-1 Membrane permeability assessment was performed as detailed in the Materials and Methods.
Similarly to the results obtained in MDA-MB-231 cell line (Figure 3A), a light-dependent induction
of membrane permeability was also shown in HeLa cells (Figure S3A) after 70 h treatment with
PST-1. Under the toxic regime, dose-dependent increases in membrane permeability were evident,
attaining a similar level to those seen with the parent compound CA4, but no toxicity of PST-1 was
observed in the dark.
C.5: Nuclear fragmentation (PST-1) A quantification of nuclear fragmentation was performed as detailed in the Materials and Methods,
on MDA-MB-231, Jurkat and HeLa cells treated with PST-1 (Figure 3B and Figure S3B-E; note that
the panels of Figure S2C-D present overlapping data sets). Conditions: MDA-MB-231 and Jurkat:
toxic regime - 350 ms pulses every 5 min, treatment time 48 h; HeLa: toxic regime - 1 s pulses every
15 min, treatment time 30 h. In all cell lines tested, the toxic regime at 390 nm resulted in steep
induction of nuclear fragmentation with submicromolar PST-1, showing an effect similar to the one
induced by the parent compound CA4. In the dark regime, the PST response began only at 100 – 300
times higher concentration than under the toxic regime. Jurkat cells were most sensitive to PST-1
(EC50 of 80 nM under the toxic regime) however all cell lines gave qualitatively similar response.
This again indicated that PSTs have a generalizable mode of cytotoxic action across different cell
lines (as is appropriate to CDIs) and that their cytotoxic mechanism may be controlled by light.
C.6: IF staining of tubulin in fixed cells Immunofluorescence tubulin staining was performed in MDA-MB-231 cells as described in the
Materials and Methods. Figure S4A shows a representative image after CA4P treatment. CA4P led
Borowiak, et al., Trauner* and Thorn-Seshold* 2015 Supp. Page 40 Photoswitchable inhibitors of microtubule dynamics optically control mitosis and cell death
to complete microtubule breakdown and fragmentation of the nuclei (typical for apoptotic cells). This
is a positive control to the PST-1 immunofluorescence studies shown in Figure 4C.
Part D: C. elegans experiments Still images of C. elegans embryos bathed in 40 µM PST-1 and exposed to single-cell-localised ROI
illumination with different conditions as outlined in the Methods, are shown in Figure 6A-B. The
videos from which Figures 6A and 6B are drawn are available as Movie S4 and Movie S5
respectively. The experiments show that single cells within C. elegans embryos can be targeted for
mitotic arrest by localised illumination with 405 nm light (bulk isomerisation to the cis form within
the defined ROI; representative results from n=8 independent experiments are shown). Rescue
protocol experiments such as Movie S5 show that by adding a second pulse component at 514 nm
after each pulse of 405 nm, there is no mitotic block (bulk of PST-1 is kept as trans isomer, since
although each 405 nm pulse component favours cis, the immediately subsequent 514 nm component
then induces bulk photodeactivation to trans); while an internal positive control within the experiment
(cell with 405 nm pulse component only) was arrested in mitosis (n=2). In all cases, the neighbouring
cells outside the ROIs, including those with cell cycle synchronised to the selected cells, divided
normally.
Figure S4B-E shows representative images from control experiments examining the potential effects
of illumination parameters on the mitotic progression, as well as behaviour of PST-1 in the absence of
photoisomerising illumination. These accompany the C.elegans experiments shown in Movies S4-S5
discussed above. Figure S4B shows a dark control with PST-1: the cell cycle progression is not
altered by PST-1 at 40 µM in the absence of activating irradiation, even in the long term. PST-1 was
applied at t=0 min and embryos were imaged for up to 150 min. No perturbation of embryonic
development was observed as many cell divisions occurred successfully (n=6). Figure S4C-D shows
illumination controls in the absence of PST-1: the single-wavelength (405 nm only) and dual-
wavelength (405 followed by 514 nm) irradiation regimes do not affect cell cycle progression in the
absence of PST-1 (C: n=4; D: n=2). Figure S4E shows a further control for the rescue regime: PST-1
does not give mitotic arrest when irradiated at 514 nm only (n=4). Taken together, these results show
that generating mostly trans-PST-1 allows mitosis to proceed, while generating significant cis-PST-1
arrests it; and cis→trans photoswitching efficiently allows cells to continue mitosis after exposure to
concentrations of the cis isomer that would otherwise leave them arrested.
Lastly, positive controls using the archetypal CDI, colchicine itself, were performed (Figure S4F-G)
Note that the C. elegans strain (expressing GFP-tagged tubulin and histones) used here allows for
direct visualisation of mitotic spindle and chromosome position. When colchicine was applied,
chromosomal segregation was stopped and the microtubules depolymerized, whether colchicine was
applied during metaphase or anaphase (Figure S4F and G respectively). The observed effect exactly
Borowiak, et al., Trauner* and Thorn-Seshold* 2015 Supp. Page 41 Photoswitchable inhibitors of microtubule dynamics optically control mitosis and cell death
mirrors the arrest of chromosomal segregation seen with PST-1 under 405 nm illumination and
confirms that cis-PSTs behave as expected for a CDI in this model system.
Considering the combined data from these experiments, we can rule out that PST-1's effect on mitosis
is due to phototoxicity or a photosensitised mode of specific biochemical damage (eg. the
chromophore-assisted laser inactivation effect), since then the Rescue cells e.g. in Figure 4B and
Movie S5 would also experience these effects, instead of dividing normally. We thus conclude that
PST-1 is inactive as an antimitotic in the dark, can be efficiently photoactivated by short 405 nm
pulses, and can then be reversibly photodeactivated by short 514 nm pulses (up to 20
activation/deactivation cycles shown in Movie S5). Thereby, PST-1 enables full and reversible
photocontrol of mitosis on a single-cell level within the living organism, without affecting the
progression of mitosis in neighbouring cells, and presenting no “background activity” in the absence
of targeted illumination.
Part E: Mouse cremaster muscle experiment Mouse cremaster muscle was treated with 50 µM PST-1P (or PBS only) under 390 nm or in the dark.
Following the treatment, muscle was fixed, stained and imaged as outlined in the Materials and
Methods. Figure S5A-D gives larger-scale and wider field of view images of the data that are shown
in Figure 6C. PST-1P achieved clear disruption of MTs in vivo under 390 nm irradiation; but in the
dark it had no effects on the microtubule cytoskeleton that could be distinguished from the PBS
negative controls.
Borowiak, et al., Trauner* and Thorn-Seshold* 2015 Supp. Page 42 Photoswitchable inhibitors of microtubule dynamics optically control mitosis and cell death
Appendix 1: Photoisomerisation parameter space
Rationale for the quantities to be measured by in vitro studies: We aimed to evaluate those isomerisation parameters of the PSTs which would be needed to
satisfactorily design PST biological assays, and to evaluate and intercompare the results. Key
measurements were therefore to be taken at 37 °C in aqueous solution (cell culture purpose PBS at
pH∼7.4, with 10% acetonitrile for solubility). We focussed on deriving qualitatively useful estimates
of three key parameters: (1) PSS(λ), the fraction of cis isomer established at the photostationary state
(the condition when trans↔cis photoisomerisations are in equilibrium under saturating photon flux)
as a function of wavelength. PSS(λ) depends strongly on the relative ratio between εE(λ) and εZ(λ) (the
absorption coefficients of the trans and cis forms at wavelength λ), among other factors; (2) the
relative efficiency E(λ) of approaching the PSS(λ) as a function of that wavelength λ. E(λ) reflects
the magnitude of the photon flux one would need to apply to photoisomerise a mixture of trans and
cis forms from a starting cis/trans ratio by a given percentage towards the cis/trans ratio at PSS(λ).
E(λ) depends strongly on the absolute magnitudes of both εE(λ) and εZ(λ), among other factors; (3) the
thermal reversion halflife τ for the spontaneous Z→E isomerisation.
PSS(λ), E(λ) and τ should inform the design of appropriate lighting conditions for long-term
biological experiments, since for these, samples should not be irradiated at high intensities or with
high net flux (Boonacker and Van Noorden, 2001; Grossweiner, 2005; Ibsen et al., 2013). If
irradiation is to be applied at a fixed intensity as a function of wavelength [I(λ)], then limiting the
applied flux while favouring the maintenance of the PSS is most easily achieved by applying pulses of
time length tIR, with the interval tpause between pulses chosen to be rather less than τ; 1/[I(λ)×E(λ)]
could be used as a factor to scale the relative pulse durations tIR(λ) so that the PSS(λ) is approached
equally at each wavelength applied (for in cellulo studies, ε(λ)×c×l is relatively small so we ignore
absorbance along the optical path).
These parameters also enable a key analysis and comparison of assay data. If the PSS is
essentially maintained by appropriate lighting conditions with tpause<<τ, then [Z]*(λ) – the product of
the total applied concentration of PST, and its PSS(λ) – approximates the time-average concentration
of cis-PST in the assay. The local net antitubulin effect generated might then be understood
simplistically as the product of [Z]*(λ) with a wavelength-independent Inhibitory Factor which would
crudely describe the cis-PST’s strength of tubulin polymerisation inhibition (which for PSTs should
reflect not only the cis isomer’s kinetic parameters of binding/unbinding and thermodynamic binding
strength, but also eg. kinetic parameters of Z→E relaxation in the active site, and of the trans isomer’s
unbinding kinetics). This crude model was rather extraordinarily successful even when applied to far-
downstream readout given in the long term, by cytotoxicity results obtained in the complex in cellulo
environment (see Figure S1C). Therefore we concluded that under our assay conditions, PSS(λ) was
reliably established, and we could indeed intercompare the PSTs’ inhibitory strengths.
Borowiak, et al., Trauner* and Thorn-Seshold* 2015 Supp. Page 43 Photoswitchable inhibitors of microtubule dynamics optically control mitosis and cell death
Note however, that the quantitative predictive power obtainable by using any particular set of
in vitro-determined, solution-state values of τ, PSS(λ), and E(λ) was not considered to be strong, since
there are large uncertainties about the true intracellular concentration, location, and expected
isomerisation behaviour of an applied PST. Strong bioconcentration of the lipophilic combretastatins
inside cells (relative to the applied extracellular concentration), and their inhomogeneous repartition
between different cellular compartments, have been reported (Bisby et al., 2012). The PSTs too were
predicted (calculated cLogP ~3-5) and observed (long retention times on reverse phase LCMS) to be
relatively lipophilic; and similar bioconcentration of the PSTs would reduce the accuracy of using the
applied dose to model the true [Z]*. Furthermore, azobenzenes have strong environment-dependence
of τ, and to a lesser extent also of PSS(λ) and E(λ); and even in fully aqueous media τ depends
strongly on the pH especially below pH 5-6 (Knoll, 2003). Therefore PSTs located in different cell
types, in different cell compartments (eg cytosol vs. lipid membranes), or even lipophilically adsorbed
onto carrier proteins (Bisby et al., 2012), would experience a range of solvent environments and pH
values which should locally alter these three isomerisation parameters far from any single set of in
vitro-determined values, providing a spatiotemporally heterogeneous distribution of stocks and sinks
of the active cis form. Even the model that a certain effective pool of cis-PST at concentration [Z]*(λ)
establishes a binding equilibrium with tubulin, where the proportion of bound tubulin then determines
the “downstream biological readout,” is also a simplification, due to the potential for bound-state
relaxation. If the cis→trans relaxation rate of bound PSTs is significantly different from the bulk rate,
then considering only solution-state τ will be insufficient to understand the PSTs’ bioactivity. Bound-
state relaxation may also arise by photoisomerisation since the PSS(λ) is a dynamic equilibrium state.
The effect these may have on overall MT inhibition is difficult to predict (especially at rather low
PST concentrations only slightly beyond the threshold for bioactivity, which would be most
interesting for biological applications). However, both could be very important, as the on-off kinetics
and lability of CDIs have been argued to play a vital role in determining their biological consequences
in diverse systems and assays (Jordan, 2002). Indeed from ongoing studies it seems likely that an
altered-τ effect may contribute to the unexpectedly weaker toxicity of cis-PSTs compared to CA4.
With so many unknowns, we considered a full analytical description of PSTs’ light-
dependent bioactivity impossible. So, for initial qualitative intercomparison of the PSTs we simply
determined estimates for solution-state PSS(λ), E(λ) and τ under reasonable conditions, by
measurements which could simply be precise enough to be intercomparable between compounds. Our
tests for whether these estimates, along with our simplistic model of Z*(λ), were good enough to
inform an initial choice of biological assay conditions which could later be optimised, were the
wavelength- and pulse timing-dependency assays shown in Figure S1C and Figure S2O. The
successful outcome and logically consistent analysis of these assays under our simple model, argued
that for our assay purposes, the prediction of the PSTs’ wavelength-, pulse protocol-, and
concentration-dependent effects required no more detailed investigations than this.
Borowiak, et al., Trauner* and Thorn-Seshold* 2015 Supp. Page 44 Photoswitchable inhibitors of microtubule dynamics optically control mitosis and cell death
Defining and determining εE(λ) and εZ(λ), PSS(λ), τ, and E(λ): Measuring εE(λ) and εZ(λ): UV-Vis absorption spectra Adark(λ) in the range 340 nm < λmeas < 540 nm
were acquired, with samples kept in the dark overnight, so it was assumed that no significant spectral
contribution from the cis isomer was present in these spectra. Then, an isosbestic point (wavelength
λiso) was found for each compound by monochromator irradiation. See Part B for details.
HPLC (high-performance liquid chromatography) was then used with the run conditions described in
Part A to measure ε*E(λ) and ε*Z(λ) (the separated absorption profiles of trans and cis isomers
respectively, in arbitrary units which are not intercomparable in an absolute sense). Although these
spectra are acquired in less well-defined and less biologically appropriate medium (usually 50:50 to
90:10 acetonitrile:slightly acidified MilliQ water (depending on the elution time) and 25 °C), it was
approximated that these spectra would be identical in shape if measured under the UV-Vis conditions.
To place the arbitrary-unit absorption spectra on an absolute scale, the maximal absorption
wavelength λstrong of the trans-isomer was first selected from the UV-Vis measurement: typically,
λstrong≈380 nm. Expressing Adark(λ) in units M-1cm-1, ε*E(λstrong) was then scaled so that εE(λstrong) =
Adark(λstrong), giving:
εE(λ) = ε*E(λ)×[Adark(λstrong)/ε*E(λstrong)] (Eq. 1)
and the isosbestic point was used to scale the cis-isomer spectrum as per:
εZ(λ) = ε*Z(λ)×[εE(λiso)/ε*Z(λiso)] (Eq. 2)
The measured value of A(λiso) could also have been used to scale the spectra, with the advantage that
finding A(λiso) does not require samples to be kept in the dark prior to UV-Vis measurement.
However, using Adark(λstrong) was preferred, since (1) A(λiso) was typically much smaller than
Adark(λstrong); (2) the gradient around A(λiso) is much larger than around Adark(λstrong); (3) λiso was seen
to depend more on the solvent than λstrong; these three factors give the result that the standard deviation
in the scaled absorptivities which the λstrong method generated was smaller.
Calculating PSS(λ): In a simple analysis of the PSS(λ), it was approximated that ΦEZ and ΦZE [the
quantum efficiencies of the photoisomerisations trans→cis and cis→trans, respectively] are equal and
independent of wavelength, and also that the kinetics of spontaneous reversion could be ignored (i.e.
in the target experimental conditions, photoisomerisation is the strongly dominant bulk isomerisation
pathway, comparing to thermal relaxation). A function φ(λ) was then calculated as per:
φ(λ) = εE(λ)/[εZ(λ) + εE(λ)] (Eq. 3)
If ΦEZ and ΦZE are equal and independent of wavelength, φ(λ) gives the true PSS(λ). The
wavelength independence of ΦEZ and ΦZE may be an acceptable approximation in regions of relatively
strong absorption within the visible spectrum. Their equality may also be an acceptable assumption:
since if ΦEZ and ΦZE are unequal but only depend weakly on wavelength in regions of relatively
Borowiak, et al., Trauner* and Thorn-Seshold* 2015 Supp. Page 45 Photoswitchable inhibitors of microtubule dynamics optically control mitosis and cell death
strong absorption, then φ(λ) is a transform of the true PSS(λ), and this transform preserves the
features of PSS(λ) which were most desired for evaluation in this study as long as ΦEZ and ΦZE are not
too different (eg less than a factor of ten difference). Indeed, the calculated φ(λ) were later confirmed
by in cellulo experiments to give reliable indications of both favourable wavelengths for bulk
trans→cis and bulk cis→trans photoisomerisation, and of the experimentally-experienced PSS(λ)
(see Figure S1C). The advantages of calculating φ(λ) rather than exhaustively measuring the PSS(λ)
experimentally are that (a) the throughput is much faster, (b) the true PSS(λ) may be difficult to
achieve at weakly-absorbing/inefficiently-isomerising wavelengths or with fast-relaxing compounds,
(c) the true PSS(λ) may be difficult to measure accurately at wavelengths where one isomer strongly
dominates the sample even if both are relatively strongly absorbing, and (d) the variation of PSS(λ)
with changes in the local biological microenvironment (polarity, pH etc.) may anyway be larger than
the error incurred by the assumption φ(λ)=PSS(λ).
Calculating E(λ): To consider the efficiency E(λ) of approaching the PSS(λ) under flux-limited
conditions [where a relatively low light intensity is applied, so that the sample does not
instantaneously attain PSS(λ)], in a simple analysis we again approximated that ΦEZ and ΦZE are equal
and independent of wavelength. Then, ignoring spontaneous reversion, we derive Z(t) [the proportion
of a sample present as the Z form after irradiation at a given wavelength ‘for time t’ - where t is a
dummy parameter reflecting normalised photon flux] as follows:
dZ(t)/dt = E(t)εE(λ) - Z(t)εZ(λ) (Eq. 4)
Defining the sum of the absorptivities σσ(λ) = [εE(λ)+εZ(λ)], we then have
Z(t) = Z(t0)exp[-σ(λ)t] + εE(1-exp[-σ(λ)t])/σ(λ) (Eq. 5)
Note in passing that maximising or minimising (Eq. 4) implies that under flux-limited conditions, the
optimum wavelength for effecting photoisomerisation in either direction (Z→E or E→Z) is not a
constant, but depends on the current Z:E isomeric ratio. Typically, for E→Z isomerisation, the
optimum wavelength varied by only 10-20 nm for 0 < Z(t0) < 0.9; however, for the “rescue”
wavelength used to effect Z→E isomerisation, for a typical compound the variation could be
substantial (>100 nm) even over the range 0.2 < E(t0) < 0.8. This makes quoting an “optimum rescue
wavelength” a gross simplification, which sometimes missed key qualities.
To compare efficiencies of approaching the PSS as a function of wavelength, note that the “rate
constant” for this photoisomerisation process is σ(λ) (see Eq. 5). Thus a relative photoisomerisation
efficiency E(λ) was calculated as per Eq. 6, and is graphed in Figure S1A:
E(λ) = σ(λ)/[σ(390)] (Eq. 6)
Larger values of E(λ) therefore denote higher efficiency photoisomerisation [less photon flux is
required to approach the PSS(λ)], where E(λ) is parametrised to σ(390) since typically 390 nm gave
Borowiak, et al., Trauner* and Thorn-Seshold* 2015 Supp. Page 46 Photoswitchable inhibitors of microtubule dynamics optically control mitosis and cell death
strong absorption and efficient photoisomerisation, ie. satisfactorily rapid attainment of a cis-rich PSS
useful for biological studies (see Figure S2). It should be noted that E(λ) are not intercomparable
between compounds, especially as the ΦEZ (or the ΦZE) of two arbitrarily chosen compounds may
differ by a significant amount, even if the approximation that ΦEZ and ΦZE are equal and independent
of wavelength applies independently to each compound. Thus while E(λ) does not present new
measured information, as an efficiency measurement it is a convenient quantity, whereby increasing
E(λ) denotes higher efficiency isomerisation (lower dose of light required to approach the PSS(λ)).
Trends in τ: Finally, trends in τ were ascertained by establishing the PSS at λstrong, then turning off the
light source at time t0, and measuring A(λstrong) over time. Data were acquired for half an hour, or else
the first three halflives (whichever was the shorter period), then fitted to:
A(λstrong, t) = Adark(λstrong) - [Adark(λstrong) - A(λstrong, t0)]×e-kt (Eq. 7)
This fit was used to return an in vitro halflife τ* for the cis→trans spontaneous thermal reversion
isomerisation process, defined as τ*=ln(2)/k (Figure S1B). It should be recalled however, that
azoaryl compounds’ thermal reversion rates are known to depend strongly upon their
microenvironment, such as pH and solvent/solvation effects (Beharry and Woolley, 2011b; Knoll,
2003). This was shown for PST-1, where a change of only 1.4 pH units – while remaining within an
aqueous environment – gave a 25% change in τ*. Note too that different compounds are expected to
respond very differently to changes in pH and environment so no unifying trends are expected.
Therefore the τ* acquired in vitro were considered appropriate only for qualitative intercomparison
between samples (trend of τ* vs structure), rather than quantitative prediction of the τ values which
might be experienced in cellulo or in vivo.
A note on photoisomerisations at wavelengths above 530 nm Driving photoisomerisation in a sample depends not only on the intensity applied but on intrinsic
switching efficiency at the wavelength applied. The measurement procedures used above rely on low-
intensity light, so can demonstrate photoswitching only at wavelengths with relatively high E(λ), eg.
below 530 nm, where the applied monochromator light dominates the effects of both the 378 nm
readout beam of the spectrophotometer and of the spontaneous cis→trans isomerisation. However if
light at >530 nm is applied at sufficient intensity, near-complete (>90%) cis→trans
photoisomerisation may still be actively induced. So, (1) if choosing a wavelength for a rescue
protocol where weaker light sources must be used (such as the long-term LED lighting systems),
shorter wavelengths such as 505-515 nm, which generate “worse” cis/trans ratios, may prove more
effective; but (2) it is likely that longer wavelengths can compensate for their small E(λ) to deliver
near-complete cis→trans isomerisation, if very high intensities, eg. a microscopy laser, can be used.

Borowiak, et al., Trauner* and Thorn-Seshold* 2015 Supp. Page 47 Photoswitchable inhibitors of microtubule dynamics optically control mitosis and cell death
Appendix 2: PhotoCan “Disco” cell culture lighting system
Disco system – in practice Figure S6 introduced our “Disco” cell culture lighting system, which we describe in more detail to
encourage other researchers to use such simple and cost-effective automatic, multichromatic,
parallelised pulsed lighting systems.
Disco system – Switchboards Note: since this work was performed, we have found that pre-prepared 8-Relay modules with
identical circuit design and function as ours, with the correct operating voltages/currents for use with
Arduino input, and output circuits up to 10A at 24V DC, and with inbuilt operation indicator LEDs,
are now available for 10-20€ by mail order from quality electronics suppliers such as Okaphone
Elektronika (www.okaphone.nl) as well as from large internet warehouses (searchterms “5V Relay
Module Arduino”). We confirmed that the pre-built switchboard from Okaphone was suitable.
We built switchboards to use programmable timed output sequences from a cheap, simple Arduino
microcomputer to drive sets of LED-arrays to flash ON/off with identical timings. The Arduino timed
voltage sequences alternate between 5V [but low current] and 0V, and independent output can be
taken from up to 52 “pins” on a standard Arduino (50€). Each LED-array required 24V, 80-320 mA
power. Typically, up to 8 arrays were run on an identical timing sequence controlled by the output
from one pin and up to 8 pins were used in one parallelised experiment, so upwards of 30 LED arrays
were run independently or in parallel in a single experiment. The circuit diagram in Figure S6A
depicts one such switchboard arrangement.
In brief, the switchboards took the 5 V output from an active pin on the Arduino, through a 1000-Ohm
resistor, to actuate a transistor allowing a 5 V driving current (primary circuit) to close the switch of a
Reed Relay (with a diode as protection for the against back-flow current during state change). This
switch bridged the gap between a set of LED arrays (with each array in the set being in parallel) and a
24V external power supply. Thus the arrays turned off and on according to the timed Arduino
sequence of that pin. By setting up multiple relay circuits (eg. between 3 and 14) on one switchboard,
and connecting each relay circuit to a different Arduino output pin, we could drive the different
timing patterns for cell culture experiments in a fully parallel, automated fashion which was also
highly modular (different wavelengths can be obtained by swapping LEDs on each array). Figure
S6E shows working examples of these switchboards. The power source driving the
switchboard+Arduino was a standard, low-current 5 V DC wall charger (eg. a re-purposed mobile
phone charger); the power source for the arrays (24 V DC) could also be a low-current model (eg. 2 A
is suitable for twenty 24-LED arrays flashing in unison, or many more with staggered timing).
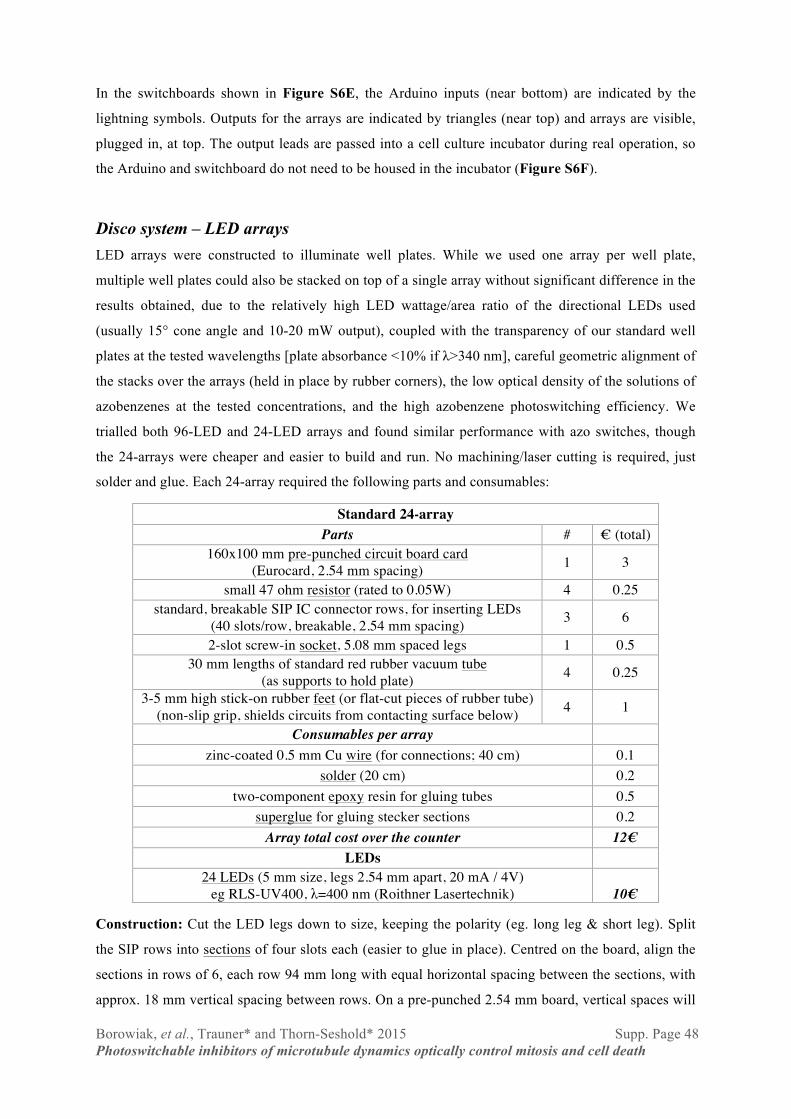
Borowiak, et al., Trauner* and Thorn-Seshold* 2015 Supp. Page 48 Photoswitchable inhibitors of microtubule dynamics optically control mitosis and cell death
In the switchboards shown in Figure S6E, the Arduino inputs (near bottom) are indicated by the
lightning symbols. Outputs for the arrays are indicated by triangles (near top) and arrays are visible,
plugged in, at top. The output leads are passed into a cell culture incubator during real operation, so
the Arduino and switchboard do not need to be housed in the incubator (Figure S6F).
Disco system – LED arrays LED arrays were constructed to illuminate well plates. While we used one array per well plate,
multiple well plates could also be stacked on top of a single array without significant difference in the
results obtained, due to the relatively high LED wattage/area ratio of the directional LEDs used
(usually 15° cone angle and 10-20 mW output), coupled with the transparency of our standard well
plates at the tested wavelengths [plate absorbance <10% if λ>340 nm], careful geometric alignment of
the stacks over the arrays (held in place by rubber corners), the low optical density of the solutions of
azobenzenes at the tested concentrations, and the high azobenzene photoswitching efficiency. We
trialled both 96-LED and 24-LED arrays and found similar performance with azo switches, though
the 24-arrays were cheaper and easier to build and run. No machining/laser cutting is required, just
solder and glue. Each 24-array required the following parts and consumables:
Standard 24-array Parts # € (total)
160x100 mm pre-punched circuit board card (Eurocard, 2.54 mm spacing) 1 3
small 47 ohm resistor (rated to 0.05W) 4 0.25 standard, breakable SIP IC connector rows, for inserting LEDs
(40 slots/row, breakable, 2.54 mm spacing) 3 6
2-slot screw-in socket, 5.08 mm spaced legs 1 0.5 30 mm lengths of standard red rubber vacuum tube
(as supports to hold plate) 4 0.25
3-5 mm high stick-on rubber feet (or flat-cut pieces of rubber tube) (non-slip grip, shields circuits from contacting surface below) 4 1
Consumables per array zinc-coated 0.5 mm Cu wire (for connections; 40 cm) 0.1
solder (20 cm) 0.2 two-component epoxy resin for gluing tubes 0.5
superglue for gluing stecker sections 0.2 Array total cost over the counter 12€
LEDs 24 LEDs (5 mm size, legs 2.54 mm apart, 20 mA / 4V)
eg RLS-UV400, λ=400 nm (Roithner Lasertechnik)
10€
Construction: Cut the LED legs down to size, keeping the polarity (eg. long leg & short leg). Split
the SIP rows into sections of four slots each (easier to glue in place). Centred on the board, align the
sections in rows of 6, each row 94 mm long with equal horizontal spacing between the sections, with
approx. 18 mm vertical spacing between rows. On a pre-punched 2.54 mm board, vertical spaces will
Borowiak, et al., Trauner* and Thorn-Seshold* 2015 Supp. Page 49 Photoswitchable inhibitors of microtubule dynamics optically control mitosis and cell death
be 18/21/18 mm, and horizontal spaces (to section centres) will be 18 / 21 / 18 / 18 / 21 mm, for best
alignment with wells in a standard plate (Figure S6C). Glue the sections in place. Align the socket
with the top row, at the edge of the plate, and glue in place. Flip the board over; solder cut pieces of
wire to connect the sockets in each row leaving gaps (for the LEDs) between the middle two slots,
and inserting one resistor per row. Connect the four rows (in parallel) to the positive and negative
poles of the socket. Place/glue the feet as close to the outermost sections as possible (Figure S6D), so
that they will sit on the lid of a cell culture plate below them for stacking plates if needed, or at least
provide clearance between wiring and the surface below in case of shorts in damp incubator settings
(the bottom of the array can also be sprayed with lacquer to insulate it). Flip the board over, epoxy the
rubber tube sections in position so that the corners of a standard cell culture plate lie in the centre of
each tube section when its wells are aligned over the LEDs. Using a sharp sturdy craft knife, carefully
cut out inward-facing 90° wedges approx. 5 mm high from the tubes, so that the cell culture plate will
slide down into these slots and be held firmly in place during movement, so will not be de-aligned by
small impacts, and so it sits flat (Figure S6C).
These 24-arrays can accommodate 96-, 24-, and 6-well cell culture plates with no significant spatial
variation in the biological effects of the photoswitches tested here under our conditions, probably due
to light scattering in the clear cell culture well plates combined with the efficiency of azobenzene
photoisomerisation; and other formats such as 130×87 mm cell culture dishes can also be fit by
installing extra tubes as holders. Alternatively, similar construction gives 96-LED arrays if desired;
the slightly irregular gaps shown on the schematic permits using stecker rows without cutting them
into sections (Figure S6B).
Disco system – Arduino program 1 The free and open-source Arduino GUI interface (http://www.arduino.cc) allows uploading programs
to the Arduino via USB cable. Program 1 is a typical program we used to control standard cell culture
experiments. It has a long but basic structure for easy overview. Typical pulsed protocol settings are
given through pins 46-53, and mirrored output on pins 22-29 as well as overall indicator pins 12-13
for an optional indicator board showing system operation. Channel pairs (1 & 2) and (3 & 4) are
synched for strong rescue protocols (channel 1 activating, channel 2 deactivating; similarly for 3&4).
The standard cycle time is 30 seconds (except channels 5-6). By default, cycles are slightly staggered
so as not to risk overloading the array power supply by flashing all arrays on simultaneously, when
many arrays are used (though for relatively few LED boards this can be ignored entirely).
/* Non-Array Program 1: Channels 1/2 and 3/4 as synched pairs of Act/Deact ; channels 5-8 for general purpose. Please acknowledge source-inspiration if you find this useful. OTS 2013 */ /* CIRCUITS - 8 channels of LED arrays hooked on Digital pins 46-53, INVERSE MIRRORS - 8 channels to Digital Pins 22-29 for indicator board */ const int pinC1 = 46; const int pinC2 = 47; const int pinC3 = 48; const int pinC4 = 49; const int pinC5 = 50; const int pinC6 = 51; const int pinC7 = 52; const int pinC8 = 53;
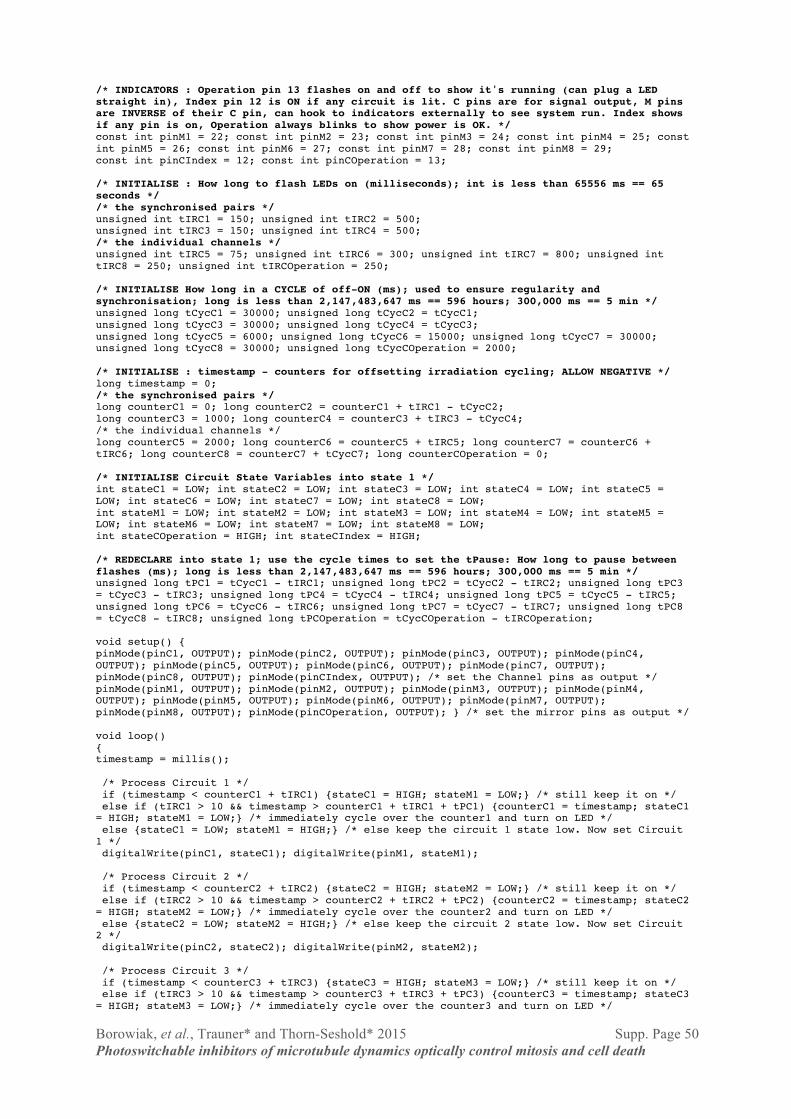
Borowiak, et al., Trauner* and Thorn-Seshold* 2015 Supp. Page 50 Photoswitchable inhibitors of microtubule dynamics optically control mitosis and cell death
/* INDICATORS : Operation pin 13 flashes on and off to show it's running (can plug a LED straight in), Index pin 12 is ON if any circuit is lit. C pins are for signal output, M pins are INVERSE of their C pin, can hook to indicators externally to see system run. Index shows if any pin is on, Operation always blinks to show power is OK. */ const int pinM1 = 22; const int pinM2 = 23; const int pinM3 = 24; const int pinM4 = 25; const int pinM5 = 26; const int pinM6 = 27; const int pinM7 = 28; const int pinM8 = 29; const int pinCIndex = 12; const int pinCOperation = 13; /* INITIALISE : How long to flash LEDs on (milliseconds); int is less than 65556 ms == 65 seconds */ /* the synchronised pairs */ unsigned int tIRC1 = 150; unsigned int tIRC2 = 500; unsigned int tIRC3 = 150; unsigned int tIRC4 = 500; /* the individual channels */ unsigned int tIRC5 = 75; unsigned int tIRC6 = 300; unsigned int tIRC7 = 800; unsigned int tIRC8 = 250; unsigned int tIRCOperation = 250; /* INITIALISE How long in a CYCLE of off-ON (ms); used to ensure regularity and synchronisation; long is less than 2,147,483,647 ms == 596 hours; 300,000 ms == 5 min */ unsigned long tCycC1 = 30000; unsigned long tCycC2 = tCycC1; unsigned long tCycC3 = 30000; unsigned long tCycC4 = tCycC3; unsigned long tCycC5 = 6000; unsigned long tCycC6 = 15000; unsigned long tCycC7 = 30000; unsigned long tCycC8 = 30000; unsigned long tCycCOperation = 2000; /* INITIALISE : timestamp - counters for offsetting irradiation cycling; ALLOW NEGATIVE */ long timestamp = 0; /* the synchronised pairs */ long counterC1 = 0; long counterC2 = counterC1 + tIRC1 - tCycC2; long counterC3 = 1000; long counterC4 = counterC3 + tIRC3 - tCycC4; /* the individual channels */ long counterC5 = 2000; long counterC6 = counterC5 + tIRC5; long counterC7 = counterC6 + tIRC6; long counterC8 = counterC7 + tCycC7; long counterCOperation = 0; /* INITIALISE Circuit State Variables into state 1 */ int stateC1 = LOW; int stateC2 = LOW; int stateC3 = LOW; int stateC4 = LOW; int stateC5 = LOW; int stateC6 = LOW; int stateC7 = LOW; int stateC8 = LOW; int stateM1 = LOW; int stateM2 = LOW; int stateM3 = LOW; int stateM4 = LOW; int stateM5 = LOW; int stateM6 = LOW; int stateM7 = LOW; int stateM8 = LOW; int stateCOperation = HIGH; int stateCIndex = HIGH; /* REDECLARE into state 1; use the cycle times to set the tPause: How long to pause between flashes (ms); long is less than 2,147,483,647 ms == 596 hours; 300,000 ms == 5 min */ unsigned long tPC1 = tCycC1 - tIRC1; unsigned long tPC2 = tCycC2 - tIRC2; unsigned long tPC3 = tCycC3 - tIRC3; unsigned long tPC4 = tCycC4 - tIRC4; unsigned long tPC5 = tCycC5 - tIRC5; unsigned long tPC6 = tCycC6 - tIRC6; unsigned long tPC7 = tCycC7 - tIRC7; unsigned long tPC8 = tCycC8 - tIRC8; unsigned long tPCOperation = tCycCOperation - tIRCOperation; void setup() { pinMode(pinC1, OUTPUT); pinMode(pinC2, OUTPUT); pinMode(pinC3, OUTPUT); pinMode(pinC4, OUTPUT); pinMode(pinC5, OUTPUT); pinMode(pinC6, OUTPUT); pinMode(pinC7, OUTPUT); pinMode(pinC8, OUTPUT); pinMode(pinCIndex, OUTPUT); /* set the Channel pins as output */ pinMode(pinM1, OUTPUT); pinMode(pinM2, OUTPUT); pinMode(pinM3, OUTPUT); pinMode(pinM4, OUTPUT); pinMode(pinM5, OUTPUT); pinMode(pinM6, OUTPUT); pinMode(pinM7, OUTPUT); pinMode(pinM8, OUTPUT); pinMode(pinCOperation, OUTPUT); } /* set the mirror pins as output */ void loop() { timestamp = millis(); /* Process Circuit 1 */ if (timestamp < counterC1 + tIRC1) {stateC1 = HIGH; stateM1 = LOW;} /* still keep it on */ else if (tIRC1 > 10 && timestamp > counterC1 + tIRC1 + tPC1) {counterC1 = timestamp; stateC1 = HIGH; stateM1 = LOW;} /* immediately cycle over the counter1 and turn on LED */ else {stateC1 = LOW; stateM1 = HIGH;} /* else keep the circuit 1 state low. Now set Circuit 1 */ digitalWrite(pinC1, stateC1); digitalWrite(pinM1, stateM1); /* Process Circuit 2 */ if (timestamp < counterC2 + tIRC2) {stateC2 = HIGH; stateM2 = LOW;} /* still keep it on */ else if (tIRC2 > 10 && timestamp > counterC2 + tIRC2 + tPC2) {counterC2 = timestamp; stateC2 = HIGH; stateM2 = LOW;} /* immediately cycle over the counter2 and turn on LED */ else {stateC2 = LOW; stateM2 = HIGH;} /* else keep the circuit 2 state low. Now set Circuit 2 */ digitalWrite(pinC2, stateC2); digitalWrite(pinM2, stateM2); /* Process Circuit 3 */ if (timestamp < counterC3 + tIRC3) {stateC3 = HIGH; stateM3 = LOW;} /* still keep it on */ else if (tIRC3 > 10 && timestamp > counterC3 + tIRC3 + tPC3) {counterC3 = timestamp; stateC3 = HIGH; stateM3 = LOW;} /* immediately cycle over the counter3 and turn on LED */
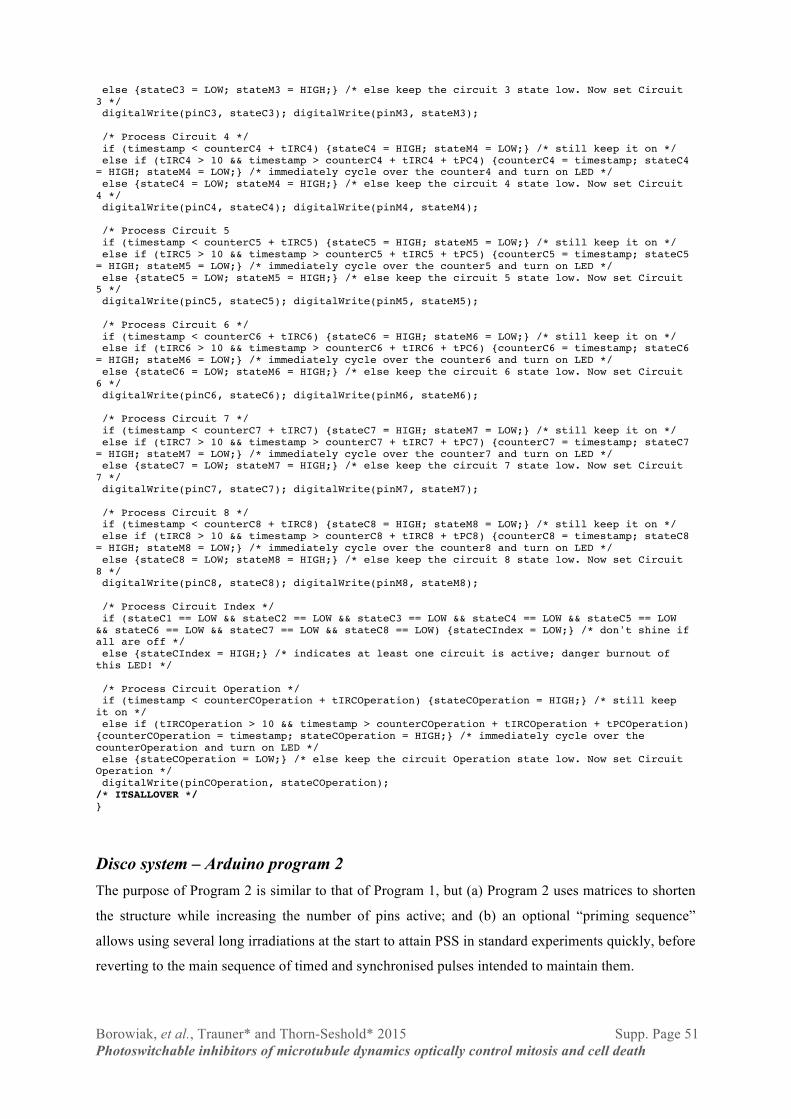
Borowiak, et al., Trauner* and Thorn-Seshold* 2015 Supp. Page 51 Photoswitchable inhibitors of microtubule dynamics optically control mitosis and cell death
else {stateC3 = LOW; stateM3 = HIGH;} /* else keep the circuit 3 state low. Now set Circuit 3 */ digitalWrite(pinC3, stateC3); digitalWrite(pinM3, stateM3); /* Process Circuit 4 */ if (timestamp < counterC4 + tIRC4) {stateC4 = HIGH; stateM4 = LOW;} /* still keep it on */ else if (tIRC4 > 10 && timestamp > counterC4 + tIRC4 + tPC4) {counterC4 = timestamp; stateC4 = HIGH; stateM4 = LOW;} /* immediately cycle over the counter4 and turn on LED */ else {stateC4 = LOW; stateM4 = HIGH;} /* else keep the circuit 4 state low. Now set Circuit 4 */ digitalWrite(pinC4, stateC4); digitalWrite(pinM4, stateM4); /* Process Circuit 5 if (timestamp < counterC5 + tIRC5) {stateC5 = HIGH; stateM5 = LOW;} /* still keep it on */ else if (tIRC5 > 10 && timestamp > counterC5 + tIRC5 + tPC5) {counterC5 = timestamp; stateC5 = HIGH; stateM5 = LOW;} /* immediately cycle over the counter5 and turn on LED */ else {stateC5 = LOW; stateM5 = HIGH;} /* else keep the circuit 5 state low. Now set Circuit 5 */ digitalWrite(pinC5, stateC5); digitalWrite(pinM5, stateM5); /* Process Circuit 6 */ if (timestamp < counterC6 + tIRC6) {stateC6 = HIGH; stateM6 = LOW;} /* still keep it on */ else if (tIRC6 > 10 && timestamp > counterC6 + tIRC6 + tPC6) {counterC6 = timestamp; stateC6 = HIGH; stateM6 = LOW;} /* immediately cycle over the counter6 and turn on LED */ else {stateC6 = LOW; stateM6 = HIGH;} /* else keep the circuit 6 state low. Now set Circuit 6 */ digitalWrite(pinC6, stateC6); digitalWrite(pinM6, stateM6); /* Process Circuit 7 */ if (timestamp < counterC7 + tIRC7) {stateC7 = HIGH; stateM7 = LOW;} /* still keep it on */ else if (tIRC7 > 10 && timestamp > counterC7 + tIRC7 + tPC7) {counterC7 = timestamp; stateC7 = HIGH; stateM7 = LOW;} /* immediately cycle over the counter7 and turn on LED */ else {stateC7 = LOW; stateM7 = HIGH;} /* else keep the circuit 7 state low. Now set Circuit 7 */ digitalWrite(pinC7, stateC7); digitalWrite(pinM7, stateM7); /* Process Circuit 8 */ if (timestamp < counterC8 + tIRC8) {stateC8 = HIGH; stateM8 = LOW;} /* still keep it on */ else if (tIRC8 > 10 && timestamp > counterC8 + tIRC8 + tPC8) {counterC8 = timestamp; stateC8 = HIGH; stateM8 = LOW;} /* immediately cycle over the counter8 and turn on LED */ else {stateC8 = LOW; stateM8 = HIGH;} /* else keep the circuit 8 state low. Now set Circuit 8 */ digitalWrite(pinC8, stateC8); digitalWrite(pinM8, stateM8); /* Process Circuit Index */ if (stateC1 == LOW && stateC2 == LOW && stateC3 == LOW && stateC4 == LOW && stateC5 == LOW && stateC6 == LOW && stateC7 == LOW && stateC8 == LOW) {stateCIndex = LOW;} /* don't shine if all are off */ else {stateCIndex = HIGH;} /* indicates at least one circuit is active; danger burnout of this LED! */ /* Process Circuit Operation */ if (timestamp < counterCOperation + tIRCOperation) {stateCOperation = HIGH;} /* still keep it on */ else if (tIRCOperation > 10 && timestamp > counterCOperation + tIRCOperation + tPCOperation) {counterCOperation = timestamp; stateCOperation = HIGH;} /* immediately cycle over the counterOperation and turn on LED */ else {stateCOperation = LOW;} /* else keep the circuit Operation state low. Now set Circuit Operation */ digitalWrite(pinCOperation, stateCOperation); /* ITSALLOVER */ }
Disco system – Arduino program 2 The purpose of Program 2 is similar to that of Program 1, but (a) Program 2 uses matrices to shorten
the structure while increasing the number of pins active; and (b) an optional “priming sequence”
allows using several long irradiations at the start to attain PSS in standard experiments quickly, before
reverting to the main sequence of timed and synchronised pulses intended to maintain them.
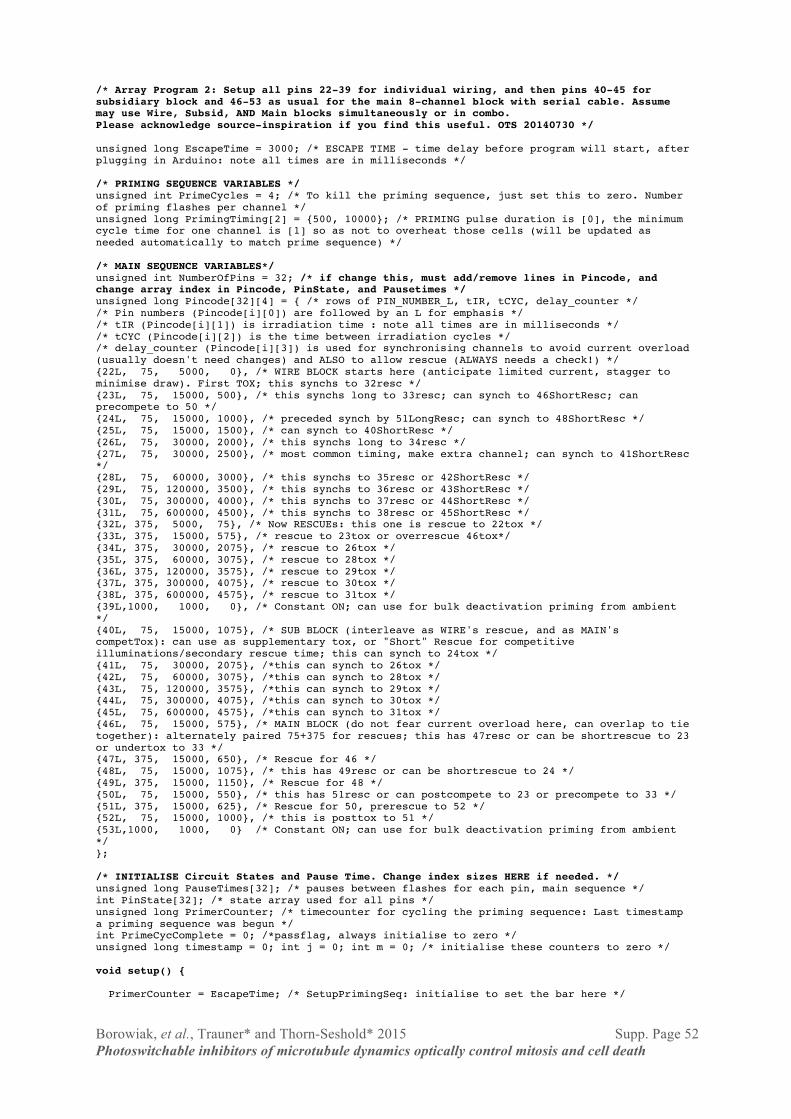
Borowiak, et al., Trauner* and Thorn-Seshold* 2015 Supp. Page 52 Photoswitchable inhibitors of microtubule dynamics optically control mitosis and cell death
/* Array Program 2: Setup all pins 22-39 for individual wiring, and then pins 40-45 for subsidiary block and 46-53 as usual for the main 8-channel block with serial cable. Assume may use Wire, Subsid, AND Main blocks simultaneously or in combo. Please acknowledge source-inspiration if you find this useful. OTS 20140730 */ unsigned long EscapeTime = 3000; /* ESCAPE TIME - time delay before program will start, after plugging in Arduino: note all times are in milliseconds */ /* PRIMING SEQUENCE VARIABLES */ unsigned int PrimeCycles = 4; /* To kill the priming sequence, just set this to zero. Number of priming flashes per channel */ unsigned long PrimingTiming[2] = {500, 10000}; /* PRIMING pulse duration is [0], the minimum cycle time for one channel is [1] so as not to overheat those cells (will be updated as needed automatically to match prime sequence) */ /* MAIN SEQUENCE VARIABLES*/ unsigned int NumberOfPins = 32; /* if change this, must add/remove lines in Pincode, and change array index in Pincode, PinState, and Pausetimes */ unsigned long Pincode[32][4] = { /* rows of PIN_NUMBER_L, tIR, tCYC, delay_counter */ /* Pin numbers (Pincode[i][0]) are followed by an L for emphasis */ /* tIR (Pincode[i][1]) is irradiation time : note all times are in milliseconds */ /* tCYC (Pincode[i][2]) is the time between irradiation cycles */ /* delay_counter (Pincode[i][3]) is used for synchronising channels to avoid current overload (usually doesn't need changes) and ALSO to allow rescue (ALWAYS needs a check!) */ {22L, 75, 5000, 0}, /* WIRE BLOCK starts here (anticipate limited current, stagger to minimise draw). First TOX; this synchs to 32resc */ {23L, 75, 15000, 500}, /* this synchs long to 33resc; can synch to 46ShortResc; can precompete to 50 */ {24L, 75, 15000, 1000}, /* preceded synch by 51LongResc; can synch to 48ShortResc */ {25L, 75, 15000, 1500}, /* can synch to 40ShortResc */ {26L, 75, 30000, 2000}, /* this synchs long to 34resc */ {27L, 75, 30000, 2500}, /* most common timing, make extra channel; can synch to 41ShortResc */ {28L, 75, 60000, 3000}, /* this synchs to 35resc or 42ShortResc */ {29L, 75, 120000, 3500}, /* this synchs to 36resc or 43ShortResc */ {30L, 75, 300000, 4000}, /* this synchs to 37resc or 44ShortResc */ {31L, 75, 600000, 4500}, /* this synchs to 38resc or 45ShortResc */ {32L, 375, 5000, 75}, /* Now RESCUEs: this one is rescue to 22tox */ {33L, 375, 15000, 575}, /* rescue to 23tox or overrescue 46tox*/ {34L, 375, 30000, 2075}, /* rescue to 26tox */ {35L, 375, 60000, 3075}, /* rescue to 28tox */ {36L, 375, 120000, 3575}, /* rescue to 29tox */ {37L, 375, 300000, 4075}, /* rescue to 30tox */ {38L, 375, 600000, 4575}, /* rescue to 31tox */ {39L,1000, 1000, 0}, /* Constant ON; can use for bulk deactivation priming from ambient */ {40L, 75, 15000, 1075}, /* SUB BLOCK (interleave as WIRE's rescue, and as MAIN's competTox): can use as supplementary tox, or "Short" Rescue for competitive illuminations/secondary rescue time; this can synch to 24tox */ {41L, 75, 30000, 2075}, /*this can synch to 26tox */ {42L, 75, 60000, 3075}, /*this can synch to 28tox */ {43L, 75, 120000, 3575}, /*this can synch to 29tox */ {44L, 75, 300000, 4075}, /*this can synch to 30tox */ {45L, 75, 600000, 4575}, /*this can synch to 31tox */ {46L, 75, 15000, 575}, /* MAIN BLOCK (do not fear current overload here, can overlap to tie together): alternately paired 75+375 for rescues; this has 47resc or can be shortrescue to 23 or undertox to 33 */ {47L, 375, 15000, 650}, /* Rescue for 46 */ {48L, 75, 15000, 1075}, /* this has 49resc or can be shortrescue to 24 */ {49L, 375, 15000, 1150}, /* Rescue for 48 */ {50L, 75, 15000, 550}, /* this has 51resc or can postcompete to 23 or precompete to 33 */ {51L, 375, 15000, 625}, /* Rescue for 50, prerescue to 52 */ {52L, 75, 15000, 1000}, /* this is posttox to 51 */ {53L,1000, 1000, 0} /* Constant ON; can use for bulk deactivation priming from ambient */ }; /* INITIALISE Circuit States and Pause Time. Change index sizes HERE if needed. */ unsigned long PauseTimes[32]; /* pauses between flashes for each pin, main sequence */ int PinState[32]; /* state array used for all pins */ unsigned long PrimerCounter; /* timecounter for cycling the priming sequence: Last timestamp a priming sequence was begun */ int PrimeCycComplete = 0; /*passflag, always initialise to zero */ unsigned long timestamp = 0; int j = 0; int m = 0; /* initialise these counters to zero */ void setup() { PrimerCounter = EscapeTime; /* SetupPrimingSeq: initialise to set the bar here */
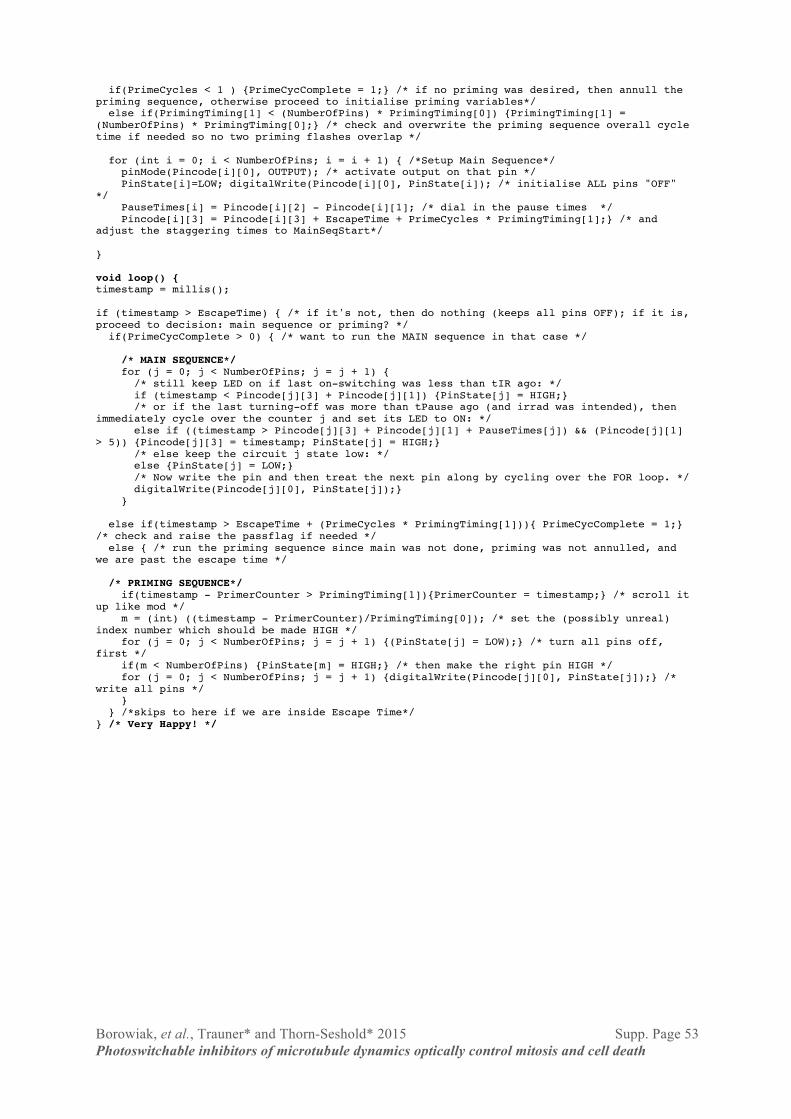
Borowiak, et al., Trauner* and Thorn-Seshold* 2015 Supp. Page 53 Photoswitchable inhibitors of microtubule dynamics optically control mitosis and cell death
if(PrimeCycles < 1 ) {PrimeCycComplete = 1;} /* if no priming was desired, then annull the priming sequence, otherwise proceed to initialise priming variables*/ else if(PrimingTiming[1] < (NumberOfPins) * PrimingTiming[0]) {PrimingTiming[1] = (NumberOfPins) * PrimingTiming[0];} /* check and overwrite the priming sequence overall cycle time if needed so no two priming flashes overlap */ for (int i = 0; i < NumberOfPins; i = i + 1) { /*Setup Main Sequence*/ pinMode(Pincode[i][0], OUTPUT); /* activate output on that pin */ PinState[i]=LOW; digitalWrite(Pincode[i][0], PinState[i]); /* initialise ALL pins "OFF" */ PauseTimes[i] = Pincode[i][2] - Pincode[i][1]; /* dial in the pause times */ Pincode[i][3] = Pincode[i][3] + EscapeTime + PrimeCycles * PrimingTiming[1];} /* and adjust the staggering times to MainSeqStart*/ } void loop() { timestamp = millis(); if (timestamp > EscapeTime) { /* if it's not, then do nothing (keeps all pins OFF); if it is, proceed to decision: main sequence or priming? */ if(PrimeCycComplete > 0) { /* want to run the MAIN sequence in that case */ /* MAIN SEQUENCE*/ for (j = 0; j < NumberOfPins; j = j + 1) { /* still keep LED on if last on-switching was less than tIR ago: */ if (timestamp < Pincode[j][3] + Pincode[j][1]) {PinState[j] = HIGH;} /* or if the last turning-off was more than tPause ago (and irrad was intended), then immediately cycle over the counter j and set its LED to ON: */ else if ((timestamp > Pincode[j][3] + Pincode[j][1] + PauseTimes[j]) && (Pincode[j][1] > 5)) {Pincode[j][3] = timestamp; PinState[j] = HIGH;} /* else keep the circuit j state low: */ else {PinState[j] = LOW;} /* Now write the pin and then treat the next pin along by cycling over the FOR loop. */ digitalWrite(Pincode[j][0], PinState[j]);} } else if(timestamp > EscapeTime + (PrimeCycles * PrimingTiming[1])){ PrimeCycComplete = 1;} /* check and raise the passflag if needed */ else { /* run the priming sequence since main was not done, priming was not annulled, and we are past the escape time */ /* PRIMING SEQUENCE*/ if(timestamp - PrimerCounter > PrimingTiming[1]){PrimerCounter = timestamp;} /* scroll it up like mod */ m = (int) ((timestamp - PrimerCounter)/PrimingTiming[0]); /* set the (possibly unreal) index number which should be made HIGH */ for (j = 0; j < NumberOfPins; j = j + 1) {(PinState[j] = LOW);} /* turn all pins off, first */ if(m < NumberOfPins) {PinState[m] = HIGH;} /* then make the right pin HIGH */ for (j = 0; j < NumberOfPins; j = j + 1) {digitalWrite(Pincode[j][0], PinState[j]);} /* write all pins */ } } /*skips to here if we are inside Escape Time*/ } /* Very Happy! */
Borowiak, et al., Trauner* and Thorn-Seshold* 2015 Supp. Page 54 Photoswitchable inhibitors of microtubule dynamics optically control mitosis and cell death
Appendix 3: PST design and handling Note in passing two unusually favourable features of the PSTs. (1) PSTs are trans-inactive. Thus they
may be applied globally in their stable inactive trans form, and only photoisomerised to the active
metastable cis inside the target zone of interest. This natively gives far easier spatial targeting than
trans-active azobenzenes, which instead require active photoisomerisation everywhere outside the
target zone to suppress off-target effects, which may be essentially impossible in vivo, and also in
general is impossible to achieve quantitatively due to PSS considerations. (2) While azobenzenes are
known to suffer bioreduction, the PSTs showed successful long-term intracellular applications, which
we attribute to their extremely electron rich design (Beharry et al., 2011b).
Choice of Prodrug Strategies for PSTs PST-1P: We anticipate that the biochemical activity of PST-1P is null until both phosphate cleavage
by endogenous intracellular phosphatases and photoisomerisation take place, since the bulky
phosphate group is expected (Tron et al., 2006) to prevent binding of cis-PST-1P to tubulin. We
expect, and it is not contraindicated by experimental results, that such cleavage is nonspecific (many
phosphatases are capable of it, and effects are not cell-type specific), and is rapid (the net activity of
these phosphatases upon the candidate substrate PST-1P is high). Therefore PST-1P is essentially a
delivery method for PST-1 which (a) does not require using cosolvents (which may give side-effects
or result in irregular biodistribution); and (b) can be applied in high concentrations since water
solubility is ensured (at least 10 mM solubility in PBS); and (c) in a potential clinical setting, may
ensure good delivery to target (Stella, 2006) - the negatively-charged phosphate is a key advantage for
the isosteric CA4P compared to the lipophilic CA4 (not only increases aqueous solubility, but eg.
may reduce the drug’s adsorption by hydrophobic carrier proteins in plasma) (Pettit and Rhodes,
2009). Points (b) and (c) may be vital for the efficiency and success of in vivo tumour treatment, since
we expect that the in vivo drug response relationship at therapeutic concentrations will depend very
nonlinearly on concentration (as seen in cellulo: eg. the sigmoidal fits of viability to log10[PST] under
the toxic regime, such as Figure 2D, have Hill coefficients around 3.6), so bolus-style, high-
concentration application and target delivery could be exceptionally effective.
PST-2S: Water-soluble salt PST-2S is designed as an improvement (Ohsumi et al., 1998) over PST-2
for in vivo work, with similar rationale as for PST-1P, including (a) a higher concentration can be
supported in aqueous solution, and (b) better delivery to target. Likewise, it is expected that
bioactivity requires the prior cleavage of the serine residue (see discussion in the section on PST-1P
above). The serine residue is expected to be cleaved in cellulo nonspecifically (many peptidases may
perform cleavage, and cleavage will not be cell/tissue type specific) by monopeptide-cleaving
exopeptidases with relatively high substrate tolerance (eg. leucine aminopeptidase and membrane
alanyl peptidase families, EC 3.4.11.1 and 3.4.11.2 respectively); however we anticipated that typical
Borowiak, et al., Trauner* and Thorn-Seshold* 2015 Supp. Page 55 Photoswitchable inhibitors of microtubule dynamics optically control mitosis and cell death
enzymatic processing of PST-2S into PST-2 would not be as fast as release of PST-1 from PST-1P;
and the tenfold drop of potency of PST-2S compared to PST-2 (while the potency of PST-1 is similar
to that of PST-1P) may in part reflect such slower enzymatic processing.
PST-1CL was desired as a proof of principle for dual optical-and-biochemical targeting prodrugs.
Phenolic phosphates such as PST-1P are biochemically nonspecific prodrugs due to the ubiquity of
phosphatases. However, changes in the expression and activity of various peptidases have been
widely documented in disorders such as cancers which are an obvious target for clinical applications
of PSTs (Gill et al., 2014). Since numerous sequence-specific polypeptidases are known (eg. the
tripeptide D-Ala-Phe-Lys- (de Groot et al., 2000) is specifically processed by the tumour-associated
peptidase plasmin), using polypeptide sequences to target drug release specifically is attractive (Gill et
al., 2014). However, although peptidyl anilides (as in design PST-2S) are tolerated by nonspecific
monopeptidases to some degree, they are generally poor or unusable as mimics for the post-scissile
portions of polypeptide-specific peptidase substrates (de Groot et al., 2000; Thorn-Seshold et al.,
2012). Therefore, we wished to apply a cyclisation spacer design which (a) provides a highly robust
prodrug in the absence of enzymatic hydrolysis (this robustness is favoured by the electron richness of
the PST-1 phenol), (b) bears an aliphatic amine post-scissile bond with low steric demand for optimal
enzymatic processing, (c) features very rapid kinetics of spacer immolation and drug release (Thorn-
Seshold et al., 2012), (d) favours water solubility for better chance of success in clinical settings, and
(e) is designed so that the attachment site for the auto-immolative spacer-peptide unit blocks all
biochemical activity of the cis prodrug until enzymatic processing takes place. These several design
criteria are satisfied in PST-1CL. The peptide substrate we have chosen (leucine) to attach to this
cyclisation spacer will not provide biochemical specificity to a single enzyme, but rather, PST-1CL
should be seen as a proof of principle for design and synthesis of prodrugs with different peptide
sequences (incorporated by reaction sequences analogous to that used for leucine here) that will
enable true biochemical specificity for target cells to some degree, as well as optical control. The
potential advantages of this dual targeting approach are discussed in Appendix 5.
Solubility and Handling PST-1P’s profile of light-dependent biological effects is indistinguishable from the two other most-
potent candidates (PST-1 and PST-2) but it surpasses them for convenience. It is easy to handle
(hydrophilic) and soluble at >10 mM in PBS at room temperature; and its halflife for spontaneous
degradation at room temperature under air (>100 days) implies that no special haste is required when
preparing and applying solutions.
The non-prodrug PSTs instead (1) require a cosolvent and their solubility is temperature-dependent;
and (2) they are hydrophobic, so brief handling instructions are detailed here. We recommend using
Borowiak, et al., Trauner* and Thorn-Seshold* 2015 Supp. Page 56 Photoswitchable inhibitors of microtubule dynamics optically control mitosis and cell death
glass vials for preparing any stocks at concentrations above 100 µM; always performing dilutions
such that the percentage of cosolvent is maximised along the chain of dilutions; and using only teflon
cartridges to filter pure-MeCN-solutions, for these reasons:
(1) Acetonitrile (MeCN) was found to be a much better cosolvent for these azobenzenes than DMSO;
additionally, it is tolerated in cell culture at 10-20× higher percentage without significant effects.
PST-1 and PST-2 are soluble at 100 µM with 2% MeCN at 25°C and may be diluted down keeping
this cosolvent ratio (eg 10 µM, 0.2%). PST-3 and PST-5 require 2-3 times as much acetonitrile, and
PST-4 is intermediate in solubility between these cases. The MeCN used does not have to be top
grade ("dry" MeCN may even be disadvantageous due to contaminants from the drying process).
(2) Especially, the plastic surfaces of Eppendorf tubes (but also other surfaces such as standard
cellulose filters and some pipette tips) can easily adsorb PSTs, which may not be obvious due to light
scattering obscuring colouration. Adsorption losses depend entirely on stock preparation: this includes
the particular compound's lipophilicity, the stock concentration coupled with its cosolvent percentage,
the temperature, the settling time, and it can even be kinetically affected by order of addition. High
adsorption results from working with concentrated solutions near their solubility limit (eg 100 mM in
pure MeCN), but also when using medium-concentrated solutions at 2-20% MeCN (eg 0.1-2 mM)
even if solubility is acceptable when solutions are contained in glass vials. The true concentration of a
PST working stock can always be measured by UV-Vis absorbance, calibrating to the absorbance
coefficients detailed in Part B. We have found adsorptive losses of the more lipophilic compounds of
up to 70% when careful sample preparation is neglected.
Borowiak, et al., Trauner* and Thorn-Seshold* 2015 Supp. Page 57 Photoswitchable inhibitors of microtubule dynamics optically control mitosis and cell death
Appendix 4: Photopharmacology: design, rationale, applications
From Principles to Biological Assay Design: Rationale For convenience, [Z] is defined as the instantaneous local concentration of the cis-PST isomer; [Z]*
is defined as the time-average [Z] experienced during a significant phase of an experiment (eg. the
first phase of a two-phase experiment; see below); and tpause is defined as the interval between light
pulses in a pulsed experiment (if the experiment is a dual-wavelength experiment, each pulse is
defined as containing both λACT and λDEACT). A target is that spatiotemporal region where it is desired
that the biological effects of the PST be most strongly applied, while it would be beneficial to avoid
generating biological effects in all off-target zones.
Two strong light-dependent steady-state protocols are evident for the PSTs: (1) a toxic regime
designed to maximise their pharmacological effect on-target, by applying activating irradiation at
wavelength λACT so as to generate a significant [Z]* in the target; continuous irradiation could be
used, or else pulsed irradiation if tpause were significantly shorter than τ; an example pulsed toxic
regime for compound PST-1 (τ estimated around 8 minutes) could thus be “390 nm applied in pulses
of 75 ms with tpause=30 s”; and (2) a strong rescue regime, designed to deliver a rigorous test of the
degree of photocontrol which can be exerted over the PST’s toxicity, by applying λACT exactly as for
the toxic regime, but competitively applying deactivating irradiation at wavelength λDEACT in order to
reduce [Z]* relative to the value experienced in the toxic regime; like the toxic regime, this regime
could be pulsed or continuous; an example pulsed strong rescue regime for compound PST-1 could
thus be “390 nm applied for 100 ms then 505 nm applied for 600 ms, with tpause=30 s”.
One design we consider likely for localised therapeutic applications of the PST compounds is shown
in principle in Figure S1E. A toxic regime is applied on a target synchronously with the application
of a deactivating regime (featuring only the λDEACT component of an optimised strong rescue regime)
in a thin protection zone surrounding this target (in order to reduce the exposure of the rest of the
organism or sample to any cis-PST diffusing out of or transported away from the target, and
counteract any scattering of λACT). This may maximise the biological effects in a target while keeping
the off-target [Z]* below the minimal response concentration, thereby avoiding side effects.
For such biomedical applications, the toxic regime thus gives an estimate of the maximum strength of
the biological effects that can be exerted in a target zone by a given concentration of PST; and
assuming that a deactivating regime can be applied in those off-target zones which are the very
closest neighbours to this target zone, then the strong rescue regime estimates the maximum strength
of the (undesirable) biological effects that could be experienced in the very nearest off-target zones
(weaker biological effects are to be anticipated in off-target zones still further from the target).
Borowiak, et al., Trauner* and Thorn-Seshold* 2015 Supp. Page 58 Photoswitchable inhibitors of microtubule dynamics optically control mitosis and cell death
Weak light-dependent protocols are defined as those where spontaneous cis→trans reversion plays a
significant role in reducing [Z]*, and these may also be important in medicine and research. Examples
include (3) a dark rescue protocol, where a toxic regime would be applied for the first phase of an
experiment, then all light switched off throughout a second phase of the experiment thus allowing [Z]
to reach zero; and (4) a weak pulsed rescue regime similar to the strong pulsed rescue regime but
where tpause is instead significantly longer than τ, such that the component of λDEACT in each pulse
primes the sample to decay more rapidly to [Z]∼0 than would be possible by spontaneous reversion
alone. Note that a weak pulsed rescue regime will always display lesser biological effects than the
corresponding strong rescue regime (since the strong regime has a shorter tpause).
Light can be applied either continuously (allowing very low intensities to be used), or in pulses
(allowing for fixed source intensity, easier use, and permitting the weak pulsed rescue protocol). We
always used pulsed protocols as they illustrated well the relationships between observed
photopharmacological effects and the underlying qualitative trends of PSS(λ), E(λ) and τ described
previously (see eg. Figure S1C). We focussed on strong light-dependent steady-state protocols, as
these provide the most demanding proof of principle for fully reversibly light-controllable biological
effects (compared to eg. the weak protocols described above): the corresponding weak protocols
could always be applied with at least as much success. Lastly, λ1 and λ2 as defined in Part B.3 gave
estimates for “good” values of λACT and λDEACT by balancing the need to restrict the light flux applied,
while still favouring one or the other isomer’s formation as much as possible. The values of λACT and
λDEACT used in optimised experiments could be refined empirically from these initial guesses, however
we found this unnecessary.
cis-activity, dual targeting and other advantages for spatial precision Considering biomedical applications of photopharmaceuticals e.g. to chemotherapy (Velema
et al., 2014), if target cells can be uniquely identified and spatially addressed by light (e.g. localised
tumour), then cell-specific illumination may achieve cell-specific treatment, depending on the
magnitude of the activity difference between the isomers and on the degree of control over
isomerisation which is possible. An elegant solution for azobenzenes is if the trans is totally inactive
and if the cis→trans halflife is moderate (the PSTs feature these two properties): then, they will be
only photoisomerised to the active cis inside the target zone, and spontaneous cis→trans
isomerisation outside this irradiated target zone, optionally aided by active photoswitching towards
the trans as in the “belt zone” concept, should eliminate the toxic burden of diffusing/transported
active cis on surrounding cells, entirely avoiding side-effects off-target. Such photopharmaceuticals
may avoid the dose-limitations that the current always-ON antimitotics suffer (primarily due to
cardiotoxicity, immunosuppression, endothelial toxicity and neurotoxicity), which may allow them to
establish the truly optimum on-target dose (OTD) within such a spatially-addressable target, whereas

Borowiak, et al., Trauner* and Thorn-Seshold* 2015 Supp. Page 59 Photoswitchable inhibitors of microtubule dynamics optically control mitosis and cell death
current drugs cannot. Thus a PST might achieve even better on-target effects than current therapies,
but also without off-target effects elsewhere. These advantages correspond to the design features of an
ideal general photopharmaceutical as reviewed by Feringa (Velema et al., 2014).
Yet even when tumour cells cannot be specifically addressed, and are surrounded by nearest-
neighbour cells which must avoid toxicity (here called “blind targeting”), photopharmaceuticals such
as PSTs may have therapeutic advantages over current agents. They will still only generate localised
bystander toxicity, which must be preferable to the systemic side-effects that can be expected from
conventional drugs; and as the OTD of PSTs can be chosen considering only this localised bystander
toxicity, this may increase their usable OTD towards optimal therapeutic levels and thus improve the
on-target therapeutic outcome compared to the always-ON case, as well as lowering the systemic
load. Photopharmaceuticals might also for the first time allow treatment regimes tackling sensitive
tissues piecewise (e.g. first treating one region, allowing tissue recovery, then treating the second
region) to reduce the overall toxic challenge without being forced to apply lower (less therapeutic)
drug doses.
In the context of blind targeting, the orthogonal extra level of target specificity from the
preferential biochemical unmasking of PST prodrugs in a subpopulation of target cells within a tissue
could be an important advantage, even compared to conventional biochemically-targeted prodrugs.
Purely biochemically-targeted approaches are, generally, not entirely specific to targeted cells.
Typically, a substrate’s processing is upregulated in the diseased state, rather than switched on from
zero background; also, it is rare that processing of suitable substrates occurs with tissue-specificity for
endogenous enzyme profiles; lastly, drug diffusion and bulk transport may occur after unmasking,
further reducing spatial specificity. Yet, by dual optical-and-biochemical targeting, these effects may
be compensated. E.g., if enzymatic processing can occur in several distinct organs, but only one
contains the target subpopulation, spatially localised irradiation can easily avoid generating off-target
effects. Diffusion or bulk transport from the target zone after enzymatic activation may also be
counteracted by localised optical deactivation.
Temporal modulation of photopharmaceuticals Regardless of spatial precision effects however, photopharmaceuticals can deliver unique
temporal patterns of their active form, which could provide significant advantages compared to
conventional drugs, not only for cell biology research but potentially for clinical applications. This
may give significant improvements to therapeutic effects, as well as greater mechanistic insight into
treatment outcomes and more effective combination therapies.

Borowiak, et al., Trauner* and Thorn-Seshold* 2015 Supp. Page 60 Photoswitchable inhibitors of microtubule dynamics optically control mitosis and cell death
Hat function dose(t) profiles: Recall that tumour cells in general show a different drug
response profile to normal cells. In the long term, this provides a therapeutic margin where tumour
destruction may involve an acceptable attrition of healthy bystander cells: this is the paradigm
underlying decades of patient treatment with always-ON, nonspecific antimitotics, whose best
achievable dosage regimes have been established by extensive pharmacokinetic trials and errors.
Based on this intrinsic response difference, we first consider a simplistic picture where an optimal
OTD, after maintenance for time tOPT, would give some best possible overall therapeutic response: ie.
the optimal OTD(t) is a “hat” function, which toggles from zero up to the optimal OTD and then back
to zero after time tOPT. Truly off↔ON photopharmaceuticals such as PSTs can provide this hat
function (note that a situation approaching the “hat function” ideal profile [PST]eqm(t) has already
been shown in the C. elegans experiments where active photoswitching was used to turn PST-1 ON
and OFF). Always-ON drugs rely on drug absorption and elimination to drive changes of the OTD,
which constrains the conventional OTD(t) to exhibit only slow changes in concentration under
typically biexponential kinetics. Figure S1D presents a model of a biexponential [toxin](t) trace for a
standard drug, compared to the OTD(t) trace for a cis-PST with the same underlying PK of the total
pool of PST, but where irradiating wavelength (or, eg. irradiating intensity) would be modulated over
time, depending on the local total concentration of PST (eg. with feedback via dynamic plasma
concentration readout) so as to achieve a hat function of [cis-PST](t). Essentially, the higher the local
[PST]TOT, the less trans→cis photoisomerisation is stimulated, but if even optimum trans→cis
isomerisation would generate a suboptimal effect due to insufficient [PST]TOT, then irradiation is
stopped. The colour of the cis-PST(t) plot line at any given time is intended to reflect the wavelength
applied, with red representing “no light applied” (since red is not absorbed by these PSTs); the
colouration could instead be a heat-map reflecting the photon flux applied per unit time (intensity
modulation), which would achieve the same behaviour. If an optimal OTD exists, the time spent at
that dose can be maximised by the hat function which is possible profile for [cis-PST](t). To recouch
the result, the photopharmaceutical approach may eliminate therapeutically ineffective phases of
conventional drug treatment (Figure S1D).
Other new PK patterns: Control of illumination wavelength, pulse repetition frequency and/or
flux delivery (power × time) can also be imagined to modulate [cis-PST](t) in other forms than a hat
function, and even (were there merit to it) to reproduce the biexponential form shown for the
conventional drug: the PSTs’ reversible optical control gives the flexibility to choose where, when,
and how much of the compound should be activated. Since it may be unlikely that in all disease cases,
an optimal therapeutic outcome is only achieved by a biexponential PK profile, such dynamic
modulation could achieve therapeutic effects which it has not previously been possible to consider.
E.g. PST treatment could allow applying numerous very short high-concentration spikes of cis-PST,
each returning quickly to zero; these short spikes might be able to attain cis-PST levels well beyond

Borowiak, et al., Trauner* and Thorn-Seshold* 2015 Supp. Page 61 Photoswitchable inhibitors of microtubule dynamics optically control mitosis and cell death
the maximum tolerated dose established for pharmacologically-equivalent but conventional drugs, but
without giving unwanted effects, since the long phase of clearance is avoided. In the context of
combination therapies too, the opportunity to turn one component (or several) on and off
independently at will might allow great mechanistic insight and achieve better therapeutic outcomes.
Time-dependent toxicity: We also expect PSTs to exploit toxicity mechanisms which are
regulated not only by dose but also by time of application; such that more sensitive (tumour) cells
may tolerate cis-PST application for far shorter periods than do normal cells before committing to
apoptosis, even if in the long term, with irreversibly-acting drugs, similar outcomes are achieved.
Thus dynamic modulation to restrict exposure time might achieve intrinsic therapeutic selectivity.
Repeatability: Photochemical off↔ON switching may deliver a [toxin](t) profile which
shows high temporal repeatability across different scenarios or patients, which may address problems
faced when correlating applied doses with observed effects, or when selecting doses to administer,
leading to improvements in monotherapy as well as greater understanding of its mechanisms.
Concluding remark on targeting and CDIs:
It may be that the cis-PSTs in particular can leverage non-linear effects inherent to their mode
of action to improve on-target selectivity. For further information about CDI dynamics, and the varied
and complex knock-on responses to MT inhibition on different levels (in vitro – cell culture –
diffusion-limited culture – in vivo), the interested reader is referred to the reviews by Stanton (Stanton
et al., 2011), de Tozer (Tozer et al., 2005; Tozer et al., 2002), Dumontet (Dumontet and Jordan,
2010), Jordan (Jordan et al., 1998), and Tron (Tron et al., 2006); from this last, we quote:
“… does the simple structure of CA4 and the concentrated medicinal chemistry effort already profused mean that most interesting modifications have been exploited? Should medicinal chemists move to more complex natural products that have been shown to elicit effects on neovasculature? We believe not, since more challenges lie ahead. The strong cytotoxic nature of CA4, for example, would make it an excellent bullet against the tumor itself, if properly targeted...” (Tron et al., 2006)
Munich, September 2014
Borowiak, et al., Trauner* and Thorn-Seshold* 2015 Supp. Page 62 Photoswitchable inhibitors of microtubule dynamics optically control mitosis and cell death
Supplemental References Bailey, K., Cowling, R., Tan, E.W., and Webb, D. (2004). A colormetric assay for catechol-O-
methyltransferase. Bioorg Med Chem Lett 12, 595-601. Bastos, E.L., Ciscato, L.F.M.L., and Baader, W.J. (2005). Microwave-Assisted Protection of Phenols as tert-
Butyldimethylsilyl (TBDMS) Ethers Under Solvent-Free Conditions. Synth Commun 35, 1501-1509. Beharry, A.A., Sadovski, O., and Woolley, G.A. (2011a). Azobenzene Photoswitching without Ultraviolet
Light. J Am Chem Soc 133, 19684-19687. Beharry, A.A., Wong, L., Tropepe, V., and Woolley, G.A. (2011b). Fluorescence Imaging of Azobenzene
Photoswitching In Vivo. Angew Chem, Int Ed 50, 1325-1327. Beharry, A.A., and Woolley, G.A. (2011a). Azobenzene photoswitches for biomolecules. Chem Soc Rev 40,
4422-4437. Beharry, A.A., and Woolley, G.A. (2011b). Photoswitch Design. In Photosensitive Molecules for Controlling
Biological Function, pp. 171-184. Bisby, R.H., Botchway, S.W., Hadfield, J.A., McGown, A.T., Parker, A.W., and Scherer, K.M. (2012).
Fluorescence lifetime imaging of E-combretastatin uptake and distribution in live mammalian cells. European Journal of Cancer 48, 1896-1903.
Boonacker, E., and Van Noorden, C.J.F. (2001). Enzyme Cytochemical Techniques for Metabolic Mapping in Living Cells, with Special Reference to Proteolysis. J Histo Cyto 49, 1473-1486.
Cushman, M., Nagarathnam, D., Gopal, D., Chakraborti, A.K., Lin, C.M., and Hamel, E. (1991). Synthesis and evaluation of stilbene and dihydrostilbene derivatives as potential anticancer agents that inhibit tubulin polymerization. J Med Chem 34, 2579-2588.
de Groot, F.M.H., van Berkom, L.W.A., and Scheeren, H.W. (2000). Synthesis and Biological Evaluation of 2'-Carbamate-Linked and 2'-Carbonate-Linked Prodrugs of Paclitaxel: Selective Activation by the Tumor-Associated Protease Plasmin. J Med Chem 43, 3093-3102.
Desai, A., Cramer, L., and Mitchison, T. (2012). Fluorescence Procedures for the Actin and Tubulin Cytoskeleton in Fixed Cells. < http://mitchison.med.harvard.edu/protocols.html >.
Dumontet, C., and Jordan, M.A. (2010). Microtubule-binding agents: a dynamic field of cancer therapeutics. Nat Rev Drug Discov 9, 790-803.
Friedman, O.M., Gofstein, R.M., and Seligman, A.M. (1949). Preparation of Azo Compounds for the Study of Inhibition of Tumor Growth. J Am Chem Soc 71, 3010-3013.
Gottlieb, H.E., Kotlyar, V., and Nudelman, A. (1997). NMR Chemical Shifts of Common Laboratory Solvents as Trace Impurities. J Org Chem 62, 7512-7515.
Harrowven, D.C., Guy, I.L., Howell, M., and Packham, G. (2006). The Synthesis of a Combretastatin A-4 Based Library and Discovery of New Cooperative ortho-Effects in Wittig Reactions Leading to (Z)-Stilbenes. Synlett, 2977-2980.
Hetenyi, A., Martinek, T.A., Lazar, L., Zalan, Z., and Fulop, F. (2003). Substituent-Dependent Negative Hyperconjugation in 2-Aryl-1,3-N,N-heterocycles. Fine-Tuned Anomeric Effect? J Org Chem 68, 5705-5712.
Jordan, M.A. (2002). Mechanism of action of antitumor drugs that interact with microtubules and tubulin. Current Medicinal Chemistry: Anti-Cancer Agents 2, 1-17.
Mallory, F.B., and Mallory, C.W. (2004). Photocyclization of Stilbenes and Related Molecules. In Organic Reactions (John Wiley & Sons, Inc.).
Mylavarapu, R.K., Kondaiah, G.C.M., Kolla, N., Veeramalla, R., Koilkonda, P., Bhattacharya, A., and Bandichhor, R. (2007). Boric Acid Catalyzed Amidation in the Synthesis of Active Pharmaceutical Ingredients. Org Process Res Dev 11, 1065-1068.
Shindo, K., Nakamura, R., Chinda, I., Ohnishi, Y., Horinouchi, S., Takahashi, H., Iguchi, K., Harayama, S., Furukawa, K., and Misawa, N. (2003). Hydroxylation of ionized aromatics including carboxylic acid or amine using recombinant Streptomyces lividans cells expressing modified biphenyl dioxygenase genes. Tetrahedron 59, 1895-1900.
Stella, V. (2006). Prodrug Strategies for Improving Drug-Like Properties; in, Optimizing the “Drug-Like” Properties of Leads in Drug Discovery, R.T. Borchardt, E.H. Kerns, M.J. Hageman, D.R. Thakker, and J.L. Stevens, eds. (Springer New York), pp. 221-242.
Tozer, G.M., Kanthou, C., and Baguley, B.C. (2005). Disrupting tumour blood vessels. Nat Rev Cancer 5, 423-435.
Velema, W.A., Szymanski, W., and Feringa, B.L. (2014). Photopharmacology: beyond proof of principle. J Am Chem Soc 136, 2178-2191.