Cell Host & Microbe, Volume 13 · PDF fileCell Host & Microbe, Volume 13 ... Random assignment...
20
Cell Host & Microbe, Volume 13 Supplemental Information Convergent Antibody Signatures in Human Dengue Poornima Parameswaran, Yi Liu, Krishna M. Roskin, Katherine K.L. Jackson, Vaishali P. Dixit, Ji-Yeun Lee, Karen Artiles, Simona Zompi, Maria José Vargas, Birgitte B. Simen, Bozena Hanczaruk, Kim R. McGowan, Muhammad A. Tariq, Nader Pourmand, Daphne Koller, Angel Balmaseda, Scott D. Boyd, Eva Harris, and Andrew Z. Fire
Transcript of Cell Host & Microbe, Volume 13 · PDF fileCell Host & Microbe, Volume 13 ... Random assignment...
Cell Host & Microbe, Volume 13
Supplemental Information
Convergent Antibody Signatures in Human Dengue
Poornima Parameswaran, Yi Liu, Krishna M. Roskin, Katherine K.L. Jackson, Vaishali P. Dixit, Ji-Yeun Lee, Karen Artiles, Simona Zompi, Maria José Vargas, Birgitte B. Simen, Bozena Hanczaruk, Kim R. McGowan, Muhammad A. Tariq, Nader Pourmand, Daphne Koller, Angel Balmaseda, Scott D. Boyd, Eva Harris, and Andrew Z. Fire
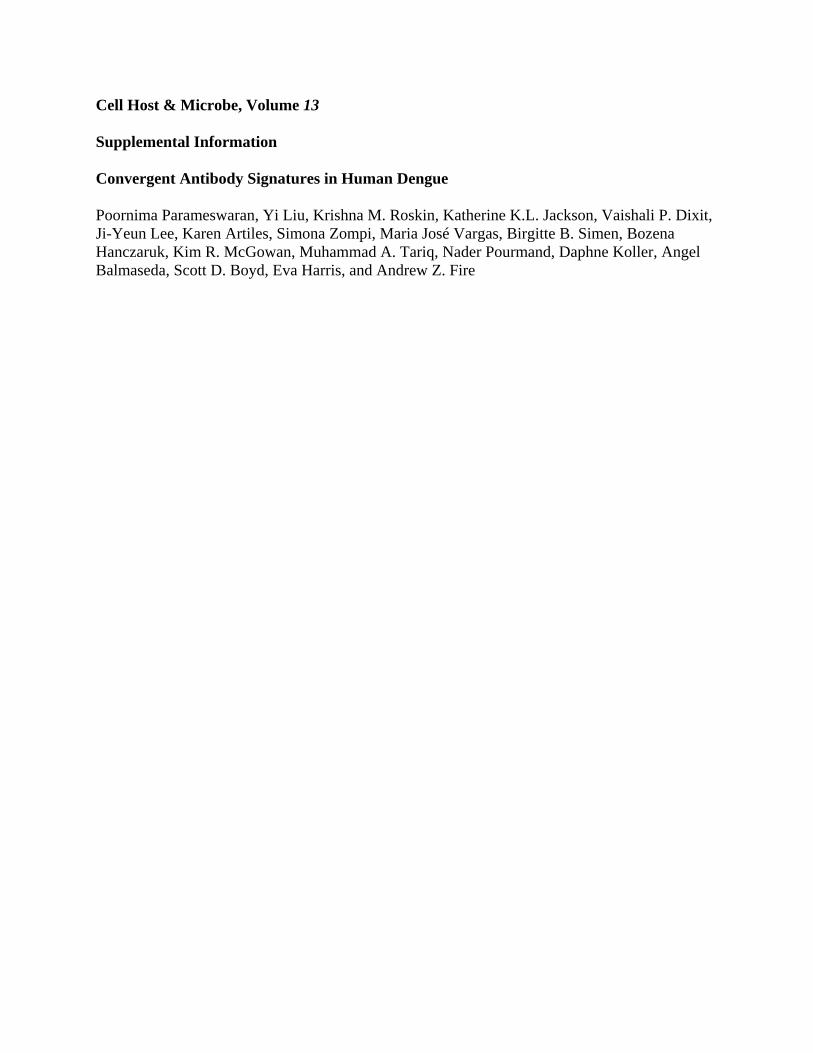
Figure S1. Relationship between P(collision), Read Depth, and Immune Status, Related to
Figure 1
(A) P(collision) values are shown in relation to the number of unique mapped and filtered
sequences for each sample (colored by sample type). (B) Number of unique sequences per
sample, binned by sample type. Annotations to each plot show the 25th-75th percentiles (box),
the 10th-90th percentiles (whiskers), and the median (horizontal line). (C, D) Paired values for
P(collision) in acute and convalescent (left panel), or acute and post-convalescent (middle
panel), or convalescent and post-convalescent (right panel) phase samples from individuals
presenting with (C) primary or (D) secondary DENV infections. **P < 0.0001 (acute vs. P-Conv;
Wilcoxon Signed Rank), *P = 0.0046 (Conv vs. P-Conv; Wilcoxon Signed Rank).
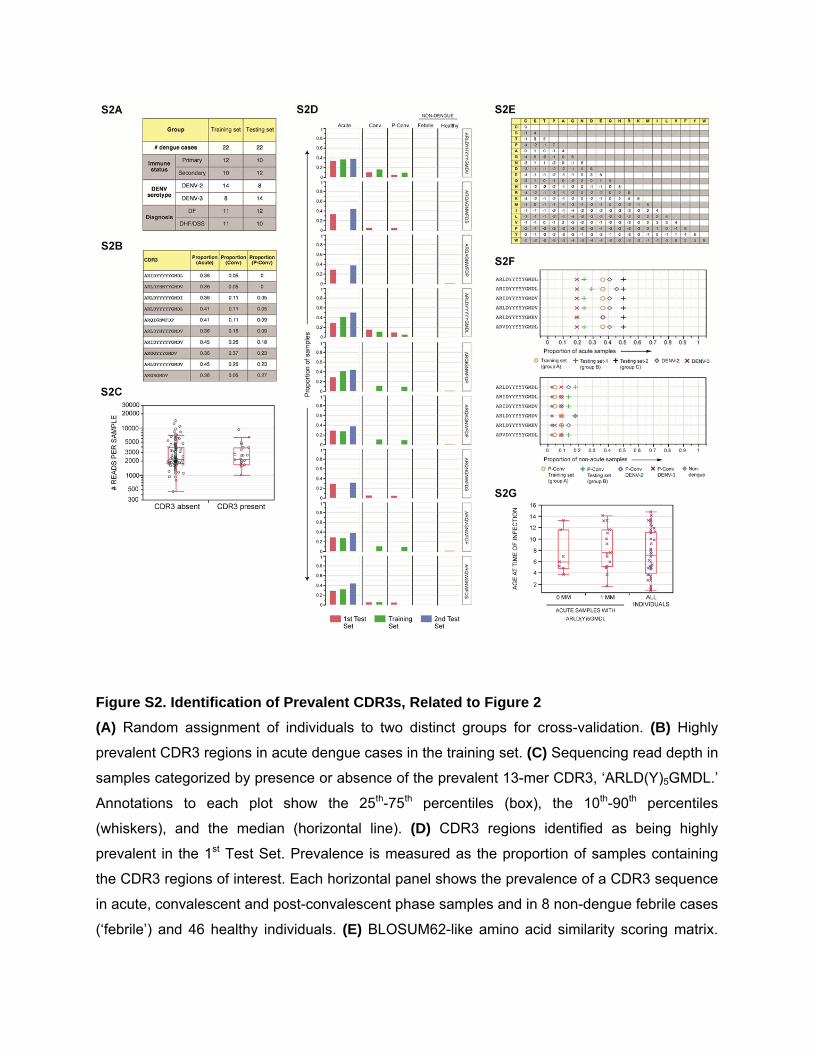
Figure S2. Identification of Prevalent CDR3s, Related to Figure 2
(A) Random assignment of individuals to two distinct groups for cross-validation. (B) Highly
prevalent CDR3 regions in acute dengue cases in the training set. (C) Sequencing read depth in
samples categorized by presence or absence of the prevalent 13-mer CDR3, ‘ARLD(Y)5GMDL.’
Annotations to each plot show the 25th-75th percentiles (box), the 10th-90th percentiles
(whiskers), and the median (horizontal line). (D) CDR3 regions identified as being highly
prevalent in the 1st Test Set. Prevalence is measured as the proportion of samples containing
the CDR3 regions of interest. Each horizontal panel shows the prevalence of a CDR3 sequence
in acute, convalescent and post-convalescent phase samples and in 8 non-dengue febrile cases
(‘febrile’) and 46 healthy individuals. (E) BLOSUM62-like amino acid similarity scoring matrix.
(F) Prevalent CDR3 regions that were identified using the amino acid similarity-based cross-
validation. Upper panel: CDR3 prevalence in acute phase samples partitioned for cross-
validation or by DENV serotype. Lower panel: prevalence in samples from 47 healthy individuals
and 8 individuals with non-dengue febrile illness (Non-dengue), and in post-convalescent phase
samples partitioned for cross-validation or partitioned by DENV serotype. (G) Ages of
individuals with zero mismatch (0MM) ARLD(Y)5GMDL CDR3 signatures and their one-
mismatch derivatives (1MM) at time of sampling, compared to the ages of all individuals
included in this study. Annotations to each plot show the 25th-75th percentiles (box), the 10th-90th
percentiles (whiskers), and the median (horizontal line).
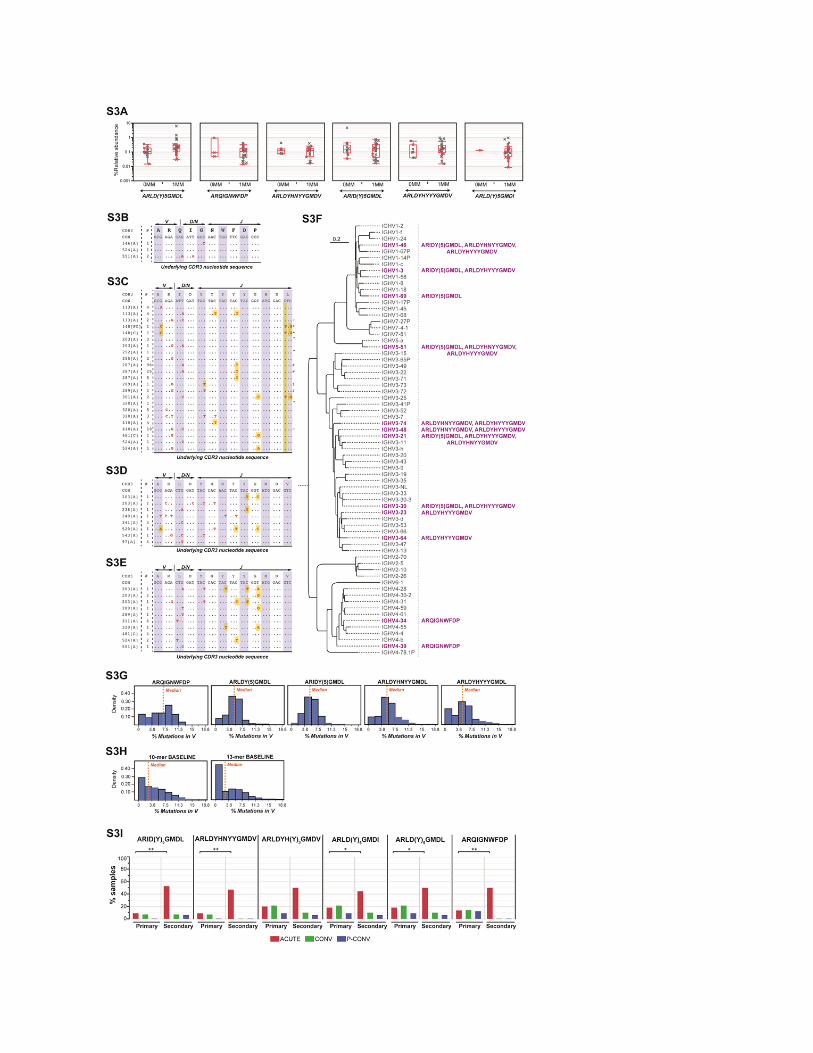
Figure S3. Properties of Prevalent CDR3s, Related to Figure 3
(A) Percent relative abundance of prevalent CDR3 regions that were identified by mismatch
cross-validation. CDR3 regions are binned by the number of amino acid mismatches (0MM or
1MM) to the indicated parent sequence. Annotations to each plot show the 25th-75th percentiles
(box), the 10th-90th percentiles (whiskers), and the median (horizontal line). (B-E) Nucleotide
sequences encoding for convergent CDR3 regions. Sequences are segregated by patient
identity and sample type (A, Acute; C, Convalescent; PC, Post-convalescent). #, count per
sample; CON, Consensus; V, Variable region; D, Diversity region; N, non-templated additions;
J, Joining region. (F) V genes used in encoding for the convergent CDR3 regions and their one-
mismatch derivatives. Only V genes with evidence for usage in at least two samples are shown.
(G-H) Deviations from germline nucleotide sequence in reads encoding for convergent CDR3
regions. Frequency distribution of percent mutation in VH segments encoding for (G) convergent
10-mer and 13-mer CDR3 regions, compared to (H) baseline percent mutation distributions in
similar VH segments that encode for other CDR3 regions in these individuals. (I) Percent
prevalence of convergent CDR3 regions in primary and secondary dengue cases. *P < 0.05, **P
< 0.005 for comparisons between acute primary and acute secondary (Fisher’s test).
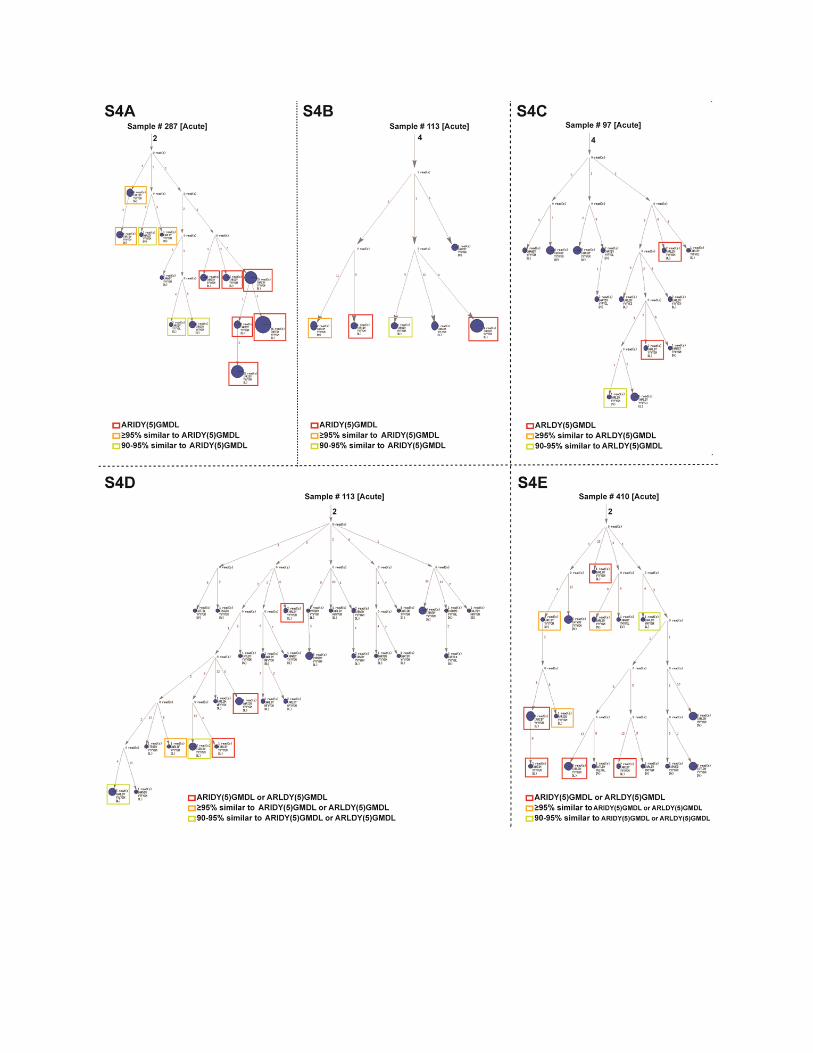
Figure S4. Possible VH Phylogenies for B Cells with Convergent 13-mer CDR3s, Related
to Figure 4
Phylogenies are shown for reads derived from (A-B) IGHV1-46 and IGHJ6, and (C-E) IGHV5-51
and IGHJ6 genes for various individuals, along with the number of nucleotide changes between
any two nodes. The sizes of the circles represent the number of reads. Reads that encode for
ARID(Y)5GMDL and ARLD(Y)5GMDL CDR3 regions and their derivatives with ≥95% similarity or
90-95% similarity are highlighted using red, orange and green boxes, respectively. Methods: A
probabilistic generative model was used to assign a probability to each possible phylogeny.
Markov Chain Monte Carlo (MCMC) was applied to sample this probability distribution over all
possible phylogenies subject to the constraint that the phylogeny must generate the observed
empirical heavy chain reads. Per MCMC iteration, block Gibbs sampling was performed on each
of the following parameters: phylogenetic tree structure, birth and death times of individual
subclones, birth and death rates, mutation rates, read error rates, subclone consensus
sequences, and assignment of reads to subclones. The sampled trees were then optimized, and
the most optimized sample was selected as the final representative output.
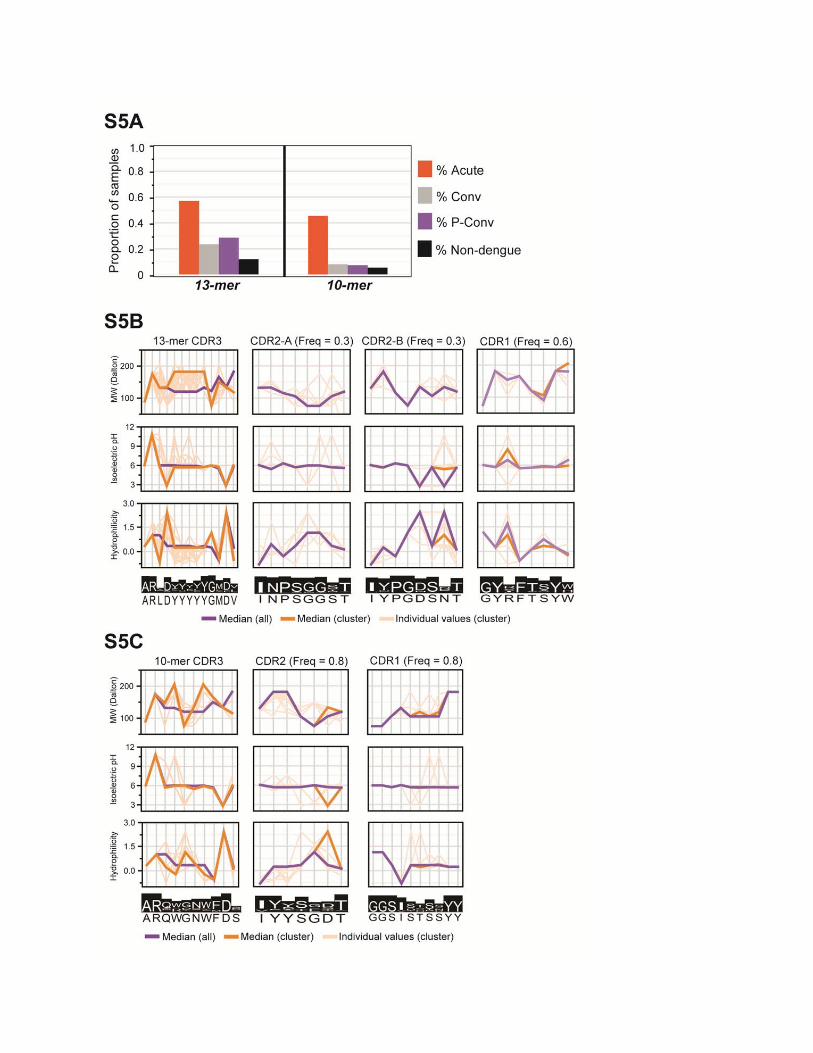
Figure S5. Prevalence and Physicochemical Properties of Clusters Associated with
Convergent CDR3s, Related to Figure 5
(A) Percent prevalence of clusters associated with the convergent 10-mer and 13-mer CDR3
regions in various sample subsets. (B, C) Residue-specific properties of 10-mer and 13-mer
clusters containing the convergent CDR3 regions and their associated CDR2 and CDR1
regions. Scores for molecular weight (top line plot), isoelectric pH (center line plot) or
hydrophilicity (bottom line plot). Purple line, scores for germline CDR1 and CDR2 sequences
(middle and right panels) or median scores across all CDR3 regions of length (B) 10 or (C) 13
(left panels); thick orange line, median scores across all members of the cluster; faded orange
lines, scores for individual members of the cluster. Observed frequencies of association
between CDR3 and CDR1 or CDR2 clusters are shown (freq), as well as the extent of amino
acid conservation and consensus peptide sequences for the CDR clusters.
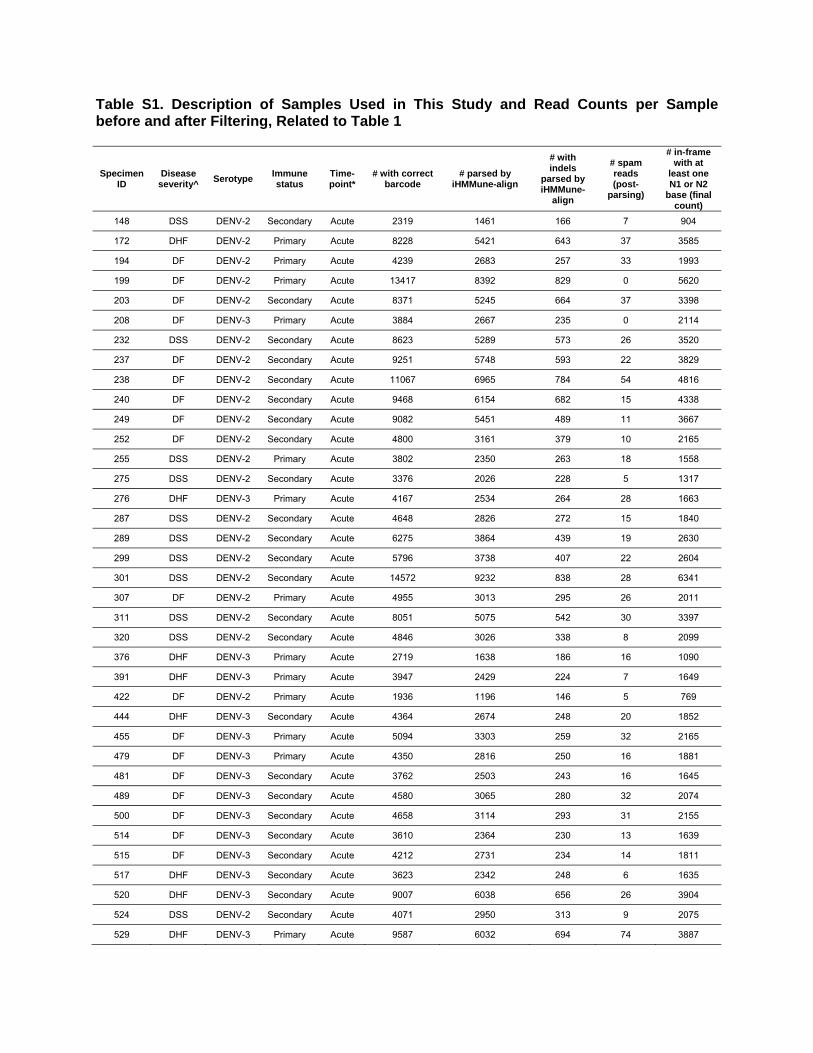
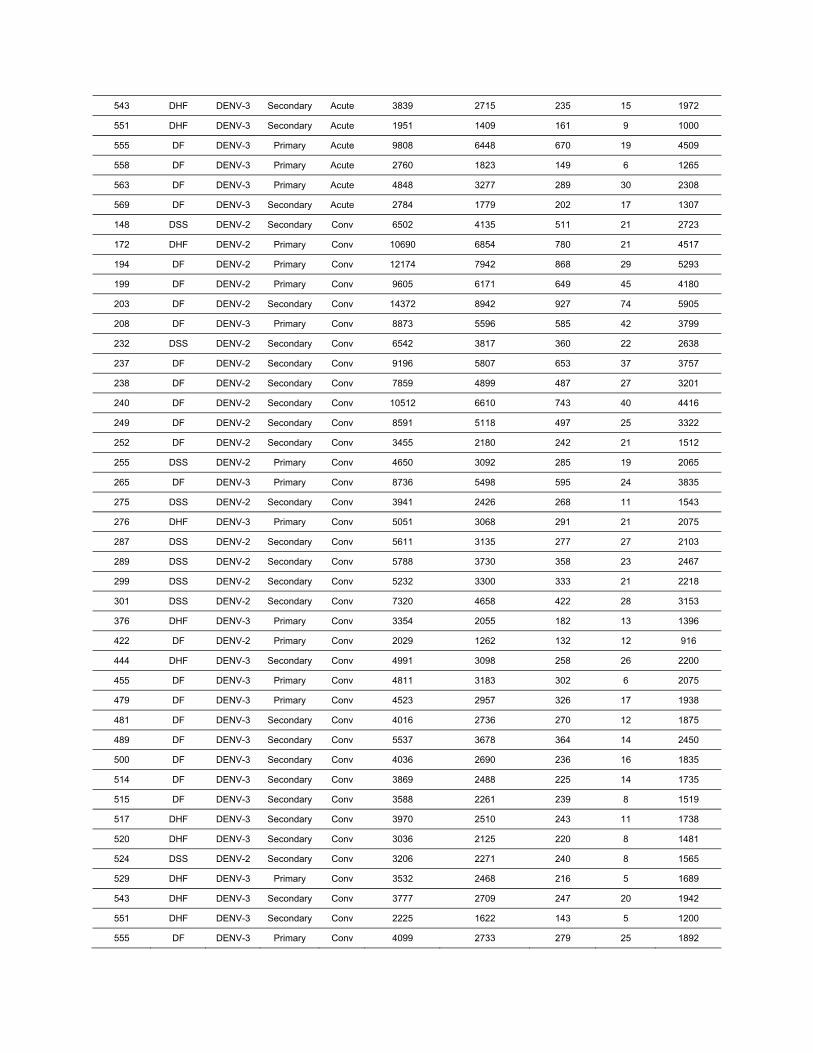
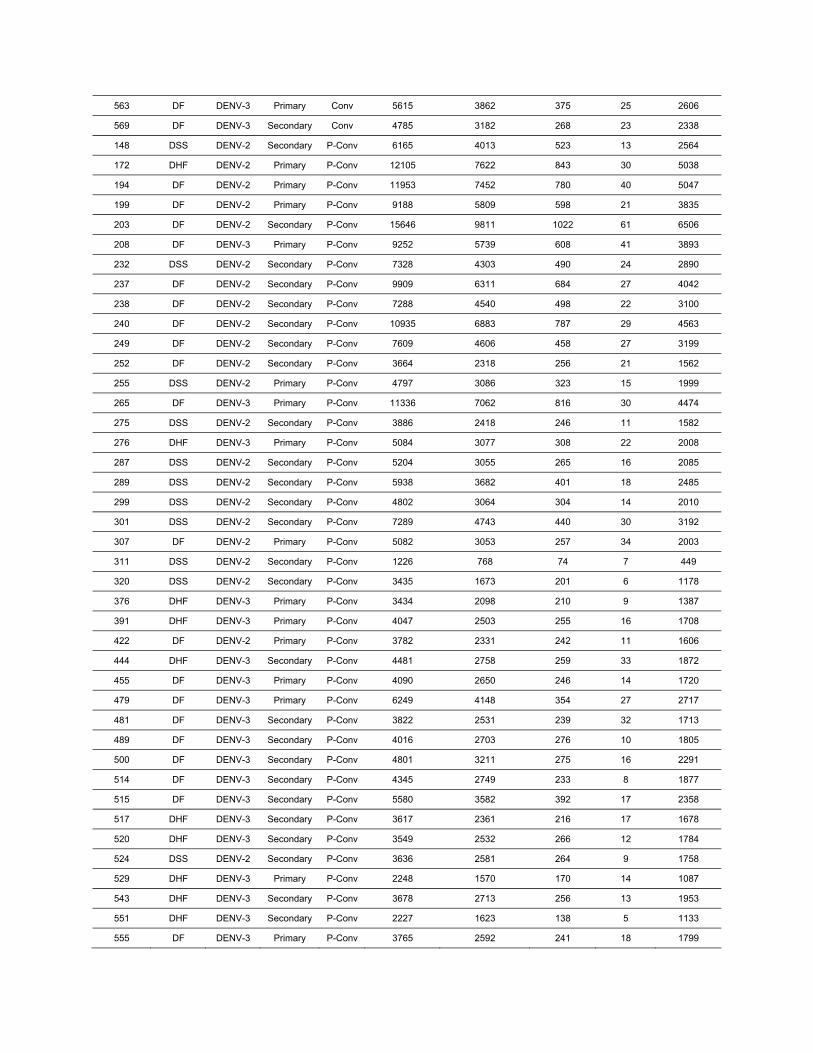
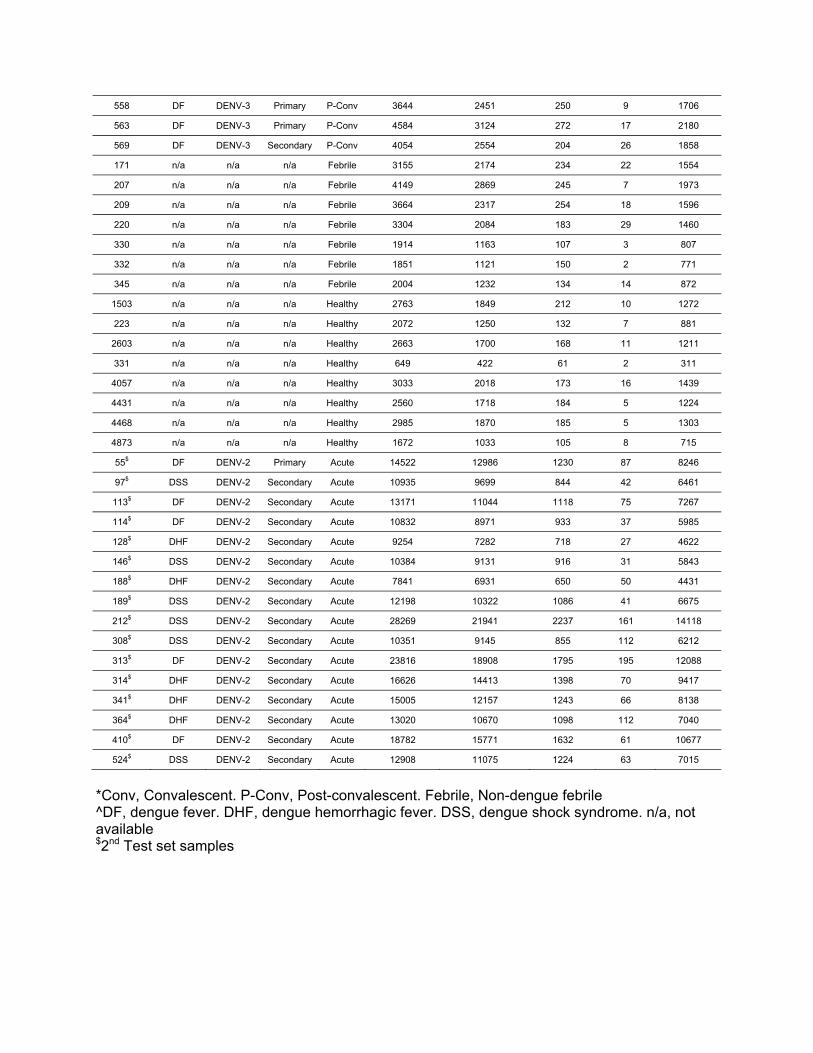
Table S1. Description of Samples Used in This Study and Read Counts per Sample before and after Filtering, Related to Table 1
Specimen ID
Disease severity^
Serotype Immune status
Time-point*
# with correct barcode
# parsed by iHMMune-align
# with indels
parsed by iHMMune-
align
# spam reads (post-
parsing)
# in-frame with at
least one N1 or N2
base (final count)
148 DSS DENV-2 Secondary Acute 2319 1461 166 7 904
172 DHF DENV-2 Primary Acute 8228 5421 643 37 3585
194 DF DENV-2 Primary Acute 4239 2683 257 33 1993
199 DF DENV-2 Primary Acute 13417 8392 829 0 5620
203 DF DENV-2 Secondary Acute 8371 5245 664 37 3398
208 DF DENV-3 Primary Acute 3884 2667 235 0 2114
232 DSS DENV-2 Secondary Acute 8623 5289 573 26 3520
237 DF DENV-2 Secondary Acute 9251 5748 593 22 3829
238 DF DENV-2 Secondary Acute 11067 6965 784 54 4816
240 DF DENV-2 Secondary Acute 9468 6154 682 15 4338
249 DF DENV-2 Secondary Acute 9082 5451 489 11 3667
252 DF DENV-2 Secondary Acute 4800 3161 379 10 2165
255 DSS DENV-2 Primary Acute 3802 2350 263 18 1558
275 DSS DENV-2 Secondary Acute 3376 2026 228 5 1317
276 DHF DENV-3 Primary Acute 4167 2534 264 28 1663
287 DSS DENV-2 Secondary Acute 4648 2826 272 15 1840
289 DSS DENV-2 Secondary Acute 6275 3864 439 19 2630
299 DSS DENV-2 Secondary Acute 5796 3738 407 22 2604
301 DSS DENV-2 Secondary Acute 14572 9232 838 28 6341
307 DF DENV-2 Primary Acute 4955 3013 295 26 2011
311 DSS DENV-2 Secondary Acute 8051 5075 542 30 3397
320 DSS DENV-2 Secondary Acute 4846 3026 338 8 2099
376 DHF DENV-3 Primary Acute 2719 1638 186 16 1090
391 DHF DENV-3 Primary Acute 3947 2429 224 7 1649
422 DF DENV-2 Primary Acute 1936 1196 146 5 769
444 DHF DENV-3 Secondary Acute 4364 2674 248 20 1852
455 DF DENV-3 Primary Acute 5094 3303 259 32 2165
479 DF DENV-3 Primary Acute 4350 2816 250 16 1881
481 DF DENV-3 Secondary Acute 3762 2503 243 16 1645
489 DF DENV-3 Secondary Acute 4580 3065 280 32 2074
500 DF DENV-3 Secondary Acute 4658 3114 293 31 2155
514 DF DENV-3 Secondary Acute 3610 2364 230 13 1639
515 DF DENV-3 Secondary Acute 4212 2731 234 14 1811
517 DHF DENV-3 Secondary Acute 3623 2342 248 6 1635
520 DHF DENV-3 Secondary Acute 9007 6038 656 26 3904
524 DSS DENV-2 Secondary Acute 4071 2950 313 9 2075
529 DHF DENV-3 Primary Acute 9587 6032 694 74 3887
543 DHF DENV-3 Secondary Acute 3839 2715 235 15 1972
551 DHF DENV-3 Secondary Acute 1951 1409 161 9 1000
555 DF DENV-3 Primary Acute 9808 6448 670 19 4509
558 DF DENV-3 Primary Acute 2760 1823 149 6 1265
563 DF DENV-3 Primary Acute 4848 3277 289 30 2308
569 DF DENV-3 Secondary Acute 2784 1779 202 17 1307
148 DSS DENV-2 Secondary Conv 6502 4135 511 21 2723
172 DHF DENV-2 Primary Conv 10690 6854 780 21 4517
194 DF DENV-2 Primary Conv 12174 7942 868 29 5293
199 DF DENV-2 Primary Conv 9605 6171 649 45 4180
203 DF DENV-2 Secondary Conv 14372 8942 927 74 5905
208 DF DENV-3 Primary Conv 8873 5596 585 42 3799
232 DSS DENV-2 Secondary Conv 6542 3817 360 22 2638
237 DF DENV-2 Secondary Conv 9196 5807 653 37 3757
238 DF DENV-2 Secondary Conv 7859 4899 487 27 3201
240 DF DENV-2 Secondary Conv 10512 6610 743 40 4416
249 DF DENV-2 Secondary Conv 8591 5118 497 25 3322
252 DF DENV-2 Secondary Conv 3455 2180 242 21 1512
255 DSS DENV-2 Primary Conv 4650 3092 285 19 2065
265 DF DENV-3 Primary Conv 8736 5498 595 24 3835
275 DSS DENV-2 Secondary Conv 3941 2426 268 11 1543
276 DHF DENV-3 Primary Conv 5051 3068 291 21 2075
287 DSS DENV-2 Secondary Conv 5611 3135 277 27 2103
289 DSS DENV-2 Secondary Conv 5788 3730 358 23 2467
299 DSS DENV-2 Secondary Conv 5232 3300 333 21 2218
301 DSS DENV-2 Secondary Conv 7320 4658 422 28 3153
376 DHF DENV-3 Primary Conv 3354 2055 182 13 1396
422 DF DENV-2 Primary Conv 2029 1262 132 12 916
444 DHF DENV-3 Secondary Conv 4991 3098 258 26 2200
455 DF DENV-3 Primary Conv 4811 3183 302 6 2075
479 DF DENV-3 Primary Conv 4523 2957 326 17 1938
481 DF DENV-3 Secondary Conv 4016 2736 270 12 1875
489 DF DENV-3 Secondary Conv 5537 3678 364 14 2450
500 DF DENV-3 Secondary Conv 4036 2690 236 16 1835
514 DF DENV-3 Secondary Conv 3869 2488 225 14 1735
515 DF DENV-3 Secondary Conv 3588 2261 239 8 1519
517 DHF DENV-3 Secondary Conv 3970 2510 243 11 1738
520 DHF DENV-3 Secondary Conv 3036 2125 220 8 1481
524 DSS DENV-2 Secondary Conv 3206 2271 240 8 1565
529 DHF DENV-3 Primary Conv 3532 2468 216 5 1689
543 DHF DENV-3 Secondary Conv 3777 2709 247 20 1942
551 DHF DENV-3 Secondary Conv 2225 1622 143 5 1200
555 DF DENV-3 Primary Conv 4099 2733 279 25 1892
563 DF DENV-3 Primary Conv 5615 3862 375 25 2606
569 DF DENV-3 Secondary Conv 4785 3182 268 23 2338
148 DSS DENV-2 Secondary P-Conv 6165 4013 523 13 2564
172 DHF DENV-2 Primary P-Conv 12105 7622 843 30 5038
194 DF DENV-2 Primary P-Conv 11953 7452 780 40 5047
199 DF DENV-2 Primary P-Conv 9188 5809 598 21 3835
203 DF DENV-2 Secondary P-Conv 15646 9811 1022 61 6506
208 DF DENV-3 Primary P-Conv 9252 5739 608 41 3893
232 DSS DENV-2 Secondary P-Conv 7328 4303 490 24 2890
237 DF DENV-2 Secondary P-Conv 9909 6311 684 27 4042
238 DF DENV-2 Secondary P-Conv 7288 4540 498 22 3100
240 DF DENV-2 Secondary P-Conv 10935 6883 787 29 4563
249 DF DENV-2 Secondary P-Conv 7609 4606 458 27 3199
252 DF DENV-2 Secondary P-Conv 3664 2318 256 21 1562
255 DSS DENV-2 Primary P-Conv 4797 3086 323 15 1999
265 DF DENV-3 Primary P-Conv 11336 7062 816 30 4474
275 DSS DENV-2 Secondary P-Conv 3886 2418 246 11 1582
276 DHF DENV-3 Primary P-Conv 5084 3077 308 22 2008
287 DSS DENV-2 Secondary P-Conv 5204 3055 265 16 2085
289 DSS DENV-2 Secondary P-Conv 5938 3682 401 18 2485
299 DSS DENV-2 Secondary P-Conv 4802 3064 304 14 2010
301 DSS DENV-2 Secondary P-Conv 7289 4743 440 30 3192
307 DF DENV-2 Primary P-Conv 5082 3053 257 34 2003
311 DSS DENV-2 Secondary P-Conv 1226 768 74 7 449
320 DSS DENV-2 Secondary P-Conv 3435 1673 201 6 1178
376 DHF DENV-3 Primary P-Conv 3434 2098 210 9 1387
391 DHF DENV-3 Primary P-Conv 4047 2503 255 16 1708
422 DF DENV-2 Primary P-Conv 3782 2331 242 11 1606
444 DHF DENV-3 Secondary P-Conv 4481 2758 259 33 1872
455 DF DENV-3 Primary P-Conv 4090 2650 246 14 1720
479 DF DENV-3 Primary P-Conv 6249 4148 354 27 2717
481 DF DENV-3 Secondary P-Conv 3822 2531 239 32 1713
489 DF DENV-3 Secondary P-Conv 4016 2703 276 10 1805
500 DF DENV-3 Secondary P-Conv 4801 3211 275 16 2291
514 DF DENV-3 Secondary P-Conv 4345 2749 233 8 1877
515 DF DENV-3 Secondary P-Conv 5580 3582 392 17 2358
517 DHF DENV-3 Secondary P-Conv 3617 2361 216 17 1678
520 DHF DENV-3 Secondary P-Conv 3549 2532 266 12 1784
524 DSS DENV-2 Secondary P-Conv 3636 2581 264 9 1758
529 DHF DENV-3 Primary P-Conv 2248 1570 170 14 1087
543 DHF DENV-3 Secondary P-Conv 3678 2713 256 13 1953
551 DHF DENV-3 Secondary P-Conv 2227 1623 138 5 1133
555 DF DENV-3 Primary P-Conv 3765 2592 241 18 1799
558 DF DENV-3 Primary P-Conv 3644 2451 250 9 1706
563 DF DENV-3 Primary P-Conv 4584 3124 272 17 2180
569 DF DENV-3 Secondary P-Conv 4054 2554 204 26 1858
171 n/a n/a n/a Febrile 3155 2174 234 22 1554
207 n/a n/a n/a Febrile 4149 2869 245 7 1973
209 n/a n/a n/a Febrile 3664 2317 254 18 1596
220 n/a n/a n/a Febrile 3304 2084 183 29 1460
330 n/a n/a n/a Febrile 1914 1163 107 3 807
332 n/a n/a n/a Febrile 1851 1121 150 2 771
345 n/a n/a n/a Febrile 2004 1232 134 14 872
1503 n/a n/a n/a Healthy 2763 1849 212 10 1272
223 n/a n/a n/a Healthy 2072 1250 132 7 881
2603 n/a n/a n/a Healthy 2663 1700 168 11 1211
331 n/a n/a n/a Healthy 649 422 61 2 311
4057 n/a n/a n/a Healthy 3033 2018 173 16 1439
4431 n/a n/a n/a Healthy 2560 1718 184 5 1224
4468 n/a n/a n/a Healthy 2985 1870 185 5 1303
4873 n/a n/a n/a Healthy 1672 1033 105 8 715
55$ DF DENV-2 Primary Acute 14522 12986 1230 87 8246
97$ DSS DENV-2 Secondary Acute 10935 9699 844 42 6461
113$ DF DENV-2 Secondary Acute 13171 11044 1118 75 7267
114$ DF DENV-2 Secondary Acute 10832 8971 933 37 5985
128$ DHF DENV-2 Secondary Acute 9254 7282 718 27 4622
146$ DSS DENV-2 Secondary Acute 10384 9131 916 31 5843
188$ DHF DENV-2 Secondary Acute 7841 6931 650 50 4431
189$ DSS DENV-2 Secondary Acute 12198 10322 1086 41 6675
212$ DSS DENV-2 Secondary Acute 28269 21941 2237 161 14118
308$ DSS DENV-2 Secondary Acute 10351 9145 855 112 6212
313$ DF DENV-2 Secondary Acute 23816 18908 1795 195 12088
314$ DHF DENV-2 Secondary Acute 16626 14413 1398 70 9417
341$ DHF DENV-2 Secondary Acute 15005 12157 1243 66 8138
364$ DHF DENV-2 Secondary Acute 13020 10670 1098 112 7040
410$ DF DENV-2 Secondary Acute 18782 15771 1632 61 10677
524$ DSS DENV-2 Secondary Acute 12908 11075 1224 63 7015
*Conv, Convalescent. P-Conv, Post-convalescent. Febrile, Non-dengue febrile ^DF, dengue fever. DHF, dengue hemorrhagic fever. DSS, dengue shock syndrome. n/a, not available $2nd Test set samples
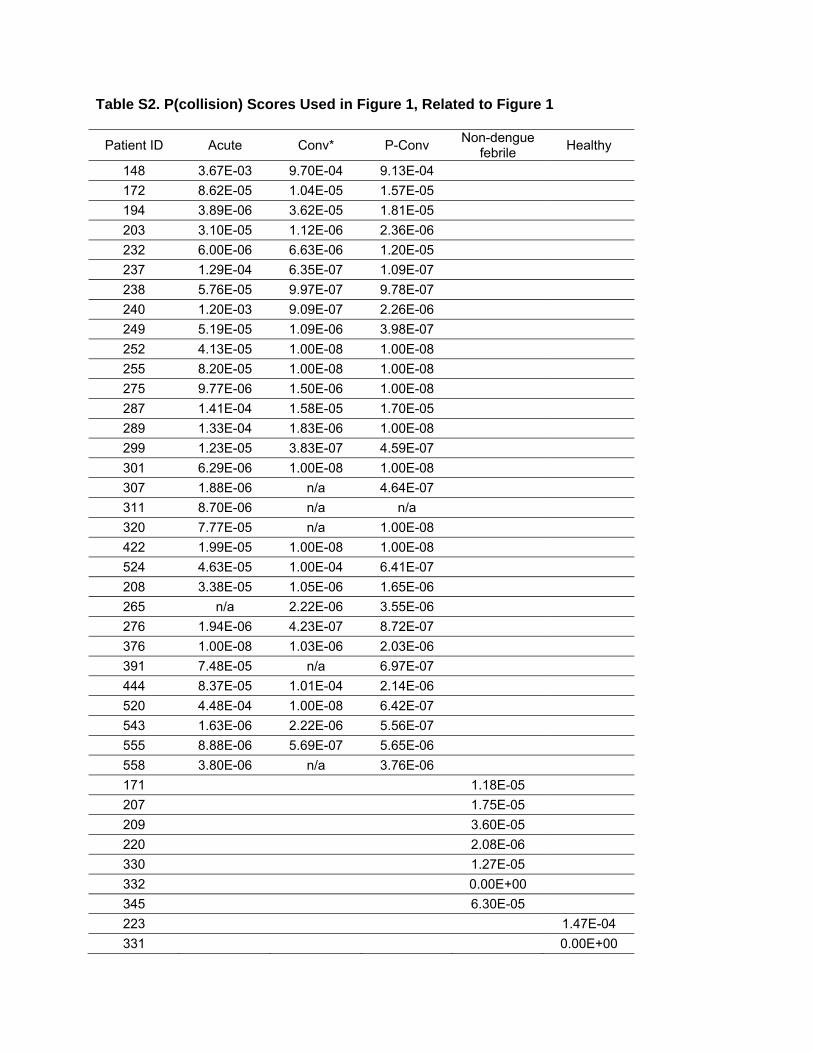
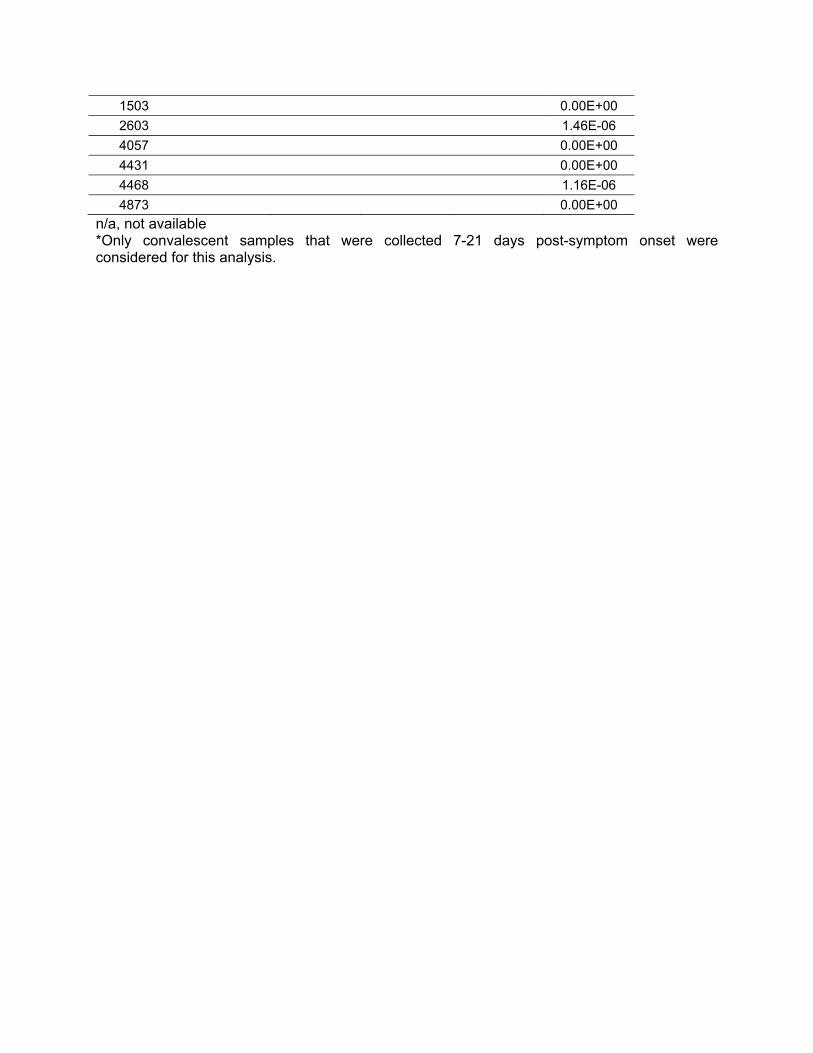
Table S2. P(collision) Scores Used in Figure 1, Related to Figure 1
Patient ID Acute Conv* P-Conv Non-dengue
febrile Healthy
148 3.67E-03 9.70E-04 9.13E-04
172 8.62E-05 1.04E-05 1.57E-05
194 3.89E-06 3.62E-05 1.81E-05
203 3.10E-05 1.12E-06 2.36E-06
232 6.00E-06 6.63E-06 1.20E-05
237 1.29E-04 6.35E-07 1.09E-07
238 5.76E-05 9.97E-07 9.78E-07
240 1.20E-03 9.09E-07 2.26E-06
249 5.19E-05 1.09E-06 3.98E-07
252 4.13E-05 1.00E-08 1.00E-08
255 8.20E-05 1.00E-08 1.00E-08
275 9.77E-06 1.50E-06 1.00E-08
287 1.41E-04 1.58E-05 1.70E-05
289 1.33E-04 1.83E-06 1.00E-08
299 1.23E-05 3.83E-07 4.59E-07
301 6.29E-06 1.00E-08 1.00E-08
307 1.88E-06 n/a 4.64E-07
311 8.70E-06 n/a n/a
320 7.77E-05 n/a 1.00E-08
422 1.99E-05 1.00E-08 1.00E-08
524 4.63E-05 1.00E-04 6.41E-07
208 3.38E-05 1.05E-06 1.65E-06
265 n/a 2.22E-06 3.55E-06
276 1.94E-06 4.23E-07 8.72E-07
376 1.00E-08 1.03E-06 2.03E-06
391 7.48E-05 n/a 6.97E-07
444 8.37E-05 1.01E-04 2.14E-06
520 4.48E-04 1.00E-08 6.42E-07
543 1.63E-06 2.22E-06 5.56E-07
555 8.88E-06 5.69E-07 5.65E-06
558 3.80E-06 n/a 3.76E-06
171 1.18E-05
207 1.75E-05
209 3.60E-05
220 2.08E-06
330 1.27E-05
332 0.00E+00
345 6.30E-05
223 1.47E-04
331 0.00E+00
1503 0.00E+00
2603 1.46E-06
4057 0.00E+00
4431 0.00E+00
4468 1.16E-06
4873 0.00E+00
n/a, not available *Only convalescent samples that were collected 7-21 days post-symptom onset were considered for this analysis.
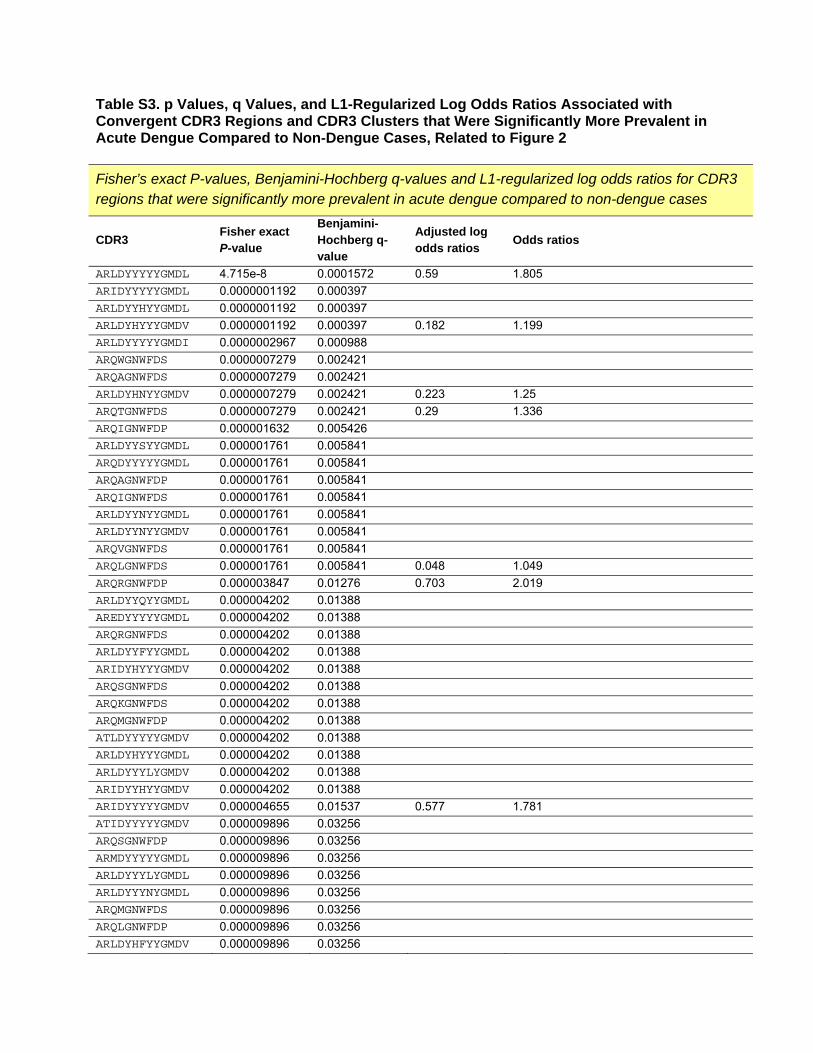
Table S3. p Values, q Values, and L1-Regularized Log Odds Ratios Associated with Convergent CDR3 Regions and CDR3 Clusters that Were Significantly More Prevalent in Acute Dengue Compared to Non-Dengue Cases, Related to Figure 2
Fisher’s exact P-values, Benjamini-Hochberg q-values and L1-regularized log odds ratios for CDR3 regions that were significantly more prevalent in acute dengue compared to non-dengue cases
CDR3 Fisher exact P-value
Benjamini-Hochberg q-value
Adjusted log odds ratios
Odds ratios
ARLDYYYYYGMDL 4.715e-8 0.0001572 0.59 1.805
ARIDYYYYYGMDL 0.0000001192 0.000397
ARLDYYHYYGMDL 0.0000001192 0.000397
ARLDYHYYYGMDV 0.0000001192 0.000397 0.182 1.199
ARLDYYYYYGMDI 0.0000002967 0.000988
ARQWGNWFDS 0.0000007279 0.002421
ARQAGNWFDS 0.0000007279 0.002421
ARLDYHNYYGMDV 0.0000007279 0.002421 0.223 1.25
ARQTGNWFDS 0.0000007279 0.002421 0.29 1.336
ARQIGNWFDP 0.000001632 0.005426
ARLDYYSYYGMDL 0.000001761 0.005841
ARQDYYYYYGMDL 0.000001761 0.005841
ARQAGNWFDP 0.000001761 0.005841
ARQIGNWFDS 0.000001761 0.005841
ARLDYYNYYGMDL 0.000001761 0.005841
ARLDYYNYYGMDV 0.000001761 0.005841
ARQVGNWFDS 0.000001761 0.005841
ARQLGNWFDS 0.000001761 0.005841 0.048 1.049
ARQRGNWFDP 0.000003847 0.01276 0.703 2.019
ARLDYYQYYGMDL 0.000004202 0.01388
AREDYYYYYGMDL 0.000004202 0.01388
ARQRGNWFDS 0.000004202 0.01388
ARLDYYFYYGMDL 0.000004202 0.01388
ARIDYHYYYGMDV 0.000004202 0.01388
ARQSGNWFDS 0.000004202 0.01388
ARQKGNWFDS 0.000004202 0.01388
ARQMGNWFDP 0.000004202 0.01388
ATLDYYYYYGMDV 0.000004202 0.01388
ARLDYHYYYGMDL 0.000004202 0.01388
ARLDYYYLYGMDV 0.000004202 0.01388
ARIDYYHYYGMDV 0.000004202 0.01388
ARIDYYYYYGMDV 0.000004655 0.01537 0.577 1.781
ATIDYYYYYGMDV 0.000009896 0.03256
ARQSGNWFDP 0.000009896 0.03256
ARMDYYYYYGMDL 0.000009896 0.03256
ARLDYYYLYGMDL 0.000009896 0.03256
ARLDYYYNYGMDL 0.000009896 0.03256
ARQMGNWFDS 0.000009896 0.03256
ARQLGNWFDP 0.000009896 0.03256
ARLDYHFYYGMDV 0.000009896 0.03256
ARCDYYYYYGMDL 0.000009896 0.03256
ARLDFYYYYGMDL 0.000009896 0.03256
ARQNGNWFDS 0.000009896 0.03256
ARYDYYYYYGMDL 0.000009896 0.03256
ARADYYYYYGMDL 0.000009896 0.03256
ARGGYSDY 0.553 1.739
ARGPTLDY 0.371 1.449
ARGGPYYFDY 0.323 1.382
ARQWGNWFDR 0.212 1.236
ARQYGNYFDY 0.149 1.161
ARDGGSYYFDY 0.098 1.102
ARGLTGFDY 0.074 1.077
ARYYFDY 0.023 1.023
ARAGSYYFDY 0.011 1.011
ARVYYYYYGMDV 0.011 1.011
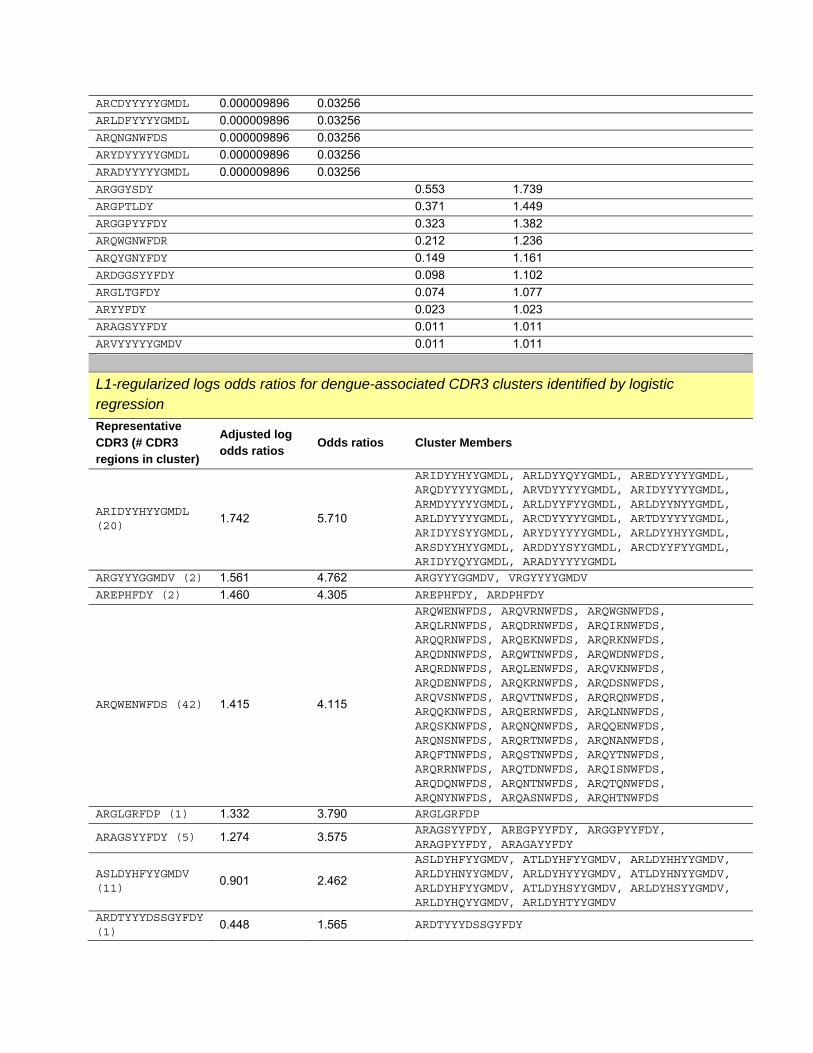
L1-regularized logs odds ratios for dengue-associated CDR3 clusters identified by logistic regression
Representative CDR3 (# CDR3 regions in cluster)
Adjusted log odds ratios
Odds ratios Cluster Members
ARIDYYHYYGMDL (20)
1.742 5.710
ARIDYYHYYGMDL, ARLDYYQYYGMDL, AREDYYYYYGMDL, ARQDYYYYYGMDL, ARVDYYYYYGMDL, ARIDYYYYYGMDL, ARMDYYYYYGMDL, ARLDYYFYYGMDL, ARLDYYNYYGMDL, ARLDYYYYYGMDL, ARCDYYYYYGMDL, ARTDYYYYYGMDL, ARIDYYSYYGMDL, ARYDYYYYYGMDL, ARLDYYHYYGMDL, ARSDYYHYYGMDL, ARDDYYSYYGMDL, ARCDYYFYYGMDL, ARIDYYQYYGMDL, ARADYYYYYGMDL
ARGYYYGGMDV (2) 1.561 4.762 ARGYYYGGMDV, VRGYYYYGMDV
AREPHFDY (2) 1.460 4.305 AREPHFDY, ARDPHFDY
ARQWENWFDS (42) 1.415 4.115
ARQWENWFDS, ARQVRNWFDS, ARQWGNWFDS, ARQLRNWFDS, ARQDRNWFDS, ARQIRNWFDS, ARQQRNWFDS, ARQEKNWFDS, ARQRKNWFDS, ARQDNNWFDS, ARQWTNWFDS, ARQWDNWFDS, ARQRDNWFDS, ARQLENWFDS, ARQVKNWFDS, ARQDENWFDS, ARQKRNWFDS, ARQDSNWFDS, ARQVSNWFDS, ARQVTNWFDS, ARQRQNWFDS, ARQQKNWFDS, ARQERNWFDS, ARQLNNWFDS, ARQSKNWFDS, ARQNQNWFDS, ARQQENWFDS, ARQNSNWFDS, ARQRTNWFDS, ARQNANWFDS, ARQFTNWFDS, ARQSTNWFDS, ARQYTNWFDS, ARQRRNWFDS, ARQTDNWFDS, ARQISNWFDS, ARQDQNWFDS, ARQNTNWFDS, ARQTQNWFDS, ARQNYNWFDS, ARQASNWFDS, ARQHTNWFDS
ARGLGRFDP (1) 1.332 3.790 ARGLGRFDP
ARAGSYYFDY (5) 1.274 3.575 ARAGSYYFDY, AREGPYYFDY, ARGGPYYFDY, ARAGPYYFDY, ARAGAYYFDY
ASLDYHFYYGMDV (11)
0.901 2.462
ASLDYHFYYGMDV, ATLDYHFYYGMDV, ARLDYHHYYGMDV, ARLDYHNYYGMDV, ARLDYHYYYGMDV, ATLDYHNYYGMDV, ARLDYHFYYGMDV, ATLDYHSYYGMDV, ARLDYHSYYGMDV, ARLDYHQYYGMDV, ARLDYHTYYGMDV
ARDTYYYDSSGYFDY (1)
0.448 1.565 ARDTYYYDSSGYFDY
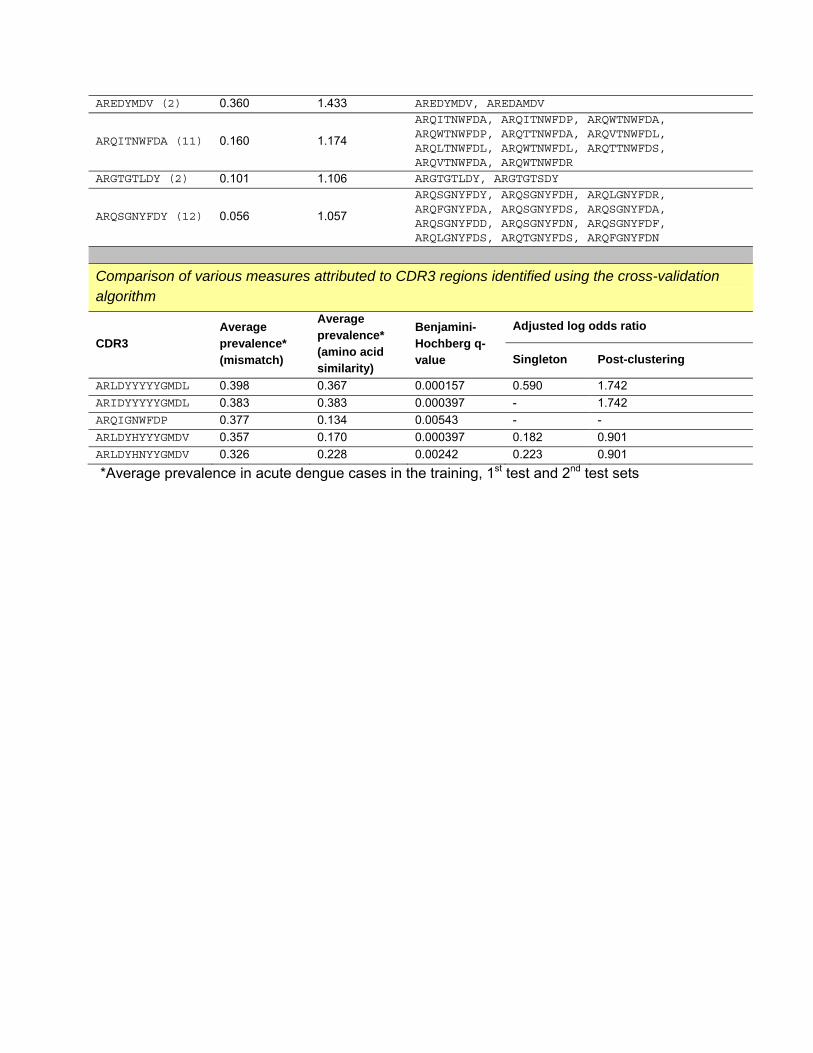
AREDYMDV (2) 0.360 1.433 AREDYMDV, AREDAMDV
ARQITNWFDA (11) 0.160 1.174
ARQITNWFDA, ARQITNWFDP, ARQWTNWFDA, ARQWTNWFDP, ARQTTNWFDA, ARQVTNWFDL, ARQLTNWFDL, ARQWTNWFDL, ARQTTNWFDS, ARQVTNWFDA, ARQWTNWFDR
ARGTGTLDY (2) 0.101 1.106 ARGTGTLDY, ARGTGTSDY
ARQSGNYFDY (12) 0.056 1.057
ARQSGNYFDY, ARQSGNYFDH, ARQLGNYFDR, ARQFGNYFDA, ARQSGNYFDS, ARQSGNYFDA, ARQSGNYFDD, ARQSGNYFDN, ARQSGNYFDF, ARQLGNYFDS, ARQTGNYFDS, ARQFGNYFDN
Comparison of various measures attributed to CDR3 regions identified using the cross-validation algorithm
CDR3 Average prevalence* (mismatch)
Average prevalence* (amino acid similarity)
Benjamini-Hochberg q-value
Adjusted log odds ratio
Singleton Post-clustering
ARLDYYYYYGMDL 0.398 0.367 0.000157 0.590 1.742
ARIDYYYYYGMDL 0.383 0.383 0.000397 - 1.742
ARQIGNWFDP 0.377 0.134 0.00543 - -
ARLDYHYYYGMDV 0.357 0.170 0.000397 0.182 0.901
ARLDYHNYYGMDV 0.326 0.228 0.00242 0.223 0.901
*Average prevalence in acute dengue cases in the training, 1st test and 2nd test sets
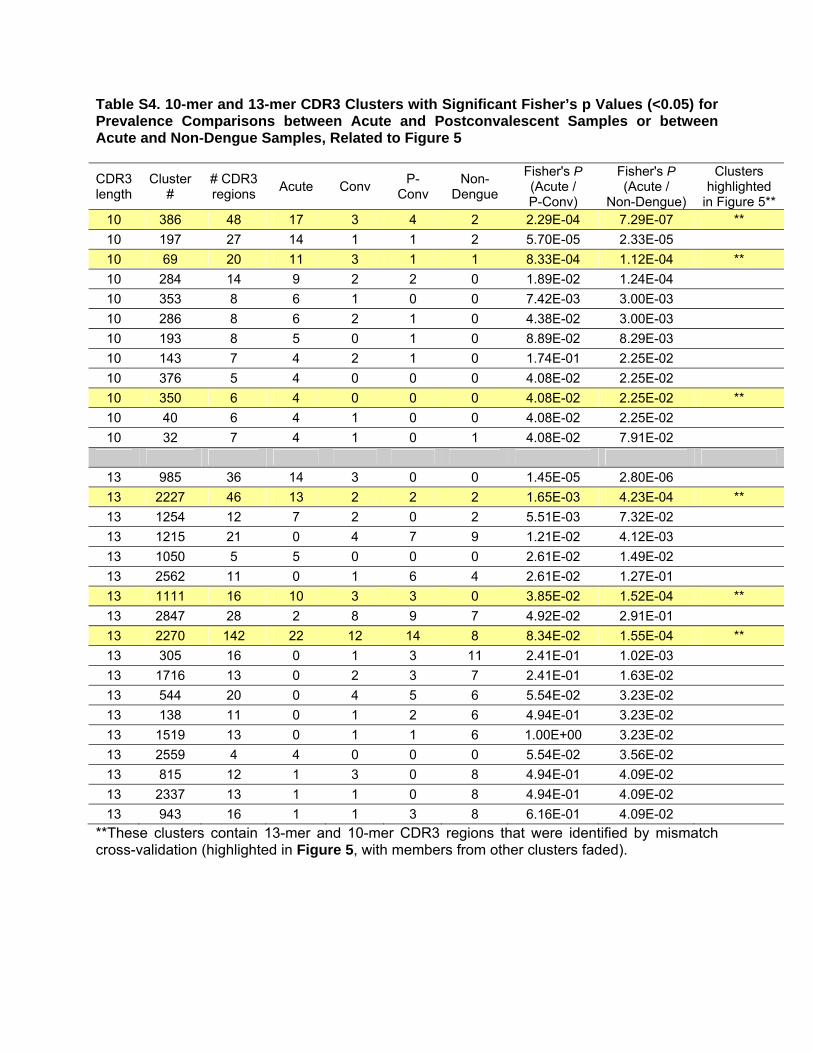
Table S4. 10-mer and 13-mer CDR3 Clusters with Significant Fisher’s p Values (<0.05) for Prevalence Comparisons between Acute and Postconvalescent Samples or between Acute and Non-Dengue Samples, Related to Figure 5
CDR3 length
Cluster #
# CDR3 regions
Acute Conv P-
Conv Non-
Dengue
Fisher's P (Acute / P-Conv)
Fisher's P (Acute /
Non-Dengue)
Clusters highlighted
in Figure 5** 10 386 48 17 3 4 2 2.29E-04 7.29E-07 **
10 197 27 14 1 1 2 5.70E-05 2.33E-05
10 69 20 11 3 1 1 8.33E-04 1.12E-04 **
10 284 14 9 2 2 0 1.89E-02 1.24E-04
10 353 8 6 1 0 0 7.42E-03 3.00E-03
10 286 8 6 2 1 0 4.38E-02 3.00E-03
10 193 8 5 0 1 0 8.89E-02 8.29E-03
10 143 7 4 2 1 0 1.74E-01 2.25E-02
10 376 5 4 0 0 0 4.08E-02 2.25E-02
10 350 6 4 0 0 0 4.08E-02 2.25E-02 **
10 40 6 4 1 0 0 4.08E-02 2.25E-02
10 32 7 4 1 0 1 4.08E-02 7.91E-02
13 985 36 14 3 0 0 1.45E-05 2.80E-06
13 2227 46 13 2 2 2 1.65E-03 4.23E-04 **
13 1254 12 7 2 0 2 5.51E-03 7.32E-02
13 1215 21 0 4 7 9 1.21E-02 4.12E-03
13 1050 5 5 0 0 0 2.61E-02 1.49E-02
13 2562 11 0 1 6 4 2.61E-02 1.27E-01
13 1111 16 10 3 3 0 3.85E-02 1.52E-04 **
13 2847 28 2 8 9 7 4.92E-02 2.91E-01
13 2270 142 22 12 14 8 8.34E-02 1.55E-04 **
13 305 16 0 1 3 11 2.41E-01 1.02E-03
13 1716 13 0 2 3 7 2.41E-01 1.63E-02
13 544 20 0 4 5 6 5.54E-02 3.23E-02
13 138 11 0 1 2 6 4.94E-01 3.23E-02
13 1519 13 0 1 1 6 1.00E+00 3.23E-02
13 2559 4 4 0 0 0 5.54E-02 3.56E-02
13 815 12 1 3 0 8 4.94E-01 4.09E-02
13 2337 13 1 1 0 8 4.94E-01 4.09E-02
13 943 16 1 1 3 8 6.16E-01 4.09E-02
**These clusters contain 13-mer and 10-mer CDR3 regions that were identified by mismatch cross-validation (highlighted in Figure 5, with members from other clusters faded).