Cell-based Binding Assays Using Platform Technology · 2 Outline Antibody drug conjugate (ADC)...
21
1 Cell-based Binding Assays Using Platform Technology Mary Hu Seattle Genetics CASSS Bioassay Conference March 4-5th, 2013
Transcript of Cell-based Binding Assays Using Platform Technology · 2 Outline Antibody drug conjugate (ADC)...

1
Cell-based Binding Assays
Using Platform Technology
Mary Hu
Seattle Genetics
CASSS Bioassay Conference
March 4-5th, 2013

2
Outline
Antibody drug conjugate (ADC) technology
Binding ELISA vs cell-based binding assay
MSD technology
Development of cell-based binding assay
Qualification of cell-based binding assay
Platform assay or platform technology
Summary

3
Endosome
Lysosome: drug
release from ADC
Drug escape
to cytosol
Receptor-mediated
endocytosis
ADC
Antigen Cell
membrane
Cell death
Binding is a Key Component of ADC

4
Binding ELISA vs Cell-based Binding Assay
Ligand Binding ELISA Pros
Easy to perform and transfer
Robust
Cons Availability of binding ligand
Binding ligand reproducibly made
Need to demonstrate the recombinant/purified ligand (fusion protein) similar to the native molecule on the cell surface
Cell-based Binding Assay Target antigen molecule on the cell surface, no need
for purified recombinant ligand
Less robust
5
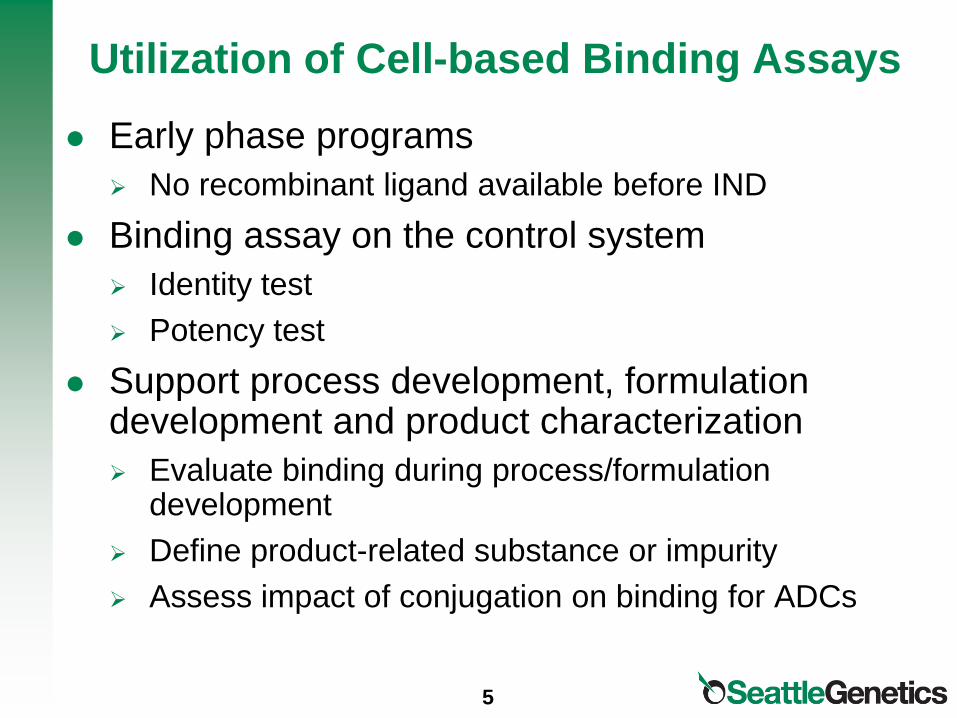
Utilization of Cell-based Binding Assays
Early phase programs
No recombinant ligand available before IND
Binding assay on the control system
Identity test
Potency test
Support process development, formulation development and product characterization
Evaluate binding during process/formulation development
Define product-related substance or impurity
Assess impact of conjugation on binding for ADCs

6
MSD SULFO-TAG NHS-Ester
MSD Technology
(Electrochemiluminescence, ECL)

7
ECL Technology

8
Direct Binding vs Competitive Binding
Assay Design
antigen
target Cell Cells bound to plate
High-Bind MSD Plate
mAb or ADC binding
SULFO-TAG Anti-Human IgG
Detection antiobody
antigen
target Cell
High-Bind MSD Plate
SULFO-TAG mAb or ADC

9
Representative Competitive Binding Curve

10
Development of Cell-based Binding Assays
Optimization of assay conditions
Cell density
Blocking condition
Wash condition
Assay incubation time
Detection antibody
Plate uniformity
Use DOE extensively

11
Cell Density Optimization
37C - 1 Hour in 1X PBS + 1% FBS
0.1 1 10 100 1000 100000.1
1
10
100
1000
1e5
2e5
5e5
10e5
20e5
40e5
SGN-75 (ng/mL)
EC
L S
ign
al/B
ackg
rou
nd
Interesting observation: with cell density increasing, ECL signal
first increases, reaches maximal then decreases.

12
Interim Reference
Accuracy Control %RP range: 91 108
Sample %RP range: 92 113
Precision
Control %CV (N=14): 5
All Samples %CV (N=28): 5
3SD Range for Control: 86 113
3SD Range for Sample: 87 114
Repeatability (Same day)
Control %CV range: 0 8
Sample %CV range: 2 6
Assay Qualification: Accuracy,
Precision & Repeatability

13
Linearity with Interim Reference
Nominal %RP Measured
%RP %Diff from
Nominal %RP
25 25 0
50 48 -4
75 76 1
100 104 4
133 135 1
200 201 1
R2 = 0.9993
0
50
100
150
200
250
0 50 100 150 200 250
Nominal %RP
Measu
red
%R
P
200%
25%

14
Specificity Demonstrated for ADC-1
Antigen positive cells • Specificity demonstrated for the
mAb and ADC
• No competition observed for the
unrelated mAbs and ADCs
Antigen negative cells • No signal observed

15
Qualification Summary
Interim Reference Result
Accuracy Control %RP range: 91 108
Sample %RP range: 92 113
Precision
Control %CV (N=14): 5
All Samples %CV (N=28): 5
3SD Range for Control: 86 113
3SD Range for Sample: 87 114
Repeatability
(Same day)
Control %CV range: 0 8
Sample %CV range: 2 6
Linearity %Diff from Nominal %RP 0 4
Trend Line R2 Value 0.9993
Specificity Other unrelated products Curves not similar to
reference
16
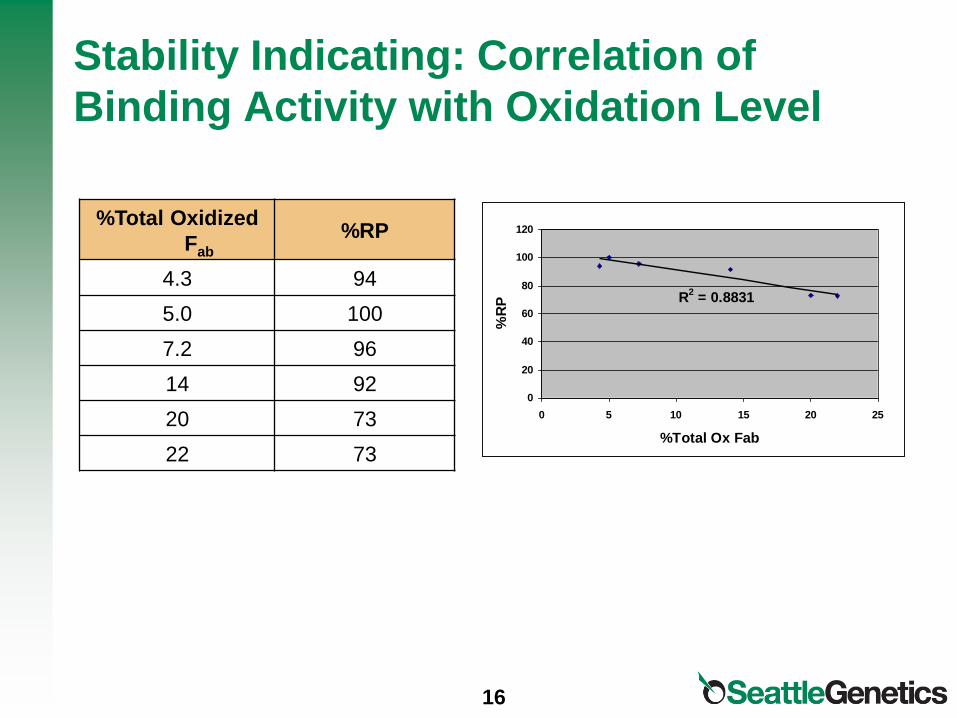
Stability Indicating: Correlation of
Binding Activity with Oxidation Level
%Total Oxidized
Fab
%RP
4.3 94
5.0 100
7.2 96
14 92
20 73
22 73
R2 = 0.8831
0
20
40
60
80
100
120
0 5 10 15 20 25
%Total Ox Fab
%R
P
17
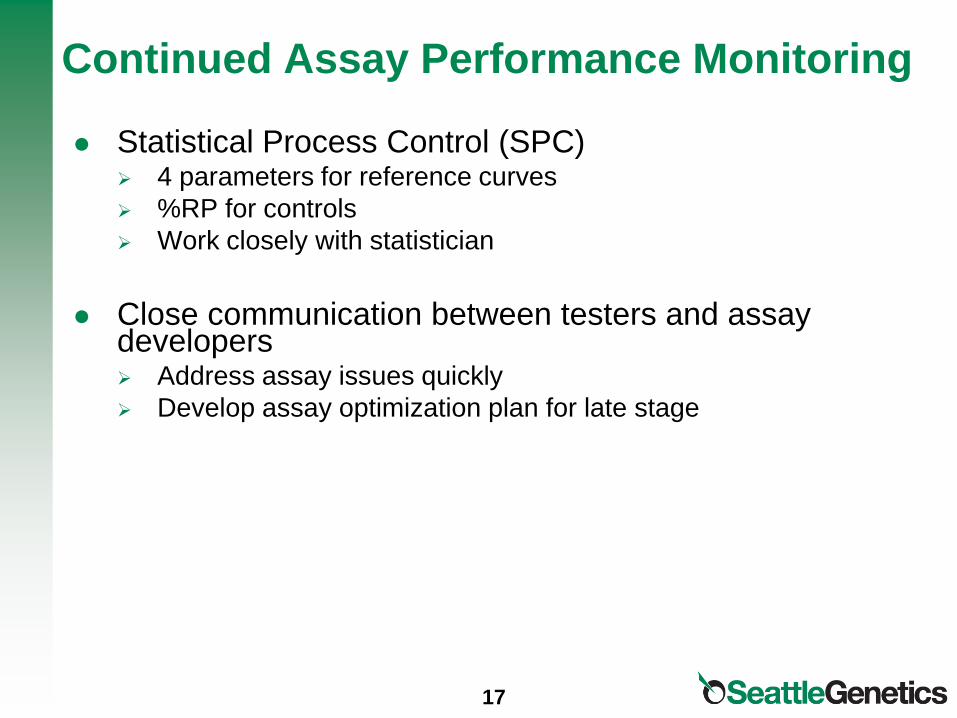
Continued Assay Performance Monitoring
Statistical Process Control (SPC) 4 parameters for reference curves
%RP for controls
Work closely with statistician
Close communication between testers and assay developers Address assay issues quickly
Develop assay optimization plan for late stage

18
Platform Assay or Platform Technology
Platform approach for process and assay Efficiency and productivity – “do more with less”
Less resources needed
More predictable timeline
Easier assay transfer
More effective use of instruments
Platform bioassays Impossible for product specific MOA-based bioassay
Effector function assays Binding assays
Utilize platform technology (MSD, AlphaScreen…)

19
Challenges in Platforming Bioassay
Each therapeutic has unique MOA
Ligand binding
Effector functions – ADCC, CDC and ADCP
Cytotoxic signalling
Cytotoxic drug delivery
Cell lines have different characteristics
Target surface antigen/receptor number varying in a wide range
Suspension or adherence
Growth rate
Growth condition
Passage number

20
Summary
We have developed robust and reliable cell-based binding assays for early phase programs.
MSD can be utilized as a platform technology for cell-based binding assays.
Continued assay performance monitoring is more important than a snapshot of assay qualification.

21
Thanks
Bioassay group members at Seattle Genetics


