Factoring Accounts Receivables By: Veronica Wallace Vice President Vice President.


TheLooming
Crisis
Who Will Pay ForYour Retirement?
A Statement by the Research and Policy Committeeof the Committee for Economic Development

Who Will Pay ForYour Retirement?
TheLooming
Crisis

Library of Congress Cataloging-in-Publication Data
Committee for Economic Development. Research and Policy Committee.Who will pay for your retirement? : the looming crisis : a statement /by the Research and Policy Committee of the Committee for Economic Development.p. cm.Includes bibliographical references.ISBN 0-87186-119-4 : $20.001. Old age pensions — United States. 2. Retirement income — United States.
3. Social security — United States. 4. Civil service — Pensions — United States.5. Individual retirement accounts — United States. I. Committee for EconomicDevelopment. II. Title.HD7105.35.U6C65 1995331.25'2'0973 — dc20 95-3345
CIP
First printing in bound-book form: 1995Paperback: $20.00Printed in the United States of AmericaDesign: Rowe & Ballantine
COMMITTEE FOR ECONOMIC DEVELOPMENT477 Madison Avenue, New York, N.Y. 10022(212) 688-2063
2000 L Street, N.W., Suite 700, Washington, D.C. 20036(202) 296-5860

84 iii
CONTENTS
RESPONSIBILITY FOR CED STATEMENTS ON NATIONAL POLICY vi
PURPOSE OF THIS STATEMENT ix
CHAPTER 1: EXECUTIVE SUMMARY AND POLICY RECOMMENDATIONS ....................................... 1The Challenge Posed by an Aging Population ...................................................................................................... 2The Untimely Decline in Retirement Saving .......................................................................................................... 5
Pension Contributions and Funding ................................................................................................................. 5Economic Effects of Declining Retirement Saving........................................................................................... 6
Policy Options to Tackle the Retirement Finance Problem .................................................................................. 7Regulatory Reform for Private Retirement Plans ............................................................................................ 7Retirement Information and Individual Responsibility ................................................................................. 8Reforming Government Employee Pensions and the Social Security Program.......................................... 8
Summary of Policy Recommendations ................................................................................................................... 9
CHAPTER 2: RETIREMENT SAVING AND ECONOMIC SECURITY ...................................................... 15The Economic Security of Future Retirees ............................................................................................................ 15The Economy and Retirement Saving ................................................................................................................... 16Private- and Public-Sector Responsibilities for Pensions ................................................................................... 21Actions Required to Meet These Responsibilities ................................................................................................ 22
CHAPTER 3: THE BASIC FACTS ON OUR AGING POPULATION AND RETIREMENT SAVING .................................................................................................................................. 24An Aging Population ............................................................................................................................................... 24Private Sector Preparation for Retirement of the Baby Boomers....................................................................... 27
Private Pension Contributions .......................................................................................................................... 28Private Pension Coverage.................................................................................................................................. 29Decline in Defined Benefit Plans ...................................................................................................................... 30Preretirement Withdrawals of Pension Funds ............................................................................................... 31
The Status of Pension Funds ................................................................................................................................... 32Private Pension Funds ....................................................................................................................................... 32Public Sector Funding of Pensions ................................................................................................................... 33
Expectations of the Baby Boomers for Retirement Income ................................................................................ 37How Much Should Workers Save for Retirement? ............................................................................................. 38
Undersaving by Baby Boomers ........................................................................................................................ 39
CHAPTER 4: DESIGNING TAX INCENTIVES TO RAISE SAVING .......................................................... 42The Tax Base Controversy ....................................................................................................................................... 42Tax Incentives and Saving ....................................................................................................................................... 43
Design of Tax-Preferred Saving Incentives..................................................................................................... 44Proposals for Compulsory Saving Programs ................................................................................................. 45
The Budget Deficit .................................................................................................................................................... 46

85iv
CHAPTER 5: THE REGULATORY TANGLE: PROPOSALS FOR SIMPLIFICATION ........................... 48Favorable Tax Treatment ......................................................................................................................................... 48Federal Regulation ................................................................................................................................................... 48ERISA and Subsequent Legislation........................................................................................................................ 49Regulations Limiting Private Pension Contributions and Benefits .................................................................. 50
Funding Limit for Defined Benefit Plans ........................................................................................................ 51Reductions in Contribution and Benefit Limits ............................................................................................. 53
Regulations to Prevent Discrimination in Pension Plans ................................................................................... 59Top-heavy Rules ................................................................................................................................................. 60Social Security Integration ................................................................................................................................. 60Coverage and Vesting Rules ............................................................................................................................. 60
Preserving Pension Funds for Retirement ............................................................................................................ 61Preretirement Lump-Sum Withdrawals and Borrowing from Pensions ................................................... 61Portability of Pensions ....................................................................................................................................... 61
Pension Benefit Guaranty Corporation ................................................................................................................. 61The Premium Structure ..................................................................................................................................... 62Moral Hazard ...................................................................................................................................................... 63
Rising Regulatory Costs Discourage Pension Saving ......................................................................................... 64Sources of Cost Increases ................................................................................................................................... 65Impact of Cost Increases on Plan Terminations and Formations ................................................................ 65
APPENDIX: A BRIEF HISTORY OF GOVERNMENT REGULATION OF PRIVATE PENSIONS ............................................................................................................... 66
NOTES 72
MEMORANDUM OF COMMENT, RESERVATION, OR DISSENT 82
OBJECTIVES OF THE COMMITTEE 83

The Committee for Economic Developmentis an independent research and policy organi-zation of some 250 business leaders and edu-cators. CED is nonprofit, nonpartisan, and non-political. Its purpose is to propose policies thatbring about steady economic growth at highemployment and reasonably stable prices, in-creased productivity and living standards,greater and more equal opportunity for everycitizen, and improved quality of life for all.
All CED policy recommendations musthave the approval of trustees on the Researchand Policy Committee. This Committee isdirected under the bylaws which emphasizethat “all research is to be thoroughly objectivein character, and the approach in each instanceis to be from the standpoint of the generalwelfare and not from that of any special politi-cal or economic group.” The Committee isaided by a Research Advisory Board of lead-ing social scientists and by a small permanentprofessional staff.
The Research and Policy Committee doesnot attempt to pass judgment on any pending
specific legislative proposals; its purpose is tourge careful consideration of the objectives setforth in this statement and of the best means ofaccomplishing those objectives.
Each statement is preceded by extensivediscussions, meetings, and exchange of memo-randa. The research is undertaken by a sub-committee, assisted by advisors chosen for theircompetence in the field under study.
The full Research and Policy Committeeparticipates in the drafting of recommenda-tions. Likewise, the trustees on the draftingsubcommittee vote to approve or disapprovea policy statement, and they share with theResearch and Policy Committee the privilegeof submitting individual comments for publi-cation.
Except for the members of the Research andPolicy Committee and the responsible subcommit-tee, the recommendations presented herein are notnecessarily endorsed by other trustees or by theadvisors, contributors, staff members, or othersassociated with CED.
RESPONSIBILITY FOR CED STATEMENTS ON NATIONAL POLICY
vi
CED RESEARCH AND POLICY COMMITTEE
REX D. ADAMSVice President–AdministrationMobil Corporation
IAN ARNOFPresident and Chief Executive OfficerFirst Commerce Corporation
ALAN BELZERRetired President and Chief
Operating OfficerAlliedSignal Inc.
PETER A. BENOLIELChairman of the BoardQuaker Chemical Corporation
ROY J. BOSTOCKChairman and Chief Executive OfficerD’Arcy, Masius, Benton & Bowles, Inc.
THEODORE A. BURTISRetired Chairman of the BoardSun Company, Inc.
OWEN B. BUTLERRetired Chairman of the BoardThe Procter & Gamble Company
FLETCHER L. BYROMChairmanAdience, Inc.
PHILIP J. CARROLLPresident and Chief Executive OfficerShell Oil Company
JOHN B. CAVEPrincipalAvenir Group, Inc.
ROBERT CIZIKChairman and Chief Executive OfficerCooper Industries Inc.
A. W. CLAUSENRetired Chairman and Chief
Executive OfficerBankAmerica Corporation
JOHN L. CLENDENINChairman and Chief Executive OfficerBellSouth Corporation
RONALD R. DAVENPORTChairman of the BoardSheridan Broadcasting Corp.
ChairmanJOSH S. WESTONChairman and Chief Executive OfficerAutomatic Data Processing, Inc.
Vice ChairmenFRANK P. DOYLEExecutive Vice PresidentGEW.D. EBERLEChairmanManchester Associates, Ltd.WILLIAM S. EDGERLYChairmanFoundation for PartnershipsCHARLES J. ZWICKCoral Gables, Florida
LINNET F. DEILYChairman, President and
Chief Executive OfficerFirst Interstate Bank of Texas
GEORGE C. EADSVice President, Worldwide
Economic & Market AnalysisGeneral Motors Corporation
WALTER Y. ELISHAChairman and Chief Executive OfficerSprings Industries, Inc.
EDMUND B. FITZGERALDManaging DirectorWoodmont Associates
HARRY L. FREEMANPresidentThe Freeman Company
RAYMOND V. GILMARTINPresident and Chief Executive OfficerMerck & Company, Inc.BOYD E. GIVANSenior Vice President and Chief Financial
OfficerThe Boeing Company
BARBARA B. GROGANPresidentWestern Industrial Contractors
RICHARD W. HANSELMANRetired ChairmanGenesco Inc.
EDWIN J. HESSSenior Vice PresidentExxon Corporation
RODERICK M. HILLSPartnerMudge Rose Guthrie Alexander &
Ferdon
LEON C. HOLT, JR.Retired Vice ChairmanAir Products and Chemicals, Inc.
MATINA S. HORNERExecutive Vice PresidentTIAA-CREF
CORDELL W. HULLExecutive Vice President and DirectorBechtel Group, Inc.
SOL HURWITZPresidentCommittee for Economic Development
HARRY P. KAMENChairman and Chief Executive OfficerMetropolitan Life Insurance Company
HELENE L. KAPLAN, Esq.Of CounselSkadden Arps Slate Meagher & Flom
JOSEPH E. KASPUTYSChairman, President and Chief
Executive OfficerPrimark Corporation
ALLEN J. KROWEVice Chairman and Chief Financial
OfficerTexaco Inc.
RICHARD J. KRUIZENGASenior FellowISEM
CHARLES R. LEEChairman and Chief Executive OfficerGTE Corporation
FRANKLIN A. LINDSAYRetired ChairmanItek Corporation
WILLIAM F. MAYChairman and Chief Executive OfficerStatue of Liberty - Ellis Island
Foundation, Inc.
ALONZO L. MCDONALDChairman and Chief Executive OfficerAvenir Group, Inc.
HENRY A. MCKINNELLExecutive Vice President and Chief
Financial OfficerPfizer Inc.
JOSEPH NEUBAUERChairman and Chief Executive OfficerARAMARK Corp.
JOHN D. ONGChairman of the Board, President and
Chief Executive OfficerThe BFGoodrich Company
VICTOR A. PELSONExecutive Vice President, Chairman-
Global Operations TeamAT&T Corp.
PETER G. PETERSONChairmanThe Blackstone Group
DEAN P. PHYPERSNew Canaan, Connecticut
JAMES J. RENIERRenier & Associates
JAMES Q. RIORDANStuart, Florida
HENRY B. SCHACHTChairman of the Executive CommitteeCummins Engine Company, Inc.
ROCCO C. SICILIANOBeverly Hills, California
ELMER B. STAATSFormer Comptroller General of
the United States
ARNOLD R. WEBERChancellorNorthwestern University
LAWRENCE A. WEINBACHManaging Partner – Chief ExecutiveArthur Andersen & Co, SC
WILLIAM S. WOODSIDEVice ChairmanLSG Sky Chefs
MARTIN B. ZIMMERMANExecutive Director, Governmental Relations and Corporate EconomicsFord Motor Company
*
vii
*Voted to approve the policy statement but submitted memorandum of comment, reservation, or dissent. See page 82.

viii
ChairmanLAWRENCE A. WEINBACHManaging Partner-Chief ExecutiveArthur Andersen & Co, SC
REX D. ADAMSVice President-AdministrationMobil CorporationIAN ARNOFPresident & Chief Executive OfficerFirst Commerce CorporationELI BROADChairman, President &
Chief Executive OfficerSunAmerica Inc.STEPHEN L. BROWNChairman & Chief Executive
OfficerJohn Hancock Mutual Life
Insurance CompanyJ. GARY BURKHEADPresidentFidelity Management and Research
CompanyPHILIP CALDWELLSenior Managing DirectorLehman Brothers, Inc.KATHLEEN COOPERChief EconomistExxon CorporationGARY L. COUNTRYMANChairman & Chief Executive OfficerLiberty Mutual Insurance CompanyW. D. EBERLEChairmanManchester Associates, Ltd.JAMES D. ERICSONPresident & Chief Executive OfficerNorthwestern Mutual Life
Insurance CompanyKATHLEEN FELDSTEINPresidentEconomics Studies, Inc.RICHARD W. HANSELMANRetired ChairmanGenesco Inc.RODERICK M. HILLSPartnerMudge Rose Guthrie Alexander
& Ferdon
Ex-Officio TrusteesJOHN L. CLENDENINChairman & Chief Executive OfficerBellSouth CorporationFRANK P. DOYLEExecutive Vice PresidentGESOL HURWITZPresidentCommittee for Economic DevelopmentJOSH S. WESTONChairman & Chief Executive OfficerAutomatic Data Processing, Inc.
Non-Trustee MembersW. GORDON BINNS, JR.Former Vice PresidentGeneral Motors CorporationMARSHALL N. CARTERChairman & Chief Executive OfficerState Street Bank and Trust CompanyMARVIN GREENEManaging Director, Retirement ServicesTowers Perrin
GuestsWILLIAM CHENEYEconomistJohn Hancock Financial ServicesCATHERINE L. HERONVice President & Senior Counsel,
Tax, Pension, and InternationalInvestment Company InstituteSANFORD KOEPPELVice President, Issues ManagementPrudential Asset Management CompanyEDWARD V. REGANPresidentThe Jerome Levy Economics InstituteCAROL REUTERPresidentNew York Life FoundationDAVID M. WALKERCompensation and Benefits ConsultingArthur Andersen & Co, SC
HARRY G. HOHNChairman & Chief Executive OfficerNew York Life Insurance CompanyROBERT C. HOLLANDSenior Economic ConsultantCommittee for Economic DevelopmentMATINA S. HORNERExecutive Vice PresidentTIAA-CREFTHOMAS W. JONESPresident & Chief Operating OfficerTIAA-CREFHARRY P. KAMENChairman & Chief Executive OfficerMetropolitan Life Insurance CompanyROBERT W. LUNDEENRetired ChairmanThe Dow Chemical CompanyLEIF H. OLSENPresidentLeif H. Olsen Investments, Inc.JAMES F. ORR IIIChairman & Chief Executive OfficerUNUM CorporationDEAN P. PHYPERSNew Canaan, ConnecticutS. LAWRENCE PRENDERGASTVice President & TreasurerAT&T Corp.JAMES Q. RIORDANStuart, FloridaIAN M. ROLLANDChairman & Chief Executive OfficerLincoln National CorporationGEORGE F. RUSSELL, JR.ChairmanFrank Russell CompanyJOHN L. STEFFENSExecutive Vice PresidentMerrill Lynch & Co., Inc.RICHARD F. SYRONChairman & Chief Executive OfficerAmerican Stock Exchange
PROJECT DIRECTORWILLIAM J. BEEMANVice President and Director of
Economic StudiesCommittee for Economic Development
ADVISORSB. DOUGLAS BERNHEIMProfessor, Department of EconomicsStanford UniversityBERNARD SAFFRANFranklin & Betty Barr Professor of
EconomicsSwarthmore CollegeJOHN B. SHOVENCharles R. Schwab Professor of
EconomicsDean, School of Humanities and SciencesStanford University
*
*Voted to approve the policy statement but submitted memorandum of comment, reservation, or dissent. See page 82.
PROJECTASSOCIATEMICHAEL K. BAKEREconomistCommittee for Economic Development
SUBCOMMITTEE ON PENSIONS AND SAVING

ix
PURPOSE OF THIS STATEMENT
Major reforms are needed in policies thataffect both private retirement plans and SocialSecurity if the United States is to avoid a seri-ous crisis in retirement funding and livingstandards in the next century. Our goal inpreparing this report is to show as clearly aspossible the consequences of inadequateretirement saving for those retiring early inthe next century and thereafter. If policies andpractices are not changed, many twenty-first–century retirees will experience an unexpectedand substantially reduced standard of living,due in no small part to a retirement systemthat is underfunded, overregulated, and soonto be strained as never before with the retire-ment of the baby-boom cohort.
Who Will Pay for Your Retirement? issues astrong warning, but it also offers comprehen-sive, specific, and workable recommendations.These recommendations, if taken together, willnot only allow the nation to avert disaster butwill also:
• Strengthen and streamline the way we fundand regulate retirement programs.
• Educate workers and employers aboutretirement needs, and provide incentivesfor people to save adequately for theirown retirement.
• Significantly broaden the scope and cover-age of private plans.
• Preserve Social Security for generations tocome by improving funding and limitingthe growth of benefits.
We are keenly aware of the enormousimpact that retirement policies have onnational saving and the economy. Decisions
on retirement policies should place top prior-ity not only on coverage and increased ben-efits but also on national saving, capitalformation, and economic growth.
The Committee for Economic Developmenthas a long-standing interest in retirement poli-cies. In 1981, CED issued Reforming RetirementPolicies, which outlined a strategy for broad-ening the reach of private pensions, increas-ing individual saving, and strengtheningSocial Security. Although a number of therecommendations in that report have beenimplemented (e.g., a gradual rise in the retire-ment age), recent changes in federal regula-tion (many made in the name of deficit reduc-tion or antidiscrimination policy) havecurtailed new pension formation and soundfunding.
With this policy statement, we call on Con-gress to reverse government policies that arestrangling private pensions and threateningtheir financial soundness. Although this state-ment deals primarily with policy for privatepensions, we also say that Social Securitycannot be ignored and that changes are neces-sary to preserve that system well into the nextcentury. We call on all Americans to educatethemselves about their retirement needs andoptions so that they can make sound and sen-sible decisions for themselves and their fami-lies.
ACKNOWLEDGMENTSI want to thank the very able group of
CED Trustees and advisors who served onthe CED subcommittee that prepared this re-port (see page viii).

Very special thanks are due to the sub-committee’s chairman, Lawrence A.Weinbach,Managing Partner-Chief Executive of ArthurAndersen & Co, for the energy, expertise,and wisdom he brought to this project. Weare also indebted to Project DirectorWilliam J. Beeman, CED’s Vice President andDirector of Economic Studies, not only for hiscomprehensive knowledge but also for theclarity he has brought to this complex set ofissues.
Thanks are also due to CED EconomistMichael Baker for his contributions to thisproject and to Carol Alvey for her secretarialassistance.
x
We are deeply grateful to Merrill Lynchand Company, the New York Life Founda-tion, Morgan Stanley Group Inc., JohnHancock Mutual Life Insurance Company,Lincoln National Corporation, the InvestmentCompany Institute, Household International,and Towers Perrin for their generous sup-port of this most important program.
Josh S. WestonChairmanCED Research and Policy Committee

1
America’s retirement system is under-funded, overregulated, and soon to be chal-lenged by unprecedented growth in theretirement-age population. Consequently, ournation will confront a major crisis in financingthe needs of the elderly at the beginning of thetwenty-first century unless policies arereformed to make retirement saving a top pri-ority. If steps are taken promptly to imple-ment the reforms recommended by CED inthis statement, significant sacrifices will berequired, but they will be manageable. Ifaction is postponed, the nation will face thevery unpleasant choice of a substantial cut inthe economic status of the elderly or an eco-nomically damaging and unfair tax burdenon future generations of workers.
The economic well-being of future retireesand, indeed, of workers is seriously at riskbecause of the interaction of several demo-graphic, economic, and fiscal trends:
• Growth in the elderly population in theUnited States, which is already quite rapidbecause of increasing life expectancy anddeclining fertility rates, will accelerate whenthe baby-boom generation reaches retire-ment age in about a decade. A sharpdecline in the ratio of workers to retireeswill result.1
• Private saving for retirement is woefullyinadequate, and national saving hasdeclined.
• Underfunded pension promises in bothprivate and public retirement programs area growing and often understated problem.
• Rapid growth in government spending forthe elderly threatens to get so far out ofcontrol when the baby-boom generationretires that it cannot be financed by reason-able burdens on taxpayers.
Private saving is only a fraction of thatneeded to enable future retirees to fulfill theireconomic expectations in retirement. Onerecent study showed that the baby-boom gen-eration needs to triple its rate of accumulationof assets in order to maintain its preretirementliving standard during retirement. Moreover,this projection assumes that Social Securitybenefits will not be cut.2 But it is now clearthat the Social Security system has made prom-ises to future retirees that cannot be kept with-out vastly improving prefunding or imposinga harsh burden on future workers. This situa-tion has been exacerbated by ill-advisedchanges in regulatory and tax policies thathave discouraged private saving for retire-ment and by federal budget policies that havegenerated huge deficits. These deficits con-tinue to absorb the lion’s share of private sav-ing needed to ensure the economic prosperityof future citizens.
Clearly, for the vast majority of those cur-rently in the labor force, their future economiccircumstances will depend greatly upon theirown saving and participation in retirementplans. Those who are not making sufficientpreparations for retirement appear to have amisunderstanding about the impact of under-saving on their retirement income. CED be-lieves that this situation calls for a majoreducation campaign sponsored by both gov-
Chapter 1
Executive Summary andPolicy Recommendations

2
ernment and private employers to improveworkers’ understanding about their own re-sponsibilities and options for retirement.
Although the primary focus of this policystatement is private retirement programs, werecognize that private saving is only one com-ponent of the retirement finance problem.Therefore, our discussion of retirement sav-ing would not be complete without a briefexamination of the problem of underfundedpromises with respect to Social Security andpensions for public employees. Indeed, theoutlook for Social Security makes reform ofprivate retirement policies all the moreimportant.
The major thrust of the reforms recom-mended by CED can be described as follows:
• The federal government should streamlineand simplify regulation and reverse recentchanges in regulatory and tax policies thatact as barriers to private retirement savingand discourage growth in private pensioncoverage.
• Businesses and government sponsors ofretirement programs should fully fund pen-sion promises made to their workers andavoid making promises that cannot be kept.Business and government should alsoencourage an increase in the averageretirement age in recognition of theimproved health status of the elderly andthe projected need for skilled workers, andto compensate for added retirement costsarising from increases in life expectancy.
• In order to encourage individuals to in-crease their saving and take greater respon-sibility for their future, workers must bebetter educated about the effects of retire-ment saving and the choices they makeabout retirement ages, saving rates, andinvestment strategies on their future eco-nomic circumstances.
• Government should quickly legislate thegradual introduction of benefit-trimmingchanges in Social Security in order to pre-serve the long-run financial health of the
system. Social Security retirement benefitsand other benefits for the elderly shouldnot be promised if they cannot be financedeither by advance funding that adds tonational saving or by an acceptable level oftaxes on active workers.
We believe that the nation must act quicklyto reform retirement policies and practices sothat the future economic security of retireesand all other citizens will be protected. Post-poning action would simply raise the cost dra-matically; in contrast, early action imple-mented in gradual steps would minimize theimpact on the living standards of both work-ers and retirees.
THE CHALLENGE POSED BY ANAGING POPULATION
Growth in the nation’s real income andwealth has made it possible for the UnitedStates not only to provide for the basic needsof rapidly growing numbers of elderly butalso to greatly improve their economicwell-being. However, because of the aging ofthe baby-boom generation, the retired popu-lation will begin to rise much more rapidlyand the workforce more slowly during thefirst decade of the next century. The ratio ofworkers to retirees is expected to plunge fromits current level of about 3.4 to 1 to about 2 to 1by 2030 (see Figure 1).3 Consequently, provid-ing for the needs of growing numbers of eld-erly will become a much greater challenge forthe country. The share of the nation’s totaloutput consumed by this group will increase,placing a heavy burden on workers unlessthe increased consumption by retirees isprefinanced by saving, including funded pen-sions. Unfortunately, federal regulationsenacted since the mid-1980s have been inimi-cal to funding. Moreover, legislation requir-ing the delay of a large part of funding untilthe later part of workers’ careers, combinedwith the aging of the workforce (as the baby-boomers approach retirement), will raise thecost of many retirement plans sharply, therebydiscouraging the expansion of retirement ben-

3
efits. Delay in funding was required by theOmnibus Budget Reconciliation Act of 1987(OBRA 1987). See Chapter 5 and Figure 25 fora description of the effect on funding.
The upcoming bulge in the elderly popula-tion presents a particularly serious problemfor Social Security. Some of the increase inspending for Social Security benefits can befinanced by drawing down the reserve in theSocial Security trust funds. However, this willmerely delay a tax increase, and probably notfor long. The Social Security Administration’sintermediate projection indicates that the an-nual cash flow will turn negative beginning in2013 and that the reserve fund will be ex-hausted in 2029. Because earlier projections ofthe balance in the Social Security retirementtrust funds have been revised downward per-sistently and dramatically (see Figure 2), manybelieve it is more realistic to assume that thefund will run out much sooner, perhaps by2012, as in the Social Security Administration’smore pessimistic projection. When the reserves
Ratio of Workers to Social SecurityRecipients, 1980 to 2050
Ratio
(intermediate projection)
Figure 1
SOURCE: Office of the Actuary, Social Security Administration.
Year
Trillions of Dollars
1985 1995 2005 2015 2025 2035 2045 2055 2063
Figure 2
Revised Intermediate Projections for Social Security Trust Fund Balances(current dollars)
20
15
10
5
0
1983 projection
1989 projection
1994 projection
1980 1990 2000 2010 2020 2030 2040 2050
Year
4
3
2
1
0
NOTE: “Workers” defined as persons having earningscreditable for Social Security.SOURCE: Office of the Actuary, Social SecurityAdministration.

4
are exhausted, Social Security benefits mustbe financed by taxes on current wages (or byincreased debt), placing a uniquely heavy bur-den on future workers.
The actuarial deficiency in Social Security,taking into account all prospective revenuesand expenditures for the next seventy-fiveyears, was estimated at $1.9 trillion at the endof 1993.4 A rough indication of the potentialfuture burden of Social Security on activeworkers can be seen by comparing the cost ofretirement benefits with the wages of work-ers. The Social Security Administration’s 1994intermediate projection indicates that totalexpenditures for old age and survivors insur-ance and disability and hospital insurance ben-efits, or OASDIHI,5 which are financed by thepayroll tax, will increase by an alarming12 percent of taxable payroll (from more than15 percent to nearly 28 percent) during the1994–2030 period, largely as a consequence ofdemographic change (see Figure 3).6 OASDIHIbenefits are also projected to rise sharply as ashare of the gross domestic product (GDP),from 6.4 percent in 1994 to 10.8 percent in2030. These figures do not reflect the rapidlygrowing cost of supplementary medicalinsurance (SMI, or Part B of Medicare) that isfinanced primarily out of general tax revenues,the growth in unfunded retirement benefitsfrom government jobs that will also befinanced from general revenues, and otherprograms for the elderly for which long-termprojections are not available.7 Thus, it is notsurprising that many have concluded thatgovernment-related retirement and health ben-efits for the elderly must be cut back. In CED’sview, reliance on extremely high taxes paidby future workers to finance these benefitsfor the elderly would be very inequitable andhave an extremely adverse effect on the livingstandard of those workers born after thebaby-boom generation.
The impact of demographic change onpay-as-you-go retirement financing makes itimperative that pension policy be reformed toencourage increased retirement saving and toreduce unfair shifting of the burden to future
30
25
20
15
10
Percent
Social Security Retirement and HospitalInsurance Benefits and Revenues,1980 to 2030
Figure 3
(percent of taxable payroll)
Year
NOTE: Revenues exclude interest on trust funds.SOURCE: Office of the Actuary, Social SecurityAdministration.
Revenues
Benefits
1980 1990 2000 2010 2020 2030
generations of workers. Senator Robert Kerreyand former Senator John Danforth, co-chair-men of the Bipartisan Commission on Entitle-ment and Tax Reform, have responded to theSocial Security projections by proposing fun-damental changes in Social Security and theU.S. retirement system that would bringfuture outlays and revenues to near balance.However, there is substantial political resis-tance to changes in Social Security at thepresent time, although reform is criticallyneeded and delaying action will only makethe problem worse.8 But given the unavoid-able impact of the aging population onpay-as-you-go retirement systems, the mostpromising way to protect the economic secu-rity of future retirees without overburden-ing workers is to increase private retirementsaving. Many individuals look upon contri-

5
Personal and Pension Saving,1970 to 1991
Percent
Figure 4
butions to their pension funds, which are theirown assets, as much less of a burden thanincreased payroll taxes. If policy changes suc-ceed in encouraging individuals to forgo asignificant amount of consumption beforeretiring, and if sponsors of retirement pro-grams fully fund pension promises, theincome of retirees can be maintained withoutan unacceptable sacrifice by workers.
THE UNTIMELY DECLINE INRETIREMENT SAVING
Unfortunately, saving for retirement andother purposes has declined in the UnitedStates at the very time when it should be ris-ing in anticipation of the retirement of thebaby-boom generation. Private contributionsto pensions as a percent of disposable incomehave declined in the last decade, though notas sharply as total personal saving (see Fig-ure 4).
(percent of disposable personal income)
SOURCE: Bureau of Economic Analysis; pension saving seriesprovided by staff at The Brookings Institution.
Year
10
8
6
4
2
0
Pension saving
Personal saving
Decline in Contributions to PrivatePension Plans, 1975 to 1991
Figure 5
(in 1987 dollars)
SOURCE: The Brookings Institution, Bureau of LaborStatistics, Bureau of Economic Analysis.
1975 1977 1979 1981 1983 1985 1987 1989 19911970 1972 1974 1976 1978 1980 1982 1984 1986 1988 1990
Year
Total contributions per privatesector worker
1,600
1,400
1,200
1,000
800
600
400
200
0
Employer contributions per privatesector worker
Dollars
PENSION CONTRIBUTIONSAND FUNDING
Total private pension contributionsdeclined in constant 1987 dollars from about$1,470 per worker in 1985 to about $1,140 perworker in 1991. The employer componentdeclined in real terms from about $1,039 in1980 to about $506 per worker in 1991 (seeFigure 5). Defined benefit plans, which aremore commonly sponsored by large firms, suf-fered a very sharp decrease in contributions(see Figure 6).9 Overall contributions byemployers to these plans declined largely asa consequence of three developments: (1)increased earnings on financial assets, (2) theenactment in 1987 of lower ceilings on pen-sion funding eligible for tax deductions, and(3) a sharp rise in the cost of complying withincreasingly complex regulations that discour-aged the growth of defined benefit plans, par-ticularly in small firms (see Figure 7). Total

6
Employer Contributions to DefinedBenefit Plans, 1975 to 1991
Figure 6
1975 1977 1979 1981 1983 1985 1987 1989 1991
70
60
50
40
30
20
10
0
(in 1987 dollars)
Year
SOURCE: Pension and Welfare Benefits Administration,U.S. Department of Labor.
Billions of Dollars
eral agency that insures private pensions. Itshould be noted that this insurance programalso exposes future taxpayers to a huge poten-tial liability.11
Information on underfunding of govern-ment employee pensions is incomplete, butthe magnitude of underfunding appears to begreater than for private pensions. (Of course,the government’s taxing authority makes itdifficult to compare the risks.) It has been esti-mated that the average funding ratio of allstate and local pensions is only 80 percent andthat the actuarial deficiency for federal, civil-ian, and military pensions at the end of 1992was $1.5 trillion, taking into account both pro-spective receipts and outlays.12
ECONOMIC EFFECTS OF DECLININGRETIREMENT SAVING
The decline in retirement saving not onlyjeopardizes the economic security of individual
contributions to defined contribution planscontinue to rise, however, as a consequence ofrapid growth in plan participation.
Underfunding of defined benefit pensionplans is a serious problem. Although mostprivate pensions meet legal funding require-ments, CED believes that the funding limitsenacted in the 1980s (described in detail inChapter 5) have placed many pension fundsat risk in the event of unexpected changes inthe value of financial assets and in the finan-cial strength of firms. A decline in interestrates, for example, would reduce the returnon pension assets and increase the presentvalue of future benefits, thereby causing somepensions to become underfunded. Moreover,the funding status of private pensions hasdeteriorated even by current legal fundingstandards. Underfunding of private retirementplans has been increasing rapidly, reaching$71 billion in 1993, according to the PensionBenefit Guaranty Corporation (PBGC),10 a fed-
SOURCE: Hay/Huggins Company, Inc.
15 75 500 10,000
Plan Size (number of employees)
1981
500
400
300
200
100
0
1991
Regulatory Costs Have Soared
Figure 7
(administrative costs for defined benefit plansin 1990 dollars)Dollars per Worker

7
and widespread pension coverage. Unfortu-nately, recent legislation appears to have beenmotivated by other concerns, such as the elimi-nation of every potential abuse of pensions,the impact of pension saving on the distribu-tion of income, and the budget deficit. Allthese concerns have merit but frequently can-not be addressed through pension policies with-out creating enormously complex and costlyregulation and undermining the primaryobjective of retirement policy.
CED believes that the looming crisis inretirement finance requires the prompt imple-mentation of three measures: (1) tax incen-tives and regulatory reform to encourageindividual retirement saving and to achieveincreased funding of, and coverage by, pri-vate pensions; (2) education programs thatincrease worker awareness of the need forretirement saving and encourage individualresponsibility; and (3) changes in governmentpriorities to provide full funding of publicemployee pensions, increased funding of So-cial Security, and a reduction in the growth ofspending programs and promises for the eld-erly financed from current income.
REGULATORY REFORM FOR PRIVATERETIREMENT PLANS
The objective of the 1974 Employee Retire-ment Income Security Act (ERISA), whichremains the basic pension law of the UnitedStates and deals with all facets of private pen-sions, was quite simple: to protect the pen-sions of the elderly. However, numerousamendments have since been enacted that areextremely complex, in large part because oftheir diverse objectives. These changes haveplaced many barriers in the way of increasedpension coverage and retirement saving. Forexample, complicated discrimination rules andfunding limits enacted in the 1980s havesharply increased administrative costs,reduced contributions, and placed pensionsat increased risk. From a national saving per-spective, the most serious setback wasOBRA87, which limited funding of definedbenefit plans to 150 percent of plan termination
workers but also affects the economic healthof the country, because retirement saving is avery large and growing component of nationalsaving. The U.S. national saving rate (the sumof saving for retirement and all other pur-poses by individuals, business, and govern-ment) has fallen to record low levels in recentyears. In fact, the national saving rate hasaveraged less than 2 percent of GDP so far inthe 1990s, down from 4 percent in the 1980sand about 8 percent in previous decades.Because national saving is the domestic sourceof funds for investment, its decline has anadverse effect on U.S. productivity growthand international competitiveness. Moreover,the rate of saving has been low for some time,and the cumulative effect on the nation’s capi-tal stock cannot be reversed quickly. Of course,weak growth in productivity and real wagesdoes not bode well for the living standard offuture retirees and workers.
POLICY OPTIONS TO TACKLE THERETIREMENT FINANCE PROBLEM
There are limited options for alleviatingthe burden on future workers arising from theinevitable increase in the elderly population.The most important is to make retirement sav-ing and adequate funding of pensions top pri-orities for individuals, employers, and gov-ernment. Retiree spending from retirementsaving (including benefits received fromfunded pensions) is merely the recapture ofdeferred consumption. Unlike pay-as-you-gofinancing, this recapture need not be a burdenon workers because the saving resulting fromdeferred consumption contributes to thegrowth of the economy and the growth ofworkers’ real incomes. Indeed, if the addedsaving creates sufficient income to pay for therise in benefits to retirees, active workerswould experience no increased burden as theretiree population grows.
Therefore, the basic objective of retire-ment policy should be to ensure the eco-nomic security of retirees by encouragingretirement saving, full funding of pensions,

8
liability. (Termination liability is the liability aplan would incur if it were to cease at anygiven time. 150 percent of termination liabil-ity is generally lower than 100% of projectedliability, which was the previous fundinglimit.) This change forced many firms to dis-continue further funding of pensions for sev-eral years.
By discouraging retirement saving, theseregulatory changes have clearly exacerbatedthe burden on future workers arising fromdemographic change. At the same time, regu-lators have failed to take adequate action topreserve existing retirement funds. Reformsare needed to reduce preretirement with-drawal of retirement funds for consumptionpurposes and to encourage improvements inthe portability of pension funds.
CED believes that pension regulatory andtax policies must be streamlined and simpli-fied and subjected to cost-benefit evaluation.We propose a number of changes in the regu-lation of private pensions that would greatlysimplify discrimination rules, restore thefull-funding limit to its pre-1987 level of 100percent of projected plan liability, preservepension funds for retirement, permit pensiontax preferences to be based on lifetime income(as opposed to current-year income only),encourage accelerated vesting and greaterportability of pension assets, increase theauthority of the PBGC to make sure that spon-sors of private pensions meet their fundingresponsibilities, and increase the limit on pen-sion benefits and contributions (see “Summaryof Policy Recommendations”). All our recom-mendations are designed to encourage savingand greater support for private retirement pro-grams.
RETIREMENT INFORMATION ANDINDIVIDUAL RESPONSIBILITY
Although reform of pension regulation iscritical, CED believes that it is incumbentupon individuals to take greater responsi-bility for financing their retirement. Individu-als ultimately pay for their own retirement bysaving, participating in retirement plans, and
paying taxes. We recognize, however, thatworkers are not well informed about retire-ment needs and benefits.13 Indeed, financialliteracy is low in the United States, and manyworkers do not have adequate informationabout retirement income and retirementoptions to plan intelligently for their old age.The fact that private retirement saving perworker may be only about one-third of whatwill be needed to maintain accustomed livingstandards during retirement does not appearto be widely understood by workers. There-fore, CED recommends that government andbusiness regularly provide all workers withinformation on accrued and prospectiveretirement benefits. The Social SecurityAdministration is planning to begin the distri-bution of such information soon. This isa positive development. It is criticallyimportant, however, that the information onSocial Security be as realistic as possible,including the possibility that benefits may becut in order to preserve the system. In thisway, individuals can make informed plans fortheir retirement.
REFORMING GOVERNMENTEMPLOYEE PENSIONS AND THESOCIAL SECURITY PROGRAM
It is also important to reform the fundingof government employee pensions. Indeed,CED strongly endorses the view that pen-sion promises made by both private and pub-lic employers should be fully funded andthat no promises should be made that cannotbe funded.
The specific character of required reformsin Social Security retirement programs is acomplex issue beyond the scope of this state-ment. It is clear, however, that merely passingthe burden to future generations is both ineq-uitable and bad economics. The increase intotal benefit payments that will occurbecause of the baby-boom bulge should beprefinanced, and/or benefits should be cutto limit the burden on future workers. Wealso believe that the rise in life expectancywarrants a further increase in the normal

9
of preparations for retirement and the poten-tial burden on workers, reduced benefits anddelayed retirement are not likely to be mattersof choice. However, the burden on futureretirees can be minimized by giving themadequate warning. CED believes that neces-sary reductions in future Social Security ben-efits should be enacted well before they takeeffect in order to give workers an opportu-nity to make compensating adjustments intheir saving behavior.
Such reforms would permit a largerbuildup in Social Security trust fund reservesand reduce the potential burden on futureworkers by making it possible to hold downpayroll tax rates when the baby-boom genera-tion retires. However, the effect on the payrolltax may be a misleading indicator of thefuture burden if the increased reserves do notadd to national saving. No additional resourcesare created to pay for the rise in benefitsunless the reserves add to national saving,productive capital, and economic growth.Unfortunately, it appears that the recent posi-tive cash flow in the Social Security programhas been used to pay for current governmentservices rather than to add to saving. CEDbelieves it is imperative that the positive cashflow in the Social Security program be used,not to support government consumption, butto add to national saving.
retirement age beyond the increase alreadylegislated and that the earnings limit forrecipients of Social Security should be raisedsubstantially in order to reduce the disincen-tive for the elderly to continue working. Ofcourse, a politically realistic resolution of theSocial Security financing problem is likely toinvolve both cuts in benefits, especially forhigher-income individuals, and some addi-tional taxes to increase prefunding of theretirement of the baby boomers. CED has pre-viously endorsed a proposal for full taxingof Social Security benefits in excess of thebeneficiary’s contributions. (Because low-income retirees do not pay federal incometaxes, the taxation of all benefits would havean effect somewhat similar to means testing ofbenefits.) Other reforms, such as a gradualphase-in of a lower ratio of initial benefits toincome and/or limits on the indexing of ben-efits (above the minimum subsistence level),should be considered.
The economic status of retirees hasimproved sharply in recent decades, a devel-opment that has probably raised workers’expectations relating to retirement income. Tothe degree that workers regard promisedSocial Security benefits as a right, similar to aproperty right, that should not be repealed,there may be strong resistance to theseoptions. Nevertheless, given the present state
The economic well-being of future retireesand their dependents is in jeopardy becauseof the continuing failure of our society to makeadequate preparation for an inevitable sharprise in the retirement-age population. This situ-ation is reflected in the low priority manyindividuals give to retirement saving, changesin regulations that have discouraged or lim-ited contributions to retirement plans,underfunded pensions sponsored by both pub-lic and private employers, and a looming cri-sis in the Social Security retirement system,which has promised future benefits that can-
not be provided without imposing a harshburden on future generations of workers.Unfortunately, the regulation of private pen-sions has become incredibly complex andaimed at various social objectives that oftenconflict with the goal of encouraging retire-ment saving. CED believes that policy mak-ers should focus much greater attention onthe basic goal of retirement policy, which isto ensure the economic security of the eld-erly by encouraging saving for retirement.
The adverse effects of government policieson retirement saving and work effort have led
SUMMARY OF POLICY RECOMMENDATIONS

10
us to the conclusion that current pension laws,regulations, and practices must be streamlined,simplified and designed to achieve six basicobjectives:
• Provide retirement plans for the largestpossible number of workers.
• Ensure that pension plans meet appropri-ate fiduciary standards and are funded tofulfill pension promises.
• Encourage individual saving by makingretirement saving opportunities availableto all workers through deferred taxes oncontributions and earnings and by pro-viding all workers with realistic informa-tion on their retirement saving needs,resources, and options.
• Place simple and reasonable limits on taxpreferences received by any individual(i.e., a single overall limit on eligible con-tributions indexed to inflation and a limiton benefits received from a qualifieddefined benefit plan).
• Preserve retirement saving and pensionrights by discouraging preretirementwithdrawals and by improving the port-ability of pension assets.
• Compensate for the rise in life expect-ancy by encouraging retirement at a laterage and by reducing work disincentivesfor the elderly who receive retirement ben-efits.
Both business and government shouldencourage later retirement in order to com-pensate for the rise in life expectancy, andgovernment should raise the earnings limitsapplicable to retirees receiving Social Secu-rity benefits. Although government tax andregulatory policies should encourage privatepension saving, we believe that tax incen-tives should be carefully designed to ensurethat they raise national saving as well. Pen-sion saving for retirement represent a largeand increasingly important component ofnational saving. Other legitimate fiscal policy
concerns, such as the budget deficit, shouldnot be addressed in a manner that serves toexacerbate our private saving deficiency. Inaddition, other important retirement policyissues should not be addressed in a way thatdefeats the basic saving objective of pensionpolicy.
The inadequacy of present-day retirementsaving may be due in part to confusion aboutwho is responsible for meeting the incomegoals of retirees. Apparently, some individu-als mistakenly believe that their income inretirement is entirely or principally theresponsibility of government and business. Infact, the responsibility for the income ofretirees is divided among government,employers, and individuals. However, eachindividual must bear the ultimate responsi-bility for his or her living standard in retire-ment. Social Security, which is only looselylinked to income, should continue to providea minimum level of retirement income for allworking members of society and their depen-dents. Businesses and other employers should beencouraged to voluntarily facilitate and assistsaving for retirement to the degree affordable.Company-sponsored pensions are often use-ful as a means of attracting and retaining acompetent workforce. Employer plans, com-bined with Social Security, are generallyintended to provide retirees with a reasonableminimum standard of living, though with lessincome than received by active workers.Finally, saving by individual workers should beencouraged so that they can achieve theirdesired living standard in retirement. Formany workers, their savings are a criticalsource of retirement income.
CED continues to favor strong action toreduce the federal deficit as the most certainway to increase national saving needed toimprove the growth and competitiveness ofthe U.S. economy. Some of the recommenda-tions presented in this statement wouldreduce the federal deficit; others would raiseit. We believe that any net increase in thefederal deficit resulting from reform of retire-

11
ment policies should be offset by reductionsin real spending. However, the purpose ofreducing the deficit is to increase national sav-ing; therefore, attempts to lower the deficit bytaxing private saving are counterproductiveand should be avoided.
With these goals and responsibilities inmind, CED makes the following recommen-dations:
1. Retirement plan nondiscrimination rulesgoverning coverage and contributions shouldbe streamlined and simplified in a mannerthat reduces administrative costs and in-creases saving for retirement and coverage.
Nondiscrimination rules in general, includ-ing coverage rules and nondiscrimination testsrelating to contributions under Sections 401(k)and 401(m) of the Internal Revenue Code,are complex and extremely costly to adminis-ter. These tests reduce pension saving bymiddle-income earners as well as more highlycompensated employees. With appropriategrandfathering of rules where necessary, thesetests should be replaced by a vastly moresimple and administratively inexpensive safe-guard against discrimination:
• All employees who meet nondiscrimina-tory age and service eligibility require-ments should (a) be covered and (b)receive the same ratio of employer contri-butions to wages. (In the case of definedbenefit plans, the same benefit formulashould be applied.)
If such a radical reform cannot be adoptedin its entirety, simplification should proceedalong the following lines:
• Employers who voluntarily comply withthe two nondiscrimination standardsspecified in the preceding bullet wouldbe given safe harbor from all further non-discrimination tests, such as those underSections 401(k) and 401(m) of the InternalRevenue Code.
• Employers who do not comply with boththe coverage and the uniform contribu-
tion standards mentioned above should,at a minimum, adopt the coverage rule.
• Top-heavy rules, which are already largelyredundant in view of the nondiscrimina-tion rules in place for all pension plans,should be eliminated.
• Restrictions on the employer’s ability tointegrate private pension benefits withSocial Security should be eliminated incases where the employer contribution forall employees equals or exceeds anappropriate threshold.
2. Federal regulation should encourage fullfunding of private pensions.
One of the most important causes ofdeclining business contributions to pensionsis OBRA87, which capped funding for definedbenefit plans at 150 percent of terminationliability. As a consequence of this legislationand rising asset values, many firms wereunable to make eligible contributions for sev-eral years. Firms can only ensure the viabilityof their defined benefit plans if they are per-mitted reasonable flexibility to spread the costsof funding plans over time in a manner thatrealistically reflects both expected plan liabili-ties and the firms’ ability to make contribu-tions. The full-funding limit based on termi-nation liability denies such flexibility andplaces a disproportionate burden on the firmin the later years of workers’ careers.
• The full-funding limit should be restoredto its pre-1987 level of 100 percent of pro-jected plan liability. Projected plan liabil-ity in the case of flat-dollar defined ben-efit plans should be calculated to includeanticipated increases in the dollar benefitlevel that are negotiated over time.
3. Business and government should provideworkers with adequate and realisticinformation about their pensions and SocialSecurity benefits.
Many individuals reportedly undersavebecause they are not adequately informed

12
about accumulated benefits, retirement needs,and the rate of saving required to meet thoseneeds. Individuals can prepare intelligentlyfor their retirement only if they have sufficientinformation about their retirement needs andresources as well as their saving and invest-ment options. Some employers are reportedto be reluctant to provide information on pro-spective growth of funds because they fearthat they could be liable for the outcome.
• Workers should be given realistic infor-mation about retirement needs, accumu-lated and projected benefits, the effect ofdifferent investment choices on theirretirement income (if they have controlover such choices), and the funded statusof their plan (if it is a defined benefitplan).
• The Department of Labor should provideguidance designed to encourage employ-ers to provide information on retirementsaving and investment to their employ-ees and to protect plan sponsors againstunreasonable lawsuits. For example,information provided by employers aboutpast market performance should not makeemployers legally liable if future perfor-mance is inconsistent with experience.
4. Regulation should encourage both the pres-ervation of retirement funds until the workerretires and the portability of pension assets.
Preretirement withdrawals from pensionfunds are placing the economic security offuture retirees in jeopardy. Although some ofthese withdrawals are used for investmentpurposes such as education and housing, alarge proportion is simply used for currentconsumption. CED recommends:
• In-service preretirement withdrawal andborrowing of employer contributions topension plans should be prohibited.Access to voluntary employee contribu-tions should not be prohibited, but exist-ing penalties should be retained.
• Regulators should investigate options foraccelerating vesting and for improving theportability of vested benefits from definedbenefit plans. Individuals who changeemployers should be strongly encouragedto roll over preretirement lump-sumdistributions into alternative retirementsaving instruments such as individualretirement accounts (IRAs) and definedcontribution plans maintained by theirnew employers.
5. In order to increase saving for retirementand to encourage small-business owners andmanagers to provide pension plans for allemployees, Congress should raise theannual limit on allowable plan contributionsand benefits to more reasonable levels.
Regulations limiting both contributions andbenefits are often redundant and tend toreduce pension contributions and saving, lead-ing to the abandonment of some plans anddiscouraging the formation of new ones. Lim-its on benefits also discourage higher-risk in-vestments. The following reforms should bemade:
• Retirement saving tax preferences shouldbe based on accumulated lifetime incomerather than current-year income only. Thiswould be a stimulus to saving and farmore equitable, particularly for those whomust postpone contributing because ofunusual expenses (such as medical expen-ditures) or because of a temporaryabsence from the workforce (such asparents caring for children).
• With respect to the redundancy of restric-tions on benefits and contributions, lim-its on tax preferences for contributionsare generally preferable to restrictions onbenefits. Therefore, the excise tax onannuitized pension distributions above astated threshold (now $148,500 for a singleemployee) should be eliminated, and thelimit on benefits from a qualified definedbenefit plan (now $118,800) should beraised.

13
• Given the proposed elimination of excisetaxes on distributions, a limit on total con-tributions and on considered compensa-tion should be retained. However, the con-sidered compensation limit (now $150,000)should be raised at least to its pre-OBRA93level14 (and indexed); to prevent contribu-tions for lower-income workers fromdeclining, the limit on considered com-pensation should apply only to thosewhose incomes actually equal or exceedthat limit, not to those whose projectedincomes equal or exceed it. The dollarlimit on total contributions should alsobe increased.
• Congress should discontinue the recentpractice of reducing considered compen-sation for more highly compensatedemployees as a means of raising federalrevenue. This is necessary because of itsadverse effect on pension saving, throughits impact on contributions for lower-income employees and on the willing-ness and ability of sponsors to create andmaintain qualified plans.
• Individual contributions to 401(k) plansthat are primary pension plans should besubject to the same limit that applies toother defined contribution plans, such thatthe combined employee and employercontributions do not exceed that limit.This will give workers in smaller firmsan opportunity to expand their retirementsavings and provide a greater incentivefor managers of small firms to offer theseplans to their workers.
6. The Pension Benefit Guaranty Corpora-tion reforms should improve both the sol-vency of the PBGC itself and the fundedstatus of the pension plans it insures. Thus,the PBGC premium structure and benefitguarantee should be aligned more closelywith the actual risk posed by a pension planand the PBGC should have stronger compli-ance authority to insure adequate funding
levels. Amortization periods for unfundedliabilities should be simplified and short-ened.
The PBGC’s poor financial position hasthree underlying causes: (a) Premiums for riskyplans are set too low. (b) Premiums are struc-tured in a way that creates an adverse-selectionproblem in the insurance pool. (c) The PBGC’scompliance authority is weak and there isinsufficient incentive for companies withunderfunded pension plans to increase theirfunding. Minimum-funding rules also allowamortization of some kinds of unfunded pen-sion liabilities over an excessively long period.
• The PBGC insurance premium should berestructured so that it more closelyresembles what would be offered in theprivate market. Such a redesign shouldinclude a stronger link between the pre-mium level and the actual risk that a pen-sion plan poses to the PBGC. For example,the premium calculation could take intoaccount the financial strength of the plansponsor, the marketability of plan assets,and the proportion of assets tied up in thefirm’s own equities.
• The PBGC should be given more power toinfluence the behavior of sponsors ofunderfunded plans, including the author-ity to prevent plans operating below a par-ticular funded ratio from granting benefitincreases to employees.
• The amortization schedules for unfundedliabilities should be simplified by reduc-ing the number of categories, and theamortization periods should be shortenedto accelerate the funding of liabilities.
• The PBGC’s benefit guarantee structureshould be revised to correlate more closelywith the minimum-funding requirementsattributable to specific benefits, such asshutdown benefits (see Chapter 5).
• The status of the PBGC’s claims in bank-ruptcy should be reviewed and enhanced,as appropriate.

14
7. Changes are required to place theSocial Security program on a sound finan-cial footing and avoid an unfair burden onfuture generations of workers.
Based on already-legislated benefits, pro-jected demographic changes, and other fac-tors, the Social Security Administration’slong-run projections indicate that the pro-gram’s assets will be depleted rapidly whenthe baby-boom generation retires unless ben-efits are cut and/or payroll taxes are increasedsharply. This policy statement focuses on theregulation of private pensions and does notset out a detailed program for Social Securityreform. However, the fiscal principlesespoused by CED lead us to call for the fol-lowing changes:
• All Social Security benefits that exceedpast contributions should be subject toincome tax. We also believe that the agerequirements for receiving normalretirement benefits should be raisedbeyond the increase already legislated andthat the limits on earnings of retireesreceiving benefits should be raised sub-stantially. Congress should consider otherlimitations on Social Security benefits,such as reduced cost-of-living adjustmentsfor benefits above a basic floor, and/or agradual phase-in of a lower ratio of initialbenefits to income.
• Steps should be taken to make sure thatthe building Social Security reserve fundsdo not serve to mask the non-Social Secu-
rity federal budget deficit and that theyresult in an increase in real national sav-ings.
8. Defined benefit plans sponsored by fed-eral, state, and local governments should besubject to minimum disclosure and fundingstandards. Plans should be fully funded, andpension promises that cannot be fundedshould be avoided.
The magnitude of underfunding of publicemployee pensions appears to exceed under-funding of private pensions. A substantialnumber of state and local governmentemployee pension plans are underfunded.Federal pensions are also greatly under-funded. To maintain the solvency of under-funded plans, it will be necessary toincrease taxes on future workers and/or cutbenefits.
9. Pension funds should not be required tomake investments to achieve social objec-tives other than the objective of protectingthe economic security of the elderly.
Many state and local pension funds andeven private funds are under pressure toinvest in infrastructure and to make variousother social investments. CED does notoppose arrangements that permit individualsto choose such investments, but we stronglyoppose any mandated use of pension invest-ment funds. Unless the individual chooses oth-erwise, pension investments should be basedon sound economics (e.g., risk and return),not on social considerations.*
*See memorandum by JAMES Q. RIORDAN, (page 82).

15
Chapter 2
Retirement Saving andEconomic SecurityIn coming years, America will face the
major challenge of providing for the economicsecurity of its elderly population without plac-ing unreasonable tax burdens on future gen-erations. Retirement systems are already bur-dened by the rising life expectancy and a trendtoward earlier retirement. More importantly,the United States, like many advanced indus-trial countries, will experience a very sharprise in its retired population and the retiree-worker ratio when the baby-boom generationbegins to retire.1 Unlike citizens in many othercountries, however, Americans are not settingaside resources adequate for their retirementneeds. Indeed, overall saving rates in theUnited States have fallen to record low levelswell below those of other industrial nations.Not only has the private saving rate declinedprecisely at a time when greater efforts shouldbe made to prepare for the aging of the popu-lation, but the federal budget deficit is alsoabsorbing the lion’s share of those savings,thereby further reducing the amount avail-able for investment needed to spur economicgrowth.
Saving for retirement must become a higherpriority of individuals and government policymakers if future American retirees and tax-payers are to avoid unexpected hardships. Butbuilding adequate savings, like turning a largeship, is a slow process; it will take many yearsof higher saving to boost investment to thelevels necessary to generate sufficient incometo meet the expectations of future retirees.Thus, it is urgent that saving and retirementincome policies be changed promptly. In thisstatement, CED argues that the reform of gov-
ernment tax and regulatory policies affectingprivate pension saving must play a criticalrole in this change.
THE ECONOMIC SECURITY OFFUTURE RETIREES
The retired elderly in the United Statesreceive income from a variety of sources, (see“Sources of Funds for Retirement,” page 17).The three primary components of the U.S.retirement system are: (1) the huge SocialSecurity retirement program, which providesmost retirees with benefits at least sufficientto meet their basic needs for subsistence; (2)the large and diverse private retirement sys-tem that grew rapidly with the encourage-ment of government tax incentives during thepost–World War II period and now coversabout 49 million workers;2 and (3) the retire-ment programs sponsored by federal, state,and local governments for their own employ-ees, which have grown in importance largelybecause of increasing employment in the stateand local sectors.3
These three components, together withgains in personal wealth (especially invest-ment in homes), have dramatically improvedthe well-being of present-day retirees relativeto past generations of retirees. Some studiessuggest that the overall economic welfare oftoday’s younger retirees is comparable to thatof present-day full-time workers. However,there are now serious concerns about whetherthe economic well-being of future retirees canbe maintained at the level enjoyed by currentretirees, let alone be improved, as many have

16
come to expect. The reasons for these con-cerns (discussed in detail in Chapter 3) can besummarized as follows:
• Individuals are living longer and retiringearlier. Greatly compounding this trend isthe fact that the ratio of workers to retireeswill decline sharply in the next severaldecades because of the retirement of thebaby-boom generation. Consequently, thecost to each future active worker of sup-porting retiree benefits will rise sharply.Benefits financed on a pay-as-you-go basismay have to be cut back significantly inorder to prevent taxes paid by future work-ers from becoming too burdensome.
• At present, saving for retirement is not suf-ficient in the United States to meet theincome requirements of future retirees. Thiscan be seen in the overall decline in contri-butions to retirement plans, the under-funding of many private and public plans,and record-low saving rates.
• There has been a gradual shift in coverage,especially among small employers, fromemployer-funded retirement plans to morediscretionary saving vehicles such as 401(k)plans. The impact of this trend on the eco-nomic security of future retirees is not yetknown with certainty.
Prompt changes in retirement policies canimprove the prospects of future retirees. Tocompensate for the rise in life expectancy,both business and government shouldencourage workers to take retirement at alater age. Policies should also be institutedthat encourage saving and full funding ofpension promises. Recent changes in federaltax and regulatory policies governing privatepensions have often moved policy in the wrongdirection. (For a detailed discussion, see Chap-ter 5.) Changes in pension regulation havediscouraged retirement saving and contrib-uted to the underfunding of many pensions.
The American taxpayer has more than onereason to be concerned about the impact of
insufficient saving for retirement. Futureretirees who have inadequate incomes maydemand increased retirement benefits fromSocial Security (or at least resist any cutbackin benefits). Those with inadequate savingsare more likely to become a burden on thegovernment in other areas, such as long-termhealth care. Inadequate saving for retirementalso affects the economic health of the nationmore broadly.
THE ECONOMY AND RETIREMENTSAVING
Although this statement focuses primarilyon the economic security of future retirees, wecannot overlook the adverse effect of pensionpolicy on the economy and, in turn, the im-pact of a weakened economy on the well-beingof future retirees. The decline in saving forretirement and other purposes has serious ad-verse implications for the future economicprosperity of the nation; a weak economy withlittle or no growth in productivity and realwages will, in turn, struggle to provide ad-equate support for rising numbers of retireesand to address other social problems. The So-cial Security Administration’s underfundedliability for baby-boomer retirement benefitsis a case of too many claims on too little out-put. One way to think about the impact of theburden of rising benefits for baby boomers isto ask: How much output will be left for work-ers? The implication of the Social SecurityAdministration’s intermediate projection isthat nearly a quarter of the assumed 1.2 per-cent annual gain in labor productivity (realGDP per worker) between 2010 and 2030 willbe absorbed by rising benefits paid by SocialSecurity retirement, disability and hospitalinsurance benefits alone. However, the SocialSecurity Administration’s history of overopti-mistic projections and the record-low nationalsaving rates experienced in recent years raisethe question of whether Social Security’s pro-ductivity assumption is again too optimistic.If so, these programs will absorb an even
17
SOURCES OF FUNDS FOR RETIREMENT
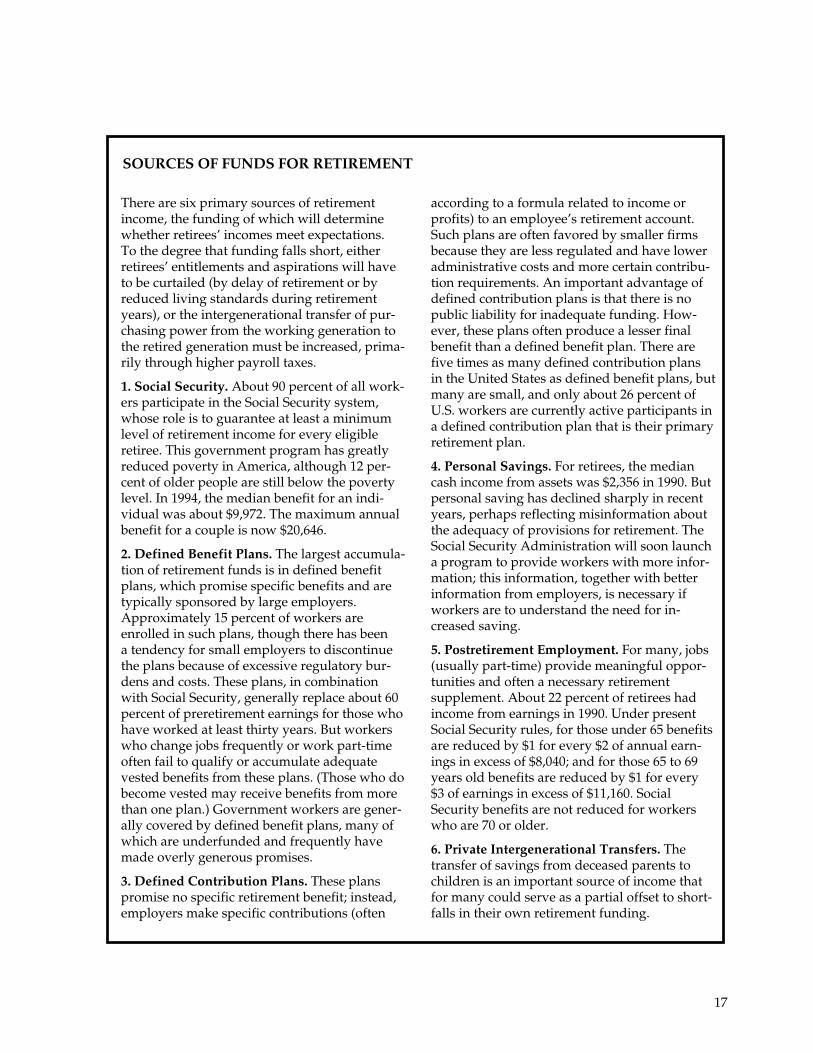
There are six primary sources of retirementincome, the funding of which will determinewhether retirees’ incomes meet expectations.To the degree that funding falls short, eitherretirees’ entitlements and aspirations will haveto be curtailed (by delay of retirement or byreduced living standards during retirementyears), or the intergenerational transfer of pur-chasing power from the working generation tothe retired generation must be increased, prima-rily through higher payroll taxes.
1. Social Security. About 90 percent of all work-ers participate in the Social Security system,whose role is to guarantee at least a minimumlevel of retirement income for every eligibleretiree. This government program has greatlyreduced poverty in America, although 12 per-cent of older people are still below the povertylevel. In 1994, the median benefit for an indi-vidual was about $9,972. The maximum annualbenefit for a couple is now $20,646.
2. Defined Benefit Plans. The largest accumula-tion of retirement funds is in defined benefitplans, which promise specific benefits and aretypically sponsored by large employers.Approximately 15 percent of workers areenrolled in such plans, though there has beena tendency for small employers to discontinuethe plans because of excessive regulatory bur-dens and costs. These plans, in combinationwith Social Security, generally replace about 60percent of preretirement earnings for those whohave worked at least thirty years. But workerswho change jobs frequently or work part-timeoften fail to qualify or accumulate adequatevested benefits from these plans. (Those who dobecome vested may receive benefits from morethan one plan.) Government workers are gener-ally covered by defined benefit plans, many ofwhich are underfunded and frequently havemade overly generous promises.
3. Defined Contribution Plans. These planspromise no specific retirement benefit; instead,employers make specific contributions (often
according to a formula related to income orprofits) to an employee’s retirement account.Such plans are often favored by smaller firmsbecause they are less regulated and have loweradministrative costs and more certain contribu-tion requirements. An important advantage ofdefined contribution plans is that there is nopublic liability for inadequate funding. How-ever, these plans often produce a lesser finalbenefit than a defined benefit plan. There arefive times as many defined contribution plansin the United States as defined benefit plans, butmany are small, and only about 26 percent ofU.S. workers are currently active participants ina defined contribution plan that is their primaryretirement plan.
4. Personal Savings. For retirees, the mediancash income from assets was $2,356 in 1990. Butpersonal saving has declined sharply in recentyears, perhaps reflecting misinformation aboutthe adequacy of provisions for retirement. TheSocial Security Administration will soon launcha program to provide workers with more infor-mation; this information, together with betterinformation from employers, is necessary ifworkers are to understand the need for in-creased saving.
5. Postretirement Employment. For many, jobs(usually part-time) provide meaningful oppor-tunities and often a necessary retirementsupplement. About 22 percent of retirees hadincome from earnings in 1990. Under presentSocial Security rules, for those under 65 benefitsare reduced by $1 for every $2 of annual earn-ings in excess of $8,040; and for those 65 to 69years old benefits are reduced by $1 for every$3 of earnings in excess of $11,160. SocialSecurity benefits are not reduced for workerswho are 70 or older.
6. Private Intergenerational Transfers. Thetransfer of savings from deceased parents tochildren is an important source of income thatfor many could serve as a partial offset to short-falls in their own retirement funding.

18
Figure 8
2000 2005 2010 2015 2020 2025 2030
1.25
1.20
1.15
1.10
1.05
1.00
0.95
0
Less real retirement benefits andhospital insurance
higher share of productivity gains. Moreover,when other transfers are taken into account,the gain in productivity available to activeworkers may decline sharply (see Figure 8).
Beginning in the mid-1970s, the growth inlabor productivity in the United States sloweddramatically, from nearly 3 percent to about 1percent a year, producing a long period ofnear stagnation of real wages. The prospectsfor restoring rapid productivity growth arelargely dependent on increases in the rate ofinvestment in physical and human capital andadvances in technology. But increased savingis required to provide the funds for suchinvestments, and unfortunately the nation haschosen to use a growing share of its income tofinance current consumption rather than sav-ing and investment. Indeed, the U.S. nationalsaving rate — the sum of net saving by indi-viduals, business, and government dividedby GDP — has declined precipitously inrecent years to record-low levels. Individuals,
business, and government have all contrib-uted to this decline. So far in this decade, netnational saving has averaged less than 2 per-cent of GDP, down from 4 percent during the1980s and about 8 percent in previous de-cades (see Figure 9). This decline in savingdoes not bode well for the future growth ofthe U.S. economy because national saving isthe only source of domestic funds for invest-ments that are needed to boost productivity.In fact, there is concern that the extremely lowdomestic saving rates experienced in recentyears are not sufficient to prevent productiv-ity growth from falling further.4
The national saving and investment ratesin the United States have also fallen belowthose of most other advanced industrialnations (see Figure 10). This is bad news forthe international competitiveness of the UnitedStates, which hinges on relative rates of pro-ductivity growth. Admittedly, investmentrates in the United States have not been as
SOURCE: Tabulated from intermediate projections contained in the 1994 OASDI Trustees report.
Five-Year Period Ending
Less real Social Security retirement benefits
Real GDP per worker
Annual Average Percent Growth
A Large Share of Worker Productivity Growth Will Go to the Elderly

19
weak as national saving rates because foreigncapital inflows have financed a substantialamount of domestic spending for investment.But reliance on foreign capital inflows hasserious disadvantages. These capital inflowsincrease foreign claims on future U.S. output,a particular concern when the inflows resultfrom a decline in domestic saving rather thanfrom rising investment opportunities in theUnited States. Foreign capital inflows havebrought about a dramatic shift (now approach-ing $1 trillion) in the U.S. net foreign invest-ment position. Once the largest creditornation in the world, the United States hasbecome the largest debtor, and the rising debtto foreigners represents a future burden forthe nation.5
Why has saving fallen in the United States?Huge federal budget deficits made the largestcontribution to the decline in net national sav-ing (see Figure 11, page 20). In recent years,these deficits have absorbed about 70 percentof private savings. The private sector has alsocontributed to the decline. The corporate sav-ing rate (retained earnings) declined sharplyin the 1980s, though it now appears to berising as profits recover. But the personal sav-ing rate, which fell from about 8 percentof disposable income in the first half of the1980s, remains very depressed at about 4 per-cent of disposable income.6 Retirement saving,which is a very large (and growing) compo-nent of personal saving, declined from nearly4 percent of disposable income in 1980 to lessthan 3 percent in recent years (see Figure 12,page 20). Clearly, any serious effort to increaseprivate saving will require a change in currentretirement policies.
In a 1992 policy statement, Restoring Pros-perity: Budget Choices for Economic Growth,CED said that reversing the collapse innational saving should become an explicitgoal of U.S. policy. It recommended that gov-ernment policies should aim to restore therate of national saving to the 8 percent normthat existed prior to the 1980s.7 Two of themost potent policy instruments available for
U.S. National Saving, Selected Periods
Figure 9
Percent
Years
(percent of GDP)
National Saving in G-7 Countries,1960 to 1991
Figure 10
30
25
20
15
10
5
01960 1965 1970 1975 1980 1985 1990
Other G-7 (a)
Japan
United States
Germany
Year
NOTE: National saving is net of depreciation.(a) Other G-7 countries are France, Italy, Canada, and UnitedKingdom.SOURCE: Organization for Economic Cooperation andDevelopment.
NOTE: National saving is net of depreciation.SOURCE: Bureau of Economic Analysis.
(percent of GDP)Percent
10
8
6
4
2
01950–1959 1960–1969 1970–1979 1980–1989 1990–1993

20
achieving that goal are federal budget policiesto decrease the budget deficit and retirementpolicies to encourage private retirement sav-ing.
With regard to the federal budget, CEDrecommended that the deficit be reduced byabout $50 billion annually, with the eventualgoal of achieving a surplus. From fiscal 1991to 1993, the federal budget deficit averagedabout $272 billion, or about 4.6 percent of GDP.The 1993 budget act and economic expansionhave put the deficit on a lower path; it isexpected to fall from 3.9 percent of GDP infiscal 1993 to 2.3 percent of GDP in fiscal 1995.8
This decline in the budget deficit will make asignificant contribution to national saving,though policy makers have a long way to goto get entitlement spending under control andto achieve the target recommended by CEDfor the federal budget. Moreover, the long-termbudget forecast is not so sanguine; later in thedecade, the deficit is expected to begin rising
Federal Deficits and National Saving,Selected Periods
Percent
(percent of net national product)
Figure 11
12
10
8
6
4
2
01950–1959 1960–1969 1970–1979 1980–1989 1990–1993
Federaldeficit
Netnonfederal
saving
Netnationalsaving
Years
SOURCE: Bureau of Economic Analysis.
Percent
Figure 12
10
8
6
4
2
0
(percent of disposable personal income)
Personal and Pension Saving, Selected Periods
Personal saving
Private pensioncontributions
1972–1974 1975–1977 1978–1980 1981–1983 1984–1986 1987–1989 1990–1991
Years
SOURCE: Bureau of Economic Analysis; pension saving series provided by staff at The Brookings Institution.

21
again as a percent of GDP.9 CED continues torecommend implementation of policies thatwill gradually move the federal budget to-ward balance as a means of increasing na-tional saving and investment.
With respect to retirement policies, it isclear that measures that succeed in increasingprivate retirement saving by expanding pen-sion coverage and increasing contributions ofcurrent participants have the potential for sub-stantially increasing household saving. How-ever, it may be very difficult to restore pen-sion saving rates to earlier levels. Changingindividual priorities would be critical becausemany individuals are not saving anything fortheir own retirement.10 Some of the blame forthe decline in retirement saving must beattributed to ill-advised changes in public poli-cies that discourage business contributions topensions. (We examine this issue in detail inChapter 5.) These policies should be reversed.11
It should also be noted that the public sectorhas contributed more directly to the problemof inadequate saving by underfunding bothpublic employee retirement programs andSocial Security retirement promises (see Chap-ter 3).
The recent weakness in private pension sav-ing is an important component of the nationalsaving and investment problem. Clearly, theUnited States needs to employ pension poli-cies to encourage saving not only to improvethe economic security of individual retireesbut also to boost national economic growthand competitiveness. More rapid growth ofthe economy, in turn, will make it easier forthis country to support its rising elderly popu-lation.
PRIVATE- AND PUBLIC-SECTORRESPONSIBILITIES FOR PENSIONS
We have seen that both the nation andindividual citizens have a strong interest inretirement savings accumulated for thebaby-boom generation. But precisely whose
responsibility is it to provide for their pen-sions? Observers report that some present-day workers have the mistaken belief that gov-ernment and business will provide for all theirretirement needs. Such beliefs may arise be-cause workers do not have adequate informa-tion about the benefits they will be entitled toin retirement.
Although CED believes that each familyshould take primary responsibility for its owneconomic welfare, we agree that all sectors ofsociety, including business, have a stake in ahealthy private pension system and in thewelfare of retirees. We believe that a reason-able arrangement would have Social Securityand voluntary business-sponsored pensionsproviding a reasonable minimum level of re-tirement income for workers, with the indi-vidual being responsible for improvementsbeyond that minimum. Given pension arrange-ments already in place, including the SocialSecurity system, the following division of re-sponsibilities is recommended:
• Social Security should provide a mini-mum level of retirement income for allworking members of society and theirdependents.
• Business, nonprofit employers, and gov-ernments should be encouraged to pro-vide supplemental retirement assistance.Employers often provide retirement ben-efits to attract and retain competent work-ers. The combination of Social Securityand employer-sponsored plans is gener-ally intended to provide retirees with areasonable minimum standard of living,though with less income than that receivedby active workers.
• Individual workers should have ultimateresponsibility for achieving retirementincome above that provided by SocialSecurity and employer retirement plans,according to their desired standard of liv-ing.

22
ACTIONS REQUIRED TO MEETTHESE RESPONSIBILITIES
It is important that each group — govern-ment, private employers, and individuals —meet their responsibilities without placing anunfair burden on future generations. As a prac-tical matter, this means that retirement sav-ings must be sufficient to fund promisedbenefits and the average retirement age mustbe raised to reflect longer life spans. CEDurges both business and government toreview retirement programs to ensure thatthey do not provide ongoing disincentivesfor productive employment by the elderly,without reducing the ability of firms torestructure as needed.
Social Security. With respect to programsfinanced largely on a pay-as-you-go basis, suchas Social Security, government must be care-ful to resist pressures to promise generousunfunded retirement benefits beyond thosenecessary to provide a basic floor of retire-ment income. Thus far, our political leadershave not been willing to face the demographicchallenge and the long-term underfunding ofpromised Social Security benefits. Longerretirement spans have greatly increased thecost of retirement benefits since the inceptionof Social Security, and the Social SecurityAdministration’s long-term projections indi-cate that the system’s assets will be depletedrapidly when the baby-boom generationretires unless benefits are cut and/or payrolltaxes are increased sharply (see Chapter 3).An increase in the normal retirement age from65 to 67 years is scheduled to be phased induring the years 2003 through 2025, but thisincrease does not fully compensate for theincrease in life expectancy.12 At the same time,earnings limitations applied to those receiv-ing Social Security benefits have reduced thesupply of productive workers and exacerbatedthe decline in the worker/retiree ratio.13
Because the primary concern of this policystatement is private retirement saving, we donot investigate the merits of alternative pro-posals for “fixing” Social Security. However,
as a matter of equity and sound fiscal policy,CED has long favored the taxation of allSocial Security benefits that exceed past con-tributions. This change would be a form ofmeans test that would also improve equity intaxation by treating income of workers andretirees in the same way.14 CED also recom-mends that Congress consider other limita-tions on Social Security benefits, such as anincrease in the normal and early retirementages beyond that already legislated, reducedcost-of-living adjustments for benefits abovea basic floor, and a gradual phase-in of lowerreplacement ratios (i.e., the ratio of retire-ment benefit to income received during yearsof employment). To reduce the disincentivefor the elderly to continue to work, the limiton earnings of recipients of Social Securitybenefits should be raised substantially. Suchchanges could place the Social Security pro-gram on a sound footing and avoid an unfairburden on future generations.
Private employers. Fully funded private andpublic employee retirement programs are criti-cal for many retirees and also have greatsocial value, because they add to national sav-ing. We believe all employers should beencouraged to provide retirement plans or atleast to give employees the opportunityto accumulate retirement savings withtax-sheltered contributions from their ownincomes. Public and private employers havean obligation to adequately fund the pensionpromises they make to their workers and tomaintain high standards of fund management.Individuals are also more likely to achievetheir retirement-saving objectives if retirementbenefits can be preserved when a workermoves from one employer to another. CEDbelieves that employers should place a highpriority on improving vesting and the port-ability of retirement assets.
Individual responsibility and the education ofworkers. Individuals, on the other hand, cantailor their retirement-saving decisions to theirparticular circumstances. When deciding onan income-replacement ratio that meets their

23
needs, individuals would, in theory, have theoption of choosing the age at which they willretire, whether they will continue to workafter retirement, and the rate at which theywill draw from existing assets, includingequity in a home. However, in a world wherejob security is uncertain, workers may notalways have such employment choices, andmany workers will have few assets other thanpensions. Most workers will need to set asidesubstantial savings in addition to pensions toachieve their lifestyle expectations.
However, American workers are not wellinformed about retirement saving and, indeed,about personal finance.15 To prepare intelli-gently for their retirement, individual work-ers require information about prospective ben-efits from Social Security and private pensions.In those instances in which workers have somecontrol over the amounts they elect to contrib-ute to pension plans and the distribution ofthose contributions over different kinds ofinvestments, they also need information onhow their choices could affect their retirementincome. Unfortunately, workers frequently donot have such information, though it may bereadily available (see Chapter 3) and can beprovided at low cost. There is also evidencethat Americans have a poor level of financialliteracy and that this deficiency is a strongfactor in poor saving decisions.16 CED believesthat business and government have the ad-ditional responsibility of providing workerswith adequate and realistic informationabout their pensions, including retirementneeds, accumulated benefits, and the fund-ing status of their plan. We also believe that
the Department of Labor should provideguidance designed to encourage employersto provide information on retirement savingand investment to their employees and toprotect plan sponsors against unreasonablelawsuits. For example, information providedby employers about past market performanceshould not make employers legally liable iffuture performance is inconsistent with ex-perience. Given the long-term funding prob-lems of Social Security, it is important to in-form workers that circumstances maynecessitate the enactment of measures that re-duce the growth of future benefits.
Employer-provided pension benefits arefuture payments for current work: that is,deferred compensation. As such, pension ben-efits, like wages generally, are primarily aprivate-sector issue. However, the U.S. expe-rience with some private pensions before theenactment of ERISA suggests that governmentalso has a responsibility to provide reasonableand stable regulation of private pensions inorder to make sure that pensions meet appro-priate fiduciary standards and that pensionpromises are kept. The contribution of privatepensions to the economic security of retireesand to the strength of the national economyindicates that the private pension system hasan important social value that extends beyondthe specific benefit to individual retirees. InCED’s view, the social benefits of privatepensions justify some government oversight(provided that it is responsible, low cost, andstable) and appropriate tax preferences toencourage retirement saving. (These issuesare discussed in detail in Chapters 4 and 5.)

24
about 12 percent currently to about 20 percentby 2030, when aged persons will number morethan 68 million. The number of beneficiariesof the Social Security retirement and disabilityprogram (OASDI) is projected to rise from41.8 million in 1993 to 80.3 million in 2030.1
The social implications of such an accelera-tion in the growth of the aged population arequite profound. Even with a gradual increasein the elderly population, the growth in gov-ernment spending for the elderly has beenphenomenal. In the last three decades, spend-ing for Social Security, Medicare, and otherrelated retirement and disability programs rose
Percentage of U.S. Population Age 65and Over, 1950 to 2050
Figure 13
Percent
Year
25
20
15
10
5
0
SOURCE: Social Security Administration (intermediateprojection)
1950 1960 1970 1980 1990 2000 2010 2020 2030 2040 2050
Chapter 3
The Basic Facts on Our AgingPopulation and Retirement Saving
AN AGING POPULATIONOne of the most significant social develop-
ments in the United States during the twenti-eth century has been the phenomenal growthof the elderly population. During the firstninety years of this century, the number ofpeople age 65 years or older in the UnitedStates rose by nearly 29 million, from 4.6 per-cent of the total population to 12.3 percent.This rapid growth reflected the combinedinfluence of three factors: (1) a spectacularincrease in life expectancy (from 47 years in1900 to 75 years in 1990), (2) a sharp decline inthe birthrate, and (3) a reduction in immigra-tion.
All these factors may contribute to the rela-tive growth of the elderly population in thefuture, though the precise contribution of eachis uncertain. However, the future growth ofthe retired population will also be greatlyinfluenced by an additional factor about whichthere is no doubt: The baby-boom generationwill begin to reach retirement age in about adecade. This group, which includes about 76million individuals born between 1946 and1964, comprises an unusually large segmentof the U.S. population because the birthraterose during that period and declined there-after. Because of the baby-boom bulge in theage distribution, the growth of the elderlypopulation during the first half of thetwenty-first century is expected to accelerate(see Figure 13), substantially exceeding thevery rapid growth in this century. The SocialSecurity Administration’s intermediate pro-jection indicates that the proportion of thepopulation age 65 and older will rise from
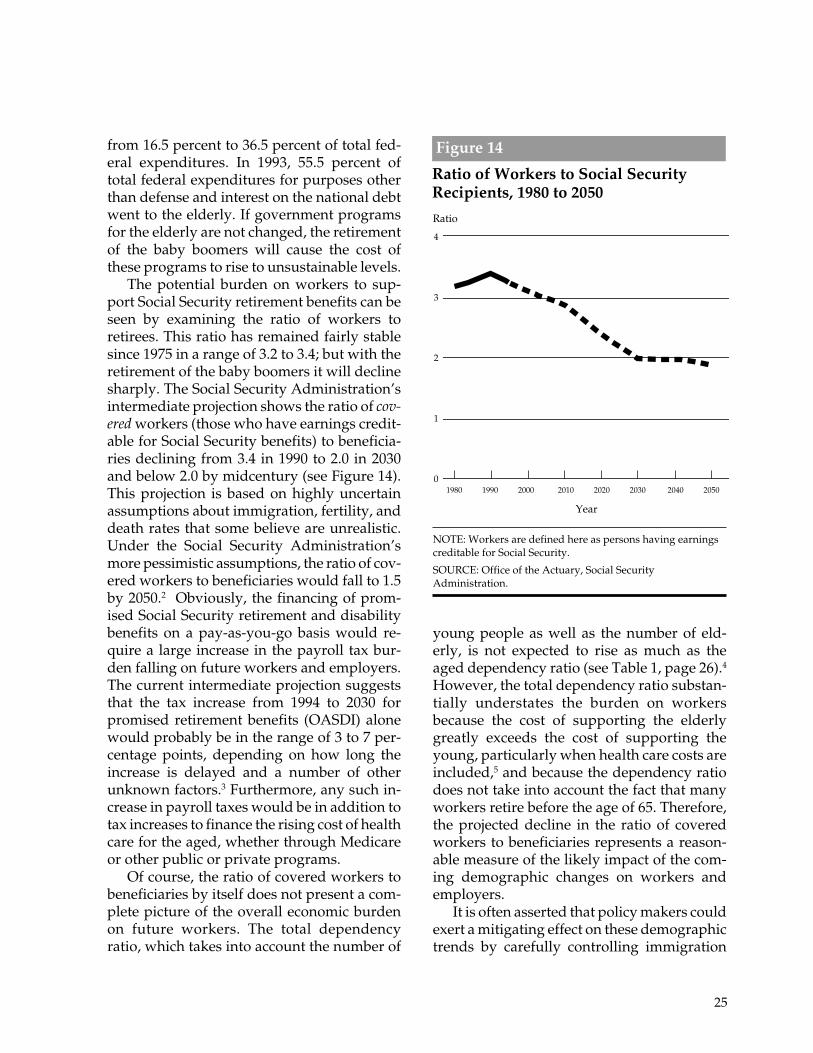
25
from 16.5 percent to 36.5 percent of total fed-eral expenditures. In 1993, 55.5 percent oftotal federal expenditures for purposes otherthan defense and interest on the national debtwent to the elderly. If government programsfor the elderly are not changed, the retirementof the baby boomers will cause the cost ofthese programs to rise to unsustainable levels.
The potential burden on workers to sup-port Social Security retirement benefits can beseen by examining the ratio of workers toretirees. This ratio has remained fairly stablesince 1975 in a range of 3.2 to 3.4; but with theretirement of the baby boomers it will declinesharply. The Social Security Administration’sintermediate projection shows the ratio of cov-ered workers (those who have earnings credit-able for Social Security benefits) to beneficia-ries declining from 3.4 in 1990 to 2.0 in 2030and below 2.0 by midcentury (see Figure 14).This projection is based on highly uncertainassumptions about immigration, fertility, anddeath rates that some believe are unrealistic.Under the Social Security Administration’smore pessimistic assumptions, the ratio of cov-ered workers to beneficiaries would fall to 1.5by 2050.2 Obviously, the financing of prom-ised Social Security retirement and disabilitybenefits on a pay-as-you-go basis would re-quire a large increase in the payroll tax bur-den falling on future workers and employers.The current intermediate projection suggeststhat the tax increase from 1994 to 2030 forpromised retirement benefits (OASDI) alonewould probably be in the range of 3 to 7 per-centage points, depending on how long theincrease is delayed and a number of otherunknown factors.3 Furthermore, any such in-crease in payroll taxes would be in addition totax increases to finance the rising cost of healthcare for the aged, whether through Medicareor other public or private programs.
Of course, the ratio of covered workers tobeneficiaries by itself does not present a com-plete picture of the overall economic burdenon future workers. The total dependencyratio, which takes into account the number of
Ratio of Workers to Social SecurityRecipients, 1980 to 2050
Figure 14
4
3
2
1
0
NOTE: Workers are defined here as persons having earningscreditable for Social Security.
SOURCE: Office of the Actuary, Social SecurityAdministration.
Ratio
young people as well as the number of eld-erly, is not expected to rise as much as theaged dependency ratio (see Table 1, page 26).4
However, the total dependency ratio substan-tially understates the burden on workersbecause the cost of supporting the elderlygreatly exceeds the cost of supporting theyoung, particularly when health care costs areincluded,5 and because the dependency ratiodoes not take into account the fact that manyworkers retire before the age of 65. Therefore,the projected decline in the ratio of coveredworkers to beneficiaries represents a reason-able measure of the likely impact of the com-ing demographic changes on workers andemployers.
It is often asserted that policy makers couldexert a mitigating effect on these demographictrends by carefully controlling immigration
1980 1990 2000 2010 2020 2030 2040 2050
Year

26
so as to boost the number of young workersand reduce the decline in the ratio of coveredworkers to retirees. But given the magnitudeof the shortfall in workers, it is not likely thatimmigration could make a significant dent inthe problem. The number of additional work-ers required to stabilize the ratio at its 1990level (3.4) is about 13 million in the year 2000(see Table 2). The shortfall would rise to 110million by 2030 and 128 million in 2050, about36 percent of the projected population in thatyear. The number of additional immigrantsnecessary to offset this shortfall of workerswould be much larger than these figuresbecause many of the immigrants would beretired by 2030.6 (The baseline projectionalready includes an assumption that about 8.5million immigrants, about 4 percent of whomwill already be over the age of 65, come to the
Table 1
Dependency Ratios
Year Aged(a) Total(b)
l990 0.209 0.700
2000 0.210 0.691
2010 0.216 0.652
2020 0.279 0.701
2030 0.360 0.791
(a) Population 65 and over divided by population age 20 –64.(b) Population 65 and over plus population under age 20divided by population age 20–64.
SOURCE: Board of Trustees. Federal Old Age and SurvivorsInsurance and Disability Trust Fund, 1994 Annual Report(Washington, D.C.: U.S. Government Printing Office, 1994),p. 144.
Number of WorkersNeeded to Hold
Worker/BeneficiaryRatio to 1990 LevelSocial Security Projection
NOTE: Workers refers to covered workers.
SOURCE: Social Security Administration intermediate projection.
Table 2
Number of Workers Required to Hold the Worker-Beneficiary Ratioat Its 1990 Value of 3.4 to 1 (millions)
Baseline Social Ratio of Percent ofPopulation Security Workers to Additional ProjectedProjection Beneficiaries Workers Beneficiaries Workers Baseline Pop.
1990 259 39 133 3.4 0 0%
2000 285 47 147 3.1 13 5%
2010 306 55 157 2.9 28 9%
2020 325 68 161 2.4 70 22%
2030 340 80 163 2.0 110 32%
2040 349 84 166 2.0 121 35%
2050 354 87 168 1.9 128 36%

27
United States between 1990 and 2000.) Recentresearch indicates that massive immigrationwould be required to have any significanteffect.7
The coming bulge in the elderly popula-tion is the inevitable consequence of the agingof the baby boomers. No reasonable publicpolicy would change these demographictrends sufficiently to halt the decline in theratio of workers to retirees. From this circum-stance, we conclude that it is critically impor-tant to increase retirement saving in anticipa-tion of the rise in the aged population.
PRIVATE SECTOR PREPARATIONFOR RETIREMENT OF THE BABYBOOMERS
Total retirement income from all sources,including Social Security and private pensions,now exceeds half a trillion dollars annually inthe United States, roughly 10 percent of per-sonal income. In 1992, Social Securityaccounted for half of total retirement pay-
ments; government pensions and private pen-sions accounted for about 19 and 31 percent,respectively (see Figure 15). Total private pen-sion payments grew very rapidly until themid-1980s. Consequently, the Social Securityretirement share of benefit payments declined(from 62.1 percent in 1970 to 48.1 percent in1986); since the mid-1980s, it has remainedabout the same. For most individual retirees,Social Security is the most important source ofincome; benefits were received by about92 percent of the aged in 1992. In that year,about 66 percent of the elderly had incomefrom assets, and 44 percent received retire-ment benefits other than Social Security. About29 percent of private sector retirees receive aprivate pension. In 1994, the median annualSocial Security payment was $9,972, whichwas roughly 80 percent higher than themedian private pension annuity payment, and3 times the median cash income from assets.For retirees who receive private pensionsafter thirty years of service from medium-sizeand large private establishments, the combined
Social Security 62.0% Social Security 49.9%
Privatepensions 31.4%
Governmentpensions 22.0%
Privatepensions 16.0%
1970 1992Governmentpensions 18.7%
SOURCE: Employee Benefit Research Institute.
Figure 15
Retirement Benefit Payments, by Source, 1970 and 1992(percent of total payments)

28
private pension and primary Social Securitybenefit replaced 59 percent of wages in 1990.Figures 15 (see page 27) and 16 show retire-ment income from all sources, including gov-ernment.8
PRIVATE PENSION CONTRIBUTIONSIn recent decades, private pension assets in
the United States have grown rapidly in dol-lar terms and as a share of national wealth(see Figure 17). However, much of the increasereflects an appreciation in the market value ofthese assets rather than saving out of currentincome.9 This is seen in Figure 18, which showsthat total contributions to private pensions inreal terms have declined during the lastdecade despite the rapid growth of the laborforce. Real contributions per worker havefallen sharply.
New funding limits enacted in the 1980s(see Chapter 5), together with a rise in assetvalues, caused the employer component of
Figure 16
Percentage of the Aged with Income from Various Sources, 1992
Dollars
15
10
5
01960 1965 1970 1975 1980 1985 1990
Year
Private Pension Assets, 1960 to 1992
Figure 17
(in 1992 dollars and as a percent of nationalwealth)Percent Billions of Dollars
3,500
3,000
2,500
2,000
1,500
1,000
500
0
100
80
60
40
20
0
Percent
Social Security Asset Income Pensions Earnings Public Assistance Veterans’ Benefits
Source of Income
SOURCE: Office of Research and Statistics, Social Security Administration.
SOURCE: Pension and Welfare Benefits Administration,Employee Benefit Research Institute, and Federal Reserve.
Percent of national wealth
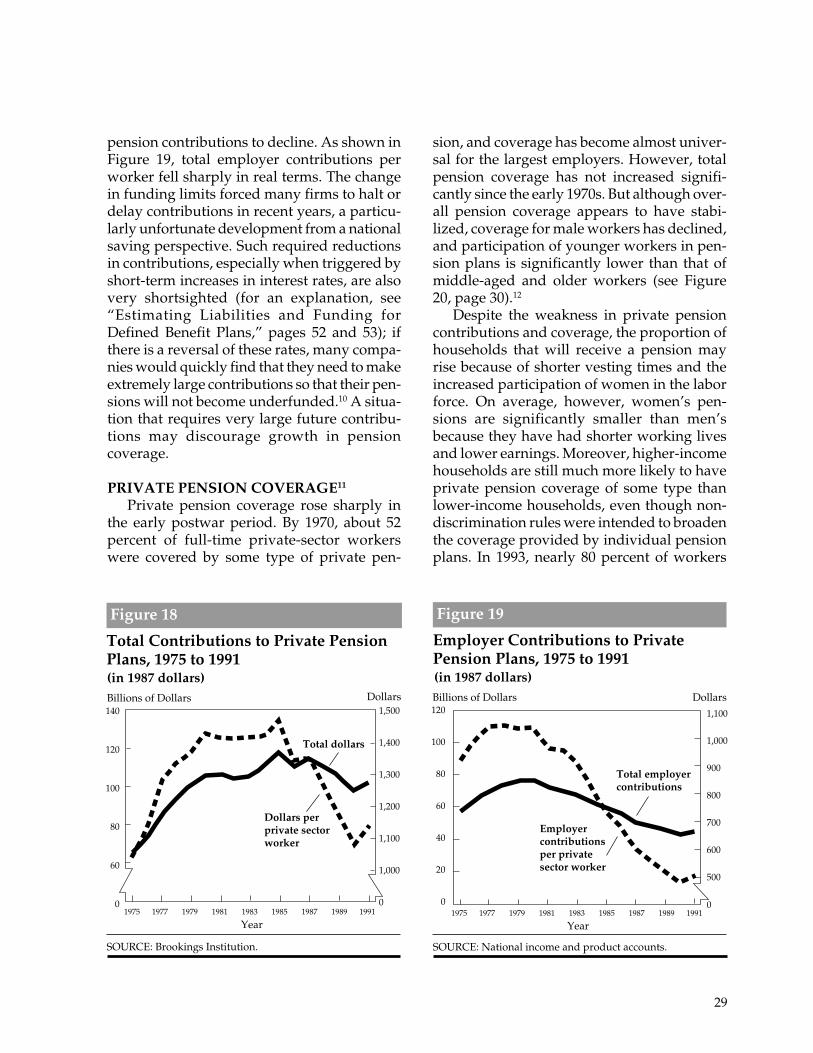
29
Employer Contributions to PrivatePension Plans, 1975 to 1991
Figure 19
Year
Total Contributions to Private PensionPlans, 1975 to 1991
Figure 18
1975 1977 1979 1981 1983 1985 1987 1989 1991
Year
(in 1987 dollars)Billions of Dollars140
120
100
80
60
0
1,500
1,400
1,300
1,200
1,100
1,000
0
Dollars perprivate sectorworker
Dollars Billions of Dollars Dollars
(in 1987 dollars)
120
100
80
60
40
20
0
Employercontributionsper privatesector worker
1,100
1,000
900
800
700
600
500
0
sion, and coverage has become almost univer-sal for the largest employers. However, totalpension coverage has not increased signifi-cantly since the early 1970s. But although over-all pension coverage appears to have stabi-lized, coverage for male workers has declined,and participation of younger workers in pen-sion plans is significantly lower than that ofmiddle-aged and older workers (see Figure20, page 30).12
Despite the weakness in private pensioncontributions and coverage, the proportion ofhouseholds that will receive a pension mayrise because of shorter vesting times and theincreased participation of women in the laborforce. On average, however, women’s pen-sions are significantly smaller than men’sbecause they have had shorter working livesand lower earnings. Moreover, higher-incomehouseholds are still much more likely to haveprivate pension coverage of some type thanlower-income households, even though non-discrimination rules were intended to broadenthe coverage provided by individual pensionplans. In 1993, nearly 80 percent of workers
pension contributions to decline. As shown inFigure 19, total employer contributions perworker fell sharply in real terms. The changein funding limits forced many firms to halt ordelay contributions in recent years, a particu-larly unfortunate development from a nationalsaving perspective. Such required reductionsin contributions, especially when triggered byshort-term increases in interest rates, are alsovery shortsighted (for an explanation, see“Estimating Liabilities and Funding forDefined Benefit Plans,” pages 52 and 53); ifthere is a reversal of these rates, many compa-nies would quickly find that they need to makeextremely large contributions so that their pen-sions will not become underfunded.10 A situa-tion that requires very large future contribu-tions may discourage growth in pensioncoverage.
PRIVATE PENSION COVERAGE11
Private pension coverage rose sharply inthe early postwar period. By 1970, about 52percent of full-time private-sector workerswere covered by some type of private pen-
1975 1977 1979 1981 1983 1985 1987 1989 1991
SOURCE: National income and product accounts.
Total dollars
Total employercontributions
SOURCE: Brookings Institution.
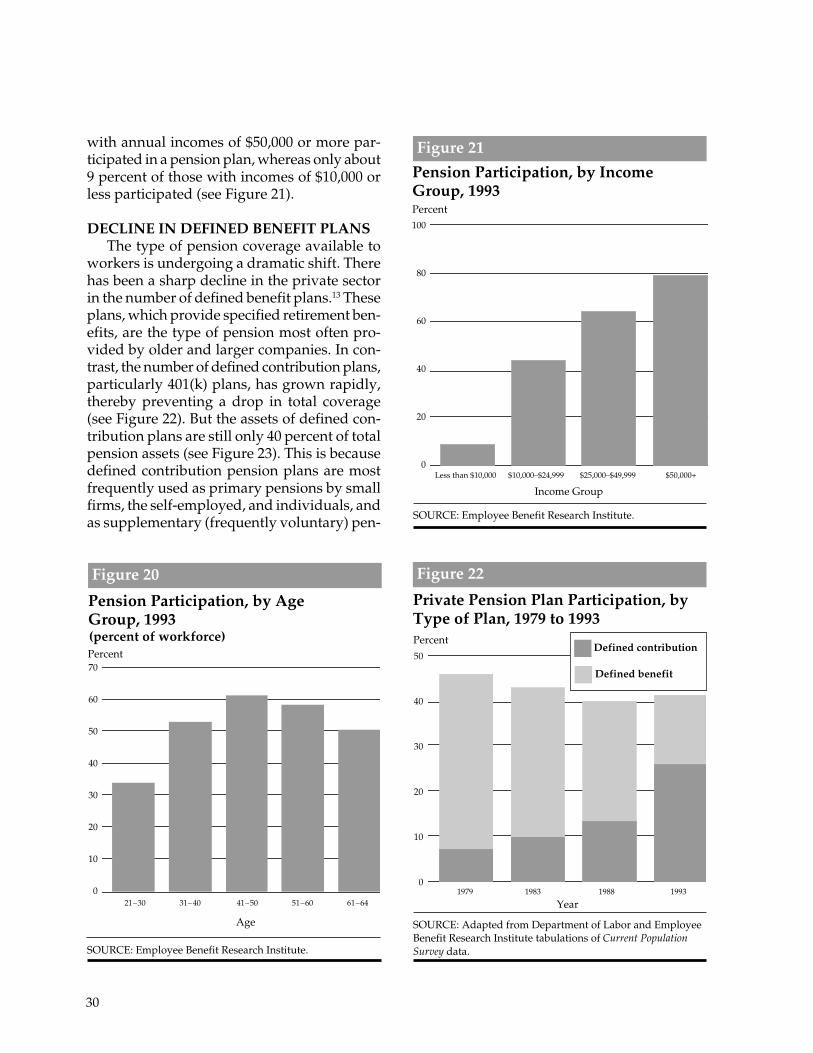
30
Year
SOURCE: Adapted from Department of Labor and EmployeeBenefit Research Institute tabulations of Current PopulationSurvey data.
Private Pension Plan Participation, byType of Plan, 1979 to 1993
Figure 22
Percent
Percent
Figure 21
Pension Participation, by IncomeGroup, 1993
100
80
60
40
20
0
50
40
30
20
10
0
with annual incomes of $50,000 or more par-ticipated in a pension plan, whereas only about9 percent of those with incomes of $10,000 orless participated (see Figure 21).
DECLINE IN DEFINED BENEFIT PLANSThe type of pension coverage available to
workers is undergoing a dramatic shift. Therehas been a sharp decline in the private sectorin the number of defined benefit plans.13 Theseplans, which provide specified retirement ben-efits, are the type of pension most often pro-vided by older and larger companies. In con-trast, the number of defined contribution plans,particularly 401(k) plans, has grown rapidly,thereby preventing a drop in total coverage(see Figure 22). But the assets of defined con-tribution plans are still only 40 percent of totalpension assets (see Figure 23). This is becausedefined contribution pension plans are mostfrequently used as primary pensions by smallfirms, the self-employed, and individuals, andas supplementary (frequently voluntary) pen-
Less than $10,000 $10,000–$24,999 $25,000–$49,999 $50,000+
1979 1983 1988 1993
Pension Participation, by AgeGroup, 1993
Figure 20
(percent of workforce)
70
60
50
40
30
20
10
0
Percent
21–30 31–40 41–50 51–60 61–64
Defined contribution
Defined benefit
SOURCE: Employee Benefit Research Institute.
Age
SOURCE: Employee Benefit Research Institute.
Income Group

31
sion saving by firms whose primary retire-ment program is a defined benefit plan.Employees of large firms are still much morelikely to be covered by a pension thanemployees of small firms (see Figure 24).Many smaller firms do not offer their employ-ees a pension plan. Evidently, economic fac-tors such as the uncertainty of future incomehave much to do with this. Smaller firms alsotend to have a greater percentage of employ-ees who are young, part-time, and/or notlikely to stay in their job for a long period.14
Formation of new plans has declined in recentyears, and most of the pensions that have beenintroduced by small firms are of the definedcontribution type.15
The decline in defined benefit plans, whichis at least partly the result of government regu-lations (see Chapter 5), has also raised fearsabout the economic security of future retirees.Critics of defined contribution plans believethat these plans will not provide retirees withadequate income. This is not a settled issue,and some researchers have reached the con-clusion that defined contribution plansactually provide greater economic security,in part because of their portability.16 But it ispossible to improve vesting and portability ofdefined benefit plans. As we noted in Chapter2, CED regards improved portability of pen-sion assets as a worthy objective and urgesregulators to investigate the various optionsfor achieving this goal.
PRERETIREMENT WITHDRAWALSOF PENSION FUNDSPension contributions and coverage rates donot tell the whole story about the adequacy ofongoing preparations for the retirement of thebaby-boom generation. Many plans (includ-ing both defined benefit and defined contri-bution plans) permit borrowing from pensionassets and lump-sum distributions at retire-ment or when changing jobs. The increasingnumber of preretirement distributions receivedwhen changing jobs appears to be a seriousthreat to retirement saving. Although the taxcode strongly encourages the rollover of
Private Pension Plan Assets, by Typeof Plan, 1975 to 1991
Figure 23
Billions of Dollars
Pension Plan Participation, by Sizeof Firm, 1993
Figure 24
NOTE: Funds held by life insurers under allocated insurancecontracts are excluded.
SOURCE: Department of Labor.
1975 1977 1979 1981 1983 1985 1987 1989 1991
Year
2,500
2,000
1,500
1,000
500
0
Non-401(K) defined contribution
401(K)
Defined benefit
1–24 25–99 100–499 500–999 1,000+
70
60
50
40
30
20
10
0
Percent
SOURCE: Employee Benefit Research Institute.
Number of Employees

32
lump-sum distributions into IRAs or otherqualified retirement instruments, one surveysuggests that only a small fraction of recipi-ents do so; 40 percent of recipients use someof the funds for consumption.17 Preretire-ment lump-sum distributions not rolled overamounted to about $42 billion in 1990.18
Many observers have become concernedthat lump-sum withdrawals and borrowingfrom pension assets, which are now quite com-mon, will undermine saving for pensions andthe adequacy of retirement income. On theother hand, a substantial proportion of fundsnot invested in qualified instruments is placedin other forms of investment, such as housingand education, and these investments mayimprove living standards in retirement.Although the net impact on the well-being offuture retirees of preretirement lump-sumwithdrawals and borrowing from pensionfunds is not certain, there certainly appears tobe a risk that such practices will underminethe adequacy of future retirement income.Moreover, the depletion of retirement fundsmay ultimately put pressure on policy makersto raise Social Security benefits. (CED’s rec-ommendations pertaining to preretirementwithdrawal of pension assets are described inChapter 5).
THE STATUS OF PENSION FUNDS
PRIVATE PENSION FUNDSThere is also evidence of inadequate pen-
sion saving in the deterioration of pensionfunding for some defined benefit plans. Thisdeterioration jeopardizes not only the eco-nomic security of future retirees but also thefuture financial strength of the economy andthe employers that have promised pensions.Pensions are a major source of national savingand capital for productive investment. Pen-sion plans own about one-fourth of all corpo-rate equities and one-third of the fixed obliga-tions of business; and of course, pensions area major holder of government obligations.19
Federal regulatory and tax policies pertain-ing to funding have been schizophrenic. Theyrequire minimum-funding levels to protectbenefit promises but limit maximum fundingso stringently that the health of even well-funded plans is threatened. Ironically, themaximum-funding requirements, which wereenacted to limit federal revenue losses, actu-ally heighten the exposure of taxpayers to thepossibility of increased Treasury expendituresto bail out the Pension Benefit Guaranty Cor-poration (PBGC), the federal governmentagency that insures defined benefit plans.20
The PBGC guarantees that a specific por-tion of the promised benefit will be paidregardless of the financial condition of thesponsor. Because of termination of under-funded plans, the PBGC has taken over planswith billions of dollars of promised benefits.The PBGC’s financial condition has raisedquestions about its viability and the securityof pensions it guarantees, and this has ledto proposals for reform. (Further discussion ofthe operation of the PBGC is provided inChapter 5.)
The 66,000 defined benefit plans insuredby the PBGC have promised about $900 bil-lion in benefits. The PBGC believes that mostof these pensions are well funded, but it notesa continuing deterioration in coverage andfunding. According to the PBGC, overfundinghas declined, and there has been a substantialrise in underfunding. The decline in fundingstatus reflects the combined effects of fallinginterest rates (which increase the present valueof plan liabilities) and funding limits enactedby Congress in 1987 in an attempt to raisefederal revenues.
The total underfunding of all plans insuredby the PBGC amounted to $71 billion at theend of 1993, an increase of $18 billion fromthe previous year. A relatively small numberof firms account for a large share of theunderfunding; in 1993, just fifty companiesaccounted for 56 percent of the underfundingin single-employer plans. The typical under-

33
cent or less for higher-income workers. SocialSecurity is credited with having sharplyreduced poverty among the elderly and,together with Medicare and private pensions,with boosting the income of many retireesnearly to the level enjoyed by workers (see“The Economic Status of the Elderly andNonelderly Compared,” page 34).
Because they had paid so little in taxes, theearly recipients of Social Security retirementbenefits received a very high return on theircontributions. In fact, for almost all individu-als who currently receive benefits, the annuityvalue of their benefits exceeds their contribu-tions paid (plus interest). The return on con-tributions is generally higher for low-incomerecipients, though in absolute terms theexcess of benefits over contributions has gen-erally favored higher-income recipients. How-ever, the return for all new retirees is fall-ing rapidly and will become negative forhigher-income single individuals (particularlymen) later in this decade. Single individualsretiring early in the next century face deeplynegative returns.24 This situation has led manyto question the long-term political viability ofthe Social Security program if reform is notforthcoming.
Social Security retirement and disabilitybenefits are financed primarily on a pay-as-you-go basis. At present, a 6.2 percent pay-roll tax is paid by both employers andemployees (a total of 12.4 percent) on earn-ings up to $60,000.25 The system currently hasa temporary positive cash flow. However,long-term projections of program expendituresand revenues show that on a net-present-valuebasis, Social Security is massively underfunded.At present, receipts in excess of benefit pay-ments and other expenses accumulate in theOASDI trust fund, which had an estimatedbalance of $427 billion at the end of 1994,about 130 percent of one year’s expenditures.
One of the problems with a retirement sys-tem financed on a pay-as-you-go basis is thatthe tax burden on workers increases as the
funded plans, according to the PBGC, are“collectively-bargained flat benefit plans thatdo not anticipate future salary and wageincreases in their funding operations.”21 Manybelieve that the PBGC figures understate thefunding problem because of the measures offunding adequacy that the PBGC is requiredto use.22
PUBLIC SECTOR FUNDINGOF PENSIONS
The primary concern of this statement isprivate retirement policies. However, a dis-cussion of the status of retirement savingwould not be complete without some mentionof the underfunding of pensions sponsoredby government, which is a very serious prob-lem.
Social Security Funding.23 The Social Se-curity retirement system was designed to bea universal retirement program that providesa basic retirement income through a transferfrom workers to retirees, including some re-distribution to lower-income retirees, financedlargely on a pay-as-you-go basis by payrolltaxes. In effect, it is a compact between gen-erations whereby current workers agree tosupport retirees in return for similar consider-ation in their retirement from future workers.Social Security is the most important source ofincome for the elderly and is received by92 percent of retirees. The maximum annualretirement benefit for a worker who retired atage 65 in 1994 was $13,797. It is estimated thatthe average worker qualified for about $9,972,which replaced about 43 percent of earnings.Recent budget legislation raised the tax onSocial Security benefits received by higher-income retirees (see Chapter 2).
Social Security is particularly important forlow-income retirees because it replaces ahigher share of their income. In 1994, thereplacement ratio (Social Security benefits asa share of preretirement income) averagedabout 58 percent for workers whose incomewas below average, compared with 24 per-

34
THE ECONOMIC STATUS OF THE ELDERLY AND NONELDERLY COMPARED
ments also reduced benefits for future retireesby gradually raising the age requirement forfull retirement benefits from 65 to 67 years.These changes were projected to generate alarge annual positive cash flow that wouldboost the OASDI trust funds to nearly $21trillion by 2045. The 1983 projections indicatedthat if tax rates and benefits were not changed,the trust fund would maintain a positive bal-ance until 2063 (under intermediate assump-
ratio of retirees to workers increases. Thiseffect can be minimized by building trust fundbalances that are later spent down during abulge in the retirement-age population. The1983 Social Security Amendments raised pay-roll tax rates not only to ensure the currentsolvency of Social Security retirement fundsbut also to prefund the bulge in benefit pay-ments that will be required by the retirementof the baby-boom generation. The amend-
The income of the elderly has clearly grownmore rapidly than the income of the non-elderly in the postwar period. Nevertheless,it is not easy to develop meaningful compari-sons of the current economic status of theelderly and nonelderly. On a before-tax cashincome basis, the median family unit incomeof the elderly was about 70 percent of all non-elderly in 1990 and about 50 percent of theincome of 45- to 55-year-olds, the age groupwith the highest earnings. But such figuresmay give a misleading picture of the eco-nomic status of the elderly.a To begin with, thedistribution of incomes of the elderly appearsto be quite variable; the more senior elderly,for example, generally have much lowerincomes than younger elderly. However, com-pared with the nonelderly, the elderly oftenface lower tax rates, have more wealth, andreceive significantly more noncash income.Indeed, some studies have found that the realmedian income of the elderly is comparable tothe median income for all nonelderly if suchfactors are taken into account.b Such findings
are controversial, in part, because the value ofMedicare and other noncash income is difficultto determine.
Poverty rates among the elderly have declinedsharply; government tabulations show a de-cline from 27.9 percent in 1967 to 12.2 percentin 1990.c In 1990, the poverty rate for the eld-erly would have been 36 percent higher if noSocial Security benefits had been received.d
It has been widely reported that by 1990, thepoverty rate for the elderly was actually belowthe rate for all nonelderly (13.7 percent). How-ever, the overall nonelderly rate was boostedby very high poverty rates for children. Pov-erty rates for the elderly are still above thepoverty rates for nonelderly adults. Moreover,these poverty measures do not take into con-sideration wealth and other factors that influ-ence economic well-being. Compared withyounger people, for example, the elderly facea much greater risk that their economic statuswill be adversely affected by large medicalbills.
a. For income data by age group, see Daniel B. Radner, An Assessment of the Economic Status of the Aged (Washington, D.C.:Social Security Administration, Office of Research and Statistics, May 1993), p. 32.
b. Michael D. Hurd, “The Adequacy of Retirement Resources and the Role of Pensions” (October 1993). Hurd adjustedcash incomes for such things as family size, tax liabilities, noncash income from assets (e.g., imputed rent on owner-occupied homes), and Medicare benefits and concluded that the real income of the elderly was 101 percent of the medianfor nonelderly.
c. Radner, An Assessment of the Economic Status of the Aged, p. 43.
d. U.S. Department of Health and Human Services, Social Security Administration, Office of Research and Statistics,Income of the Aged Chartbook, 1990, Supplement 1992 (Washington, D.C.: U.S. Government Printing Office, 1992), p . 10.

35
tions), sufficient to finance the bulge in retire-ment benefits caused by the baby-boom gen-eration. However, actuarial projections of thesolvency of the Social Security trust funds havecontinued to deteriorate since 1983 and wererevised down sharply again in 1994. Benefitoutflows are now projected to exceed tax in-come beginning in 2013; and the OASDI bal-ance is expected to be exhausted in 2029,thirty-four years earlier than envisioned in1983.26 Another way to look at the financialstatus of the Social Security program is to com-pare the present value of benefits expected toaccrue to all past, present, and future workersover a specific time horizon with the presentvalue of the assets (including future contribu-tions) expected to accrue over the same timeperiod. This provides a measure of the system’sactuarial deficiency. The actuarial deficiencyof the Social Security program by this mea-sure is estimated by the Office of Manage-ment and Budget to be about $1.9 trillion.
The frequent revisions in the projections ofSocial Security funding highlight the greatuncertainty about the future status of theSocial Security trust funds. Nevertheless, ifSocial Security benefits and taxes are notchanged, the most likely outcome is that theannual positive cash flow will end early in thenext century and the trust funds will be quicklyexhausted. If action is taken promptly, themeasures necessary to fix Social Security willbe less severe. Congress has alreadyenacted a gradual increase in the normalretirement age, and there are several propos-als to reduce Social Security benefits and raisetax rates. Senator Robert Kerrey and formerSenator John Danforth, cochairmen of the Bi-partisan Commission on Entitlement and TaxReform, proposed fundamental changes in theSocial Security retirement system that wouldbring future outlays and revenues to near bal-ance. However, there is substantial politicalresistance to change in Social Security at thepresent time, and it now appears that nochange will be implemented for some years.27
It should also be noted that a controversy
has arisen concerning Social Security fundingbecause the temporary positive cash flow thatis now being realized (about $69 billion forOASDI in fiscal 1995) is used to purchase debtissues of the U.S. Treasury, which appear tomerely finance government consumption. Ofcourse, the total government deficit measuresthe impact of the government budget balanceon national saving; thus, the impact of thepositive cash flow in Social Security dependson how it affects decisions on non–SocialSecurity spending and taxing. Social Securityadds to national saving only if the annualexcess of revenues over expenditures reducesthe overall budget deficit. Many argue thatthe Social Security surpluses finance spend-ing and therefore are merely an accountingdevice with little significance because they donot add to saving or encourage growth in thenation’s capital stock.28 In any case, the Trea-sury will have to increase taxes, borrow fur-ther, or cut spending in order to redeem thesefunds when expenditures begin to exceedrevenues.
Funding for Government Employee Pen-sions. Nearly 10 percent of U.S. workers arepublic employees covered by federal, state, orlocal pension programs, mostly of the definedbenefit variety. Unlike private employers, thepublic employer has no tax incentive to makepension contributions, and public pensions arenot subject to the funding requirements ofERISA or backed by the PBGC. Years ago,many public employee retirement benefits,like other current expenditures, were paidfrom general funds. But such pay-as-you-gofunding raised serious questions aboutintergenerational equity and the true cost totaxpayers of growing employment in the pub-lic sector. Today, prefinancing of publicemployee retirement benefits is generally arequirement, though regulatory details regard-ing public pensions differ substantially fromstate to state.
Government expenditures for pensionfunding compete with other public-sectorneeds and are therefore subject to budgetary

36
report found that 75 of 184 pension plans stud-ied contributed less than the actuariallyrequired amount in 1988. Others have esti-mated an average funding ratio of 80 percentacross all state and local pension plans. Unfor-tunately, data problems make it difficult to bemore precise about this issue. Nevertheless, itis clear that underfunding is a serious prob-lem for many government pensions and thatfuture tax burdens will rise sharply to over-come this situation if funding is not increased(or benefits cut). CED recommends thatdefined benefit plans sponsored by state andlocal governments be subject to minimumdisclosure and funding standards. Plansshould be fully funded, and promises thatcannot be funded should be avoided.
politics. There are many recent examples instate and local governments of politiciansattempting to address a budget problem byskipping the annual pension contribution orby altering the actuarial assumptions under-lying the funding. State and local pension fund-ing has also been adversely affected by pres-sures to use pension funds for some specialinterest, such as the financing of public infra-structure or environmental programs. Often,it seems that concern about the credit rating ofthe government’s debt is the only real con-straint on abuses of public pensions.
Although there seems to be great variabil-ity, a substantial number of state and localpensions are reported to be underfunded. Arecent General Accounting Office (GAO)
Table 3
Comparison of Initial Retirement Benefits and Contributions Made by Public-and Private-Sector Employees for Defined Benefit Plans and Social Security
Public Sector
Without WithPrivate Social Social
Item Sector Security Security
Combined Social Security and pensionbenefits as a percent of final earnings
Final earnings, $35,000 66.4% 65.4% 87.0%Final earnings, $65,000 57.6% 65.4% 73.3%
Total contributions to Social Security andpensions as percent of final earnings
Final earnings, $35,000 6.2% 7.6% 11.3%Final earnings, $65,000 5.5% 7.6% 10.6%
Ratio of initial benefit to contributionin final year
Final earnings, $35,000 11 to 1% 9 to 1% 8 to 1%Final earnings, $65,000 10 to 1% 9 to 1% 7 to 1%
SOURCE: William J. Wiatrowski, “On the Disparity Between Private and Public Pensions,” Monthly Labor Review (April 1994): 3–9.

37
Federal employee pension programsunderwent substantial reform in the 1980s,providing less generous defined benefit pack-ages that are expected to limit the growth offuture liabilities. Moreover, stability in fed-eral civilian employment and downsizing bythe military should reduce the growth inpension benefits. New federal employees andpreviously hired workers who joined the newFederal Employee Retirement System are nowcovered by Social Security, a reduced definedbenefit plan, and a defined contribution plan.Given present levels of employee andemployer contributions as well as statutoryfunding by agencies, these civilian and mili-tary retirement programs are expected to main-tain solvency. But a substantial unfundedliability exists for earlier service under theolder Civil Service Retirement System. Indeed,the actuarial deficiency for civilian and mili-tary pensions combined is estimated to be $1.5trillion. (The actuarial deficiency at the end of1992 was $881 billion for the civilian and $619billion for the military retirement systems.)Moreover, federal pension trust funds are in-vested in U.S. Treasury debt. Therefore, aswith Social Security, at some future point theTreasury will be required to tax or borrow toredeem these pension funds.29
It is often pointed out that where there is a“problem” public employee pension program,it may be the case not only that there isunderfunding but also that too much has beenpromised. When strapped for cash, some gov-ernments have substituted pension increasesfor pay raises in order to satisfy the demandsof workers, thereby magnifying funding prob-lems and passing on the burden to future tax-payers.30 But as a general rule, public sectorpensions do not appear to be more generousin the initial years than private sector pensionswhen individual contributions are taken intoaccount (see Table 3).31 However, the fact thatpublic sector pensions are more likely to befully indexed for inflation makes such pen-sions more attractive over a longer period.32
Of course, indexing for inflation also raisesthe cost of such plans substantially comparedwith the cost of plans that are not indexed.33
EXPECTATIONS OF THE BABYBOOMERS FOR RETIREMENTINCOME
Past experience has encouraged each gen-eration of Americans to anticipate an improve-ment in its living standards. The experience ofthe elderly population in the United States isno different. In fact, their economic status hasimproved both in absolute terms and relativeto that of younger workers (see Table 4). Themedian real income of the nonelderly is esti-mated to have risen 31.8 percent between 1967and 1990, whereas the income of the elderly(adjusted for family size) is estimated to haverisen 82.8 percent. The rapid rise in the in-come of the elderly relative to that of thenonelderly was largely due to increases inSocial Security benefits, increased coverageby private pensions, and growing income fromassets.34 The question remains: How have thegains of current retirees affected the expecta-tions of workers? Polls seem to present con-tradictory answers. Many younger workersreport that they do not expect to benefit fromSocial Security, but they generally stronglyoppose its elimination.
The recent experience with declining sav-ing rates and rising female participation in the
SOURCE: Daniel B. Radner, An Assessment of the EconomicStatus of the Aged, p. 38.
Table 4
Annual Percent Change in Real MedianFamily Unit Income Adjusted for Size
Under 65 orYears Age 65 Over
1967–1972 3.1% 4.9%
1972–1979 1.1% 1.9%
1979–1984 -0.3% 3.4%
1984–1990 1.0% 0.9%
Average change, 1967–1990 1.2% 2.6%
Total change, 1967–1990 31.8% 82.8%

38
Numberof Contri- butoryYears
labor force suggests that families will go togreat lengths to maintain and improve livingstandards. In the past, retirees have used po-litical power to enhance their living standards,and there is no reason to assume that this willnot happen in the future. Because of theintergenerational compact involved in SocialSecurity, many workers view their entitlementto future Social Security benefits as inviolable,like a property right.
If future retirees expect their living stan-dards to improve as much as those of earliergenerations of elderly, they may be in for arude awakening unless pension saving issharply increased. However, as we indicatedin Chapter 2, there is evidence that many work-ers do not have adequate information aboutpension saving and that, consequently, theirexpectations about their economic circum-stances in retirement may be unrealistic.
HOW MUCH SHOULD WORKERSSAVE FOR RETIREMENT?
Information on the savings needed to pur-chase a specific retirement annuity is avail-able. Given assumptions about investmentincome, wage growth, age at retirement, andother factors, one can also estimate therequired share of income that must be savedto achieve a specific retirement annuity. Forexample, the data in Table 5 indicate that anindividual’s annual private pension savingwould have to be 13 percent of wages over athirty-five–year period in order to receive atage 65 a fully indexed private pension thatpaid 50 percent of final pay. As Table 5 dem-onstrates, early retirement and a reduction inthe number of contributory years have a largeimpact on the required saving percentage.Another crucial factor affecting required sav-ing is the assumed rate of return on theinvested funds. The example in Table 5 is basedon a real return of 4 percent. By employing amore aggressive investment strategy (e.g., aportfolio allocation that places a higher per-centage of savings in equities and a lowerpercentage in money market funds), it may be
possible to exceed this rate of return andachieve the same replacement ratio with lowercontributions (see “Retirement Benefits andSaving Requirements”).35 Thus, it is importantthat participants understand the relation be-tween risk and return.36
Available data on pension saving suggestthat very few workers have an annual privatepension saving rate anywhere near that re-quired to generate a pension of 50 percent offinal pay. In 1991, the combined total contri-bution to private pensions by employers andemployees appeared to be about 2.9 percentof disposable personal income, down signifi-cantly from about 3.9 percent in 1980. Part ofthe decline after the mid-1980s was due tonewly enacted full-funding limits. The aver-age business contribution to pension and sav-ing plans is about 3.6 percent of payroll for all
Retirement Age
SOURCE: These estimates were provided by Don Ezra,managing director of Frank Russell Company. The underly-ing assumptions are as follows: (1) The investment return is4 percent greater than the rate of inflation. (2) Salaryescalation throughout the working career is 1 percent higherthan the rate of inflation. (3) Pensions are paid monthly solong as either the retiree or the spouse of identical age isalive. (4) Mortality after retirement is expected to follow the1983 Group Annuity Mortality Table.
Percent of Earnings that Must BeSaved to Finance a Fully IndexedPension of 50 Percent of Final Pay
55% 60% 65% 70%20 34% 31% 28% 25%
25 25% 23% 21% 18%
30 19% 18% 16% 14%
35 15% 14% 13% 11%
40 —% 11% 10% 9%
Table 5

39
DesiredRetireeIncomeas aPercent ofAnnualSalary
industries and probably about 5.5 percent forall industries that have pensions.37 Of course,these figures do not include contributions toSocial Security, which are quite large; but formost retirees, Social Security will not provideadequate income in retirement.
Unfortunately, the need for additional pri-vate saving does not appear to be well under-stood, though some pension plans (especiallydefined contribution plans) provide workerswith adequate information. Many workers areunaware of the size of their employer-providedpensions and the additional retirement savingrequired to achieve their objectives for retire-ment income.
UNDERSAVING BY BABY BOOMERSHow much are the baby boomers under-
saving on average? The answer depends inpart on how much income they expect inretirement. Perhaps some baby boomers are
willing to accept a very modest standard ofretirement income. A recent study by theCongressional Budget Office (CBO) used thefollowing standard to judge the adequacy ofongoing preparation for retirement: Will thebaby boomers’ real income and wealth in re-tirement exceed that of their parents? Thestudy answered this question in the affirma-tive for several reasons: (1) The preretirementreal income of the baby boomers is expectedto exceed that of their parents, thereby auto-matically triggering higher Social Security orpension benefits. (2) Higher workforce par-ticipation rates by women of the baby-boomgeneration will increase their eligibility forpensions. (3) Changes in pension regulationspertaining to vesting and participation makeit more likely that the baby boomers willreceive a pension. (4) The baby boomers arelikely to inherit more wealth.38
Most retirees will require more income thanprovided by Social Security. Individuals fre-quently ask: How much retirement saving isnecessary? Fortunately, a reasonably accurateanswer can be provided, given a number ofassumptions. Once an individual has decidedon a desirable level of retirement saving, theshare of earnings that should be set aside forretirement by the individual and/or anemployer depends on such factors as whetherthe retirement benefits are adjusted for infla-tion, the number of years that pension contri-butions are made, the return on investments inthe retirement fund, and the expected age ofretirement. In the example shown here, therequired saving rate is lower than in the ex-ample presented in Table 5 even when theretirement income target (50 percent of finalpay, indexed for inflation) is identical. Theprincipal reason is that a higher investmentreturn (6 percent after inflation until retire-
Years to Retirement
10 15 20 25 30 35
30% 36% 21% 13% 9% 6% 4%
40 48 27 18 12 8 6%
50 60 34 22 15 10 7%
60 72 41 26 18 12 9%
70 84 48 31 21 14 10
ment and 5 percent after inflation thereafter) isassumed in this example, reflecting a portfolioallocation that takes on a higher degree of risk.
Required Saving as a Percent of Income
RETIREMENT BENEFITS AND SAVING REQUIREMENTS
SOURCE: T. Rowe Price Associates. The underlying assumptions are as follows: (1) A 9 percent annual investment returnprior to retirement and 8 percent after retirement, (2) an inflation rate of 3 percent, (3) retirement income lasts thirty years.

40
nomic well-being as they enter retirement.Given the rise in expectations brought aboutby the prosperity of current retirees, thisdecline in living standards may be widelyviewed as unacceptable.
How much saving would be necessary for thebaby boomers to maintain their preretirement liv-ing standard in retirement? An analysis thataddresses this question was prepared by Pro-fessor B. Douglas Bernheim; it indicates thatthe baby boomers are very poorly preparedfor their future retirement.42 Employing amodel of life-cycle behavior with currentlyprescribed Social Security benefits, and usingsurvey data on household assets and consump-tion, Bernheim estimated that households witha head age 35 to 44 were accumulating assetsat only 34 percent of the required rate. Thus,the baby-boom generation needs to triple rates ofasset accumulation. He also found that savingadequacy is lower for single individuals andtends to decline as income rises, reflecting theprogressivity of Social Security benefits andinadequate private pension saving. Moreover,if future Social Security benefits are cut evenmoderately, the required increase in savingwill rise substantially.
The Bernheim study did not take intoaccount the fact that many retirees have sub-stantial equity in their homes. The increase insaving needed to maintain preretirement liv-ing standards could be less if the baby boomerswere willing to cash in on their equity in hous-ing when they retire. Home equity is esti-mated to account for about 70 percent of thetotal wealth of the elderly; therefore, homeequity conversion, by sale or reverse mort-gage, is a possible means of significantlyincreasing consumption by retirees. But as wenoted earlier, recent projections indicate thatthe baby-boom generation is not likely to ben-efit from a rise in the real value of housing.Moreover, studies show that the housing turn-over rate among the elderly is very low, eventhough many retirees are fully aware of thepotential for equity conversion.43 Some eld-
However, in keeping with the CBO’s prac-tice of not forecasting Congressional actions,the evaluation of the future well-being of babyboomers employed current-policy fiscal as-sumptions. The study assumed no change inpromised Social Security benefits, even thoughcurrent Social Security benefits cannot be main-tained without a very sharp rise in SocialSecurity taxes, given demographic trends. Arealistic projection needs to address the taxburden on workers and the political and eco-nomic pressures to reduce benefits. In thisrespect, the CBO policy assumption begs thequestion of whether the retirement income ofbaby boomers will be satisfactory.
A recent study based on generationalaccounts, which takes into consideration thefinancing of government-projected liabilitiesfor retirement and other programs, concludesthat the majority of baby boomers will actu-ally have a lower standard of living in retire-ment, in absolute terms, than their parentsnow enjoy. This is because currently legis-lated government policies (e.g., for retirementand health care) have passed forward a mas-sive burden to future generations. Conse-quently, a sustainable fiscal policy will requiresubstantial spending cuts and tax increases.39
It has also been pointed out that currentretirees have enjoyed fortunate circumstancesthat are not expected to benefit baby boomers.For example, many current retirees had largewindfalls from the rise in housing prices andthe decline in the real value of liabilities (mort-gages) resulting from inflation. In contrast,recent economic research suggests that thebaby boomers will experience a decline in thereal value of their investment in housing,which represents a very large portion of theirwealth.40 The widespread use of adjustable-ratemortgages also makes it less likely that theywill benefit as their parents did from increasedinflation.41
Recognizing the great uncertainty aboutlong-term economic trends, it seems that themost likely outcome is that the baby boomerswill experience a very large decline in eco-

41
erly become emotionally attached to theirhomes and familiar surroundings. Others wishto retain home equity as a reserve for meetingcatastrophic medical expenses. Therefore,although housing equity should be taken intoconsideration when measuring the well-beingof retirees, the existence of home equity maynot greatly affect retirees’ perceptions aboutthe adequacy of their income.
These facts on demographic trends, pri-vate retirement saving, the funding ofprivate and public pensions, and projectedretirement income strongly support the con-clusions that retirement saving is inadequate
and that increased emphasis on private sav-ing is necessary both to ensure the economicsecurity of future retirees and to avoidunreasonable burdens on future workers.Although precise estimates of individual sav-ing needs are inherently controversial, in partbecause of the difficulty of identifying rea-sonable retirement needs, CED believes thata massive increase in private retirement sav-ing over the next decade is necessary if weare to avoid a crisis in retirement finance inthe future. Clearly, Congress needs to takesteps to remove current disincentives forretirement saving (see Chapter 5).

42
Government tax policy is the major tool forencouraging retirement saving. For manyyears, federal income tax laws have includedprovisions to encourage business and indi-viduals to make contributions to retirementfunds. However, the deferral of taxes on pen-sion saving is very controversial and haschanged radically over time. Recent changesthat have sharply limited tax benefits for pen-sions were motivated by rising political pres-sures to reduce the huge federal budget defi-cits and by the belief that tax incentives are awindfall because they have little effect on sav-ing.
THE TAX BASE CONTROVERSYThe treatment of pensions in the federal
income tax system is central to the long-standing debate about the economic impactand equity of a system that includes saving inthe tax base. Some favor a consumption-basedsystem that exempts saving from taxationeither because of its desirable economiceffects (i.e., because it encourages saving andlong-term economic growth) or because theybelieve that the exemption will improve taxequity. Proponents of the basic philosophyunderlying an income tax system generallyespouse the traditional view that all incre-ments to available resources should be taxed(i.e., that taxable income is the sum of con-sumption plus the change in net worth).Although this approach holds that all income,including saving, should be taxable, in prac-tice, capital gains are generally not taxed untilrealized; and numerous tax deductions,exemptions, and credits have been added to
the present income tax system in order toachieve particular objectives. Thus, forexample, interest payments on mortgages aredeductible in order to encourage home own-ership, and pension contributions are deduct-ible in order to encourage saving. Some ofthese practices have changed the character ofthe income tax, moving it in the direction of aconsumption tax. Of course, if the income taxwere replaced by a consumption tax, specialtax provisions for pension saving would notbe needed because the exclusion of savingwould be the normal tax treatment.
The debate concerning the appropriatetax base has again entered the politicalarena because of growing support for theconsumed-income tax, which would exemptsaving from taxation. The issue is whether theUnited States should place greater reliance ontaxing consumed income, rather than com-prehensive accrual income that includes allconsumption and increases in net worth. Thereis no consensus among scholars or in the busi-ness community on this issue.
We do not propose to address the debateabout the tax base in this policy statement.1
This statement is deliberately focused onretirement saving. Of course, we recognizethat the general debate is relevant to the dis-cussion of retirement saving and fiscal policymore generally. With respect to retirement sav-ing, tax preferences are seen as a subsidy orincentive by those who view income as theappropriate tax base, whereas the absence oftax-qualified retirement savings is seen as apenalty or disincentive by those who viewconsumed income as the proper tax base.2 The
Chapter 4
Designing Tax Incentivesto Raise Saving

43
policy position that we take on retirement taxpreferences in this statement is that with theexisting income tax, the case is compelling forbroadening and simplifying the rules relatingto tax-qualified retirement savings. Even ifthis constitutes a subsidy or incentive, wenevertheless endorse it as being in the publicinterest.
Without taking a position on the tax basecontroversy, we assume in this report that thefederal government will continue to rely onthe present income tax system.
TAX INCENTIVES AND SAVINGA critical question about the current prac-
tice of employing income tax preferences toencourage pension saving is: How effectiveare these incentives? The impact of tax incen-tives on pension saving is part of the broaderissue of the determinants of saving, which hasconfounded scholars for generations. Econo-mists have approached the issue by asking:What is the effect of changes in the after-taxrate of return on private saving? Theory alonedoes not provide the answer. An increase inthe rate of after-tax return lowers the price offuture consumption, thereby increasing theincentive to save. But an increase in the returnon saving also reduces the amount of savingnecessary to achieve a given level of futureconsumption, thereby reducing the savingincentive for target savers.3 Empirical studiesintended to determine which effect predomi-nates tend to support the view that net savingdoes increase when the after-tax return rises;however, this finding is not unanimous andnearly all studies find that the effect is quitemodest.
The recent experience with IRAs, whichgrew rapidly when introduced but much lessso after eligibility for a tax deduction wasrestricted to lower-income households, haspresented researchers with an opportunityto study the effect of targeted tax incentiveson saving. Before its implementation, mosteconomists expected that the tax advantageswould generate a sharp rise in IRA balances
(as happened), but many feared that IRAswould not produce a significant increase intotal personal saving. This is because the taxbenefit could be received by households thatmerely shift existing savings into IRAs and byhouseholds that borrowed to finance IRA con-tributions. In either case, taxpayers wouldreceive a windfall in the form of lower taxeswith no net increase in aggregate householdsaving. Many empirical studies have been un-dertaken in an attempt to determine how muchof IRA saving was new saving. Several, thoughnot all, of these studies have concluded thatIRAs and other tax incentives were powerfulincentives for the creation of personal saving.4
A far more demanding and relevant test ofthe success of tax-preferred saving incentivessuch as IRAs is their effect on national saving.National saving is the sum of private saving(by individuals and business) and governmentsaving (or dissaving). The impact on nationalsaving is important because, together withinflows of foreign capital, national savingprovides the funds for investment. Whether atax incentive generates an increase in nationalsaving depends on the amount of additionalprivate saving, the amount of revenue lost bythe government, and whether governmentspending is affected by the loss in revenues. Ifthe new private saving does not exceed thegovernment’s revenue loss, national savingwill not increase and might actually fall, pro-viding that the deficit rises by the amount ofthe revenue loss. Of course, unlike the responseof private saving to tax incentives, the use offederal revenues (for spending or for deficitreduction) is a politically determined issuethat depends on the current priorities.
Putting aside the political issue concerningthe government’s use of revenues, the impactof tax preferences on national saving dependson the taxpayers’ marginal tax rate and on thefraction of contributions to IRAs and otherincentives that is new saving (i.e., that doesnot represent a shift into IRAs of othernon-tax-deferred saving). If, for example, 50percent of the contribution to pension funds is

44
Therefore, it is reasonable to conclude thatcertain existing tax incentives for retirementsaving, as well as employer contributions topension plans, are likely to increase nationalsaving.
DESIGN OF TAX-PREFERRED SAVINGINCENTIVESIt is important that future saving incentives becarefully designed to maximize their net ben-efit. The shifting of funds from existing savingto qualified saving and borrowing to financecontributions should be discouraged as muchas possible. Some have suggested, for example,that tax-preferred saving incentives could bemade more effective by making deductionsavailable only for increases in saving or onlyfor saving above a threshold that rises withincome.7 The idea is that a tax incentive shouldreward greater efforts to save.
It is also important that the tax incentive bedesigned so that those who have discretion toincrease saving qualify for the incentive.Using data on educational attainment (whichis correlated with income), one study foundthat college graduates and those who alreadyhave pensions respond positively to savingincentives, whereas those without collegedegrees may reduce saving in response totax incentives. Apparently, lower-incomeindividuals are much more likely to behave astarget savers. The study concluded that “apolicy that provides tax incentives for savingexclusively for lower-income householdsexcludes those households that are most likelyto increase saving in response to this policy;indeed, it is conceivable that such policiescould actually reduce aggregate personal sav-ing.”8 Of course, if an incentive does not gen-erate a significant increase in personal saving,there is little hope that national saving willrise. Thus, pension-related tax incentivesthat decline as income levels rise may beself-defeating if the goal is to encourageaggregate pension saving.
In some instances, the motive for taxchanges that have reduced the tax benefits
new saving generated by the tax incentiveand the relevant effective marginal tax rate is30 percent of income, a $100 contribution tothe pension fund could cause national savingto rise by $20 because the tax incentive wouldgenerate more dollars of new private savingthan the government’s revenue loss.
Because it is difficult to determine whatproportion of contributions is new saving, it isnot surprising that the results of empiricalstudies on the net impact of IRAs and othersaving incentives on national saving are notunanimous. However, it is significant that arecent study by Poterba, Venti, and Wise, basedon the U.S. experience with 401(k) plans, con-cluded that these tax-deferred saving incen-tives succeeded in generating substantial newsaving sufficient to significantly increase notonly personal saving but also national sav-ing.5 Moreover, researchers who have foundthat tax incentives created little or no newsaving, because of the induced shift fromexisting assets, generally agree that nationalsaving should rise in the long run. Forexample, recent model simulations of long-term outcomes by Engen, Gale, and Scholzstrongly support the finding that over time,the impact on national saving will be posi-tive.6
Thus far, we have discussed the effects oftax incentives, such as IRAs, that are designedto encourage retirement saving by individu-als. However, tax deductions for employercontributions made from current-year earn-ings may have a larger positive impact onnational saving. A high proportion ofemployer contributions to retirement plans arelikely to be new savings, that exceed thegovernment’s revenue loss, given the usualassumption that wages would be higher inthe absence of retirement benefits. Employeesare not likely to change their saving behaviorin response to a change in employer contribu-tions because they frequently have very littleinformation about those contributions;employees are more concerned about the sizeof the benefit than about how it is financed.

45
available for high-wage individuals is to com-pensate for the fact that in any given year,pension tax policies provide considerablyfewer benefits for low-wage workers. Indeed,some have cited the distribution of pensiontax benefits as reason to increase taxes on pen-sion saving.9 However, in a given year, manyof those who do not benefit are younger work-ers who are not yet covered by a pension butwho will ultimately be covered and benefitfrom the tax treatment of pensions. Measuredin terms of lifetime earnings, rather than earn-ings at a specific time, pension tax benefitsappear to be more evenly distributed.10
We conclude that pension tax policy isnot a good instrument for redistributingincome. Proposals for reducing pension taxbenefits for high-wage workers are clearly notdesirable from the viewpoint of increasingnational saving and may not be effective evenfrom the viewpoint of distributional policy.Moreover, if society finds the distributionalimplication of pension policies worrisome, thiscan be fixed by other changes in taxes (e.g.,rates or exemptions).
On the issue of the design of tax-deferredincentives, CED concludes that private pen-sion participation and saving should beencouraged, but in a manner that is mostlikely to raise national saving as well. Otherlegitimate concerns, such as income distri-bution, cannot easily be addressed with pri-vate pension policies without defeating abasic objective of retirement policies: toincrease saving.
PROPOSALS FOR COMPULSORYSAVING PROGRAMS
It has frequently been observed that somehouseholds are savers and others, includingsome middle-income households, do little orno saving. Moreover, it appears that the be-havior of these nonsaving households changeslittle, if at all, in response to incentives to save.Consequently, some scholars have proposeda mandatory qualified saving program — arequirement for a minimum rate of saving,
such as 2 percent of disposable income, for allworkers — in order to make sure that mosthouseholds contribute to national saving andmake preparations for the future. It is arguedthat this approach would be very effective inraising national saving because those who donot save would be forced to save and wouldhave little opportunity to shift funds fromexisting accounts to qualified accounts. Thosewho already save the required minimumwould not be affected by the proposal.11
A mandatory saving program probablywould be integrated with Social Security,either as a private supplement to Social Secu-rity or as a substitute for the part of SocialSecurity that provides benefits above basicneeds. Either approach would increase fund-ing for retirement, though the former is likelyto make a greater contribution to saving. Pro-ponents of mandatory saving plans also arguethat the fact that individuals would own andcontrol the funds would make mandatory con-tributions more attractive than mandatorytaxes paid to Social Security.
We do not dispute the idea that mandatorysaving programs could be more effective inincreasing private saving than other currentlyavailable options. But policies that force indi-viduals to take certain actions often have greatcosts to society relative to policies that merelyencourage certain behavior. For example, arequirement for annual contributions couldcause considerable inconvenience for familiesexperiencing temporary economic hardships.Moreover, the American public instinctivelyresists any compulsion; therefore, it is doubt-ful that proponents of compulsory saving pro-grams could garner widespread political sup-port unless large net social benefits are clearlydemonstrable. Thus, although CED believesthat proposals for mandatory saving pro-grams merit further study, we do notendorse the idea at the present time. Thenation should consider a mandatory programonly if other options for increasing saving,such as improved availability of pensioninformation and tax incentives, prove to beineffective.

46
In its efforts to reduce the budget deficit dur-ing the last decade, Congress often sought toraise revenues by reducing tax expenditures inthe budget. Tax expenditures were defined bythe Congressional Budget and ImpoundmentControl Act of 1974 as “those revenue lossesattributable to provisions of the federal taxlaws which allow special exclusions, exemp-tions or deductions from gross income, orwhich provide a special credit, a preferentialrate of tax or a deferral of tax liability.” TheJoint Tax Committee, which has responsibilityfor estimating the magnitude of tax expendi-tures, reports that the annual revenue loss asthe result of the preferred tax treatment ofpensions amounted to $56 billion in fiscal1993, making pension contributions the larg-est tax expenditure in the budget. The JointTax Committee’s estimate of tax expendituresfor retirement plans is the annual aggregate ofrevenue losses measured on a cash-flow basis.
In principle, legislation designed to reduce taxloopholes may improve economic efficiency ifthe added revenues are used to lower statu-tory tax rates. However, it is clear that themethod of measuring tax expenditures is mis-leading when applied to pension saving. Aproper measure would balance taxes paid onfuture benefits against the immediate revenueloss; that is, it would use a life-cycle approach
rather than the annual cash flow. This is be-cause the calculation of annual cash flow isaffected by changes in pension funding levels,trends in coverage and benefits, and the agingof the population, factors that have recentlybiased estimates upward. It is also important torealize that currently reported tax expendituresare not a true measure of forgone revenue (theamount of revenue that would be realized ifthe tax preference were ended) because the taxexpenditure calculation does not take intoaccount any taxpayer response to the increasesin effective tax rates. If the preferential taxtreatment of pensions were eliminated, suchresponses would surely lower the revenue gainimplied by the tax expenditure estimate.
More important than these measurementissues, however, is the fact that the economicconsequences of pension tax expenditures aredifferent from those of other tax expenditures.Retirement saving has very positive socialeffects as well as important benefits for futureretirees. Moreover, as explained earlier in thischapter, the preferential tax treatment of pen-sion savings also makes an important con-tribution to national saving, which in turnimproves the growth and competitiveness ofthe U.S. economy. This cannot be said aboutmany other tax expenditures that encourageconsumption rather than growth.
deficit-reducing tax increases. (See “TaxExpenditures and Pension Tax Preferences,”below.) We also believe that the government’smeasure of the subsidy is exaggerated becausethe present value of future revenue gains isnot taken into account.
CED has long advocated a change in spend-ing and tax priorities in order to eliminate thefederal budget deficit.13 We have said thatamong major policy alternatives, a reductionin the budget deficit is the most certain andeffective means of increasing national saving.In taking this position, however, CED hasargued that the purpose of reducing budget
TAX EXPENDITURES AND PENSION TAX PREFERENCES
THE BUDGET DEFICITAs we mentioned earlier in this chapter, a
number of tax changes were enacted duringthe last decade that have discouraged pensionsaving. The primary purpose of these taxchanges has been to increase government rev-enues in order to reduce the federal budgetdeficit.12 In seeking additional revenues, policymakers have often turned to the federalgovernment’s list of tax expenditures, whichincludes tax preferences for pension saving.However, in our view, pension tax expendi-tures are not an appropriate target for

47
deficits is to increase national saving, whichis needed to boost investment spending andto stimulate more rapid growth in productiv-ity. Therefore, how the deficit is reduced isimportant. Deficit-reduction policies shouldgive first priority to cuts in real spending.Although taxing private pension saving wouldreduce the budget deficit, such taxes are notan effective method of raising national savingbecause they reduce private saving. In con-trast, taxes on consumption reduce the deficitwithout discouraging private saving and aretherefore a more effective tax tool for increas-ing national saving.
CED agrees that further reductions in thebudget deficit should be a high national pri-ority. We believe that there is room for morespending cuts in the budget, certainly suffi-cient to offset any net increase in the budgetdeficit resulting from reforms of retirementlaw recommended here. This statement pro-poses legislative changes that both reduce cur-rent budget deficits (e.g., in Social Security)
and increase current budget deficits (e.g., fullfunding of pensions). The short-term net defi-cit effect of these changes is unknown, but it isprobably quite small. More important, thereforms recommended here will increasenational saving and investment and therebyachieve the objectives sought by a reductionin the budget deficit.
CED has noted elsewhere that any seriousprogram of long-term spending restraint mustsubstantially reduce the growth of entitlementand transfer programs, which have been themajor source of budget growth.14 As a practi-cal political matter, it may also be necessary toraise taxes in order to enact further deficit-reducing measures. However, we believe thatthe desire to reduce current-year deficitsshould not lead to a political decision toincrease taxes on retirement saving. Such apolicy would lose sight of the economic ratio-nale for reducing the deficit: to increasenational saving in order to improve the growthand competitiveness of the economy.

48
Government policy toward private retire-ment saving has traditionally consisted of twobroad features: First, under the Internal Rev-enue Code, savings for retirement have beenaccorded favorable tax treatment: deferral ofincome taxes on contributions and on the in-vestment earnings derived from them. Thesecond general feature has been regulation ofplan design and conduct under the InternalRevenue Code and federal labor law.1
FAVORABLE TAX TREATMENTSince the 1920s, employer and (under vari-
ous arrangements) employee contributionsto pensions have been deductible fromcurrent-year income up to certain limits. How-ever, taxes are merely deferred; taxes on con-tributions and invested earnings become pay-able upon distribution of retirement benefitsto the employee. The Internal Revenue Coderequires compliance with participation, vest-ing, and funding rules in order to qualify aplan for tax benefits. This favorable tax treat-ment of income set aside for pensions is arecognition of the importance of retirementincome to the economic security of retireesand the contribution of retirement saving tothe national economy as a source of invest-ment funds.
FEDERAL REGULATIONLabor law sets out mandatory requirements
for all private pension plans, whether quali-fied or not. These requirements, which coverparticipation, vesting, funding, reporting, andfiduciary responsibility, came about largely inresponse to rapid growth in the number of
pension plans, from 400 in 1925 to more than370,000 by 19742 (when there was a major over-haul of regulation), and the heightened con-cern about potential abuses of pension taxpreferences. The principal factors that moti-vated federal involvement were:
• Pension promises made by firms toemployees could be (and occasionally were)revoked.
• Plans eligible for preferential tax treatmentcould be established solely for the benefitof certain key company employees, therebyraising issues of tax equity.
• Employees could be excluded from partici-pation through restrictions on age andlength of service combined with timely ter-minations.
• Pension benefits distributed to key employ-ees were sometimes viewed as excessive inrelation to perceived retirement needs.
• Plans were often underfunded relative totheir future liabilities.
• Plans were overfunded in some cases forthe purpose of tax avoidance.
CED agrees that some government inter-vention in the private pension system is calledfor. However, the pension regulations thathave been enacted place excessive limits onthe ability of individual plans to be tailored toindividual needs, are much too complex, havebeen far too unstable, and seek to achieve toomany goals, some of which are of little orno benefit to society. Indeed, many regula-tions currently on the books conflict with thegoals of pension policy as CED sees them.
Chapter 5
The Regulatory Tangle:Proposals for Simplification

49
We believe that the basic goal of pensionpolicy is to ensure the economic security ofthe elderly by encouraging saving. In ourevaluation of present pension regulations andin our recommendations for reform, CED takesthe view that pension regulation must bestreamlined, simplified, and designed toachieve six basic objectives:
1. Provide retirement plans for the largest-possible number of workers.
2. Ensure that pension plans meet appropri-ate fiduciary standards and are funded tofulfill pension promises.
3. Encourage individual saving by makingretirement saving opportunities availableto all workers through deferred taxes oncontributions and earnings and by pro-viding all workers with realistic informa-tion on their retirement saving needs,resources, and options.
4. Place simple and reasonable limits on taxpreferences received by any individual(i.e., a single overall limit on eligible con-tributions indexed to inflation) and a limiton benefits received from a qualifieddefined benefit plan.3
5. Preserve retirement saving and pensionrights by discouraging preretirementwithdrawals and by improving the port-ability of pension assets.
6. Compensate for the rise in life expect-ancy by encouraging retirement at a laterage and by reducing work disincentivesfor the elderly who receive retirement ben-efits.
Simplifying pension regulation to achievethese objectives will also result in much loweradministrative costs than under the currentregulations.
ERISA AND SUBSEQUENTLEGISLATION
Beginning in the 1930s, Congress movedgradually to regulate pensions. Nondiscrimi-nation rules and limits on funding of defined
benefit plans were already in place by thetime the Employee Retirement Income Secu-rity Act of 1974 (ERISA) was passed. Thisextremely complicated legislation was amajor overhaul of pension law and, togetherwith numerous amendments, remains thebasic pension law today. (The Appendix pre-sents the chronology of pension legislation ingreater detail.) ERISA addressed all aspects ofretirement plan design and funding; its pri-mary goal was to broaden pension participa-tion and ensure the deliverability of pensionpromises.
To achieve these goals, ERISA establishedage and service rules designed to make retire-ment plans available to a greater number ofrank-and-file employees and vesting rules toincrease the probability that benefits wereactually received. It established fiduciary stan-dards for all plans, minimum-funding rulesfor defined benefit plans, and insurance toprotect participants against the loss of pen-sions. ERISA required that this insurancebe funded by employer premiums and cre-ated a new government insurance agency, thePension Benefit Guaranty Corporation (PBGC),to administer it. ERISA also gave workerswhose employers did not offer a retirementplan a chance to enjoy tax-favored retirementsaving by creating IRAs. ERISA was followedby legislation in 1978 and 1981 creating newretirement-saving vehicles, including 401(k)plans, and broadening access to others (per-mitting IRAs for all workers).
At the same time, other provisions of ERISAand subsequent legislation have discouragedthe growth of retirement savings. ERISAplaced limits on contributions to all pensionplans and penalized excessive individual ben-efits from defined benefit plans. Nevertheless,until 1982, it could be argued that the inherenttension between limiting immediate federalrevenue losses and encouraging retirementsaving had resolved itself in favor of the lat-ter. However, the Tax Equity and FiscalResponsibility Act of 1982 (TEFRA) markedthe beginning of a change in priority. TEFRA

50
and most subsequent important changes topension regulations were legislated in anenvironment of large federal budget deficitsand focused primarily on limiting immediatefederal revenue losses. Consequently, TEFRAand successive laws passed almost annuallyduring the last decade have concentrated onincreasing the stringency of contribution andbenefit limits and erecting ever more elabo-rate rules to safeguard against discrimination.These funding and benefit restrictions arebacked by tax penalties for noncompliance: a10 percent excise tax on excess contributionsand a 15 percent tax on excess distributions(annual benefits in excess of $148,500 in 1994).
Some parts of ERISA and subsequent legis-lation have had beneficial effects. But pensionregulation has also had detrimental conse-quences:
• It has sharply raised the cost of administer-ing retirement plans, with a disproportion-ate impact on smaller defined benefit plans.This trend has coincided with a steepincrease in the number of terminations ofdefined benefit plans.
• It has significantly limited pension contri-butions, undermining the ability of someplans, even those that are currently healthy,to make good on their pension promises inthe future. This has contributed to the grow-ing underfunding problem.
The complexity of private pension regula-tion in the United States cannot be exagger-ated. For example, the nondiscrimination rules,which are over 600 pages long, require com-plex numerical calculations for every employeeeach year. To ensure compliance with theseand other provisions of pension regulation,plan administrators must hire an army of law-yers, actuaries, and accountants, who oftenseem to be the major beneficiaries of the legis-lation. As an industry publication noted:“There are currently penalties for putting toomuch or too little into a plan, taking too muchor too little out of a plan, and receiving ben-efits from a plan too early or too late.”4 Somelegal experts have suggested that regulations
are now so complex that it may be impossiblefor individual pension plans to be in compli-ance with all of ERISA’s provisions.
REGULATIONS LIMITING PRIVATEPENSION CONTRIBUTIONS ANDBENEFITS
Regulations enacted in the last decade orso reduced pension saving in several ways,including lowering the funding limits ondefined benefit plans, limiting annual contri-butions and benefits for any individual, andintroducing complicated new discriminationtests that sharply raised the administrativecost of delivering pensions, thereby discour-aging their use. We deal here with only themost pernicious of these regulations. (Esti-mates of the cost of these regulations areincluded in the last section of this chapter,“Rising Regulatory Costs Discourage PensionSaving,” beginning on page 64.)
There are two broad classes of pensions:defined benefit plans and defined contributionplans. The essential difference is that the obli-gation for a defined benefit plan isexpressed in terms of a benefit (the contribu-tions being variable), whereas the obligationfor a defined contribution plan is expressed interms of contributions to the pension fund(the benefit being indeterminate). Conse-quently, problems of underfunded pensionpromises (discussed in Chapter 3) arise onlyin the case of defined benefit plans.
The primary pension plan for larger andolder firms is generally of the defined benefitvariety. The design and funding of these plans(see “Estimating Liabilities and Funding forDefined Benefit Plans,” pages 52-53) are quitecomplicated, in part because they are heavilyregulated and their benefits are partially guar-anteed by the PBGC. Many employees preferthis type of plan because the risk and respon-sibility for providing the benefits fall on theemployer and because the amount of the pen-sion, usually based on years of service multi-plied by a percentage of compensation or aflat dollar amount, is known with greater cer-

51
tainty. Employers often prefer defined benefitplans because they allow greater discretion inthe timing of contributions than many definedcontribution plans and in the use of deferredcontributions (in lieu of wages) to attract work-ers. Managers also hope to reduce the cost ofpension benefits by pursuing more aggressiveinvestments than may be included in the port-folio of defined contribution plans. However,the administrative costs of complying withregulations pertaining to defined benefit planssignificantly exceed those for defined contri-bution plans of comparable size.
Contributions to a defined contributionplan are made to an individual account estab-lished for each employee. The final benefitpaid is based on the sum of these contribu-tions plus return on investment and some-times forfeitures that have been allocated tothat account.5 Defined contribution plans areattractive to employers because they are lesscomplicated to administer than defined ben-efit plans and because funding costs are pre-dictable, since contributions are based on apredetermined formula. These plans are alsoattractive to some employees because they aregenerally portable (i.e., they can be carriedfrom employer to employer) and because it iseasy to keep track of the current value of theirbenefit. Moreover, it is usually possible foremployees to receive their benefits in a lumpsum upon terminating employment with thesponsoring employer. Because they are usedby small firms and individuals, the number ofdefined contribution plans is rising rapidly.Successive legislation has generated a largenumber of types of qualified defined contri-bution plans, sometimes making the choicequite complex. (See “Defined ContributionPlans,” pages 54-55 for a summary of plantypes.) The most rapid growth has occurred in401(k) plans, which are often supplements toprimary defined benefit retirement plans.
FUNDING LIMIT FOR DEFINEDBENEFIT PLANS
From a national saving perspective, themost serious attack on retirement saving was
contained in the Omnibus Budget Reconcilia-tion Act of 1987 (OBRA87). This law limitedfunding of defined benefit plans to 150 per-cent of plan termination liability (benefitsaccrued to date). Before OBRA87, firms couldfund up to 100 percent of their projected liabil-ity, which is based on actuarial calculationsof the benefits plan participants will accrueover their working lives. The new limit estab-lished by OBRA87 caused delay in funding ofmany plans until the later years of a worker’scareer. For many firms future pension costswill rise sharply because backloaded fundingcosts will rise just as the baby-boom genera-tion approaches retirement.
Table 6 (see page 56) reproduces a numeri-cal example of how the funding patterns forindividuals of various ages were disrupted bythe new rule. The plan in the example pays abenefit of 1 percent of final-average salary foreach year of service; it assumes a 5.5 percentannual rate of salary increase and a return onassets of 8 percent. The third column showshow the plan would be funded prior toOBRA87 using the projected unit creditmethod. Contributions rise slowly as a per-cent of compensation throughout the worker’scareer. The present value of contributions dur-ing the first half of the worker’s career is ex-actly equal to the present value of contribu-tions during the second half. However, for the25-year-old worker whose pension is fundedexclusively under the OBRA87 rule, contribu-tions as a proportion of salary begin at a muchlower level and rise very steeply during theworker’s forties and early fifties (see Figure25, page 56). On a dollar-present-value basis,75 percent of this employee’s funding ispushed back to the second half of his or herworking life. For the 35- and 45-year-oldemployees in this example who had alreadyreceived benefit credits when OBRA87 tookeffect, contributions had to be temporarily halted(for nine and six years, respectively) whileaccrued benefits caught up with the amountthat had already been funded under thepre-OBRA87 rules.

52
A typical defined benefit plan credits anemployee with a unit of benefit for every yearof participation in the plan, usually expressedas a percentage of compensation, though some-times as a flat dollar amount. In the formercase, compensation is usually based on career-average, or final-average, earnings for a speci-fied number of years (often three to five)immediately prior to retirement. A simpleexample of the final-average case is anemployee who works for thirty years untilretirement at age 65, averages $50,000 in salaryfor his last five years of employment, and par-ticipates in a plan that credits him with 1.5percent of final-average compensation for eachyear of service; he would be entitled to a pen-sion of 45 percent of $50,000 ($22,500) for eachyear that he lives in retirement. In many cases,the pension benefit is in addition to SocialSecurity benefits.a
Because accrual and payment of benefits occurover a period of many years, it is necessary forthe plan sponsor, for purposes of funding, tofirst determine the present value of the pen-sion. This involves several steps:
1. Estimating the final-average (or career-average) salary, which incorporatesassumptions about rate of salary growthfrom commencement in the plan until
retirement. This salary figure is then multipliedby the benefit percentage specified in the planformula (1.5 percent in the example) and thenby years of service to get the total annual retire-ment benefit. (The expected value of benefits fora group of participants in a plan would also bereduced by the probabilities of preretirementtermination, disability, or mortality.)
2. Calculating the value at age 65 of all post-retirement benefit flows. This requires a mortal-ity assumption to estimate life span and aninterest rate assumption to discount the valueof benefit payments made over successiveyears. The number thus derived representsthe total pension benefit valued at age 65 (orwhatever the retirement age).
3. Finding the present value of the number calcu-lated in step 2. This calculation depends criti-cally on the interest rate assumption. Becausea long period of time elapses between benefitaccrual and retirement, a small change in theinterest rate causes an inordinately large move-ment in the valuation of plan costs and conse-quently in the funding status of the plan.b
The plan sponsor next has to determine how toassign the cost of funding this liability over timewithin the constraints of minimum and maximumannual funding requirements set out in the law.
Recent empirical studies have concludedthat the full-funding limitation introduced inOBRA87 substantially reduced pension con-tributions.6 Data gleaned from surveys of busi-nesses sponsoring pension plans support theconclusion that the effects of OBRA87 weresignificant. Prior to the enactment of OBRA87,the Wyatt Company concluded that 40 per-cent of 664 defined benefit plans it examinedwould have been affected by the new fundinglimit in 1987; that is, under pre-OBRA87 actu-arial assumptions, these plans could have beenexpected to make contributions amounting tomore than 150 percent of termination liability.A survey they conducted in 1987 revealed that
48 percent of the plans met or exceeded the150 percent limit and were consequentlyoverfunded according to the new rule; by 1992,that percentage had dwindled to 37 percent asfirms cut back on their contributions to avoidbeing overfunded.7
Firms can only ensure the viability of theirdefined benefit plans if they are permittedflexibility to spread the costs of funding plansover time in a manner that realisticallyreflects both expected plan liabilities andthe firms’ ability to make contributions. Thefull-funding limit based on terminationliability denies such flexibility and places adisproportionate burden on firms in the later
ESTIMATING LIABILITIES AND FUNDING FOR DEFINED BENEFIT PLANS

53
years of workers’ careers. CED therefore rec-ommends that the funding limit be restoredto its pre-1987 level of 100 percent of pro-jected plan liability. Projected plan liabilityin the case of flat-benefit plans should becalculated to include anticipated increasesin the dollar benefit level over time.
REDUCTIONS IN CONTRIBUTIONAND BENEFIT LIMITS
Over the years, Congress has enacted aseries of regulations intended to raise revenueby reducing retirement benefits for higher-income workers, business owners, and keyemployees. These changes are in conflict with
the basic pension policy objective of encour-aging retirement saving. Moreover, it turnsout that these rules, in combination with dis-crimination rules, have a substantial adverseeffect on retirement saving by middle- andlower- income workers.
Dollar Limits on Contributions and Ben-efits. Pension plan benefits and contributionsare limited in a number of ways. There arelimits on deductible contributions for bothdefined benefit and defined contribution plans,backed up by an excise tax penalty. There is alimit on the benefit that can be received from adefined benefit plan, and there is an excise taxon aggregate distributions of more than
funding pensions over time. This can beachieved by using an actuarial cost methodgeared to making sufficiently high contribu-tions in the earlier part of a worker’s career sothat contributions do not have to rise steeply inlater years.
It should be noted that in 1987, the FinancialAccounting Standards Board mandated thatfirms use the projected unit credit method forreporting pension liabilities in financial state-ments. This is one of the less conservative ofthe six allowable funding methods because itback-loads contributions (as a percent of com-pensation) into the later years of an employee’sworking life. Moreover, 1987 legislation thatlowered the maximum funding limit to 150percent of termination liability effectively de-layed the funding of many workers’ pensions.Since the work-force will age as the babyboomers move toward retirement, any lawsthat backload the funding of pensions willmake it particularly burdensome for firms tofinance these plans.C
a. Assuming that pension benefits are independent of Social Security benefits, the individual in the example would probablyreceive a total annual retirement benefit of about $33,000, or two-thirds of preretirement earnings.
b. A 1 percent change in the interest rate assumption can alter the long-run cost of benefits for a typical plan by about 25percent. Dan M. McGill and Donald S. Grubbs, Jr., Fundamentals of Private Pensions, 6th ed. (Philadelphia: Pension ResearchCouncil, Wharton School, University of Pennsylvania, 1989), p. 259.
c. Many firms apparently also shifted to this method for funding their plans, away from more conservative methods, thusreducing contributions. William G. Gale, “Public Policies and Private Pension Contributions,” Journal of Money, Credit, andBanking, forthcoming.
Allocation of costs to each year is determinedusing one of six actuarial cost methods allowed byERISA. The allocation for any given year is calledthe normal cost of the plan for that year. Theminimum-funding requirement stipulates thatthe normal cost of the plan must be funded, inaddition to amortization of unfunded liabilities,experience gains or losses (which occur when actu-arial assumptions such as the interest rate differfrom actual plan experience), and gains or lossesarising from changes in the actuarial assumptionsthemselves.
Each of the actuarial cost methods is tailored fordifferent preferences. Some are designed to fundbenefits at a fairly stable percentage of payroll,some front load contributions into the earlierphases of a worker’s tenure, and others do thereverse.
Because plans are usually designed so that ben-efits rise as a worker advances in age, it frequentlymakes sense (particularly for mature firms on asolid financial footing) to smooth out the cost of

54
$148,500 to any individual from one or moreplans. There is also a limit on considered com-pensation (the compensation that can be takeninto account in a benefit or contribution for-mula).
In 1982, TEFRA reduced by one-third andthen froze until 1986 both the maximumannual contribution to a defined contribution
plan and the maximum annual benefit thatcould be paid out by a qualified defined ben-efit plan. The Deficit Reduction Act of 1984(DEFRA) extended this freeze on contribu-tions and benefits until 1988.8 The Tax ReformAct of 1986 (TRA) effectively extended thefreeze on contributions beyond 1988. It alsoreduced the contribution limit by individuals
(from after-tax dollars), although most suchplans also provide for full or partial employermatching. The employee is typically able tochoose from a range of rates of contribution,and the employer match is normally a uni-form percentage of each employee’s contribu-tion.
PROFIT-SHARING PLANS
Profit-sharing plans must meet many of the sameregulatory requirements as money purchase pen-sion plans. The principal difference is that contri-butions are not definitely determinable and infact need not be tied to profits at all. IRS regula-tions require only that contributions be “recur-ring and substantial.” The limit on tax-deductiblecontributions is 15 percent of aggregate employeecompensation. There are three principal kinds ofprofit-sharing plans:
1. Conventional profit-sharing plans. Allrequired contributions are made by theemployer.
2. Thrift profit-sharing plans. Employees makecontributions, and these are matched by theemployer, often using a formula based oncorporate profits.
3. Cash or deferred arrangements [CODAs,or 401(k) plans]. Employees can choose toreceive distributions in the form of cash, or astax-deferred contributions by the employer toa trust. The earliest CODAs were establishedout of employer contributions that were inexcess of regular compensation, but over timethe concept came to be applied to regularcompensation, whereby employees enter intosalary-reduction agreements with employers,
MONEY PURCHASE PENSION PLANS
The important distinguishing characteristic of amoney purchase pension plan is that contribu-tions must be definitely determinable; that is, theyare made according to a predetermined for-mula that is independent of fluctuations in theprofits of the sponsoring employer. The contri-bution limit on behalf of each employee is thelesser of $30,000 or 25 percent of employeecompensation. There are several different typesof money purchase plans:
1. Traditional money purchase plans. Theplan sponsor undertakes to make periodiccontributions to employee accounts accord-ing to a formula, usually a percentage ofemployee compensation. These plans arefrequently “contributory,” meaning thatcontributions are made by both employerand employee. Except for plans establishedbefore passage of ERISA, which were ableto convert to 401(k) plans, employee contri-butions are made from after-tax dollars andare not tax deductible.
2. Target benefit plans. Contributions onbehalf of each employee are based on anactuarial estimate of the contributionsrequired to achieve a specific target benefitupon retirement.
3. Negotiated contribution plans. The for-mula for contributions usually arisesfrom collective bargaining and covers theemployees of more than one firm. Contribu-tions accumulate in a single fund, ratherthan individual accounts.
4. Savings, or thrift, pension plans. Thesealways involve employee contributions
DEFINED CONTRIBUTION PLANS

55
and the amount of the reduction is placed ina tax-deferred account by the employer on theemployee’s behalf. The limit on these contri-butions was $9,240 in 1994. About half of401(k) plans provide for some amount ofmatching contribution by employers. Thecombined limit is the same as for a moneypurchase pension plan ($30,000).
STOCK BONUS PLANS
1. Traditional plans. These are similar to profit-sharing plans, except that the benefits can bemade available in the form of stock in theemployer’s company.
2. Employee stock ownership plans (ESOPs).These are stock bonus plans that are at least 50percent invested in the securities of the spon-soring employer. Most ESOPs are investedexclusively in employer securities. A leveragedESOP is one in which money is borrowed inorder to purchase the stock.
INDIVIDUAL RETIREMENT PLANS
The principal kinds of individual retirementplans are individual retirement accounts, individualretirement annuities, and simplified employee pen-sions. The first two are funded by the workerand are distinguishable primarily by the type offunding instrument. The third is an employer-financed IRA.
1. Individual retirement accounts (IRAs). Aworker can make tax-deferred contributionsto an IRA up to an annual limit of $2,000($2,250 for a single-earner married couple).However, if an individual is already coveredunder an employer-sponsored plan and has
an adjusted gross income in excess of$25,000 ($40,000 for a married couple), thetax deduction is scaled down, reaching zeroat an income level $10,000 over the thresh-old.
2. Individual retirement annuities. This is anannuity purchased from a life insurancecompany; as with the IRA, the insurer can-not accept more than $2,000 annually inpremiums.
3. Simplified employee pensions (SEPs). Anemployer establishes and finances an IRAfor each eligible employee. The contributionlimit is much higher than for an IRA: thelesser of $30,000 or 15 percent of employeecompensation. Compared with conventionalpension plans, SEPs are easy and inexpen-sive to establish and are therefore favored bymany employers.
TAX-DEFERRED ANNUITIES UNDERSECTION 403(B)
Section 403(b) plans are made available for non-profit organizations and educational institu-tions. They are similar to 401(k) plans in thatemployees and/or employers may contributepretax dollars to an investment pool. Thereare two limits on combined employer andemployee annual contributions: (1) the lesserof 25 percent of taxable compensation or$30,000, or (2) a cumulative maximum exclusionallowance limit of 20 percent of taxable com-pensation times years of service minus priorcontributions. There is also a limit on tax-deferred employee contributions similar tothat of 401(k) plans ($9,500 in 1994).
for one important category of defined contri-bution plans, 401(k) plans, from $30,000 to$7,000 (before adjustment for inflation).Profit-sharing plans were prohibited fromapplying the unused portion of their prior-yearcontribution limit to exceed the contributionlimit in another year. This reduced the degreeto which they could make higher contribu-
tions in profitable years to offset lower con-tributions in unprofitable years. TRA alsoreduced early retirement benefits from definedbenefit plans actuarially in line with the nor-mal retirement-age benefit limit establishedunder TEFRA.
As a result of the changes to qualified con-tribution and benefit limits, and after subse-

56
Projected Lifetime Contributionsas a Percent of Salary for 25-Year-OldParticipant
Figure 25
Table 6
Effects of OBRA87 Full-Funding Limits on Contribution Rates
ProjectedUnit Credit
Worker ContributionAge Pay Rate 25% 35% 45% 55%
25 $25,000 4.2% 0.9% 4.2% 4.2% 4.2%
30 32,674 4.7 1.4% 4.7% 4.7% 4.7%
35 42,704 5.3 2.6% 0.0% 5.3% 5.3%
40 55,812 5.9 4.4% 0.0% 5.9% 5.9%
45 72,944 6.7 7.4% 7.4% 0.0% 6.7%
50 95,335 7.5 12.3% 12.3% 0.0% 7.5%
55 124,599 8.4 16.2% 16.2% 16.2% 0.0%
60 162,846 9.5 11.5% 11.5% 11.5% 10.2%
64 201,737 10.4 11.1% 11.1% 11.1% 10.7%
SOURCE: The Wyatt Company.
Age When Change Implemented
Contribution Rates UnderFunding Limit of 150% of Accrued Benefit
quent indexing of these amounts in the yearssince, the following annual limits applied in1994:
• Benefits from a defined benefit plan: thelesser of $118,800 or 100 percent of averagecompensation for the three consecutiveyears of highest earnings. A plan that pro-vides for benefits in excess of this amountis disqualified.
• Contributions for a defined benefit planare subject to a funding limit of 150 percentof termination liability. Excess funding issubject to a 10 percent excise tax.
• Contributions to a defined contributionplan: the lesser of $30,000 or 25 percent ofthe individual’s compensation. Excess con-tributions are subject to a 10 percent excisetax.9
• Contributions by individuals to a 401(k):$9,240.
SOURCE: The Wyatt Company.
20
15
10
5
025 27 29 31 33 35 37 39 41 43 45 47 49 51 53 55 57 59 61 63
After OBRA87
Pre-OBRA87
Age
Percent

57
• Distributions from defined contributionplans are subject to the overall limit onbenefits from one or several plans: a 15percent excise tax on aggregate distribu-tions received by an individual from oneor more plans in excess of $148,500.10
The data indicate that although the vastmajority (86 percent in 1987) of 401(k) plansare primary plans (i.e., the firm’s sole or prin-cipal pension plan), aggregate participation insecondary 401(k) plans is substantially higher(49 percent of participants versus 26 percentin primary plans).11 This suggests that smallfirms are much more reliant on 401(k) plans astheir principal retirement saving plan.
The regulations described above tend tohave two effects: (1) They reduce pension con-tributions and saving. (2) Because a substan-tial impact is felt by managers of businesses,who generally make the decision whether ornot firms operate a pension plan, the regula-tions frequently lead to the abandonment ofsome plans and discourage the formation ofnew ones, particularly for small firms. CEDbelieves that there are legitimate reasons tolimit the pension tax preference received byany one individual. But the limitations justdescribed, together with the limits on consid-ered compensation, are duplicative, discour-age investment in high-yielding assets, andare too damaging to the basic pension policyobjective of encouraging retirement saving.Therefore, CED urges Congress to eliminatethe excise tax on distributions above thestated limit. Limits on benefits from quali-fied defined benefit plans, which discour-age retirement saving and encourage invest-ment in lower-yielding assets, should beincreased. Contributions for qualifieddefined contribution plans should also beraised to more reasonable levels (and indexedfor inflation) in order to encourage small-business managers to provide pension plansfor all employees.
CED also believes that individual contri-butions to 401(k) plans that are primary pen-sion plans should be subject to the same
limit that applies to other defined contribu-tion plans, such that the combined employeeand employer contributions do not exceedthat limit. This will give workers in smallerfirms an opportunity to expand their retire-ment savings and will provide a greaterincentive for managers of small firms tooffer these plans to their workers.
The contributions of all workers are alsolimited by discontinuities in employment andearnings. As we discussed in Chapter 3, pen-sion plan participation is substantially loweramong workers who are younger and havelower earnings (see Figures 20 and 21, page30). Many of these workers are not offered apension plan by their employers. Others donot have sufficient means to begin saving fortheir retirement, or they do not give saving forretirement a high priority because they are farfrom the end of their working lives. They per-manently lose tax benefits available for pen-sion saving during their younger years, andcompounding of pension contributions andinterest cannot occur over a long-enoughperiod of years to build sufficient retirementincome. CED believes that it would be moreequitable and a stimulus to saving if theretirement-saving tax preference were basedon accumulated lifetime income. This wouldenable parents, who often must leave thelabor force temporarily to care for children,and other individuals who undercontributeto their pension plans early in their careersto exceed the contribution limit in later years.In practice, this would allow individuals tomake larger tax-deferred contributions whenthey are financially better equipped to do so,usually later in their careers.12
Reductions in Considered CompensationLimits. In addition to the dollar limit on con-tributions, pension contributions for bothdefined benefit and defined contribution planshave been reduced by limits on consideredcompensation, which is the maximum amountof income that may be taken into account whencalculating the eligible contributions fora defined contribution plan or the benefits

58
Considered Compensation Limits May Affect Non-HighlyCompensated Employees
Figure 26
The chart shown illustrates how the $150,000limit on considered compensation may affectcontributions of employees with less than$150,000 of current income but whose pro-jected earnings exceed $150,000. The solid linerepresents the lifetime projected compensationpath for the same individual as in Table 6. Thedashed line represents the OBRA93 earningspath for purposes of calculating his pensionbenefit. This line is derived by taking $150,000,the maximum allowable, and discounting backto year 1 at 5.5 percent a year (the same interestrate as the salary growth assumption). Thisgives a compensation figure of $18,589. Thus,instead of a benefit based on a percentage of$25,000, this individual’s benefit is funded as apercentage of $18,589. The vertical distancebetween the two lines at every point representsthe amount of reduction in considered com-pensation for each age. An important qualifieris that the $150,000 is indexed for inflation,which will allow employers to increase contri-butions over time and leave the ultimate ben-efit payment to the employee unaffected.However, as with the OBRA87 full-fundingrule, delay of funding in the early years in-creases the burden in later years and increases
the chances that employers will be unable orunwilling to continue to fund their pensionplans.
individuals with low incomes but whose pro-jected earnings exceed $150,000. The easiestway to see this is by examining Figure 26,which illustrates how the limit on consideredcompensation could affect the contributionsfor employee earnings of less than $20,000.Lowering the cap on considered compensa-tion also affects middle- and lower-incomeworkers participating in defined contributionplans, such as 401(k) plans, because it increasesthe likelihood of a plan failing to comply withnondiscrimination rules peculiar to theseplans. Plan administrators must divide par-ticipating employees into two groups: highlycompensated and all others. A plan is consid-
under a defined benefit plan. Although theintent may have been to limit contributionsmade for highly compensated individuals,in practice these limits are expected to havea substantial effect on contributions forlower-income workers. The Tax Reform Actof 1986 reduced the maximum from $235,000to $200,000, and the Omnibus Budget Recon-ciliation Act of 1993 (OBRA93) reduced itfurther, to $150,000.13 The most obvious effectof the rule is to reduce the pension contribu-tions and benefits for highly compensatedemployees.14 However, the lower limit on con-sidered compensation can also severely limitcontributions to defined benefit plans for
Compensation (dollars)
200,000
150,000
100,000
50,000
0
NOTE: Assumes individual enters service at age 25 earning$25,000 a year and expects annual salary growth of 5.5%.
Age
OBRA93
Pre-OBRA93
Effect of Considered CompensationLimit at Each Age for Participant inDefined Benefit Plan
25 27 29 31 33 35 37 39 41 43 45 47 49 51 53 55 57 59 61 63

59
CED also believes that the nondiscrimi-nation tests under Sections 401(k) and 401(m)are unnecessarily complicated and reducepension saving among middle-income earn-ers as well as among more highly compen-sated employees. These tests could be elimi-nated and replaced by a vastly more simpleand administratively inexpensive safeguardagainst discrimination. For example, employ-ers who make contributions to 401(k)accounts could be required to contribute thesame percentage of payroll for all partici-pants up to the maximum contribution limit.16
REGULATIONS TO PREVENTDISCRIMINATION IN PENSIONPLANS
The limit on considered compensation andlimits on maximum benefits and contributionsdirectly reduce pension saving. There are alsonondiscrimination rules that are extremelycostly to administer and have more subtleeffects on pension saving. Generally, nondis-crimination rules provide for some rebalancingof pension benefits and contributions betweenhigh- and low-salary individuals. These rulesare often expressed as percentages by whichthe contributions and benefits of high-salaryworkers cannot exceed those of low-salaryworkers. Falling into this category are the dis-crimination tests for 401(k) plans, Social Secu-rity integration rules, coverage rules, andtop-heavy rules. These rules are extremelycomplicated, often redundant, and imposeenormous costs on pension administration.
CED believes that these rules should bestreamlined and simplified in a manner thatreduces costs. Ideally, all discrimination testswould be replaced by a vastly more simpleand less costly safeguard against discrimina-tion. For example, all employees who meetnondiscriminatory age and service eligibil-ity requirements should be covered andreceive the same ratio of contributions towages up to the prescribed limit. (In the caseof defined benefit plans, the same benefit
ered nondiscriminatory only if elective con-tributions for the highly paid group do notexceed those for the lower-paid group by anamount determined by two alternative for-mulas.15 For high-wage workers already con-tributing the maximum allowable to their401(k) plans ($9,240 in 1994), reducing the con-sidered compensation limit automaticallyincreases the ratio of contributions to com-pensation and thus increases the likelihoodthat plans will fail the nondiscrimination test.Rebalancing contributions among high-wageemployees in order to correct this problem isexpected to result in reduced contributionsfor middle-income employees unfortunateenough to be just above the cut between thehighly compensated and nonhighly compen-sated groups.
The primary purpose of the pension limi-tations in OBRA93 was to raise federal rev-enue. Advocates of considered compensationlimits believed that such limits would preventdiscrimination in favor of key employees. Butclearly this objective will be undermined assome plans are abandoned, as some plan for-mulas are amended to negate the effects of theprovision, and as lost benefits are recoupedby other forms of payment. CED urges Con-gress to discontinue the recent practice ofreducing considered compensation as ameans of raising federal revenue. Webelieve this practice is harmful because itcan affect pension saving by reducing con-tributions for lower-income employees. Italso reduces the willingness and ability ofsponsors to create and maintain qualifiedplans.
Assuming the elimination of the excisetax on distributions and increased limits onbenefits as recommended by CED, webelieve that some limits on considered com-pensation should be retained. However, theconsidered compensation limit should beraised to a more reasonable level, at least toits pre-OBRA93 level (and indexed); it shouldapply only to those whose incomes actuallyequal or exceed that limit, not to those whoseprojected incomes equal or exceed it.

60
formula should be applied.) If such a radicalreform could not be adopted in its entirety,simplification should proceed along the linesdescribed in this section.
TOP-HEAVY RULESTop-heavy rules, a product of TEFRA, are a
special set of particularly stringent nondis-crimination standards that must be met byplans in which 60 percent or more of accumu-lated benefits accrue to key employees (cer-tain officers and highly paid employees). Theyinclude minimum benefits for nonkey employ-ees in defined benefit plans, minimum contri-butions for employees in defined contributionplans, a complete prohibition against SocialSecurity integration, and a faster vesting sched-ule (see the Appendix). The rules are costly toadminister because they involve annual test-ing of all plans. They also reduce pension ben-efits for more highly compensated employ-ees. Consequently, many top-heavy plans(primarily smaller ones) were abandoned af-ter passage of the regulations.
The Tax Reform Act of 1986 subsequentlystrengthened nondiscrimination rules for allpension plans by enacting more stringent cov-erage and participation rules and requiringmore rapid vesting of benefits. In light of theserequirements, the special rules for top-heavyplans serve little useful purpose. CED believesthat the other nondiscrimination rules ap-plying to all pension plans are adequate andthat it is desirable therefore to completelyeliminate top-heavy rules.
SOCIAL SECURITY INTEGRATIONBecause contributions and benefits under
OASDI are greater for lower-salary workers,it has been a common practice in private pen-sion plans to compensate for this distribu-tional effect by weighting pension contribu-tions and benefits toward the higher-salariedemployees. The desired outcome was thateither the combined contributions or the com-bined benefits accruing from Social Securityand the private pension would equal approxi-
mately the same percentage of compensationfor all employees.
The Tax Reform Act of 1986 introducednew rules that restricted the degree to whichemployers could integrate plans with SocialSecurity. Essentially, it stipulated percentagesby which benefits and contributions with re-spect to compensation above the Social Secu-rity taxable wage base could not exceed thosewith respect to compensation below the SocialSecurity taxable base (see the Appendix fordetails). Because of these limits, many firmshave had to restrict contributions to highlycompensated employees.17 CED believes thatrestrictions on the integration of SocialSecurity and private pensions are not neededin cases where the employer contribution forall employees equals or exceeds an appropri-ate minimum threshold.
COVERAGE AND VESTING RULESThe Tax Reform Act of 1986 also intro-
duced highly complicated nondiscriminationtests relating to coverage and vesting indefined benefit and defined contributionplans.18 These rules are in addition to the strin-gent participation and vesting rules for indi-vidual employees.19 Provided they are not toocomplex, rules that broaden coverage andaccelerate vesting are generally desirable be-cause they encourage the growth of pensionsaving. At present, however, these rules areexcessively complex.
There are two primary effects of the cover-age rules: (1) They make pensions complexand costly to administer because of the natureof the calculations involved. (2) They tend toredistribute benefits from high- to low-salaryemployees rather than simply increasing ben-efits for the low-salaried (and therefore totalpension saving).
CED believes the current coverage rulesare not cost-effective and should be simpli-fied into a single test. For example, the rulecould state that all employees who meet non-discriminatory eligibility requirements must

61
be covered. Moreover, employers who pro-vide a uniform ratio of contributions to wagesfor all eligible employees should be givensafe harbor from all further discriminationtests.
CED also recommends that minimumvesting requirements be revised for recogni-tion of the greater mobility of today’s laborforce. For example, vesting could be conferredon one of the following two schedules: (1) athree-year cliff (down from five) or (2)five-year graded (down from seven).
PRESERVING PENSION FUNDS FORRETIREMENT
PRERETIREMENT LUMP-SUMWITHDRAWALS AND BORROWINGFROM PENSIONS
As we noted in Chapter 2, many observersare greatly concerned that lump-sumpreretirement withdrawals are often not be-ing rolled over when participants change jobs.There is also concern about borrowing frompension funds. It is feared that both these prac-tices place the economic security of futureretirees in jeopardy. It is also argued that theyare an abuse of tax preferences provided toencourage pension saving. Other observersfear that prohibition of these practices willdiscourage participation and pension saving,especially when applied to supplementary sav-ing plans that typically involve voluntary em-ployee contributions. However, CED believesthat preretirement withdrawals and borrow-ing from pensions pose an even greater threatto pension saving and conflict with the basicobjectives of pension policy.
CED recommends that in-service pre-retirement withdrawals and borrowing ofemployer contributions to pension plans beprohibited. Preretirement withdrawals andborrowing of voluntary employee contribu-tions to pension plans should not be prohib-ited, but existing penalties should beretained.
PORTABILITY OF PENSIONSPreviously enacted reforms involving vest-
ing in retirement plans and proposals for fur-ther improvements in pension coverage willhelp preserve pension funds for retirement.A needed improvement in pensions relatingto preservation of funds for retirement involvesthe portability of defined benefit plans andthe rollover of pension distributions whenworkers change jobs. CED recommends thatregulators investigate options for improvingthe portability of vested benefits fromdefined benefit plans. Individuals whochange employers should be strongly encour-aged to roll over preretirement lump-sumdistributions into alternative retirement sav-ing instruments such as individual retire-ment accounts (IRAs) and defined contribu-tion plans maintained by their newemployers.
PENSION BENEFIT GUARANTYCORPORATION
According to the PBGC’s 1993 annualreport, its liabilities for payment of benefits toparticipants of terminated plans exceeded itsassets by $2.9 billion. The six-year period thatended in 1993 saw an alarming trend:Although the number of plan terminationsfell sharply compared with those in the pre-ceding six years, the net claims of these planson the PBGC (plan liability minus the sum ofplan assets and recoveries from employers)rose from $1.7 billion (between 1982 and 1987)to $2.4 billion (between 1988 and 1993).
Unfortunately, there is a strong likelihoodthat the $2.9 billion is just the tip of the ice-berg. The PBGC has developed three alterna-tive forecasts of future losses. The most opti-mistic of these forecasts projects a deficit of$1.9 billion (in 1993 dollars) by the end of2003, but it assumes a continuation of the sameaverage annual net losses the agency hasincurred over its entire lifetime. On the otherhand, if companies in a precarious financialstate, whose plans are classified by the PBGC
62
as “reasonably possible losses,” actually ter-minate their plans, the PBGC expects a deficitof $13.8 billion by 2003.20 In this scenario, thepossibility of a taxpayer bailout looms omi-nously.
Although the true financial condition ofthe PBGC is reflected in a comparison of itsassets and the present value of its liabilities,the relevant comparison for federal budgetingis between current-year income and expenses;in this case, the PBGC now has a surplus.Thus, the PBGC actually contributes to reduc-ing the budget deficit, which in turn reducesthe incentive for Congress to focus on theunderlying long-term problem. However, achange in the way that the PBGC’s activitiesare accounted for in the federal budgetfrom an operating-income basis to a change-in-net-liability basis would help to get theattention of Congress because it would thenbe adding to the deficit.
There are three underlying causes of thePBGC’s dire financial straits: (1) Premium lev-els are not set to cover future claimsadequately. (2) Premiums are structured in away that creates an adverse-selection prob-lem in the insurance pool. (3) Companies thatunderfund their plans have insufficient incen-tive to increase funding, because of weakPBGC compliance authority. Moreover, mini-mum- funding requirements under current lawallow companies to amortize certain kinds ofunfunded liabilities, including those that arisebecause of an increase in promised benefits,over a long period of time.21
THE PREMIUM STRUCTUREUntil passage of the Retirement Protection
Act of 1994 (incorporated in the GATT-enabling legislation; see the Appendix), planspaid $19 a year per participant, plus $9 foreach $1,000 of unfunded vested benefits. Therewas an overall cap of $72 per plan participant.The sum of these premiums and the incomeearned from investing them, plus recoveriesfrom employers in the event of plan termina-
tion, were supposed to fund the PBGC’sliabilities. The 1994 legislation phases out thecap on the variable part of the premium overthree years. This reform still does not permitpremiums to be set in a way that satisfiesinsurance market principles.
In a private insurance market, premiumswould be set for each plan according to twocriteria:
1. The statistical probability of plan failure,which in turn is dependent on the firm’sfinancial condition and future prospects.
2. The amount of the insurer’s exposure inthe event of plan termination. This is rep-resented by the unfunded actuarial liabil-ity minus employer liability payments.22
Although phasing out the variable pre-mium cap is a move toward risk-based premi-ums, the current PBGC premium structure isstill deficient in two respects:
1. It does not reflect the likelihood of planfailure. A number of the companies whosepension plans are most underfunded arenevertheless in sound financial conditionand expose the PBGC to relatively littlerisk.
2. Although the variable part of the premiumis now more closely related to underfund-ing, it does not distinguish between planson the basis of asset risk.23
Because of these shortcomings in the pre-mium structure, some underfunded plans are,in effect, being subsidized by healthy ones.Consequently, the companies that sponsorweaker plans have an incentive to stay in thesystem, and those that sponsor stronger oneshave an incentive to terminate them. More-over, there is a clear danger that raising pre-miums to a level that would cover the PBGCfor its expected losses would further exacer-bate the adverse selection problem by causingstrong firms to terminate their plans and with-draw from the insurance pool.24

63
Moreover, the PBGC now has claim to 100percent of unfunded liabilities from plan spon-sors. Although these changes have amelio-rated the problem of moral hazard, they haveby no means eliminated it. Bankrupt compa-nies frequently do not have sizable assets forthe PBGC to seize; and in any case, the PBGCclaim is not necessarily given priority abovethose of other creditors. The data indicate thatliability payments from employers to the PBGChave actually dropped slightly as a percent-age of uncovered benefit liabilities since thenew rules were passed.
CED recommends the following reforms:• The PBGC insurance premium should be
restructured so that it more closelyresembles what would be offered in aprivate market. Such a redesign shouldinclude a stronger linkage between thepremium level and the actual risk posedby a pension plan to the PBGC. For ex-ample, the premium calculation could takeinto account the financial strength of theplan sponsor, the marketability of planassets, and the proportion of assets tiedup in the firm’s own equities.
• The PBGC should be given more powerto influence the behavior of sponsors ofunderfunded plans, including the author-ity to prevent plans operating below aparticular funded ratio from granting ben-efit increases to employees.26
• The amortization schedules for unfundedliabilities should be simplified by reduc-ing the number of categories, and theamortization periods should be shortenedto accelerate the funding of liabilities.
• The PBGC’s benefit guaranty structureshould be revised to correlate more closelywith the minimum funding requirementsattributable to specific benefits, such asshutdown benefits.
• The status of the PBGC’s claims in bank-ruptcy should be reviewed and enhancedas appropriate.
MORAL HAZARDThe PBGC does not have sufficient author-
ity to enforce responsible behavior by pensionplan sponsors whose actions expose the agencyto loss. Thus, firms in a precarious financialposition have an incentive to garner additionalresources by reducing pension contributions.They are also likely to embark on riskierinvestment strategies. Moreover, such firmshave an incentive to offer pension benefitsthat are insured by the PBGC and whose fund-ing is deferrable in lieu of wage compensa-tion. Workers accept such arrangementsbecause the PBGC protects them from loss. Itis for these reasons that unfunded plan liabili-ties tend to rise sharply in the period just priorto plan termination (usually when the firm isbankrupt), thus increasing the PBGC’s expo-sure. In the words of the PBGC’s own annualreport:
The insurance program’s weakness cre-ates incentives for financially distressedcompanies to take actions that further in-crease the program’s exposure to loss. Suchactions include:• using pension increases as a form of com-
pensation, the costs of which can bedeferred. Workers are more willing toagree to these promises because they arebacked by federal pension insurance. . . .
• forgoing required pension contri-butions while in bankruptcy with judges’approval. . . .
• allowing a pension plan to run out ofmoney without violating the minimumfunding standards. . . .
Lenders rarely put pressure on troubledcompanies to fund their plans, believing inthe optimistic funding assumptions andexpecting the PBGC’s pension claims will haveno priority. On the contrary, creditors are morelikely to pressure distressed companies to ter-minate plans rather than fund them.25
It is no longer possible, as it was prior to1986, to terminate an underfunded pensionplan and pass the liability on to the PBGCwithout demonstrating financial distress.

64
One-Time Administrative Costs per Worker in Defined Benefit Plans, by Plan Size,1983 to 1990 (in 1990 dollars)
Figure 27
Dollars
1983 1984 1985 1986 1987 1988 1989 1990
Year
400
300
200
100
0
SOURCE: Hay/Huggins Company, Inc.
15 employees
75 employees
500 employees
RISING REGULATORY COSTSDISCOURAGE PENSION SAVING
The number of defined benefit planspeaked at just over 175,000 in 1983 and subse-quently declined by 24 percent in the 1984–1989 period. Of the net 43,000 defined benefitplans lost during that period, about 90 per-cent were plans servicing fewer than 100 work-ers. The Employee Benefit Research Institutereports that 60 percent of the net terminationsbetween 1985 and 1989 had fewer than 10participants.27 There is no doubt that risingadministrative costs, which are particularlyburdensome for small employers, contributedsignificantly to the decimation of defined bene-fit plans in the 1980s.
A study by Hay/Huggins Company forthe PBGC28 analyzed the impact of elevenmajor regulatory changes, enacted between1982 and 1989, on the cost of administeringdefined benefit and defined contribution plansof varying sizes. It found that real administra-tive costs for both the smallest and the largest
defined benefit plans (covering 15 and 10,000persons, respectively) increased at an averageannual rate of more than 10 percent between1982 and 1991, with costs for intermediate plansizes increasing at a slightly lower rate. Smallplans were particularly burdened by one-timeexpenditures arising from frequent changesin regulations (Figure 27). For the smallestplans, administrative costs per covered employeeincreased from $162 to $455 (in 1990 dollars),compared with an increase from $19 to $54 forlarge plans.29 Equally telling is that by 1991,small-plan administrative costs were equal toabout one-third of the benefits accrued in thatyear. In other words, for every $3 of retire-ment benefits accruing to participants, anextra $1 was being spent on administrativecosts. For a large plan with 10,000 employees,administrative costs were estimated at just 4percent of benefits.
According to the Hay/Huggins study,defined contribution plans fared slightly bet-ter under the constantly changing regulatory

65
regime; the increase in real administrativecosts for these plans between 1982 and 1989was in the 6 to 7 percent range, depending onplan size. More important, ongoing costs forthe most severely affected defined contribu-tion plans were still only half as large as thosefor small defined benefit plans. The results ofdirect interviews with fifty pension serviceproviders, conducted for the Small BusinessAdministration in 1989, indicated similartrends. Annual administrative costs for a smalldefined benefit plan were 50 percent higherthan for a defined contribution plan of thesame size and 270 percent higher on aper-participant basis than for a larger definedbenefit plan.30
SOURCES OF COST INCREASESAccording to the Hay/Huggins study, con-
sulting fees for actuarial and legal servicesmade up the bulk of the cost increases forsmall plans, whereas consulting fees andPBGC premiums were of equal importance inlarge plans. The consulting fees were paid toactuaries and lawyers who were neededrepeatedly by plan sponsors to explain regu-latory changes, redraw plan documents, testplans for discrimination, and calculate maxi-mum and minimum contribution levels. Theseactivities were accompanied by increases inin-house administrative costs for such pur-poses as collecting and preparing data andcommunicating plan changes to participants.The most costly legislative changes were iden-tified as: Tax Equity and Fiscal ResponsibilityAct of 1982 (TEFRA), Retirement Equity Actof 1984 (REA), Tax Reform Act of 1986 (TRA),Single Employer Pension Plan AmendmentsAct of 1986 (SEPPAA), and Omnibus Budget
Reconciliation Act of 1987 (OBRA87). (See theAppendix for details.)
Although each regulatory change can beexamined in isolation for the costs it imposedon pension plans, it is important to recognizethat the sheer regularity of the changes hasmade it difficult (if not impossible) for smallerfirms to stay in compliance with the law andto have any assurance of future stability. It isalso important to note that there have been anumber of regulatory changes since 1989 (thelast year studied), which continue to impose aheavy administrative cost burden on pensionplans.31
IMPACT OF COST INCREASESON PLAN TERMINATIONS ANDFORMATIONS
The costs of maintaining defined benefitplans have become too high for many em-ployers, a fact that has contributed to theirdecision to terminate plans. In a survey con-ducted in 1992, 50 percent of the respondentsstated that they terminated their defined ben-efit plans because federal regulations were“too costly or burdensome.”32 The data indi-cate that a large number of employers whoterminated defined benefit plans did notreplace them with successor pension plans ofany kind, and most of those who did so optedfor defined contribution plans.33
These trends indicate that it is critical thatpolicy makers simplify and stabilize regula-tions pertaining to defined contributionplans in order to reduce compliance costs.The retirement security of the 40 million par-ticipants of defined benefit plans may dependto a significant degree on policy makers’actions that influence plan administrativecosts.34

66
Legislation governing private pensionplans was only sporadic until passage of theEmployee Retirement Income Security Act(ERISA) in 1974. Since then, however, pensionlaw has been subject to incessant revision byCongress.
What follows is only a thumbnail sketch ofthe evolution of private pension regulation.However, it is sufficient to demonstrate howobsessively Congress has tinkered with thelaw and how complicated that law hasbecome.
Before ERISA
1. Revenue Act of 1921. Deferred tax (until ben-efit disbursement) on contributions to, andincome from, stock bonus or profit-sharingplans established for employees. The Rev-enue Act of 1926 extended the concession toother pension plans.
2. Revenue Act of 1938. Denied tax-exempt sta-tus to any pension plan that revoked pen-sion promises to its participants. This leg-islation responded to the problem of plansbeing terminated so that the funds couldbe used for purposes other than meetingpension obligations.
3. Revenue Act of 1942. Responded to concernsabout discrimination against rank-and-fileemployees by establishing participationtests.
4. Welfare and Pension Plans Disclosure Act of1958. Required pension plan documentsand annual reports to be submitted to theSecretary of Labor and to plan participants.The objective was to make fraud and other
maladministration of plans more easilydetectable.
5. Self-Employed Individual Retirement Act of1962 (Keogh Act). Expanded tax-favoredretirement plans to include unincorporatedsmall business and the self-employed.
Employee Retirement Income Security Actof 1974 (ERISA)
1. Concerns addressed by legislation:
a. Plans were exclusionary, with limits onparticipation and vesting of benefits.
b. Some plans were inadequately fundedto meet their obligations.
c. There were insufficient incentives forsome employers to offer pension plans.
d. Some plans were not administeredaccording to acceptable fiduciary standards.
e. Pension benefits for key employees weresometimes viewed as excessive in relationto perceived retirement needs.
f. Pensions were not always protected dur-ing takeovers or other kinds of companyrestructuring.
2. Major provisions:
a. Required more information to be providedby employers to plan participants: an eas-ily intelligible plan description, subsequentplan modifications, an annual financialreport, and a statement of the participant’saccrued benefits upon request. Thisstrengthened the provisions of the 1958 dis-closure act, which was formally repealed.
APPENDIXA Brief History of Government Regulationof Private Pensions

67
j. Established the Pension Benefit GuarantyCorporation. Purchase of insurance wasmade mandatory for most plans receivingtax concessions. The PBGC guaranteed pay-ment of vested benefits to a certain level.The premium was set at $1 per plan par-ticipant.
Revenue Act of 1978
1. Contained incentives to encourage smallerfirms to set up pension plans for theiremployees.
2. Major provisions:
a. Established cash or deferred arrangements(CODAs) by adding Section 401(k) to theInternal Revenue Code.6
b. Established simplified employee pensions(SEPs), in which the employer sets up andfinances IRAs for eligible employees. How-ever, the maximum contribution limit,$7,500, was higher than for IRAs.7
c. Created tax-credit ESOPs, or TRASOPs, aform of employee stock ownership planwhereby an employer could receive a taxcredit equal to contributions.
Multiemployer Pension Plan AmendmentsAct of 1980 (MEPPAA)
1. This legislation was designed to addressunderfunding of multiemployer pensionplans.
2. Major provisions:
a. Reduced the incentive for individualemployers to withdraw from multi-employer plans by obliging them to con-tinue funding the liability of workers theyhad hired in the past.
b. Increased PBGC premiums for multi-employer plans.
c. Required faster funding of unfundedliabilities.
b. Strengthened participation rules. Requiredthat employees 25-years-old and over withone year of service could not be excludedfrom a plan.1
c. Established vesting rules. Employerscould choose one of three alternative for-mulas:
i. Full vesting after ten years with novesting until then.
ii. Graded vesting, achieving 100 per-cent after fifteen years of service.2
iii. The “rule of 45”: at least 50 percentvesting when the employee’s age andyears of service add to 45, increasing by10 percent each succeeding year untilfull vesting is attained.3
d. Required that a joint and survivor annuitybe provided to an employee retiring at thenormal age unless the employee specifi-cally waived that right.
e. Set minimum funding rules, by requiringthat the normal cost of a pension plan befunded currently.4 Past service costs wereto be amortized over thirty or forty years.
f. Set fiduciary standards. Plan assets had tobe invested prudently and for the sole ben-efit of plan participants. Relevant financialand participation data must be providedperiodically to the government.
g. Allowed a person not covered by a pen-sion plan to establish an individual retire-ment account. IRA contributions up to thelesser of $1,500 or 15 percent of earnedincome would be tax deductible.
h. Limited contributions to profit-sharing andmoney purchase plans5 to the lesser of 25percent of annual compensation or $25,000.
i. Limited annual pension benefits that couldbe paid to highly compensated employeesto the lesser of $75,000 or 100 percent ofaverage compensation for the three yearsof highest career earnings.

68
Economic Recovery Tax Act of 1981 (ERTA)
1. Contained further incentives to increasepension saving:
a. Replaced TRASOPs with payroll-basedESOPs (PAYSOPS), whereby an employerreceived a tax credit equal to a percentageof payroll.
b. Commercial lenders facilitating leveragedESOPs8 were allowed to deduct a portionof their interest income on these loans. Thiseffectively lowered the cost of setting upan ESOP.
c. Permitted IRAs for all workers, and raisedthe contribution limit from $1,500 to $2,000.
d. Increased limit on contributions to SEPsfrom $7,500 to $15,000 per participant.
Tax Equity and Fiscal Responsibility Actof 1982 (TEFRA)
1. This legislation signaled a shift in pensionpolicy away from concerns about pensionsecurity and the adequacy of retirementincome toward measures to reduce tax rev-enue loss.
2. Major provisions:
a. Reduced contribution limits for defined con-tribution plans to the lesser of 25 percent ofcompensation or $30,000.9
b. Reduced maximum annual pensions fromdefined benefit plans from $136,425, to thelesser of 100 percent of average cash com-pensation in the three years of highest earn-ings or $90,000.
c. For defined contribution plans integratedwith Social Security, contributions based onthat part of income above the Social Secu-rity taxable wage base (the so-called inte-gration level or breakpoint) could not exceedcontributions in respect of income below(the base contribution percentage) by morethan 5.4 percent.10
d. Introduced top-heavy rules. A top-heavyplan was defined as one in which 60 per-cent of accumulated benefits had accruedto key employees (officers and highly com-pensated employees). Top-heavy plans hadto comply with special standards for vest-ing, contributions and benefits, and SocialSecurity integration.11
Deficit Reduction Act of 1984 (DEFRA)
1. Major provision:
a. Delayed indexing of contribution and ben-efit limits until 1988.
Retirement Equity Act of 1984 (REA)
1. Major provisions:
a. Strengthened participation rules by low-ering the minimum age a firm can requirefor enrollment in a plan from 25 to 21; thelaw also lowered the minimum age for vest-ing service from 22 to 18.
b. An employee could now have a break inservice of up to five consecutive years orthe period of eligibility or vesting serviceaccumulated prior to the break without los-ing that eligibility or vesting service. Ma-ternity and paternity leaves were to betreated as though the employee was still atwork through the period of absence.
c. Greater survivor protection:
i. Preretirement death benefit wasextended to all vested employees.
ii. Written spousal consent was requiredto exclude death benefits in order toobtain a more generous pension.
iii. On some domestic relations orders,private pensions could be divided upondivorce.
Single Employer Pension Plan AmendmentsAct of 1986 (SEPPAA)
1. Congress enacted SEPPAA largely becauseof the moral hazard implicit in the pension

69
insurance system, whereby under existinglaw, it was possible for a firm to terminatea pension plan and shift the unfundedliabilities onto the PBGC.
2. Major provisions:
a. Raised PBGC premium.
b. Limited the circumstances under whicha voluntary plan termination could occur:
i. Standard termination: A voluntary ter-mination in which liabilities were cov-ered by assets.
ii. Distressed termination: Permitted atthe discretion of the PBGC. Requiredthe plan administrator to show that thefirm was financially unable to continuethe plan.12
Tax Reform Act of 1986 (TRA)
1. Major provisions:
a. The minimum vesting requirement wasnow defined by the following two options:
i. Five-year cliff.
ii. Graded, under which participants are20 percent vested after three years, withan additional 20 percent each subsequentyear until full vesting is attained afterseven years.
b. Where plan vesting was 100 percent uponenrollment, an employer could now requireonly two years of service before enrollingan employee.
c. Instituted a 10 percent tax penalty ondistributions made prior to age 59 1/2.
d. Established a 10 percent excise tax onexcess pension assets that reverted to theemployer upon termination of a pensionplan.
e. For participants in employer-sponsoredpension plans whose adjusted gross incomewas greater than $25,000 ($40,000 for a mar-ried couple filing jointly), pretax IRA con-tributions were phased out.
f. Limited the amount of compensation thatcould be considered in contribution or ben-efit calculations to $200,000, the same asfor top-heavy plans.
g. Temporarily capped contributions to de-fined contribution plans at $30,000.
h. Reduced the limit on employee contri-butions to 401(k) plans from $30,000 to$7,000.
i. Changed rules for integration of planswith Social Security:
i. For a defined contribution plan, con-tributions in respect of compensationabove the integration level could not ex-ceed the base contribution percentageby more than the lesser of the base con-tribution percentage or 5.7 percent.
ii. For a defined benefit excess plan,13 theexcess benefit percentage could not ex-ceed the base percentage by more thanthe lesser of the base benefit percentageor 0.75 percent.14
iii. For a defined benefit offset plan,15 themaximum offset could not exceed thelesser of 50 percent of the benefit ac-crued without regard to the offset or0.75 percent of final-average compensa-tion multiplied by years of service.
j. New coverage rules were introduced.One of three tests now had to be satisfied:
i. Percentage test: The plan must coverat least 70 percent of all non–highlycompensated employees.16
ii. Ratio test: The percentage of non–highly compensated employees coveredunder a plan must be at least 70 percentof the percentage of highly compensatedemployees covered.
iii. Average benefits percentage test:Both of the following must be satisfiedto pass this test:
(a) The plan must cover a non–discriminatory classification of em-ployees.17

70
(b) The ratio of employer-providedbenefits or contributions to theparticipant’s compensation for non–highly compensated employees mustbe at least 70 percent that of highlycompensated employees.
k. A new nondiscrimination rule was intro-duced for 401(k) plans. The average ratioof contributions to compensation of thehighly compensated group cannot exceed:
i. 125 percent of the ratio of therank-and-file group if the ratio for thelatter group is 8 percent or more.
ii. 200 percent of the ratio of therank-and-file group if the ratio for thelatter is 2 percent or less.
iii. 2 percent in all other cases.
l. Profit-sharing plans could no longer ap-ply the unused portion of their prior-yearcontribution limit (15 percent of the cashcompensation of plan participants) to ex-ceed their contribution limit in another year.
Omnibus Budget Reconciliation Act of 1986
1. Major provisions:
a. Benefit accruals could no longer be fro-zen beyond normal retirement age.
b. Employees hired after age 60 could nolonger be excluded from participation.
Omnibus Budget Reconciliation Act of 1987(OBRA87)
1. Major provisions:
a. Increased the PBGC premium from $8.50to $16 per participant, plus an additionalpremium of $6 per $1,000 of unfundedliability (although the premium was cappedat $50 per participant).
b. Introduced quarterly contribution require-ments.
c. The period for amortizing experience gains
and losses was reduced from fifteen to fiveyears.
d. Introduced a new minimum contributionstandard for underfunded defined benefitplans with more than 100 participants. Theminimum contribution may henceforthinclude a “deficit reduction contribution”that would effectively speed up the fund-ing of underfunded plans.18
e. The full-funding limitation for defined ben-efit plans was capped at 150 percent oftermination liabilities. As a consequence ofrising asset values, many firms wereunable to make further deductible contri-butions.
Technical and Miscellaneous Revenue Actof 1988 (TAMRA)
1. Major provision:
a. Increased the excise tax on employerreversion of assets from 10 percent to 15percent.
Omnibus Budget Reconciliation Act of 1989(OBRA89)
1. Major provision:
a. Defined benefit plan valuations wouldnow be required annually instead of trien-nially.
Omnibus Budget Reconciliation Act of 1990(OBRA90)
1. Major provision:
a. Enabled employers to transfer excess pen-sion assets tax-free to an account for thecurrent health benefit expenses of retirees.Otherwise, the excise tax on asset rever-sions increased to 20 percent or 50 percentunless the employer transferred a portionof the assets to a replacement plan orincreased benefits under the terminatingplan.

71
Omnibus Budget Reconciliation Act of 1993(OBRA93)
1. Major provision:
a. Reduced considered compensation from$235,840 to $150,000.
Retirement Protection Act of 1994 (RPA,incorporated in Uruguay Round AgreementsAct)
1. The Retirement Protection Act acceleratedfunding of the liabilities of underfundedpension plans and contained other mea-sures that strengthened the position of thePBGC. The net effect of RPA on govern-ment revenues is positive; consequently,it was incorporated as part of the financingpackage for the General Agreement onTariffs and Trade (GATT).
2. Major provisions:
a. Delayed indexation of dollar limits oncontributions and benefits by stipulating thatinflation adjustments be implemented inround dollar amounts, rather than annu-ally in step with the precise rate of infla-tion. Indexation will now occur in the fol-lowing increments:
i. Benefit limit for a defined benefit plan:$5,000.
ii. Contribution limit for a defined con-tribution plan: $5,000.
iii. Limit on elective deferrals under a401(k) plan: $500.
b. Strengthened minimum funding standardsfor underfunded defined benefit plans:
i. Increased the required contribution forunfunded new liability.
ii. Provided for accelerated funding ofunpredictable contingent event benefits.19
iii. Lowered the maximum interest ratethat could be used for calculating planliability to 105 percent of the weightedaverage of thirty-year Treasury securi-ties, for the four most recent years priorto the plan year.20
iv. Mandated use of the 1983 Group An-nuity Mortality Table for determinationof current plan liability.21
c. Prohibited certain underfunded plansfrom changing actuarial assumptions fordetermining current liability without firstgaining approval of the Secretary of theTreasury.
d. Prohibited an employer in bankruptcyfrom amending an underfunded plan toincrease benefits unless the increasebecame effective after the planned date ofthe firm’s reorganization.
e. Authorized the PBGC to obtain certaininformation from sponsors of underfundedplans that would assist the PBGC in deter-mining plan assets and liabilities.
f. Gave the PBGC authority to sue plansponsors to enforce minimum-fundingrequirements where the amount of thedeficient contributions exceeds $1 million.
g. Phased out, over three years, the cap onthe variable part of the PBGC premium.
h. Required employers who pay the vari-able premium to notify plan participantsof the plan’s funded status and the extentof the PBGC’s guaranty in the event ofplan termination.

72
NOTES
CHAPTER 1
1. The baby-boom generation refers to the bulge in the agedistribution caused by a rise in birthrates between 1946and 1964 and the decline thereafter. The earliest babyboomers will reach 65 in 2011, but they will affect theretirement-age population much earlier because manyworkers retire before the age of 65.
2. B. Douglas Bernheim, “Is the Baby Boom GenerationPreparing Adequately for Retirement?” Technical Re-port, mimeographed, 1992, and a “Summary Report”with the same title published by Merrill Lynch, 1993.
3. The ratio is expected to remain at that level or oneslightly lower through to 2070.
4. Information supplied by the Office of Managementand Budget.
5. Hospital insurance includes only Part A of Medicare.Under current policies, the HI program is expected torealize a $7 billion cash-flow deficit in calendar 1994,increasing to $1.2 trillion in 2030. See U.S. Department ofHealth and Human Services, Social Security Administra-tion, Annual Report of the Board of Trustees of the FederalOld-Age and Survivors Insurance and Disability InsuranceTrust Funds, 1994 (Washington, D.C.: U.S. GovernmentPrinting Office, 1994), and the U.S. Department of Healthand Human Services, Health Care Financing Adminis-tration, Annual Report of the Board of Trustees of the FederalHospital Insurance Trust Fund, 1994 (Washington, D.C.:U.S. Government Printing Office, 1994).
6. Although the Social Security projection includes the in-crease in the normal retirement age enacted earlier, cur-rently legislated benefits are assumed to be unchanged.
7. Currently, about three-quarters of SMI funding comesfrom general tax revenues and one-quarter from enroll-ees. SMI is expected to grow to be as large as HI. C.Eugene Steuerle and Jon M. Bakija, Retooling Social Secu-rity for the 21st Century: Right and Wrong Approaches toReform (Washington, D.C.: The Urban Institute Press,1994), pp. 54-55.
8. The full commission did not accept the Kerrey-Danforthproposals, of which the four most important in relation toSocial Security were: (1) further increasing the SocialSecurity retirement age, (2) reducing growth of initialbenefits relative to earnings, (3) reducing benefits forupper-income workers, and (4) replacing part of theSocial Security program with a mandatory saving pro-gram. The leadership of the 104th Congress has alsoindicated that no changes will be made to Social Securityfor the time being.
9. Defined benefit plans promise a specific benefit; de-fined contribution plans promise a specific contributionto a fund. The benefits provided by defined benefit plansare normally determined by a formula relating to com-pensation and length of service. Benefits from a definedcontribution plan depend on the annuity value of the totalaccumulation.
10. Pension Benefit Guaranty Corporation, news release,December 5, 1994.
11. The PBGC insures individual benefits promised by66,000 private defined benefit plans up to $30,886 (ad-justed annually for inflation). Although it charges plansponsors a premium for the insurance, the premiums donot cover expected liability, which has risen rapidly.Reforms enacted as part of GATT-enabling legislationshould help correct this situation over time. (See Chapter5, page 48.) However, if underfunding of pension planscontinues to grow rapidly as some anticipate, an eventualbailout by taxpayers cannot be ruled out.
12. Office of Management and Budget.
13. Merrill Lynch, Retirement Savings in America (Princeton,N.J.: Merrill Lynch, Pierce, Fenner & Smith, Inc., 1993).
14. Prior to OBRA93, the considered compensation limitwas $235,840.
CHAPTER 2
1. The aging of the population is, in fact, a worldwidephenomenon; and old-age security systems, includingboth community- or family-based systems and formalretirement programs, appear to be breaking down inmany countries. International Bank for Reconstructionand Development, Averting the Old Age Crisis: Policies toProtect the Old and Promote Growth (New York: OxfordUniversity Press, 1994).
2. Employee Benefit Research Institute, Baby Boomers inRetirement: What Are Their Prospects?, Special Report andIssue Brief, no. 151 (Washington, D.C.: EBRI, July 1994),Table 12, page 19.
3. About 2.6 million federal workers and 11.3 million stateand local government workers participate in these plans.EBRI, Baby Boomers in Retirement: What Are Their Pros-pects?, Table 12, page 19.
4. Although foreign capital inflows may provide consid-erable support for investment, they cannot be counted onto make up for the decline in domestic saving. Economicstudies find that saving and investment rates are highly

73
11. These policy changes are described in Chapter 5.Other factors that may have contributed to the decline inbusiness contributions include the rising costs of healthcare programs, the growing importance of small firmsthat often have no (or less generous) pension plans, andthe rising value of assets in pension portfolios.
12. This increase in the normal retirement age, enacted inthe early 1980s, was intended to compensate for the risein life expectancy from that time until 2025 but not thegrowth in life spans before or after. C. Eugene Steuerleand Jon M. Bakija, Retooling Social Security for the 21stCentury: Right and Wrong Approaches to Reform (Washing-ton, D.C.: The Urban Institute Press, 1994), pp. 195-198.
13. The current Social Security offset rules are as follows:(1) for those under 65, benefits are reduced $1 for every $2of annual earnings in excess of $8,040; (2) for those 65 to69 years old, benefits are reduced $1 for every $3 ofearnings in excess of $11,160; (3) for those over 69, nobenefit reduction.
14. OBRA93 increased the percentage of Social Securitybenefits subject to tax for higher-income taxpayers. SocialSecurity benefits for individuals with incomes below$25,000 ($32,000 for joint returns) are not taxable. Forindividuals with combined incomes between $25,000and $34,000 ($33,000 and $44,000 for those filing jointly),50 percent of benefits are taxed. The act made 85 percentof benefits subject to tax for those with higher incomes.
15. Merrill Lynch, Retirement Savings in America.
16. A recent survey of 1,000 adult Americans sponsoredby Merrill Lynch found that 82 percent were unable topass a basic financial literacy test; 55 percent were notable to correctly answer which of stocks, bonds, savingsaccounts, and CDs had generated the highest historicalreturns; 29 percent could not make a simple compoundinterest calculation; and 87 percent could not accuratelyestimate the maximum annual Social Security benefit.Using Merrill Lynch data, Professor B. Douglas Bernheimfound a causal connection between substandard finan-cial literacy and inadequate saving. See B. DouglasBernheim, “The Determinants and Consequences ofFinancial Literacy,” (manuscript, October 1994).
CHAPTER 3
1. These projections included 5.0 million recipients ofdisability in 1993; this number is expected to rise to 10.5million by 2030. The projections assume that the fertilityrate will decline from 2.07 in 1990 to 1.9 in 2020 and holdsteady thereafter. (The fertility rate is the average numberof children that would be born to a woman in her lifetimeif she were to experience the birthrate prevailing in aparticular year.) Life expectancy at birth is assumed torise from about 75 years in 1990 to about 79 years in 2030.For details, see U.S. Department of Health and HumanServices, Social Security Administration, Annual Report
correlated both across countries (which suggests thatbarriers to international capital flows are still important)and over time within individual countries. Martin S.Feldstein and Charles Horioka. “Domestic Saving andInternational Capital Flows” Economic Journal (June 1990).It has been estimated that it would take a national savingrate of 5 to 5.5 percent simply to maintain productivitygrowth at about 1 percent annually. See Charles L.Schultze, “Of Wolves, Termites, and Pussycats, or WhyWe Should Worry about the Deficit,” The BrookingsReview (Summer 1989): 33.
5. On a current-account basis, the U.S. net foreign invest-ment position fell from a surplus of $234 billion in 1984to a deficit of $591 billion in 1992, the latest year for whichdata are available. Economic Report of the President (Wash-ington, D.C.: U.S. Government Printing Office, February1994), p. 385.
6. Some have speculated that the saving rate will risesharply as the baby boomers age. But the decline in thepersonal saving rate does not appear to have occurredbecause of demographic change; therefore, the aging ofthe baby boomers may not increase the overall savingrate significantly. Martin Neil Baily, Gary Burtless, andRobert E. Litan, Growth with Equity: Economic Policymakingfor the Next Century (Washington, D.C.: The BrookingsInstitution, 1994), p. 147.
7. See Restoring Prosperity: Budget Choices for EconomicGrowth, p. 6.
8. Congressional Budget Office, An Economic and BudgetOutlook Update (Washington, D.C.: U.S. GovernmentPrinting Office, August 1994), p. 8. The standardizedemployment budget measure, which adjusts for thebusiness cycle, suggests that nearly half of the deficitdecline reflects a change in fiscal policy.
9. CBO, An Economic and Budget Outlook Update, p. 29.
10. A recent survey conducted by Merrill Lynch indi-cated that among those who are not self-employed, only46 percent of those in the 45- to 64-year age bracketreported that they were saving specifically for retire-ment; among the baby-boom generation, only 25 percentindicated that they were currently saving for retirement.See Merrill Lynch, Retirement Savings in America(Princeton, N.J.: Merrill Lynch, Pierce, Fenner & Smith,Inc., 1993). Based on a telephone survey of workers whoare not self-employed, p. 3. Surveys conducted in 1993and 1994 by the Gallup Organization for the EmployeeBenefit Research Institute found that two-thirds of re-spondents who had not retired had begun to save fortheir retirement, although the amounts actually beingsaved appear to be quite inadequate. See EmployeeBenefit Research Institute, Public Attitudes on RetirementIncome, 1994, Report no. G-55 (Washington, D.C.: EBRI,1994); and EBRI, Public Attitudes on Retirement Age andPlanning, 1993, Report no. G-46 (Washington, D.C.:EBRI, 1993).

74
GATT-enabling legislation. The maximum interest ratethat could be used to calculate pension liabilities waslowered to 105 percent of the preceding four-yearweighted Treasury bond rate (from 110 percent). Thiswill cause some pension plans that were previously fullyfunded to become underfunded and to have to increasecontributions.
11. The term pension coverage refers to the percentage ofworkers eligible to participate in an employer- orunion-sponsored pension plan. Some eligible workerschoose not to participate. Although the absolute num-bers of covered and participating workers differ, cover-age and participation rates exhibit similar trends overtime.
12. Employee Benefit Research Institute, Pension Cover-age and Participation Growth: A New Look at Primaryand Supplemental Plans, Issue Brief no. 144 (Washington,D.C.: EBRI, December 1993), p. 4. Available data fromone source, the 1988 Current Population Survey, indicatedthat coverage declined slightly between 1979 and 1988,an event that raised some concern. Data for more recentperiods suggest that coverage has since increased or atleast leveled off. Moreover, IRS data on participationrates did not show the decline.
13. The obligation assumed by an employer in establish-ing a pension plan often takes one of two forms: (1) adefined benefit plan, whereby the employer providesspecified benefits that are established in advance byformula (usually affected by wage and years of service)and financed by variable employer contributions to apension fund, and (2) a defined contribution plan, wherebythe annual employer contributions are specified (usuallya percent of the wage) but the benefits are variable,depending on the performance of the fund. For furtherdescription, see Dan M. McGill and Donald S. Grubbs,Jr., Fundamentals of Private Pensions, 6th ed. (Philadelphia:Pension Research Council, Wharton School, Universityof Pennsylvania, 1989), p. 105.
14. David Kennell et al., Retirement Coverage in Small andLarge Firms, Final Report, (Paper prepared for the Officeof Advocacy, U.S. Small Business Administration,Washington, D.C.: June 1992), p. ES.8.
15. Based on tax status determination requests to the IRSfrom companies instituting new plans, it appears notonly that the total number of new plans has declined butalso that most of the new plans introduced have been ofthe defined contribution type. In 1982 alone, for example,85,000 plan sponsors applied for favorable determina-tion status, of whom 28,000 sponsored defined benefitplans; but in 1990, 1991, and 1992 combined, only 40,000sponsors applied, of whom just 3,000 were of the definedbenefit type. However, this measure of recent trends isnot ideal because application for favorable determina-tion status is not compulsory.
16. Those who favor defined benefit plans argue that
of the Board of Trustees, Federal Old-Age and SurvivorsInsurance and Disability Insurance Trust Funds, 1994 (Wash-ington, D.C.: U.S. Government Printing Office, 1994),p. 59.
2. See Social Security Administration, Annual Report of theBoard of Trustees of the Federal OASDI Trust Funds, 1994,p. 119.
3. In addition to economic and demographic factors, themagnitude of the necessary payroll tax increase woulddepend on such factors as when that tax increase wouldbe implemented and the size and rate of the drawdownof the surplus. The Social Security Administration calcu-lated that the OASDI rate would have to be raised by2.13 percentage points beginning in 1994 in order to bringthe program into actuarial balance over the seventy-five-year projection period (ending in 2068). (The pessi-mistic projection suggests a much larger tax increase.)However, it is unlikely that rates will be increased for thispurpose until much later, perhaps until the surplus be-gins to run down. Thus, the realized increase is likely tobe substantially higher than 2.13 percentage points.Social Security Administration, Annual Report of the Boardof Trustees of the Federal OASDI Trust Funds, 1994, p. 22.
4. It is sometimes argued that the ratio of covered work-ers to beneficiaries overstates the burden on workers.Robert Ball and Henry Aaron, “Social Security: It IsAffordable,” Washington Post, February 15, 1994, p. A17.
5. Two recent estimates place the cost of supporting theelderly at 2.5 times and 1.76 times the cost of supportinga child dependent. See Dennis A. Ahlburg and James W.Vaupel, “Immigration and the Dependency Burden”(manuscript, 1993), p. 6.
6. For example, the median age of immigrants to theUnited States is currently 28 years, but a 28-year-oldarriving in 1990 will be 88 by 2050 and probably retired.Therefore, in order to maintain the worker-retiree ratio atits 1990 level in the year 2050, additional immigrants ofworking age would be needed to fill the retiree’s place.
7. Thomas Espenshade, “Can Immigration Slow U.S.Population Aging?” Journal of Policy Analysis and Man–agement (1994); Ahlburg and Vaupel, “Immigration andthe Dependency Burden.”
8. In 1988, the median government employee pensionwas $8,049, but many federal retirees and some state andlocal retirees were not eligible for Social Security ben-efits. Joseph S. Piacentini and Jill D. Foley, EBRI Databookon Employee Benefits, 2d ed. (Washington, D.C.: EmployeeBenefit Research Institute, 1992), p. 103.
9. Increased saving out of current income increases in-vestment resources, whereas a rise in the market value ofexisting assets does not.
10. Indeed, a similar situation was engineered by one ofthe pension reform measures contained in the 1994

75
retirement income will be higher because fewer lump-sumdistributions are made from defined benefit plans andbecause the professional investors who manage the plansare likely to get a higher return on investment. On theother hand, the defined contribution plans are generallyfully portable, a feature that may improve retirementbenefits for those who have several jobs during theirworking years. See Richard V. Burkhauser and Dallas L.Salisbury, eds., Pensions in a Changing Economy, (Wash-ington, D.C., and Syracuse, N.Y.: Employee Benefit Re-search Institute and National Academy on Aging, 1993);and Andrew Samwick and Jonathan Skinner,“How Will Defined Contribution Pension Plans AffectRetirement Incomes?” (Paper prepared for conference on“Public Policy Toward Pensions,”sponsored by the Asso-ciation of Private Pension and Welfare Plans and theCenter for Economic Policy Research, Stanford Univer-sity, Stanford, Calif.: October 7-8, 1993).
17. Available data on lump-sum distributions are dis-cussed in Burkhauser and Salisbury, Pensions in a Chang-ing Economy, pp. 27 and 43-45.
18. Employee Benefit Research Institute, “RetirementProgram Lump-Sum Distributions: Hundreds of Billionsin Hidden Pension Income” Issue Brief no. 146(Washington, D.C.: EBRI, February 1994), p. 8.
19. Private pension funds will be drawn down as thebaby-boom generation retires. Indeed, one projectionindicates that the pension system will cease being a netsource of savings by 2024. Given the magnitude of theshift, there is concern that this will have a depressing ef-fect on asset prices. Sylvester Schieber and John Shoven,“The Consequences of Population Aging on Private Pen-sion Fund Saving and Asset Markets,” Working Paperno. 4665 (Cambridge, Mass.: National Bureau of Eco-nomic Research, March 1994).
20. The PBGC’s single-employer insurance fund contin-ues to be in deficit on a net liability basis; and at the endof 1993, PBGC liabilities ($11.3 billion) exceeded its assets($8.4 billion) by $2.9 billion. Although ERISA states thatthe United States is not liable for any obligation incurredby the PBGC [Title IV Section 4002(g)(2)], Congress hasbehaved as if the PBGC’s liabilities are the liabilities of thefederal government because it wants to avoid a default onfederally insured pensions. Consequently, many haveconcluded, as the Congressional Budget Office has, that“the federal government is almost certainly responsiblefor those liabilities of the PBGC that exceed PBGC’sassets.” CBO, Controlling Losses of the Pension Benefit Guar-anty Corporation (Washington, D.C.: U.S. GovernmentPrinting Office, January 1993), p. 3.
21. Pension Benefit Guaranty Corporation, Annual Report1992 (Washington, D.C.: U.S. Government Printing Of-fice, 1992), pp. 4 and 10; and PBGC, Annual Report 1993(Washington, D.C.: U.S. Government Printing Office,1993), pp. 7, 20-21.
22. A number of alternative concepts are used to estimatepension liabilities that can significantly affect the percep-tion of the adequacy of funding. Because of the need forfederal revenues, Congressional tax-writing committeestend to choose less stringent standards of funding todetermine the eligibility of contributions. For example,tax provisions of OBRA87, which had the effect of sharplyreducing business contributions to pension funds, re-quired that the calculation of maximum eligible fundingbe based on 150 percent of the termination-of-plan conceptof liabilities. This concept assumes the pension is termi-nated at the valuation date and therefore ignores in-creases in obligations that will arise because of futurewage increases and years of service. Broader measures offunding adequacy, such as the concept required by theFinancial Accounting Standards Board (FASB Statement87), do include projected increases in earnings and, con-sequently, generally show higher liabilities.
23. See Chapter 2 for recommendations for changes in theSocial Security system.
24. Those single men and women who have an averagewage and turn 65 years old in 1995 and 2010, respec-tively, will be the first cohorts with average wages toreceive a negative return. Returns remain positive inthose years for all but the highest-income married cou-ples. For high-wage single individuals who turn 65 in2010, the present value of taxes paid will exceed theannuity value of benefits by $135,000 for men and $84,000for women. See C. Eugene Steuerle and Jon M. Bakija,Retooling Social Security for the 21st Century (Washington,D.C.: Urban Institute Press, 1994), p. 107.
25. The payroll tax rate for employees and employers in1994, including Medicare, was 7.65 percent, consistingof 5.60 for retirement (OASI), 0.60 for disability (DI),and 1.45 for health (HI). Self-employed persons pay ahigher rate.
26. Social Security Administration, Annual Report of theBoard of Trustees, OASDI Trust Funds, 1994, pp. 5 and 177.
27. The full commission did not accept the Kerrey-Danforth proposals, of which the four most important inrelation to Social Security were: (1) further increasing theSocial Security retirement age, (2) reducing growth ofinitial benefits relative to earnings, (3) reducing benefitsfor upper-income workers, and (4) replacing part of theSocial Security program with a mandatory saving pro-gram. The leadership of the 104th Congress has alsoindicated that no changes will be made to Social Securityfor the time being.
28. In August 1994, the CBO projected that the totalfederal deficit would be $202 billion in fiscal 1994. TheOASDI surplus was expected to total $58 billion, indicat-ing a non–Social Security debt of $260 billion. U.S. Con-gress, Congressional Budget Office, The Economic andBudget Outlook: An Update (Washington, D.C.: U.S. Gov-ernment Printing Office, August 1994), p. 29. Because of

76
the fungibility of government income, strictly speaking,it cannot be stated that the Social Security surplus is notused to finance government investment spendinginstead of consumption spending. Some would like tosee the annual surplus invested in private assets in anattempt to ensure that pension savings are increased,though this would not necessarily increase national sav-ing. Others argue that the non–Social Security budgetshould be in balance so that the Social Security surplusescan be used to retire federal debt and, thereby, increasethe nation’s saving. See Rudolph G. Penner, Social Secu-rity and National Saving (New York: Committee for Eco-nomic Development, 1989).
29. Office of Management and Budget, “Budget Baseline,Historical Data and Alternatives for the Future,” Budgetof the United States Government for Fiscal Year 1994 (Wash-ington, D.C.: U.S. Government Printing Office, January1993), pp. 187-196.
30. There have been widespread news reports aboutabuses involving excessively generous pensions. Forexample, local government pensions that base benefitson earnings during the final years of work occasionallyhave been manipulated by permitting workers in thosefinal years to work long hours of overtime and to includeovertime pay in earnings counted for retirement. Somefederal employees also qualify for very generous pen-sions, often from legislative service or from combinedcivilian and military service.
31. Pension coverage is higher in the public sector, andbenefits are sometimes more generous than in the privatesector. But it is not always the case that public-sectorpensions are a “better deal” for workers thanprivate-sector pensions. Most public-sector workers arerequired to contribute to their defined benefit plan,whereas most private-sector workers make contribu-tions to Social Security only. Private-sector workers aremore likely to have a supplementary defined contribu-tion plan, and many public-sector workers are not cov-ered by Social Security. (New workers in the publicsector are now required to be covered by Social Security.)A recent study of retirement income provided by definedbenefit plans and Social Security found that the initialretirement income replacement ratio for typical newlyretired public-sector workers not covered by Social Secu-rity was similar to or slightly better than the incomereplacement ratio for private-sector workers but that thecontribution to pensions made by public-sector workerstypically exceeded contributions made by private-sectorworkers. Those public-sector workers who were coveredby Social Security on average had very high ratios ofreplacement income, but their contributions were simi-larly high (Table 3).
32. About half of state and local government employeescovered by defined benefit pensions and all full-timefederal employees are in programs that provide auto-matic cost-of-living increases. Social Security is also ad-
justed for inflation. Many private sector pensions areadjusted to compensate for inflation, but the adjustmentis nearly always discretionary and frequently intermit-tent. William J. Wiatrowski, “On the Disparity betweenPrivate and Public Pensions,” Monthly Labor Review(April 1994): 3-9.
33. It is also argued that automatic cost-of-living adjust-ments for Social Security and other pension benefits raisesocial costs by reducing the voting constituency thatsupports anti-inflationary policies.
34. Elderly income has also grown relative to that of thenonelderly as a result of economic conditions. A largeshare of their income has been shielded from inflationand unemployment; consequently, the elderly may berelatively well off in bad times. For example, high unem-ployment, high inflation, and high interest rates in the1979–1984 period helped to reduce the real income of thenonelderly by 0.3 percent while raising the income of theelderly by 3.4 percent.
35. According to the example given in “Retirement Ben-efits and Saving Requirements” (see page 39), if the realreturn were 6 percent annually, the individual’s requiredrate of saving to attain the same retirement income targetwould be only 7 percent. This illustration also presentsestimates of required saving to achieve alternativereplacement ratios.
36. Many managers of defined contribution pension plansfear that participants are too risk averse to invest inportfolios with higher potential returns. Educating par-ticipants about the required rate of saving and assetreturns needed to attain a desired level of retirementincome is increasingly emphasized. For example,TIAA-CREF, a very large defined contribution plan,encourages its members to include equities in their port-folios. Based on its historical rates of return on a fifty-fiftysplit between a traditional annuity and a common-stockfund, TIAA-CREF reports that a contribution of 10 per-cent of salary for thirty years yields a replacement rate of50.7 percent of final pay. See John J. McCormack, State-ment presented to U.S. Department of Labor, ERISAAdvisory Council, Washington, D.C., September 23, 1993.
37. Employee Benefit Research Institute, EBRI Data Bookon Employee Benefits, 2d ed. (Washington: D.C.: EBRI,1992), pp. 28 and 36.
38. The study does concede that future retirement looksvery bleak for some groups, particularly the poorly edu-cated and single women with few marketable skills.Congressional Budget Office, Baby Boomers in Retirement:An Early Perspective (Washington, D.C.: U.S. GovernmentPrinting Office, September 1993).
39. Alan J. Auerbach and Laurence J. Kotlikoff, “TheUnited States Fiscal and Savings Crisis and Their Impli-cations for the Baby Boom Generation” (Paper presentedat a policy forum sponsored by the Employee BenefitResearch Institute, Washington, D.C., May 4, 1994).

77
40. Hilary Williamson Hoynes and Daniel McFadden,“The Impact of Demographics on Housing andNon-Housing Wealth in the United States” (NationalBureau of Economic Research, Inc., Working Paper no.4666, Cambridge, Mass., March 1994).
41. These and other arguments have led some scholarsto conclude that the CBO calculations actually present avery pessimistic picture about the economic status ofbaby boomers in retirement. B. Douglas Bernheim, “TheAdequacy of Saving for Retirement: Are the Baby Boom-ers on Track?” (Paper presented at EBRI Policy Forum,Washington, D.C., May 4, 1994).
42. See B. Douglas Bernheim, “Is the Baby Boom Genera-tion Preparing Adequately for Retirement?” TechnicalReport, mimeographed 1992, and a “Summary Report”with the same title published by Merrill Lynch, 1993. Themethodology is also discussed by Bernheim and JohnKarl Scholz in “Private Saving and Public Policy,” TaxPolicy and the Economy, vol. 7, ed. James M. Poterba(Cambridge, Mass.: National Bureau of Economic Re-search and MIT Press, 1993), pp. 76-87.
43. Karen Martin Gibler and Joseph Rabianski, “ElderlyInterest in Home Equity Conversion,” Housing PolicyDebate 4, no. 4 (1993): 565-588.
CHAPTER 4
1. Over the years, CED has sponsored critical research onreforming the income tax, including perhaps the mostbasic source on the consumed-income tax. In the 1980s,CED commissioned a study by David Bradford, pub-lished as Untangling the Income Tax, a Committee forEconomic Development publication, (Cambridge, Mass:Harvard University Press, 1986). Bradford described theU.S. income tax system as a hybrid that has sometimesfollowed the comprehensive accrual-income theory, whichincludes in the income tax base all consumption andsaving, and sometimes followed the consumed-incometheory, which does not include savings in the tax base.Bradford believes that our hybrid approach produces amuddle that is worse than would occur if we were tofollow either theory consistently. He recommendedmoving from the accrual-income theory toward the con-sumption theory.
Bradford makes clear that neither theory is the truetheory. Rather, he believes that the contending theoriespresent a choice. The language of the debate on particularquestions (e.g., taxation of pensions) is influenced might-ily if one accepts one or the other theory as true. Exclud-ing retirement savings from the tax base is described asthe grant of a subsidy or incentive from the perspectiveof the comprehensive accrual-income theory, whereasthe inclusion of those savings in the tax base is describedas a penalty or disincentive from the perspective of theconsumed-income theory. On page 208, Bradford states:
There is a certain irony about the existence of savingand investment incentives in the context of an incometax, inasmuch as the principal reason for believingthat special incentives for these activities are neededis the tax itself. The rules that we think of under thisheading are largely aimed not at mitigating someinherent defect in the economy but at offsetting aproblem created by the tax system in the first place:namely, the disincentive effect of income taxes onsaving and investing.
Describing tax-qualified savings as an incentive (underthe comprehensive accrual-income theory) may also con-tribute to excessive and complicated regulation of whatis deemed to be a special exception. Under the consump-tion theory, the exclusion of savings from the tax base istreated as normal, not a special exception, and thereforeis less likely to be subject to overregulation.
2. The federal government’s classification of the deferralof taxes on pension savings as a tax expenditure is consis-tent with the income tax view, not the consumed-incomeview. (See “Tax Expenditures and Pension Tax Prefer-ences,” page 46.)
3. Target savers are likely to be low-income individualswho save the minimum needed for a specific purpose,such as a down payment on an automobile or an appli-ance, whereas those who increase savings in response toa higher return are likely to be higher-income earnerswho have discretion to save for more than minimumfuture consumption.
4. See, for example, Stephen F. Venti and David A. Wise,“IRAs and Saving,” in The Effects of Taxation on CapitalAccumulation, ed. Martin Feldstein (Chicago: Universityof Chicago Press, 1987), pp. 7-40; and James Poterba,Steven F. Venti, and David A. Wise, “401(k) Plans andTax-Deferred Saving,” National Bureau of EconomicResearch, Working Paper no. 4181 (Cambridge, Mass.:NBER, October 1992).
5. Poterba, Venti and Wise, “401(k) Plans andTax-Deferred Saving.”
6. This is because the positive impact on savings result-ing from the increased return will dominate over theshifting of savings as funds available for shifting decline.See Eric M. Engen, William G. Gale, and John Karl Scholz,“Do Saving Incentives Work?” in Brookings Papers onEconomic Activity, vol 1., ed. William C. Brainard andGeorge L. Perry (Washington, D.C.: Brookings Institu-tion, 1994), pp. 85-152.
7. To promote household saving, Bernheim and Scholzproposed premium saving accounts (PSAs) as an alterna-tive to IRAs. A PSA would require each taxpayer to savein total some fixed amount before becoming eligible tomake contributions to a tax-preferred account. Theamount of eligible contributions would vary with ad-justed gross income. B. Douglas Bernheim and John Karl

78
Scholz, “Private Saving and Public Policy,” in Tax Policyand the Economy, ed. James Poterba (Cambridge, Mass.:NBER, 1993), p. 98.
8. B. Douglas Bernheim and John Karl Scholz, “PrivateSaving and Public Policy,” National Bureau of EconomicResearch, Working Paper no. 4215 (Cambridge, Mass.:NBER, November 1992), p. 24.
9. Alicia Munnell, “It’s Time to Tax Employee Benefits,”New England Economic Review (July-August 1989): 49-63.
10. Some researchers have also found that policies thatreduce pension tax benefits are likely to increase inequal-ity in the distribution of wealth. See Robert L. Clark andElisa Wolper, “Pension Tax Expenditures: MagnitudeDistribution and Economic Effect,” (Paper prepared forconference on “Public Policy Toward Pensions,” spon-sored by the Association for Private Pension and WelfarePlans and the Center for Economic Policy Research,Stanford University, October 1993).
11. The advantages and disadvantages of compulsorysaving plans are discussed in William G. Gale and RobertE. Litan, “Saving Our Way Out of the Deficit Dilemma,”The Brookings Review (Fall 1993): 7-11.
12. This has occurred yet again in the 1994 legislationenabling GATT. For example, one measure effectivelydelays indexation of pension benefit and contributionlimits purely as a revenue-raising measure. (See Retire-ment Protection Act of 1994, Title VII, Section 732).
13. For the most recent CED statement on the budgetdeficit, see Restoring Prosperity: Budget Choices for Eco-nomic Growth (1992), p. 2.
14. See Restoring Prosperity: Budget Choices for EconomicGrowth, pp. 6-7.
CHAPTER 5
1. Pension plans for public-sector employees are notcovered under the federal laws governing private plans.
2. Employee Benefit Research Institute, Pension Fundingand Taxation: Implications for Tomorrow (Washington, DC:EBRI, 1994), p. 44.
3. Many propose that the United States abandon thecurrent practice of taxing income and adopt aconsumption-based tax system, which would exempt allsaving from taxation. In such a system the limits on taxpreferences would not be necessary. (See Chapter 4.)
4. American Council of Life Insurance, The Pension Legacy:The Case for Preserving the Private Pension System (Wash-ington, D.C.: 1993), p. 6.
5. A forfeiture is a situation whereby an individual ceasesemployment before being vested with the pension ben-efits.
6. See William G. Gale, “Public Policies and PrivatePension Contributions,” Journal of Money, Credit, andBanking, forthcoming; and Scott B. Smart and JoelWaldfogel, “Tax Policy, Saving, and Pension Funding”(manuscript, Indiana University, October 1992).
7. Sylvester J. Schieber and John B. Shoven, The Con-sequences of Population Aging on Private Pension FundSaving and Asset Markets, CEPR Technical Paper no. 363(Stanford, Calif.: Center for Economic Policy Research,Stanford University, September 1993), p. 12. A 1989 sur-vey by Mercer-Meidinger-Hansen found comparableresults. See William M. Mercer-Meidinger-Hansen, TheEffect of OBRA on Pension Plans: A Survey (New York:William M. Mercer-Meidinger-Hansen, 1989).
8. Contributions to defined contribution plans werecapped at $30,000 until the indexed benefit limit fordefined benefit plans reaches $120,000. Contributionshave also been reduced by limits on considered compen-sation.
9. If an employee participates in a defined benefit and adefined contribution plan, a special overall limitation oncontributions and benefits is applied. This limit uses acomplicated formula based on the limits for individualplans. Thus, if the individual-plan limits are changed, themultiple-plan limit also changes.
10. This limit applies to annuities; if a lump sum isinvolved, the limit is $742,000.
11. Emily S. Andrews, “The Growth and Distribution of401(k) Plans,” in U.S. Department of Labor, Pension andWelfare Benefits Administration, Trends in Pensions 1992(Washington, D.C.: U.S. Government Printing Office,1992), p. 164.
12. Section 403(b) plans (see “Defined Contribution Plans,pp. 54-55) already include a catch-up provision thatallows additional employer and employee deferrals forindividuals who have been with an employer fifteenyears. However, these plans are available only to non-profit organizations and educational institutions.
13. There is also a family aggregation rule, which stipu-lates a combined $150,000 limit for a married couple ifthey both work for the same employer and one spouse isin the top group of highly compensated employees.
14. For example, in a defined benefit plan, an individualearning $175,000 and participating in a plan that specifiesa pension benefit of 40 percent of salary would be cred-ited with only 40 percent of $150,000 under the new rule,a $10,000 reduction in retirement benefit. Of course,because the contributions are limited, benefits are re-duced accordingly.
15. They are referred to as the actual deferral percentagetests: (1) The average percentage of compensation de-ferred (i.e., contributed to the plan) for the highly com-pensated group cannot exceed 125 percent of the average

79
deferral percentage for the low-paid group. (2) The aver-age deferral percentage for the highly compensated groupcannot be more than two times that of the other group,and the difference between the percentages cannot bemore than 2 percent. Matching employer contributionsare subject to similar tests under Section 401(m) of theInternal Revenue Code.
16. In the case of saving plans with matchingemployer-employee contributions, nondiscriminationrules would require that the employer contribution be auniform percent of the contribution made by individualemployees. Retention of a ceiling on contributions tosecondary 401(k) plans would prevent highly compen-sated employees from gaining an inordinately large ben-efit from this arrangement
17. John Trutko and John Gibson et al. Cost and Impact ofFederal Regulation on Small Versus Large Business Retire-ment Plans, Final Report (submitted to the Office of theChief Counsel for Advocacy, Small Business Administra-tion, June 1990), p. 66.
18. A pension plan had to satisfy one of these tests in orderto be in compliance:
1. Percentage test: The plan must cover at least 70 percentof all non–highly compensated employees.
2. Ratio test: The percentage of non–highly compensatedemployees covered under a plan must be at least 70percent of the percentage of highly compensatedemployees covered.
3. Average benefits percentage test: Both of the following must be satisfied to pass this test:
a. The plan must cover a nondiscriminatory classifi-cation of employees.
b. The ratio of employer-provided benefits or contri-butions to the participant’s compensation for non–highly compensated employees must be at least 70percent that of highly compensated employees.
19. The participation rule requires that no individual whohas reached the age of 21 and has one year of service canbe excluded from a plan. Employees must, at a minimum,be vested according to one of two schedules: (1) five-yearcliff or (2) 20 percent after three years and an additional20 percent for each of the next four years.
20. Independent projections by the Office of Manage-ment and Budget put the PBGC’s exposure at about $24billion over the next thirty to forty years.
21. Changes in a plan’s unfunded liability arising from anincrease in plan benefits can be amortized over thirtyyears. Losses or gains resulting from changes in actuarialassumptions can be amortized over ten years; experiencelosses or gains can be amortized over five years. There area number of other amortization schedules that apply toother categories of gains and losses. The Retirement
Protection Act of 1994 speeds up amortization of differ-ent kinds of unfunded liabilities but also further compli-cates the amortization schedules.
22. McGill and Grubbs, Fundamentals of Private Pensions,p. 611.
23. Carolyn L. Weaver, “Government Guarantees ofPrivate Pension Benefits: Current Problems and LikelyFuture Prospects” (Paper prepared for conference on“Public Policy Towards Pensions,” sponsored by theAssociation of Private Pension and Welfare Plans andthe Center for Economic Policy Research, Stanford Uni-versity, September 1993), pp. 13-14.
24. Weaver, “Government Guarantees of Private Pen-sion Benefits: Current Problems and Likely Future Pros-pects,” pp. 14-15.
25. Pension Benefit Guaranty Corporation, Annual Re-port 1992 (Washington, D.C.: U.S. Government PrintingOffice, 1992), p. 11.
26. The Retirement Protection Act of 1994 gives thePBGC authority to sue plan sponsors to enforce mini-mum-funding standards where contributions are defi-cient by more than $1 million.
27. Celia Silverman and Paul Yakoboski, “Public andPrivate Pensions Today: An Overview of the System,” inPension Funding and Taxation: Implications for Tomorrow,ed. Dallas L. Salisbury and Nora Super Jones (Washing-ton, D.C.: EBRI, 1994), p. 19.
28. Hay/Huggins Company, Inc., Pension Plan ExpenseStudy for the Pension Benefit Guaranty Corporation (Wash-ington, D.C.: Hay/Huggins, September 1990).
29. Small plans are at a significant cost disadvantage intrying to comply with constantly changing regulationsbecause the variable costs of plan administration are notclosely linked to the number of participants. Pensionplan service providers typically charge a fixed fee plus aper-participant fee; however, the latter may be reducedif the number of plan participants exceeds a threshold.See Trutko and Gibson et al., Cost and Impact of FederalRegulation on Small Versus Large Business Retirement Plans,p. 74.
30. The two plan sizes considered were 25 and 200participants. Trutko and Gibson et al., p. 80.
31. These changes include OBRA93, which further re-duced considered compensation, and requires compli-cated calculations for compliance. See pages 57-59 of thisdocument.
32. Another 7 percent cited limitations on benefits toowners resulting from regulations governing maximumbenefits, considered compensation, and nondiscrimina-tion. Other major reasons were plant shutdowns or un-certainty of employer income (22 percent) and employer/

80
employee preferences (17 percent). David Kennell et al.Retirement Plan Coverage in Small and Large Firms, FinalReport (submitted to Office of Advocacy, U.S. Small Busi-ness Administration, June 1992), Table III-19. See alsoTrutko and Gibson et al., pp. 60-61.
33. Although many workers were left without coveragebecause of the failure of employers to form successorplans, the rapid decline in pension coverage under de-fined benefit plans cannot be attributed exclusively toregulation. In addition to administrative costs, research-ers believe that labor market shifts have been a crucialfactor: A decreasing number of workers are in industriesdominated by large, unionized firms that traditionallysponsor defined benefit plans. Daniel J. Beller and HelenH. Lawrence, “Trends in Private Pension Plan Coverage”in U.S. Department of Labor, Pension and Welfare Ben-efits Administration, Trends in Pensions 1992 (Washing-ton, D.C.: U.S. Government Printing Office, 1992), p. 70.
34. The impact of regulatory reform on the formation ofdefined benefit plans by very small firms may be lesscritical. Many smaller firms still do not offer their employ-ees any pension plan. Evidently, economic factors such asuncertainty about income have much to do with this.Smaller firms also tend to have a greater percentage ofemployees who are young, part-time, and/or not likely tostay for a long period in their job. See Kennell et al.,Retirement Plan Coverage in Small and Large Firms, FinalReport, p. ES.8.
APPENDIX
1. Where the plan provides for full immediate vesting, theemployer can require three years of service. Also, em-ployees who begin service before age 25 can have threeyears of that service credited toward vesting when theyattain 25.
2. The vesting grades were now as follows: at least 25percent after five years, increasing by 5 percent in each ofthe following five years and 10 percent annually in thethird five-year tranche.
3. However, an employee with ten years of service mustbe 50 percent vested even if the sum of age and servicedoes not exceed 45.
4. The normal cost of a pension plan in a particular yearis the cost of benefits accrued in that year.
5. A money purchase plan is a defined contribution planwhereby periodic contributions are made according to aformula, usually a percent of salary. Some plans mayrequire contributions by the employee as well as theemployer. A profit-sharing plan is another type of definedcontribution plan, with the distinctive characteristic thatcontributions are likely to be variable because they aretied to a firm’s profits.
6. The most common type of 401(k) plan entails an em-ployee salary reduction, the amount of which is placed ina tax-deferred account. About half of these plans involvesome amount of matching employer contribution.
7. The contribution limit for SEPs is now the lesser of$30,000 or 15 percent of compensation.
8. Under a leveraged ESOP, the plan’s trustee takes out aloan and uses it to purchase employer stock, which itselfis pledged as collateral for the loan. As repayments ofprincipal are made on the loan, stock can be released ascollateral and allocated to employee accounts.
9. Down from $45,475.
10. Previously 7 percent.
11. The major rules are as follows:
a. Vesting: Either three-year cliff or graded to achievefull vesting after six years.
b. Minimum benefits: For nonkey employees, the mini-mum annual benefit from a defined benefit plan wasset at the lesser of 20 percent of average compensationor 2 percent of average compensation multiplied bythe number of years of service.
c. Minimum contributions: For nonkey employees, theminimum contribution to a defined contribution planwas set at the lesser of 3 percent of cash compensationor the highest contribution rate for a key employee.
d. Considered compensation: Only the first $200,000 ofcompensation could be taken into account when cal-culating benefits.
e. Social Security integration: Neither Social Securitybenefits nor taxes could be counted against minimumpension benefits.
f. Aggregate benefit and contribution limits on multipleplans: Normally, if an employer operates a plan ofeach type (i.e., one defined contribution and one de-fined benefit), the total benefits and contributionscannot exceed 140 percent of the limit governing oneplan if the percentage of compensation limit applies or125 percent of the limit if the dollar limit applies. Fortop-heavy plans that would otherwise come under the125 percent rule, benefits and contributions frommultiple plans were reduced to 100 percent unlessminimum benefits and contributions for nonkey em-ployees are increased 1 percentage point and no morethan 90 percent of benefits and account balances isdesignated to key employees.
12. However, the plan was made liable to the PBGC forthe sum of total unfunded benefits up to 30 percent of networth and the excess (if any) of 75 percent of all unfundedbenefits minus 30 percent of net worth.
13. An integrated defined benefit excess plan is one that

81
provides a higher percentage of benefits for earningsabove the integration level than for earnings below theintegration level. Under prior law, it was possible todesign a plan so that there was no benefit below theintegration level.
14. Here the integration level is defined as covered compen-sation. Covered compensation is the average Social Secu-rity taxable earnings base for the thirty-five years imme-diately preceding the participant’s normal retirementage.
15. Defined as a plan in which the benefit attributable toemployer contributions is reduced by a specified amount.
16. TRA also introduced a definition of highly compen-sated employee that differed from that in the top-heavyrules contained in TEFRA.
17. This is a subjective test administered by the IRS.
18. The deficit reduction contribution consisted of twoparts: (1) the amount necessary to amortize unfunded oldliability in equal annual installments over eighteen yearsand (2) a percentage of unfunded liability relating to thecurrent plan year.
19. Unpredictable contingent event benefits are benefitspromised in the event of the closure of a facility or someother occurrence that cannot be reliably anticipated.
20. Reduced from 10 percent above the same average.
21. Amortization of increases in current liability as aresult of the new rules regarding the allowable interestrates and mortality table had to be amortized in equalannual installments over a twelve-year period beginningin 1995.

82
Page 14, JAMES Q. RIORDAN
The report is excellent and timely. The U.S.retirement system is indeed underfunded,overpromised, and overregulated. As a resultwe have less savings for retirement than weneed. This is, however, a special case of themore general problem that government policygenerally discourages savings and encouragesconsumption. CED has long warned about thelack of savings and the consequences of gov-ernment dissaving (deficits). The deficit has, attimes, shown a year-to-year decline in the lastdecade; but in the best of years it has been toolarge, and the outlook is bleak.
If net saving is to increase, it will need tocome from increased private saving — includ-ing increased retirement savings.
The report makes many excellent incremen-tal suggestions to improve the tax and regula-tory scheme governing retirement savings. Iwish, however, that we had recommended amore fundamental cure for our problem. The
MEMORANDUM OF COMMENT, RESERVATION, OR DISSENT
report properly puts the retirement savingsissue in the context of the debate now goingforward on whether savings of any kindshould be included in the income tax base.Indeed it briefly states the case for moving toa tax system that does not include privatesaving in the income tax base. Unfortunately,it does not carry the discussion to its logicalconclusion and instead makes the assumptionthat the government will persist in acceptingas revealed wisdom the comprehensive ac-crual-income theory that treats every instanceof deferred taxation on savings as a prefer-ence. The assumption has led the report toaccept continuing limits and regulatory com-plications that will limit the increase in sav-ings. It inevitably leads to the use of languagethat distorts the dialogue. I wish that we hadgrasped the nettle and recommended taxingconsumption and not savings.
Nevertheless, this is a fine report, and Ihope that all of the improvements recom-mended will be adopted.

For more than 50 years, the Committee forEconomic Development has been a respectedinfluence on the formation of business andpublic policy. CED is devoted to these twoobjectives:
To develop, through objective research andinformed discussion, findings and recommenda-tions for private and public policy that will contrib-ute to preserving and strengthening our free soci-ety, achieving steady economic growth at highemployment and reasonably stable prices, increas-ing productivity and living standards, providinggreater and more equal opportunity for every citi-zen, and improving the quality of life for all.
To bring about increasing understanding bypresent and future leaders in business, govern-ment, and education, and among concerned citi-zens, of the importance of these objectives and theways in which they can be achieved.
CED’s work is supported by privatevoluntary contributions from business andindustry, foundations, and individuals. It is
independent, nonprofit, nonpartisan, andnonpolitical.
Through this business-academic partner-ship, CED endeavors to develop policy state-ments and other research materials thatcommend themselves as guides to public andbusiness policy; that can be used as texts incollege economics and political science coursesand in management training courses; that willbe considered and discussed by newspaperand magazine editors, columnists, and com-mentators; and that are distributed abroad topromote better understanding of the Ameri-can economic system.
CED believes that by enabling businessleaders to demonstrate constructively their con-cern for the general welfare, it is helping busi-ness to earn and maintain the national andcommunity respect essential to the successfulfunctioning of the free enterprise capitalistsystem.
OBJECTIVES OF THE COMMITTEE FORECONOMIC DEVELOPMENT
83

*Life Trustee
Chairman
JOHN L. CLENDENIN, Chairman andChief Executive Officer
BellSouth Corporation
Vice ChairmenPHILIP J. CARROLL, President and Chief
Executive OfficerShell Oil CompanyROBERT CIZIK, Chairman and Chief
Executive OfficerCooper Industries Inc.A.W. CLAUSEN, Retired Chairman and
Chief Executive OfficerBankAmerica CorporationALFRED C. DECRANE, JR., Chairman of the
Board and Chief Executive OfficerTexaco Inc.MATINA S. HORNER, Executive Vice PresidentTIAA-CREFJAMES J. RENIERRenier & Associates
TreasurerJOHN B. CAVE, PrincipalAvenir Group, Inc.
REX D. ADAMS, Vice President - AdministrationMobil CorporationPAUL A. ALLAIRE, Chairman and
Chief Executive OfficerXerox CorporationIAN ARNOF, President and
Chief Executive OfficerFirst Commerce CorporationEDWIN L. ARTZT, Chairman of the Board and
Chief ExecutiveThe Procter & Gamble CompanyWILLIAM F. BAKER, President and
Chief Executive OfficerWNET/Channel 13RICHARD BARTH, Chairman, President and
Chief Executive OfficerCiba-Geigy CorporationBERNARD B. BEAL, Chief Executive OfficerM. R. Beal & Co.HANS W. BECHERER, Chairman and
Chief Executive OfficerDeere & CompanyHENRY P. BECTON, JR., President and
General ManagerWGBH Educational FoundationALAN BELZER, Retired President and
Chief Operating OfficerAlliedSignal Inc.PETER A. BENOLIEL, Chairman of the BoardQuaker Chemical CorporationMICHEL L. BESSON, President and
Chief Executive OfficerSaint-Gobain CorporationROY J. BOSTOCK, Chairman and
Chief Executive OfficerD’Arcy, Masius, Benton & Bowles, Inc.
CED BOARD OF TRUSTEES
DENNIS C. BOTTORFF, President andChief Executive Officer
First American Corporation & First AmericanNational Bank
C. L. BOWERMAN, Executive Vice Presidentand Chief Information Officer
Phillips Petroleum CompanyMIKE R. BOWLIN, President and
Chief Executive OfficerARCODICK W. BOYCE, Chief Executive OfficerFTDERNEST L. BOYER, PresidentCarnegie Foundation for the Advancement
of TeachingRICHARD J. BOYLE, Vice ChairmanChase Manhattan Bank, N.A.JOHN BRADEMAS, President EmeritusNew York UniversityEDWARD A. BRENNAN, Chairman and
Chief Executive OfficerSears, Roebuck & Co.ELI BROAD, Chairman, President and
Chief Executive OfficerSunAmerica Inc.STEPHEN L. BROWN, Chairman and
Chief Executive OfficerJohn Hancock Mutual Life Insurance CompanyJOHN H. BRYAN, Chairman and
Chief Executive OfficerSara Lee CorporationJ. GARY BURKHEAD, PresidentFidelity Management and Research CompanyTHEODORE A. BURTIS, Retired Chairman
of the BoardSun Company, Inc.*OWEN B. BUTLER, Retired Chairman of the BoardThe Procter & Gamble CompanyJEAN B. BUTTNER, Chairman and
Chief Executive OfficerValue Line Inc.*FLETCHER L. BYROM, ChairmanAdience, Inc.DONALD R. CALDWELL, Executive Vice
PresidentSafeguard Scientifics, Inc.FRANK C. CARLUCCI, ChairmanThe Carlyle GroupPHILIP J. CARROLL, President and
Chief Executive OfficerShell Oil CompanyEDWARD M. CARSON, ChairmanFirst Interstate BancorpROBERT B. CATELL, President and
Chief Executive OfficerBrooklyn Union Gas CompanyJOHN B. CAVE, PrincipalAvenir Group, Inc.JOHN S. CHALSTY, President and
Chief Executive OfficerDonaldson, Lufkin & Jenrette, Inc.RAYMOND G. CHAMBERS, Chairman
of the BoardAmelior Foundation

FOREST J. FARMERRochester Hills, MichiganKATHLEEN FELDSTEIN, PresidentEconomics Studies, Inc.RONALD E. FERGUSON, Chairman, President and
Chief Executive OfficerGeneral RE CorporationWILLIAM C. FERGUSON, Chairman and
Chief Executive OfficerNYNEX CorporationRICHARD B. FISHER, ChairmanMorgan Stanley Group, Inc.*EDMUND B. FITZGERALD, Managing DirectorWoodmont Associates*WILLIAM H. FRANKLIN, Retired Chairman
of the BoardCaterpillar Inc.HARRY L. FREEMAN, PresidentThe Freeman CompanyELLEN V. FUTTER, PresidentAmerican Museum of Natural HistoryJOHN W. GALIARDO, Vice Chairman and General CounselBecton Dickinson and CompanyALBERT R. GAMPER, JR., President and
Chief Executive OfficerThe CIT Group, Inc.RICHARD L. GELB, Chairman of the BoardBristol-Myers Squibb CompanyJOHN A. GEORGES, Chairman and
Chief Executive OfficerInternational Paper CompanyRAYMOND V. GILMARTINPresident and Chief Executive OfficerMerck & Company, Inc.BOYD E. GIVAN, Senior Vice President and
Chief Financial OfficerThe Boeing CompanyCAROL R. GOLDBERG, PresidentThe AVCAR Group, Ltd.ELLEN R. GORDON, President and
Chief Operating OfficerTootsie Roll Industries, Inc.JOSEPH T. GORMAN, Chairman and
Chief Executive OfficerTRW Inc.DENNIS J. GORMLEY, Chairman and
Chief Executive OfficerFederal-Mogul CorporationEARL G. GRAVES, SR., Publisher and
Chief Executive OfficerBlack Enterprise MagazineHANNA H. GRAY, President Emeritus and Harry Pratt
Judson Distinguished Service Professor of HistoryThe University of ChicagoWILLIAM H. GRAY, III, President and
Chief Executive OfficerUnited Negro College FundROSEMARIE B. GRECO, President and
Chief Executive OfficerCoreStates BankGERALD GREENWALDGreenwald & Freeman AssociatesBARBARA B. GROGAN, PresidentWestern Industrial ContractorsCLIFFORD J. GRUM, Chairman of the Board
and Chief Executive OfficerTemple-Inland Inc.JOHN H. GUTFREUNDNew York, New York
ROBERT CIZIK, Chairman andChief Executive Officer
Cooper Industries Inc.RICHARD A. CLARKE, Chairman of the BoardPacific Gas and Electric CompanyA. W. CLAUSEN, Retired Chairman and
Chief Executive OfficerBankAmerica CorporationJOHN L. CLENDENIN, Chairman and
Chief Executive OfficerBellSouth CorporationNANCY S. COLE, PresidentEducational Testing Services*EMILIO G. COLLADOPalm Beach Gardens, FloridaKATHLEEN COOPER, Chief EconomistExxon CorporationGARY L. COUNTRYMAN, Chairman and
Chief Executive OfficerLiberty Mutual Insurance CompanyROBERT L. CRANDALL, Chairman, President
and Chief Executive OfficerAMR/American AirlinesRONALD R. DAVENPORT, Chairman
of the BoardSheridan Broadcasting Corp.ROBERT J. DAYTON, Chief Executive OfficerOkabena CompanyALFRED C. DECRANE, JR., Chairman of the
Board and Chief Executive OfficerTexaco Inc.LINNET F. DEILY, Chairman, President and
Chief Executive OfficerFirst Interstate Bank of TexasJERRY E. DEMPSEY, Chairman and
Chief Executive OfficerPPG Industries, Inc.JOHN DIEBOLD, ChairmanJohn Diebold IncorporatedWILLIAM H. DONALDSON, Chairman and
Chief Executive OfficerNew York Stock ExchangeJOSEPH L. DOWNEY, DirectorThe Dow Chemical CompanyFRANK P. DOYLE, Executive Vice PresidentGEE. LINN DRAPER, JR., Chairman, President
and Chief Executive OfficerAmerican Electric Power CompanyGEORGE C. EADS, Vice President,
Worldwide Economic & Market AnalysisGeneral Motors CorporationW.D. EBERLE, ChairmanManchester Associates, Ltd.WILLIAM S. EDGERLY, ChairmanFoundation for PartnershipsWALTER Y. ELISHA, Chairman and
Chief Executive OfficerSprings Industries, Inc.JAMES D. ERICSON, President and
Chief Executive OfficerNorthwestern Mutual Life Insurance CompanyWILLIAM T. ESREY, Chairman and
Chief Executive OfficerSprintJANE EVANS, Vice President and General
Manager, Home and Personal Services DivisionU.S. West Communications, Inc.
*Life Trustee

JOHN R. HALL, Chairman andChief Executive Officer
Ashland Oil Inc.JUDITH H. HAMILTON, President and
Chief Executive OfficerDataquestRICHARD W. HANSELMAN, Retired ChairmanGenesco Inc.JOHN T. HARTLEY, Chairman and
Chief Executive OfficerHarris CorporationLANCE H. HERNDON, Managing ConsultantAccess, Inc.EDWIN J. HESS, Senior Vice PresidentExxon CorporationRODERICK M. HILLS, PartnerMudge Rose Guthrie Alexander & FerdonDONALD P. HILTYEconomic Strategy InstituteHAYNE HIPP, President and
Chief Executive OfficerThe Liberty CorporationDELWIN D. HOCK, Chairman and Chief
Executive OfficerPublic Service Company of ColoradoHARRY G. HOHN, Chairman and
Chief Executive OfficerNew York Life Insurance CompanyLEON C. HOLT, JR., Retired Vice ChairmanAir Products and Chemicals, Inc.MATINA S. HORNER, Executive Vice PresidentTIAA-CREFAMOS B. HOSTETTER, Chairman and
Chief Executive OfficerContinental Cablevision, Inc.JAMES R. HOUGHTON, Chairman and
Chief Executive OfficerCorning IncorporatedBILL HOWELL, PresidentHowell Petroleum Products, Inc.WILLIAM R. HOWELL, Chairman of the BoardJ.C. Penney Company, Inc.CORDELL W. HULL, Executive Vice President
and DirectorBechtel Group, Inc.ROBERT J. HURST, General PartnerGoldman, Sachs & Co.SOL HURWITZ, PresidentCommittee for Economic DevelopmentALICE STONE ILCHMAN, PresidentSarah Lawrence CollegeGEORGE B. JAMES, Senior Vice President and
Chief Financial OfficerLevi Strauss & Co.ERIC G. JOHNSON, President and Chief
Executive OfficerTri-Star Associates, Inc.JAMES A. JOHNSON, Chairman and
Chief Executive OfficerFannie MaeROBBIN S. JOHNSON, Corporate Vice President,
Public AffairsCargill, IncorporatedTHOMAS W. JONES, President and
Chief Operating OfficerTIAA-CREFPRES KABACOFF, President and
Co-ChairmanHistoric Restoration, Inc.
HARRY P. KAMEN, Chairman andChief Executive Officer
Metropolitan Life Insurance CompanyEDWARD A. KANGAS, Chairman and
Chief Executive OfficerDeloitte Touche Tohmatsu InternationalHELENE L. KAPLAN, Esq., Of CounselSkadden Arps Slate Meagher & FlomJOSEPH E. KASPUTYS, Chairman, President
and Chief Executive OfficerPrimark CorporationJULIUS KATZ, PresidentHills & CompanyEAMON M. KELLY, PresidentTulane UniversityTHOMAS J. KLUTZNICK, PresidentThomas J. Klutznick CompanyCHARLES F. KNIGHT, Chairman and
Chief Executive OfficerEmerson Electric Co.ALLEN J. KROWE, Vice Chairman and
Chief Financial OfficerTexaco Inc.RICHARD J. KRUIZENGA, Senior FellowISEMCHARLES R. LEE, Chairman and
Chief Executive OfficerGTE CorporationFRANKLIN A. LINDSAY, Retired ChairmanItek CorporationEDWARD E. LUCENTE, Executive In Residence, GSIACarnegie Mellon UniversityEDWIN LUPBERGER, Chairman and
Chief Executive OfficerEntergy CorporationBRUCE K. MACLAURY, PresidentThe Brookings InstitutionCOLETTE MAHONEY, RSHM, ChairEducational Consulting Associates, Ltd.MICHAEL P. MALLARDI, President, Broadcast
Group and Senior Vice PresidentCapital Cities/ABC, Inc.DERYCK C. MAUGHAN, Chairman and
Chief Executive OfficerSalomon Brothers Inc.WILLIAM F. MAY, Chairman and
Chief Executive OfficerStatue of Liberty - Ellis Island Foundation, Inc.JEWELL JACKSON MCCABE, PresidentJewell Jackson McCabe Associates, Inc.R. MICHAEL MCCULLOUGH, Senior ChairmanBooz Allen & Hamilton Inc.ALONZO L. MCDONALD, Chairman and
Chief Executive OfficerAvenir Group, Inc.JAMES L. MCDONALD, Co-ChairmanPrice WaterhouseJOHN F. MCGILLICUDDY, Retired Chairman of
the Board and Chief Executive OfficerChemical Banking CorporationEUGENE R. MCGRATH, Chairman, President and
Chief Executive OfficerConsolidated Edison Company of New York, Inc.HENRY A. MCKINNELL, Executive Vice President
and Chief Financial OfficerPfizer Inc.DAVID E. MCKINNEYWestport, Connecticut
*Life Trustee

R. CLAYTON MCWHORTER, Chairman,President and Chief Executive Officer
Healthtrust Inc.JEAN C. MONTY, President and
Chief Executive OfficerNorthern Telecom LimitedJ. RICHARD MUNRO, Chairman,
Executive CommitteeTime Warner Inc.GARY L. NEALE, Chairman, President
and Chief Executive OfficerNipsco IndustriesKENT C. NELSON, Chairman and
Chief Executive OfficerUnited Parcel Service of America, Inc.MARILYN CARLSON NELSON, Vice ChairmanCarlson Holdings, Inc.JOSEPH NEUBAUER, Chairman and
Chief Executive OfficerARAMARK Corp.BARBARA W. NEWELL, Regents ProfessorFlorida State UniversityPATRICK F. NOONAN, Chairman and
Chief Executive OfficerThe Conservation FundRICHARD C. NOTEBAERT, Chairman and
Chief Executive OfficerAmeritech CorporationJAMES J. O’CONNOR, Chairman and
Chief Executive OfficerCommonwealth Edison CompanyDEAN R. O’HARE, Chairman and
Chief Executive OfficerChubb CorporationJOHN D. ONG, Chairman of the Board, President
and Chief Executive OfficerThe BFGoodrich CompanyANTHONY J.F. O’REILLY, Chairman, President
and Chief Executive OfficerH.J. Heinz CompanyJAMES F. ORR III, Chairman and
Chief Executive OfficerUNUM CorporationROBERT J. O'TOOLE, Chairman and
Chief Executive OfficerA. O. Smith CorporationWILLIAM R. PEARCE, President and
Chief Executive OfficerIDS Mutual Fund GroupJERRY K. PEARLMAN, Chairman and
Chief Executive OfficerZenith Electronics CorporationVICTOR A. PELSON, Executive Vice President,
Chairman-Global Operations TeamAT&T Corp.PETER G. PETERSON, ChairmanThe Blackstone GroupDEAN P. PHYPERSNew Canaan, ConnecticutS. LAWRENCE PRENDERGAST, Vice President
and TreasurerAT&T Corp.WESLEY D. RATCLIFF, President and
Chief Executive OfficerAdvanced Technological Solutions, Inc.ALLAN L. RAYFIELDLowell, MassachusettsJAMES J. RENIERRenier & Associates
WILLIAM R. RHODES, Vice ChairmanCiticorp/Citibank, N.A.WILLIAM C. RICHARDSON, PresidentThe Johns Hopkins UniversityJAMES Q. RIORDANStuart, FloridaJOHN D. ROACH, Chairman, President and
Chief Executive OfficerFibreboard CorporationVIRGIL ROBERTS, PresidentDick Griffey Productions/Solar RecordsDAVID ROCKEFELLER, JR., ChairmanRockefeller Financial Services, Inc.JUDITH S. RODIN, PresidentUniversity of PennsylvaniaIAN M. ROLLAND, Chairman and
Chief Executive OfficerLincoln National CorporationDANIEL ROSE, PresidentRose Associates, Inc.CHARLES O. ROSSOTTI, ChairmanAmerican Management SystemsLANDON H. ROWLAND, President and
Chief Executive OfficerKansas City Southern Industries, Inc.NEIL L. RUDENSTINE, PresidentHarvard UniversityGEORGE E. RUPP, PresidentColumbia UniversityGEORGE F. RUSSELL, JR., ChairmanFrank Russell CompanyVINCENT A. SARNI, Retired Chairman
and Chief Executive OfficerPPG Industries, Inc.JOHN C. SAWHILL, President and
Chief Executive OfficerThe Nature ConservancyHENRY B. SCHACHT, Chairman of the
Executive CommitteeCummins Engine Company, Inc.THOMAS SCHICK, Executive Vice President,
Corporate Affairs and CommunicationsAmerican Express CompanyJONATHAN M. SCHOFIELD, Chairman and
Chief Executive OfficerAirbus Industrie of North America, Inc.DONALD J. SCHUENKE, ChairmanNorthern Telecom LimitedROBERT G. SCHWARTZNew York, New YorkJ. L. SCOTTSalt Lake City, UtahERVIN R. SHAMESWilton, ConnecticutWALTER V. SHIPLEY, Chairman and
Chief Executive OfficerChemical Banking CorporationC. R. SHOEMATE, Chairman, President and
Chief Executive OfficerCPC International Inc.WALTER H. SHORENSTEIN, Chairman of the BoardThe Shorenstein Company*GEORGE P. SHULTZ, Distinguished FellowThe Hoover InstitutionROCCO C. SICILIANOBeverly Hills, CaliforniaL. PENDLETON SIEGEL, President and
Chief Operating OfficerPotlach Corporation
*Life Trustee

*Life Trustee
ANDREW C. SIGLER, Chairman andChief Executive Officer
Champion International CorporationIRBY C. SIMPKINS, JR., Publisher and
Chief Executive OfficerNashville BannerFREDERICK W. SMITH, Chairman, President
and Chief Executive OfficerFederal Express CorporationRAYMOND W. SMITH, Chairman of the Board
and Chief Executive OfficerBell Atlantic CorporationSHERWOOD H. SMITH, JR., Chairman of the
Board and Chief Executive OfficerCarolina Power & Light CompanyWILLIAM D. SMITHBURG, Chairman and
Chief Executive OfficerThe Quaker Oats CompanyTIMOTHY P. SMUCKER, ChairmanThe J.M. Smucker CompanyALAN G. SPOON, PresidentThe Washington Post CompanyELMER B. STAATS, Former Comptroller
General of the United StatesJOHN R. STAFFORD, Chairman, President
and Chief Executive OfficerAmerican Home Products CorporationSTEPHEN STAMAS, ChairmanNew York PhilharmonicJOHN L. STEFFENS, Executive Vice PresidentMerrill Lynch & Co., Inc.RICHARD J. STEGEMEIER, Chairman of the BoardUnocal CorporationW. THOMAS STEPHENS, Chairman,
President and Chief Executive OfficerManville CorporationPAUL G. STERNPotomac, MarylandPAULA STERN, Senior FellowProgressive Policy InstituteDONALD M. STEWART, PresidentThe College BoardWILLIAM P. STIRITZ, Chairman of the BoardRalston Purina CompanyROGER W. STONE, Chairman, President and
Chief Executive OfficerStone Container CorporationMATTHEW J. STOVER, President and
Chief Executive OfficerNYNEX Information Resources CompanyCARROLL W. SUGGS, Chairman of the Board and
Chief Executive OfficerPetroleum Helicopters, Inc.JAMES N. SULLIVAN, Vice Chairman of the BoardChevron CorporationRICHARD F. SYRON, Chairman and
Chief Executive OfficerAmerican Stock ExchangeALISON TAUNTON-RIGBYLincoln, MassachusettsANTHONY P. TERRACCIANO, Chairman, President
and Chief Executive OfficerFirst Fidelity BancorporationRICHARD L. THOMAS, Chairman and
Chief Executive OfficerFirst Chicago Corporation
JAMES A. THOMSON, President andChief Executive Officer
RANDCHANG-LIN TIEN, ChancellorUniversity of California, BerkeleyRANDALL L. TOBIAS, Chairman of the Board and
Chief Executive OfficerEli Lilly and CompanyALEXANDER J. TROTMAN, Chairman, President
and Chief Executive OfficerFord Motor CompanyRICHARD A. VOELL, President and
Chief Executive OfficerThe Rockefeller GroupHAROLD A. WAGNER., Chairman, President and
Chief Executive OfficerAir Products & Chemicals, Inc.ADMIRAL JAMES D. WATKINS, USN (Ret.),PresidentJoint Oceanographic Institutions, Inc.ARNOLD R. WEBER, ChancellorNorthwestern UniversityLAWRENCE A. WEINBACH, Managing Partner–
Chief ExecutiveArthur Andersen & Co, SCHARVEY A. WEINBERG, ConsultantHSSI, Inc.ROBERT E. WEISSMAN, President and
Chief Executive OfficerDun & Bradstreet CorporationJOHN F. WELCH, JR., Chairman and
Chief Executive OfficerGEVIRGINIA V. WELDON, M.D., Senior Vice President,
Public PolicyMonsanto CompanyJOSH S. WESTON, Chairman and
Chief Executive OfficerAutomatic Data Processing, Inc.CLIFTON R. WHARTON, JR., Former ChairmanTIAA-CREFDOLORES D. WHARTON, Chairman and
Chief Executive OfficerThe Fund for Corporate Initiatives, Inc.EDWARD E. WHITACRE, JR., Chairman and
Chief Executive OfficerSBC Communications, Inc.GORDON L. WILLIAMS, Corporate Vice President
and General Manager for the CommercialAircraft Division
Northrop Grumman CorporationHAROLD M. WILLIAMS, PresidentThe J. Paul Getty TrustJ. KELLEY WILLIAMS, Chairman and
Chief Executive OfficerFirst Mississippi CorporationMARGARET S. WILSON, Chairman of the BoardScarbroughsWILLIAM S. WOODSIDE, Vice ChairmanLSG Sky ChefsMARTIN B. ZIMMERMAN, Executive Director,
Governmental Relations and Corporate EconomicsFord Motor CompanyCHARLES J. ZWICKCoral Gables, Florida

RAY C. ADAMNew York, New York*O. KELLEY ANDERSONBoston, MassachusettsROBERT O. ANDERSON, ChairmanHondo Oil & Gas CompanyROY L. ASHLos Angeles, CaliforniaSANFORD S. ATWOOD, President EmeritusEmory UniversityROBERT H. B. BALDWIN, Retired ChairmanMorgan Stanley Group Inc.JOSEPH W. BARRHume, VirginiaGEORGE F. BENNETT, Chairman EmeritusState Street Investment TrustHAROLD H. BENNETTSalt Lake City, UtahJACK F. BENNETTGreenwich, ConnecticutHOWARD W. BLAUVELTCharlottesville, VirginiaFRED J. BORCHNew Canaan, ConnecticutMARVIN BOWER, DirectorMcKinsey & Company, Inc.ALAN S. BOYDWashington, D.C.ANDREW F. BRIMMER, PresidentBrimmer & Company, Inc.HARRY G. BUBB, Chairman EmeritusPacific Mutual Life InsuranceJOHN L. BURNSGreenwich, ConnecticutTHOMAS D. CABOT, Honorary
Chairman of the BoardCabot CorporationPHILIP CALDWELL, Senior Managing DirectorLehman Brothers Inc.EDWARD W. CARTER, Chairman EmeritusCarter Hawley Hale Stores, Inc.EVERETT N. CASEVan Hornesville, New YorkHUGH M. CHAPMAN, ChairmanNationsBank SouthE. H. CLARK, JR., Chairman and Chief
Executive OfficerThe Friendship GroupGEORGE S. CRAFTAtlanta, GeorgiaDOUGLAS D. DANFORTH, Retired ChairmanWestinghouse Electric CorporationJOHN H. DANIELS, Retired Chairman
and Chief Executive OfficerArcher-Daniels Midland Co.RALPH P. DAVIDSONWashington, D.C.ARCHIE K. DAVIS, Chairman of the
Board (Retired)Wachovia Bank and Trust Company, N.A.DOUGLAS DILLONNew York, New YorkROBERT R. DOCKSON, Chairman EmeritusCalFed, Inc.
CED HONORARY TRUSTEES
LYLE EVERINGHAM, Retired ChairmanThe Kroger Co.THOMAS J. EYERMAN, PresidentDelphi Associates LimitedJOHN T. FEYJamestown, Rhode IslandJOHN M. FOXSapphire, North CarolinaDON C. FRISBEE, Chairman EmeritusPacifiCorpW. H. KROME GEORGE, Retired ChairmanAluminum Company of AmericaWALTER B. GERKEN, Chairman,
Executive CommitteePacific Mutual Life Insurance CompanyPAUL S. GEROTDelray Beach, FloridaLINCOLN GORDON, Guest ScholarThe Brookings InstitutionKATHARINE GRAHAM, Chairman of
the Executive CommitteeThe Washington Post CompanyJOHN D. GRAY, Chairman EmeritusHartmarx CorporationWALTER A. HAAS, JR., Honorary Chairman
of the BoardLevi Strauss & Co.ROBERT A. HANSON, Retired ChairmanDeere & CompanyROBERT S. HATFIELD, Retired ChairmanThe Continental Group, Inc.ARTHUR HAUSPURG, Member, Board
of TrusteesConsolidated Edison Company of New York, Inc.PHILIP M. HAWLEY, Retired Chairman
of the BoardCarter Hawley Hale Stores, Inc.WILLIAM A. HEWITTChadds Ford, PennsylvaniaOVETA CULP HOBBY, ChairmanH&C Communications, Inc.ROBERT C. HOLLAND, Senior Economic
ConsultantCommittee for Economic DevelopmentGEORGE F. JAMESSouth Bristol, MaineHENRY R. JOHNSTONPonte Vedra Beach, FloridaGILBERT E. JONES, Retired Vice ChairmanIBM CorporationCHARLES KELLER, JR.Keller Family FoundationGEORGE M. KELLER, Chairman of the
Board, RetiredChevron CorporationDAVID M. KENNEDYSalt Lake City, UtahJAMES R. KENNEDYEssex Falls, New JerseyTOM KILLEFER, Chairman EmeritusUnited States Trust Company of New YorkCHARLES M. KITTRELLBartlesville, OklahomaPHILIP M. KLUTZNICK, Senior PartnerKlutznick Investments
*Life Trustee

HARRY W. KNIGHTNew York, New YorkROY G. LUCKSSan Francisco, CaliforniaROBERT W. LUNDEEN, Retired ChairmanThe Dow Chemical CompanyRAY W. MACDONALD, Honorary Chairman
of the BoardBurroughs CorporationIAN MACGREGOR, Retired ChairmanAMAX Inc.RICHARD B. MADDEN, Retired Chairman
and Chief Executive OfficerPotlatch CorporationFRANK L. MAGEEStahlstown, PennsylvaniaSTANLEY MARCUS, ConsultantStanley Marcus ConsultancyAUGUSTINE R. MARUSIRed Bank, New JerseyOSCAR G. MAYER, Retired ChairmanOscar Mayer & Co.GEORGE C. MCGHEE, Former U.S.
Ambassador and Under Secretary of StateWashington, D.C.JAMES W. MCKEE, JR., Retired ChairmanCPC International, Inc.CHAMPNEY A. MCNAIR, Retired Vice ChairmanTrust Company of GeorgiaJ. W. MCSWINEY, Retired Chairman of the BoardThe Mead CorporationCHAUNCEY J. MEDBERRY, III, Retired ChairmanBankAmerica Corporation and Bank of America
N.T. and S.A.ROBERT E. MERCER, Retired ChairmanThe Goodyear Tire & Rubber Co.RUBEN F. METTLER, Retired Chairman and
Chief Executive OfficerTRW Inc.LEE L. MORGAN, Former Chairman of the BoardCaterpillar, Inc.ROBERT R. NATHAN, ChairmanNathan Associates, Inc.ALFRED C. NEALHarrison, New YorkJ. WILSON NEWMAN, Retired ChairmanDun & Bradstreet CorporationLEIF H. OLSEN, PresidentLeif H. Olsen Investments, Inc.NORMA PACE, Senior AdvisorThe WEFA GroupCHARLES W. PARRY, Retired ChairmanAluminum Company of AmericaJOHN H. PERKINS, Former PresidentContinental Illinois National Bank and Trust CompanyHOWARD C. PETERSENRadnor, PennsylvaniaC. WREDE PETERSMEYERVero Beach, FloridaRUDOLPH A. PETERSON, President and
Chief Executive Officer (Emeritus)BankAmerica CorporationEDMUND T. PRATT, JR., Chairman EmeritusPfizer Inc.
ROBERT M. PRICE, Retired Chairman andChief Executive Officer
Control Data CorporationR. STEWART RAUCH, Former ChairmanThe Philadelphia Savings Fund SocietyAXEL G. ROSIN, Retired ChairmanBook-of-the-Month Club, Inc.WILLIAM M. ROTHSan Francisco, CaliforniaGEORGE RUSSELLBloomfield, MichiganJOHN SAGAN, PresidentJohn Sagan AssociatesRALPH S. SAUL, Former Chairman of the BoardCIGNA CompaniesGEORGE A. SCHAEFER, Retired Chairman
of the BoardCaterpillar, Inc.MARK SHEPHERD, JR., Retired ChairmanTexas Instruments, Inc.RICHARD R. SHINN, Retired Chairman
and Chief Executive OfficerMetropolitan Life Insurance Co.NEIL D. SKINNERIndianapolis, IndianaELLIS D. SLATERLandrum, South CarolinaDAVIDSON SOMMERSWashington, D.C.ELVIS J. STAHR, JR.Chickering & Gregory, P.C.FRANK STANTON, President EmeritusCBS, Inc.EDGAR B. STERN, JR., Chairman of the BoardRoyal Street CorporationJ. PAUL STICHT, Retired ChairmanRJR Nabisco, Inc.ALEXANDER L. STOTTFairfield, ConnecticutWAYNE E. THOMPSON, Past ChairmanMerritt Peralta Medical CenterCHARLES C. TILLINGHAST, JR.Providence, Rhode IslandHOWARD S. TURNER, Retired ChairmanTurner Construction CompanyL. S. TURNER, JR.Dallas, TexasTHOMAS A. VANDERSLICE, Chairman, President
and Chief Executive OfficerM/A-Com, Inc.ROBERT C. WEAVERNew York, New YorkJAMES E. WEBBWashington, D.C.SIDNEY J. WEINBERG, JR., Limited PartnerThe Goldman Sachs Group, L.P.GEORGE WEISSMAN, Retired ChairmanPhilip Morris Companies Inc.ARTHUR M. WOODChicago, IllinoisRICHARD D. WOOD, DirectorEli Lilly and Company

CED RESEARCH ADVISORY BOARD
ChairmanJOHN P. WHITEDirector, Center for Business and
GovernmentJohn F. Kennedy School of GovernmentHarvard University
DOUGLAS J. BESHAROVResident ScholarAmerican Enterprise Institute for
Public Policy Research
SUSAN M. COLLINSSenior Fellow, Economic Studies ProgramThe Brookings Institution
SOL HURWITZPresident
CED PROFESSIONAL AND ADMINISTRATIVE STAFF
JUNE E. O‘NEILLDirector, Center for the Study of
Business and GovernmentBaruch College, City University
of New York
PETER PASSELLThe New York Times
CHRISTINA D. ROMERProfessor of EconomicsUniversity of California, Berkeley
BERNARD SAFFRANFranklin & Betty Barr Professor
of EconomicsSwarthmore College
SANDRA KESSLER HAMBURGVice President and Director of Education Studies
TIMOTHY J. MUENCHVice President and Director of Finance and Administration
EVA POPPERVice President, Secretary of the
Board of Trustees and Directorof Development
NATHANIEL M. SEMPLEVice President, Secretary of
the Research and PolicyCommittee, and Director ofBusiness-Government Relations
Senior Economic ConsultantROBERT C. HOLLAND
Advisor on InternationalEconomic PolicyISAIAH FRANKWilliam L. Clayton Professor
of International EconomicsThe Johns Hopkins University
AdministrationDOROTHY M. STEFANSKIDeputy Comptroller
KAREN CASTROAssistant Comptroller
ARLENE M. MURPHYAdministrative Assistant to the President
SHIRLEY R. SHERMANOffice Manager, Washington
DevelopmentJULIA R. HICKSAssistant Director
MICHAEL BORNHEIMERStaff Associate
ANA SOMOHANOCampaign Coordinator
WILFORD V. MALCOLMCampaign Production Administrator
VAN DOORN OOMSSenior Vice President and
Director of Research
WILLIAM J. BEEMANVice President and Director
of Economic Studies
ANTHONY P. CARNEVALEVice President and
Director of Human ResourceStudies
CLAUDIA P. FEUREYVice President for
Communications andCorporate Affairs
ResearchMICHAEL K. BAKEREconomist
JESSE W. ELLISPolicy Analyst
LORRAINE MACKEYResearch Administrator
MARIA L. LUISPublications Coordinator
ConferencesVALERIE MENDELSOHNManager
FRANK LEVYDaniel Rose Professor of Urban
EconomicsDepartment of Urban Studies and
PlanningMassachusetts Institute of Technology
REBECCA MAYNARDTrustee Professor of Education
PolicyUniversity of Pennsylvania
JANET L. NORWOODSenior FellowUrban Institute
SHARON O'CONNELLDirector of Special Projects
THOMAS R. FLAHERTYComptroller and Director of
Operations
MARK FRANCISDirector of Information

STATEMENTS ON NATIONAL POLICY ISSUED BY THECOMMITTEE FOR ECONOMIC DEVELOPMENT
SELECTED PUBLICATIONS:
Putting Learning First: Governing and Managing the Schools for High Achievement (1994)Prescription for Progress: The Uruguay Round in the New Global Economy (1994)*From Promise to Progress: Towards a New Stage in U.S.-Japan Economic Relations (1994)U.S. Trade Policy Beyond The Uruguay Round (1994)In Our Best Interest: NAFTA and the New American Economy (1993)What Price Clean Air? A Market Approach to Energy and Environmental Policy (1993)Why Child Care Matters? Preparing Young Children For A More Productive America (1993)Restoring Prosperity: Budget Choices for Economic Growth (1992)The United States in the New Global Economy: A Rallier of Nations (1992)The Economy and National Defense: Adjusting to Cutbacks in the Post-Cold War Era (1991)Politics, Tax Cuts and the Peace Dividend (1991)The Unfinished Agenda: A New Vision for Child Development and Education (1991)Foreign Investment in the United States: What Does It Signal? (1990)An America That Works: The Life-Cycle Approach to a Competitive Work Force (1990)Breaking New Ground in U.S. Trade Policy (1990)Battling America's Budget Deficits (1989)*Strengthening U.S.-Japan Economic Relations (1989)Who Should Be Liable? A Guide to Policy for Dealing with Risk (1989)Investing in America's Future: Challenges and Opportunities for Public Sector Economic Policies (1988)Children in Need: Investment Strategies for the Educationally Disadvantaged (1987)Finance and Third World Economic Growth (1987)Toll of the Twin Deficits (1987)Reforming Health Care: A Market Prescription (1987)Work and Change: Labor Market Adjustment Policies in a Competitive World (1987)Leadership for Dynamic State Economies (1986)Investing in Our Children: Business and the Public Schools (1985)Fighting Federal Deficits: The Time for Hard Choices (1985)Strategy for U.S. Industrial Competitiveness (1984)Strengthening the Federal Budget Process: A Requirement for Effective Fiscal Control (1983)Productivity Policy: Key to the Nation's Economic Future (1983)

*Statements issued in association with CED counterpart organizations in foreign countries.
Energy Prices and Public Policy (1982)Public-Private Partnership: An Opportunity for Urban Communities (1982)Reforming Retirement Policies (1981)Transnational Corporations and Developing Countries: New Policies for a Changing World Economy
(1981)Fighting Inflation and Rebuilding a Sound Economy (1980)Stimulating Technological Progress (1980)Helping Insure Our Energy Future: A Program for Developing Synthetic Fuel Redefining Government's Role in the Market System (1979)Improving Management of the Public Work Force: The Challenge to State and Local Government (1978)Jobs for the Hard-to-Employ: New Directions for a Public-Private Partnership (1978)An Approach to Federal Urban Policy (1977)Key Elements of a National Energy Strategy (1977)Nuclear Energy and National Security (1976)Fighting Inflation and Promoting Growth (1976)Improving Productivity in State and Local Government (1976)*International Economic Consequences of High-Priced Energy (1975)Broadcasting and Cable Television: Policies for Diversity and Change (1975)Achieving Energy Independence (1974)A New U.S. Farm Policy for Changing World Food Needs (1974)Congressional Decision Making for National Security (1974)*Toward a New International Economic System: A Joint Japanese-American View (1974)More Effective Programs for a Cleaner Environment (1974)The Management and Financing of Colleges (1973)Financing the Nation's Housing Needs (1973)Building a National Health-Care System (1973)High Employment Without Inflation: A Positive Program for Economic Stabilization (1972)Reducing Crime and Assuring Justice (1972)Military Manpower and National Security (1972)The United States and the European Community: Policies for a Changing World Economy (1971)Social Responsibilities of Business Corporations (1971)

CE Circulo de Empresarios
Madrid, Spain
CEDA Committee for Economic Development of Australia
Sydney, Australia
EVA Centre for Finnish Business and Policy Studies
Helsinki, Finland
FAE Forum de Administradores de Empresas
Lisbon, Portugal
IDW Institut der Deutschen Wirtschaft
Cologne, Germany
IE Institut de l’Entreprise
Brussels, Belgium
IE Institut de l’Entreprise
Paris, France
Keizai Doyukai
Tokyo, Japan
SMO Stichting Maatschappij en Onderneming
The Netherlands
SNS Studieförbundet Naringsliv och Samhälle
Stockholm, Sweden
CED COUNTERPART ORGANIZATIONS
Close relations exist between the Committee for Economic Development andindependent, nonpolitical research organizations in other countries. Such counter-part groups are composed of business executives and scholars and have objec-tives similar to those of CED, which they pursue by similarly objective methods.CED cooperates with these organizations on research and study projects ofcommon interest to the various countries concerned. This program has resultedin a number of joint policy statements involving such international matters asenergy, East-West trade, assistance to developing countries, and the reductionof nontariff barriers to trade.