
CE8 R2 CE8.R2 Neeeatuesadw Features and … · Trace Mix and Super Gather For rolling averages as...
38
CE8 R2 SAMPLE IMAGE CE8.R2 New Features and Improvements
Transcript of CE8 R2 CE8.R2 Neeeatuesadw Features and … · Trace Mix and Super Gather For rolling averages as...

CE8 R2 SAMPLE IMAGE
CE8.R2 New Features and e eatu es a dImprovements

CE8.R2 New Features
GeneralGeneral:: Contouring Smoother, Extraneous Contours, 2D Annotation, Automatic Horizon Picking, Cross Plot Display Parameters, Data Plot Order, Cross Plot Axes Changing, FlexNET License.
GeoViewGeoView:: Interval Velocity Summary Table, Automatic Log Profiling, Curve Filter, Single Well Mode, Universal Well y y g g gNaming Convention, ASCII Export Well Format, XTerm Windows on UNIX or Linux.
Well ModelingWell Modeling: FRM changes.
eLogeLog:: Curve View Filter, Color Fill Options, Multiple Log Cross Plot.
AVOAVO:: Attribute Volumes, Attribute Map, Gradient Analysis, AFI Porosity Check.
EMERGEEMERGE:: Application Plot Displays, Reading Log Data.
ISMapISMap: Improved Attribute Selection, Exhaustive Search, Neural Networks
P 4DP 4D B d idth M t hiPro4DPro4D:: Bandwidth Matching.
ProMCProMC:: Cross Plot Regressions.
SeisLoaderSeisLoader:: Trace Mix and Super Gather Algorithm Plug-ins.
View3DView3D:: VoxelGeo Output New PlatformsView3DView3D:: VoxelGeo Output, New Platforms.
External LinksExternal Links:: OpenWorks Log Import, OpenWorks Well Mapping, GeoFrame 4.3, OpenSpirit 2.9, STRATA Models in SeisWorks, ASCII Color Key Import in SeisWare.
HampsonHampson--Russell AssistantRussell Assistant:: Theory and Index Expansion. Improved Auto-Correlation Section.
2

General: Contour Smoothing
For maps and slices, you can now smooth the contour lines.
3

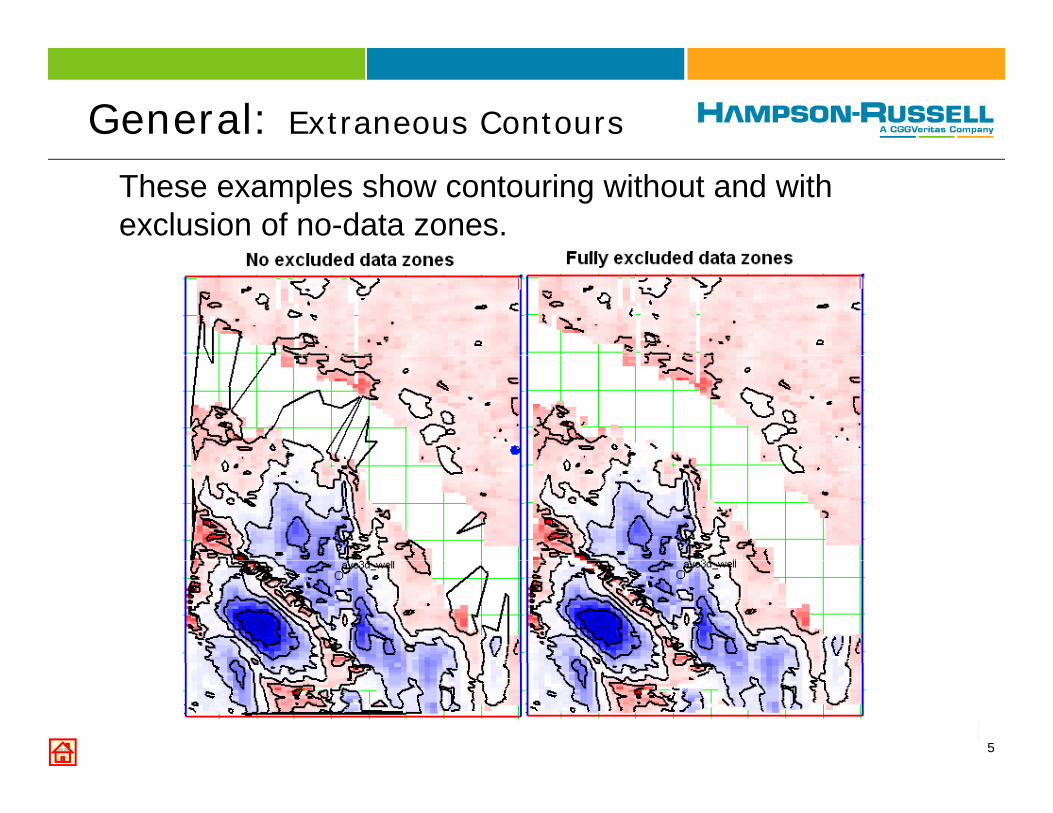
General: Extraneous Contours
You can define regions on your map that have no data and then select not to contour these regions This avoidsthen select not to contour these regions. This avoids unrealistic contouring in these zones.
4
General: Extraneous Contours
These examples show contouring without and with exclusion of no-data zones.
5

General: 2D Annotation
Use the View Menu to toggle theUse the View Menu to toggle the names and annotation of 2D lines on and off.
6

General: Automatic Horizon Pickinguto at c o o c g
You can now select aYou can now select a constant time value as a flat horizon to guide automatic picking. This will smooth out
i k d i f l fpicks and is very useful for pick analysis.
7

General:Cross Plot Display ParametersCross Plot Display Parameters
To change the parameters displayed on the cross plot axes, you can now use drop-down y pmenus at the top of the plot to do the same operation as the New Plot dialog.
The cross plotting parameters are now saved for the next cross plot you create in this session.
8

General: Trace Plotting Cross Plot ZonesTrace Plotting Cross Plot ZonesWe now plot cross plot zones on seismic using a blocky, low resolution mode with no interpolation between traces.
9

General:Data Plot Order in Cross PlotsData Plot Order in Cross PlotsWell data is now plotted in the order in which you selected the wells. The first selected to load into the map is the first plotted.
The yellow box is nearly covered by the green box in the top example and covers it in the bottom example.The tan box is also eitherThe tan box is also either covered or on top of the blue boxes.In the lower right, the dark and light boxes overlap differently,
10
based on plotting order.
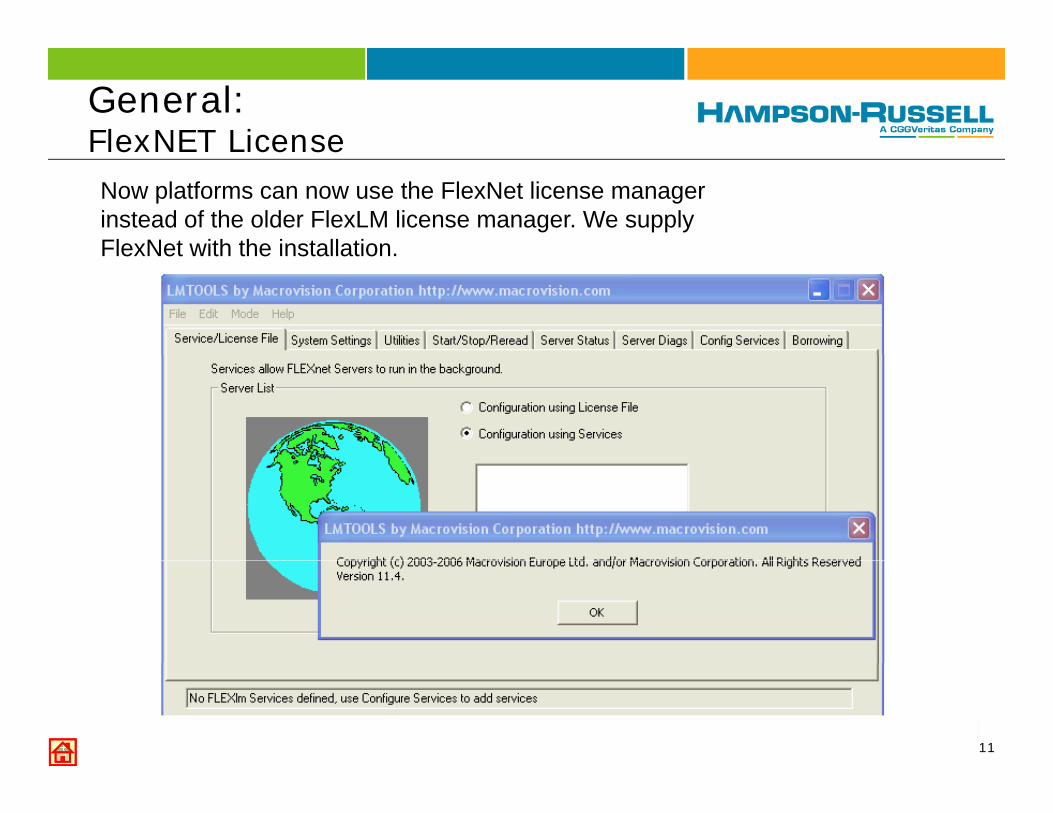
General:FlexNET LicenseNow platforms can now use the FlexNet license manager instead of the older FlexLM license manager. We supply FlexNet with the installation
FlexNET License
FlexNet with the installation.
11

GeoView Well Explorer:Interval Velocity Summary table
The Summary tab now has an Interval Velocity table showing velocity values.
Interval Velocity Summary table
12

GeoView Well ExplorerCurve View FilterCurve View Filter
An improved Curve View Filter lets you display all the logs of any specific type for all selected wells at the same time.
13

GeoView Well Explorer:Curve View Single Well ModeCurve View Single Well Mode
Single Well Mode displays all of the curves for a selected well.
14

GeoView Well Explorer:Automatic Log ProfilingAutomatic Log Profiling
You can now display overlapping curves for specific log types for any number of wells in the project by using the Advanced selections option.wells in the project by using the Advanced selections option.
15

GeoView Well Explorer :Multiple Edited Log PlotsMultiple Edited Log Plots
You can now display the original and edited curves for a log, by selecting the actual t di l i Ad d l ti f fili l i dcurve to display in an Advanced selections for profiling log curves window.
16

GeoView Well Explorer:ASCII Export Well FormatASCII Export Well Format
You can now export, not only logs and tops, but also deviation databut also deviation data.
You can also indicate the datumYou can also indicate the datum used for the logs.
17

GeoView:XTerm Windows on UNIX or Linux
You can now start an XTerm window from GEOVIEW on your UNIX or Linux system.
XTerm Windows on UNIX or Linux
18

eLog: Color Fill Options
You now have many options for coloring log curves, including cross over options and using constant values for fills and coloring by curve amplitude.
19

Well Log Modeling: FRM
You can indicate whether you are using percent or fraction values for saturation units. The FRM process can handle one saturation value being percent and p g panother being a fraction.
The FRM fluid default is now brine and gas.
20

AVO: Attribute Volumes
The Angle Gather as Input toggle is now moved to the first page of this process.
21
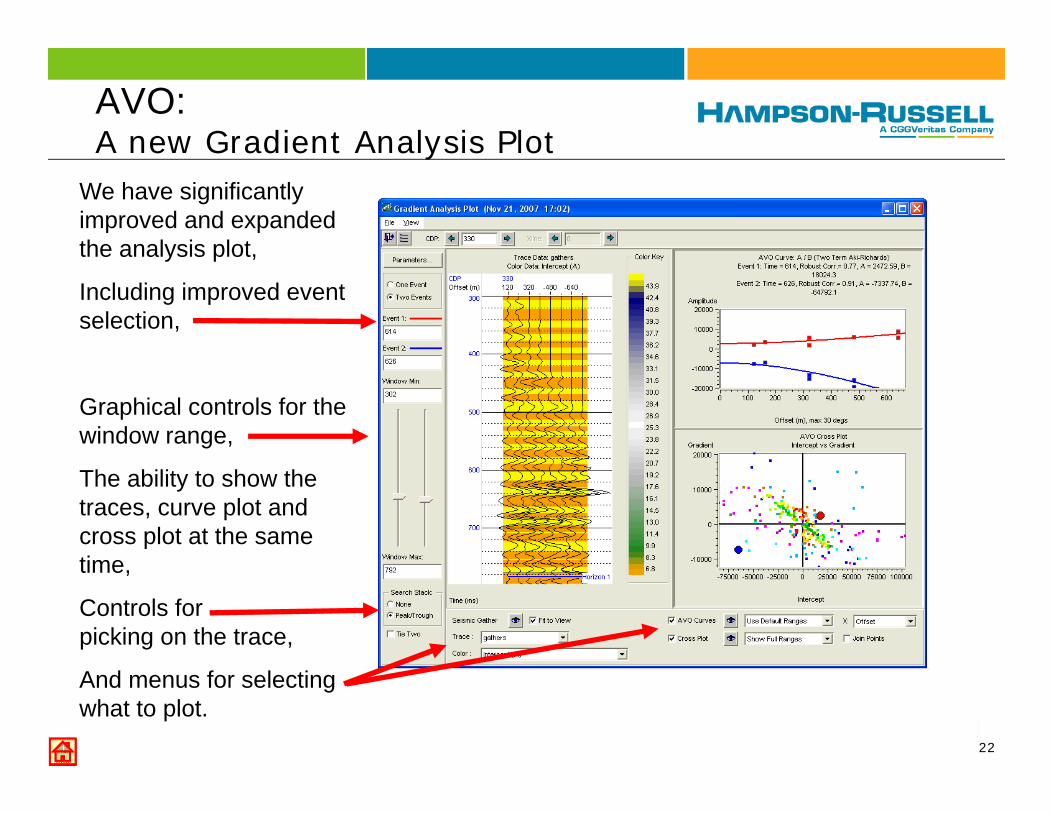
AVO: A new Gradient Analysis PlotA new Gradient Analysis Plot
We have significantly improved and expanded the analysis plotthe analysis plot,
Including improved event selection,
Graphical controls for the window range,
The ability to show the traces, curve plot and cross plot at the same timetime,
Controls for picking on the trace,
22
And menus for selecting what to plot.

AFI: Porosity Check
The program now checks for values in normal distributions that exceed physical bounds to avoid such problems as modeling negative porositiesbounds, to avoid such problems as modeling negative porosities.
23

SeisLoader:Trace Mix and Super Gather
For rolling averages as used in trace mixing and super gathers, you can now use advanced algorithms and even define your own, by using a plug-in option.
Trace Mix and Super Gather
24

EMERGE:Application Plot DisplaysApplication Plot Displays
EMERGE now remembers the last display parameters for application plots.
25

EMERGE: Reading Log Data
The Processing Sample Rate has been expanded tohas been expanded to include 3.0 and 6.0.
26
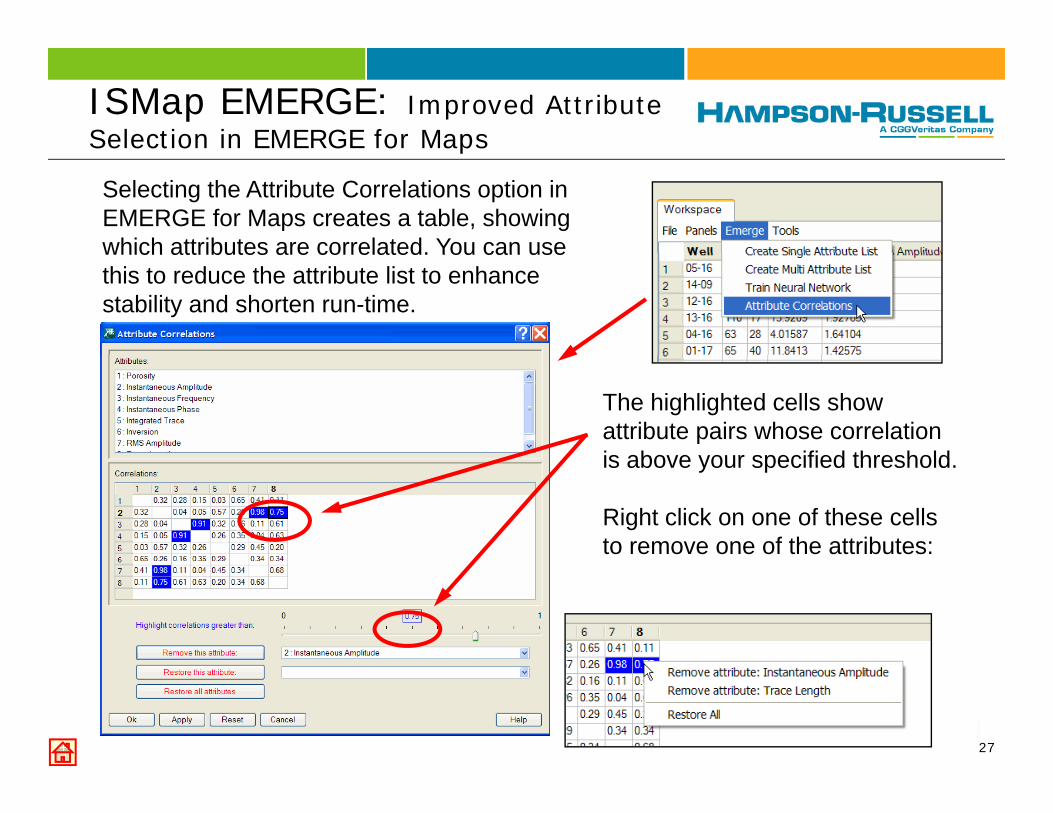
ISMap EMERGE: Improved Attribute Selection in EMERGE for Mapsp
Selecting the Attribute Correlations option in EMERGE for Maps creates a table, showing which attributes are correlated. You can usewhich attributes are correlated. You can use this to reduce the attribute list to enhance stability and shorten run-time.
The highlighted cells show attribute pairs whose correlation is above your specified thresholdis above your specified threshold.
Right click on one of these cells to remove one of the attributes:
27

ISMap: Improved Exhaustive Search in EMERGE for MapsSearch in EMERGE for Maps
When creating the Multi-Attribute List, we recommend the Exhaustive Search algorithm. For some projects this can be very time-consumingsome projects, this can be very time consuming.
We have made two improvements to help with this problem.
The first is that you can now limit theThe first is that you can now limit the search to a selected set of combinations.
Th d i th t th
28
The second is that the progress monitor has been greatly improved to monitor and control the process:

ISMap:Neural Networks in EMERGE for MapsNeural Networks in EMERGE for Maps
We have added options to calculate new maps using either the PNN or RBF Neural Network algorithms.
29

Pro4D: Interactive Design of Bandpass WaveletsBandpass Wavelets
1. Extract wavelets 2. Define the desired wavelet shape
3. Specify shaping waveletlength and QC shaped wavelet
30
4. Apply shaping wavelets

ProMC: Cross Plot Regressions
In ProMC’s Joint Inversion, you can
g
ysave the regression results of cross plots, as displayed in the third page of thethird page of the process.
31

View3D:VoxelGeo OutputVoxelGeo Output
You can now use the Seismic menu to export a volume as a VoxelGeo volume.
32

View3D:New platformsNew platforms
The View3D program can now beprogram can now be run on Linux 32 bit and Windows 64-bit platformsplatforms.
Testing has shown that the 64-bit platform version can handle a larger datahandle a larger data set and more rendering.
33

External Links:OpenWorks Log ImportOpe o s og po t
You can now select log curves by Run Number and Version, and you can set the Active Log status.
34

External LinksOpenWorks Log ImportOpenWorks Log Import
You can use the new Well List Filter to more easily find your well lists in OpenWorks.
Well Exchange now detects OpenWorks messages thatWell Exchange now detects OpenWorks messages that signal changes to the project, measurement system, interpreter and well list.
35

External LinksOpenWorks Well Type MappingOpenWorks Well Type Mapping
You can now map OpenWorks well types to GEOVIEW well types.
36

Hampson-Russell Assistant:
The Assistant has been updated and expanded, especially the Theory section. The Index has almost 900 entries.
37

Hampson-Russell Assistant
Pro-4D’s Auto-Calibration documentation has been significantly expanded.
38


