Cédric PHILIBERT Renewable Energy Division International ... · ©OECD/IEA 2013 Renewables:...
43
© OECD/IEA 2013 Renewables: challenges and opportunities for the power grid Cédric PHILIBERT Renewable Energy Division International Energy Agency Atoms for the Future, Paris, 22 October 2013
Transcript of Cédric PHILIBERT Renewable Energy Division International ... · ©OECD/IEA 2013 Renewables:...

© OECD/IEA 2013
Renewables: challenges and
opportunities for the power grid
Cédric PHILIBERT
Renewable Energy Division
International Energy Agency
Atoms for the Future, Paris, 22 October 2013

© OECD/IEA 2013
� Renewable electricity projected to scale up by 40% from 2012 to 2018
� Broadly on track with 2020 IEA 2°C scenario targets
Positive mid-term outlook for renewable
electricity
0%
5%
10%
15%
20%
25%
30%
0
1 000
2 000
3 000
4 000
5 000
6 000
7 000
8 000
2006 2008 2010 2012 2014 2016 2018 2020
TWh
Hydropower Bioenergy Onshore windOffshore wind Solar PV CSPGeothermal Ocean % Total generation
IEA 2° C Scenario
Global renewable electricity production, by technol ogy
Gas-fired generation 2016
Nuclear generation 2016
Source: Medium-Term Renewables Market Report 2013

© OECD/IEA 2013
The whole RE power mix accelerating its growth
� Hydro remains the largest increasing single renewable technology
� But for the first time additional generation from all non-hydro sources
exceeds that from hydro
Recent cumulative additions (TWh) Forecast cumulative additions (TWh)

© OECD/IEA 2013
But other technologies lagging behind
� Potential of offshore power remains high, but technical, financial
and grid connection issues pose challenges
� Storage adds value to CSP, but deployment hampered by
relatively high costs
0
10
20
30
40
50
60
70
80
90
2006 2007 2008 2009 2010 2011 2012 2013 2014 2015 2016 2017 2018
TWh
OECD Americas OECD Asia Oceania OECD Europe Africa Asia ChinaNon-OECD Europe Non-OECD Americas Middle East MTRMR 2012
Wind offshore Concentrated Solar Power
0
5
10
15
20
25
30
35
40
2006 2007 2008 2009 2010 2011 2012 2013 2014 2015 2016 2017 2018
TWh
OECD Americas OECD Asia Oceania OECD Europe Africa Asia ChinaNon-OECD Europe Non-OECD Americas Middle East MTRMR 2012
© OECD/IEA 2013
Improving competitiveness
� Most dynamic technologies – onshore wind and solar PV –
increasingly competitive in a number of markets
� But market framework matters
� Deployment with little support occurring in some areas with rising energy
needs, good resources, and predictable long-term revenues
Global levelised costs of power
generation ranges (USD per MWh)
Note: costs reflect differences in resource, local conditions, and the choice of sub-technology.
MRMR 2012
0
100
200
300
400
500
Small scaleUtility scale

© OECD/IEA 2013
Renewable power spreading out everywhere
� Emerging markets more than compensate for slowing growth and volatility
in markets such as Europe and the US
Total Renewable Annual Capacity Additions, by regio n (GW)
This map is without prejudice to the status of or sovereignty over any territory, to the delimitation of international frontiers and boundaries and to the name of any
territory, city or area.
Source: Medium-Term Renewables Market Report 2013

© OECD/IEA 2013
Non-OECD accounts for two-thirds of growth
� In 2018, non-OECD comprises 58% of total renewable generation, up
from 54% in 2012 and 51% in 2006
� China leads with deployment of a broad portfolio of renewables
� Other key markets: Brazil (wind, bioenergy), India (wind, solar, bioenergy), South
Africa and Morocco (wind, solar), Thailand (bioenergy), Middle East (solar)
0
1 000
2 000
3 000
4 000
5 000
6 000
7 000
2006 2007 2008 2009 2010 2011 2012 2013 2014 2015 2016 2017 2018
TWh
OECD Americas OECD Asia Oceania OECD Europe Africa Asia ChinaNon-OECD Europe Non-OECD Americas Middle East MRMR 2012
Global renewable electricity production, by region

© OECD/IEA 2013
RE largest contributor to total
electricity increase in OECD
� Renewables expected to grow almost like fossils in America,
and more than total demand in Europe
- 100
100
300
500
700
900
1 100
Total OECD OECD Americas OECD Asia Oceania OECD Europe
TWh
Renewables Nuclear Fossil fuels Others
Changes in power generation by source and region, O ECD, 2012-18

© OECD/IEA 2013
Over the longer term, the power
generation mix is set to change
Global electricity generation by source, 2010-2035
Renewables electricity generation overtakes natural gas by 2016 & almost coal by
2035; growth in coal generation in emerging economies outweighs a fall in the OECD
2 000
4 000
6 000
8 000
10 000
12 000
14 000
1990 1995 2000 2005 2010 2015 2020 2025 2030 2035
TWh
Coal
Renewables
Gas
Nuclear
Oil
Source: IEA World Energy Outlook 2012 New Policies Scenario

© OECD/IEA 2013
Global climate-friendly electricity
mix by 2050
Renewables to provide 57 to 71% of World’s electricity by 2050
in 2 degree scenarios - VRE 22 to 32%
Renewables57%
Variables32%
22%
71%

© OECD/IEA 2013
The IEA Technology Roadmaps:
Hydropower
� IEA roadmaps look at
technologies required to limit
climate change at 2°C
� HP roadmpa co-authored with
Brazil’s Ministry of Mines and
Energy
� Reviewers from agencies,
academia, governments,
industry, NGOs
� Support from CEPEL, ADEME,
Iberdrola
© OECD/IEA 2012

© OECD/IEA 2013
Vision for Hydropower IEA
Roadmap
Hydropower generation will double by 2050 and
reach 2 000 GW and 7 000 TWh, mostly from
large plants in emerging/developing economies© OECD/IEA 2012
China
India
AseanOther Asia Pacific
Africa M. East
OECD Europe
RussiaTransition eco.
Canada
Other LAM+Mex
Brazil
USA
Asia Pacific
Africa
Europe & Eurasia
Central & South America
North America
Middle East
16%
19%
17%
Share on total electricity generationTWh

© OECD/IEA 2013
Technical improvements
� Strengthened environmental requirements may
reduce hydropower output and potential
� Technical improvements allow to increase or
maintain performance and output, and reduce
environmental impacts© OECD/IEA 2012

© OECD/IEA 2013
IEA Wind Power Roadmap 2013
� Update considers recent trends
and revised long-term targets:
� By 2050, 15% to 18% of global
electricity, vs. 12% targeted in the
former roadmap
� Technology and cost evolution
� 2050 “Vision” based on global
energy context and system
optimization
� Barriers and policy
recommendations

© OECD/IEA 2013
Wind power deployment to 2050
in the Roadmap Vision
� Wind power to provide 15% to 18% of global electricity
� China, Europe and the USA together account for two thirds

© OECD/IEA 2013
Land-based and offshore
deployment and costs
� By 2050, 25% of total global wind capacity to be located at sea,
up from 6% in 2020
� Investment costs for wind power to decrease by 25% on land
and 45% off shore by 2050

© OECD/IEA 2013
Technology Evolution
� Growth in size, height
and capacity
� Greater capacity
factors
� Easier access to sites
with lower-speed
winds
� Easing grid
integration with
more regular output
© OECD/IEA 2013
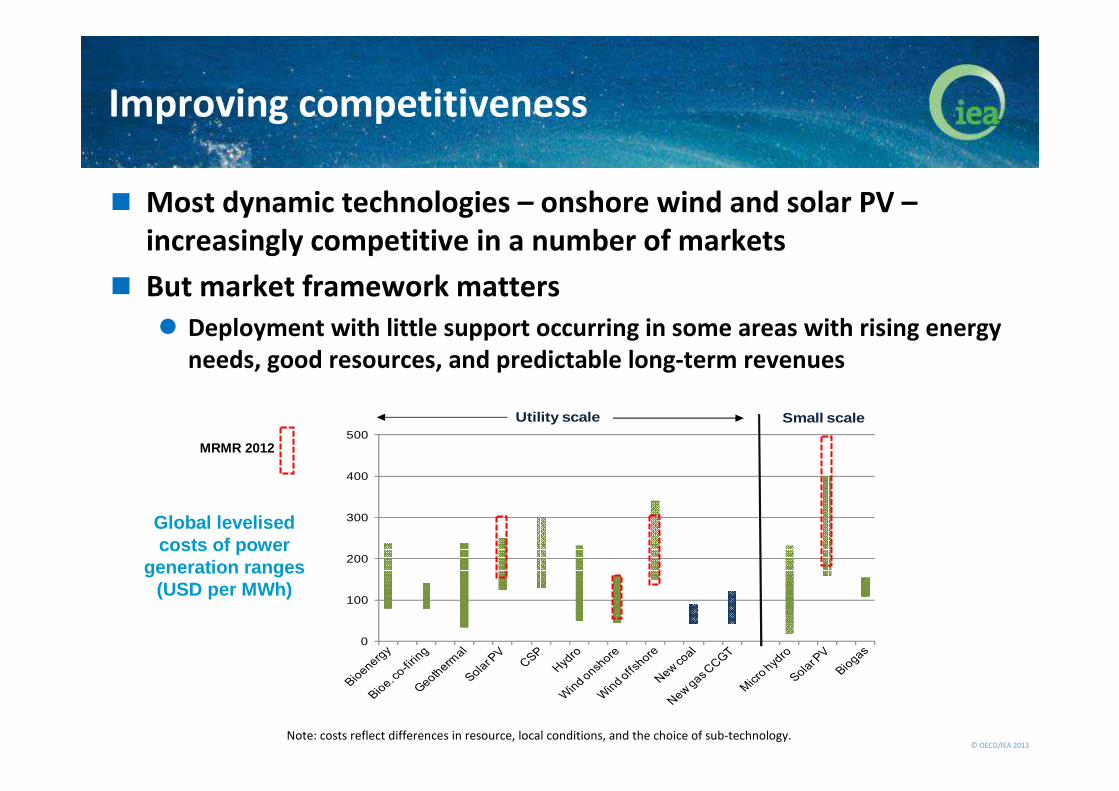
Wind costs decreasing
� Land-based wind
getting cheaper
� Offshore not yet
� But significant cost
decrease expected
Land-based LCOE
Land-based
turbines
Evolution of LCOE to 2050
USD/MWh 2013 2020 2050
Land-basedLow 60 48 44
High 130 104 96
OffshoreLow 136 136 65
High 218 174 105

© OECD/IEA 2013
PV Annual Capacity Additions (GW)
Strong growth seen in China, Africa, Middle East, and Latin America
0
1
2
2012 2015 2018
0
5
10
15
20
2012 2015 2018
0
1
2
3
2012 2015 2018
0
1
2
3
4
5
2012 2015 2018
Solar PV growing out of Europe

© OECD/IEA 2013
Medium Term RE Market Report 2013
PV generation to 2018 by regions

© OECD/IEA 2013
PV Module Prices
� Technology improvements and economies of scale
drive sharp cost reduction
� Overcapacity leads to price setting below costs

© OECD/IEA 2013
Rapid system cost cuts
0
1
2
3
4
5
6
7
8
20
08
20
09
20
10
20
11
20
12
20
08
20
09
20
10
20
11
20
12
20
08
20
09
20
10
20
11
20
12
20
08
20
09
20
10
20
11
20
12
20
08
20
09
20
10
20
11
20
12
€/
W
PV system Price (€/W) Median
1-3 kW 3-20 kW 20-200 kW 200 – 1000 kW > 1 MW
Solar PV system costs in Italy by size, EUR/W
Source: GSE, 2013. Note: includes VAT.

© OECD/IEA 2013
PV LCOE depends on
Solar Resource and Cost of CapitalBest ‘sustainable’price ground-mounted PV systems: USD 1.7/W
� Costs soon to reach competitive levels when and
where all favourable circumstances are met
Murcia, Spain
South Germany Sicily, Italy
South France

© OECD/IEA 2013
Time GW TWh Scenario Source
2018308
(370-390)
368Medium Term RE Market Report 2013
2020 210 298 IEA Technology Roadmap (2010)
2035
602 846 NPS
World Energy Outlook 2012
966 1 371 450
2050
3 155 4 572 IEA Technology Roadmap (2010)
2 017 2 655 2DS
Energy Technology Perspectives 2012
3 289 4 822 hiRen
>2060 12 000 18 000 « Testing
limits »
Solar Energy Perspectives (2011)
Various IEA scenarios for PV

© OECD/IEA 2013
Distributed PV reaching “grid parity”
in some markets � Economics of distributed PV for self-consumption improving rapidly
� Difficult to quantify deployment – further monitoring needed
Residential solar PV LCOE vs. average retail power prices (variable tariff)
Examples correspond to Southern Germany, Southern California and Southern Italy. LCOEs use average residential system costs (include VAT and sales tax in California and Italy where they are applicable) and do not include financial incentives; ranges represent differences in financing costs and full load hours. The variable component of residential electricity prices calculated from average annual household electricity prices and estimation of fixed and variable components as reflected on a household electricity bill. In Germany and Italy, variable component is estimated at 91% while in California variable tariffs account for 99% of the bill. 2012 electricity prices are taken as proxy for 2013 in Germany and Italy where data not yet available. 2013 prices in California based on 1Q2013.
0
50
100
150
200
250
300
350
400
450
2010 2011 2012 2013
USD/MWh
Germany Italy California
Average residential electricity price (variable tarif f )
USD/MW
Residentialsolar PV, LCOE
estimates:

© OECD/IEA 2013
Variability limits self-consumption
June - cloudy June - sunny June – partly cloudy
March – partly sunny
December –cloudy
December – very cloudy
In grey, electricity drawn from the grid. In blue, electricity injected into the grid. In green, self-
consumption. Numbers indicate the percentage of self-consumed electricity. Horizontal axes: hours.
Vertical axes: watts. Source: Génin, 2013.
� Self-consumption higher for:
� Some office and commerce buildings with high daily consumption,
and relatively small systems on multi-storey dwellings
� Self-consumption potentially increased with:
� Load management
� Decentralised electricity storage (if/when affordable)
Daily self-consumption example – a household with 5-kW PV system in Germany

© OECD/IEA 2013
Paying for grid injected excess power
Payment System
Where Observations
FIT/FIP Germany •FIT below LCOE•Reduces FIT costs
Net Metering Denmark, US States, Australia(Italy since July )
•Netting period critical•Can over-reward generation•Overall level often capped
Market based or avoided
cost
California •Likely to be more sustainable in long-term

© OECD/IEA 2013
Electricity System Implications
System Concerns
RE Surcharge
Foregone Tax
Fixed Grid Cost Recovery
•Who pays as commercial power demand reduced?
� More time-based pricing and different user profile-adjusted
tariffs
Integration Costs•Depend on match of PV output and peak demand
�Need for better assessment

© OECD/IEA 2013
Solar thermal electricity (CSP plants)
Solar Receiver
Heliostats
Absorber Tube
Pipe with thermal fluid
Curved mirror
Receiver / Engine
Reflector
Central Receiver
Parabolic Trough
Dish/Engine
Linear Fresnel
Absorber tube andreconcentrator
Curvedmirror
Solar Receiver
Heliostats
Solar Receiver
Heliostats
Absorber Tube
Pipe with thermal fluid
Curved mirror
Receiver / Engine
Reflector
Receiver / Engine
Reflector
Central Receiver
Parabolic Trough
Dish/Engine
Linear Fresnel
Absorber tube andreconcentrator
Curvedmirror
Linear Concentration
C: 100
T: ~ 500 °C
Point Concentration
C: 1000+
T: ~ 1000+ °C

© OECD/IEA 2013
� Higher costs but built-in
thermal storage
� When demand peaks after
sunset!
� If PV (plus minimum load of
back-up, if any) already
saturates demand at noon
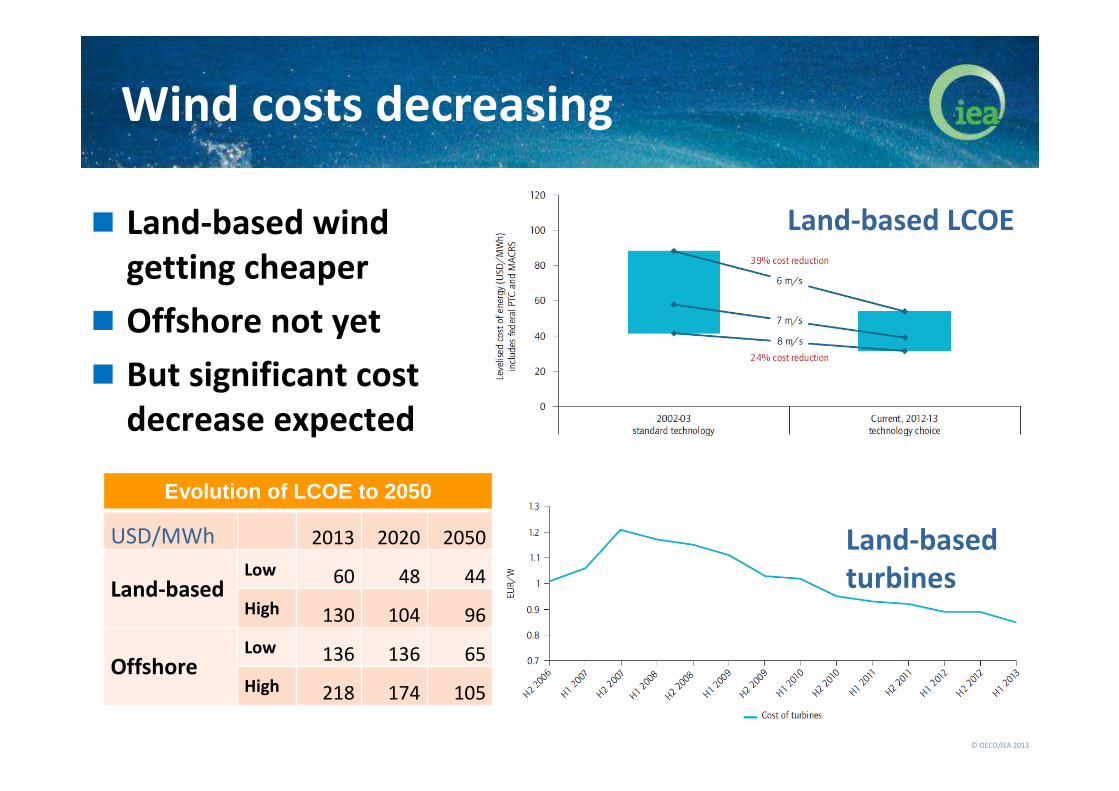
Why STE/CSP might survive the
competition of PV
� Only competing option (for now): pump-hydro storage
� Saudi Arabia plans for 2032: PV 16 GW and 25 GW STE/CSP;
China’s plans for 2030
� STE very flexible, helps accommodating more PV (when
replacing coal)
© OECD/IEA 2013
Time GW TWh Scenario Source
201812.4
(14)
34Medium Term RE Market Report 2013
2020 147 414 IEA Technology Roadmap (2010)
2035
72 278 NPS
World Energy Outlook 2012
219 815 450
2050
1 089 4 770 IEA Technology Roadmap (2010)
859 3 333 2DS
Energy Technology Perspectives 2012
1 108 4 125 hiRen
>2060 6 000 25 000 « Testing
limits »
Solar Energy Perspectives (2011)
Various IEA scenarios for STE/CSP
© OECD/IEA 2013
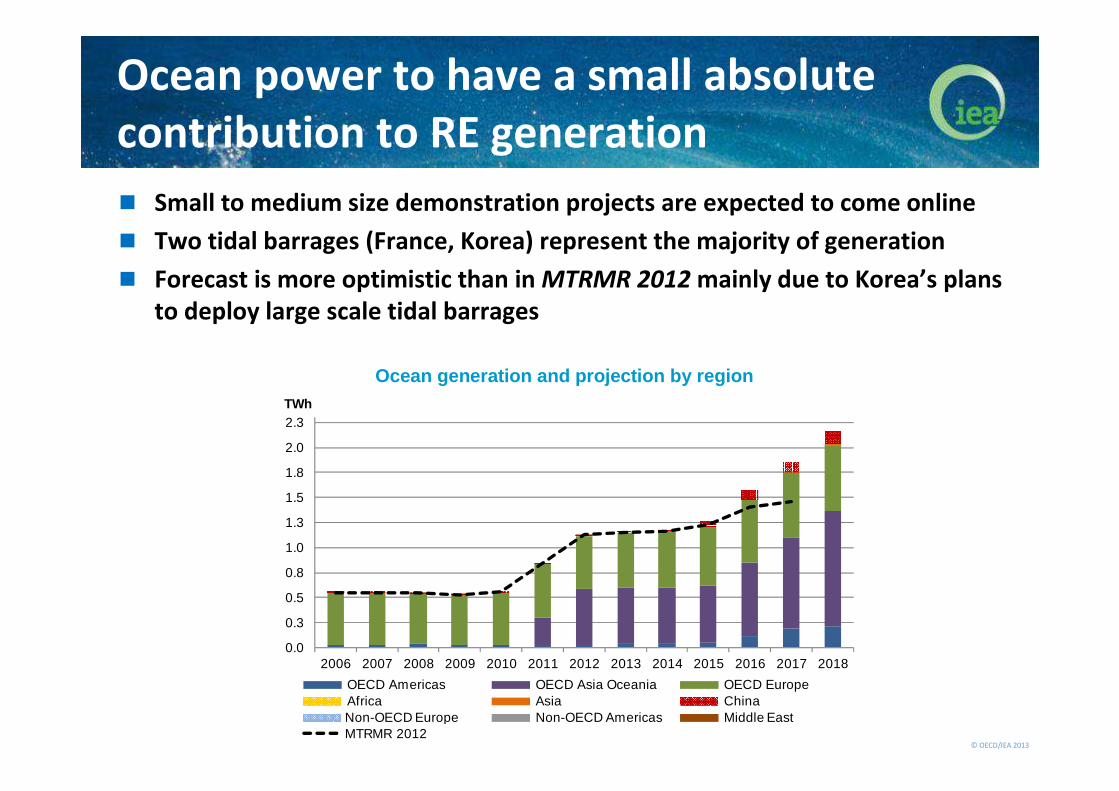
Ocean power to have a small absolute
contribution to RE generation
0.0
0.3
0.5
0.8
1.0
1.3
1.5
1.8
2.0
2.3
2006 2007 2008 2009 2010 2011 2012 2013 2014 2015 2016 2017 2018
TWh
OECD Americas OECD Asia Oceania OECD Europe Africa Asia ChinaNon-OECD Europe Non-OECD Americas Middle East MTRMR 2012
Ocean generation and projection by region
� Small to medium size demonstration projects are expected to come online
� Two tidal barrages (France, Korea) represent the majority of generation
� Forecast is more optimistic than in MTRMR 2012 mainly due to Korea’s plans
to deploy large scale tidal barrages

© OECD/IEA 2013
Geothermal advances but with slower
growth rates
0
10
20
30
40
50
60
70
80
90
100
2006 2007 2008 2009 2010 2011 2012 2013 2014 2015 2016 2017 2018
TWh
OECD Americas OECD Asia Oceania OECD Europe Africa Asia ChinaNon-OECD Europe Non-OECD Americas Middle East MTRMR 2012
Geothermal generation and projection by region
� Investment risks associated with drilling and exploration remains as a major
challenge to deployment
� 60% of growth to come from OECD countries and the rest from Southeast
Asia , Africa and Latin America

© OECD/IEA 2013
0
100
200
300
400
500
600
2010 2011 2012 2013 2014 2015 2016 2017 2018
TWh
OECD Americas OECD Asia Oceania OECD Europe Africa Asia ChinaNon-OECD Europe Non-OECD Americas Middle East MTRMR 2012
Bioenergy scales up with increased use of
agricultural, municipal waste and co-firing
� China is largest grower, with ambitious targets and increasing renewable
waste-to-energy plants
� Other non-OECD countries – Brazil, India and Thailand – also expected to
add significant new generation
� OECD growth dominated by Europe, driven by 2020 targets
Bioenergy generation and projection by region

© OECD/IEA 2013
Variable RE will need more Flexibility
Grid
infrastructure
Dispatchable
generation StorageDemand side
integration
� Value of flexibility has to be reflected in the market
� Need for a suite of different flexibility options
� GIVAR III study to be published in January 2014

© OECD/IEA 2013
PSP: 99% of current on-grid storage
� Pumped-hydro plants the reference solution
� 140 GW in service, 50 GW in development
� PSP developed from existing hydro plants
� “off-stream” or “pumped-back” schemes
� Small energy volumes but large power capacities
� Daily/weekly storage does not require large areas
© OECD/IEA, 2011
Source: Inage 2009. © OECD/IEA 2012

© OECD/IEA 2013
Vision for PSP deployment by 2050
China USA Europe Japan RoW Total
Low
vRE/totalenergy
21% 24% 43% 18%
Hydro/totalenergy
14% 6% 13% 12%
PSP/total capacity
4% 4% 6% 11% 2%
GW 119 58 91 35 109 412
High
vRE/totalenergy
34% 37% 48% 33%
Hydro/totalenergy
15% 6% 11% 13%
PSP/total capacity
5% 8% 10% 12% 3%
GW 179 139 188 39 164 700

© OECD/IEA 2010
The way forward: testing the limits� Under severe climate constraints…
� What if other low-carbon energy options are
not easily available?
� Where are the technical limits to solar energy?
� Assuming efficiency improvements and further
electrification of buildings, industry and transport
� Not always least cost, but affordable options
� Footprint, variability and convenience issues
� Three broad categories of situations:
� Sunny and dry climates, where CSP dominates
� Sunny and wet climates, with PV backed by hydro
� Temperate climates, with wind power and PV
backed by hydro, pumped-hydro and H2-NG plants

© OECD/IEA 2010
Testing limits: key role of electricity� Electricity share keeps growing as efficient end-
use technologies continue to penetrate marketsS
ou
rce: H
eid
e e
t al. 2
01
1S
ou
rce: H
eid
e e
t al. 2
01
1
©O
EC
D/IE
A, 2
01
1
� Solar energy dominated by power (STE and PV)
� Space heating needs reduced and satisfied with
ambient heat through heat pumps
� Many options converging towards USD 100/MWh
� Solar PV (and wind) electricity storage where STE is
not feasible: pumped-hydro plants
cp1

Diapositive 39
cp1 Paolo: add illustrations in these four slidesieauser; 26/08/2011

© OECD/IEA 2010
Testing the limits: Electricity by 2060
© OECD/IEA, 2012
------ 3000

© OECD/IEA 2010
� Footprint and variability solvable issues
� Solar energy, wind power, hydro power and
biomass provide most of the world’s final
energy demand
� Other renewables important in places
� Some uses of fossil fuels still required, but CO2
emissions reduced to 3 Gt or less if CCS is available
Testing limits:
key results
� If energy efficiency is greatly improved
� Solar energy
could provide a
third of final
energy after 2060

© OECD/IEA 2013
A reminder


