
CDP Investor Survey Response - Oracle › assets › cdp-investor-survey-response-2398… · CEO...
104
CDP Climate Change 2016 Information Request Oracle Corporation Module: Introduction Page: Introduction CC0.1 Introduction Please give a general description and introduction to your organization. Oracle offers a comprehensive and fully integrated stack of cloud applications, platform services, and engineered systems. With more than 420,000 customers — including 100 of the Fortune 100—in more than 145 countries, Oracle provides a complete technology stack both in the cloud and in the data center. Oracle’s industry-leading cloud-based and on-premises solutions give customers complete deployment flexibility and unmatched benefits including application integration, advanced security, high availability, scalability, energy efficiency, powerful performance, and low total cost of ownership. For more information about Oracle (NYSE:ORCL), visit oracle.com. Scale: • US$38.2 billion total GAAP revenue in FY15 • Position on the 2015 Fortune 500: 77 • Position on the 2015 Interbrand 100: 16 • #1 in 50 product or industry categories • Key offerings: database, middleware, applications, servers, storage, support, and consulting • Key industries: financial services, manufacturing, communications, media and entertainment, utilities, tax, public sector, education and research, life sciences, healthcare, travel and transportation, consumer products, aerospace and defense, automotive, professional services, and natural resources • 420,000 customers in 145 countries • More than 25,000 partners • More than 130,000 employees Innovation and Investment: • 37,000 developers and engineers • 18,000 customer support specialists, speaking 29 languages • 17,000 implementation consultants • Over 600 independent user communities representing more than 600,000 members • 2.2 million students supported annually • More than 17,000 patents worldwide Other
Transcript of CDP Investor Survey Response - Oracle › assets › cdp-investor-survey-response-2398… · CEO...

CDP Climate Change 2016 Information Request
Oracle Corporation
Module: Introduction
Page: Introduction
CC0.1
Introduction
Please give a general description and introduction to your organization. Oracle offers a comprehensive and fully integrated stack of cloud applications, platform services, and engineered systems. With more than 420,000 customers—including 100 of the Fortune 100—in more than 145 countries, Oracle provides a complete technology stack both in the cloud and in the data center. Oracle’s industry-leading cloud-based and on-premises solutions give customers complete deployment flexibility and unmatched benefits including application integration, advanced security, high availability, scalability, energy efficiency, powerful performance, and low total cost of ownership. For more information about Oracle (NYSE:ORCL), visit oracle.com. Scale: • US$38.2 billion total GAAP revenue in FY15 • Position on the 2015 Fortune 500: 77 • Position on the 2015 Interbrand 100: 16 • #1 in 50 product or industry categories • Key offerings: database, middleware, applications, servers, storage, support, and consulting • Key industries: financial services, manufacturing, communications, media and entertainment, utilities, tax, public sector, education and research, life sciences, healthcare, travel and transportation, consumer products, aerospace and defense, automotive, professional services, and natural resources • 420,000 customers in 145 countries • More than 25,000 partners • More than 130,000 employees Innovation and Investment: • 37,000 developers and engineers • 18,000 customer support specialists, speaking 29 languages • 17,000 implementation consultants • Over 600 independent user communities representing more than 600,000 members • 2.2 million students supported annually • More than 17,000 patents worldwide Other

• Headquarters: Redwood Shores, California • Major operations in the United States, India, the United Kingdom, Japan, Germany, Canada, India, France, Australia, Brazil, the Netherlands, Romania, and Ireland • Fiscal year: June 1 to May 31
CC0.2
Reporting Year
Please state the start and end date of the year for which you are reporting data. The current reporting year is the latest/most recent 12-month period for which data is reported. Enter the dates of this year first. We request data for more than one reporting period for some emission accounting questions. Please provide data for the three years prior to the current reporting year if you have not provided this information before, or if this is the first time you have answered a CDP information request. (This does not apply if you have been offered and selected the option of answering the shorter questionnaire). If you are going to provide additional years of data, please give the dates of those reporting periods here. Work backwards from the most recent reporting year. Please enter dates in following format: day(DD)/month(MM)/year(YYYY) (i.e. 31/01/2001).
Enter Periods that will be disclosed
Thu 01 Jan 2015 - Thu 31 Dec 2015
CC0.3
Country list configuration
Please select the countries for which you will be supplying data. If you are responding to the Electric Utilities module, this selection will be carried forward to assist you in completing your response.
Select country
United States of America
Rest of world

CC0.4
Currency selection
Please select the currency in which you would like to submit your response. All financial information contained in the response should be in this currency. USD($)
CC0.6
Modules
As part of the request for information on behalf of investors, electric utilities, companies with electric utility activities or assets, companies in the automobile or auto component manufacture sub-industries, companies in the oil and gas sub-industries, companies in the information technology and telecommunications sectors and companies in the food, beverage and tobacco industry group should complete supplementary questions in addition to the main questionnaire. If you are in these sector groupings (according to the Global Industry Classification Standard (GICS)), the corresponding sector modules will not appear below but will automatically appear in the navigation bar when you save this page. If you want to query your classification, please email [email protected]. If you have not been presented with a sector module that you consider would be appropriate for your company to answer, please select the module below. If you wish to view the questions first, please see https://www.cdp.net/en-US/Programmes/Pages/More-questionnaires.aspx.
Further Information
Module: Management
Page: CC1. Governance
CC1.1
Where is the highest level of direct responsibility for climate change within your organization?
Board or individual/sub-set of the Board or other committee appointed by the Board
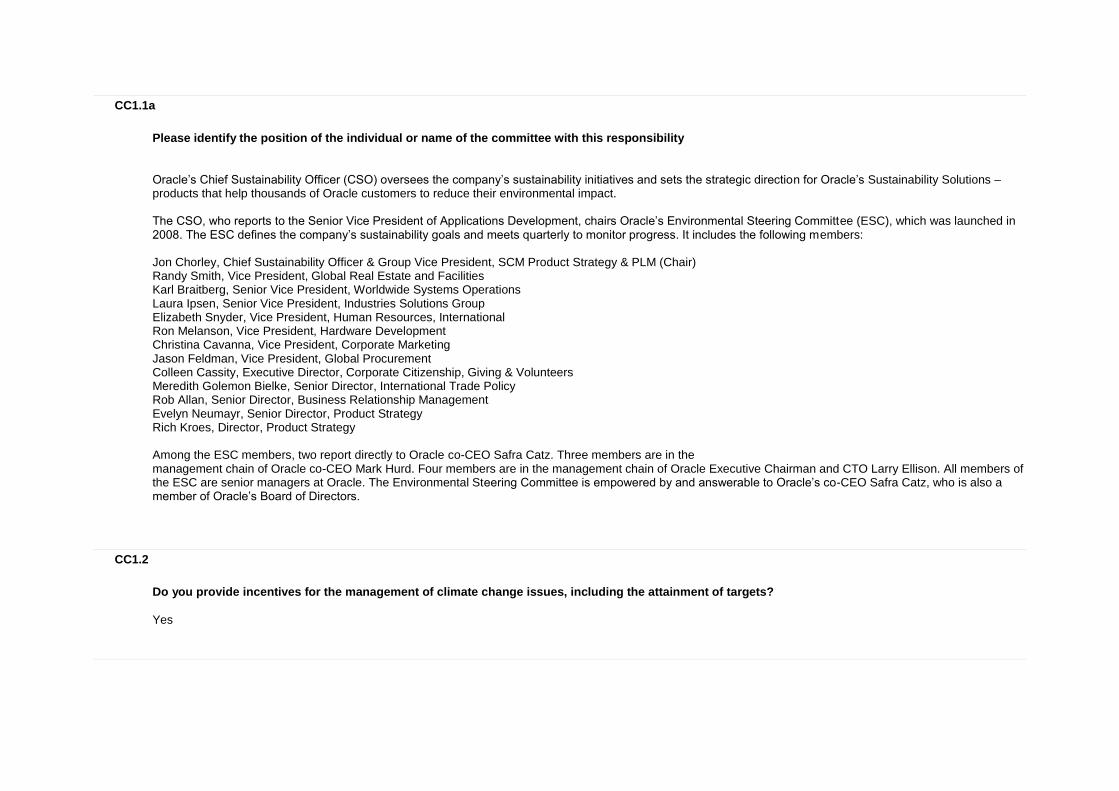
CC1.1a
Please identify the position of the individual or name of the committee with this responsibility
Oracle’s Chief Sustainability Officer (CSO) oversees the company’s sustainability initiatives and sets the strategic direction for Oracle’s Sustainability Solutions – products that help thousands of Oracle customers to reduce their environmental impact. The CSO, who reports to the Senior Vice President of Applications Development, chairs Oracle’s Environmental Steering Committee (ESC), which was launched in 2008. The ESC defines the company’s sustainability goals and meets quarterly to monitor progress. It includes the following members: Jon Chorley, Chief Sustainability Officer & Group Vice President, SCM Product Strategy & PLM (Chair) Randy Smith, Vice President, Global Real Estate and Facilities Karl Braitberg, Senior Vice President, Worldwide Systems Operations Laura Ipsen, Senior Vice President, Industries Solutions Group Elizabeth Snyder, Vice President, Human Resources, International Ron Melanson, Vice President, Hardware Development Christina Cavanna, Vice President, Corporate Marketing Jason Feldman, Vice President, Global Procurement Colleen Cassity, Executive Director, Corporate Citizenship, Giving & Volunteers Meredith Golemon Bielke, Senior Director, International Trade Policy Rob Allan, Senior Director, Business Relationship Management Evelyn Neumayr, Senior Director, Product Strategy Rich Kroes, Director, Product Strategy Among the ESC members, two report directly to Oracle co-CEO Safra Catz. Three members are in the management chain of Oracle co-CEO Mark Hurd. Four members are in the management chain of Oracle Executive Chairman and CTO Larry Ellison. All members of the ESC are senior managers at Oracle. The Environmental Steering Committee is empowered by and answerable to Oracle’s co-CEO Safra Catz, who is also a member of Oracle’s Board of Directors.
CC1.2
Do you provide incentives for the management of climate change issues, including the attainment of targets?
Yes
CC1.2a
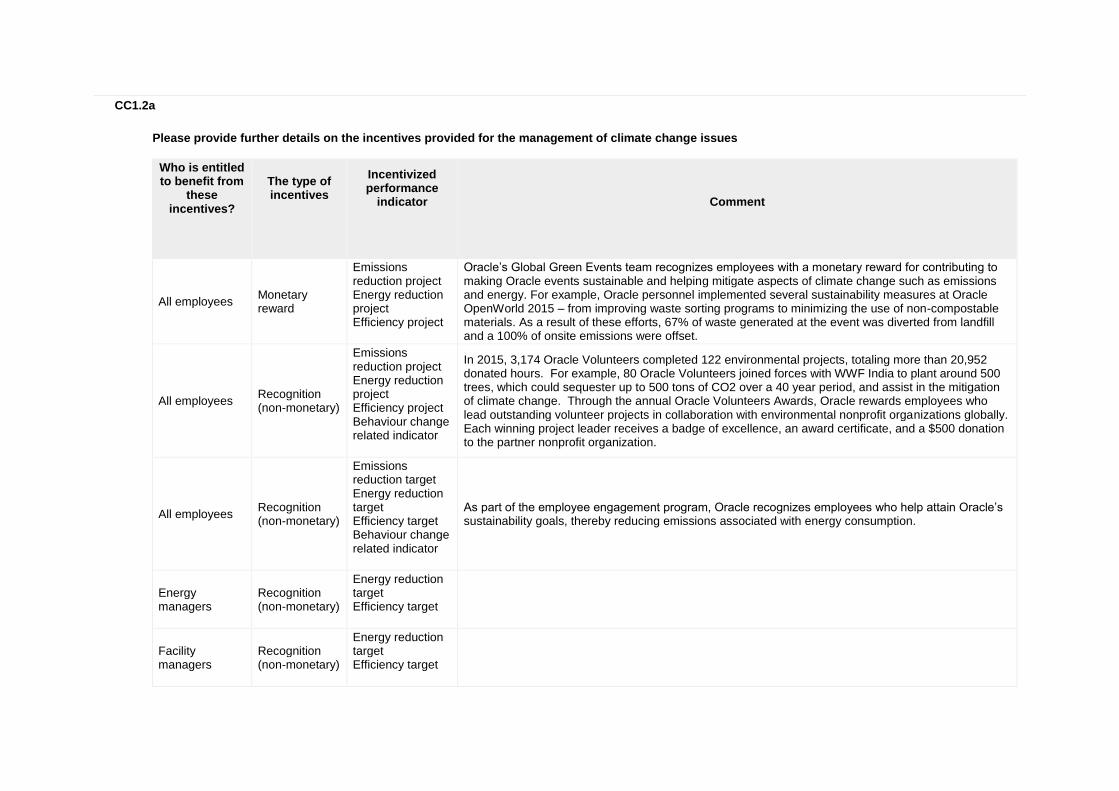
Please provide further details on the incentives provided for the management of climate change issues
Who is entitled to benefit from
these incentives?
The type of incentives
Incentivized performance
indicator
Comment
All employees Monetary reward
Emissions reduction project Energy reduction project Efficiency project
Oracle’s Global Green Events team recognizes employees with a monetary reward for contributing to making Oracle events sustainable and helping mitigate aspects of climate change such as emissions and energy. For example, Oracle personnel implemented several sustainability measures at Oracle OpenWorld 2015 – from improving waste sorting programs to minimizing the use of non-compostable materials. As a result of these efforts, 67% of waste generated at the event was diverted from landfill and a 100% of onsite emissions were offset.
All employees Recognition (non-monetary)
Emissions reduction project Energy reduction project Efficiency project Behaviour change related indicator
In 2015, 3,174 Oracle Volunteers completed 122 environmental projects, totaling more than 20,952 donated hours. For example, 80 Oracle Volunteers joined forces with WWF India to plant around 500 trees, which could sequester up to 500 tons of CO2 over a 40 year period, and assist in the mitigation of climate change. Through the annual Oracle Volunteers Awards, Oracle rewards employees who lead outstanding volunteer projects in collaboration with environmental nonprofit organizations globally. Each winning project leader receives a badge of excellence, an award certificate, and a $500 donation to the partner nonprofit organization.
All employees Recognition (non-monetary)
Emissions reduction target Energy reduction target Efficiency target Behaviour change related indicator
As part of the employee engagement program, Oracle recognizes employees who help attain Oracle’s sustainability goals, thereby reducing emissions associated with energy consumption.
Energy managers
Recognition (non-monetary)
Energy reduction target Efficiency target
Facility managers
Recognition (non-monetary)
Energy reduction target Efficiency target
Who is entitled to benefit from
these incentives?
The type of incentives
Incentivized performance
indicator
Comment
Other: Data center managers
Recognition (non-monetary)
Energy reduction target Efficiency target
Other: Building site managers
Recognition (non-monetary)
Energy reduction target Efficiency target
Further Information
Page: CC2. Strategy
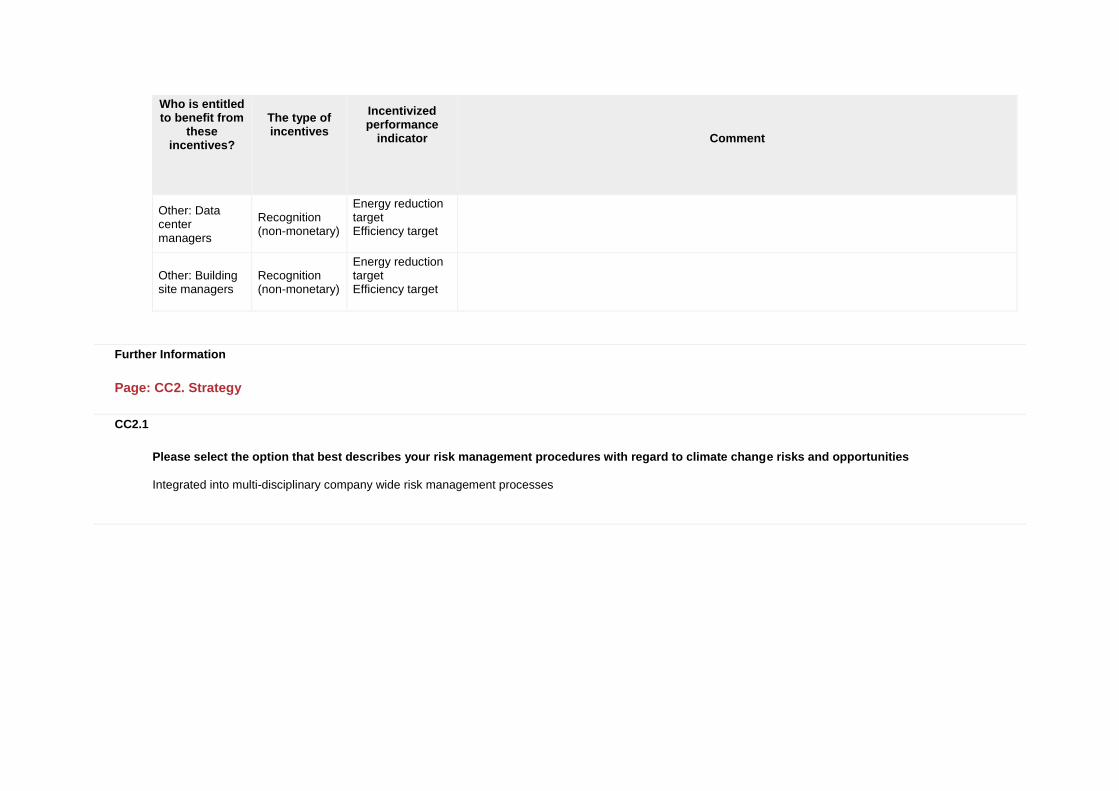
CC2.1
Please select the option that best describes your risk management procedures with regard to climate change risks and opportunities
Integrated into multi-disciplinary company wide risk management processes
CC2.1a
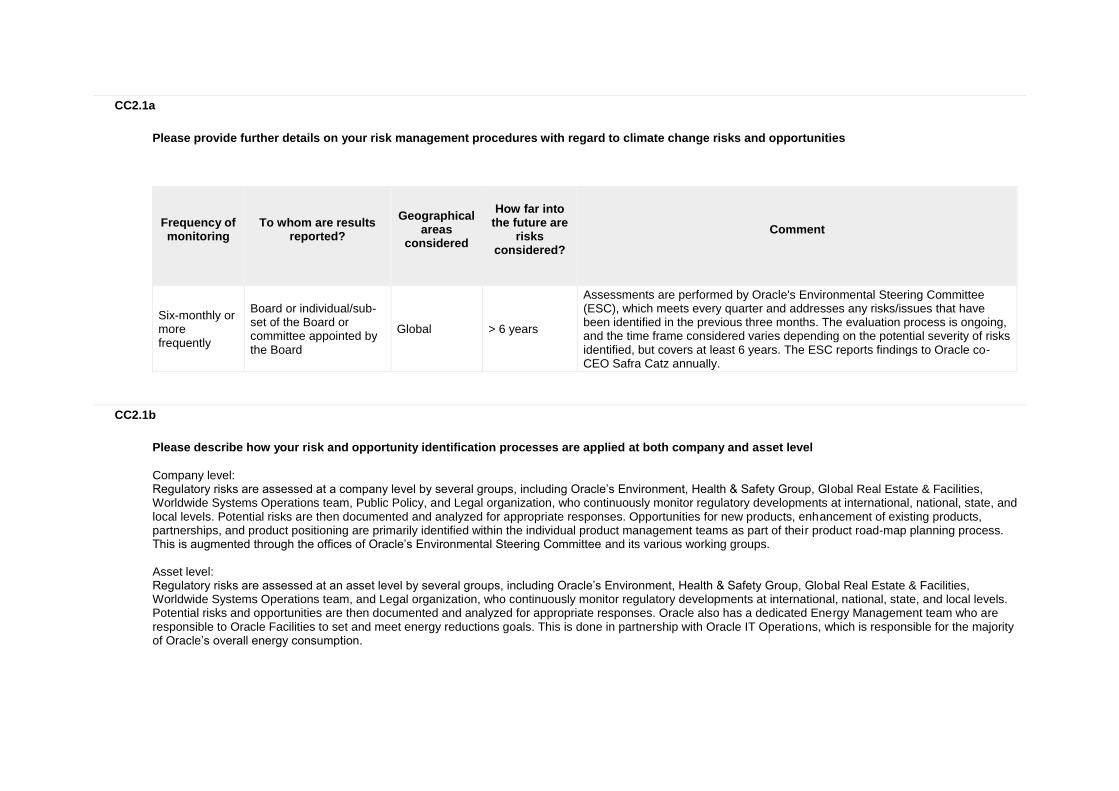
Please provide further details on your risk management procedures with regard to climate change risks and opportunities
Frequency of monitoring
To whom are results
reported?
Geographical
areas considered
How far into
the future are risks
considered?
Comment
Six-monthly or more frequently
Board or individual/sub-set of the Board or committee appointed by the Board
Global > 6 years
Assessments are performed by Oracle's Environmental Steering Committee (ESC), which meets every quarter and addresses any risks/issues that have been identified in the previous three months. The evaluation process is ongoing, and the time frame considered varies depending on the potential severity of risks identified, but covers at least 6 years. The ESC reports findings to Oracle co-CEO Safra Catz annually.
CC2.1b
Please describe how your risk and opportunity identification processes are applied at both company and asset level
Company level: Regulatory risks are assessed at a company level by several groups, including Oracle’s Environment, Health & Safety Group, Global Real Estate & Facilities, Worldwide Systems Operations team, Public Policy, and Legal organization, who continuously monitor regulatory developments at international, national, state, and local levels. Potential risks are then documented and analyzed for appropriate responses. Opportunities for new products, enhancement of existing products, partnerships, and product positioning are primarily identified within the individual product management teams as part of their product road-map planning process. This is augmented through the offices of Oracle’s Environmental Steering Committee and its various working groups. Asset level: Regulatory risks are assessed at an asset level by several groups, including Oracle’s Environment, Health & Safety Group, Global Real Estate & Facilities, Worldwide Systems Operations team, and Legal organization, who continuously monitor regulatory developments at international, national, state, and local levels. Potential risks and opportunities are then documented and analyzed for appropriate responses. Oracle also has a dedicated Energy Management team who are responsible to Oracle Facilities to set and meet energy reductions goals. This is done in partnership with Oracle IT Operations, which is responsible for the majority of Oracle’s overall energy consumption.
CC2.1c
How do you prioritize the risks and opportunities identified?
Oracle prioritizes the risks and opportunities identified by evaluating these risks and opportunities based on both quantitative and qualitative criteria that assess the severity of the potential impacts as well as the scale of the opportunities. Key areas of risks include supply chain disruption (including but not limited to climate change related disruption), commodity pricing volatility (including energy), and resource availability. The materiality/priority of each potential regulatory risk is analyzed based on criteria including: probability, cost, and risk of non-action. Opportunities associated with new products or product enhancements are evaluated in accordance with Oracle’s standard processes for any such investment.
CC2.1d
Please explain why you do not have a process in place for assessing and managing risks and opportunities from climate change, and whether you plan to introduce such a process in future
Main reason for not having a process
Do you plan to introduce a process?
Comment
CC2.2
Is climate change integrated into your business strategy?
Yes
CC2.2a
Please describe the process of how climate change is integrated into your business strategy and any outcomes of this process
The processes of how climate change is integrated into Oracle’s business strategy and the subsequent outcomes are: i) How business strategy has been influenced: Oracle’s business strategy has been influenced by climate change in that we’ve incorporated an environmental policy that defines our commitment to sustainable

business practices. Our internal process for collecting and reporting data to influence business strategy includes quarterly meetings with Oracle’s Environmental Steering Committee, where any new topics related to climate change are addressed. As an example of an outcome of climate change being integrated into our business strategy, Oracle’s Real Estate and Facilities team has a process in place for setting sustainability goals around emissions reduction, energy efficiency, water conservation and waste reduction, helping Oracle achieve its sustainability targets, while also improving operational efficiency. In addition, Oracle reduces its environmental impact through a multifaceted approach that includes developing products to help our customers achieve their sustainability goals. ii) Aspects of climate change that have influenced strategy: The aspects of climate change that have influenced strategy include potential resource availability challenges, the need to reduce energy and water consumption and waste generation, potential regulatory changes, and opportunities to develop sustainability-related business solutions for our customers. To this end, we closely monitor our energy consumption, consumption of natural resources through procurement processes and through our own activities, and end-of-life disposal of our hardware products. iii) Most important components of short-term strategy that are influenced by climate change: The key components of Oracle’s short-term strategy influenced by climate change are: emissions and energy consumption, equipment selection and management, waste management, and travel minimization. Our short-term strategy includes a commitment to environmental management through a number of avenues, including: • Continually monitoring and improving performance, and managing the consumption of energy, water, and other resources in our day-to-day operations; • Incorporating environmental considerations into leasing, purchasing and procurement processes; • Keeping our internal and external stakeholders informed about Oracle's environmental performance, and providing channels for employees to contribute to our efforts; • Developing software and hardware offerings to help our customers manage their own environmental challenges; and • Committing to comply with applicable environmental laws and regulations. iv) Most important components of long-term strategy that are influenced by climate change: The key components of our long-term strategy influenced by climate change are: emphasizing environmental sustainability in our business operations and development of product and service offerings. Externally, we are striving to set new industry standards. Internally, we set energy- and emissions-reduction goals and track these goals annually. Three long-term goals we have in place are: • Achieve a 33% target for renewable energy use at Oracle facilities globally by 2020. • Achieve a 20% reduction in absolute emissions by 2020 vs. 2015 for all Oracle-occupied buildings. • Achieve a 20% reduction in energy per revenue by 2020 vs. 2015 for all Oracle-occupied buildings. v) How this is gaining us strategic advantage over our competitors: Oracle gains strategic advantage over its competitors by engineering its software and hardware to work together. Oracle is uniquely positioned to deliver practical, concrete solutions that help customers with their sustainability initiatives. For example, Oracle offers the Environmental Accounting & Reporting (EA&R) software module to help businesses conduct sustainability reporting. Similarly, Oracle Advanced Procurement and Oracle Manufacturing help businesses achieve sustainable sourcing and manufacturing goals. Furthermore, Oracle endeavors to operate its own business according to environmental best practices, and we use our own sustainability products, achieving significant benefits to our bottom line. In 2015, Oracle received the BizSMART@Work Gold award for Recycling and Composting, in recognition of our excellent waste management efforts. vi) Most substantial business decisions made during the reporting year that were influenced by the climate change driven aspects of the strategy: This year’s substantial business decisions that were influenced by climate change aspects include:

• In 2015, Oracle continued to expand use of Environmental Accounting & Reporting – an Oracle software product that enables companies to better manage and report their environmental footprint and thus reduce their GHG emissions – internally, worldwide. Oracle’s business decision to expand EA&R usage was influenced by the need to decrease energy consumption and greenhouse gas emissions with regard to climate change. • Through the Sustainability Innovation Awards - at Oracle OpenWorld 2015 - we recognized customers who use Oracle products to support their sustainability initiatives. This business decision was influenced by the need to develop and promote green business practices. • Oracle used the EPA's ENERGY STAR program to benchmark its owned buildings in regions served by the program. We strive to achieve ENERGY STAR certifications for qualifying buildings, placing them in the top quartile for energy performance in North America. The business decision to benchmark our buildings with ENERGY STAR was influenced by the need to decrease GHG emissions with regard to climate change. As a result, Oracle-owned buildings in the following cities received ENERGY STAR certifications in 2015: -Burlington, MA -Nashua, NH -Denver, CO -Rocklin, CA -Colorado Springs, CO -Broomfield, CO -Orlando, FL -Pleasanton, CA -Redwood Shores, CA -San Jose, CA -West Jordan, UT • Another substantial business decision influenced by the need to reduce greenhouse gas emissions was the installation of a new solar photovoltaic system at an Oracle facility in Burlington, Massachusetts in April 2015. The system is fully operational, generating clean, zero-emission electricity for the new, adjacent 125,000 square foot building. In 2015, the photovoltaic system produced 653,254 kWh of energy from the sun. This solar production equates to a $101,022 savings in the cost associated with purchasing energy from the local utility, and reduces emissions through the use of cleaner energy sources. • In 2016, Oracle acquired OPower, a leading provider of energy efficiency cloud services to utilities. Between 2007 and 2015, Opower technology enabled consumers to save more than $700 million in energy bills, avoiding 9 billion lbs of CO2 emissions. This acquisition reflects Oracle’s long-term, strategic commitment to sustainability and climate change mitigation.
CC2.2b
Please explain why climate change is not integrated into your business strategy
CC2.2c
Does your company use an internal price of carbon?
No, and we currently don't anticipate doing so in the next 2 years
CC2.2d
Please provide details and examples of how your company uses an internal price of carbon
CC2.3
Do you engage in activities that could either directly or indirectly influence public policy on climate change through any of the following? (tick all that apply)
Trade associations Funding research organizations
CC2.3a
On what issues have you been engaging directly with policy makers?
Focus of legislation
Corporate Position
Details of engagement
Proposed legislative solution
CC2.3b
Are you on the Board of any trade associations or provide funding beyond membership?
Yes
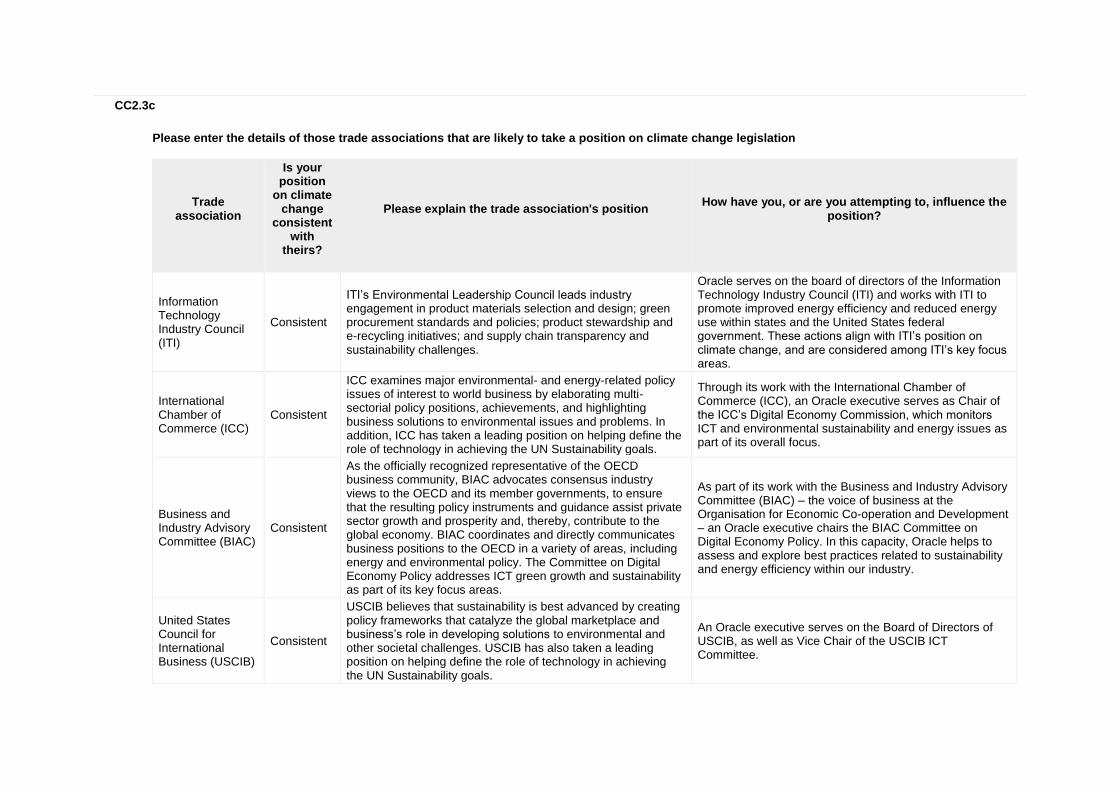
CC2.3c
Please enter the details of those trade associations that are likely to take a position on climate change legislation
Trade association
Is your position
on climate change
consistent with
theirs?
Please explain the trade association's position
How have you, or are you attempting to, influence the position?
Information Technology Industry Council (ITI)
Consistent
ITI’s Environmental Leadership Council leads industry engagement in product materials selection and design; green procurement standards and policies; product stewardship and e-recycling initiatives; and supply chain transparency and sustainability challenges.
Oracle serves on the board of directors of the Information Technology Industry Council (ITI) and works with ITI to promote improved energy efficiency and reduced energy use within states and the United States federal government. These actions align with ITI’s position on climate change, and are considered among ITI’s key focus areas.
International Chamber of Commerce (ICC)
Consistent
ICC examines major environmental- and energy-related policy issues of interest to world business by elaborating multi-sectorial policy positions, achievements, and highlighting business solutions to environmental issues and problems. In addition, ICC has taken a leading position on helping define the role of technology in achieving the UN Sustainability goals.
Through its work with the International Chamber of Commerce (ICC), an Oracle executive serves as Chair of the ICC’s Digital Economy Commission, which monitors ICT and environmental sustainability and energy issues as part of its overall focus.
Business and Industry Advisory Committee (BIAC)
Consistent
As the officially recognized representative of the OECD business community, BIAC advocates consensus industry views to the OECD and its member governments, to ensure that the resulting policy instruments and guidance assist private sector growth and prosperity and, thereby, contribute to the global economy. BIAC coordinates and directly communicates business positions to the OECD in a variety of areas, including energy and environmental policy. The Committee on Digital Economy Policy addresses ICT green growth and sustainability as part of its key focus areas.
As part of its work with the Business and Industry Advisory Committee (BIAC) – the voice of business at the Organisation for Economic Co-operation and Development – an Oracle executive chairs the BIAC Committee on Digital Economy Policy. In this capacity, Oracle helps to assess and explore best practices related to sustainability and energy efficiency within our industry.
United States Council for International Business (USCIB)
Consistent
USCIB believes that sustainability is best advanced by creating policy frameworks that catalyze the global marketplace and business’s role in developing solutions to environmental and other societal challenges. USCIB has also taken a leading position on helping define the role of technology in achieving the UN Sustainability goals.
An Oracle executive serves on the Board of Directors of USCIB, as well as Vice Chair of the USCIB ICT Committee.
Trade association
Is your position
on climate change
consistent with
theirs?
Please explain the trade association's position
How have you, or are you attempting to, influence the position?
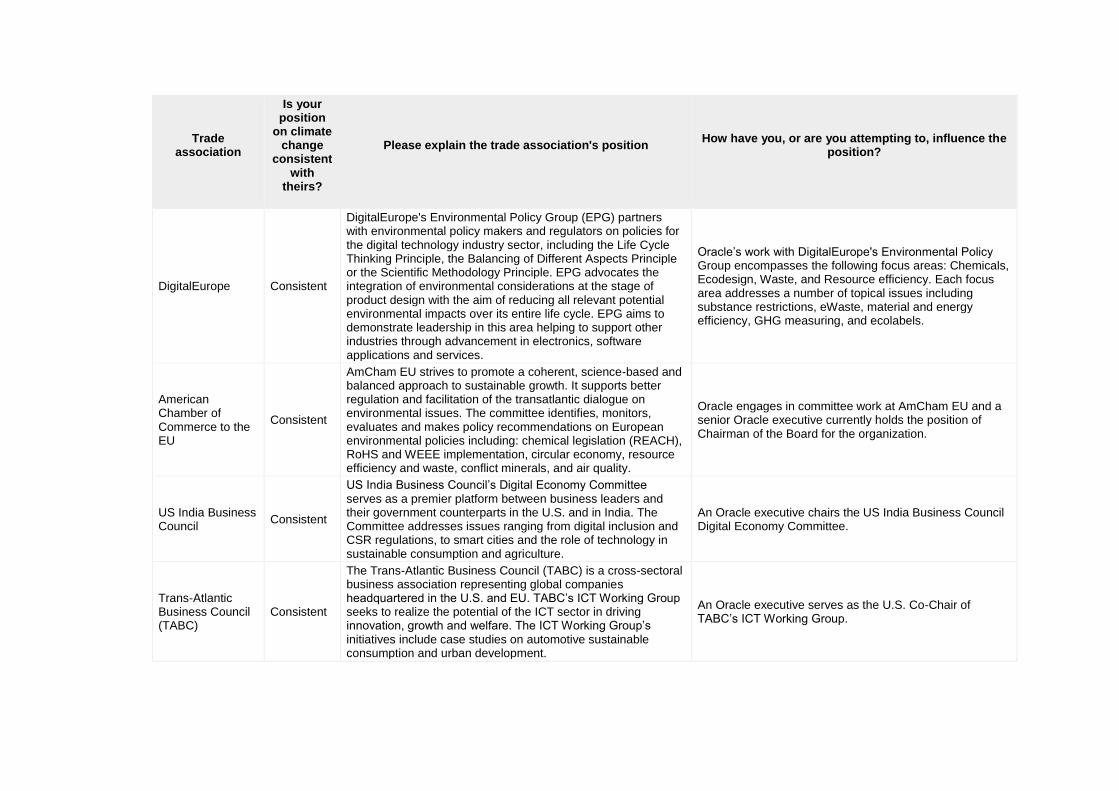
DigitalEurope Consistent
DigitalEurope's Environmental Policy Group (EPG) partners with environmental policy makers and regulators on policies for the digital technology industry sector, including the Life Cycle Thinking Principle, the Balancing of Different Aspects Principle or the Scientific Methodology Principle. EPG advocates the integration of environmental considerations at the stage of product design with the aim of reducing all relevant potential environmental impacts over its entire life cycle. EPG aims to demonstrate leadership in this area helping to support other industries through advancement in electronics, software applications and services.
Oracle’s work with DigitalEurope's Environmental Policy Group encompasses the following focus areas: Chemicals, Ecodesign, Waste, and Resource efficiency. Each focus area addresses a number of topical issues including substance restrictions, eWaste, material and energy efficiency, GHG measuring, and ecolabels.
American Chamber of Commerce to the EU
Consistent
AmCham EU strives to promote a coherent, science-based and balanced approach to sustainable growth. It supports better regulation and facilitation of the transatlantic dialogue on environmental issues. The committee identifies, monitors, evaluates and makes policy recommendations on European environmental policies including: chemical legislation (REACH), RoHS and WEEE implementation, circular economy, resource efficiency and waste, conflict minerals, and air quality.
Oracle engages in committee work at AmCham EU and a senior Oracle executive currently holds the position of Chairman of the Board for the organization.
US India Business Council
Consistent
US India Business Council’s Digital Economy Committee serves as a premier platform between business leaders and their government counterparts in the U.S. and in India. The Committee addresses issues ranging from digital inclusion and CSR regulations, to smart cities and the role of technology in sustainable consumption and agriculture.
An Oracle executive chairs the US India Business Council Digital Economy Committee.
Trans-Atlantic Business Council (TABC)
Consistent
The Trans-Atlantic Business Council (TABC) is a cross-sectoral business association representing global companies headquartered in the U.S. and EU. TABC’s ICT Working Group seeks to realize the potential of the ICT sector in driving innovation, growth and welfare. The ICT Working Group’s initiatives include case studies on automotive sustainable consumption and urban development.
An Oracle executive serves as the U.S. Co-Chair of TABC’s ICT Working Group.

CC2.3d
Do you publicly disclose a list of all the research organizations that you fund?
No
CC2.3e
Please provide details of the other engagement activities that you undertake
CC2.3f
What processes do you have in place to ensure that all of your direct and indirect activities that influence policy are consistent with your overall climate change strategy?
The processes that Oracle has in place to ensure that all of our direct and indirect activities that influence policy are consistent with our overall climate strategy are: Oracle’s Environmental Steering Committee – which includes representatives from all business divisions, including the public policy team, and which is led by Oracle’s Chief Sustainability Officer – ensures a common approach that is consistent with Oracle’s overall strategy on climate change. The full committee meets quarterly, while sub-committees and working groups meet more frequently.
CC2.3g
Please explain why you do not engage with policy makers
Further Information
Page: CC3. Targets and Initiatives
CC3.1

Did you have an emissions reduction or renewable energy consumption or production target that was active (ongoing or reached completion) in the reporting year?
Absolute target Intensity target Renewable energy consumption and/or production target
CC3.1a
Please provide details of your absolute target
ID
Scope
% of emissions in
scope
% reduction from base
year
Base year
Base year emissions covered by
target (metric tonnes CO2e)
Target year
Is this a science-based target?
Comment
Abs1 Scope 1+2 (market-based)
100% 20% 2015 386720 2020 No, but we anticipate setting one in the next 2 years
CC3.1b
Please provide details of your intensity target
ID
Scope
% of emissions in scope
% reduction from base
year
Metric
Base year
Normalized base year emissions covered by
target
Target year
Is this a science-based
target?
Comment
Int1 Scope 1+2 (location-
77% 10% Metric tonnes CO2e per unit
2010 3.26 2016 No, but we anticipate setting
We achieved our goal of reducing energy use by 10% per employee by

ID
Scope
% of emissions in scope
% reduction from base
year
Metric
Base year
Normalized base year emissions covered by
target
Target year
Is this a science-based
target?
Comment
based) FTE employee one in the next 2 years
2016, over our 2010 base year for all facilities, excluding data centers.
Int2 Scope 1+2 (location-based)
23% 6%
Other: Power Usage Effectiveness (PUE)
2010 1.573 2016
No, but we anticipate setting one in the next 2 years
By 2016, we made progress toward achieving our goal of improving our data center Power Usage Effectiveness (PUE) by 6% over our 2010 base year.
Int3 Scope 1+2 (market-based)
100% 20% Metric tonnes CO2e per unit revenue
2015 0.000010 2020
No, but we anticipate setting one in the next 2 years
By 2020, we plan to reduce our energy consumption per unit revenue by 20% over our 2015 base year.
CC3.1c
Please also indicate what change in absolute emissions this intensity target reflects
ID
Direction of change
anticipated in absolute
Scope 1+2 emissions at
target completion?
% change anticipated in
absolute Scope 1+2 emissions
Direction of change anticipated in absolute Scope
3 emissions at target completion?
% change anticipated in
absolute Scope 3
emissions
Comment
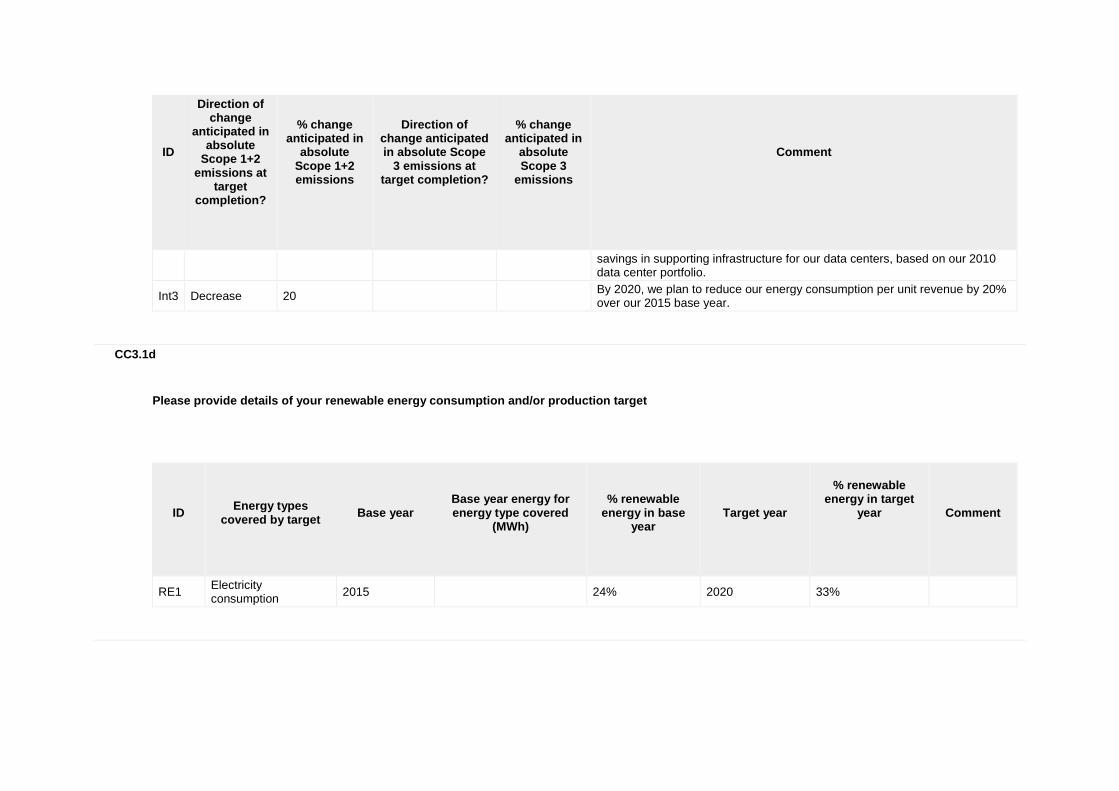
Int1 Decrease 10
By 2016, we reduced energy use by 10% per employee over our 2010 base year for all facilities, excluding data centers.
Int2 Decrease 6
By 2016, we plan to improve our data center Power Usage Effectiveness (PUE) by 6% over our 2010 base year. This translates to a 10% emissions
ID
Direction of change
anticipated in absolute
Scope 1+2 emissions at
target completion?
% change anticipated in
absolute Scope 1+2 emissions
Direction of change anticipated in absolute Scope
3 emissions at target completion?
% change anticipated in
absolute Scope 3
emissions
Comment
savings in supporting infrastructure for our data centers, based on our 2010 data center portfolio.
Int3 Decrease 20
By 2020, we plan to reduce our energy consumption per unit revenue by 20% over our 2015 base year.
CC3.1d
Please provide details of your renewable energy consumption and/or production target
ID
Energy types
covered by target
Base year
Base year energy for energy type covered
(MWh)
% renewable
energy in base year
Target year
% renewable
energy in target year
Comment
RE1 Electricity consumption
2015
24% 2020 33%
CC3.1e
For all of your targets, please provide details on the progress made in the reporting year
ID
% complete
(time)
% complete (emissions or
renewable energy)
Comment
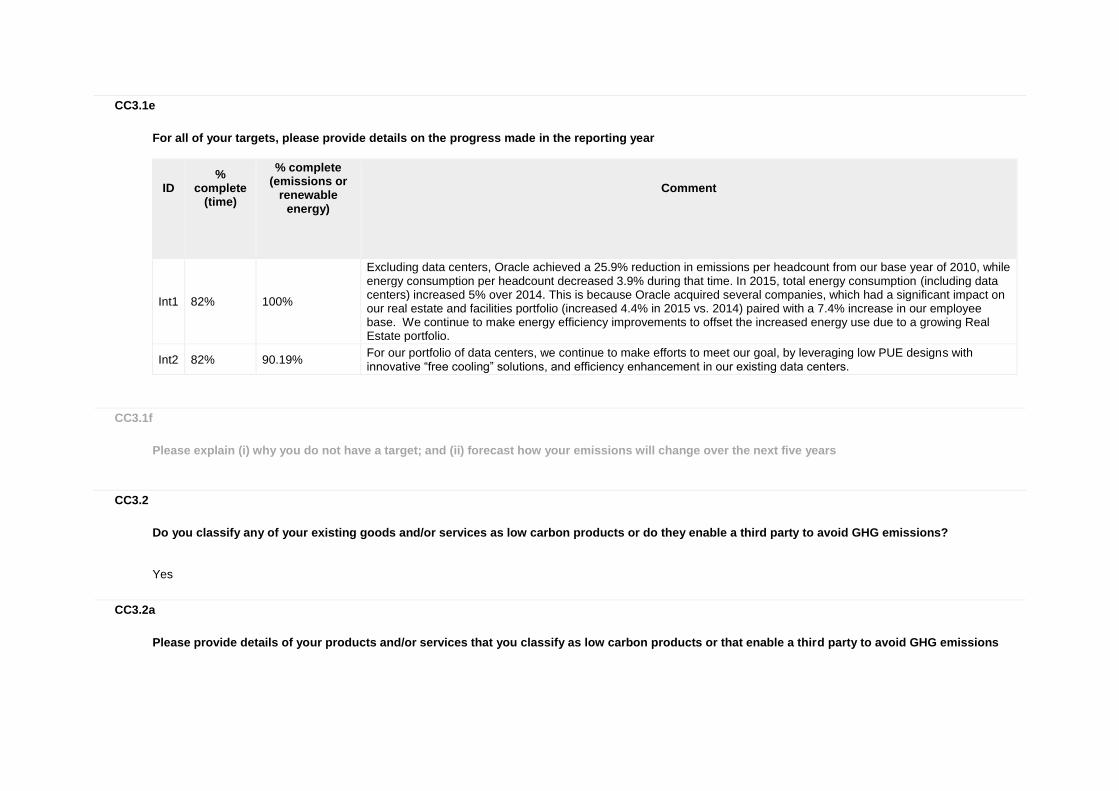
Int1 82% 100%
Excluding data centers, Oracle achieved a 25.9% reduction in emissions per headcount from our base year of 2010, while energy consumption per headcount decreased 3.9% during that time. In 2015, total energy consumption (including data centers) increased 5% over 2014. This is because Oracle acquired several companies, which had a significant impact on our real estate and facilities portfolio (increased 4.4% in 2015 vs. 2014) paired with a 7.4% increase in our employee base. We continue to make energy efficiency improvements to offset the increased energy use due to a growing Real Estate portfolio.
Int2 82% 90.19% For our portfolio of data centers, we continue to make efforts to meet our goal, by leveraging low PUE designs with innovative “free cooling” solutions, and efficiency enhancement in our existing data centers.
CC3.1f
Please explain (i) why you do not have a target; and (ii) forecast how your emissions will change over the next five years
CC3.2
Do you classify any of your existing goods and/or services as low carbon products or do they enable a third party to avoid GHG emissions?
Yes
CC3.2a
Please provide details of your products and/or services that you classify as low carbon products or that enable a third party to avoid GHG emissions

Level of
aggregation
Description of product/Group of
products
Are you
reporting low carbon product/s or avoided emissions?
Taxonomy, project or
methodology used to classify product/s as low
carbon or to calculate avoided
emissions
%
revenue from low carbon
product/s in the
reporting year
% R&D in
low carbon
product/s in the
reporting year
Comment
Group of products
Many of Oracle’s solutions enable our customers to be more environmentally sustainable and to reduce their GHG emissions. These solutions are broadly categorized under ‘Risk and Performance Management’ (including environmental data collection and reporting); ‘Business Operations’ (including transportation management, smart grid technologies, and product lifecycle management); and ‘IT Infrastructure’ (including energy efficient engineered systems and cloud computing).
Avoided emissions
Other: Avoided emissions are reported on a customer-by-customer basis.
Less than or equal to 10%
Inherently, the benefits of many of these solutions are not just limited to environmental performance improvements, but also include cost reduction and continuous improvement potential. It is Oracle’s policy not to provide revenue breakdowns at the product level beyond what is available in our 10-K filings. In terms of R&D, Oracle is rigorously focused on working with its customers to meet their business needs in the ongoing development of our solutions. Given Oracle’s commitment to developing practices and products that help protect the environment, this includes addressing product enhancement requests from customers related to meeting their sustainability objectives. Oracle’s product strategy is to embed sustainability related features in products so customers can leverage their existing IT investments and business processes wherever possible. In many cases customers are also able to configure Oracle’s solutions to address their sustainability needs in conjunction with other business objectives. In FY15, Oracle spent $5.5 billion on research and development of products and services, including those

Level of
aggregation
Description of product/Group of
products
Are you
reporting low carbon product/s or avoided emissions?
Taxonomy, project or
methodology used to classify product/s as low
carbon or to calculate avoided
emissions
%
revenue from low carbon
product/s in the
reporting year
% R&D in
low carbon
product/s in the
reporting year
Comment
related to sustainability.
CC3.3
Did you have emissions reduction initiatives that were active within the reporting year (this can include those in the planning and/or implementation phases)
Yes
CC3.3a
Please identify the total number of projects at each stage of development, and for those in the implementation stages, the estimated CO2e savings
Stage of development
Number of projects
Total estimated annual CO2e savings in metric tonnes CO2e (only for rows marked *)
Under investigation 71
To be implemented* 26 2340
Implementation commenced* 15 1230
Implemented* 51 5839
Not to be implemented 16

CC3.3b
For those initiatives implemented in the reporting year, please provide details in the table below
Activity type
Description of activity
Estimated annual CO2e
savings (metric tonnes CO2e)
Scope
Voluntary/ Mandatory
Annual monetary savings
(unit currency -
as specified in CC0.4)
Investment required
(unit currency -
as specified in
CC0.4)
Payback period
Estimated lifetime of
the initiative
Comment
Low carbon energy installation
In April 2015, we installed a new solar photovoltaic system at an Oracle facility in Burlington, Massachusetts. The system is fully operational, generating clean, zero-emission electricity for the new, adjacent 125,000 square foot building. In 2015, the photovoltaic system produced 653,254 kWh of energy from the sun. This solar production equates to a $101,022 savings in the cost associated with purchasing energy from the local utility. Tax credits, accelerated asset depreciation and other financial benefits also justified the project.
190
Scope 2 (location-based) Scope 2 (market-based)
Voluntary
101022 2455973 4-10 years
21-30 years
Low carbon energy purchase
In 2015, we purchased low carbon energy at several facilities, including 5,400 MWh in renewable energy credits (RECs) at Oracle’s Austin Data Center, and 38,151 MWh in zero carbon electricity at several facilities in the UK.
20957
Scope 2 (market-based)
Voluntary
0 5000 1-3 years
<1 year
Energy efficiency: Building
The foot print of our global facilities portfolio increased more than 5.8 million square feet from the base year. We
3504 Scope 2 (location-based)
Voluntary
256850 642125 1-3 years
6-10 years

Activity type
Description of activity
Estimated annual CO2e
savings (metric tonnes CO2e)
Scope
Voluntary/ Mandatory
Annual monetary savings
(unit currency -
as specified in CC0.4)
Investment required
(unit currency -
as specified in
CC0.4)
Payback period
Estimated lifetime of
the initiative
Comment
services installed dimmable lighting, interior and exterior LED lights, advanced lighting controls, building HVAC controls, hardware and advanced control schemes, upgraded our mechanical cooling systems with economizers and higher efficiency components and boiler and heating systems, increased monitoring, and undertook retro-commissioning. These measures have a median life of 1-12 years and an average persistency life of 7 years. This is a voluntary activity for Scope 2.
Scope 2 (market-based)
Energy efficiency: Processes
In an effort to reduce our data center emissions, we implemented a number of voluntary measures, including the Lab Energy Optimization initiative, enhanced IT and cooling power monitoring and tracking, PUE tracking, airflow management, heat containment, hot aisle/cold aisle barriers, efficient airflow, efficient cooling production, airside economizer, evaporative humidification, and evaporative cooling. This is a voluntary activity for Scope 2.
2335
Scope 2 (location-based) Scope 2 (market-based)
Voluntary
169913 764608 4-10 years
6-10 years
CC3.3c
What methods do you use to drive investment in emissions reduction activities?
Method
Comment
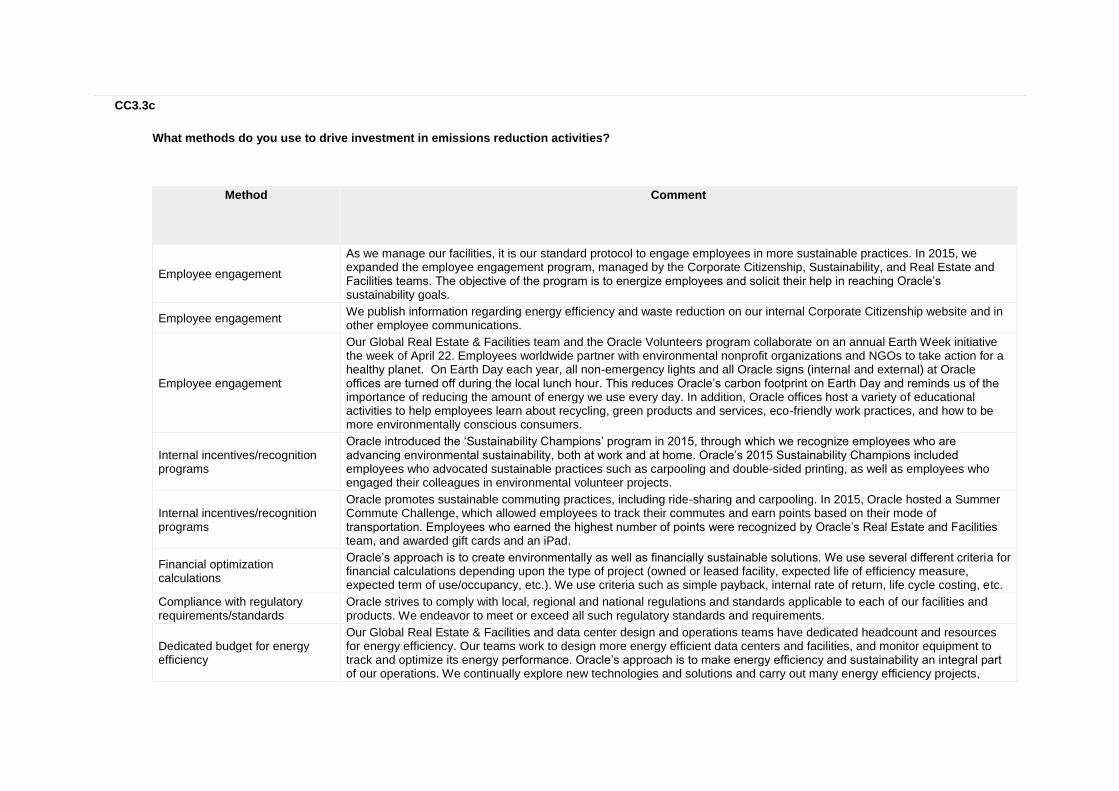
Employee engagement
As we manage our facilities, it is our standard protocol to engage employees in more sustainable practices. In 2015, we expanded the employee engagement program, managed by the Corporate Citizenship, Sustainability, and Real Estate and Facilities teams. The objective of the program is to energize employees and solicit their help in reaching Oracle’s sustainability goals.
Employee engagement We publish information regarding energy efficiency and waste reduction on our internal Corporate Citizenship website and in other employee communications.
Employee engagement
Our Global Real Estate & Facilities team and the Oracle Volunteers program collaborate on an annual Earth Week initiative the week of April 22. Employees worldwide partner with environmental nonprofit organizations and NGOs to take action for a healthy planet. On Earth Day each year, all non-emergency lights and all Oracle signs (internal and external) at Oracle offices are turned off during the local lunch hour. This reduces Oracle’s carbon footprint on Earth Day and reminds us of the importance of reducing the amount of energy we use every day. In addition, Oracle offices host a variety of educational activities to help employees learn about recycling, green products and services, eco-friendly work practices, and how to be more environmentally conscious consumers.
Internal incentives/recognition programs
Oracle introduced the ‘Sustainability Champions’ program in 2015, through which we recognize employees who are advancing environmental sustainability, both at work and at home. Oracle’s 2015 Sustainability Champions included employees who advocated sustainable practices such as carpooling and double-sided printing, as well as employees who engaged their colleagues in environmental volunteer projects.
Internal incentives/recognition programs
Oracle promotes sustainable commuting practices, including ride-sharing and carpooling. In 2015, Oracle hosted a Summer Commute Challenge, which allowed employees to track their commutes and earn points based on their mode of transportation. Employees who earned the highest number of points were recognized by Oracle’s Real Estate and Facilities team, and awarded gift cards and an iPad.
Financial optimization calculations
Oracle’s approach is to create environmentally as well as financially sustainable solutions. We use several different criteria for financial calculations depending upon the type of project (owned or leased facility, expected life of efficiency measure, expected term of use/occupancy, etc.). We use criteria such as simple payback, internal rate of return, life cycle costing, etc.
Compliance with regulatory requirements/standards
Oracle strives to comply with local, regional and national regulations and standards applicable to each of our facilities and products. We endeavor to meet or exceed all such regulatory standards and requirements.
Dedicated budget for energy efficiency
Our Global Real Estate & Facilities and data center design and operations teams have dedicated headcount and resources for energy efficiency. Our teams work to design more energy efficient data centers and facilities, and monitor equipment to track and optimize its energy performance. Oracle’s approach is to make energy efficiency and sustainability an integral part of our operations. We continually explore new technologies and solutions and carry out many energy efficiency projects,

Method
Comment
including leveraging external incentives where available, as long as they meet our internal criteria.
Dedicated budget for other emissions reduction activities
Oracle is committed to reducing its environment impact where practical and economically feasible. Our Global Real Estate & Facilities organization has a dedicated budget for several emissions reduction activities, including purchase of renewable energy certificates, commuter travel, and employee ride sharing programs. In 2015, we continued our work to reduce travel by leveraging Oracle products and updating our travel-related business practices. We ask employees to travel only when necessary and employ Oracle Web Conferencing and Cisco TelePresence across our enterprise to ensure that virtual meetings are highly effective. In addition, we have installed electric vehicle charging stations at several of our facilities, and offer alternative transportation and commuter benefits to our employees across North America. In recognition of these efforts, Oracle was named a Best Workplace for Commuters in California for meeting the National Standard of Excellence.
Other Oracle develops products that support more than 400,000 customers in 145 countries to employ our industry-leading technology to address their environmental initiatives in conjunction with other business objectives.
CC3.3d
If you do not have any emissions reduction initiatives, please explain why not
Further Information
Page: CC4. Communication
CC4.1
Have you published information about your organization’s response to climate change and GHG emissions performance for this reporting year in places other than in your CDP response? If so, please attach the publication(s)
Publication
Status
Page/Section reference
Attach the document
Comment
In mainstream reports Complete pg. 32 (Risk Factors) https://www.cdp.net/sites/2016/13/14013/Climate Change

Publication
Status
Page/Section reference
Attach the document
Comment
(including an integrated report) but have not used the CDSB Framework
2016/Shared Documents/Attachments/CC4.1/Oracle Corporation_SEC-Filing-10K_2015.pdf
In voluntary communications Complete
Corporate Citizenship Report, Sustainability Section, 2015 Sustainability Update
https://www.cdp.net/sites/2016/13/14013/Climate Change 2016/Shared Documents/Attachments/CC4.1/Oracle 2015 Sustainability Update.pdf
In voluntary communications Underway - previous year attached
Corporate Citizenship Report, Sustainability Section, CSO Message
https://www.cdp.net/sites/2016/13/14013/Climate Change 2016/Shared Documents/Attachments/CC4.1/2014 CCR_Sustainability_CSO Message.PNG
In voluntary communications Underway - previous year attached
Corporate Citizenship Report, Sustainability Section, Facilities, Energy
https://www.cdp.net/sites/2016/13/14013/Climate Change 2016/Shared Documents/Attachments/CC4.1/2014 CCR_Facitlies_Energy.PNG
In voluntary communications Underway - previous year attached
Corporate Citizenship Report, Sustainability Section, Facilities, Data Centers
https://www.cdp.net/sites/2016/13/14013/Climate Change 2016/Shared Documents/Attachments/CC4.1/2014 CCR_Facitlies_Data Centers.PNG
In voluntary communications Underway - previous year attached
Corporate Citizenship Report, Sustainability Section, Facilities, Water and Waste
https://www.cdp.net/sites/2016/13/14013/Climate Change 2016/Shared Documents/Attachments/CC4.1/2014 CCR_Facitlies_Water and Waste.PNG
Further Information
Module: Risks and Opportunities
Page: CC5. Climate Change Risks
CC5.1
Have you identified any inherent climate change risks that have the potential to generate a substantive change in your business operations, revenue or expenditure? Tick all that apply
Risks driven by changes in regulation Risks driven by changes in physical climate parameters Risks driven by changes in other climate-related developments
CC5.1a
Please describe your inherent risks that are driven by changes in regulation
Risk driver
Description
Potential impact
Timeframe
Direct/ Indirect
Likelihood
Magnitude of impact
Estimated financial
implications
Management
method
Cost of
management
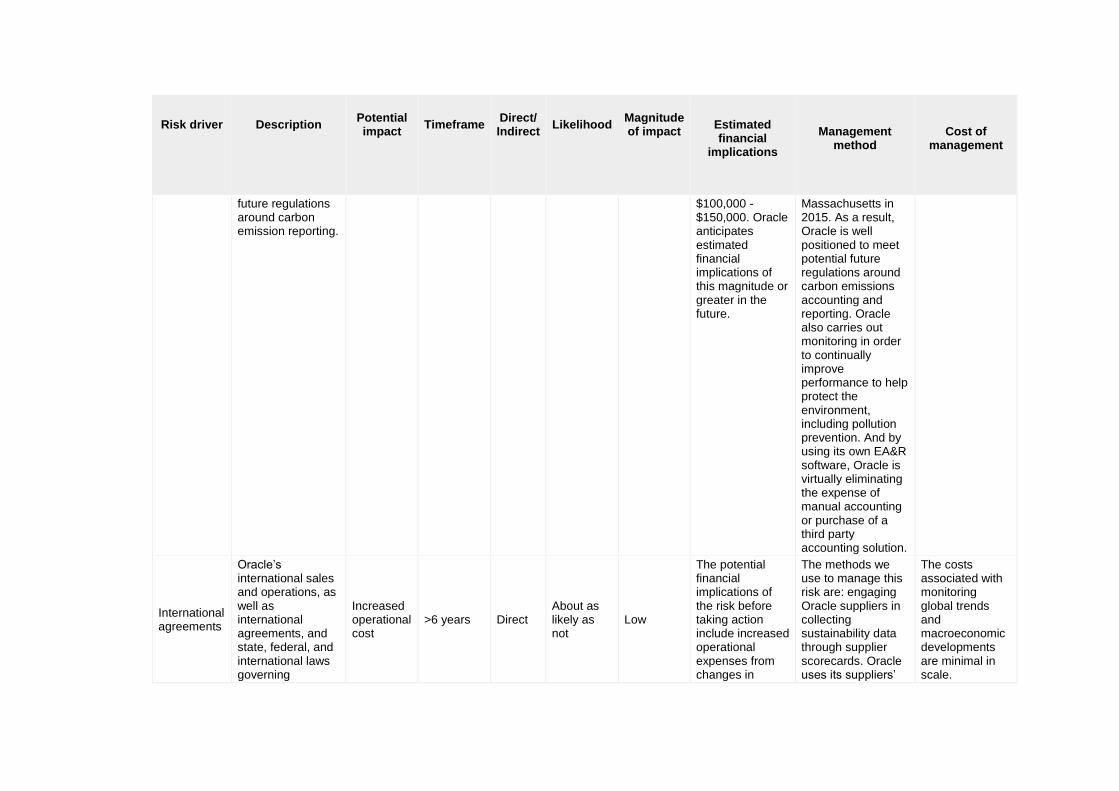
Emission reporting obligations
Future government regulations on emissions accounting and reporting could result in increased operational costs. Oracle expanded use of its own Environmental Accounting & Reporting (EA&R) software product in 2015. By conducting annual carbon accounting of company-wide operations and discussing the best path toward carbon reduction targets, Oracle is well positioned to meet potential
Increased operational cost
>6 years Direct Likely Low
The potential financial implications of the risk before taking action include future government regulations on emissions accounting and reporting, which could result in increased operational costs, and the expense of manual accounting of emissions or purchase of a third party accounting solution, estimated at
The methods we use to manage this risk are: conducting annual carbon accounting of company-wide operations (using Oracle's EA&R software), evaluating the best path toward carbon reduction targets, and travelling that path. Additionally, we implemented several emissions reduction initiatives at our facilities worldwide; for example, the installation of a new solar photovoltaic system at an Oracle facility in Burlington,
Costs of conducting annual carbon accounting and monitoring are minimal.
Risk driver
Description
Potential impact
Timeframe
Direct/ Indirect
Likelihood
Magnitude of impact
Estimated financial
implications
Management
method
Cost of
management
future regulations around carbon emission reporting.
$100,000 - $150,000. Oracle anticipates estimated financial implications of this magnitude or greater in the future.
Massachusetts in 2015. As a result, Oracle is well positioned to meet potential future regulations around carbon emissions accounting and reporting. Oracle also carries out monitoring in order to continually improve performance to help protect the environment, including pollution prevention. And by using its own EA&R software, Oracle is virtually eliminating the expense of manual accounting or purchase of a third party accounting solution.
International agreements
Oracle’s international sales and operations, as well as international agreements, and state, federal, and international laws governing
Increased operational cost
>6 years Direct About as likely as not
Low
The potential financial implications of the risk before taking action include increased operational expenses from changes in
The methods we use to manage this risk are: engaging Oracle suppliers in collecting sustainability data through supplier scorecards. Oracle uses its suppliers’
The costs associated with monitoring global trends and macroeconomic developments are minimal in scale.

Risk driver
Description
Potential impact
Timeframe
Direct/ Indirect
Likelihood
Magnitude of impact
Estimated financial
implications
Management
method
Cost of
management
protection of the environment, proper handling and disposal of materials used to manufacture our products, human health and safety, and regulating the use of certain chemical substances subject us to regulatory risks that may affect our operating results. These regulatory risks can apply as we have significant operations, and derive a substantial portion of our revenues from outside of the United States. Our international operations include software and hardware systems development, manufacturing, assembly, sales, customer support, consulting, managed cloud services and
international agreements in countries where Oracle does business, as Oracle derives a substantial portion of revenues (> 50%) from outside the United States.
data to evaluate the impact of changing regulations on our supply chain. In addition, we continually monitor international agreements and laws governing protection of the environment, as well as global trends and macroeconomic developments.
Risk driver
Description
Potential impact
Timeframe
Direct/ Indirect
Likelihood
Magnitude of impact
Estimated financial
implications
Management
method
Cost of
management
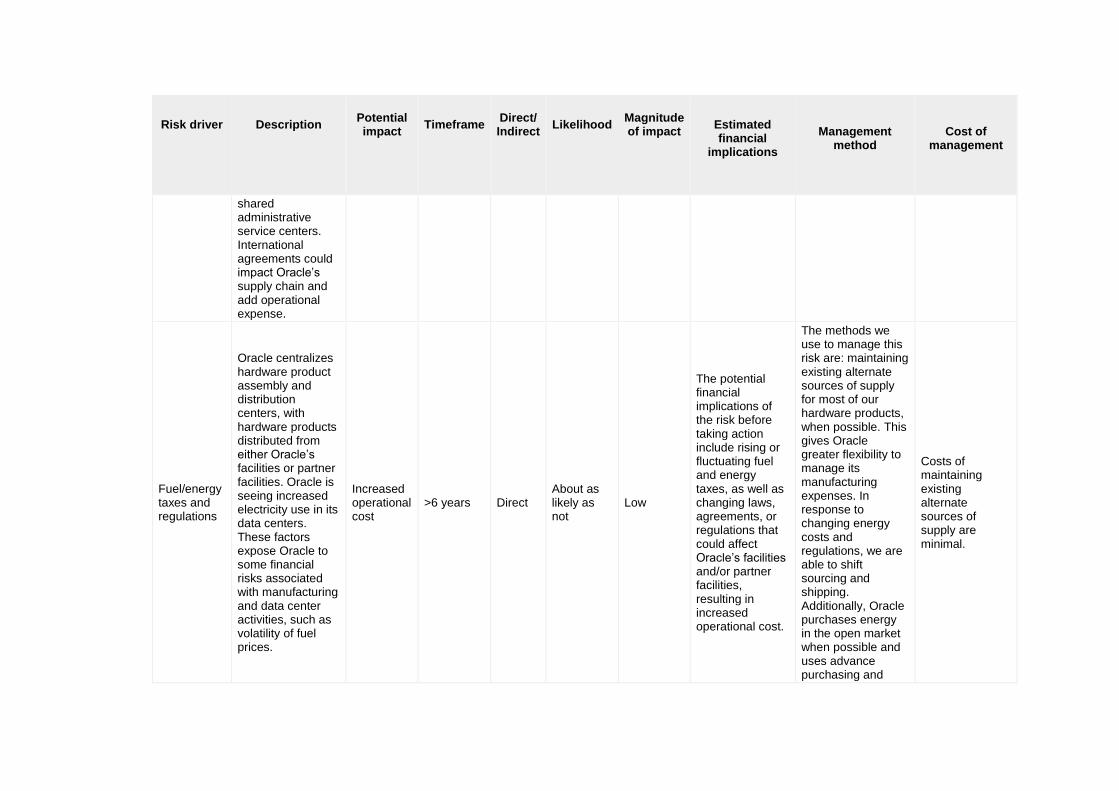
shared administrative service centers. International agreements could impact Oracle’s supply chain and add operational expense.
Fuel/energy taxes and regulations
Oracle centralizes hardware product assembly and distribution centers, with hardware products distributed from either Oracle’s facilities or partner facilities. Oracle is seeing increased electricity use in its data centers. These factors expose Oracle to some financial risks associated with manufacturing and data center activities, such as volatility of fuel prices.
Increased operational cost
>6 years Direct About as likely as not
Low
The potential financial implications of the risk before taking action include rising or fluctuating fuel and energy taxes, as well as changing laws, agreements, or regulations that could affect Oracle’s facilities and/or partner facilities, resulting in increased operational cost.
The methods we use to manage this risk are: maintaining existing alternate sources of supply for most of our hardware products, when possible. This gives Oracle greater flexibility to manage its manufacturing expenses. In response to changing energy costs and regulations, we are able to shift sourcing and shipping. Additionally, Oracle purchases energy in the open market when possible and uses advance purchasing and
Costs of maintaining existing alternate sources of supply are minimal.

Risk driver
Description
Potential impact
Timeframe
Direct/ Indirect
Likelihood
Magnitude of impact
Estimated financial
implications
Management
method
Cost of
management
hedging to further minimize risk. We strive to maximize energy efficiency in data centers and elsewhere to reduce exposure to energy price fluctuations. Oracle continually evaluates the source of our energy, and in April 2015, we installed a new solar photovoltaic system at an Oracle facility in Burlington, Massachusetts. The system is fully operational, generating clean, zero-emission electricity for the new, adjacent 125,000 square foot building. It produced 653,254 kWh of energy from the sun in 2015.
Other regulatory drivers
Compliance with international and U.S. laws and regulations that apply to our global
Increased operational cost
1 to 3 years
Direct Likely Low
The potential financial implications of the risk before taking action
The methods we use to manage this risk are: meeting and exceeding standards for
Costs of exceeding standards and certifying facilities are
Risk driver
Description
Potential impact
Timeframe
Direct/ Indirect
Likelihood
Magnitude of impact
Estimated financial
implications
Management
method
Cost of
management
operations increases our cost of doing business in foreign jurisdictions. For example, new regulations around energy efficiency, emissions trading requirements, and air pollution limits in China, and in the other countries where our component suppliers are based, may influence manufacturing operations and operational costs. We endeavor to comply with these environmental laws, yet compliance with such laws could increase our operating costs. For these reasons, other regulatory drivers are a source of risk. Violations of these laws and regulations could
include compliance with international and U.S. laws and regulations that apply to our global operations. We endeavor to comply with these laws, but compliance can increase our cost of doing business in foreign jurisdictions. Violations of these laws and regulations could result in fines, criminal sanctions against us, our officers or our employees, or even our suppliers and prohibitions on the conduct of our business or our supplier’s ability to do business.
environmental and corporate social responsibility, monitoring and working to comply with changing regulatory landscapes, and consistently striving to be a model corporate citizen. As such, Oracle was named an Overall Leader in the 2015 PR News CSR Awards for Corporation with more than 25,000 employees. Additionally, Oracle’s hardware manufacturing facilities are IS0 14001 certified, and Oracle seeks to incorporate environmental considerations into procurement processes. In FY15, Oracle’s Take Back and Recycling Program collected 3,884,754 lbs of product, an increase of 15%
minimal.

Risk driver
Description
Potential impact
Timeframe
Direct/ Indirect
Likelihood
Magnitude of impact
Estimated financial
implications
Management
method
Cost of
management
result in fines, criminal sanctions against us, our officers or our employees, and prohibitions on the conduct of our business. Any such violations could result in prohibitions on our ability to offer our products and services in one or more countries. Other regulatory drivers also include regulations around product take back (the ‘reverse supply chain’). In some cases this represents additional responsibility for Oracle to properly collect and dispose of old equipment. It also presents an opportunity to minimize e-waste by harvesting parts and realize value from recycled materials working
over the prior year. Of the total material collected, 94.5% was recycled, 5% reused, and 0.5% sent to landfill. Oracle conducts audits to help ensure that our recyclers and their downstream processors have proper Health & Safety controls in place and are compliant with local law. By expanding the number of sites in our recycling network and increasing the percentage of material reused vs. recycled, we reduce shipping miles and conserve raw materials, both of which have an environmental benefit. For these reasons, we believe Oracle is well positioned to meet potential future environmental regulations.

Risk driver
Description
Potential impact
Timeframe
Direct/ Indirect
Likelihood
Magnitude of impact
Estimated financial
implications
Management
method
Cost of
management
with third party recyclers.
CC5.1b
Please describe your inherent risks that are driven by changes in physical climate parameters
Risk driver
Description
Potential impact
Timeframe
Direct/ Indirect
Likelihood
Magnitude of impact
Estimated financial
implications
Management
method
Cost of
management
Induced changes in natural resources
Our international supply chain can be affected by induced changes in and shortages of natural resources, which can result in increased operational costs. For most of Oracle's hardware products, we have existing alternate sources of supply; however, these alternate sources
Increased operational cost
>6 years Indirect (Supply chain)
About as likely as not
Medium
The potential financial implications of the risk before taking action include supply chain impacts. In FY15, the hardware systems business accounted for 14% of Oracle's revenue, and our international hardware supply chain can be affected by changes in resource
The methods we use to manage this risk are: 1) engaging with our hardware suppliers to help reduce their susceptibility to changes in and shortages of natural resources. For example, Oracle periodically hosts webinars on sustainable management for our suppliers and industry colleagues. 2) For most of our hardware products,
Costs of monitoring potential risks to our supply chain and maintaining alternate sources of supply are minimal.

Risk driver
Description
Potential impact
Timeframe
Direct/ Indirect
Likelihood
Magnitude of impact
Estimated financial
implications
Management
method
Cost of
management
may be subject to the same changes and shortages. In addition, we do rely on sole sources for certain hardware components. As a result, we continually monitor potential risks of disruption to our supply chain operations and establish contingency plans as needed.
availability and the associated changes in pricing, which could have financial implications. Therefore, the potential financial implications of the risk before taking action are estimated to be minimal, and much less than 14% of our revenue.
we have existing alternate sources of supply; however, these alternate sources may be subject to the same shortages. In addition, for a few components we rely on a sole source supplier. As a result, we continually monitor potential risks of disruption to our supply chain operations and establish contingency plans as needed.
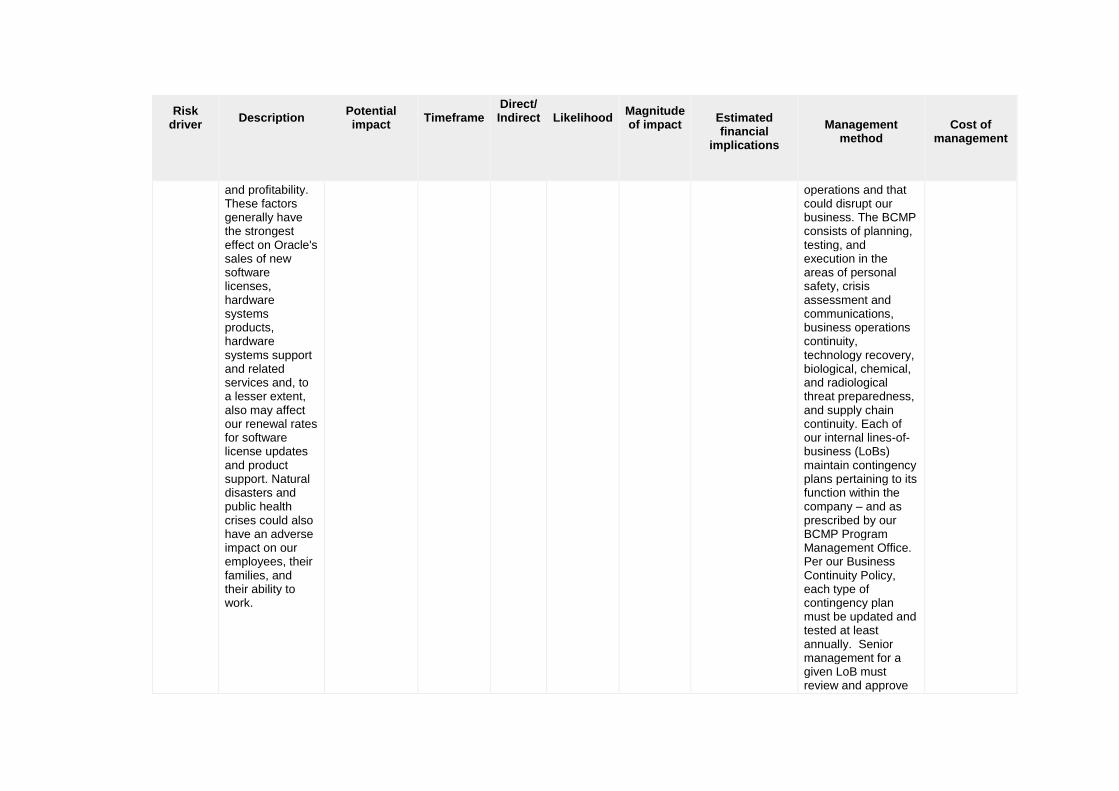
Other physical climate drivers
Other physical climate drivers such as potential natural disasters or public health crises could contribute to a climate of economic and political uncertainty that could adversely affect our results of operations and financial condition, including our revenue growth
Reduced demand for goods/services
>6 years Indirect (Supply chain)
About as likely as not
Medium
The potential financial implications of the risk before taking action include increased operational costs, and decreased revenue growth and profitability.
The methods we use to manage this risk are: implementing and maintaining a Business Continuity Management Plan (BCMP) and a Business Process Contingency Plan (BCP), both part of a global formal emergency response process related to potential extreme events that could impact our employees, data centers or other
Costs of developing and implementing our formal business continuity system and HR protocols are minimal.
Risk driver
Description
Potential impact
Timeframe
Direct/ Indirect
Likelihood
Magnitude of impact
Estimated financial
implications
Management
method
Cost of
management
and profitability. These factors generally have the strongest effect on Oracle's sales of new software licenses, hardware systems products, hardware systems support and related services and, to a lesser extent, also may affect our renewal rates for software license updates and product support. Natural disasters and public health crises could also have an adverse impact on our employees, their families, and their ability to work.
operations and that could disrupt our business. The BCMP consists of planning, testing, and execution in the areas of personal safety, crisis assessment and communications, business operations continuity, technology recovery, biological, chemical, and radiological threat preparedness, and supply chain continuity. Each of our internal lines-of-business (LoBs) maintain contingency plans pertaining to its function within the company – and as prescribed by our BCMP Program Management Office. Per our Business Continuity Policy, each type of contingency plan must be updated and tested at least annually. Senior management for a given LoB must review and approve

Risk driver
Description
Potential impact
Timeframe
Direct/ Indirect
Likelihood
Magnitude of impact
Estimated financial
implications
Management
method
Cost of
management
planning and testing as performed. Our Security Oversight Committee and Audit Committee also review the effectiveness of our BCMP on a recurring basis.
CC5.1c
Please describe your inherent risks that are driven by changes in other climate-related developments
Risk driver
Description
Potential impact
Timeframe
Direct/ Indirect
Likelihood
Magnitude of impact
Estimated financial
implications
Management
method
Cost of
management
Fluctuating socio-economic conditions
According to the National Bureau of Economic Research, higher temperatures resulting from climate change may substantially reduce industrial output, investment, innovation, and political stability. This trend may
Reduced demand for goods/services
>6 years Direct About as likely as not
Low
The potential financial implications of the risk before taking action include slowdowns in IT spending and fluctuating currencies. An example specific to currency fluctuations: movements in international
One method we use to manage these risks is close monitoring of sales trends, our sales pipeline, and movements in international currencies relative to the United States dollar. A second management method is our
Costs of managing this risk are minimal in scale.

Risk driver
Description
Potential impact
Timeframe
Direct/ Indirect
Likelihood
Magnitude of impact
Estimated financial
implications
Management
method
Cost of
management
have several economic implications, including slowdowns in IT spending and currency fluctuations, both of which could affect Oracle's revenue, as well as that of other companies.
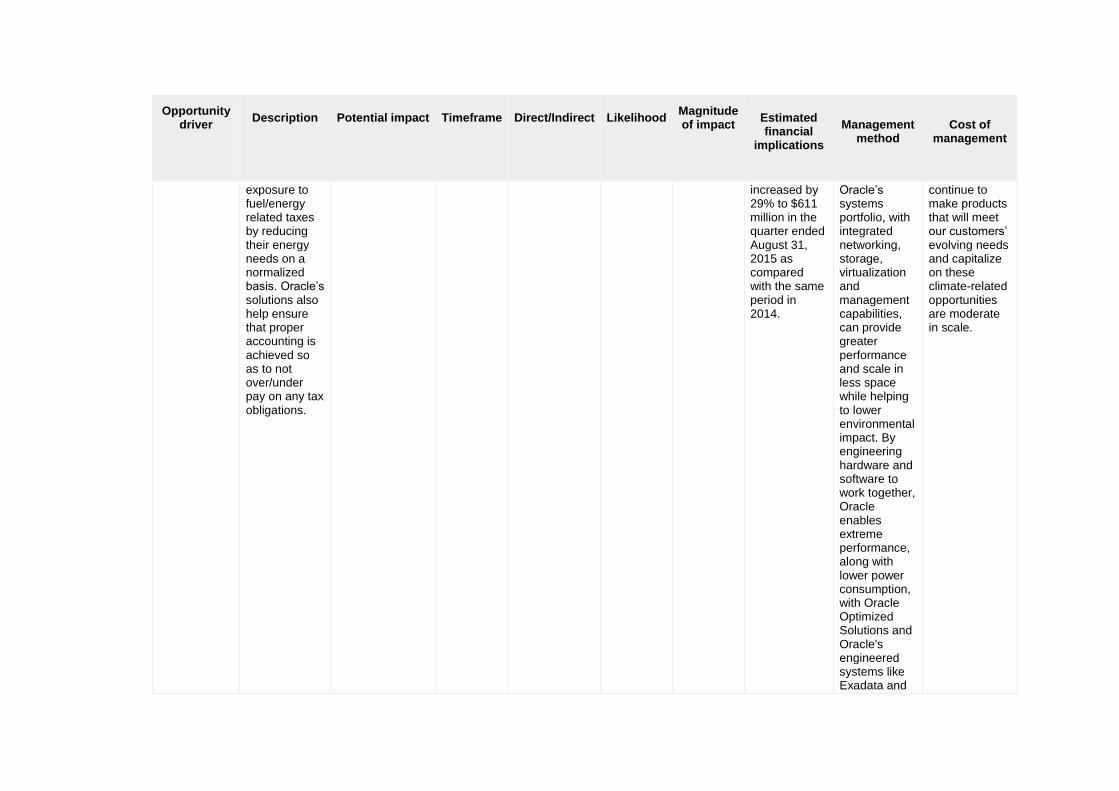
currencies relative to the United States dollar during the three months ended November 30, 2015, compared with the corresponding prior year period, decreased our revenues by 6%, operating expenses by 5% and operating income by 9%. Oracle anticipates similar estimated financial implications of this magnitude in the future.
design of ever more energy-efficient products and services that help both Oracle and its customers reduce their energy costs and thereby better weather fluctuating socio-economic conditions. The attractiveness of these products and services helps drive sales. For example, Oracle’s Enterprise Manager allows monitoring and management of individual servers and storage systems and also entire application environments to help ensure maximum utilization of IT assets – driving lower energy and cooling costs. Similarly, Oracle Cloud Computing provides on-demand access to a shared and
Risk driver
Description
Potential impact
Timeframe
Direct/ Indirect
Likelihood
Magnitude of impact
Estimated financial
implications
Management
method
Cost of
management
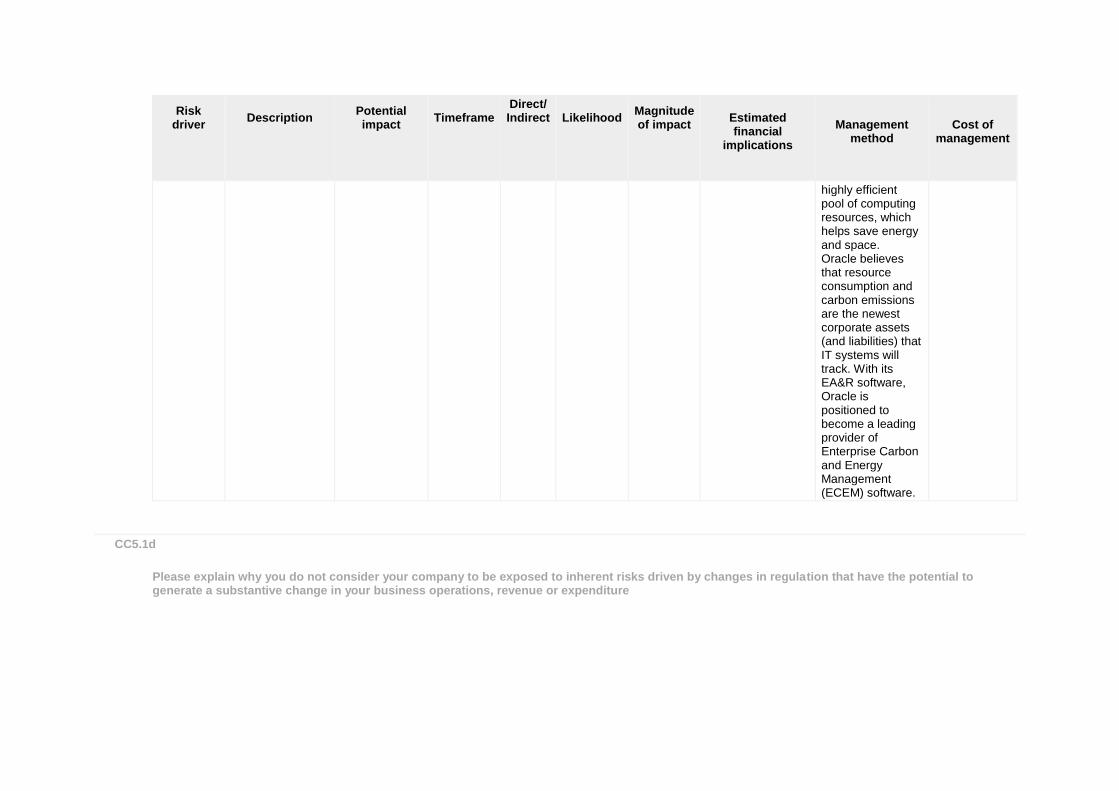
highly efficient pool of computing resources, which helps save energy and space. Oracle believes that resource consumption and carbon emissions are the newest corporate assets (and liabilities) that IT systems will track. With its EA&R software, Oracle is positioned to become a leading provider of Enterprise Carbon and Energy Management (ECEM) software.
CC5.1d
Please explain why you do not consider your company to be exposed to inherent risks driven by changes in regulation that have the potential to generate a substantive change in your business operations, revenue or expenditure

CC5.1e
Please explain why you do not consider your company to be exposed to inherent risks driven by physical climate parameters that have the potential to generate a substantive change in your business operations, revenue or expenditure
CC5.1f
Please explain why you do not consider your company to be exposed to inherent risks driven by changes in other climate-related developments that have the potential to generate a substantive change in your business operations, revenue or expenditure
Further Information
Page: CC6. Climate Change Opportunities
CC6.1
Have you identified any inherent climate change opportunities that have the potential to generate a substantive change in your business operations, revenue or expenditure? Tick all that apply
Opportunities driven by changes in regulation Opportunities driven by changes in physical climate parameters Opportunities driven by changes in other climate-related developments
CC6.1a

Please describe your inherent opportunities that are driven by changes in regulation
Opportunity driver
Description
Potential impact
Timeframe
Direct/Indirect
Likelihood
Magnitude of impact
Estimated financial
implications
Management
method
Cost of
management
Emission reporting obligations
Oracle delivers several software solutions, such as the Environmental Accounting and Reporting (EA&R) tool, which help customers reduce their environmental impact and meet their emission reporting obligations. EA&R, which is an add-on module to Oracle’s Enterprise Resource Planning (ERP) system, enables end-users to easily track their greenhouse gas emissions and other environmental data –
Increased demand for existing products/services
1 to 3 years
Indirect (Client)
Very likely Medium
Potential financial implications of these opportunities are: increased sales from greater demand for existing products and services. As a result of this opportunity, Oracle’s total Cloud revenues increased by 29% to $611 million in the quarter ended August 31, 2015 as compared with the same period in 2014. Oracle anticipates estimated financial implications of this magnitude or greater in the future.
One method Oracle is using to manage this opportunity is continually developing energy-efficient products that enable Oracle and its customers to manage their emissions reporting obligations and meet their carbon reduction goals. Oracle is rigorously focused on working with its customers to meet their business needs in the ongoing development of our solutions. This includes addressing product
Costs associated with measuring and communicating the environmental benefits of Oracle’s products are included in our marketing budgets, and are minimal in scale. Costs associated with relevant R&D in order to continue to make products that will meet our customers’ evolving needs and capitalize on these climate-related opportunities are moderate in scale.

Opportunity driver
Description
Potential impact
Timeframe
Direct/Indirect
Likelihood
Magnitude of impact
Estimated financial
implications
Management
method
Cost of
management
including energy usage – for both voluntary and legislated emissions reporting schemes. The system utilizes Oracle Business Intelligence to provide immediate insight into an organization's environmental data, allowing users to identify and manage CO2 and cost reduction opportunities, hence allowing for rapid Return On Investment. Should emissions reporting obligations become mandatory or more stringent,
Additionally, there is an opportunity for increased operational efficiency resulting in cost savings for Oracle and its customers. For example, the CDP study titled “Cloud Computing – The IT Solution for the 21st Century” estimates that by 2020 (base year: 2011), large U.S. companies that use cloud computing can achieve annual energy savings of $12.3 billion, and annual carbon reductions equivalent to 200 million barrels of oil. This represents a
enhancement requests from customers related to meeting their sustainability objectives. Oracle’s product strategy is to embed sustainability related features in products so customers can leverage their existing IT investments and business processes wherever possible. In many cases customers are also able to configure Oracle’s solutions to address their sustainability needs in conjunction with other business objectives. In
Opportunity driver
Description
Potential impact
Timeframe
Direct/Indirect
Likelihood
Magnitude of impact
Estimated financial
implications
Management
method
Cost of
management
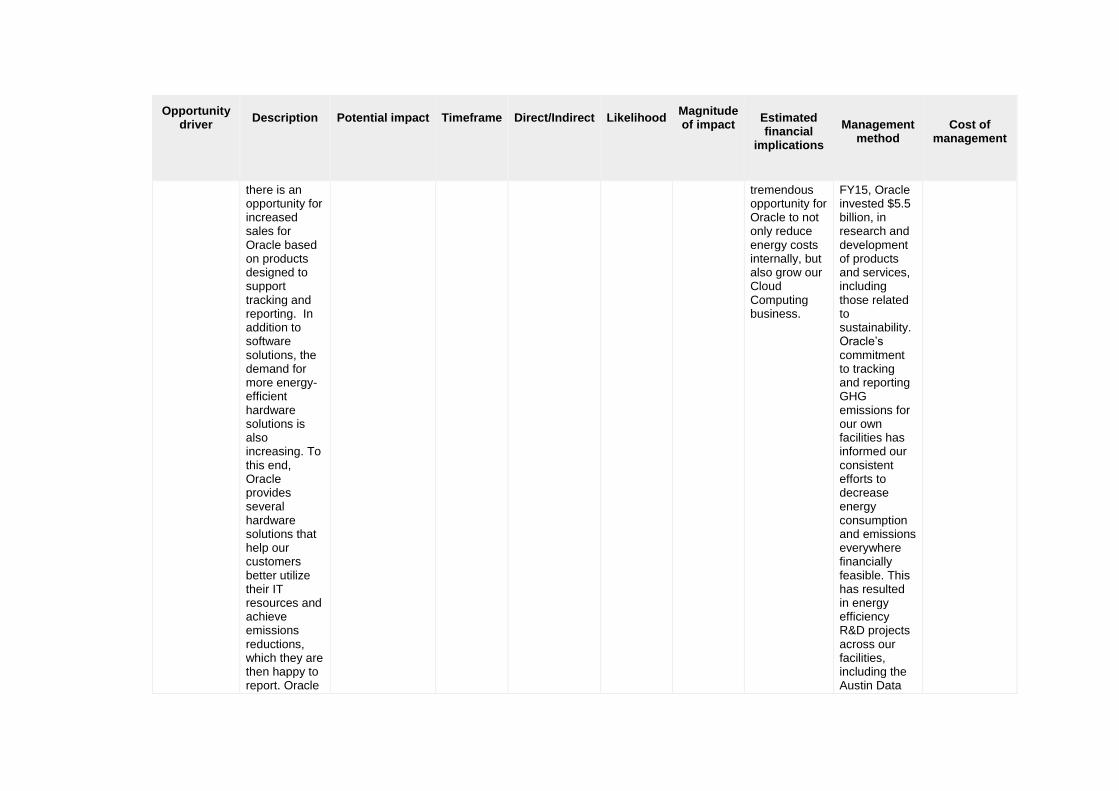
there is an opportunity for increased sales for Oracle based on products designed to support tracking and reporting. In addition to software solutions, the demand for more energy-efficient hardware solutions is also increasing. To this end, Oracle provides several hardware solutions that help our customers better utilize their IT resources and achieve emissions reductions, which they are then happy to report. Oracle
tremendous opportunity for Oracle to not only reduce energy costs internally, but also grow our Cloud Computing business.
FY15, Oracle invested $5.5 billion, in research and development of products and services, including those related to sustainability. Oracle’s commitment to tracking and reporting GHG emissions for our own facilities has informed our consistent efforts to decrease energy consumption and emissions everywhere financially feasible. This has resulted in energy efficiency R&D projects across our facilities, including the Austin Data

Opportunity driver
Description
Potential impact
Timeframe
Direct/Indirect
Likelihood
Magnitude of impact
Estimated financial
implications
Management
method
Cost of
management
Cloud Computing, for example, provides on-demand access to a shared and highly efficient pool of computing resources, which helps save energy and space. According to a study published by CDP titled, “Cloud Computing – The IT Solution for the 21st Century,” cloud computing has the potential to reduce companies’ carbon emissions. Through virtualization and running servers at higher utilization
Center. This data center utilizes innovative technologies such as hot-air containment and variable airflow cooling resulting in energy savings of 16 million kilowatt hours annually.

Opportunity driver
Description
Potential impact
Timeframe
Direct/Indirect
Likelihood
Magnitude of impact
Estimated financial
implications
Management
method
Cost of
management
rates, the total energy required to support a given service is reduced, which results in lower carbon emissions. This helps companies meet their emission reporting obligations and carbon reduction goals.
Fuel/energy taxes and regulations
Oracle’s products, such as Cloud Computing, help our customers to save fuel/energy and space. Many of the solutions referenced above directly enable Oracle’s customers to reduce their
Increased demand for existing products/services
1 to 3 years
Indirect (Client)
Very likely Medium
Potential financial implications of these opportunities are increased sales from increased demand for existing products and services. As a result of this opportunity, Oracle’s total Cloud revenues
One method Oracle is using to manage this opportunity is continually developing products and services that help Oracle and its customers better manage exposure to fuel/energy taxes and regulations.
Costs associated with measuring and communicating the environmental benefits of Oracle’s products are included in our marketing budgets, and are minimal in scale. Costs associated with relevant R&D in order to
Opportunity driver
Description
Potential impact
Timeframe
Direct/Indirect
Likelihood
Magnitude of impact
Estimated financial
implications
Management
method
Cost of
management
exposure to fuel/energy related taxes by reducing their energy needs on a normalized basis. Oracle’s solutions also help ensure that proper accounting is achieved so as to not over/under pay on any tax obligations.
increased by 29% to $611 million in the quarter ended August 31, 2015 as compared with the same period in 2014.
Oracle’s systems portfolio, with integrated networking, storage, virtualization and management capabilities, can provide greater performance and scale in less space while helping to lower environmental impact. By engineering hardware and software to work together, Oracle enables extreme performance, along with lower power consumption, with Oracle Optimized Solutions and Oracle's engineered systems like Exadata and
continue to make products that will meet our customers’ evolving needs and capitalize on these climate-related opportunities are moderate in scale.

Opportunity driver
Description
Potential impact
Timeframe
Direct/Indirect
Likelihood
Magnitude of impact
Estimated financial
implications
Management
method
Cost of
management
SPARC SuperCluster. Oracle works with its customers to develop software and hardware solutions that help our customers better manage their own environmental challenges.
General environmental regulations, including planning
Oracle’s solutions help enable its customers to manage their compliance with applicable regulations, including planning. For example, Enterprise Asset Manager helps customers confirm that machines are operating in accordance with regulatory
Increased demand for existing products/services
1 to 3 years
Indirect (Client)
Very likely Medium
Potential financial implications of these opportunities are increased sales from increased demand for existing products and services. Oracle’s Sustainability Solutions enable our customers to measure, manage, and report on environmental
One method Oracle is using to manage this opportunity is continually developing products that enable Oracle and its customers to manage their compliance with environmental regulations, including planning. Oracle’s systems portfolio, with
Costs associated with measuring and communicating the environmental benefits of Oracle’s products are included in our marketing budgets, and are minimal in scale. Costs associated with relevant R&D in order to continue to make products that will meet our customers’

Opportunity driver
Description
Potential impact
Timeframe
Direct/Indirect
Likelihood
Magnitude of impact
Estimated financial
implications
Management
method
Cost of
management
requirements to enable safe operating conditions. Oracle’s products also directly support consumer interest in energy efficiency, helping Oracle to support customers in achieving their sustainability goals and meeting environmental regulations. Oracle’s planning tools, such as Hyperion Planning and Crystal Ball, can be used to assess the impact of potential future legislation through scenario planning and what-if
performance while also driving financial performance improvement. For example, by using Oracle Exadata Database Machine, our customer SThree cut down its rack space by 99 units, which significantly reduced its database server power consumption and lowered its annual carbon footprint.
integrated networking, storage, virtualization and management capabilities, can provide greater performance and scale in less space while helping to lower environmental impact. For example, Oracle’s planning tools, such as Hyperion Planning and Crystal Ball, can be used to assess the impact of potential future legislation through scenario planning and what-if analyses.
evolving needs and capitalize on these climate-related opportunities are moderate in scale.
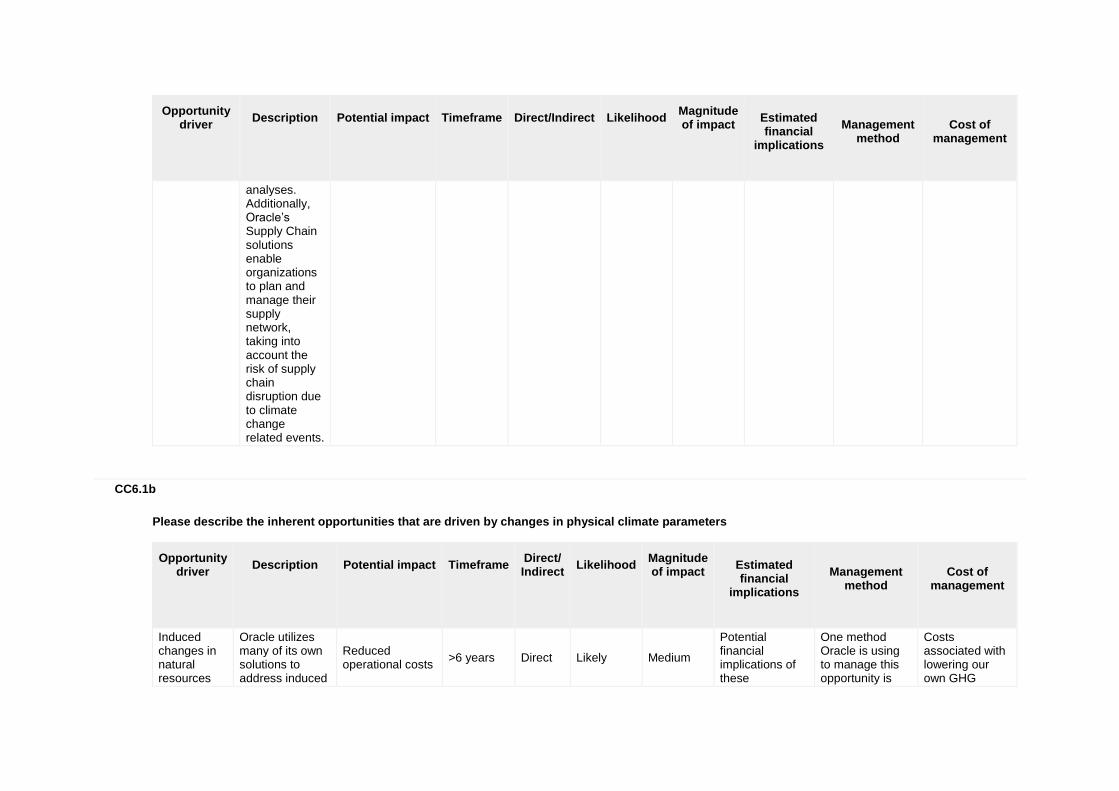
Opportunity driver
Description
Potential impact
Timeframe
Direct/Indirect
Likelihood
Magnitude of impact
Estimated financial
implications
Management
method
Cost of
management
analyses. Additionally, Oracle’s Supply Chain solutions enable organizations to plan and manage their supply network, taking into account the risk of supply chain disruption due to climate change related events.
CC6.1b
Please describe the inherent opportunities that are driven by changes in physical climate parameters
Opportunity driver
Description
Potential impact
Timeframe
Direct/ Indirect
Likelihood
Magnitude of impact
Estimated financial
implications
Management
method
Cost of
management
Induced changes in natural resources
Oracle utilizes many of its own solutions to address induced
Reduced operational costs
>6 years Direct Likely Medium
Potential financial implications of these
One method Oracle is using to manage this opportunity is
Costs associated with lowering our own GHG

Opportunity driver
Description
Potential impact
Timeframe
Direct/ Indirect
Likelihood
Magnitude of impact
Estimated financial
implications
Management
method
Cost of
management
changes in and shortages of natural resources. These solutions are categorized under Risk and Performance Management (including the module Oracle Environmental Accounting & Reporting); Operations (including transportation management and smart grid technologies); and IT Infrastructure (including energy efficient hardware such as Oracle Exadata engineering systems). Inherently, the benefits of many of these solutions are not just limited to environmental performance improvements,
opportunities are related to reduced operational costs. For example, the business benefits from Oracle Environmental Accounting & Reporting annually include a projected $1.2M savings in utility spend; 95% reduction in staffing needs for data collection; and 50% reduction in reporting cycle time. Similarly, we achieved significant benefits from the internal implementation of Oracle Depot Repair, a tool that enables us to automate and manage our returns and take-back programs
continually developing products and programs that help Oracle and its customers to address induced changes in natural resources, and subsequently, reduce operational costs. Another management method is to maximize the volume of electronic equipment collected and managed in an environmentally sound manner through our electronic product recyclers. For example, in FY15 we took back a total of 3,884,754 lbs of electronic waste through Oracle’s Product Take Back and Recycling
emissions and improving our environmental footprint are included in our operational budgets, and are moderate in scale. Costs associated with relevant R&D in order to continue to make products that will meet our customers’ evolving needs and capitalize on these climate-related opportunities are moderate in scale.

Opportunity driver
Description
Potential impact
Timeframe
Direct/ Indirect
Likelihood
Magnitude of impact
Estimated financial
implications
Management
method
Cost of
management
but also include cost reduction and continuous improvement potential.
through the Oracle Returns Management System (ORMS). These benefits include: • A 61% increase in the volume of systems returned compared to the previous year, with 12,045 total units across all programs (9.5% from internal returns). • Savings of $8.2 million in reduced spares from Last Time Buy (LTB). Oracle anticipates estimated financial implications of this magnitude or greater in the future.
Program. More than 99.5% of the material was either recycled or reused. This enables us to not only conserve natural resources by minimizing electronic waste, but also to reduce our operational costs.
Other physical climate opportunities
Oracle products support flexibility in information sharing and access, which
Increased demand for existing products/services
1 to 3 years
Indirect (Client)
Likely Medium
Potential financial implications of these opportunities
One method Oracle is using to manage this opportunity is embracing R&D
Costs associated with measuring and communicating the
Opportunity driver
Description
Potential impact
Timeframe
Direct/ Indirect
Likelihood
Magnitude of impact
Estimated financial
implications
Management
method
Cost of
management
may be in higher demand if physical climate parameters change. This opportunity has the potential to increase Oracle’s sales. Oracle provides a number of solutions to address sustainability-related customer needs, categorized under Risk and Performance Management (including the module Oracle Environmental Accounting & Reporting); Operations (including transportation management and smart grid technologies); and IT Infrastructure (including energy efficient hardware such as Oracle
are increased sales from increased demand for existing products and services. Oracle’s Sustainability Solutions enable our customers to measure, manage, and report on environmental performance while also driving financial performance improvement. For example, by using Oracle Exadata Database Machine, our customer SThree cut down its rack space by 99 units, which significantly reduced its database server power consumption and lowered its annual carbon
in the realm of energy-efficient products. Oracle’s systems portfolio, with integrated networking, storage, virtualization and management capabilities, can provide greater performance and scale in less space while helping to lower environmental impact. By engineering hardware and software to work together, Oracle enables extreme performance, along with lower power consumption, with Oracle Optimized Solutions and Oracle's engineered systems like Exadata and SPARC SuperCluster. Oracle works
environmental benefits of Oracle’s products are included in our marketing budgets, and are minimal in scale. Costs associated with relevant R&D in order to continue to make products that will meet our customers’ evolving needs and capitalize on these climate-related opportunities are moderate in scale.
Opportunity driver
Description
Potential impact
Timeframe
Direct/ Indirect
Likelihood
Magnitude of impact
Estimated financial
implications
Management
method
Cost of
management
Exadata engineering systems). Inherently the benefits of many of these solutions are not just limited to environmental performance improvements, but also include cost reduction and continuous improvement potential. Through the Sustainability Innovation Awards, Oracle annually recognizes customers who are using Oracle solutions to make their organizations more environmentally sustainable. The current economic climate is driving demand for more energy-conserving product
footprint. with its customers to develop software and hardware solutions that help our customers better manage their own environmental challenges.

Opportunity driver
Description
Potential impact
Timeframe
Direct/ Indirect
Likelihood
Magnitude of impact
Estimated financial
implications
Management
method
Cost of
management
alternatives in the marketplace. Oracle’s products directly support consumer interest in energy efficiency. Oracle Cloud Computing provides on-demand access to a shared and highly efficient pool of computing resources, which helps save energy and space. Oracle’s Enterprise Manager allows monitoring and management of individual servers and storage systems and also entire application environments to help achieve maximum utilization of IT assets – driving lower energy and cooling

Opportunity driver
Description
Potential impact
Timeframe
Direct/ Indirect
Likelihood
Magnitude of impact
Estimated financial
implications
Management
method
Cost of
management
costs. Oracle believes that resource consumption and carbon emissions are the newest corporate assets (and liabilities) that IT systems will track. With its EA&R software, Oracle is positioned to become a leading provider of Enterprise Carbon and Energy Management (ECEM) software.
CC6.1c
Please describe the inherent opportunities that are driven by changes in other climate-related developments
Opportunity driver
Description
Potential impact
Timeframe
Direct/ Indirec
t
Likelihood
Magnitude of
impact
Estimated financial
implications
Management
method
Cost of
management
Changing Growing Increased 1 to 3 Indirect Likely Medium Potential financial One method Costs
Opportunity driver
Description
Potential impact
Timeframe
Direct/ Indirec
t
Likelihood
Magnitude of
impact
Estimated financial
implications
Management
method
Cost of
management
consumer behaviour
awareness around the negative impacts of climate change is likely to drive a shift in consumer behavior, with an increased emphasis on sustainable business practices. This trend has the potential to boost the market for green products and services that enable consumers to minimize their own environmental footprint. As the market for sustainability products and services expands, so does Oracle’s opportunity to increase sales and revenue from growing demand for our existing products/services. Oracle’s products, such as Cloud Computing, provide our
demand for existing products/services
years (Client) implications of these opportunities are increased sales from increased demand for existing products/services. For example, Oracle’s total Cloud revenues increased by 29% to $611 million in the quarter ended August 31, 2015 as compared with the same period in 2014. Oracle anticipates estimated financial implications of this magnitude or greater in the future.
Oracle is using to manage this opportunity is communicating the benefits of Oracle’s Sustainability Solutions, both internally and externally, as well as recognizing customers who use Oracle technology to address global sustainability business challenges. For example, Oracle presented Sustainability Innovation Awards to ten customers, including Cisco and Bank Asya, at the Oracle OpenWorld Conference in 2015. Another management method is continually developing products and services that help our customers
associated with measuring and communicating the environmental benefits of Oracle’s products are included in our marketing budgets, and are minimal in scale. Costs associated with relevant R&D in order to continue to make products that will meet our customers’ evolving needs and capitalize on these climate-related opportunities are moderate in scale.
Opportunity driver
Description
Potential impact
Timeframe
Direct/ Indirec
t
Likelihood
Magnitude of
impact
Estimated financial
implications
Management
method
Cost of
management
customers on-demand access to a shared and highly efficient pool of computing resources, which helps save energy and space. This opportunity has the potential to increase Oracle’s sales.
reduce their environmental footprint and strengthen their sustainability efforts. Oracle’s systems portfolio, with integrated networking, storage, virtualization and management capabilities, can provide greater performance and scale in less space while helping to lower environmental impact. By engineering hardware and software to work together, Oracle enables extreme performance, along with lower power consumption, with Oracle Optimized Solutions and Oracle's engineered systems like Exadata and SPARC SuperCluster.

Opportunity driver
Description
Potential impact
Timeframe
Direct/ Indirec
t
Likelihood
Magnitude of
impact
Estimated financial
implications
Management
method
Cost of
management
Reputation
Oracle’s increasing emphasis on environmental sustainability, both internally and externally, has the potential to strengthen our brand value and reputation. By implementing several of our own sustainability solutions, we are able to reduce our operational costs, while demonstrating our commitment to environmental responsibility. In recognition of our efforts, Oracle received the PR News CSR Award for Overall Leader in the Corporation with more than 25,000 employees category, as well as the BizSMART@Work Gold award for Recycling and Composting in 2015.
Reduced operational costs
1 to 3 years
Direct Likely High
Potential financial implications of these opportunities include reduced operational costs, as well as increased demand for existing products/services. For example, the business benefits from EA&R annually include a projected $1.2M savings in utility spend; 95% reduction in staffing needs for data collection; and 50% reduction in reporting cycle time.
One method Oracle is using to manage this opportunity is continually developing energy-efficient products that enable Oracle and its customers to manage their emissions reporting obligations and meet their carbon reduction goals. Oracle’s systems portfolio, with integrated networking, storage, virtualization and management capabilities, can provide greater performance and scale in less space while helping to lower environmental impact. In addition, Oracle consistently strives to meet or exceed standards for environmental and corporate
Costs associated with measuring and lowering our own GHG emissions are included in our operational budgets, and are moderate in scale. Costs associated with relevant R&D in order to continue to make products that will meet our customers’ evolving needs and capitalize on these climate-related opportunities are moderate in scale.
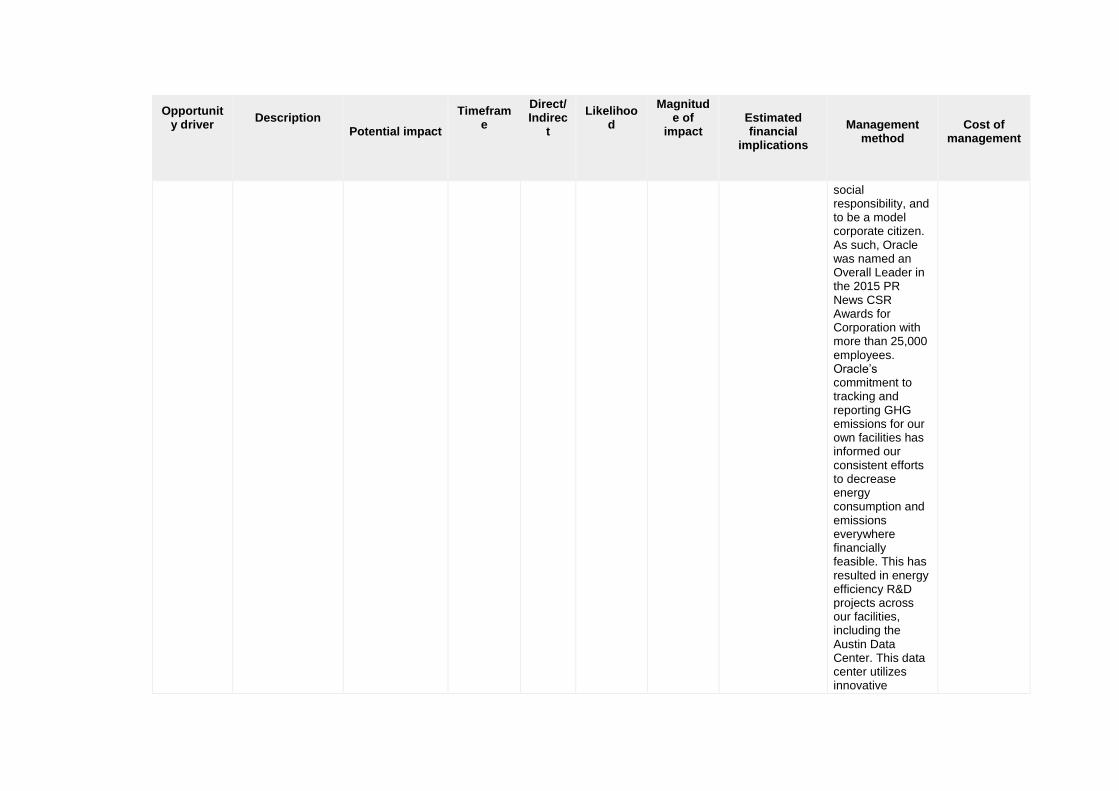
Opportunity driver
Description
Potential impact
Timeframe
Direct/ Indirec
t
Likelihood
Magnitude of
impact
Estimated financial
implications
Management
method
Cost of
management
social responsibility, and to be a model corporate citizen. As such, Oracle was named an Overall Leader in the 2015 PR News CSR Awards for Corporation with more than 25,000 employees. Oracle’s commitment to tracking and reporting GHG emissions for our own facilities has informed our consistent efforts to decrease energy consumption and emissions everywhere financially feasible. This has resulted in energy efficiency R&D projects across our facilities, including the Austin Data Center. This data center utilizes innovative

Opportunity driver
Description
Potential impact
Timeframe
Direct/ Indirec
t
Likelihood
Magnitude of
impact
Estimated financial
implications
Management
method
Cost of
management
technologies such as hot-air containment and variable airflow cooling resulting in energy savings of 16 million kilowatt hours annually
Reputation
Oracle’s increasing emphasis on environmental sustainability, both internally and externally, has the potential to strengthen our brand value and reputation. As sustainability and corporate responsibility become increasingly important to job seekers and employees, Oracle’s reputation as a leader in sustainability could help us attract and retain top talent.
Other: Ability to attract and retain top talent
1 to 3 years
Direct Very likely High
Potential financial implications of this opportunity include costs savings associated with employee retention, as well as reduced costs for recruitment and training of new hires.
One method Oracle is using to manage this opportunity is communicating our sustainability efforts and accomplishments, both internally and externally. For example, Oracle’s Corporate Citizenship Report highlights our sustainability practices and achievements. Additionally, Oracle introduced the ‘Sustainability Champions’ program in 2015, through which we recognize employees who are advancing environmental
Costs associated with communicating Oracle’s environmental efforts and achievements are included in our marketing budgets, and are minimal in scale.
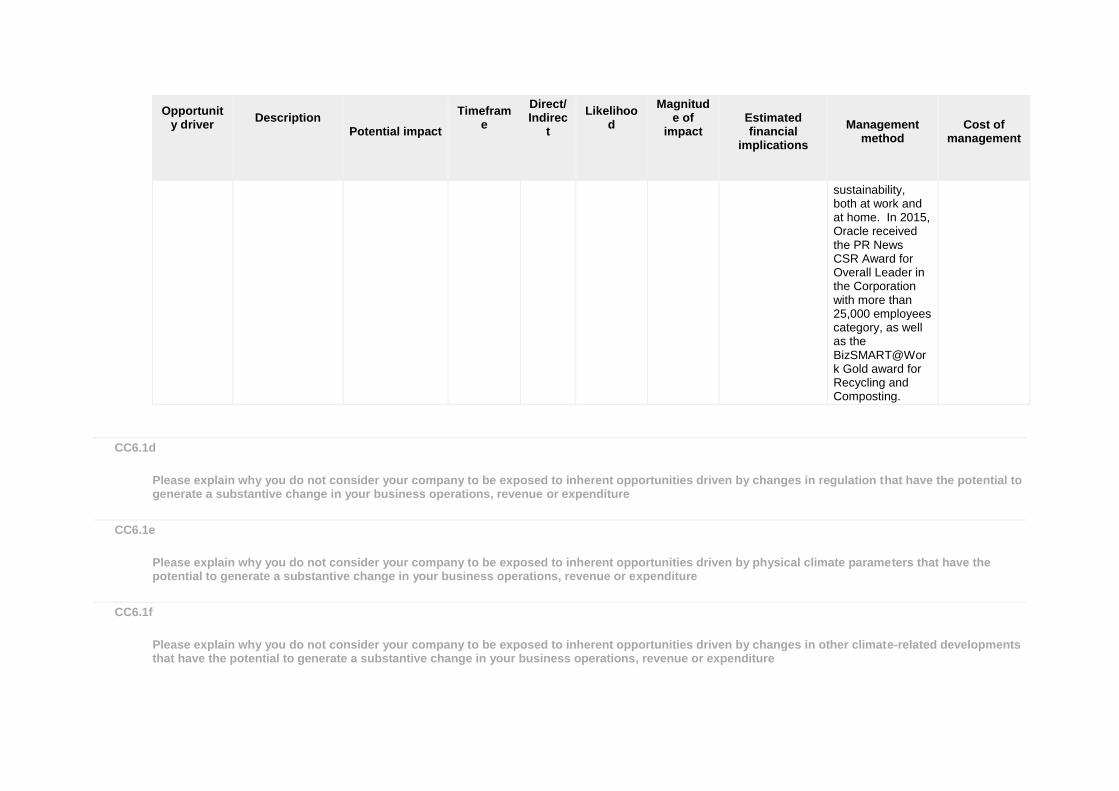
Opportunity driver
Description
Potential impact
Timeframe
Direct/ Indirec
t
Likelihood
Magnitude of
impact
Estimated financial
implications
Management
method
Cost of
management
sustainability, both at work and at home. In 2015, Oracle received the PR News CSR Award for Overall Leader in the Corporation with more than 25,000 employees category, as well as the BizSMART@Work Gold award for Recycling and Composting.
CC6.1d
Please explain why you do not consider your company to be exposed to inherent opportunities driven by changes in regulation that have the potential to generate a substantive change in your business operations, revenue or expenditure
CC6.1e
Please explain why you do not consider your company to be exposed to inherent opportunities driven by physical climate parameters that have the potential to generate a substantive change in your business operations, revenue or expenditure
CC6.1f
Please explain why you do not consider your company to be exposed to inherent opportunities driven by changes in other climate-related developments that have the potential to generate a substantive change in your business operations, revenue or expenditure

Further Information
Module: GHG Emissions Accounting, Energy and Fuel Use, and Trading
Page: CC7. Emissions Methodology
CC7.1
Please provide your base year and base year emissions (Scopes 1 and 2)
Scope
Base year
Base year emissions (metric tonnes CO2e)
Scope 1 Fri 01 Jan 2010 - Fri 31 Dec 2010
15207
Scope 2 (location-based) Fri 01 Jan 2010 - Fri 31 Dec 2010
433522
Scope 2 (market-based)
CC7.2
Please give the name of the standard, protocol or methodology you have used to collect activity data and calculate Scope 1 and Scope 2 emissions
Please select the published methodologies that you use
The Greenhouse Gas Protocol: A Corporate Accounting and Reporting Standard (Revised Edition)

CC7.2a
If you have selected "Other" in CC7.2 please provide details of the standard, protocol or methodology you have used to collect activity data and calculate Scope 1 and Scope 2 emissions
CC7.3
Please give the source for the global warming potentials you have used
Gas
Reference
CO2 IPCC Fourth Assessment Report (AR4 - 100 year)
CH4 IPCC Fourth Assessment Report (AR4 - 100 year)
N2O IPCC Fourth Assessment Report (AR4 - 100 year)
HFCs IPCC Fourth Assessment Report (AR4 - 100 year)
PFCs IPCC Fourth Assessment Report (AR4 - 100 year)
CC7.4
Please give the emissions factors you have applied and their origin; alternatively, please attach an Excel spreadsheet with this data at the bottom of this page
Fuel/Material/Energy
Emission Factor
Unit
Reference
Natural gas 0.18123 metric tonnes CO2e per MWh
United States: U.S. Environmental Protection Agency (EPA)
Natural gas 0.18551 metric tonnes CO2e per MWh
Australia: Australian Government Department of the Environment National Greenhouse Accounts Factors

Fuel/Material/Energy
Emission Factor
Unit
Reference
Natural gas 0.18445 metric tonnes CO2e per MWh
Rest of the world: Department for Environment, Food and Rural Affairs (DEFRA)
Further Information
We use regional standards including U.S Environmental Protection Agency (EPA), Department for Environment, Food and Rural Affairs (DEFRA), and Australian Government Department of the Environment National Greenhouse Accounts Factors. Purchased electricity emissions factors are specific to the geographic location of each site in which we operate (Oracle has 771 sites in 89 countries). We validate and update our emissions factors annually.
Page: CC8. Emissions Data - (1 Jan 2015 - 31 Dec 2015)
CC8.1
Please select the boundary you are using for your Scope 1 and 2 greenhouse gas inventory
Operational control
CC8.2
Please provide your gross global Scope 1 emissions figures in metric tonnes CO2e
11741
CC8.3
Does your company have any operations in markets providing product or supplier specific data in the form of contractual instruments?
Yes

CC8.3a
Please provide your gross global Scope 2 emissions figures in metric tonnes CO2e
Scope 2, location-based
Scope 2, market-based (if applicable)
Comment
412628 374979
CC8.4
Are there are any sources (e.g. facilities, specific GHGs, activities, geographies, etc.) of Scope 1 and Scope 2 emissions that are within your selected reporting boundary which are not included in your disclosure?
Yes
CC8.4a
Please provide details of the sources of Scope 1 and Scope 2 emissions that are within your selected reporting boundary which are not included in your disclosure
Source
Relevance of
Scope 1 emissions from this source
Relevance of
location-based Scope 2 emissions
from this source
Relevance of market-based
Scope 2 emissions from this source (if
applicable)
Explain why the source is excluded
Diesel and refrigerants
Emissions are not relevant
No emissions excluded
No emissions excluded
We estimate that emissions from diesel and refrigerants account for less than 1% of our total emissions inventory (diesel accounts for approximately .16% and refrigerants account for .7%). Therefore, we have determined these sources are not material, based on our threshold that defines "material" as all emission sources that account for the top 95% of our total emissions. That said, we do take these sources into consideration when implementing emissions reduction activities.

Source
Relevance of
Scope 1 emissions from this source
Relevance of
location-based Scope 2 emissions
from this source
Relevance of market-based
Scope 2 emissions from this source (if
applicable)
Explain why the source is excluded
Owned vehicles and fire suppressant equipment
Emissions are not relevant
No emissions excluded
No emissions excluded
We also take owned vehicles and fire suppressant equipment into consideration when implementing emissions reduction activities, but have determined they are not material to our total emissions inventory (owned vehicles account for approximately 0.11% and fire suppressants account for approximately 0.17%).
CC8.5
Please estimate the level of uncertainty of the total gross global Scope 1 and 2 emissions figures that you have supplied and specify the sources of uncertainty in your data gathering, handling and calculations
Scope
Uncertainty range
Main sources of
uncertainty
Please expand on the uncertainty in your data
Scope 1 Less than or equal to 2%
Data Gaps
We utilized an Oracle software product called Environmental Accounting & Reporting (EA&R), which enabled us to track energy use and calculate emissions, resulting in improved data accuracy. For select facilities where data wasn't available, we did not extrapolate for scope 1 emissions.
Scope 2 (location-based)
More than 2% but less than or equal to 5%
Data Gaps Extrapolation Metering/ Measurement Constraints
We implemented an Oracle software product called Environmental Accounting & Reporting (EA&R), which enabled us to track energy use and calculate emissions, resulting in improved data accuracy. The emissions data were derived from metered invoices provided by our energy suppliers. Most of our smaller data centers in our mixed use facilities are not separately monitored for energy use. We are in the process of implementing a plan that will allow us to monitor energy use and PUE for our data centers at these mixed use facilities.
Scope 2 (market-based)
More than 2% but less than or equal to 5%
Data Gaps Extrapolation Metering/
We implemented an Oracle software product called Environmental Accounting & Reporting (EA&R), which enabled us to track energy use and calculate emissions, resulting in improved data accuracy. The emissions data were derived from metered invoices provided by our energy suppliers. Most of our

Scope
Uncertainty range
Main sources of
uncertainty
Please expand on the uncertainty in your data
Measurement Constraints
smaller data centers in our mixed use facilities are not separately monitored for energy use. We are in the process of implementing a plan that will allow us to monitor energy use and PUE for our data centers at these mixed use facilities. For our market-based emissions calculation, we obtained supplier-specific emission factors for several facilities globally. Where supplier-specific factors were not available, we followed the Scope 2 Guidance hierarchy, and used either residual or location-based factors.
CC8.6
Please indicate the verification/assurance status that applies to your reported Scope 1 emissions
Third party verification or assurance process in place
CC8.6a
Please provide further details of the verification/assurance undertaken for your Scope 1 emissions, and attach the relevant statements
Verification
or assurance cycle in place
Status in
the current reporting
year
Type of verification
or assurance
Attach the statement
Page/section
reference
Relevant standard
Proportion of reported
Scope 1 emissions verified (%)
Annual process
Complete Limited assurance
https://www.cdp.net/sites/2016/13/14013/Climate Change 2016/Shared Documents/Attachments/CC8.6a/Oracle 2015 GHG Assurance Review Letter - FINAL.pdf
1-2 ISO14064-3
100
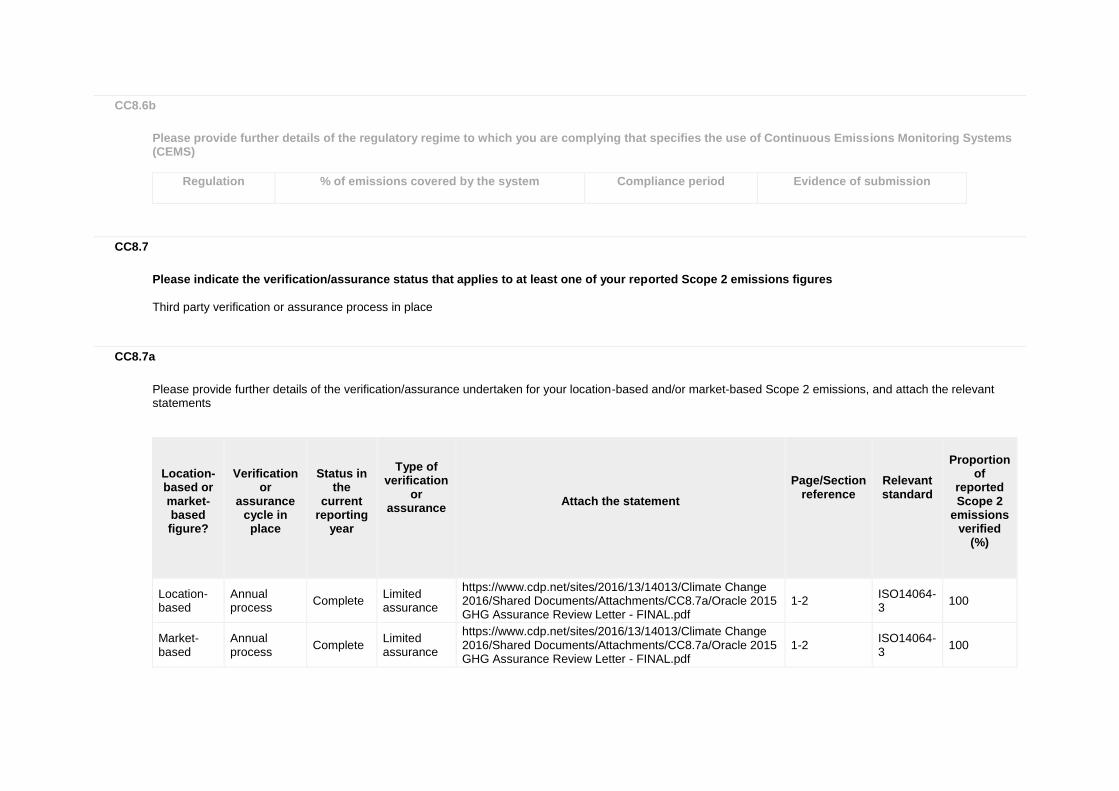
CC8.6b
Please provide further details of the regulatory regime to which you are complying that specifies the use of Continuous Emissions Monitoring Systems (CEMS)
Regulation
% of emissions covered by the system
Compliance period
Evidence of submission
CC8.7
Please indicate the verification/assurance status that applies to at least one of your reported Scope 2 emissions figures
Third party verification or assurance process in place
CC8.7a
Please provide further details of the verification/assurance undertaken for your location-based and/or market-based Scope 2 emissions, and attach the relevant statements
Location-based or market-based figure?
Verification
or assurance
cycle in place
Status in
the current
reporting year
Type of verification
or assurance
Attach the statement
Page/Section reference
Relevant standard
Proportion
of reported Scope 2
emissions verified
(%)
Location-based
Annual process
Complete Limited assurance
https://www.cdp.net/sites/2016/13/14013/Climate Change 2016/Shared Documents/Attachments/CC8.7a/Oracle 2015 GHG Assurance Review Letter - FINAL.pdf
1-2 ISO14064-3
100
Market-based
Annual process
Complete Limited assurance
https://www.cdp.net/sites/2016/13/14013/Climate Change 2016/Shared Documents/Attachments/CC8.7a/Oracle 2015 GHG Assurance Review Letter - FINAL.pdf
1-2 ISO14064-3
100

CC8.8
Please identify if any data points have been verified as part of the third party verification work undertaken, other than the verification of emissions figures reported in CC8.6, CC8.7 and CC14.2
Additional data points verified
Comment
Renewable energy products
Other: Oracle OpenWorld 2015
CC8.9
Are carbon dioxide emissions from biologically sequestered carbon relevant to your organization?
No
CC8.9a
Please provide the emissions from biologically sequestered carbon relevant to your organization in metric tonnes CO2
Further Information
Page: CC9. Scope 1 Emissions Breakdown - (1 Jan 2015 - 31 Dec 2015)
CC9.1
Do you have Scope 1 emissions sources in more than one country?
Yes

CC9.1a
Please break down your total gross global Scope 1 emissions by country/region
Country/Region
Scope 1 metric tonnes CO2e
North America 6595
Asia Pacific (or JAPA) 3178
Europe, Middle East and Africa (EMEA) 1968
CC9.2
Please indicate which other Scope 1 emissions breakdowns you are able to provide (tick all that apply)
CC9.2a
Please break down your total gross global Scope 1 emissions by business division
Business division
Scope 1 emissions (metric tonnes CO2e)

CC9.2b
Please break down your total gross global Scope 1 emissions by facility
Facility
Scope 1 emissions (metric tonnes CO2e)
Latitude
Longitude
CC9.2c
Please break down your total gross global Scope 1 emissions by GHG type
GHG type
Scope 1 emissions (metric tonnes CO2e)
CC9.2d
Please break down your total gross global Scope 1 emissions by activity
Activity
Scope 1 emissions (metric tonnes CO2e)
Further Information

Page: CC10. Scope 2 Emissions Breakdown - (1 Jan 2015 - 31 Dec 2015)
CC10.1
Do you have Scope 2 emissions sources in more than one country?
Yes
CC10.1a
Please break down your total gross global Scope 2 emissions and energy consumption by country/region
Country/Region
Scope 2, location-based
(metric tonnes CO2e)
Scope 2, market-based (metric tonnes CO2e)
Purchased and consumed
electricity, heat, steam or cooling
(MWh)
Purchased and consumed low carbon electricity, heat, steam
or cooling accounted in market-based approach (MWh)
North America 273785 247501 630222 5400
Asia Pacific (or JAPA) 93448 93328 119133
Latin America (LATAM) 2028 2028 10571
Europe, Middle East and Africa (EMEA)
43367 32122 101437 38151
CC10.2
Please indicate which other Scope 2 emissions breakdowns you are able to provide (tick all that apply)
By activity
CC10.2a

Please break down your total gross global Scope 2 emissions by business division
Business division
Scope 2 emissions, location based (metric tonnes CO2e)
Scope 2 emissions, market-based
(metric tonnes CO2e)
CC10.2b
Please break down your total gross global Scope 2 emissions by facility
Facility
Scope 2 emissions, location based (metric tonnes CO2e)
Scope 2 emissions, market-based
(metric tonnes CO2e)
CC10.2c
Please break down your total gross global Scope 2 emissions by activity
Activity
Scope 2 emissions,
location based (metric tonnes
CO2e)
Scope 2
emissions, market-based (metric tonnes
CO2e)
Data center activities – ICT1.2: The figure cited here applies to our two largest data centers, Austin Data Center and Utah Compute Facility, as well as emissions from our 10 smaller data centers located in California, Colorado, and Utah
100465 79975
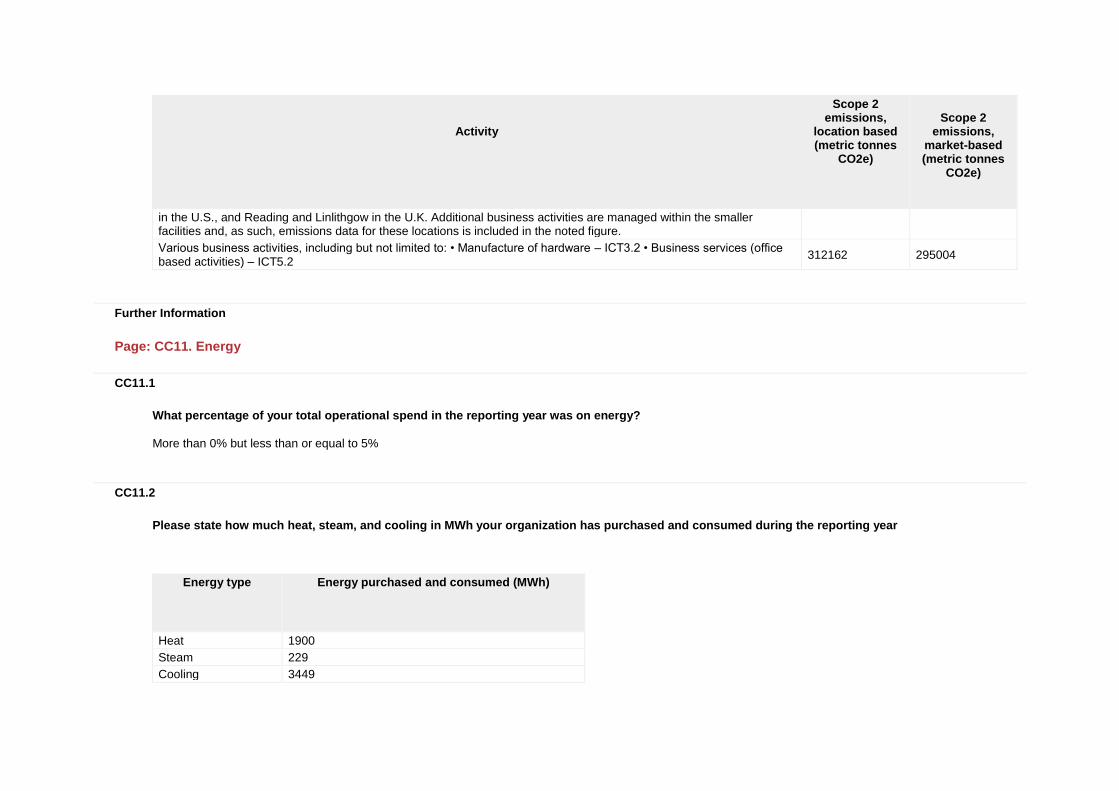
Activity
Scope 2 emissions,
location based (metric tonnes
CO2e)
Scope 2
emissions, market-based (metric tonnes
CO2e)
in the U.S., and Reading and Linlithgow in the U.K. Additional business activities are managed within the smaller facilities and, as such, emissions data for these locations is included in the noted figure.
Various business activities, including but not limited to: • Manufacture of hardware – ICT3.2 • Business services (office based activities) – ICT5.2
312162 295004
Further Information
Page: CC11. Energy
CC11.1
What percentage of your total operational spend in the reporting year was on energy?
More than 0% but less than or equal to 5%
CC11.2
Please state how much heat, steam, and cooling in MWh your organization has purchased and consumed during the reporting year
Energy type
Energy purchased and consumed (MWh)
Heat 1900
Steam 229
Cooling 3449

CC11.3
Please state how much fuel in MWh your organization has consumed (for energy purposes) during the reporting year
53670
CC11.3a
Please complete the table by breaking down the total "Fuel" figure entered above by fuel type
Fuels
MWh
Natural gas 50296
Diesel/Gas oil 3374
CC11.4
Please provide details of the electricity, heat, steam or cooling amounts that were accounted at a low carbon emission factor in the market-based Scope 2 figure reported in CC8.3a
Basis for applying a low carbon emission factor
MWh consumed associated with low carbon electricity,
heat, steam or cooling
Comment
Grid-connected generation owned, operated or hosted by the company, with energy attribute certificates created and retired by company
653 In April 2015, we installed a new solar photovoltaic system at an Oracle facility in Burlington, Massachusetts. The system is fully operational, generating clean, zero-emission electricity for the new, adjacent 125,000 square foot building.
Energy attribute certificates, Renewable Energy Certificates (RECs)
5400 Oracle purchased 5400 kWh in Renewable Energy Credits for energy use at its Austin Data Center for 2015.
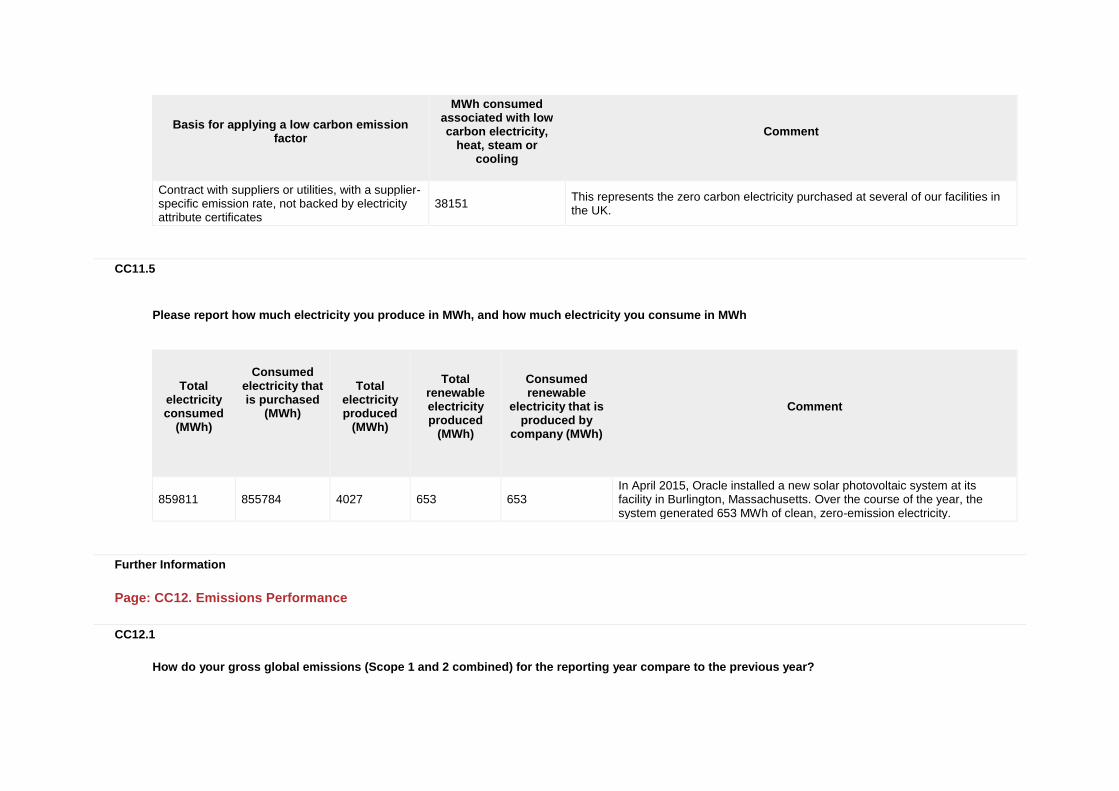
Basis for applying a low carbon emission factor
MWh consumed associated with low carbon electricity,
heat, steam or cooling
Comment
Contract with suppliers or utilities, with a supplier-specific emission rate, not backed by electricity attribute certificates
38151 This represents the zero carbon electricity purchased at several of our facilities in the UK.
CC11.5
Please report how much electricity you produce in MWh, and how much electricity you consume in MWh
Total
electricity consumed
(MWh)
Consumed
electricity that is purchased
(MWh)
Total
electricity produced
(MWh)
Total
renewable electricity produced
(MWh)
Consumed renewable
electricity that is produced by
company (MWh)
Comment
859811 855784 4027 653 653 In April 2015, Oracle installed a new solar photovoltaic system at its facility in Burlington, Massachusetts. Over the course of the year, the system generated 653 MWh of clean, zero-emission electricity.
Further Information
Page: CC12. Emissions Performance
CC12.1
How do your gross global emissions (Scope 1 and 2 combined) for the reporting year compare to the previous year?

Decreased
CC12.1a
Please identify the reasons for any change in your gross global emissions (Scope 1 and 2 combined) and for each of them specify how your emissions compare to the previous year
Reason
Emissions value
(percentage)
Direction of
change
Please explain and include calculation
Emissions reduction activities
5.8 Decrease
In 2015, an estimated 26,986 MTCO2e were reduced by our emissions reduction projects, and our total scope 1 and scope 2 emissions in the previous year amounted to 463,298 MTCO2e. Therefore, we arrived at 5.8% through (26,986/463,298)*100= 5.8%. To achieve this, we implemented several emissions reduction initiatives, including the installation of a new solar photovoltaic system at an Oracle facility in Burlington, Massachusetts, purchasing renewable energy credits, leveraging automated systems to control heating, cooling, ventilation, lighting, and other energy-consuming equipment; LED lighting installation; lighting and HVAC system and control upgrades; domestic hot water upgrades; modified boiler systems to reduce operating times; submeter installation to monitor individual labs and large equipment.
Divestment
Acquisitions 6 Increase In 2015, Oracle acquired several companies, which had an impact on our global employee headcount as well our facilities portfolio.
Mergers
Change in output
Change in methodology
8.6 Decrease
Last year, Oracle used state level emission factors from the EPA eGRID database, whereas this year we used sub region level emission factors to calculate emissions from electricity use across our facilities in the US. This impacted our emissions reporting for select US facilities in regions where the sub region factor was much lower than the state level factor.
Change in boundary
Change in physical operating conditions
Unidentified
Other

CC12.1b
Is your emissions performance calculations in CC12.1 and CC12.1a based on a location-based Scope 2 emissions figure or a market-based Scope 2 emissions figure?
Location-based
CC12.2
Please describe your gross global combined Scope 1 and 2 emissions for the reporting year in metric tonnes CO2e per unit currency total revenue
Intensity figure =
Metric numerator (Gross global combined
Scope 1 and 2 emissions)
Metric denominator: Unit
total revenue
Scope 2
figure used
% change from previous
year
Direction of change from previous year
Reason for change
0.0000113244 metric tonnes CO2e 37474000000 Location-based
5.11 Decrease Emission reduction activities such as increased operational efficiency.
CC12.3
Please provide any additional intensity (normalized) metrics that are appropriate to your business operations
Intensity figure =
Metric numerator (Gross global combined
Scope 1 and 2 emissions)
Metric denominator
Metric
denominator: Unit total
Scope 2 figure used
% change from
previous year
Direction of change
from previous
year
Reason for change

Intensity figure =
Metric numerator (Gross global combined
Scope 1 and 2 emissions)
Metric denominator
Metric
denominator: Unit total
Scope 2 figure used
% change from
previous year
Direction of change
from previous
year
Reason for change
3.17 metric tonnes CO2e
full time equivalent (FTE) employee
133789 Location-based
14.73 Decrease Emission reduction activities such as increased operational efficiency.
Further Information
Page: CC13. Emissions Trading
CC13.1
Do you participate in any emissions trading schemes?
No, and we do not currently anticipate doing so in the next 2 years
CC13.1a
Please complete the following table for each of the emission trading schemes in which you participate
Scheme name
Period for which data is supplied
Allowances allocated
Allowances purchased
Verified emissions in metric tonnes CO2e
Details of ownership
CC13.1b
What is your strategy for complying with the schemes in which you participate or anticipate participating?

CC13.2
Has your organization originated any project-based carbon credits or purchased any within the reporting period?
No
CC13.2a
Please provide details on the project-based carbon credits originated or purchased by your organization in the reporting period
Credit origination
or credit purchase
Project type
Project identification
Verified to which standard
Number of credits (metric
tonnes of CO2e)
Number of credits (metric tonnes
CO2e): Risk adjusted volume
Credits cancelled
Purpose, e.g. compliance
Further Information
Page: CC14. Scope 3 Emissions
CC14.1
Please account for your organization’s Scope 3 emissions, disclosing and explaining any exclusions

Sources of Scope 3
emissions
Evaluation
status
metric
tonnes
CO2e
Emissions calculation methodology
Percentage of
emissions
calculated using
data obtained
from suppliers or value
chain partners
Explanation
Purchased goods and services
Relevant, calculated
39458
This figure represents the estimated emissions associated with two categories of purchased goods: furniture and computers. The emissions were calculated by multiplying the spend data for both categories of goods by the corresponding conversion factors as outlined in the DEFRA 2012 Conversion Factor Repository (0.48 kg CO2e per £ for furniture, and 0.53 kg CO2e per £ for computers, laptops, and tablets).
Capital goods
Relevant, calculated
487453
Oracle used the value of Property, Plant, and Equipment (PP&E) as indicated in our balance sheet to determine our capital expenditures for fiscal year 2015. The upstream impact of these investments was calculated using the following emission factors: 589,000 mtCO2e/$1B for buildings, 454,000 mtCO2e/$1B for electronic equipment, and 464,000 mtCO2e/$1B for other.
Fuel-and-energy-related activities (not included in Scope 1 or 2)
Relevant, calculated
24757
According to the Energy Information Administration (EIA), approximately 6 percent of total electricity input in the US is lost to transmission and distribution. Based on this assumption, we calculated 6 percent of our total scope 2 emissions to estimate the scope 3 emissions around fuel- and energy-related activities. The scope 2 emissions figure was calculated using the following standards: EPA eGRID 2012 for U.S. Electricity; EPA GHG Emission Factors Hub for U.S. Natural Gas; National Greenhouse Accounts Factors for Australia Electricity and Natural Gas; DEFRA Greenhouse Gas Conversion Factor Repository for Electricity and Natural Gas in all other countries.
Upstream transportation and distribution
Relevant, calculated
42005
These are emissions from third party service providers who transport products or product components to various manufacturing locations and to our customers globally. The emissions are estimated using an equation from the World Resources Institute (WRI) Greenhouse Gas Protocol: Distance Traveled x Total Weight x WRI GHG Protocol emissions cofactor
Our transportation and distribution vendor provides us with one figure, which includes both upstream and downstream emissions. We estimate that the scale of our upstream and

Sources of Scope 3
emissions
Evaluation
status
metric
tonnes
CO2e
Emissions calculation methodology
Percentage of
emissions
calculated using
data obtained
from suppliers or value
chain partners
Explanation
per transport mode. To calculate this, our vendor has developed an internal tool which uses the following information: 1) Actual customer shipment records for the period, listing origin and destination points, weight per shipment and primary shipment mode; 2) A proprietary distance table based largely on the Publication 151 – Distance Between Ports. National Imagery and Mapping Agency, 2001. Distances are calculated based on common vessel routings for ocean and using the “Great Circle Distance” method for air and ocean; 3) GHG Protocol emissions cofactors per primary mode of transport.
downstream operations is roughly equal. Therefore we are reporting 50% of the total emissions figure (84,011 MT CO2) in each category.
Waste generated in operations
Relevant, calculated
951
This data represents waste generated to landfill for 88.58% of total net rentable area at Oracle-owned buildings globally. The volume of waste was converted to lbs using an average density of 450 lbs per yd3. The emissions calculation was based on the EPA Waste Reduction Model (WARM) version 14 (updated March 2016) using the 0.35 National Average Emission Factor for Landfilling.
Business travel
Relevant, calculated
221432
This data is acquired from Oracle’s travel vendors, Hertz and Avis. Hertz uses the following emission factors as established by The Climate Registry: 8.78 kg CO2/gallon of petrol and 10.21 kg CO2/gallon of diesel. The following GWPs were used: CO2: 1, CH4: 21, N2O: 310. For air travel, Oracle uses an internal system that is part of the Oracle Business Intelligence Enterprise Edition (OBIEE) tool, and is aligned with the GHG Protocol guidance.
Employee commuting
Relevant, calculated
59.53
This number was calculated using annual mileage data from Oracle’s employee shuttle service providers. The emissions were estimated using the following emission factors: CO2: 0.107 (kg CO2/passenger-mile), CH4: 0.0006 (g CH4/passenger-mile), N2O: 0.0005 (g N2O/passenger-mile), as referenced in the EPA Climate Leaders Greenhouse Gas Inventory Protocol
The figure represents emissions data from our employee shuttle providers for our offices in Redwood Shores and Santa Clara, CA. This figure does not include emissions
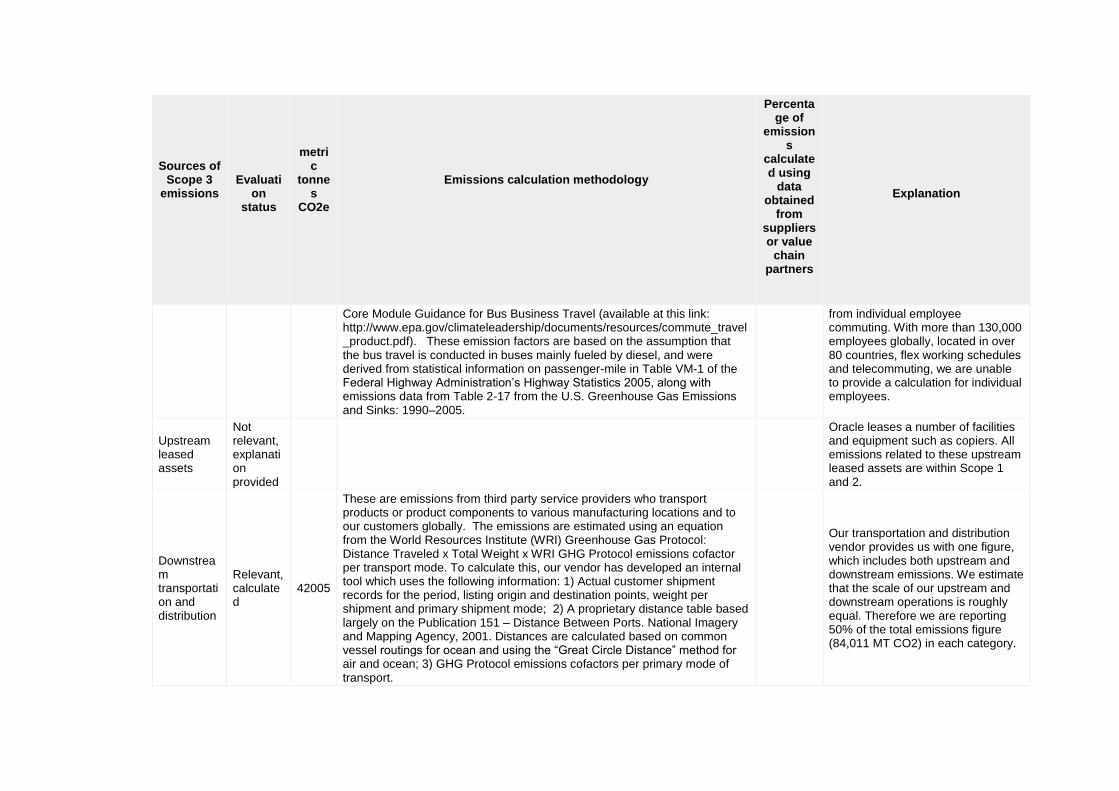
Sources of Scope 3
emissions
Evaluation
status
metric
tonnes
CO2e
Emissions calculation methodology
Percentage of
emissions
calculated using
data obtained
from suppliers or value
chain partners
Explanation
Core Module Guidance for Bus Business Travel (available at this link: http://www.epa.gov/climateleadership/documents/resources/commute_travel_product.pdf). These emission factors are based on the assumption that the bus travel is conducted in buses mainly fueled by diesel, and were derived from statistical information on passenger-mile in Table VM-1 of the Federal Highway Administration’s Highway Statistics 2005, along with emissions data from Table 2-17 from the U.S. Greenhouse Gas Emissions and Sinks: 1990–2005.
from individual employee commuting. With more than 130,000 employees globally, located in over 80 countries, flex working schedules and telecommuting, we are unable to provide a calculation for individual employees.
Upstream leased assets
Not relevant, explanation provided
Oracle leases a number of facilities and equipment such as copiers. All emissions related to these upstream leased assets are within Scope 1 and 2.
Downstream transportation and distribution
Relevant, calculated
42005
These are emissions from third party service providers who transport products or product components to various manufacturing locations and to our customers globally. The emissions are estimated using an equation from the World Resources Institute (WRI) Greenhouse Gas Protocol: Distance Traveled x Total Weight x WRI GHG Protocol emissions cofactor per transport mode. To calculate this, our vendor has developed an internal tool which uses the following information: 1) Actual customer shipment records for the period, listing origin and destination points, weight per shipment and primary shipment mode; 2) A proprietary distance table based largely on the Publication 151 – Distance Between Ports. National Imagery and Mapping Agency, 2001. Distances are calculated based on common vessel routings for ocean and using the “Great Circle Distance” method for air and ocean; 3) GHG Protocol emissions cofactors per primary mode of transport.
Our transportation and distribution vendor provides us with one figure, which includes both upstream and downstream emissions. We estimate that the scale of our upstream and downstream operations is roughly equal. Therefore we are reporting 50% of the total emissions figure (84,011 MT CO2) in each category.

Sources of Scope 3
emissions
Evaluation
status
metric
tonnes
CO2e
Emissions calculation methodology
Percentage of
emissions
calculated using
data obtained
from suppliers or value
chain partners
Explanation
Processing of sold products
Not relevant, explanation provided
Subsequent to manufacturing, Oracle hardware is not processed further.
Use of sold products
Relevant, calculated
46189
Oracle has multiple families of servers, each of which has many models, available in different configurations, with different power use capabilities. It is impossible to precisely calculate emissions for our customers’ energy use around the globe, across our entire product portfolio. For this reason, we used data from one very popular family of servers as the basis for our calculation/estimation. Our methodology and assumptions are as follows: • For the purposes of this calculation, we assumed an equal number of units sold across the various configurations. • The power use for each configuration was estimated using the publicly available "Sun Power Calculators,” available at this link: http://www.oracle.com/us/products/servers-storage/sun-power-calculators/index.html. • The results were multiplied by the US Average Domestic Electricity Emission Factor of 0.676 MT of CO2 per MWh (in accordance with the US Energy Information Administration, Domestic Electricity Emission Factors, 1999-2002). • We assumed that, on average, our customers ran workloads on their servers 50% of the time. • Lastly, we assumed an average Power-Utilization-Effectiveness (PUE) of 1.5 for our customers’ data centers.
End of life treatment of sold products
Not relevant, explanation
Upon evaluating the estimated emissions associated with the disposal and treatment of Oracle-branded products, we determined

Sources of Scope 3
emissions
Evaluation
status
metric
tonnes
CO2e
Emissions calculation methodology
Percentage of
emissions
calculated using
data obtained
from suppliers or value
chain partners
Explanation
provided that this source is not relevant and the emissions are not material to our Scope 3 emissions footprint. We offer product take-back to all of our customers to help ensure products are recycled or disposed of responsibly and in compliance with the law. Products that cannot be remanufactured by Oracle for reuse are sent to our contracted recyclers, who responsibly recycle, or resell the remaining material - sending only 0.49% to landfill. In FY15, Oracle took back 3,884,754 lbs of product, an increase of 15% over the prior year observed across all regions. Of the total material collected, 94.5% was recycled, 5% reused, and 0.5% sent to landfill. Oracle conducts audits to help ensure that our recyclers and their downstream processors have proper Health & Safety controls in place and are compliant with local law. By expanding the number of sites in our recycling network and increasing the percentage of material reused vs. recycled, we reduce shipping miles

Sources of Scope 3
emissions
Evaluation
status
metric
tonnes
CO2e
Emissions calculation methodology
Percentage of
emissions
calculated using
data obtained
from suppliers or value
chain partners
Explanation
and conserve raw materials, both of which have an environmental benefit. We assist our customers in their end-of-life planning and in many cases offer de-install, data destruction, transportation and recycling services at no charge. More information of Oracle's Take Back and Recycling programs can be found at; http://www.oracle.com/us/products/servers-storage/take-back-and-recycling/index.html
Downstream leased assets
Relevant, calculated
14840
This figure was calculated by multiplying the total square feet of subleased space by 17.3 kWH of electricity consumption per square feet (taken from the EIA CBECS survey) and the average emission factor in the US of 1,232 lbs/MWH.
Franchises
Not relevant, explanation provided
Oracle does not have any franchisees.
Investments
Not relevant, explanation provided
Oracle is not a financial institution. Our "investments" are primarily debt investments without known use of proceeds.
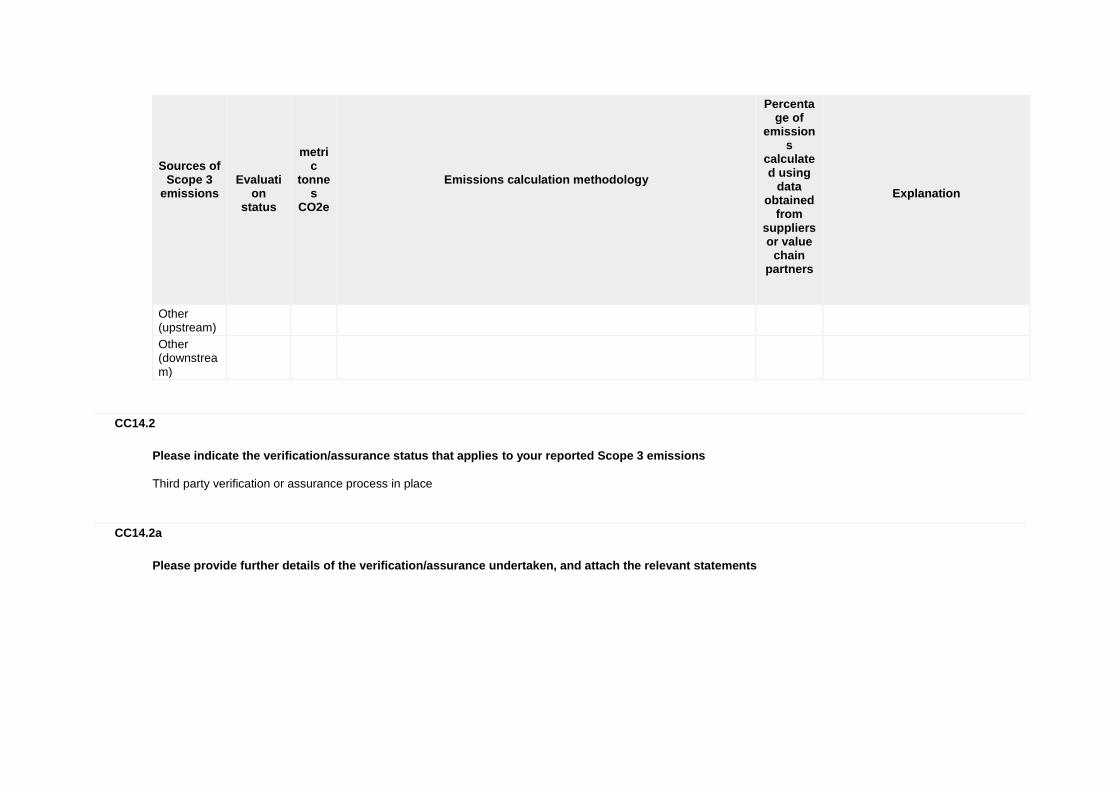
Sources of Scope 3
emissions
Evaluation
status
metric
tonnes
CO2e
Emissions calculation methodology
Percentage of
emissions
calculated using
data obtained
from suppliers or value
chain partners
Explanation
Other (upstream)
Other (downstream)
CC14.2
Please indicate the verification/assurance status that applies to your reported Scope 3 emissions
Third party verification or assurance process in place
CC14.2a
Please provide further details of the verification/assurance undertaken, and attach the relevant statements
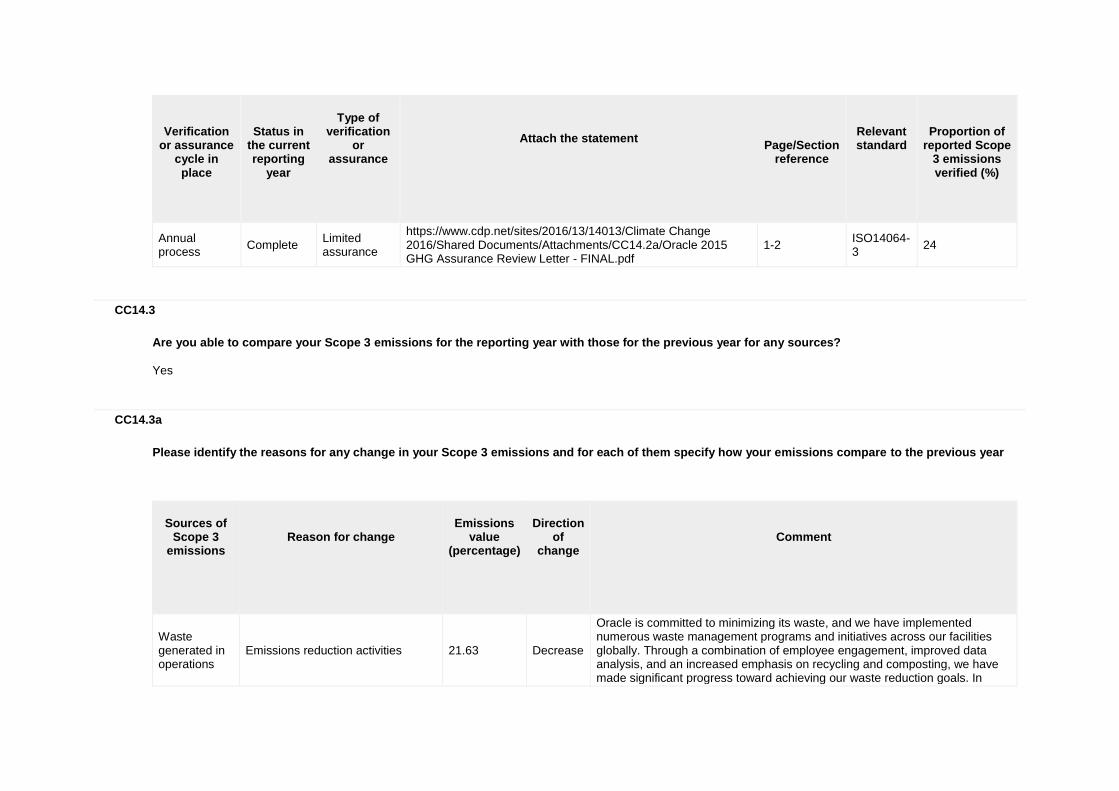
Verification
or assurance cycle in place
Status in
the current reporting
year
Type of
verification or
assurance
Attach the statement
Page/Section
reference
Relevant standard
Proportion of
reported Scope 3 emissions verified (%)
Annual process
Complete Limited assurance
https://www.cdp.net/sites/2016/13/14013/Climate Change 2016/Shared Documents/Attachments/CC14.2a/Oracle 2015 GHG Assurance Review Letter - FINAL.pdf
1-2 ISO14064-3
24
CC14.3
Are you able to compare your Scope 3 emissions for the reporting year with those for the previous year for any sources?
Yes
CC14.3a
Please identify the reasons for any change in your Scope 3 emissions and for each of them specify how your emissions compare to the previous year
Sources of
Scope 3 emissions
Reason for change
Emissions
value (percentage)
Direction
of change
Comment
Waste generated in operations
Emissions reduction activities 21.63 Decrease
Oracle is committed to minimizing its waste, and we have implemented numerous waste management programs and initiatives across our facilities globally. Through a combination of employee engagement, improved data analysis, and an increased emphasis on recycling and composting, we have made significant progress toward achieving our waste reduction goals. In

Sources of
Scope 3 emissions
Reason for change
Emissions
value (percentage)
Direction
of change
Comment
2015, Oracle received the BizSMART@Work Gold award for Recycling and Composting, in recognition of our excellent waste management efforts.
Waste generated in operations
Change in methodology 20.99 Decrease Per the EPA Waste Reduction Model (WARM) version 14, the emission factor for mixed solid waste is 0.35, as opposed to 0.48 in the previous version.
Business travel
Emissions reduction activities 8.7 Decrease
In 2015, we continued to work to reduce travel by leveraging Oracle products and updating our travel-related business practices. We ask employees to travel only when necessary and employ Oracle Web Conferencing and Cisco TelePresence across our enterprise to ensure that virtual meetings are highly effective. Many internal meetings that were previously conducted face to face have been replaced by teleconferences. When employees book business travel, they are required to submit a business justification, and their managers are immediately notified about their trip. This practice helps Oracle managers both to ensure that employees travel only when necessary and to monitor the number of employees traveling to any single event or meeting.
Employee commuting
Other: The increase in emissions reflects growth in Oracle’s alternative transportation program and employees’ increased utilization of our shuttle services.
10.91 Increase In recognition of our efforts, Oracle was named a Best Workplace for Commuters in California for meeting the National Standard of Excellence.
CC14.4
Do you engage with any of the elements of your value chain on GHG emissions and climate change strategies? (Tick all that apply)
Yes, our suppliers Yes, our customers Yes, other partners in the value chain
CC14.4a
Please give details of methods of engagement, your strategy for prioritizing engagement and measures of success
Methods of engagement: • Oracle engages with our suppliers, customers, and other partners in the value chain on GHG emissions. For example, we periodically host webinars on sustainable management for our suppliers and industry colleagues. Additionally, we participate in the Electronic Industry Citizenship Coa lition’s (EICC) Greenhouse Gas Reporting process. Oracle suppliers are invited to EICC webinars/training sessions on energy efficiency and greenhouse gas reporting. • While Oracle has an impact itself, we can have an even larger impact by the practical, concrete sustainability solutions that we provide to our customers to help with their sustainability initiatives. Leveraging the power of hardware and software, engineered to work together, Oracle provides a range of products that assist our customers in decreasing their energy use and lowering GHG emissions. For example: Oracle Transportation Management helps with Sustainable Logistics, Oracle Utilities helps with Smart Utility Grids, and Oracle Environmental Accounting and Reporting helps with Sustainability Analytics. Other examples of products that we provide to help our customers reduce their own GHG emissions and their environmental impact include: o Oracle Engineered Systems: Reducing energy needs o Oracle's server, storage, network & desktop virtualization technologies: Increasing utilization and lowering energy use o Oracle Real Application Clusters: Saving electricity, cooling and floor space o Oracle Advanced Compression: Lowering storage requirements and saving energy o Oracle Product Lifecycle Management (PLM): Reducing risk by managing a product's environmental compliance in its design phase o Oracle Strategic Network Optimization: Optimizing constrained natural resources o Oracle Lean Manufacturing: Reducing waste using lean manufacturing principles o Oracle Reverse Logistics: Increasing reverse supply chain efficiencies while addressing increasing product take-back requirements o Oracle Procurement: Ensuring use of sustainable suppliers o Oracle Governance, Risk, and Compliance (GRC) management: Formalizing the scope around green initiatives, establishing targets, and then measuring progress o Oracle On Demand: Driving down power consumption and space requirements Strategy for prioritizing engagement and measuring success: • While maximizing our own sustainability is our top priority, we also prioritize the sustainability of our strategic hardware suppliers. We measure success based on the percentage of our top direct hardware supply chain manufacturing suppliers who disclose their GHG emissions. To quantify this process, Oracle uses a supplier scorecard. In order to receive points on the scorecard, suppliers are required to report on their energy, water, and waste footprints in addition to many other items. Supplier responses are among the many factors Oracle considers in making business decisions.
CC14.4b
To give a sense of scale of this engagement, please give the number of suppliers with whom you are engaging and the proportion of your total spend that they represent
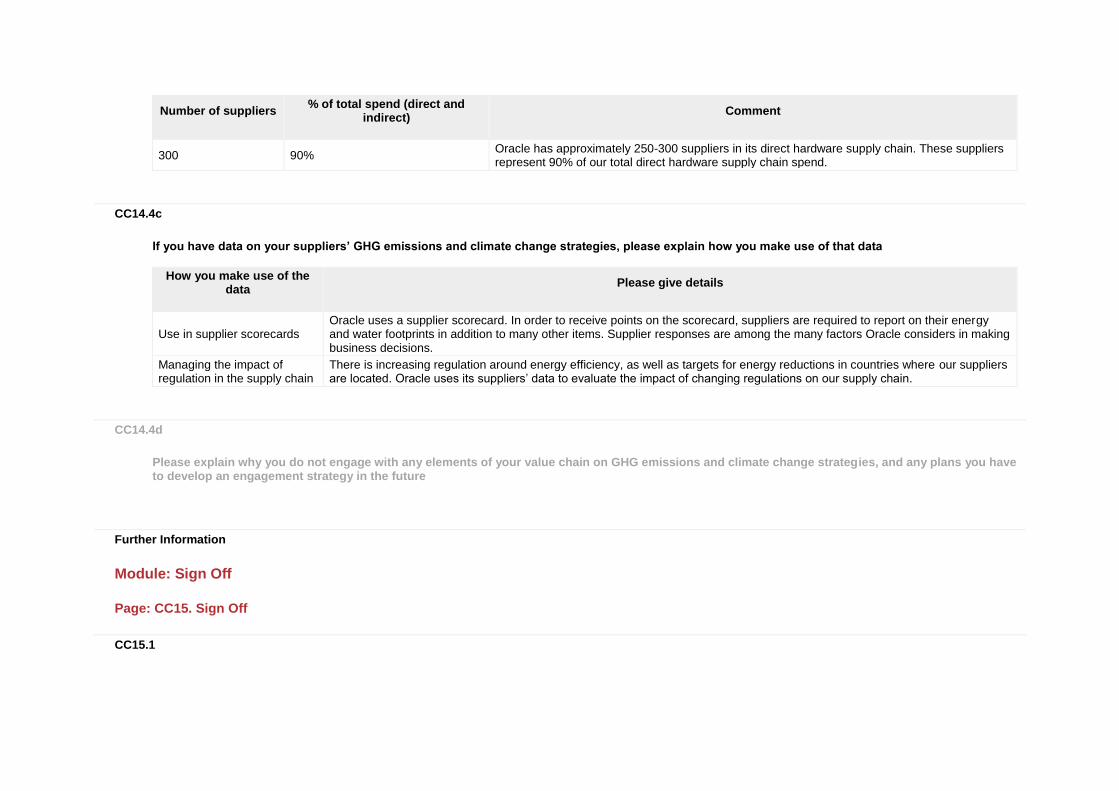
Number of suppliers
% of total spend (direct and indirect)
Comment
300 90% Oracle has approximately 250-300 suppliers in its direct hardware supply chain. These suppliers represent 90% of our total direct hardware supply chain spend.
CC14.4c
If you have data on your suppliers’ GHG emissions and climate change strategies, please explain how you make use of that data
How you make use of the data
Please give details
Use in supplier scorecards Oracle uses a supplier scorecard. In order to receive points on the scorecard, suppliers are required to report on their energy and water footprints in addition to many other items. Supplier responses are among the many factors Oracle considers in making business decisions.
Managing the impact of regulation in the supply chain
There is increasing regulation around energy efficiency, as well as targets for energy reductions in countries where our suppliers are located. Oracle uses its suppliers’ data to evaluate the impact of changing regulations on our supply chain.
CC14.4d
Please explain why you do not engage with any elements of your value chain on GHG emissions and climate change strategies, and any plans you have to develop an engagement strategy in the future
Further Information
Module: Sign Off
Page: CC15. Sign Off
CC15.1
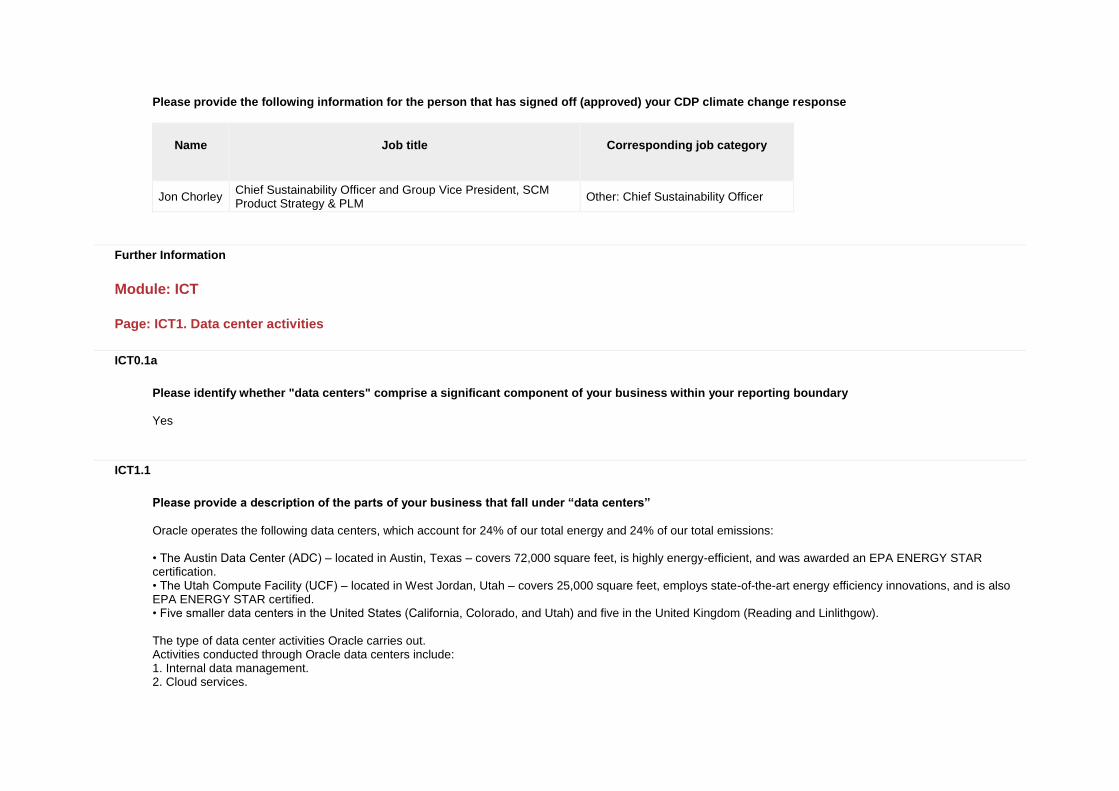
Please provide the following information for the person that has signed off (approved) your CDP climate change response
Name
Job title
Corresponding job category
Jon Chorley Chief Sustainability Officer and Group Vice President, SCM Product Strategy & PLM
Other: Chief Sustainability Officer
Further Information
Module: ICT
Page: ICT1. Data center activities
ICT0.1a
Please identify whether "data centers" comprise a significant component of your business within your reporting boundary
Yes
ICT1.1
Please provide a description of the parts of your business that fall under “data centers”
Oracle operates the following data centers, which account for 24% of our total energy and 24% of our total emissions: • The Austin Data Center (ADC) – located in Austin, Texas – covers 72,000 square feet, is highly energy-efficient, and was awarded an EPA ENERGY STAR certification. • The Utah Compute Facility (UCF) – located in West Jordan, Utah – covers 25,000 square feet, employs state-of-the-art energy efficiency innovations, and is also EPA ENERGY STAR certified. • Five smaller data centers in the United States (California, Colorado, and Utah) and five in the United Kingdom (Reading and Linlithgow). The type of data center activities Oracle carries out. Activities conducted through Oracle data centers include: 1. Internal data management. 2. Cloud services.

3. Other customer-related services (e.g., support, training, etc.). 4. Product development. 5. Website development and provisioning. 6. Other business operations.
ICT1.2
Please provide your absolute Scope 1 and 2 emissions and electricity consumption for the data centers component of your business
Business activity
Scope 1 emissions (metric tonnes CO2e)
Scope 2 emissions (metric tonnes CO2e)
Annual electricity consumption (MWh)
Electricity data collection method
Comment
Data centers
ICT1.3
What percentage of your ICT population sits in data centers where Power Usage Effectiveness (PUE) is measured on a regular basis?
Percentage
Comment
ICT1.4
Please provide a Power Usage Effectiveness (PUE) value for your data center(s). You can provide this information as (a) an average, (b) a range or (c) by individual data center - please tick the data you wish to provide (tick all that apply)
ICT1.4a
Please provide your average PUE across your data centers
Number of data centers
Average PUE
% change from previous year
Direction of change
Comment
ICT1.4b
Please provide the range of PUE values across your data centers
Number of data centers
PUE Minimum Value
% change of PUE Minimum Value from
previous year
PUE Maximum Value
% change of PUE Maximum Value from
previous year
Direction of change
Comment
ICT1.4c
Please provide your PUE values of all your data centers
Data center reference
PUE value
% change from previous year
Direction of change
Comment
ICT1.5
Please provide details of how you have calculated your PUE value
ICT1.6
Do you use any alternative intensity metrics to assess the energy or emissions performance of your data center(s)?

ICT1.6a
Please provide details on the alternative intensity metrics you use to assess the energy or the emissions performance of your data center(s)
ICT1.7
Please identify the measures you are planning or have undertaken in the reporting year to increase the energy efficiency of your data center(s)
Status in reporting year
Energy efficiency measure
Comment
ICT1.8
Do you participate in any other data center efficiency schemes or have buildings that are sustainably certified or rated?
ICT1.8a
Please provide details on the data center efficiency schemes you participate in or the buildings that are sustainably certified or rated
Scheme name
Level/certification (or equivalent) achieved in the reporting year
Percentage of your overall facilities to which the scheme applies
ICT1.9
Do you measure the utilization rate of your data center(s)?
ICT1.9a
What methodology do you use to calculate the utilization rate of your data center(s)?
ICT1.10
Do you provide carbon emissions data to your clients regarding the data center services they procure?
ICT1.10a
How do you provide carbon emissions data to your clients regarding the data center services they procure?
ICT1.11
Please describe any efforts you have made to incorporate renewable energy into the electricity supply to your data center(s) or to re-use waste heat
Further Information
Page: ICT2. Provision of network/connectivity services
ICT0.1b
Please identify whether "provision of network/connectivity services" comprises a significant component of your business within your reporting boundary
No

ICT2.1
Please provide a description of the parts of your business that fall under "provision of network/connectivity services"
ICT2.2
Please provide your absolute Scope 1 and 2 emissions and electricity consumption for the provision of network/connectivity services component of your business
Business activity
Scope 1 emissions (metric tonnes CO2e)
Scope 2 emissions (metric tonnes CO2e)
Annual electricity consumption (MWh)
Electricity data collection method
Comment
ICT2.3
Please describe your gross combined Scope 1 and 2 emissions or electricity use for the provision of network/connectivity services component of your business as an intensity metric
Intensity figure
Metric numerator
Metric denominator
% change from previous year
Direction of change from previous year
Reason for change
Comment
ICT2.4
Please explain how you calculated the intensity figures given in response to Question ICT2.3
ICT2.5
Do you provide carbon emissions data to your clients regarding the network/connectivity services they procure?

ICT2.5a
How do you provide carbon emissions data to your clients regarding the network/connectivity services they procure?
Further Information
Page: ICT3. Manufacture or assembly of hardware/components
ICT0.1c
Please identify whether "manufacture or assembly of hardware/components" comprises a significant part of your business within your reporting boundary
Yes
ICT3.1
Please provide a description of the parts of your business that fall under "manufacture or assembly of hardware/components"
The types of products that Oracle manufactures: We develop, manufacture, market, distribute, and service hardware systems, consisting primarily of computer server and storage products. The part of the manufacturing process Oracle carries out: To produce our hardware systems products, we rely on both our internal manufacturing operations as well as third party manufacturing partners. Our internal manufacturing operations consist primarily of final assembly, test and quality control of our enterprise and data center servers and storage systems. For all other manufacturing, we rely on third party manufacturing partners. We distribute most of our hardware systems products either from our facilities or partner facilities. Our manufacturing processes are based on standardization of components across product types, centralization of assembly and d istribution centers and a “build-to-order” methodology in which products are built only after customers have placed firm orders. Production of our hardware products requires that we purchase materials, supplies, product subassemblies and full assemblies from a number of vendors.
ICT3.2
Please provide your absolute Scope 1 and 2 emissions and electricity consumption for the manufacture or assembly of hardware/components part of your business
Business activity
Scope 1 emissions (metric tonnes CO2e)
Scope 2 emissions (metric tonnes CO2e)
Annual electricity consumption (MWh)
Electricity data collection method
Comment
Manufacture or assembly of hardware/components
ICT3.3
Please identify the percentage of your products meeting recognized energy efficiency standards/specifications by sales weighted volume (full product range)
Product type
Standard (sleep mode)
Percentage of products meeting the
standard by sales volume (sleep mode)
Standard (standby mode)
Percentage of products meeting the
standard by sales volume (standby
mode)
Standard (in use mode)
Percentage of products meeting the
standard by sales volume (in use mode)
Comment
ICT3.4
Of the new products released in the reporting year, please identify the percentage (as a percentage of all new products in that product type category) that meet recognized energy efficiency standards/specifications
Product type
Standard (sleep mode)
Percentage of new products meeting
the standard (sleep mode)
Standard (standby mode)
Percentage of new products meeting
the standard (standby mode)
Standard (in use mode)
Percentage of new products meeting
the standard (in use mode)
Comment

ICT3.5
Please describe the efforts your organization has made to improve the energy efficiency of your products
ICT3.6
Please describe the GHG emissions abatement measures you have employed specifically in your ICT manufacturing operations
ICT3.7
Do you provide carbon emissions data to your clients regarding the hardware/component products they procure?
ICT3.7a
How do you provide carbon emissions data to your clients regarding the hardware/component products they procure?
Further Information
Page: ICT4. Manufacture of software
ICT0.1d
Please identify whether "manufacture of software" comprises a significant component of your business within your reporting boundary
No
ICT4.1
Please provide a description of the parts of your business that fall under "manufacture of software"
ICT4.2
Please provide your absolute Scope 1 and 2 emissions and electricity consumption for the software manufacture component of your business
Business activity
Scope 1 emissions (metric tonnes CO2e)
Scope 2 emissions (metric tonnes CO2e)
Annual electricity consumption (MWh)
Electricity data collection method
Comment
ICT4.3
Please describe your gross combined Scope 1 and 2 emissions for the software manufacture component of your business in metric tonnes CO2e per unit of production
Intensity figure
Metric numerator
Metric denominator
% change from previous year
Direction of change from previous year
Reason for change
Comment
ICT4.4
What percentage of your software sales (by volume) is in an electronic format?
ICT4.5
Do you provide carbon emissions data to your clients regarding the software products they procure?
ICT4.5a
How do you provide carbon emissions data to your clients regarding the software products they procure?
Further Information
Distribution of software on tangible media does not comprise a significant component of our business. Customer adoption of electronic transmission, over traditional tangible shipments, represents the vast majority of our distribution for software, documentation, and educational course materials and has for years. We have closed our software warehouse operations and now provide tangible shipments to only a very small number of customers directly from small office locations.
Page: ICT5. Business services (office based activities)
ICT0.1e
Please identify whether "business services (office based activities)" comprise a significant component of your business within your reporting boundary
Yes
ICT5.1
Please provide a description of the parts of your business that fall under "business services (office based activities)"
The types of activities that fall under business services (office-based activities): Oracle is a global company that designs, produces and markets computer software and hardware, and provides sales, consulting, education and training in the application and use of our products.
ICT5.2
Please provide your absolute Scope 1 and 2 emissions and electricity consumption for the business services (office based activities) component of your business
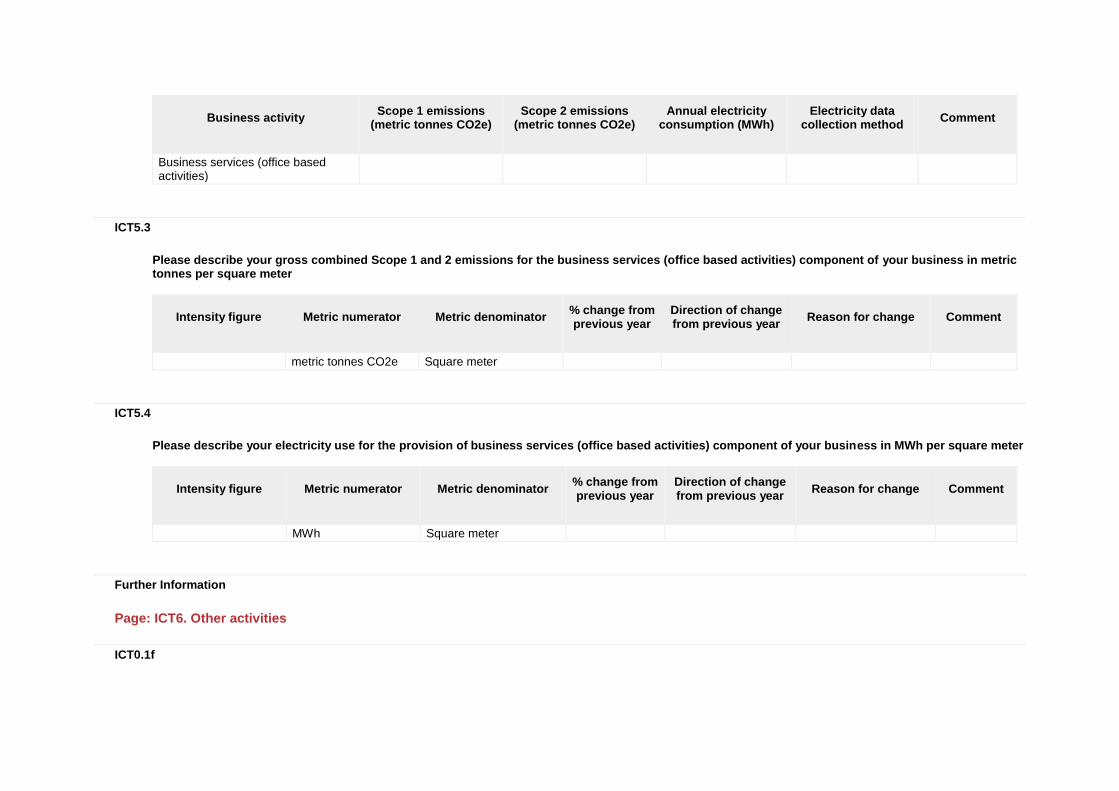
Business activity
Scope 1 emissions (metric tonnes CO2e)
Scope 2 emissions (metric tonnes CO2e)
Annual electricity consumption (MWh)
Electricity data collection method
Comment
Business services (office based activities)
ICT5.3
Please describe your gross combined Scope 1 and 2 emissions for the business services (office based activities) component of your business in metric tonnes per square meter
Intensity figure
Metric numerator
Metric denominator
% change from previous year
Direction of change from previous year
Reason for change
Comment
metric tonnes CO2e Square meter
ICT5.4
Please describe your electricity use for the provision of business services (office based activities) component of your business in MWh per square meter
Intensity figure
Metric numerator
Metric denominator
% change from previous year
Direction of change from previous year
Reason for change
Comment
MWh Square meter
Further Information
Page: ICT6. Other activities
ICT0.1f
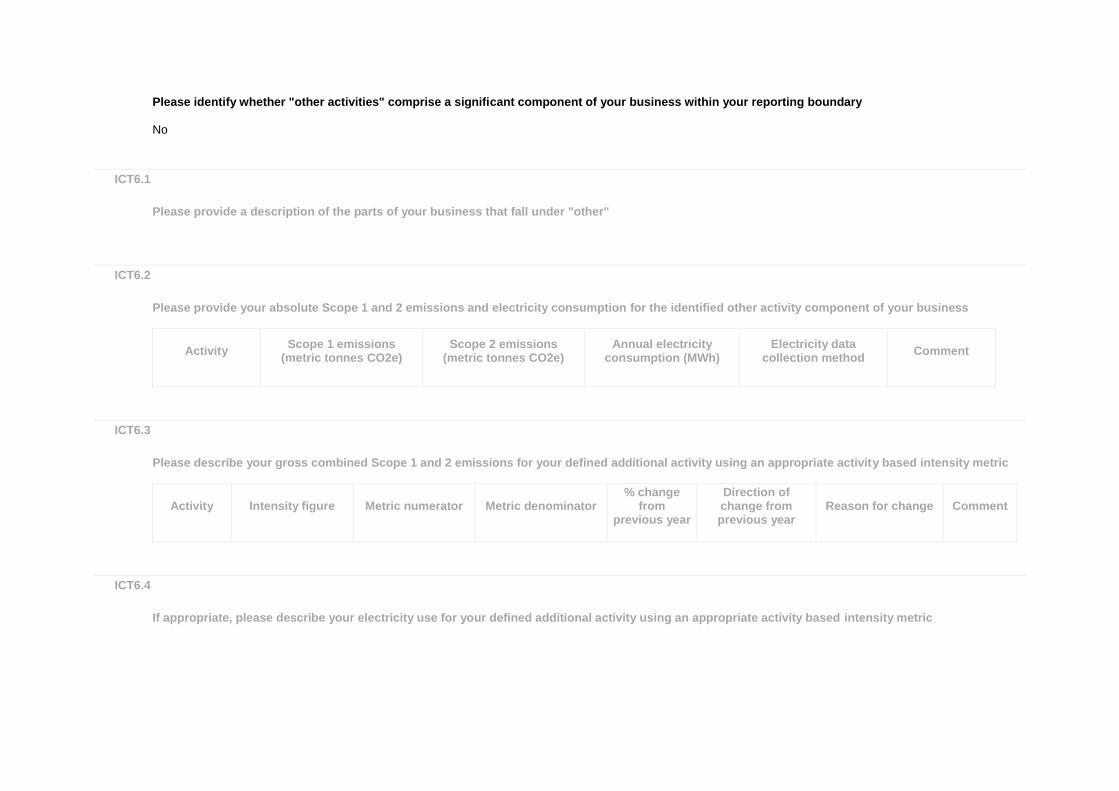
Please identify whether "other activities" comprise a significant component of your business within your reporting boundary
No
ICT6.1
Please provide a description of the parts of your business that fall under "other"
ICT6.2
Please provide your absolute Scope 1 and 2 emissions and electricity consumption for the identified other activity component of your business
Activity
Scope 1 emissions (metric tonnes CO2e)
Scope 2 emissions (metric tonnes CO2e)
Annual electricity consumption (MWh)
Electricity data collection method
Comment
ICT6.3
Please describe your gross combined Scope 1 and 2 emissions for your defined additional activity using an appropriate activity based intensity metric
Activity
Intensity figure
Metric numerator
Metric denominator
% change from
previous year
Direction of change from previous year
Reason for change
Comment
ICT6.4
If appropriate, please describe your electricity use for your defined additional activity using an appropriate activity based intensity metric

Activity
Intensity figure
Metric numerator
Metric denominator
% change from
previous year
Direction of change from previous year
Reason for change
Comment
Further Information
CDP