Investor CDP 2014 Information Request - Peab AB · Investor CDP 2014 Information Request Peab AB...
28
Investor CDP 2014 Information Request - Peab AB https://www.cdp.net/sites/2014/16/14516/Investor%20CDP%202014/Pages/DisclosureView.aspx[2014-10-17 10:37:05] Investor CDP 2014 Information Request Peab AB Module: Introduction Page: Introduction CC0.1 Introduction Please give a general description and introduction to your organization. Peab AB is a construction and civil engineering company with headquarters in Förslöv in the south of Sweden. Peab was founded in 1959 and operates in Sweden, Norway and Finland. The company is the third largest construction and civil engineering company in the Nordic region based on turnover. Peab’s vision is to be the Nordic Community Builder and our common view is based on our four core values; Down-to-earth, Developing, Personal and Reliable. During 2013 Peab was divided into four business areas; Construction, Civil Engineering, Industry and Real Estate Development. In 2013, the total assets in Peab amounted to 31 851 MSEK, debts to 24 183 MSEK and the equity to 7 668 MSEK. CONSTRUCTION Construction is the largest business area in the Group, representing approximately half of the Group’s turnover. The business area Construction is divided into twelve Swedish divisions, two divisions in Norway and two divisions in Finland. Operations within the business area Construction include new production and renovation as well as construction-related services such as provisions and maintenance. Peab builds all types of residential and commercial properties as well as public venues. Customers are found in both the private and the public sector. CIVIL ENGINEERING The business area Civil Engineering was operated through regional divisions in Sweden, Norway and Finland. Operations within this business area include; construction works, such as ground works, water and sanitation projects; infrastructure, such as road, railway and bridge construction; and maintenance and management of roads, parks and streets. The public sector is the overbearing customer group, although the private sector represents a significant share of the client base as well. INDUSTRY Peab’s third business area, Industry, holds Peab’s industrial operations and was operated through seven divisions during 2013; Asphalt, Concrete, Gravel and Rock, Transport and Machinery, Foundation, Industrial construction and Rental. All of them work on the Nordic construction and civil engineering markets. Customers are mainly the Nordic Construction and Civil engineering companies. Most of the business is generated on the Swedish market. The business is run in a larger number of companies and under a number of different brands. The biggest brands are Swerock, Cliffton, Lambertsson, Skandinaviska Byggelement, Peab Asfalt and Peab Grundläggning. PROPERTY DEVELOPMENT The area of Property Development was operated through two divisions; Development residential properties and Development commercial properties. Operations within this business area include acquisition, development and sale of commercial real estate and rental properties in the Nordic countries. Property development is also responsible for Peab's listed holdings, Associated Companies and Owned companies and projects. CC0.2 Reporting Year Please state the start and end date of the year for which you are reporting data. The current reporting year is the latest/most recent 12-month period for which data is reported. Enter the dates of this year first. We request data for more than one reporting period for some emission accounting questions. Please provide data for the three years prior to the current reporting year if you have not provided this information before, or if this is the first time you have answered a CDP information request. (This does not apply if you have been offered and selected the option of answering the shorter questionnaire). If you are going to provide additional years of data, please give the dates of those reporting periods here. Work backwards from the most recent reporting year. Please enter dates in following format: day(DD)/month(MM)/year(YYYY) (i.e. 31/01/2001). Enter Periods that will be disclosed Tue 01 Jan 2013 - Tue 31 Dec 2013 CC0.3 Country list configuration Please select the countries for which you will be supplying data. This selection will be carried forward to assist you in completing your response. Select country Sweden Finland CC0.4 Currency selection Please select the currency in which you would like to submit your response. All financial information contained in the response should be in this currency. SEK CC0.6 Modules
Transcript of Investor CDP 2014 Information Request - Peab AB · Investor CDP 2014 Information Request Peab AB...

Investor CDP 2014 Information Request - Peab AB
https://www.cdp.net/sites/2014/16/14516/Investor%20CDP%202014/Pages/DisclosureView.aspx[2014-10-17 10:37:05]
Investor CDP 2014 Information RequestPeab AB
Module: Introduction
Page: Introduction
CC0.1IntroductionPlease give a general description and introduction to your organization.
Peab AB is a construction and civil engineering company with headquarters in Förslöv in the south of Sweden. Peab was founded in 1959 and operates in Sweden, Norway and Finland. The company is the third largest construction and civil engineering company in the Nordic region based on turnover. Peab’s vision is to be the Nordic Community Builder and our common view is based on our four core values; Down-to-earth, Developing, Personal and Reliable. During 2013 Peab was divided into four business areas; Construction, Civil Engineering, Industry and Real Estate Development. In 2013, the total assets in Peab amounted to 31 851 MSEK, debts to 24 183 MSEK and the equity to 7 668 MSEK.
CONSTRUCTION Construction is the largest business area in the Group, representing approximately half of the Group’s turnover. The business area Construction is divided into twelve Swedish divisions, two divisions in Norway and two divisions in Finland. Operations within the business area Construction include new production and renovation as well as construction-related services such as provisions and maintenance. Peab builds all types of residential and commercial properties as well as public venues. Customers are found in both the private and the public sector.
CIVIL ENGINEERING The business area Civil Engineering was operated through regional divisions in Sweden, Norway and Finland. Operations within this business area include; construction works, such as ground works, water and sanitation projects; infrastructure, such as road, railway and bridge construction; and maintenance and management of roads, parks and streets. The public sector is the overbearing customer group, although the private sector represents a significant share of the client base as well.
INDUSTRY Peab’s third business area, Industry, holds Peab’s industrial operations and was operated through seven divisions during 2013; Asphalt, Concrete, Gravel and Rock, Transport and Machinery, Foundation, Industrial construction and Rental. All of them work on the Nordic construction and civil engineering markets. Customers are mainly the Nordic Construction and Civil engineering companies. Most of the business is generated on the Swedish market. The business is run in a larger number of companies and under a number of different brands. The biggest brands are Swerock, Cliffton, Lambertsson, Skandinaviska Byggelement, Peab Asfalt and Peab Grundläggning.
PROPERTY DEVELOPMENT The area of Property Development was operated through two divisions; Development residential properties and Development commercial properties. Operations within this business area include acquisition, development and sale of commercial real estate and rental properties in the Nordic countries. Property development is also responsible for Peab's listed holdings, Associated Companies and Owned companies and projects.
CC0.2Reporting YearPlease state the start and end date of the year for which you are reporting data.The current reporting year is the latest/most recent 12-month period for which data is reported. Enter the dates of this year first.We request data for more than one reporting period for some emission accounting questions. Please provide data for the three years prior to the current reporting year if you have not provided this information before, or if this is the first time you have answered a CDP information request. (This does not apply if you have been offered and selected the option of answering the shorter questionnaire). If you are going to provide additional years of data, please give the dates of those reporting periods here. Work backwards from the most recent reporting year.Please enter dates in following format: day(DD)/month(MM)/year(YYYY) (i.e. 31/01/2001).
Enter Periods that will be disclosedTue 01 Jan 2013 - Tue 31 Dec 2013
CC0.3Country list configuration Please select the countries for which you will be supplying data. This selection will be carried forward to assist you in completing your response.
Select countrySwedenFinland
CC0.4Currency selection Please select the currency in which you would like to submit your response. All financial information contained in the response should be in this currency.
SEK
CC0.6Modules

Investor CDP 2014 Information Request - Peab AB
https://www.cdp.net/sites/2014/16/14516/Investor%20CDP%202014/Pages/DisclosureView.aspx[2014-10-17 10:37:05]
As part of the request for information on behalf of investors, electric utilities, companies with electric utility activities or assets, companies in the automobile or auto component manufacture sectors, companies in the oil and gas industry, companies in the information technology and telecommunications sectors and companies in the food, beverage and tobacco sectors should complete supplementary questions in addition to the main questionnaire.If you are in these sectors (according to the Global Industry Classification Standard (GICS)), the corresponding sector modules will not appear below but will automatically appear in the navigation bar when you save this page. If you want to query your classification, please email [email protected] you have not been presented with a sector module that you consider would be appropriate for your company to answer, please select the module below. If you wish to view the questions first, please see https://www.cdp.net/en-US/Programmes/Pages/More-questionnaires.aspx.
Further Information
Module: Management
Page: CC1. Governance
CC1.1Where is the highest level of direct responsibility for climate change within your organization?
Senior Manager/Officer
CC1.1a
Please identify the position of the individual or name of the committee with this responsibility
Jesper Göransson, President and CEO, is responsible for Peab's business, including our climate change impact and performance related to emission reduction activities.
In order to provide the CEO with correct information, Peab has a sustainability organisation at group level in place. Kristina Gabrielii is group Sustainability manager since 2013 reporting directly to the leadership team and heading the new group function CSR-social responsibility in Peab.
To support the leadership team there is a steering council for sustainability issues. The Council includes a representative of executive management in the form of the HR Director. The chair of the Council is Peab’s Head of sustainability, and the other members are the Group Legal Advisor, the Purchasing Manager, the Head of Business Area Construction and the Sustainability Coordinator. The Sustainability Council handles all sustainability issues, such as climate change, and provides the executive management with strategic and operational feedback and actions for group-wide sustainability issues.
CC1.2Do you provide incentives for the management of climate change issues, including the attainment of targets?
Yes
CC1.2aPlease provide further details on the incentives provided for the management of climate change issues
Who is entitled to benefit from
these incentives?
The type of
incentivesIncentivized performance indicator
Board/Executive board
Recognition (non-monetary)
Peab has six Group-wide strategies; minimising electricity usage is relevant for all these strategies and linked to climate change. The indicator is measured yearly.
Corporate executive team
Recognition (non-monetary)
Peab has six Group-wide strategies, minimising electricity usage is relevant for all these strategies and is linked to climate change. The indicator is measured yearly.
Business unit managers
Monetary reward
In Sweden we have introduced financial incentives for managers to choose company cars that have less environmental (climate change) impact. The monetary reward is in the format of reduced environmental tax. In 2013, a vehicle environmental tax was in force of SEK 1,000 per month for cars that emit 136-160 grams/km, SEK 500 per month for cars that emit 121-135 grams/km, while cars that emit 120 grams/km or less do not pay any vehicle environmental tax at all.
Further Information
Page: CC2. Strategy
CC2.1Please select the option that best describes your risk management procedures with regard to climate change risks and opportunities
Integrated into multi-disciplinary company wide risk management processes
CC2.1aPlease provide further details on your risk management procedures with regard to climate change risks and opportunities
Frequency of To whom are results reported Geographical areas How far into the future are risks Comment

Investor CDP 2014 Information Request - Peab AB
https://www.cdp.net/sites/2014/16/14516/Investor%20CDP%202014/Pages/DisclosureView.aspx[2014-10-17 10:37:05]
monitoring considered considered?Six-monthly or more frequently
Individual/Sub-set of the Board or committee appointed by the Board
Sweden, Norway and Finland
> 6 years
CC2.1bPlease describe how your risk and opportunity identification processes are applied at both company and asset level
Identifying risks and opportunities is an integral part of the planning process of every project and carried out by the project management team.
The management team for each Division (Four business asset areas under the company level) carries out an identification of risk- and opportunity with regards to the long-term development of the division’s products and services. The analysis is reported at the division management meetings and are the basis for decisions regarding changes in the products and services provided and how to change processes to avoid risks and seize opportunities.
The results from each Division are passed on to the council for ethics and sustainability whom uses this in the process of risks- and opportunities at Group level. The council for ethics and sustainability presents the identyfied risks and opportunities together with suggestions on strategies on how to prevent risks and benefit from opportunities to the Group Management team. They also have the responsibility to identify macro factors influencing the risks and opportunities for the Group as a whole, such as changes in the legal framework in the operational countries, physical risks etc.
CC2.1cHow do you prioritize the risks and opportunities identified?
The risks and opportunities are prioritized through a risk matrix based on two factors primarily. These are likelyhood of the risk opportunity occuring ie probability and potential impact if it does occur ie consequences (both positive and negative) for the company. The result is then in turn weighed against cost for minimizing the risk and the potential investment in order to profit from an opportunity.
CC2.2Is climate change integrated into your business strategy?
Yes
CC2.2aPlease describe the process of how climate change is integrated into your business strategy and any outcomes of this process
Climate change is a key issue in sustainability which is integrated into Peab's vision and business strategies. Detailed in the following answers.
i) During 2013 internal stakeholder dialogues with employees and board were performed. The results from this show that Energy efficiency, Certified buildings and Transport and emissions are highly rated and hence focus areas and integrated in the short and long term strategies.
ii) Sustainability aspects that influenced Peab's strategy were increased demand from customers, more explicit environmental demands on energy efficiency and emissions in tenders and in regulation and legislation regarding construction.
iii) For example in the short term perspective the strategy has been to replace employee travelling with online meetings and VTC solutions as far as possible.
iv) In the long term perspective one of Peabs most important business strategies is focused on energy efficient buildings and the certifications of these according to several standards, such as LEED and BREEAM.
v) This focus of energy efficient buildings has already resulted in a competetive advantage for Peab, being one of the leading construction companies when it comes to energy efficient buildings.
vi) In order to secure our focus on sustainability and climate change Peab has during the year appointed a Sustainability manager and created a group function responsible for implementing the strategies in the organisation. The second major business decision has been to include and intergrate climate change and sustainabilty in future business targets in the whole Peab group, as part if our new strategy. No target can be in conflict with environmental care or climate change mitigation.
CC2.3Do you engage in activities that could either directly or indirectly influence public policy on climate change through any of the following? (tick all that apply)
Trade associationsFunding research organizationsOther
CC2.3bAre you on the Board of any trade associations or provide funding beyond membership?
Yes
CC2.3cPlease enter the details of those trade associations that are likely to take a position on climate change legislation
Trade association
Is your position
on climate change
consistent with
Please explain the trade association's positionHow have you, or are you
attempting to, influence the position?

Investor CDP 2014 Information Request - Peab AB
https://www.cdp.net/sites/2014/16/14516/Investor%20CDP%202014/Pages/DisclosureView.aspx[2014-10-17 10:37:05]
theirs?
SGBC Consistent
Peab is a member of Sweden Green Building Council (SGBC). SGBC is a member-based organisation that facilitates dialogue between industry and Government to promote greener approaches in the construction sector. Both public and private property owners, consultants, architects, official decision makers, etc. participate at SGCB’s events. Peab is active and member of SBGS's Environmental Construction Committee. The committee is responsible for strategies regarding the management, evaluation and development of the certification system Environment Building. The organisation's goal is to improve the sustainability of buildings. Peab contributes mainly in the area of raising awareness and knowledge level regarding greenhouse gas reducing products and technologies within the construction industry. Through SGBC Peab advocates increased use of greenhouse gas reducing technologies and products in construction.
As policy makers are participating in SGCB’s events, we aim to influence them by raising the knowledge level on technologies available and provide concrete tools such as environmental certification. Our engagement in SGBC is not aimed at expressing endorsement or opposition of a specific action from policy makers, but to promote sustainable building.
NGBC ConsistentPeab is a member of Norway Green Building Council (NGBC). NGBC is a member-based organisation that facilitates dialogue between industry and Government to promote greener approaches in the construction sector.
As policy makers are participating in NGCB’s events, we aim to influence them by raising the knowledge level on technologies available and provide concrete tools such as environmental certification. Our engagement in NGBC is not aimed at expressing endorsement or opposition of a specific action from policy makers, but to promote sustainable building.
FIGBC ConsistentPeab is a member of Finland Green Building Council (FIGBC). FIGBC is a member-based organisation that facilitates dialogue between industry and Government to promote greener approaches in the construction sector.
As policy makers are participating in FIGBC’s events, we aim to influence them by raising the knowledge level on technologies available and provide concrete tools such as environmental certification. Our engagement in FIGBC is not aimed at expressing endorsement or opposition of a specific action from policy makers, but to promote sustainable building.
Swedish Centre for Zero-Energy Buildings
Consistent
The Swedish Centre for Zero-Energy Buildings is a non-profit-making organisation that aims to play an active role in driving and stimulating developments towards low-energy buildings with minimal energy requirements and as far as possible with energy produced in-house.
The aim is to increase knowledge and influence policymakers with regards to zero-energy buildings. This is among other things conducted through cooperation with authorities and as an referral organization to BOVERKET - The Swedish National Board of Housing, Building and Planning
CC2.3dDo you publically disclose a list of all the research organizations that you fund?
Yes
CC2.3eDo you fund any research organizations to produce or disseminate public work on climate change?
Yes
CC2.3fPlease describe the work and how it aligns with your own strategy on climate change
Sveby is a Swedish acronym for "Standardise and verify energy performance in buildings", and is an industry-wide programme that develops tools for agreements on energy utilisation. Peab is involved as a financier and is in the steering group. Green buildings is a focus area for Peab and in the company strategy, since it is very important to standardize this from a competetive perspective.
CC2.3gPlease provide details of the other engagement activities that you undertake
1. Participation in working group “Göteborg 2021”.Method of engagement: As an individual company.Topic of engagement: The project “Göteborg 2021” has a theme called “Green City”.The Green City work is based on the question: ‘How can Gothenburg’s 400th anniversary in year 2021, from an environmental perspective, make an international footprint for the future?’Nature of engagement: Participation in the Green City working group.

Investor CDP 2014 Information Request - Peab AB
https://www.cdp.net/sites/2014/16/14516/Investor%20CDP%202014/Pages/DisclosureView.aspx[2014-10-17 10:37:05]
Actions advocated: Through providing public policy and decision makers with concrete information and suggestions, we are endorsing any coming actions and/or legislations regarding reducing the greenhouse gas emissions of the City of Gothenburg.
2. Byggvarubedömning is a system that performs assessments of building products from a life cycle perspective. Peab holds a position on the Board and is responsible for the system's criteria group.
3. The Development Fund of the Swedish Construction Industry (SBUF) is the construction industry's own organisation for research and development, with almost 5000 affiliated companies in Sweden. SBUF strives to develop the construction process in order to create better commercial conditions for contractors and fitters to make use of research and to drive development work. Peab is a member in the Board and a couple of the committees.
4. The Swedish Centre for Innovation and Quality in the Built Environment is a node and a catalyst for research, innovation and quality development in the building of communities. Peab is represented with a Board member andthe Chair of the communication committee.
CC2.3hWhat processes do you have in place to ensure that all of your direct and indirect activities that influence policy are consistent with your overall climate change strategy?
The Sustainability manager in cooperation with the Leadership team ensures that the decided commitments are aligned with Peab's strategies. To ensure that all employees act to our environmental approach and strategy, we have our environmental policy.
Further Information
Page: CC3. Targets and Initiatives
CC3.1Did you have an emissions reduction target that was active (ongoing or reached completion) in the reporting year?
No
CC3.1ePlease explain (i) why you do not have a target; and (ii) forecast how your emissions will change over the next five years
(i) Peab is working to reduce our usage of energy throughout the organisation and have an environmental policy that harmonizes with UN Global Compact and ISO 14001. During 2013, Peab conducted an organisational restructure of our construction unit. As a result we decided to develop and implement sustainable business targets instead of separate sustainability targets. With sustainable business targets we believe that it becomes clear that sustainability in Peab is directly linked to our business operations and therefore profitability. The targets will be set by Peab's business areas respectively during the forthcoming years.
(ii) we expect our absolute CO2 emissions will increase during the coming five years, as we are expanding our operations and growing as a company. Looking at the previous five years, our turnover has increased with 24 %. Assuming a similar development for the five years to come, we could expect emissions to increase with the same percentage. However, as we are focusing on producing green buildings and continuously implement energy reduction initiatives, we expect our emissions to decrease in relation to our turnover with 5 %.
CC3.2Does the use of your goods and/or services directly enable GHG emissions to be avoided by a third party?
Yes
CC3.2aPlease provide details of how the use of your goods and/or services directly enable GHG emissions to be avoided by a third party
i) How emissions are avoided by a third party Peab reduces GHG emissions (Scope 1 and 2) for the customers by constructing energy efficient buildings, certified in accordance with Energimerke, Green Building, Miljöbyggnad, BREEAM, BREEAM communities and/or LEED. These buildings consume less energy than the vast majority of existing buildings.
ii) Estimation of avoided emissions.During 2013 Peab completed 10 certified projects and had 48 on-going projects. To give an estimation of avoided emissions over time for a single building, we compare the energy saved from one energy efficient commercial building of 1000 square meters compared to a standard energy commercial building of the same size. The estimated amount of GHG emissions avoided for the case above is approximately 34.85 metric tonnes CO2 over a ten-year period.
iii) Methodology and assumptions.In the comparison, we used the certification standard Energimerke as a benchmark. Energimerke certifies apartments buildings on a scale from A to G, where buildings qualifying for an A-level consume the least amount of energy and buildings marked with a ‘G’ consumes the most energy. According to Energimerkning (www.energimerkning.no), the vast majority of existing buildings will have grades between D (215 kWh per square meter) to G (no limit of kWh per square meter). In order to not make a too positive estimation, we compare an industry building built by Peab that receives an A-level energy certification to an equivalent D-level energy building as the norm. We assume both buildings are located in Sweden.
The Peab building: An energy A-level commercial building can require a maximum of 85 kWh per square feet per year. A fictive A-level commercial building of 1000 square feet would thus consume 85,000 kWh per year an 850,000 kWh during ten years.
The comparison building: The norm building, that we assume have a D-level energy consumption, can consume a maximum of 215 kWh per square feet per year. The comparison commercial building of 1000 square feet would thus consume 215,000 kWh per year and 2,150,000 kWh during ten years.Energy saved and GHG emissions avoided: Comparing the energy consumption of the two fictive buildings shows that the A-level building consumes 1,300,000 kWh less energy during the ten-year period. Using IAE’s emission factor of 41, representing the average CO2 emissions in gram per kWh from electricity and heat generation for Sweden between years 2007-2009, we receive the estimated emission saving of 53,300,000 gram CO2 or 53,3 metric

Investor CDP 2014 Information Request - Peab AB
https://www.cdp.net/sites/2014/16/14516/Investor%20CDP%202014/Pages/DisclosureView.aspx[2014-10-17 10:37:05]
tonnes CO2.
Source emission factor: International Energy Agency, CO2 Emissions from fuel combustion highlights, 2011 edition, p109 (Average CO2 emissions per kWh from electricity and heat generation for Sweden between years 2007-2009).
iv) Considering generating CERs or ERUs within the framework of CDM or JI.We have not considered these mechanisms.
CC3.3Did you have emissions reduction initiatives that were active within the reporting year (this can include those in the planning and implementation phases)
Yes
CC3.3aPlease identify the total number of projects at each stage of development, and for those in the implementation stages, the estimated CO2e savings
Stage of development Number of projects Total estimated annual CO2e savings in metric tonnes CO2e (only for rows marked *)Under investigationTo be implemented*Implementation commenced* 3 20591Implemented*Not to be implemented
CC3.3bFor those initiatives implemented in the reporting year, please provide details in the table below
Activity type
Description of activity
Estimated annual CO2e
savings (metric tonnes CO2e)
Annual monetary savings
(unit currency
- as specified
in CC0.4)
Investment required
(unit currency -
as specified in CC0.4)
Payback period
Estimated lifetime of the
initiative, years
Comment
Transportation: use
Peab is committed to reducing CO2 emissions from travel, which is part of our scope 1 and scope 3 emissions. We are developing an online portal for meetings and travel booking to continue reducing our emissions and to make the choices accessible for all employees. This is a voluntary initiative that we plan on running long-term as an integrated part of our operations. All employees are encouraged to use video conferences and online meetings to reduce our business travelling. During 2013 8081.9 hours of video conferencing and 26788 online meetings were held.
293 1365134 200000 <1 year 5 years
Process emissions reductions
Over the last ten years Peab Asphalt has worked intensively to develop asphalt with a lower environmental impact that is energy efficient to manufacture. Achieving this has made it possible to improve the quality of the finished pavement, lower working temperatures even more and increase recycling. Lowering the paving temperature by around 30 degrees reduces energy consumption by 20% (scope 2), CO2 emissions by 30% as well as fuel gases (Scope1) and dust particles. This is a voluntary
0 0 0 <1 year 8 years
The invest required is 0 sek as there are no costs directly related to lowering temperature more than an unknown addition to work hours but these are not lost rather more efficiently used at sites. There are no monetary savings as this is a strictly emission reduction initiative

Investor CDP 2014 Information Request - Peab AB
https://www.cdp.net/sites/2014/16/14516/Investor%20CDP%202014/Pages/DisclosureView.aspx[2014-10-17 10:37:05]
initiative that we plan on running until the majority of the asphalt is low temperature.
that keeps the same direct costs. Energy consumption is reduced but not calculated in currency directly for each paving site as this would be a very ineffectiv use of labour. Payback period is immediate.
Transportation: use
Peab is actively introducing new fuel types to reduce its emissions from transportation. By changing fuel in our machines on construction sites from diesel to evolution diesel containing a large fraction of pine oil, we approximately reduced our CO2 emissions by 13.1 tonnes per machine. This is a voluntary project and part of our scope 1 emissions.
11554 3385998 139940000>25 years
5-10 years
CC3.3cWhat methods do you use to drive investment in emissions reduction activities?
Method Comment
Compliance with regulatory requirements/standardsDedicated budget for energy efficiencyDedicated budget for low carbon product R&DDedicated budget for other emissions reduction activitiesEmployee engagementInternal incentives/recognition programs
Further Information
Page: CC4. Communication
CC4.1Have you published information about your organization’s response to climate change and GHG emissions performance for this reporting year in places other than in your CDP response? If so, please attach the publication(s)
PublicationPage/Section
reference
Attach the document
In voluntary communications (complete)
pp. 1-5, 10-12, 20-24, 28
https://www.cdp.net/sites/2014/16/14516/Investor CDP 2014/Shared Documents/Attachments/CC4.1/Peab Sustainability-report-2013.pdf
Further Information
Module: Risks and Opportunities
Page: CC5. Climate Change Risks
CC5.1Have you identified any climate change risks that have the potential to generate a substantive change in your business operations, revenue or expenditure? Tick all that apply
Risks driven by changes in regulationRisks driven by changes in physical climate parametersRisks driven by changes in other climate-related developments
CC5.1aPlease describe your risks driven by changes in regulation

Investor CDP 2014 Information Request - Peab AB
https://www.cdp.net/sites/2014/16/14516/Investor%20CDP%202014/Pages/DisclosureView.aspx[2014-10-17 10:37:05]
Risk driver Description Potential impact
Timeframe
Direct/Indirect
Likelihood
Magnitude of impact
Estimated financial
implications
Management method
Cost of management
Carbon taxes
There are imposed full carbon taxes paid in transport, space heating, and non-combined heat and power generation. Peab could experience the risk of increased carbon taxation. The risk of the Swedish governement continuous to increase the already existing carbon taxes and including further sectors in order to meet set national emission targets.
Increased operational cost
1 to 3 years
Direct Very likelyMedium-high
The risk is related to increased operational costs as prices on raw material will increase relevant to the tax level. It will also give an increase in taxation of 1.08 SEK/kg emitted CO2.
Identifying risks is an integral part of the planning process of every project and carried out by the project management team. The management team for each division carries out an identification of risk with regards to the long-term development of the division’s products and services. The analysis is reported at the division management meetings and are the basis for activities regarding changes in the products and services. Our action are limited tio understanding and calculting cost we do not alter the magnitude of have influence on authorities in a greater scale. The results from each division are passed on to the council for ethics and sustainability whom presents the identified risks together with suggested actions and strategies on how to prevent risks to the Group Management team. The actions on taxtation have a timeframe of 3 years.
Risk assessment and management of carbon taxes is included in the annual financial budget. The scale is estimated to 0 - 5% correlated to 1.08 SEK/kg emitted CO2. The incurrance is for 3 years.
Identifying

Investor CDP 2014 Information Request - Peab AB
https://www.cdp.net/sites/2014/16/14516/Investor%20CDP%202014/Pages/DisclosureView.aspx[2014-10-17 10:37:05]
Product efficiency regulations and standards
Regulations or standards that require specific efficiency in the production, which is the Directive 2002/91/EC, Energy Efficiency in Buildings: Peab needs to take the EU Building directives into account into their daily operations.
Increased operational cost
Up to 1 year
Direct Very likely High
Product efficiency requirements are continuous in our product assortment. Sales of these products increase quarterly. Sales are estimated to rise in relevant categories with 15%.
risks related to energy efficiency is an integral part of the planning process of every project and carried out by the project management team before construction. A major action for Peab is participation in trade organisations and councils to promote energy efficient buildings and developments. The management team for each division carries out an identification of risk with regards to the long-term development of the division’s products. The analysis is reported at the division management meetings and are the basis for decisions regarding changes in buildings. The results from each project are passed on to the council for ethics and sustainability whom uses this in the process of risks at Group level. The council for ethics and sustainability presents the identified risks with suggested actions on strategies on how to prevent risks presented to the Group Management team.
Efficiency efforts and alterations to products are included in the research and development budget. The incurrance is 1 - 3 years depending on project. The increase over the next 5 years is predicted to stay equal to today with a +/-5% in assets.
Identifying risks is an
Investor CDP 2014 Information Request - Peab AB
https://www.cdp.net/sites/2014/16/14516/Investor%20CDP%202014/Pages/DisclosureView.aspx[2014-10-17 10:37:05]
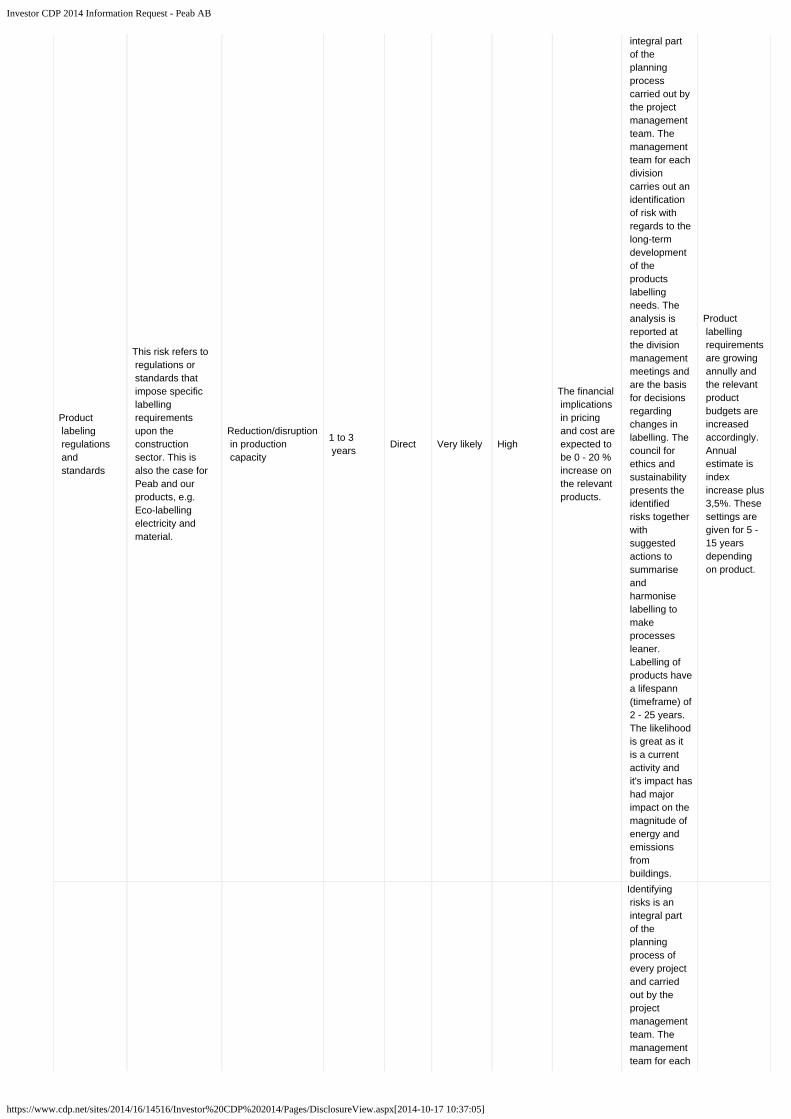
Product labeling regulations and standards
This risk refers to regulations or standards that impose specific labelling requirements upon the construction sector. This is also the case for Peab and our products, e.g. Eco-labelling electricity and material.
Reduction/disruption in production capacity
1 to 3 years
Direct Very likely High
The financial implications in pricing and cost are expected to be 0 - 20 % increase on the relevant products.
integral part of the planning process carried out by the project management team. The management team for each division carries out an identification of risk with regards to the long-term development of the products labelling needs. The analysis is reported at the division management meetings and are the basis for decisions regarding changes in labelling. The council for ethics and sustainability presents the identified risks together with suggested actions to summarise and harmonise labelling to make processes leaner. Labelling of products have a lifespann (timeframe) of 2 - 25 years. The likelihood is great as it is a current activity and it's impact has had major impact on the magnitude of energy and emissions from buildings.
Product labelling requirements are growing annully and the relevant product budgets are increased accordingly. Annual estimate is index increase plus 3,5%. These settings are given for 5 - 15 years depending on product.
Identifying risks is an integral part of the planning process of every project and carried out by the project management team. The management team for each

Investor CDP 2014 Information Request - Peab AB
https://www.cdp.net/sites/2014/16/14516/Investor%20CDP%202014/Pages/DisclosureView.aspx[2014-10-17 10:37:05]
General environmental regulations, including planning
Wider imposed regulations upon the construction sector. It directly affects Peab’s daily operations and use of products/materials. In order to minimize such risk Peab is following different methods, e.g. via the Building declaration, The Swedish Environmental Protection Law and by doing Environmental impact assessments (EIA) at construction sites.
Reduced demand for goods/services
3 to 6 years
Direct LikelyMedium-high
Financial implication unknown set by regulating body.
division carries out an identification of risk with regards to the long-term development of the division’s products and services. The analysis is reported at the division management meetings and are the basis for decisions regarding changes in the products and services provided and how to change processes to avoid risks. The results from each division are passed on to the council for ethics and sustainability whom uses this in the process of risks at Group level. The council for ethics and sustainability presents the identified risks together with suggestions on strategies on how to prevent risks to the Group Management team.
Costs related to regulations are taken and budgetised when passed or announced on a bi-annual basis due to Swedish legislative changes.
Cap and trade schemes
Many of Peabs main suppliers ie cement, steel and energy are subject to The European Union Emission Trading System. There is a risk that these suppliers pass on part of the increased costs on the price of their products.
Increased operational cost
1 to 3 years
Indirect (Supply chain)
Likely Medium
The expected cap and trade schemes financial cost is expected to be 1.08 SEK/kg emitted CO2 in taxation.
Identifying taxation risks is an integral part of the the group management on financial strategy and business management. The council for ethics and sustainability presents identified risks regarding environmental regulation, taxation and related matters to the general counsel and CFO together
Risk assessment and management of carbon taxes is included in the annual financial budget. The scale is estimated to 0 - 5% correlated to 1.08 SEK/kg emitted CO2. The

Investor CDP 2014 Information Request - Peab AB
https://www.cdp.net/sites/2014/16/14516/Investor%20CDP%202014/Pages/DisclosureView.aspx[2014-10-17 10:37:05]
with suggestions on strategies on how to prevent risks to be dicussed in the Group Management team.
incurrance is for 3 years.
Emission reporting obligations
European Union has decided that large companies (>500 employees) shall report on sustainability including CO2 emissions. This is the first step towards regulating an increased transparency. This reporting obligation might be widened in the future, which will mean an increased work-load regarding both collecting, verifying and communicating data.
Increased operational cost
1 to 3 years
Direct Likely Low
Peab currently has extensive reporting and forsees the current level to be sufficient with an increase in resources with 25% to meet KPI data collection needs.
The management team for each division carries out an identification of risk with regards to the compilation of KPIs and qualitative data. The data and disclosure is reported at the division management meetings and are the basis for decisions regarding changes in reporting. The results from each division are passed on to the council for ethics and sustainability whom uses this in the process of risks at Group level. The sustainability manager with team evaluates all in-data and compiles all annual sustainability reports and assess further needs on improvement which is quarterly reported to the council. Peabs reporting may have an impact on the environmental impact and awareness within our sector and may push environmental concious behaviour in a positive direction with customers and suppliers.
The management costs are included in the annual sustainability expenditure budget. This budget is expected to increase over the next 3 years with 25%.

Investor CDP 2014 Information Request - Peab AB
https://www.cdp.net/sites/2014/16/14516/Investor%20CDP%202014/Pages/DisclosureView.aspx[2014-10-17 10:37:05]
CC5.1bPlease describe your risks that are driven by change in physical climate parameters
Risk driver Description Potential impact Timeframe Direct/
IndirectLikelihood
Magnitude of impact
Estimated financial
implications
Management method
Cost of management
Change in mean (average) precipitation
Heavy rains in the Nordic region, especially in the South of Sweden and Denmark. Such incident could directly harm the quality of Peab’s buildings or other construction made by Peab. Warmer temperature will increase the amount of precipitation in the form of rain instead of snow.
Increased operational cost
1 to 3 years
DirectVirtually certain
Medium-high
There is an increased awareness for precipitation risks that has increased each building and construction site with cost of 5 - 50%.
Identifying risks is an integral part of the planning process of every project and carried out by the project management team. The management team for each division carries out an identification of risk with regards to the long-term development of the division’s products and services. The analysis is reported at the division management meetings and are the basis for decisions regarding changes in the products and services provided and how to change processes to avoid risks. The results from each division are passed on to the council for ethics and sustainability whom uses this in the process of detremining actions for risks at Group level. The council for ethics and sustainability presents the identified risks together with suggested actions on strategies to the Group Management team. The information actions disseminated to employees and customers have not impacted nor lessened the risk but only given methods to mitigate effect on our products. The risk is constant from now and forward
Information costs to employees and customers are included in prespective annual budgets. The incurrance is 1 - 20 years.

Investor CDP 2014 Information Request - Peab AB
https://www.cdp.net/sites/2014/16/14516/Investor%20CDP%202014/Pages/DisclosureView.aspx[2014-10-17 10:37:05]
only expected to increase in the coming 20 years.
Snow and ice
Extremely harsh and cold winters the last years in Northern Europe. Such incident could directly harm the quality of Peab’s buildings or other construction made by Peab. It could also hinder builders and constructors to reach the building sites and delay Peab’s work. The average temperature becomes colder. This influences the energy consumption for heating for Peab. In other words, it increased the variable costs of the company.
Increased operational cost
1 to 3 years
DirectVirtually certain
High
Colder and longer winters delay construction work, increase heating needs and general material consumtion alongside efffecting work load. The financial cost are too complex to simply calculate but in each area effected a leeway of +/-10% is an expected minimum.
Identifying risks is an integral part of the planning process carried out by the project management team. The management team for each division carries out an identification of risk with regards to the short-tem development of the projects impact from snow. The analysis is reported at the division management meetings and are the basis for decisions regarding changes in the products and services contracted and how to change processes to mitigate risks. The assessment of costs is made seasonely and has immediate impact on the likelihood to deliver a contract. It does not change the magnitude of the prevelance of the risk, it only minimises impact on customer.
Unknown mangement cost as they may over a year level out between delays of work in winter and a rise in summer. Giving a quarterly fluctuation in 100% per project but a 0% change in annual budget.
Change in precipitation pattern
Change in precipation patterns may undermine the ground and increase land slides, which will exclude possible building sites. It would also give a risk of disruption to operations due to severe weather events e.g. flooding, which could suspend work on site
Inability to do business
3 to 6 years
Direct Very likelyLow-medium
Unknown as this would force Peab to recalculate large parts of operations in total.
The council for ethics and sustainability would present any new finding on a macro level related to identyfied great risks together with suggested actions on strategies on how to prevent total closure risks to the Group Management team. Not calculated on a timeframe. Does not change the magnitude of the risk.
Ongoing in risk process.
CC5.1cPlease describe your risks that are driven by changes in other climate-related developments

Investor CDP 2014 Information Request - Peab AB
https://www.cdp.net/sites/2014/16/14516/Investor%20CDP%202014/Pages/DisclosureView.aspx[2014-10-17 10:37:05]
Risk driver Description
Potential impact
Timeframe
Direct/Indirect
Likelihood
Magnitude of impact
Estimated Financial
Implications
Management method
Cost of management
Reputation
Increased negative perception from customers if Peab does not take it's environmental responsibility and harms eco-systems adjacent to construction sites.
Reduced demand for goods/services
3 to 6 years
Direct Very likely High
If not awareness and delivery on our environmental profile is maintained it could mean a loss of public tenders with 100% as this is a mandatory demand.
Identifying reputational risks is an integral part of the marketing departments operations. Monthly the management team for each division carries out an identification of reputational risk with regards to the division’s products and services. This is reported at the division management meetings and are the basis for the information managers decisions regarding changes in the external environmental information and sustainability communication. Main activities include knowledge to customers how to change processes to avoid risks and minimise environmental impact from use of products. The impact is great on emission from buildings and construction sites giving a low but important change on the magnitude of reputational risk.
Estimated reputational damage is mitigated via increased environmental product information to employees and customer. This is a part of our annual marketing budget. Expected to increase parallell with our sustainability expenditure budget with 25 % over 3 years.
Climate change impacts and predictions induce changes in consumers’ habits and
If not delivery on our environmental requirements is maintained
Identifying risks is an integral part of the sales and tender process carried out by the project management team. The management team for each division carries out an identification of environmental impact and risks with regards to the products and services offered. The analysis is
Increased environmental product demand is from our customers. The

Investor CDP 2014 Information Request - Peab AB
https://www.cdp.net/sites/2014/16/14516/Investor%20CDP%202014/Pages/DisclosureView.aspx[2014-10-17 10:37:05]
Changing consumer behaviour
behaviour giving a preferences for environmental buildings with a reduced carbon footprint. Peab has a risk in not being able to keep up with the demand of these products or fullfilling demands in tenders.
Reduced demand for goods/services
3 to 6 years
Direct Likely High
it could mean a loss of public tenders with 100% as this is a mandatory demand and give a sliding loss in market position for private sector customers.
reported at the division management meetings and are the basis for decisions regarding changes in the processes to avoid risks and mitigate environmental impact. The magnitude of the risk is enourmous as environmental care and risk assessment is mandatory in all public tenders and has likelihood to impact our finances for the next 25 years as in longer construction projects.
management costs of this is part of our annual marketing budget. Expected to increase parallell with our sustainability expenditure budget with 25 % over 3 years.
Further Information
Page: CC6. Climate Change Opportunities
CC6.1Have you identified any climate change opportunities that have the potential to generate a substantive change in your business operations, revenue or expenditure? Tick all that apply
Opportunities driven by changes in regulationOpportunities driven by changes in physical climate parametersOpportunities driven by changes in other climate-related developments
CC6.1aPlease describe your opportunities that are driven by changes in regulation
Opportunity driver Description Potential impact Timeframe Direct/Indirect Likelihood Magnitude
of impact
Estimated financial
implications
Management method
Cost of management
Product efficiency regulations increase our suppliers' work with eco-design (use of raw materials, energy consumption, product durability) which would
Peabs energy procurement cost are expected to
Identifying opportunities related to cost reductions is an integral part of the planning process of every project and carried out by procurement team with the project management. The possibilities to minimise energy purchasing are the basis for activities regarding changes in the products and services production. The results from each project are passed on to the
The annual cost to harmonise with regulations and alter processess to proceed development

Investor CDP 2014 Information Request - Peab AB
https://www.cdp.net/sites/2014/16/14516/Investor%20CDP%202014/Pages/DisclosureView.aspx[2014-10-17 10:37:05]
Product efficiency regulations and standards
in turn decrease costs for procurement and give us a higher profitability. Regulations or standards that require specific efficiency in the production, will increase the demand of energy efficient buildings where Peab has a strong market position.
Reduced operational costs
1 to 3 years
DirectVirtually certain
High
decrease in line with increased energy efficiency requirements. Current level is at 2-3% annually based on energy authorities own calculations.
council for ethics and sustainability whom presents the identified opportunities together with taken or planned ( regarding major investments) actions and strategies to the Group Management team. All opportunities of energy efficiency and procurement alteration or product development have great impact/magnitude on operations and sales. The likelihood of several opportunities is predominant. The activities are current and are expected to increase over the next 20 years.
is included in the reasearch and development budget if required or generally in the relevant Division's budget. The cost for management is expected to increase over the coming years.
Product labeling regulations and standards
Environmental labelling requirements increase the awareness for Peabs energy efficient and eco designed products and services. In this field Peab has a strong market position expected to become stronger.
Increased demand for existing products/services
1 to 3 years
DirectVirtually certain
High
Peab expects to have greater revenue from sales than the costs associated with labelling requirements. Sales increase could be expected to be 10% annually from todays strong market position.
Identifying opportunities related to cost reductions is an integral part of the planning process of every project and carried out by the project management. The results from each labelling project are passed on to the council for ethics and sustainability whom presents the identified opportunities and benefits from new labellings together with taken or planned ( regarding major investments) actions and strategies to the Group Management team. All opportunities to clarify and enhance communication of the benefits of our environmental friendly products and services
The are no expected new costs related to the management of labelling as this is an integrated part of the current product and service development process today. All costs are annual and a part of the relevant budget. These budgets are set for 1-3 years.

Investor CDP 2014 Information Request - Peab AB
https://www.cdp.net/sites/2014/16/14516/Investor%20CDP%202014/Pages/DisclosureView.aspx[2014-10-17 10:37:05]
have great impact (magnitude) on operations and sales. The likelihood of several opportunities is predominant. The activities are current and are expected to increase over the next 20 years.
CC6.1bPlease describe the opportunities that are driven by changes in physical climate parameters
Opportunity driver
Description Potential impact Timeframe
Direct/ Indirect
Likelihood
Magnitude of impact
Estimated financial
implications
Management method
Cost of management
Change in mean (average) precipitation
Heavy rains, especially in the South of Sweden: increased demand in sustainable building material and products e.g. Peab's environmental classified buildings.
Increased demand for existing products/services
1 to 3 years
Direct Very likely High
Sales are expected to increase with 0,45 - 2% annually directly related to environmental products and services.
Sales related to new products and services with specific relation to energy efficient and green buildings and precipitation is carried out by the sales project management. The results from project are passed on to the council for ethics and sustainability whom presents the identified opportunities and benefits together with actions and strategies to the Group Management team. All sales have great impact (magnitude) on operations and profit. The likelihood of several opportunities related to precipitation is very probable. The activities are current and are expected to increase over the next 20 years.
There are no expected new costs related sales of environmental products and services as this is an integrated part of the current product and service development process today. All costs are annual and a part of the relevant budget. These budgets are set for 1-3 years.
Sales related to new products and services with specific

Investor CDP 2014 Information Request - Peab AB
https://www.cdp.net/sites/2014/16/14516/Investor%20CDP%202014/Pages/DisclosureView.aspx[2014-10-17 10:37:05]
Change in mean (average) temperature
Extremely harsh and cold winters the last years in Northern Europe. This has given an increased demand in energy efficient buildings.
Increased demand for existing products/services
1 to 3 years
Direct Very likely High
Sales are expected to increase with 0,45 - 2% annually directly related to environmental products and services. Several of these products and services will be newly developed to meet customer demands and climate change situations.
relation to energy efficient and green buildings and precipitation is carried out by the sales project management. The results from project are passed on to the council for ethics and sustainability whom presents the identified opportunities and benefits together with actions and strategies to the Group Management team. All sales have great impact (magnitude) on operations and profit. The likelihood of several opportunities related to energy and heating is very probable. The activities are current and are expected to increase over the next 20 years.
The are no expected new costs related sales of energy and heating products and services as this is an integrated part of the current product and service development process today. All costs are annual and a part of the relevant budget. These budgets are set for 1-3 years.
CC6.1cPlease describe the opportunities that are driven by changes in other climate-related developments
Opportunity driver
Description Potential impact Timeframe
Direct/ Indirect
Likelihood
Magnitude of impact
Estimated financial
implications
Management method
Cost of management
The sustainability efforts and focused creation of eco-designed, energy efficient and sustainably sourced materials has increased the positive perception of Peab from suppliers, designated
Sales are expected to increase with 0,45 - 2% annually directly related to environmental products and services.
Sales related to new products and services with specific relation to energy efficient and green buildings and precipation is carried out by the sales project management. The results from project are passed on to the council for ethics and sustainability whom presents the identified opportunities
The are no expected new costs related to sales or process. All these costs are annual and a part of the relevant budget. These budgets are set for 1-3 years. The

Investor CDP 2014 Information Request - Peab AB
https://www.cdp.net/sites/2014/16/14516/Investor%20CDP%202014/Pages/DisclosureView.aspx[2014-10-17 10:37:05]
Reputation customers, employees and society in general. This has lead to increased demand for Peab products and services. Peab will continue to invest into sustainable products to meet the expectation and demands from Peab’s current and future clients.
Increased demand for existing products/services
1 to 3 years
Direct Very likely High Further maintaining of strong market position related to good brand reputation is expected to keep sales at a 5% increase annually.
and benefits together with actions and strategies to the Group Management team. All sales have great impact (magnitude) on operations and profit. The likelihood of several opportunities related to energy and heating is very probable. The activities are current and are expected to increase over the next 20 years.
sustainability expenditure budget will most probably increase with 25% over the coming 5 years due to external requirements and this will give room to manage increased demands from customers.
Changing consumer behaviour
Climate change impacts and predictions induces changes in consumer’s habits and behaviour. There has become a preference for environmental buildings with a reduced carbon footprint. This opportunity is increasingly important for Peab as consumers demand more sustainable products/services.
New products/business services
1 to 3 years
Direct Likely High
Sales are expected to increase with 0,45 - 2% annually directly related demand from customers on environmental products and services that meet the needs detected due
Management of our strong and trustworthy brand with specific relation to environmental buildings and sustainability is carried out by the marketing department and the sustainability department. The sustainability manager gives input to the council and group management after the following process: They receive input from the planning process of every project which is then carried out by the project management team. The management team for each division carries out an identification of opportunities with regards to the long-term
The are no expected new costs related to marketing or process. All these costs are annual and a part of the relevant budget. These budgets are set for 1-3 years. The sustainability expenditure budget will most probabely increase with 25% over the

Investor CDP 2014 Information Request - Peab AB
https://www.cdp.net/sites/2014/16/14516/Investor%20CDP%202014/Pages/DisclosureView.aspx[2014-10-17 10:37:05]
Peab invests in proactive work with sustainable services in order to adjust to changing consumer behaviour.
to cliamte change.
development of the division’s products and services. The analysis is reported at the division management meetings and are the basis for activities regarding changes in the products and services. The results from each division are passed on to the council for ethics and sustainability whom presents the identified opportunities together with suggested actions and strategies on how to seize opportunities to the Group Management team.
coming 5 years due to external requiremnts and this will give room to maintain increased brand management.
Further Information
Module: GHG Emissions Accounting, Energy and Fuel Use, and Trading
Page: CC7. Emissions Methodology
CC7.1Please provide your base year and base year emissions (Scopes 1 and 2)
Base year Scope 1 Base year emissions (metric tonnes CO2e) Scope 2 Base year emissions (metric tonnes CO2e)Sat 01 Jan 2011 - Sat 31 Dec 2011 111935 5535
CC7.2Please give the name of the standard, protocol or methodology you have used to collect activity data and calculate Scope 1 and Scope 2 emissions
Please select the published methodologies that you useThe Greenhouse Gas Protocol: A Corporate Accounting and Reporting Standard (Revised Edition)
CC7.2aIf you have selected "Other" in CC7.2 please provide details of the standard, protocol or methodology you have used to collect activity data and calculate Scope 1 and Scope 2 emissions
CC7.3Please give the source for the global warming potentials you have used
Gas ReferenceCO2 IPCC Fourth Assessment Report (AR4 - 100 year)
CC7.4Please give the emissions factors you have applied and their origin; alternatively, please attach an Excel spreadsheet with this data at the bottom of this page
Fuel/Material/Energy Emission Factor Unit Reference
Crude oil 2.66 kg CO2e per liter Swedish Petroleum and Biofuel institute (SPBI), emission factor E1Diesel/Gas oil 2.68 kg CO2 per liter World Resources Institute (2008). GHG Protocol tool for stationary combustionOther: Diesel FAME 5% 2.41 kg CO2 per liter Swedish Petroleum and Biofuel institute (SPBI)

Investor CDP 2014 Information Request - Peab AB
https://www.cdp.net/sites/2014/16/14516/Investor%20CDP%202014/Pages/DisclosureView.aspx[2014-10-17 10:37:05]
Other: Ethanol, E85 4.73Other: kg/US gallon
World Resources Institute (2008). GHG Protocol tool for mobile combustion
Motor gasoline 8.81Other: kg/US gallon
World Resources Institute (2008). GHG Protocol tool for mobile combustion
Electricity 258.28 kg CO2 per MWh Swedish Energy Markets InspectoratesElectricity 9.67 kg CO2 per MWh Vattenfall (Peab's Electricity provider)Other: District heating Sweden
93.1 kg CO2 per MWh Swedish Energy Markets Inspectorates
Other: District heating Finland 191 kg CO2 per MWh IEA Publication "CO2 emissions from fuel combustion highlights (2013 edition)Other: evolution diesel 2.4 kg CO2e per liter Preem publication "Climate performance of Preem's fuel products"
Further Information
Page: CC8. Emissions Data - (1 Jan 2013 - 31 Dec 2013)
CC8.1Please select the boundary you are using for your Scope 1 and 2 greenhouse gas inventory
Operational control
CC8.2Please provide your gross global Scope 1 emissions figures in metric tonnes CO2e
122761.8
CC8.3Please provide your gross global Scope 2 emissions figures in metric tonnes CO2e
41468.5
CC8.4Are there are any sources (e.g. facilities, specific GHGs, activities, geographies, etc.) of Scope 1 and Scope 2 emissions that are within your selected reporting boundary which are not included in your disclosure?
Yes
CC8.4aPlease provide details of the sources of Scope 1 and Scope 2 emissions that are within your selected reporting boundary which are not included in your disclosure
Source
Relevance of Scope 1
emissions from this source
Relevance of Scope 2
emissions excluded from
this source
Explain why the source is excluded
NorwayEmissions are relevant but not yet calculated
Emissions are relevant but not yet calculated
We do not have a proper data collecting system in place for emission data in Norway. We are currently reviewing our data collection practices to include our Norwegian operations in future CDP reports. Due to a large restructuring of the Norwegian offices during 2013 this process has been postponed.
CC8.5Please estimate the level of uncertainty of the total gross global Scope 1 and 2 emissions figures that you have supplied and specify the sources of uncertainty in your data gathering, handling and calculations
Scope 1 emissions: Uncertainty
range
Scope 1 emissions:
Main sources of uncertainty
Scope 1 emissions: Please expand on the
uncertainty in your data
Scope 2 emissions: Uncertainty
range
Scope 2 emissions:
Main sources of uncertainty
Scope 2 emissions: Please expand on the uncertainty in your data
More than 30% but less than or equal to 40%
AssumptionsMetering/ Measurement Constraints
The main sources of uncertainty are accuracy of measurement of fuel consumption data and the use of public emission factors.
More than 10% but less than or equal to 20%
Metering/ Measurement ConstraintsData ManagementOther: emission factors
The use of public emission factors gives a level of uncertainty. The emissions for Swedish electricity consumption are provided directly from our supplier. However, the Finnish emissions of electricity is an internal estimation thus not as accurate as the information provided for Sweden.
CC8.6Please indicate the verification/assurance status that applies to your reported Scope 1 emissions
Third party verification or assurance complete

Investor CDP 2014 Information Request - Peab AB
https://www.cdp.net/sites/2014/16/14516/Investor%20CDP%202014/Pages/DisclosureView.aspx[2014-10-17 10:37:05]
CC8.6aPlease provide further details of the verification/assurance undertaken for your Scope 1 emissions, and attach the relevant statements
Type of verification or
assuranceAttach the statement Page/section
referenceRelevant standard
Proportion of reported Scope 1 emissions
verified (%)Moderate assurance
https://www.cdp.net/sites/2014/16/14516/Investor CDP 2014/Shared Documents/Attachments/CC8.6a/Verification Peab CDP 2013.pdf
p.1 and 2 AA1000AS 100
CC8.7Please indicate the verification/assurance status that applies to your reported Scope 2 emissions
Third party verification or assurance complete
CC8.7aPlease provide further details of the verification/assurance undertaken for your Scope 2 emissions, and attach the relevant statements
Type of verification or
assuranceAttach the statement Page/Section
referenceRelevant standard
Proportion of Scope 2 emissions verified
(%)Moderate assurance
https://www.cdp.net/sites/2014/16/14516/Investor CDP 2014/Shared Documents/Attachments/CC8.7a/Verification Peab CDP 2013.pdf
p.1-2 AA1000AS 100
CC8.8Please identify if any data points other than emissions figures have been verified as part of the third party verification work undertaken
Additional data points verified CommentYear on year change in emissions (Scope 1 and 2)Year on year change in emissions (Scope 3)Year on year emissions intensity figureEmissions reduction activities
CC8.9Are carbon dioxide emissions from biologically sequestered carbon relevant to your organization?
Yes
CC8.9aPlease provide the emissions from biologically sequestered carbon relevant to your organization in metric tonnes CO2
1008.6
Further Information
Page: CC9. Scope 1 Emissions Breakdown - (1 Jan 2013 - 31 Dec 2013)
CC9.1Do you have Scope 1 emissions sources in more than one country?
Yes
CC9.1aPlease break down your total gross global Scope 1 emissions by country/region
Country/Region Scope 1 metric tonnes CO2e
Finland 1313
CC9.2Please indicate which other Scope 1 emissions breakdowns you are able to provide (tick all that apply)
By activity
CC9.2dPlease break down your total gross global Scope 1 emissions by activity
Activity Scope 1 emissions (metric tonnes CO2e)Stationary combustion Oil 26347.3Stationary combustion Diesel 40806Mobile combustion Diesel 50948.5Mobile combustion Petrol 908.5

Investor CDP 2014 Information Request - Peab AB
https://www.cdp.net/sites/2014/16/14516/Investor%20CDP%202014/Pages/DisclosureView.aspx[2014-10-17 10:37:05]
Mobile combustion Ethanol E85 15.5Mobile combustion Evolution Diesel 993.1Mobile combustion Diesel 5% FAME 2732.9
Further Information
Page: CC10. Scope 2 Emissions Breakdown - (1 Jan 2013 - 31 Dec 2013)
CC10.1Do you have Scope 2 emissions sources in more than one country?
Yes
CC10.1aPlease break down your total gross global Scope 2 emissions and energy consumption by country/region
Country/Region Scope 2 metric tonnes CO2e
Purchased and consumed electricity, heat, steam or cooling (MWh)
Purchased and consumed low carbon electricity, heat, steam or cooling accounted for CC8.3 (MWh)
Sweden 30643.5 239166.5 115134.5Finland 10825 11997.6 8934.4
CC10.2Please indicate which other Scope 2 emissions breakdowns you are able to provide (tick all that apply)
By activity
CC10.2cPlease break down your total gross global Scope 2 emissions by activity
Activity Scope 2 emissions (metric tonnes CO2e)Electricity use 31121.7District heating use 10346.8
Further Information
Page: CC11. Energy
CC11.1What percentage of your total operational spend in the reporting year was on energy?
More than 0% but less than or equal to 5%
CC11.2Please state how much fuel, electricity, heat, steam, and cooling in MWh your organization has purchased and consumed during the reporting year
Energy type MWhFuel 444320Electricity 231315.5Heat 19848.6Steam 0Cooling 0
CC11.3Please complete the table by breaking down the total "Fuel" figure entered above by fuel type
Fuels MWhCrude oil 93439Diesel/Gas oil 346822Motor gasoline 3758Other: Ethanol, E85 301Other: Evolution diesel 4061Other: Diesel 5% FAME 11124
CC11.4Please provide details of the electricity, heat, steam or cooling amounts that were accounted at a low carbon emission factor in the Scope 2 figure reported in CC8.3
Basis for applying a low carbon emission factor
MWh associated with low carbon electricity, heat, steam or cooling Comment

Investor CDP 2014 Information Request - Peab AB
https://www.cdp.net/sites/2014/16/14516/Investor%20CDP%202014/Pages/DisclosureView.aspx[2014-10-17 10:37:05]
Supplier specific, backed by instruments
7320Green electricity (water, wind and sun) delivered by local electricity provider (Vattenfall) to our Swedish departments
Supplier specific, backed by instruments
19848.6 District heating in Sweden and Finland
Further Information
Page: CC12. Emissions Performance
CC12.1How do your gross global emissions (Scope 1 and 2 combined) for the reporting year compare to the previous year?
Increased
CC12.1aPlease identify the reasons for any change in your gross global emissions (Scope 1 and 2 combined) and for each of them specify how your emissions compare to the previous year
ReasonEmissions
value (percentage)
Direction of
changeComment
Emissions reduction activities
28 Decrease
16% decrease due to energy efficiency activities undertaken in reducing fuel consumption (car petrol and car diesel). Initiatives that has been taken are for example the increased use and promotion of VTC and online meetings and change of fuel types to reduce carbon emissions. Peab has a 12% decrease in emissions regarding trucks that are used within the company for transportation (scope 1) due to an intiative of eco-driving. The initiative includes training for truck drivers in eco-driving resulting in more fuel-efficient driving, emission reduction and fuel cost savings.
DivestmentAcquisitionsMergersChange in output
Change in methodology
100 Increase
This year, Peab has changed the methodology by including more data on electricity numbers compared to last year. Last year, purchased electricity from our company electricity provider (Vattenfall) together with an estimated CO2 emission number was given to us. The electricity provided is considered green, thus last year the assumption was made that the purchased electricity resulted in 0 CO2 emissions. This year the same we have calculated on the exact CO2 emissions (1114,5 tonnes). Also, we have included electricity that has been purchased from other electricity providers, representing additional 28116.6 tonnes CO2 emissions.
Change in boundary
9.8 Decrease
Norway not included in emission calculations due to a large restructuring in the country. Scope 1 has changed by 9.8 % due to Norway not being part of this years calculations. Regarding scope 2 there has been large changes in the Swedish electricity numbers which affect the result of scope 2. Therefore the comparison of excluding Norway this year will not give an accurate emission value change of scope 2, therefore only scope 1 emission value change is presented.
Change in physical operating conditionsUnidentifiedOther
CC12.2Please describe your gross global combined Scope 1 and 2 emissions for the reporting year in metric tonnes CO2e per unit currency total revenue
Intensity figure
Metric numerator
Metric denominator
% change
from previous
year
Direction of
change from
previous year
Reason for change
0.0000037804metric tonnes CO2e
unit total revenue
16.4 Increase
The reason for change is mainly due to our increase in CO2 emissions compared to last year. The main reason for the increase in scope 1+2 emissions is due to a large increase in electricity consumption from other sources than from the company electrical provider (vattenfall). This additional electricity consumption increased our CO2 emissions by 28116.6 tonnes CO2e.
CC12.3Please describe your gross global combined Scope 1 and 2 emissions for the reporting year in metric tonnes CO2e per full time equivalent (FTE) employee
Intensity figure
Metric numerator
Metric denominator
% change
from previous
Direction of
change from
previous
Reason for change

Investor CDP 2014 Information Request - Peab AB
https://www.cdp.net/sites/2014/16/14516/Investor%20CDP%202014/Pages/DisclosureView.aspx[2014-10-17 10:37:05]
year year
14.773metric tonnes CO2e
FTE employee
44 Increase
The reason for change is due to our increase in CO2 emissions as well as our decrease in FTE employees. The main reason for the increase in scope 1+2 emissions is due to a large increase in electricity consumption from other sources than from the company electrical provider (vattenfall) This additional electricity consumption increased our CO2 emissions by 28116.6 tonnes CO2e.
CC12.4Please provide an additional intensity (normalized) metric that is appropriate to your business operations
Intensity figure
Metric numerator
Metric denominator
% change
from previous
year
Direction of
change from
previous year
Reason for change
0.0090911114metric tonnes CO2e
unit hour worked
44 Increase
The reason for the increase in the intensity figure is due to change in methodolgy of calculating unit hour worked as well as increased CO2 emissions. The main reason for the increase in scope 1+2 emissions is due to a large increase in electricity consumption from other sources than from the company electrical provider (vattenfall) which was not part of the calculations last year. This additional electricity consumption increased our CO2 emissions by 28116.6 tonnes CO2e.
Further Information
Page: CC13. Emissions Trading
CC13.1Do you participate in any emissions trading schemes?
No, and we do not currently anticipate doing so in the next 2 years
CC13.2Has your organization originated any project-based carbon credits or purchased any within the reporting period?
No
Further Information
Page: CC14. Scope 3 Emissions
CC14.1Please account for your organization’s Scope 3 emissions, disclosing and explaining any exclusions
Sources of Scope 3
emissions
Evaluation status
metric tonnes CO2e
Emissions calculation methodology
Percentage of
emissions calculated
using primary
data
Explanation
Purchased goods and services
Relevant, calculated
97.04
The purchased services are waste transportation. The CO2 emissions are based on data from our supplier as well as internally collected data on the total amount of recycled waste within Peab. The CO2 emission factor, 2.54 tonnes CO2/collected tonnes waste, is provided by the Swedish Environmental Protection Agency.
100.00%
Capital goodsRelevant, calculated
65850.3 Stationary combustion GHG protocol 75.00%
Fuel-and-energy-related activities (not included in Scope 1 or 2)
Relevant, calculated
42.5
Sweden Green Building Council and Swedish Energy Authority official data. Energy emittance Kwh from Green Building Council converted to CO2e by use of Swedish Energy Authority official factor 93.1 g CO2/kWh (Swedish district heating)
75.00%
Upstream transportation and distribution
Not relevant, explanation provided
Upstream transportation included in Scope 3 are purchased transportation services of waste which is included in "purchased

Investor CDP 2014 Information Request - Peab AB
https://www.cdp.net/sites/2014/16/14516/Investor%20CDP%202014/Pages/DisclosureView.aspx[2014-10-17 10:37:05]
goods and services".
Waste generated in operations
Relevant, calculated
2503
The emission figure has been calculated in a tool developed by Swedish recycling companies together with Peab and NCC. The tool shows CO2 savings from reused and recycled material. Raw data and emission factors provided in the tool are taken from official investigations as well as experts in the field.
100.00%
Business travel
Relevant, calculated
578.7Our travel partner has provided us with the CO2 emission figure. Air travel booked through different channels and other modes of business travel is not included in the calculations.
100.00%
Employee commuting
Not relevant, explanation provided
Peab is aware of the employee commuting aspect which is a part of our transport emissions. However, we believe that to be out of scope since we cannot affect the end result.
Upstream leased assets
Relevant, calculated
65850.3Stationary combustion GHG protocol. Peab uses leased machines at construction sites but purchases the fuel.
100.00%
Downstream transportation and distribution
Not relevant, explanation provided
Peab does not have any downstream transportation or distribution since our products are buildings, roads etc thus not sold in stores or delivered by transportation to our customers.
Processing of sold products
Relevant, calculated
3629.3
Our product Peab Asphalt is developed to reduce energy consumption in production with 20% Emissions factor is taken from The Nordic Road Association (NRF) report on environmental friendly coatings 2009, and is estimated to be 15-20kg CO2/ton produced asphalt, we assume 17kg CO2.
50.00%
Use of sold products
Relevant, calculated
34.85
Peab reduces GHG emissions by constructing energy efficient buildings. The CO2 emission figure gives an estimation of emissions from an A-level certification industry building built by Peab in Sweden. Energy consumption data on an A-level building is provided by Energimerkning (www.energimerkning.no) and the CO2 emission factor of 41g/kWh is provided from International Energy Agence, IEA.
25.00%
End of life treatment of sold products
Not relevant, explanation provided
The life time of Peab's products (houses, roads, etc.) are estimated to last long. The life time of a house is at least 100 years.
Downstream leased assets
Not relevant, explanation provided
Peab does not have any downstream leased assets.
Franchises
Not relevant, explanation provided
Peab does not have any franchises.
InvestmentsRelevant, not yet calculated
Other (upstream)
Not evaluated
Other (downstream)
Not evaluated
CC14.2Please indicate the verification/assurance status that applies to your reported Scope 3 emissions
Third party verification or assurance complete
CC14.2aPlease provide further details of the verification/assurance undertaken, and attach the relevant statements
Type of verification or
assuranceAttach the statement Page/Section
referenceRelevant standard
Proportion of Scope 3 emissions verified
(%)Moderate https://www.cdp.net/sites/2014/16/14516/Investor CDP 2014/Shared
p.1-2 AA1000AS 100

Investor CDP 2014 Information Request - Peab AB
https://www.cdp.net/sites/2014/16/14516/Investor%20CDP%202014/Pages/DisclosureView.aspx[2014-10-17 10:37:05]
assurance Documents/Attachments/CC14.2a/Verification Peab CDP 2013.pdf
CC14.3Are you able to compare your Scope 3 emissions for the reporting year with those for the previous year for any sources?
Yes
CC14.3aPlease identify the reasons for any change in your Scope 3 emissions and for each of them specify how your emissions compare to the previous year
Sources of Scope 3
emissions
Reason for change
Emissions value
(percentage)
Direction of
changeComment
Business travelEmissions reduction activities
48 DecreasePeab is working actively to promote the use of online meetings and video conferences instead of physical meetings in order to reduce business travels.
CC14.4Do you engage with any of the elements of your value chain on GHG emissions and climate change strategies? (Tick all that apply)
Yes, our suppliersYes, our customersYes, other partners in the value chain
CC14.4aPlease give details of methods of engagement, your strategy for prioritizing engagements and measures of success
Peab has a long tradition of collaborating with stakeholders in various forums in order to strengthen relationships and be receptive to preferences and expectations. This take place in the form of, for example, customer meetings and customer surveys, participation in networks, information meetings in residential areas and dialogues with authorities and administrators.
We have regular dialogues with our stakeholders both on a local, regional and national level. During 2013 Peab continued end extended our stakeholder dialogue focusing on sustainability, including energy and carbon related aspects. A web-based questionnaire was sent to our stakeholders, which had been prioritized in a stakeholder mapping 2012. These groups included customers, employees, students, shareholders, suppliers, financial analysts, trade organizations and Peabs Board of Directors.
Applicable KPIs were matched with each material aspect to measure improvements in our performance. The results are presented in our Sustainability Report.
CC14.4bTo give a sense of scale of this engagement, please give the number of suppliers with whom you are engaging and the proportion of your total spend that they represent
Number of suppliers % of total spend Comment60 15.7%
CC14.4cIf you have data on your suppliers’ GHG emissions and climate change strategies, please explain how you make use of that data
How you make use of the data Please give detailsWe do not have any data
Further Information
Module: Sign Off
Page: CC15. Sign Off
CC15.1Please provide the following information for the person that has signed off (approved) your CDP climate change response
Name Job title Corresponding job categoryKristina Gabrielii Sustainability manager Environment/Sustainability manager
Further Information
CDP