CD Equisearch Pvt Ltd - Business...
12
CD Equisearch Pvt Ltd Dec 12, 2016 Equities Derivatives Commodities Distribution of Mutual Funds Distribution of Life Insurance . Atul Ltd No. of shares (m) 29.66 Mkt cap (Rs crs/$m) 6362/941.3 Current price (Rs/$) 2145/31.7 Price target (Rs/$) 2530/37.4 52 W H/L (Rs.) 2489/1275 Book Value (Rs/$) 706/10.4 Beta 1.0 Daily volume (avg. monthly) 17370 P/BV (FY17e/18e) 3.4/2.9 EV/EBITDA (FY17e/18e) 11.3/9.5 P/E (FY17e/18e) 20.7/17.0 EPS growth (F17e/18e) 13.7/22.2 OPM (FY16/17e/18e) 17.9/18.5/19.3 ROE (FY16/17e/18e) 18.5/17.9/18.4 ROCE(FY16/17e/18e) 16.2/16.3/17.5 D/E ratio (FY16/17e/18e) 0.2/0.1/0.0 BSE Code 500027 NSE Code ATUL Bloomberg ATLP IN Reuters ATLP.BO Shareholding pattern % Promoters 44.5 MFs / Banks / FIs 18.6 FPIs 7.7 Govt. Holding 0.0 Public & Others 29.3 Total 100.0 As on Sep 30, 2016 Recommendation ACCUMULATE Analyst KISHAN GUPTA, CFA, FRM Phone: + 91 (33) 4488 0043 E- mail: [email protected] (Figures in Rs crs) FY14 FY15 FY16 FY17e FY18e Income from operations 2457.75 2656.39 2601.44 2839.24 3258.63 Other Income 36.27 10.25 30.71 26.70 29.90 EBITDA (other income included) 400.00 411.54 494.26 552.51 658.28 Profit after EO 198.95 226.08 270.03 307.05 375.17 EPS(67.08 76.22 91.04 103.52 126.49 EPS growth (%) 72.1 13.6 19.4 13.7 22.2 Quarterly Highlights After nearly flat lining (-1.8%) last fiscal, exports vigorously revived in HI to post 28% in Q1 and 18% (volume growth) in Q2. Untowardness was averted last fiscal when crop protection business chipped in to post 72.3% growth in exports (21% export revenue share), while one of the most resilient businesses like colors (-34.3%) and aromatics (-13.6%) report jaw-dropping decline in overseas sales. Polymers business, however, managed to retain its growth streak for the sixth consecutive year (at least). After declining for four straight quarters - presumably due to weak crude oil prices denting aromatics business and lower export off take colors', revenues of Performance & other chemicals (POC) business distinctly rose in last two quarters - 13.4% in Q1and 10.2% in Q2. Contrary to perception, Atul's crop protection business has in last few years somewhat veiled the tepidity in Atul's pharmaceutical business (revenues merely 5% higher in last three years to FY16). Unyielding increase in EBIT margins of POC business explains the gaping profits (standalone) between LSC and POC business - POC's EBIT was nearly three time that of LSC's in HIFY17 from just 1.4x in FY16 and 1.2x in FY14. It also restricted sharp erosion in PBT in H1 - grew by a disappointing 4.7% for the LSC business EBIT slid 26.9% to Rs 61.44 crs ($9.1m) from Rs 84.07 ($12.4m) in the same period a year ago. Thanks to lower tax provision, PAT advanced by 12.9% to Rs 162.86 crs ($24.1m) in H1. Atul’s Board of Directors recently approved the partnership of Atul or its affiliates with Akzo Nobel Chemicals International B.V. for setting up a manufacturing plant for monochloro acetic acid (MCA) at Atul’s facility in Valsad, Gujarat with each partner holding 50% stake. Starting with an initial capacity of 32 kilotons, the plant would be designed to take the future capacity to 60 kilotons. After meeting Atul’s captive need of MCA, the rest would be marketed by Akzo Nobel. The stock currently trades at 20.7x FY17e EPS of Rs 103.52 and 17x FY18e EPS of Rs 126.49. Cataclysmic impact of ongoing demonetization of high value Indian currency risks derailing economic output by at least 2% with varied effects on sectors. Still increased allegiance on brands business (particularly for pharmaceuticals and crop protection) and unflagging focus on product introductions would stoke margin buffers. Current trends presage 17.8% earnings growth for two years ending FY18. We retain our accumulate rating with revised target of Rs 2530 (previous target: Rs 2168) based on 20x FY18e earnings (PEG ratio: 1.1) over a period of 6-9 months.
Transcript of CD Equisearch Pvt Ltd - Business...
CD Equisearch Pvt Ltd Dec 12, 2016
Equities Derivatives Commodities Distribution of Mutual Funds Distribution of Life Insurance
.
Atul Ltd
No. of shares (m) 29.66
Mkt cap (Rs crs/$m) 6362/941.3
Current price (Rs/$) 2145/31.7
Price target (Rs/$)
2530/37.4
52 W H/L (Rs.) 2489/1275
Book Value (Rs/$) 706/10.4
Beta 1.0
Daily volume (avg. monthly) 17370
P/BV (FY17e/18e) 3.4/2.9
EV/EBITDA (FY17e/18e) 11.3/9.5
P/E (FY17e/18e) 20.7/17.0
EPS growth (F17e/18e) 13.7/22.2
OPM (FY16/17e/18e) 17.9/18.5/19.3
ROE (FY16/17e/18e) 18.5/17.9/18.4
ROCE(FY16/17e/18e) 16.2/16.3/17.5
D/E ratio (FY16/17e/18e) 0.2/0.1/0.0
BSE Code 500027
NSE Code ATUL
Bloomberg ATLP IN
Reuters ATLP.BO
Shareholding pattern %
Promoters 44.5
MFs / Banks / FIs 18.6
FPIs 7.7
Govt. Holding 0.0
Public & Others 29.3
Total 100.0
As on Sep 30, 2016
Recommendation
ACCUMULATE
Analyst
KISHAN GUPTA, CFA, FRM
Phone: + 91 (33) 4488 0043
E- mail: [email protected]
(Figures in Rs crs)
FY14
FY15
FY16
FY17e
FY18e
Income from operations 2457.75 2656.39 2601.44 2839.24 3258.63
Other Income 36.27 10.25 30.71 26.70 29.90
EBITDA (other income included) 400.00 411.54 494.26 552.51 658.28
Profit after EO 198.95 226.08 270.03 307.05 375.17
EPS(Rs) 67.08 76.22 91.04 103.52 126.49
EPS growth (%) 72.1 13.6 19.4 13.7 22.2
Quarterly Highlights
� After nearly flat lining (-1.8%) last fiscal, exports vigorously revived in HI to
post 28% in Q1 and 18% (volume growth) in Q2. Untowardness was averted
last fiscal when crop protection business chipped in to post 72.3% growth in
exports (21% export revenue share), while one of the most resilient
businesses like colors (-34.3%) and aromatics (-13.6%) report jaw-dropping
decline in overseas sales. Polymers business, however, managed to retain its
growth streak for the sixth consecutive year (at least).
� After declining for four straight quarters - presumably due to weak crude oil
prices denting aromatics business and lower export off take colors', revenues
of Performance & other chemicals (POC) business distinctly rose in last two
quarters - 13.4% in Q1and 10.2% in Q2. Contrary to perception, Atul's crop
protection business has in last few years somewhat veiled the tepidity in
Atul's pharmaceutical business (revenues merely 5% higher in last three
years to FY16).
� Unyielding increase in EBIT margins of POC business explains the gaping
profits (standalone) between LSC and POC business - POC's EBIT was
nearly three time that of LSC's in HIFY17 from just 1.4x in FY16 and 1.2x in
FY14. It also restricted sharp erosion in PBT in H1 - grew by a disappointing
4.7% for the LSC business EBIT slid 26.9% to Rs 61.44 crs ($9.1m) from Rs
84.07 ($12.4m) in the same period a year ago. Thanks to lower tax provision,
PAT advanced by 12.9% to Rs 162.86 crs ($24.1m) in H1.
� Atul’s Board of Directors recently approved the partnership of Atul or its
affiliates with Akzo Nobel Chemicals International B.V. for setting up a
manufacturing plant for monochloro acetic acid (MCA) at Atul’s facility in
Valsad, Gujarat with each partner holding 50% stake. Starting with an initial
capacity of 32 kilotons, the plant would be designed to take the future
capacity to 60 kilotons. After meeting Atul’s captive need of MCA, the rest
would be marketed by Akzo Nobel.
� The stock currently trades at 20.7x FY17e EPS of Rs 103.52 and 17x FY18e
EPS of Rs 126.49. Cataclysmic impact of ongoing demonetization of high
value Indian currency risks derailing economic output by at least 2% with
varied effects on sectors. Still increased allegiance on brands business
(particularly for pharmaceuticals and crop protection) and unflagging focus
on product introductions would stoke margin buffers. Current trends
presage 17.8% earnings growth for two years ending FY18. We retain our
accumulate rating with revised target of Rs 2530 (previous target: Rs 2168)
based on 20x FY18e earnings (PEG ratio: 1.1) over a period of 6-9 months.
2
2
CD Equisearch Pvt Ltd
Equities Derivatives Commodities Distribution of Mutual Funds Distribution of Life Insurance
[
Outlook & Recommendation
ACC Report on US chemistry
According to American Chemistry Council’s (ACC) “Year End 2016 Chemical Industry Situation and Outlook,”, despite a
contraction this year, US chemical production (excluding pharmaceuticals) is expected to grow by 1.6% in 2016, followed by
3.6% growth next year and 4.8% in 2018. It reckons that US competitive advantage - access to sufficient supplies of natural gas
- continues to offset major challenges, including a rebalancing in oil & gas sector, weak export markets and a strong dollar.
Demand continues to expand from key domestic end use markets, including light vehicles and housing, consumer spending
accelerated, household spending increased owing to low energy costs - all factors supporting industrial activity.
According to the report, output gains were driven by agricultural chemicals, coatings and other specialties, as well as bulk
petrochemicals and organics and plastic resin, all aided by improved competitiveness from shale gas. It portends that
advances in manufacturing and exports in 2017 would stoke demand for basic chemicals and improving manufacturing
activity will aid growth for most specialty chemicals. It posits that production of specialty chemicals, which has been
dampened by oilfield and mining chemicals, would pick up and rise to 3% in 2017 as demand from oil& gas sector recovers.
Indian specialty chemicals
Changing dynamics of global specialty chemicals industry in past year or so has reinvigorated fortunes of Indian specialty
chemical manufacturers. Tellingly, strict implementation of environment control regulations in China has led to shutdown of
plants across the country, benefitting Indian players the most. Reports indicate that India's share in global specialty chemical
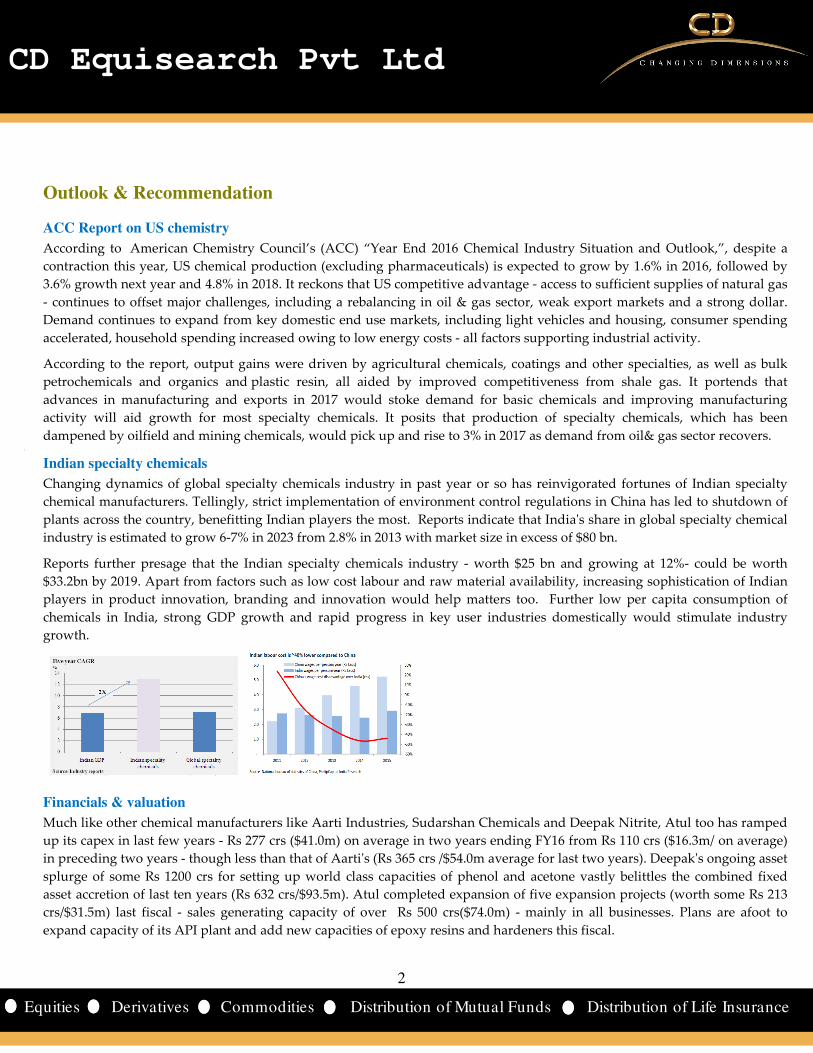
industry is estimated to grow 6-7% in 2023 from 2.8% in 2013 with market size in excess of $80 bn.
Reports further presage that the Indian specialty chemicals industry - worth $25 bn and growing at 12%- could be worth
$33.2bn by 2019. Apart from factors such as low cost labour and raw material availability, increasing sophistication of Indian
players in product innovation, branding and innovation would help matters too. Further low per capita consumption of
chemicals in India, strong GDP growth and rapid progress in key user industries domestically would stimulate industry
growth.
Financials & valuation
Much like other chemical manufacturers like Aarti Industries, Sudarshan Chemicals and Deepak Nitrite, Atul too has ramped
up its capex in last few years - Rs 277 crs ($41.0m) on average in two years ending FY16 from Rs 110 crs ($16.3m/ on average)
in preceding two years - though less than that of Aarti's (Rs 365 crs /$54.0m average for last two years). Deepak's ongoing asset
splurge of some Rs 1200 crs for setting up world class capacities of phenol and acetone vastly belittles the combined fixed
asset accretion of last ten years (Rs 632 crs/$93.5m). Atul completed expansion of five expansion projects (worth some Rs 213
crs/$31.5m) last fiscal - sales generating capacity of over Rs 500 crs($74.0m) - mainly in all businesses. Plans are afoot to
expand capacity of its API plant and add new capacities of epoxy resins and hardeners this fiscal.

3
3
CD Equisearch Pvt Ltd
Equities Derivatives Commodities Distribution of Mutual Funds Distribution of Life Insurance
Surprisingly, tumult in global crude oil markets did little to perturb most chemical manufacturers who have relied on
motley of factors - increasing share of specialty chemicals; altering product mix; resorting to dynamic pricing mechanism
(fixing absolute margins) - to guard themselves from menace of falling finished product realizations. Both Atul and Aarti for
instance, bettered their operating profit growth (relative to sales growth) in last two years - the former by broadening its
product mix and aggressively promoting its brand business and the latter shook off the jolt by exploiting the incessant fall in
benzene prices to increase its specialty chemicals margins by over 700 bps in last two years.
Yet threat of demonetization of Indian currency - particularly on the rural economy – could neutralize beneficial impact of
recent rise in crude oil prices and other margin stimulating initiatives. For Atul's crop protection business, increasing brand
sales and expanding overseas presence (Africa/ South America) remain key priorities, while the pharmaceutical business
would focus on increasing CRAMS business and developing new formulation business for patents. Its colors business which
dealt a fatal blow last fiscal (sales down by some 23%) would strive to unveil new dyes, pigments and products for non-
textile applications, while the aromatics business would expand its product portfolio in personal care and aroma
ingredients, besides setting up state-of-the-art-kilo lab facility.
After faltering a bit in H2 revenues though are projected to briskly recover (+14.8%) by next fiscal but the estimates risks
falling apart to demonetization precipitating a dreadful economic slowdown. Besides, time lag in price setting in aromatics
business (finished product prices misaligned to monthly fluctuations in raw material prices), margin besetting impact of
cheaper imports of epoxy resins and hardeners and restive competition from China in crop protection business are factors
not to be languidly allayed. Estimates of notable rise in crop protection and aromatics volumes lend their fragility to
aftershocks of demonetization on consumer spending and farm output. Yet dramatic loss in margins appears a lesser risk
not least due to product diversification and propensity to introduce value added products.
The stock currently trades at 20.7x FY17e EPS of Rs 103.52 and 17x FY18e EPS of Rs 126.49. Average earnings growth of
17.9% (previous estimate: 11.9%) for two years ending FY18 somewhat undermines the ravaging impact of non-linear events
- slowdown in consumer spending, increased volatility in crude oil markets - and their inter dependence. Little scope exists
of limitless expansion of margins through cost control and product rationalization - the cornerstones of hefty swell in
operating margins in last few years - from 11.4% in FY12 to 17.9% in FY16.Yet steady return on equity (five year average:
17.8%) and its eschewing of debt pile up doubtless make investors sanguine. Balancing odds, we retain our accumulate
rating on the stock with revised target of Rs 2530 (previous target: Rs 2168) based on 20x FY18e earnings (PEG ratio: 1.1)
over a period of 6-9 months. For more info refer to our May report.
4
4
CD Equisearch Pvt Ltd
Equities Derivatives Commodities Distribution of Mutual Funds Distribution of Life Insurance
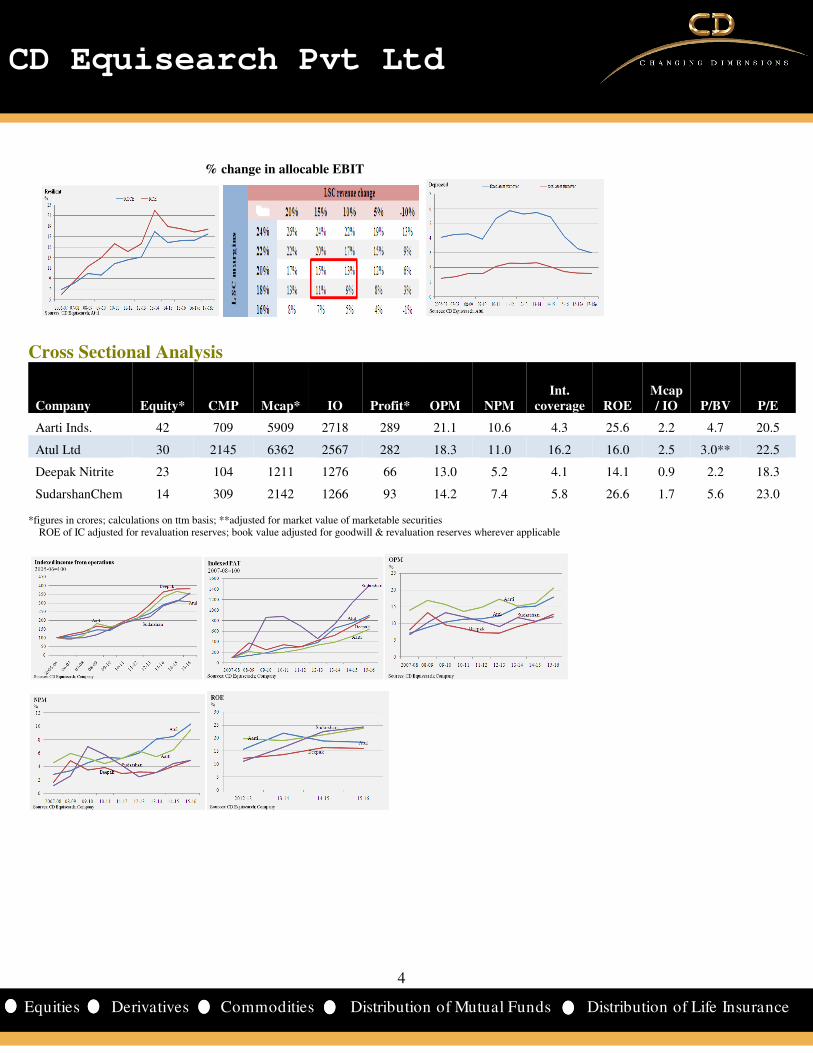
% change in allocable EBIT
Cross Sectional Analysis
Company Equity* CMP Mcap* IO Profit* OPM NPM
Int.
coverage ROE
Mcap
/ IO P/BV P/E
Aarti Inds. 42 709 5909 2718 289 21.1 10.6 4.3 25.6 2.2 4.7 20.5
Atul Ltd 30 2145 6362 2567 282 18.3 11.0 16.2 16.0 2.5 3.0** 22.5
Deepak Nitrite 23 104 1211 1276 66 13.0 5.2 4.1 14.1 0.9 2.2 18.3
SudarshanChem 14 309 2142 1266 93 14.2 7.4 5.8 26.6 1.7 5.6 23.0 *figures in crores; calculations on ttm basis; **adjusted for market value of marketable securities ROE of IC adjusted for revaluation reserves; book value adjusted for goodwill & revaluation reserves wherever applicable
5
5
CD Equisearch Pvt Ltd
Equities Derivatives Commodities Distribution of Mutual Funds Distribution of Life Insurance
Financials
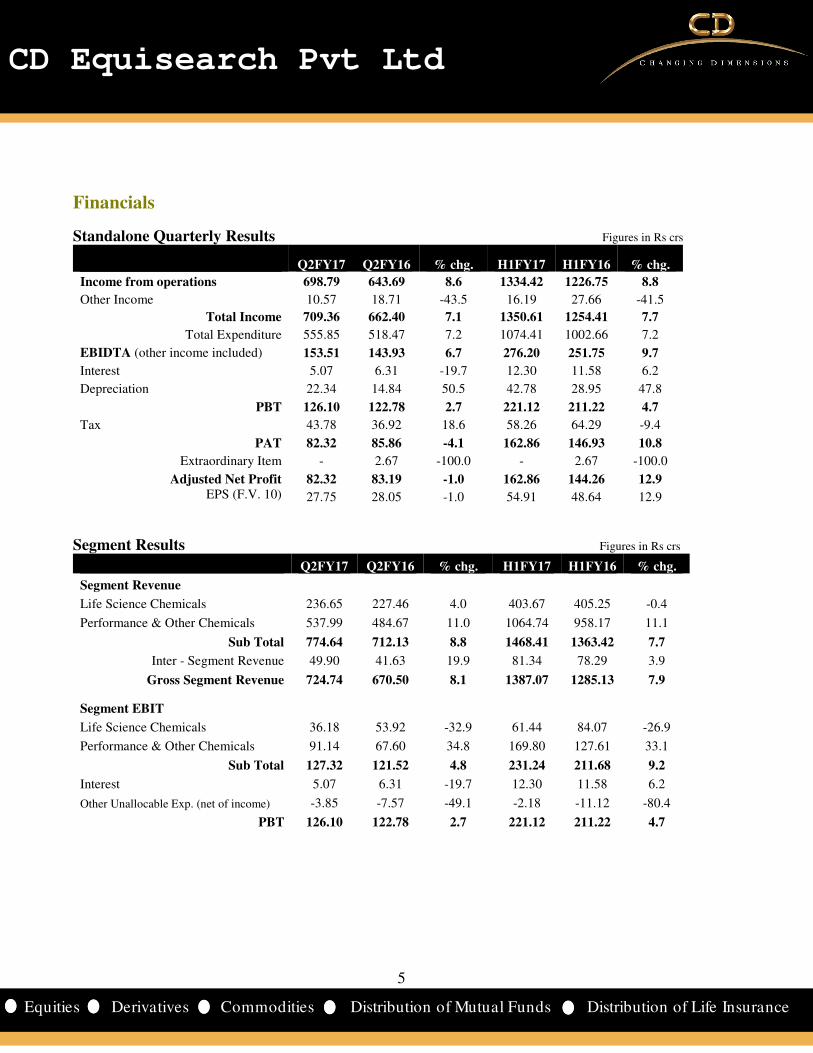
Standalone Quarterly Results Figures in Rs crs
Q2FY17 Q2FY16 % chg. H1FY17 H1FY16 % chg.
Income from operations 698.79 643.69 8.6 1334.42 1226.75 8.8
Other Income 10.57 18.71 -43.5 16.19 27.66 -41.5
Total Income 709.36 662.40 7.1 1350.61 1254.41 7.7
Total Expenditure 555.85 518.47 7.2 1074.41 1002.66 7.2
EBIDTA (other income included) 153.51 143.93 6.7 276.20 251.75 9.7
Interest 5.07 6.31 -19.7 12.30 11.58 6.2
Depreciation 22.34 14.84 50.5 42.78 28.95 47.8
PBT 126.10 122.78 2.7 221.12 211.22 4.7
Tax 43.78 36.92 18.6 58.26 64.29 -9.4
PAT 82.32 85.86 -4.1 162.86 146.93 10.8
Extraordinary Item - 2.67 -100.0 - 2.67 -100.0
Adjusted Net Profit 82.32 83.19 -1.0 162.86 144.26 12.9
EPS (F.V. 10) 27.75 28.05 -1.0 54.91 48.64 12.9
Segment Results Figures in Rs crs
Q2FY17 Q2FY16 % chg. H1FY17 H1FY16 % chg.
Segment Revenue
Life Science Chemicals 236.65 227.46 4.0 403.67 405.25 -0.4
Performance & Other Chemicals 537.99 484.67 11.0 1064.74 958.17 11.1
Sub Total 774.64 712.13 8.8 1468.41 1363.42 7.7
Inter - Segment Revenue 49.90 41.63 19.9 81.34 78.29 3.9
Gross Segment Revenue 724.74 670.50 8.1 1387.07 1285.13 7.9
Segment EBIT
Life Science Chemicals 36.18 53.92 -32.9 61.44 84.07 -26.9
Performance & Other Chemicals 91.14 67.60 34.8 169.80 127.61 33.1
Sub Total 127.32 121.52 4.8 231.24 211.68 9.2
Interest 5.07 6.31 -19.7 12.30 11.58 6.2
Other Unallocable Exp. (net of income) -3.85 -7.57 -49.1 -2.18 -11.12 -80.4
PBT 126.10 122.78 2.7 221.12 211.22 4.7
6
6
CD Equisearch Pvt Ltd
Equities Derivatives Commodities Distribution of Mutual Funds Distribution of Life Insurance
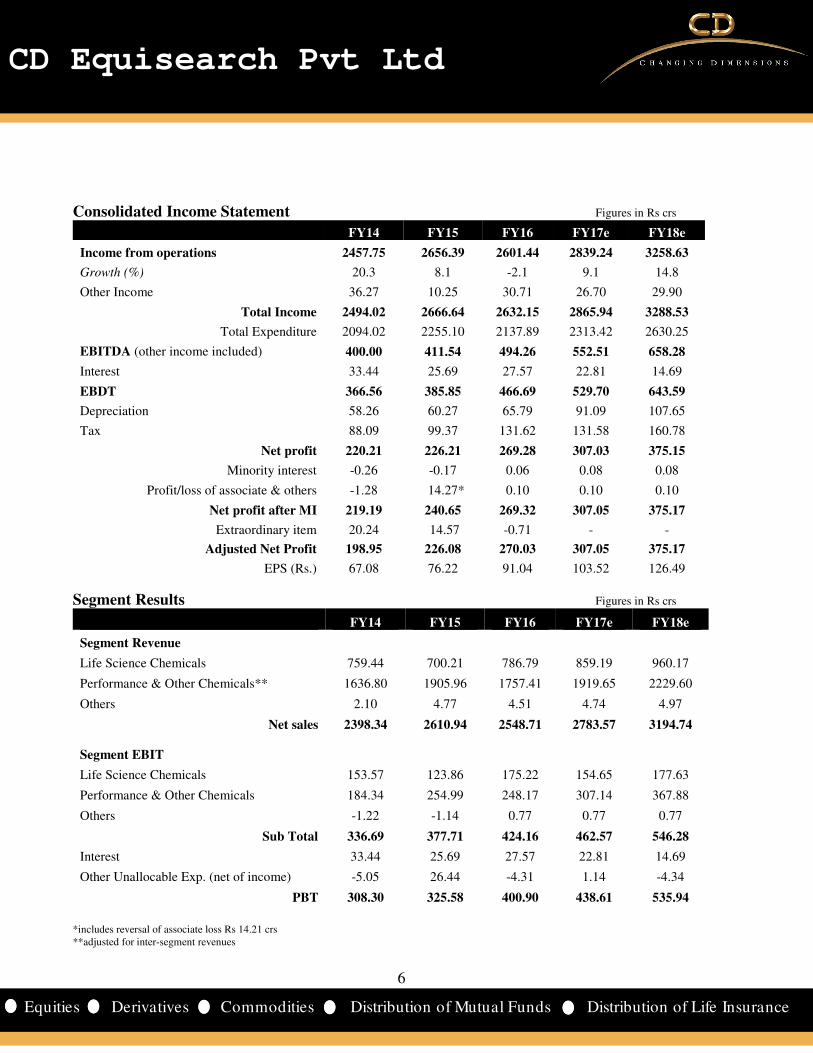
Consolidated Income Statement Figures in Rs crs
FY14 FY15 FY16 FY17e FY18e
Income from operations 2457.75 2656.39 2601.44 2839.24 3258.63
Growth (%) 20.3 8.1 -2.1 9.1 14.8
Other Income 36.27 10.25 30.71 26.70 29.90
Total Income 2494.02 2666.64 2632.15 2865.94 3288.53
Total Expenditure 2094.02 2255.10 2137.89 2313.42 2630.25
EBITDA (other income included) 400.00 411.54 494.26 552.51 658.28
Interest 33.44 25.69 27.57 22.81 14.69
EBDT 366.56 385.85 466.69 529.70 643.59
Depreciation 58.26 60.27 65.79 91.09 107.65
Tax 88.09 99.37 131.62 131.58 160.78
Net profit 220.21 226.21 269.28 307.03 375.15
Minority interest -0.26 -0.17 0.06 0.08 0.08
Profit/loss of associate & others -1.28 14.27* 0.10 0.10 0.10
Net profit after MI 219.19 240.65 269.32 307.05 375.17
Extraordinary item 20.24 14.57 -0.71 - -
Adjusted Net Profit 198.95 226.08 270.03 307.05 375.17
EPS (Rs.) 67.08 76.22 91.04 103.52 126.49
Segment Results Figures in Rs crs
FY14 FY15 FY16 FY17e FY18e
Segment Revenue
Life Science Chemicals 759.44 700.21 786.79 859.19 960.17
Performance & Other Chemicals** 1636.80 1905.96 1757.41 1919.65 2229.60
Others 2.10 4.77 4.51 4.74 4.97
Net sales 2398.34 2610.94 2548.71 2783.57 3194.74
Segment EBIT
Life Science Chemicals 153.57 123.86 175.22 154.65 177.63
Performance & Other Chemicals 184.34 254.99 248.17 307.14 367.88
Others -1.22 -1.14 0.77 0.77 0.77
Sub Total 336.69 377.71 424.16 462.57 546.28
Interest 33.44 25.69 27.57 22.81 14.69
Other Unallocable Exp. (net of income) -5.05 26.44 -4.31 1.14 -4.34
PBT 308.30 325.58 400.90 438.61 535.94
*includes reversal of associate loss Rs 14.21 crs **adjusted for inter-segment revenues
7
7
CD Equisearch Pvt Ltd
Equities Derivatives Commodities Distribution of Mutual Funds Distribution of Life Insurance
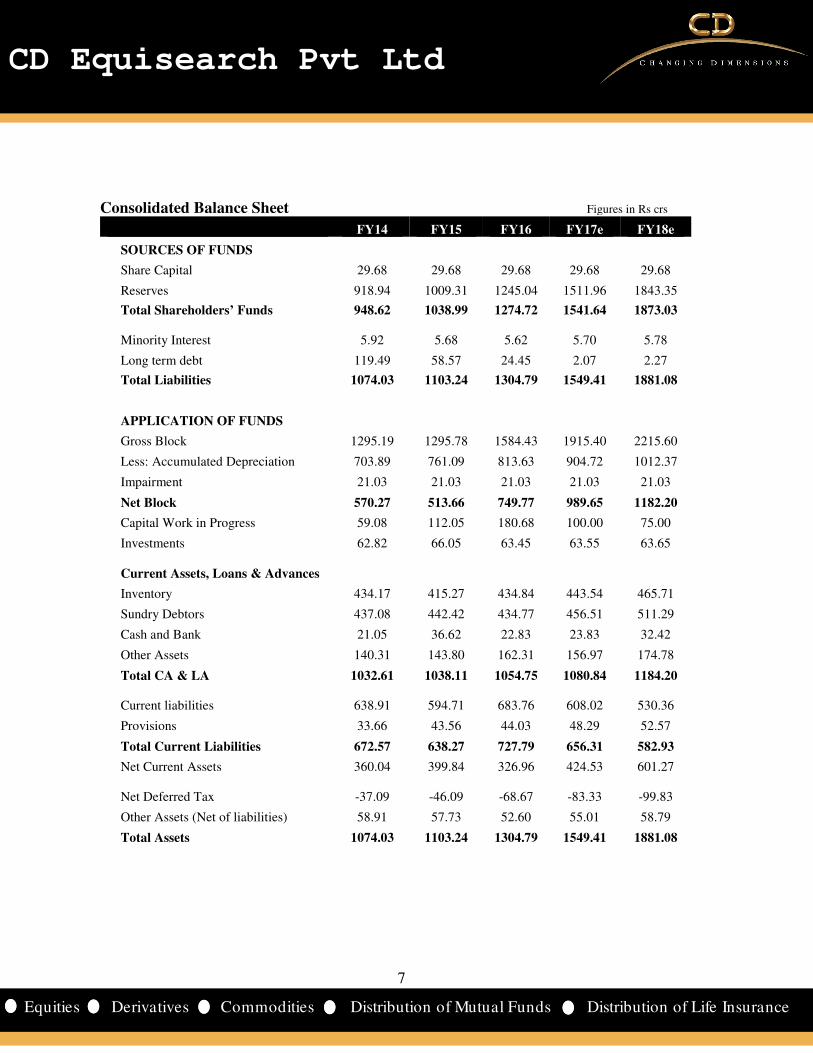
Consolidated Balance Sheet Figures in Rs crs
FY14 FY15 FY16 FY17e FY18e
SOURCES OF FUNDS
Share Capital 29.68 29.68 29.68 29.68 29.68
Reserves 918.94 1009.31 1245.04 1511.96 1843.35
Total Shareholders’ Funds 948.62 1038.99 1274.72 1541.64 1873.03
Minority Interest 5.92 5.68 5.62 5.70 5.78
Long term debt 119.49 58.57 24.45 2.07 2.27
Total Liabilities 1074.03 1103.24 1304.79 1549.41 1881.08
APPLICATION OF FUNDS
Gross Block 1295.19 1295.78 1584.43 1915.40 2215.60
Less: Accumulated Depreciation 703.89 761.09 813.63 904.72 1012.37
Impairment 21.03 21.03 21.03 21.03 21.03
Net Block 570.27 513.66 749.77 989.65 1182.20
Capital Work in Progress 59.08 112.05 180.68 100.00 75.00
Investments 62.82 66.05 63.45 63.55 63.65
Current Assets, Loans & Advances
Inventory 434.17 415.27 434.84 443.54 465.71
Sundry Debtors 437.08 442.42 434.77 456.51 511.29
Cash and Bank 21.05 36.62 22.83 23.83 32.42
Other Assets 140.31 143.80 162.31 156.97 174.78
Total CA & LA 1032.61 1038.11 1054.75 1080.84 1184.20
Current liabilities 638.91 594.71 683.76 608.02 530.36
Provisions 33.66 43.56 44.03 48.29 52.57
Total Current Liabilities 672.57 638.27 727.79 656.31 582.93
Net Current Assets 360.04 399.84 326.96 424.53 601.27
Net Deferred Tax -37.09 -46.09 -68.67 -83.33 -99.83
Other Assets (Net of liabilities) 58.91 57.73 52.60 55.01 58.79
Total Assets 1074.03 1103.24 1304.79 1549.41 1881.08
8
8
CD Equisearch Pvt Ltd
Equities Derivatives Commodities Distribution of Mutual Funds Distribution of Life Insurance
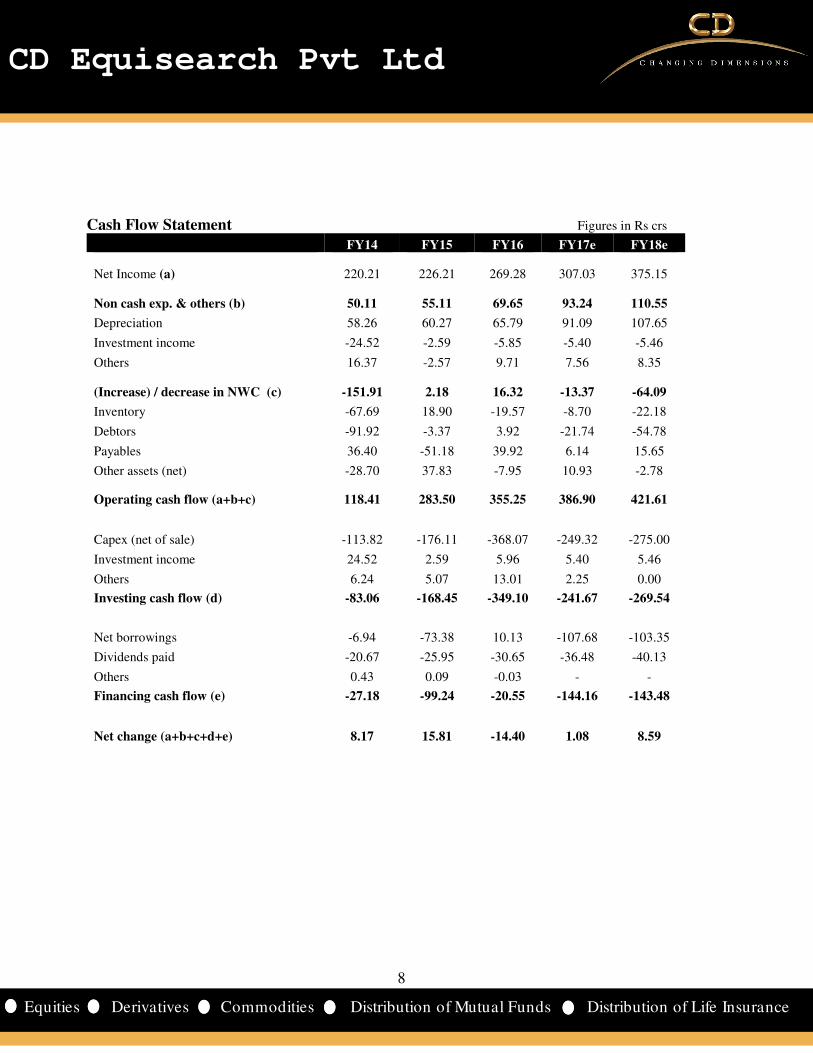
Cash Flow Statement Figures in Rs crs
FY14 FY15 FY16 FY17e FY18e
Net Income (a) 220.21 226.21 269.28 307.03 375.15
Non cash exp. & others (b) 50.11 55.11 69.65 93.24 110.55
Depreciation 58.26 60.27 65.79 91.09 107.65
Investment income -24.52 -2.59 -5.85 -5.40 -5.46
Others 16.37 -2.57 9.71 7.56 8.35
(Increase) / decrease in NWC (c) -151.91 2.18 16.32 -13.37 -64.09
Inventory -67.69 18.90 -19.57 -8.70 -22.18
Debtors -91.92 -3.37 3.92 -21.74 -54.78
Payables 36.40 -51.18 39.92 6.14 15.65
Other assets (net) -28.70 37.83 -7.95 10.93 -2.78
Operating cash flow (a+b+c) 118.41 283.50 355.25 386.90 421.61
Capex (net of sale) -113.82 -176.11 -368.07 -249.32 -275.00
Investment income 24.52 2.59 5.96 5.40 5.46
Others 6.24 5.07 13.01 2.25 0.00
Investing cash flow (d) -83.06 -168.45 -349.10 -241.67 -269.54
Net borrowings -6.94 -73.38 10.13 -107.68 -103.35
Dividends paid -20.67 -25.95 -30.65 -36.48 -40.13
Others 0.43 0.09 -0.03 - -
Financing cash flow (e) -27.18 -99.24 -20.55 -144.16 -143.48
Net change (a+b+c+d+e) 8.17 15.81 -14.40 1.08 8.59

9
9
CD Equisearch Pvt Ltd
Equities Derivatives Commodities Distribution of Mutual Funds Distribution of Life Insurance
Key Financial Ratios
FY14 FY15 FY16 FY17e FY18e
Growth Ratios
Revenue (%) 20.3 8.1 -2.1 9.1 14.8
EBIDTA (%) 43.3 8.2 20.2 11.8 19.1
Net Profit (%) 72.1 13.6 19.4 13.7 22.2
EPS (%) 72.1 13.6 19.4 13.7 22.2
Margins
Operating Profit Margin (%) 14.8 15.1 17.9 18.5 19.3
Gross Profit Margin (%) 14.1 14.5 17.9 18.7 19.8
Net Profit Margin (%) 8.1 8.5 10.4 10.8 11.5
Return
ROCE (%) 17.9 15.9 16.2 16.3 17.5
RONW (%) 21.9 18.9 18.5 17.9 18.4
Valuations
Market Cap / Sales 0.5 1.3 1.8 2.2 2.0
EV/EBIDTA 3.7 7.9 9.2 11.3 9.5
P/E 6.5 14.8 16.9 20.7 17.0
P/BV 1.3 2.5 2.9 3.4 2.9
Other Ratios
Interest Coverage 9.6 13.7 15.5 20.2 37.5
Debt-Equity Ratio 0.4 0.2 0.2 0.1 0.0
Current Ratio 1.5 1.6 1.5 1.6 2.0
Turnover Ratios
Fixed Asset Turnover 5.7 5.4 4.1 3.3 3.0
Total Asset Turnover 2.3 2.1 1.7 1.6 1.6
Debtors Turnover 6.2 6.0 5.9 6.4 6.7
Inventory Turnover 5.2 5.3 5.0 5.3 5.8
Creditors Turnover 6.8 7.5 7.4 7.5 8.2
WC Ratios
Debtor Days 58.6 60.4 61.5 57.3 54.2
Inventory Days 69.8 68.8 72.6 69.3 63.1
Creditor Days 53.7 48.4 49.5 48.9 44.5
Cash Conversion Cycle 74.6 80.8 84.7 77.7 72.8
Cash Flows (Rs crs)
Operating Cash Flow 118.4 283.5 355.3 386.9 421.6
FCFF 59.2 132.9 24.7 161.2 162.4
FCFE 28.4 41.7 16.3 37.6 48.7
note: market value of marketable securities considered in calculations of EV; ROE; ROCE and turnover ratios

10
10
CD Equisearch Pvt Ltd
Equities Derivatives Commodities Distribution of Mutual Funds Distribution of Life Insurance
Cumulative Financial Data
Figures in Rs crs FY07-09 FY10-12 FY13-15 FY16-18e
Income from operations 3196 4561 7157 8699
Operating profit 237 508 1015 1619
EBIT 207 435 886 1440
PBT 103 340 793 1375
PAT after EO 94 232 541 952
Dividends 31 45 78 120
Capexa 175 203 405 894
OPM (%) 7.4 11.1 14.2 18.6
GPM (%) 6.1 10.1 13.5 18.8
NPM (%) 2.9 5.2 7.7 10.9
Interest coverage 2.0 4.6 9.6 22.1
ROE (%) 8.1 14.5 17.6 17.8
ROCE (%) 8.4 11.0 15.0 16.7
Debt-equity ratio* 1.0 0.6 0.2 0.0
Fixed asset turnover 3.9 4.7 5.7 3.4
Total asset turnover 1.4 1.9 2.1 1.6
Debtors turnover 4.9 5.3 6.0 6.1
Inventory turnover 4.5 4.9 5.5 5.4
Creditors turnover 5.6 6.0 7.6 7.9
Debtors days 74.1 68.4 61.3 60.0
Inventory days 81.2 73.7 66.7 68.1
Creditor days 65.6 60.3 48.2 46.5
Cash conversion cycle 89.7 81.8 79.8 81.7
Dividend payout ratio (%) 32.5 18.7 13.5 12.7 FY07-09 implies three years ending fiscal 09; *as on terminal year; a: purchase of fixed assets (cap. advances excluded)
Inexorable fall in crude oil prices over the last few years has had a cascading effect on chemical prices with little relaxation on
volumes. Partly helped by growing portfolio of specialty chemicals, some chemical manufacturers did report conspicuous
increase in margins - for Atul from 14.8% in FY14 to 17.9% in FY16; for Aarti Industries from 15.3% to 20.6%; Deepak Nitrite
9.2% to 12.7%. Atul's overall volume growth (3%) swooned last fiscal to the lowest in three years as nerve-wracking fall in
dispatches of colors (-18%) and bulk chemicals (-11%) business barely helped sidestep stunning growth in crop protection
business.
Still shaky world crude oil markets and weak global economic output risk trampling the fragile recovery in volumes - Atul's
overall dispatches shot up 19% in Q1 and 15% in Q2- thus posing no less arduous risk to earnings. Reliance on self funded
capex - cumulative outlays to more than double in three years ending FY18- and sustained focus on value addition would help
somewhat stymie pummeling impact of low revenue growth (21.5% in FY16-18 from 56.9% in preceding three years) ensuing
from both life science chemicals and performance chemicals businesses. Robustness in asset turnover ratios (fixed asset
turnover to decline to 3.4 from 5.7; total asset: 1.6 from 2.1) would elude the conservative not least for ramp up in capex
(cumulative capex nearly a tenth of sales in FY16-18 period compared to 5.7% in the preceding period) and listless growth in
product realizations. Wariness to debt would lend it robustness to profound exigencies emanating from sudden changes in
business environment, regulatory setbacks (more pertinent to pharma) and unhealthy competition.
11
11
CD Equisearch Pvt Ltd
Equities Derivatives Commodities Distribution of Mutual Funds Distribution of Life Insurance
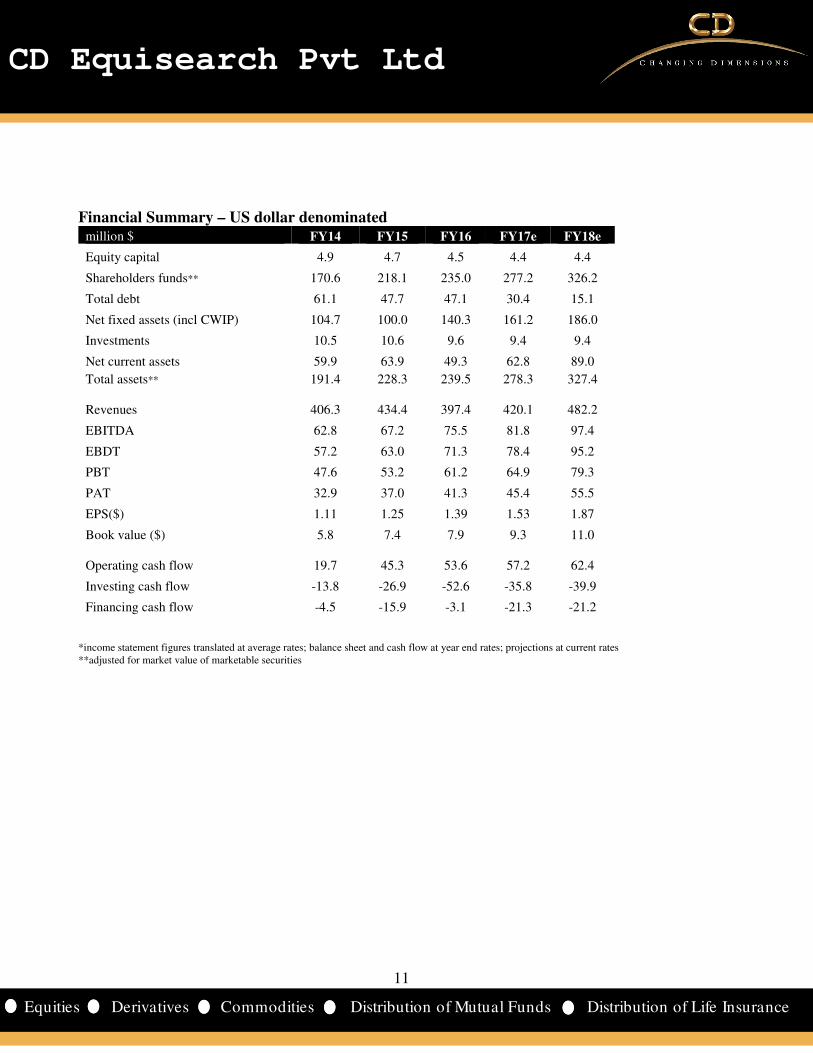
Financial Summary – US dollar denominated
million $ FY14 FY15 FY16 FY17e FY18e
Equity capital 4.9 4.7 4.5 4.4 4.4
Shareholders funds** 170.6 218.1 235.0 277.2 326.2
Total debt 61.1 47.7 47.1 30.4 15.1
Net fixed assets (incl CWIP) 104.7 100.0 140.3 161.2 186.0
Investments 10.5 10.6 9.6 9.4 9.4
Net current assets 59.9 63.9 49.3 62.8 89.0
Total assets** 191.4 228.3 239.5 278.3 327.4
Revenues 406.3 434.4 397.4 420.1 482.2
EBITDA 62.8 67.2 75.5 81.8 97.4
EBDT 57.2 63.0 71.3 78.4 95.2
PBT 47.6 53.2 61.2 64.9 79.3
PAT 32.9 37.0 41.3 45.4 55.5
EPS($) 1.11 1.25 1.39 1.53 1.87
Book value ($) 5.8 7.4 7.9 9.3 11.0
Operating cash flow 19.7 45.3 53.6 57.2 62.4
Investing cash flow -13.8 -26.9 -52.6 -35.8 -39.9
Financing cash flow -4.5 -15.9 -3.1 -21.3 -21.2
*income statement figures translated at average rates; balance sheet and cash flow at year end rates; projections at current rates **adjusted for market value of marketable securities

12
12
CD Equisearch Pvt Ltd
Equities Derivatives Commodities Distribution of Mutual Funds Distribution of Life Insurance
Disclosure& Disclaimer CD Equisearch Private Limited (hereinafter referred to as ‘CD Equi’) is a Member registered with National Stock Exchange of India Limited,
Bombay Stock Exchange Limited and Metropolitan Stock Exchange of India Limited (Formerly known as MCX Stock Exchange Limited). CD
Equi is also registered as Depository Participant with CDSL and AMFI registered Mutual Fund Advisor. The associates of CD Equi are
engaged in activities relating to NBFC-ND - Financing and Investment, Commodity Broking, Real Estate, etc.
CD Equi is registered under SEBI (Research Analysts) Regulations, 2014 with SEBI Registration no INH300002274. Further, CD Equi hereby
declares that –
• No disciplinary action has been taken against CD Equi by any of the regulatory authorities.
• CD Equi/its associates/research analysts do not have any financial interest/beneficial interest of more than one percent/material
conflict of interest in the subject company(s) (kindly disclose if otherwise).
• CD Equi/its associates/research analysts have not received any compensation from the subject company(s) during the past twelve
months.
• CD Equi/its research analysts has not served as an officer, director or employee of company covered by analysts and has not been
engaged in market making activity of the company covered by analysts.
This document is solely for the personal information of the recipient and must not be singularly used as the basis of any investment decision.
Nothing in this document should be construed as investment or financial advice. Each recipient of this document should make such
investigations as they deem necessary to arrive at an independent evaluation of an investment in the securities of the companies referred to in
this document (including the merits and risks involved) and should consult their own advisors to determine the merits and risks of such an
investment.
Reports based on technical and derivative analysis center on studying charts of a stock's price movement, outstanding positions and trading
volume, as opposed to focusing on a company's fundamentals and as such, may not match with a report on a company's fundamentals.
The information in this document has been printed on the basis of publicly available information, internal data and other reliable sources
believed to be true but we do not represent that it is accurate or complete and it should not be relied on as such, as this document is for general
guidance only. CD Equi or any of its affiliates/group companies shall not be in any way responsible for any loss or damage that may arise to
any person from any inadvertent error in the information contained in this report. CD Equi has not independently verified all the information
contained within this document. Accordingly, we cannot testify nor make any representation or warranty, express or implied, to the accuracy,
contents or data contained within this document.
While, CD Equi endeavors to update on a reasonable basis the information discussed in this material, there may be regulatory compliance or
other reasons that prevent us from doing so.
This document is being supplied to you solely for your information and its contents, information or data may not be reproduced, redistributed
or passed on, directly or indirectly. Neither, CD Equi nor its directors, employees or affiliates shall be liable for any loss or damage that may
arise from or in connection with the use of this information.
CD Equisearch Private Limited (CIN: U67120WB1995PTC071521)
Registered Office: 37, Shakespeare Sarani, 1st Floor, Kolkata – 700 017; Phone: +91(33) 4488 0000; Fax: +91(33) 2289 2557 Corporate Office: 10,
Vasawani Mansion, 5th Floor, Dinshaw Wachha Road, Churchgate, Mumbai – 400 020. Phone: +91(22) 2283 0652/0653; Fax: +91(22) 2283, 2276
Website: www.cdequi.com; Email: [email protected]
buy: >20% accumulate: >10% to ≤20% hold: ≥-10% to ≤10% reduce: ≥-20% to <-10% sell: <-20%