CCAT survey of the GEMS Legacy field in ECDF-S Shardha Jogee (UT Austin)
10
CCAT survey of the GEMS Legacy field in ECDF-S Shardha Jogee (UT Austin)
-
date post
15-Jan-2016 -
Category
Documents
-
view
228 -
download
0
Transcript of CCAT survey of the GEMS Legacy field in ECDF-S Shardha Jogee (UT Austin)
CCAT survey of the GEMS Legacy field in ECDF-S
Shardha Jogee (UT Austin)

30’
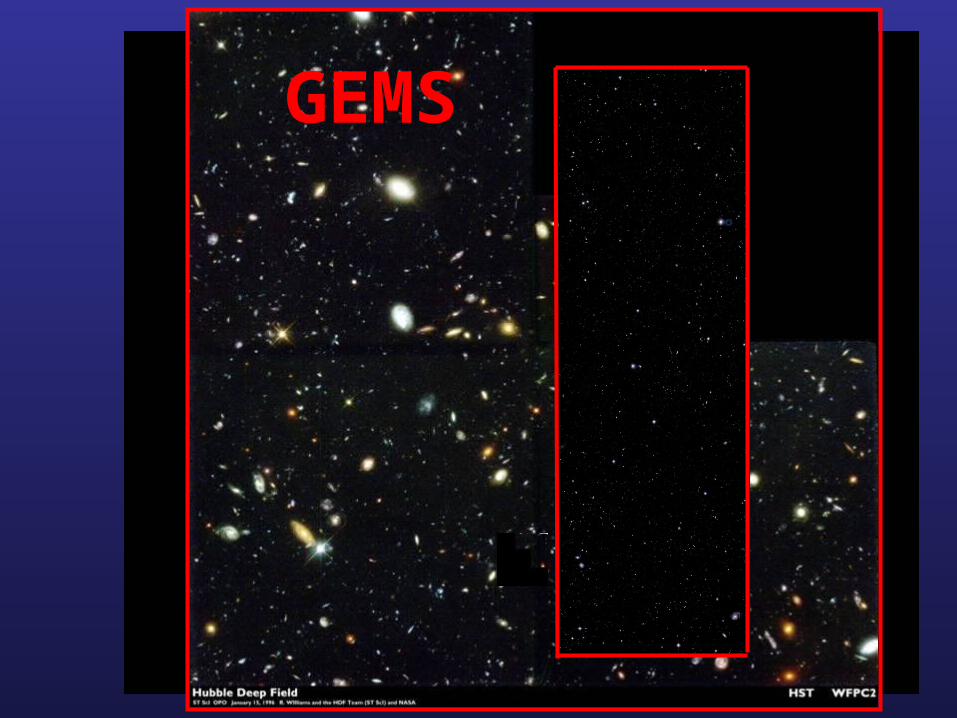
CCAT survey the legacy GEMS/Extended CDF-S field
GEMS (Galaxy Evolution from Morphology and SEDs) is the largest area 2-filter survey completed to date with HST (Rix et al. 2004)
Area : 30’x30’ = 120 x HDF = 78 x HUDF= 5 x GOODS-S
Filters : F606W (V) , F850LP (z) (26.8, 25.7 AB mag); 0.07”
Has accurate redshifts for ~9000 galaxies out to z=1.2
(Tback = 8 Gyr) from Combo-17 (Wolf et al 2004)
dz/(1+z) ] ~ 0.02 for RVega<24
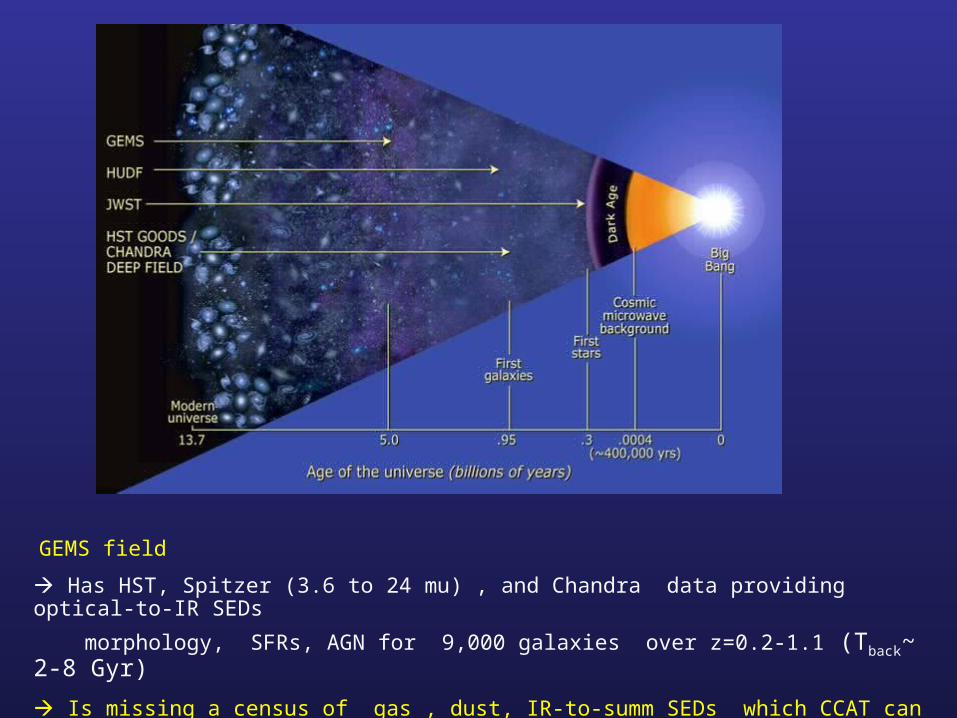
GEMS field
Has HST, Spitzer (3.6 to 24 mu) , and Chandra data providing optical-to-IR SEDs
morphology, SFRs, AGN for 9,000 galaxies over z=0.2-1.1 (Tback~ 2-8 Gyr)
Is missing a census of gas , dust, IR-to-summ SEDs which CCAT can provide
Has dec= -28 and is ideal for CCAT surveys and target follow-ups by ALMA
GEMS
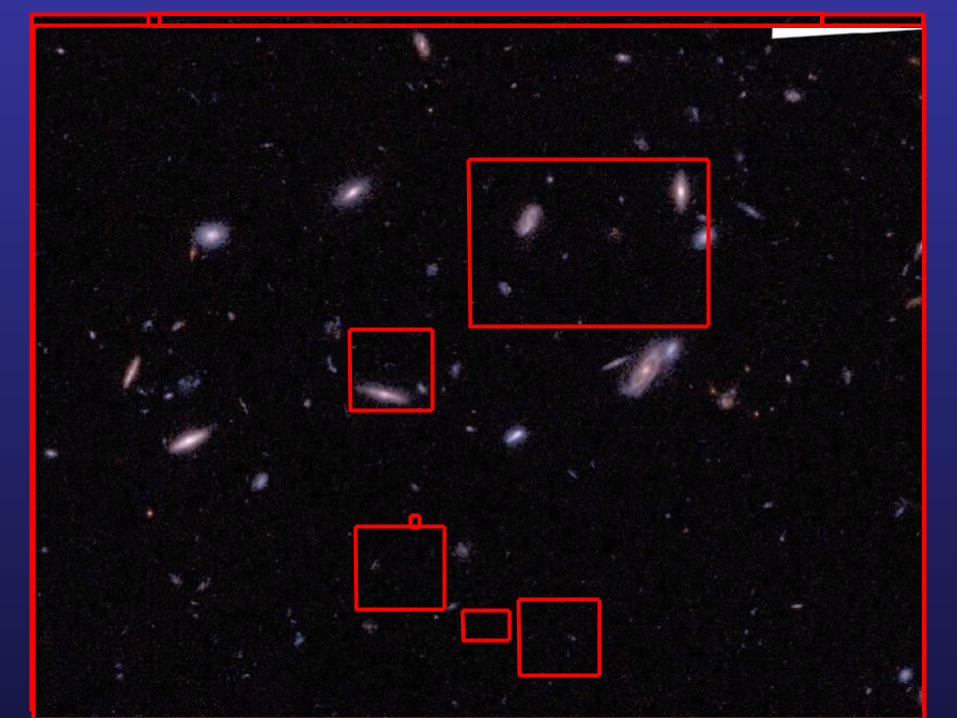
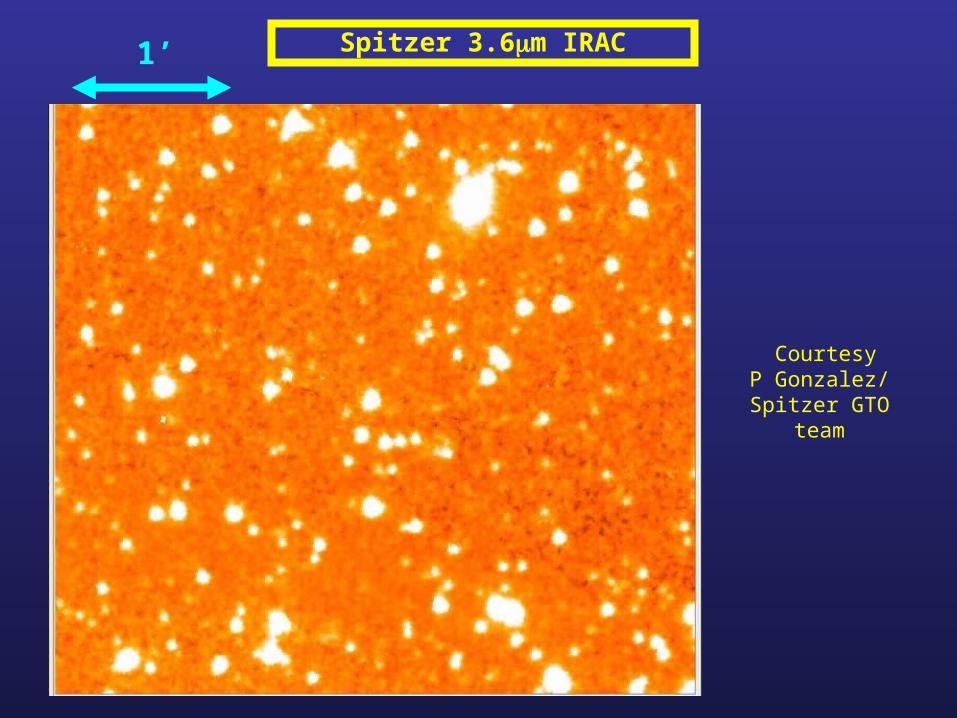
Spitzer 3.6m IRAC1’
Courtesy P Gonzalez/ Spitzer
GTO team
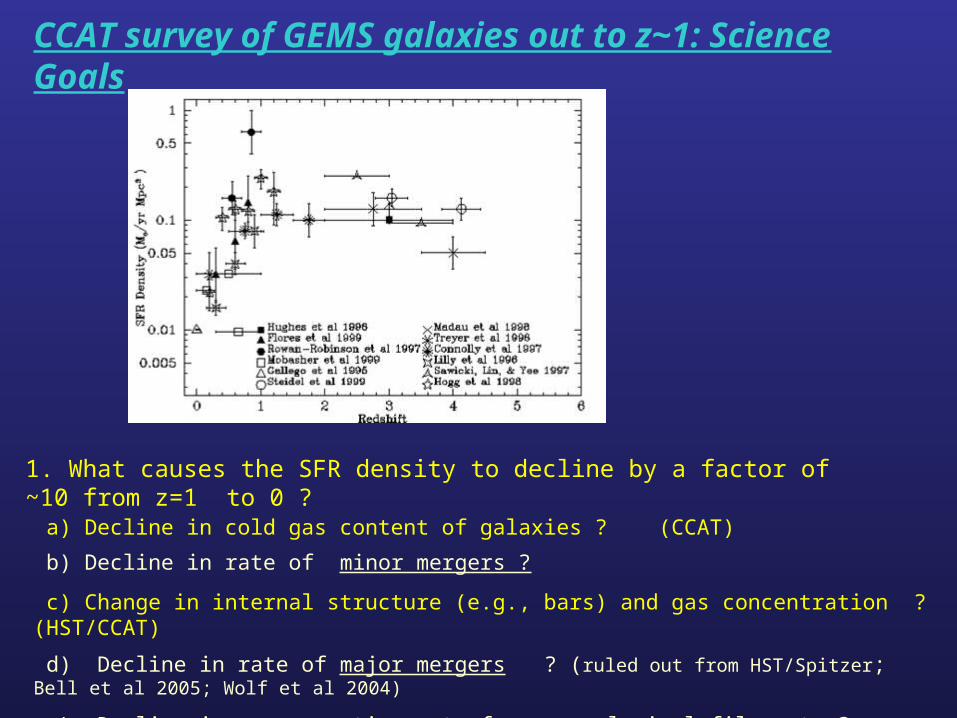
CCAT survey of GEMS galaxies out to z~1: Science Goals
a) Decline in cold gas content of galaxies ? (CCAT)
b) Decline in rate of minor mergers ?
c) Change in internal structure (e.g., bars) and gas concentration ? (HST/CCAT)
d) Decline in rate of major mergers ? (ruled out from HST/Spitzer; Bell et al 2005; Wolf et al 2004)
e) Decline in gas accretion rate from cosmological filaments ?
1. What causes the SFR density to decline by a factor of ~10 from z=1 to 0 ?
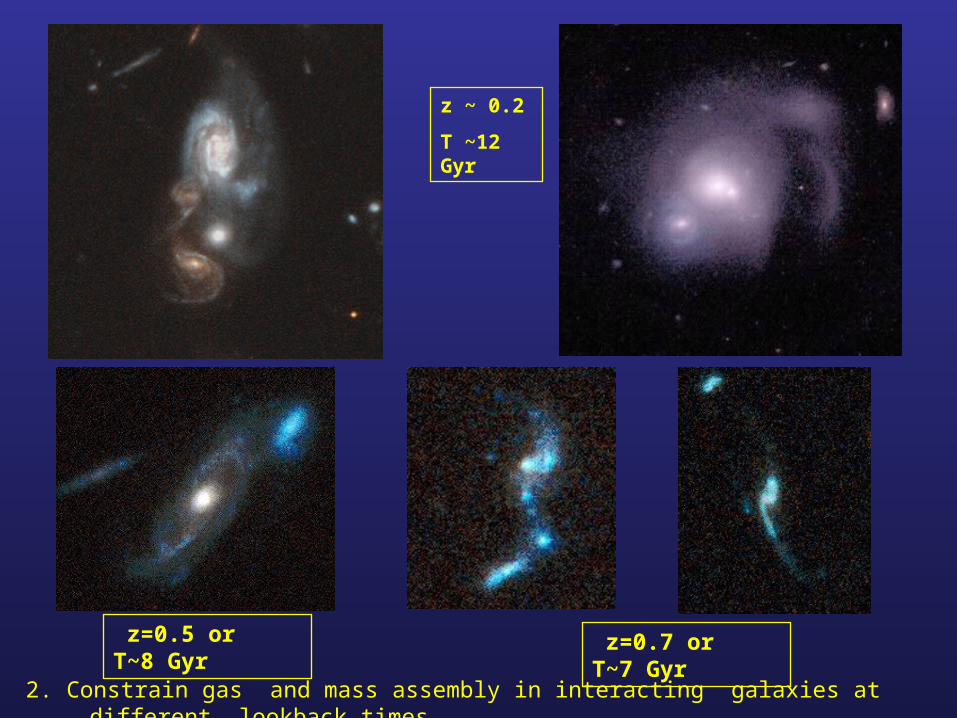
2. Constrain gas and mass assembly in interacting galaxies at different lookback times
z ~ 0.2
T ~12 Gyr
z=0.5 or T~8 Gyr z=0.7 or T~7 Gyr

3. Constrain content and concentration of gas/dust in young barred galaxies (Jogee et al. 2004) vs unbarred ones at z = 0.4-1.1 (Tback=4.5 to 8 Gyr).
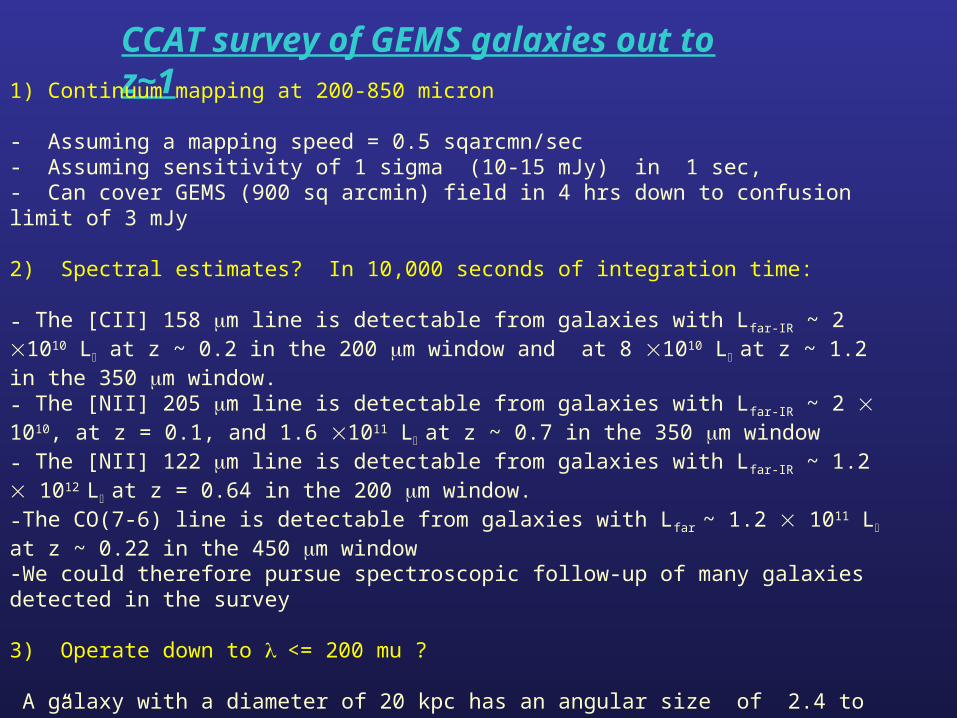
CCAT survey of GEMS galaxies out to z~11) Continuum mapping at 200-850 micron
- Assuming a mapping speed = 0.5 sqarcmn/sec- Assuming sensitivity of 1 sigma (10-15 mJy) in 1 sec, - Can cover GEMS (900 sq arcmin) field in 4 hrs down to confusion limit of 3 mJy
2) Spectral estimates? In 10,000 seconds of integration time:
- The [CII] 158 m line is detectable from galaxies with Lfar-IR ~ 2 1010 L at z ~ 0.2 in the 200 m window and at 8 1010 L at z ~ 1.2 in the 350 m window. - The [NII] 205 m line is detectable from galaxies with Lfar-IR ~ 2 1010, at z = 0.1, and 1.6 1011 L at z ~ 0.7 in the 350 m window- The [NII] 122 m line is detectable from galaxies with Lfar-IR ~ 1.2 1012 L at z = 0.64 in the 200 m window.-The CO(7-6) line is detectable from galaxies with Lfar ~ 1.2 1011 L at z ~ 0.22 in the 450 m window-We could therefore pursue spectroscopic follow-up of many galaxies detected in the survey
3) Operate down to <= 200 mu ?
A galaxy with a diameter of 20 kpc has an angular size of 2.4 to 4.6” at z=0.5-1.2. The high angular resolution (< 2”) and low confusion limit (0.04 mJy assuming 10 beams/src at <= 200 mu) will help to identify individual galaxies and reduce overblending