CBRE Hot 100 2017 winners in London’s residential … · Centre Point Residences, Camden. CBRE...
14
CBRE Hot 100 2017 winners in London’s residential market
Transcript of CBRE Hot 100 2017 winners in London’s residential … · Centre Point Residences, Camden. CBRE...

CBRE Hot 1002017 winners in London’s residential market

2–3CBRE Residential Hot 100 2017
2017 has drawn to a close and so our annual Hot 100 report is published; find out where was top in 2017.
Contents Best performing locations 4 – 5
Most affordable boroughs 6 – 7
Student destinations 8 – 9
For young’uns and old’uns 10 – 11
Rate of turnover 12 – 13
Boroughs for renters 14 – 15
For internet junkies 16 – 17
Electoral turnout 18 – 19
Highest level of development 20 – 21
Best economic performance 22 – 23

4–5CBRE Residential Hot 100 2017
Top 10 Best performing locations
£
1 Kensington & Chelsea 1,341,895
2 Westminster 1,025,978
3 Camden 839,626
4 City 812,591
5 Hammersmith & Fulham 771,031
6 Richmond 669,070
7 Islington 656,011
8 Wandsworth 608,749
9 Haringey 562,831
10 Hackney 558,097
%
1 Camden 13.4
2 Hackney 9.1
3 Haringey 7.0
4 Waltham Forest 6.3
5 Barking 5.2
6 Greenwich 4.9
7 Redbridge 4.6
8 Bexley 4.5
9 Islington 4.3
10 Havering 4.1
The top ten highest value boroughs remain the same as last year (although Hackney and Haringey have swapped positons). However, Newham, which has taken the top spot for house price growth for the last two years running, has been knocked off its top spot, and indeed out of this year’s top ten entirely. In its place, two inner London boroughs take first and second spot: Camden and Hackney. Another marked change is the extent of house price growth. This year only one borough had house price growth above 10%. Last year all but nine boroughs had double digit growth.
Source: Land Registry, House prices as at Q3, growth 2017 Q3 compared with 2016 Q3
Table 1: House prices Table 2: House price growth
Centre Point Residences, Camden

6–7CBRE Residential Hot 100 2017
Top 10 Most affordable boroughs
1 Barking & Dagenham 7.26
2 Bexley 8.48
3 Havering 9.10
4 Newham 9.13
5 Croydon 9.37
6 Sutton 9.50
7 Greenwich 9.77
8 Enfield 10.14
9 Hounslow 10.15
10 Redbridge 10.37
Using a simple ratio of average borough house prices to average London earnings, we can illustrate the most affordable boroughs. Barking and Dagenham has propelled itself from last year’s fifth most affordable borough into the top spot this year. It has displaced Bexley, which has been the most affordable borough for two years running, into second place. New entrants this year include Newham, Enfield and Hounslow.
Source: House prices as at 2017 Q3 from Land Registry. Mean earnings from ASHE 2017 survey
Table 3: House price to earnings ratio
360 Barking, Barking & Dagenham
8–9CBRE Residential Hot 100 2017
Number
1 Camden 22,207
2 Tower Hamlets 19,129
3 Southwark 18,298
4 Islington 16,783
5 Westminster 14,309
6 Newham 12,701
7 Hillingdon 11,363
8 Barnet 10,325
9 Lambeth 10,248
10 Wandsworth 9,938
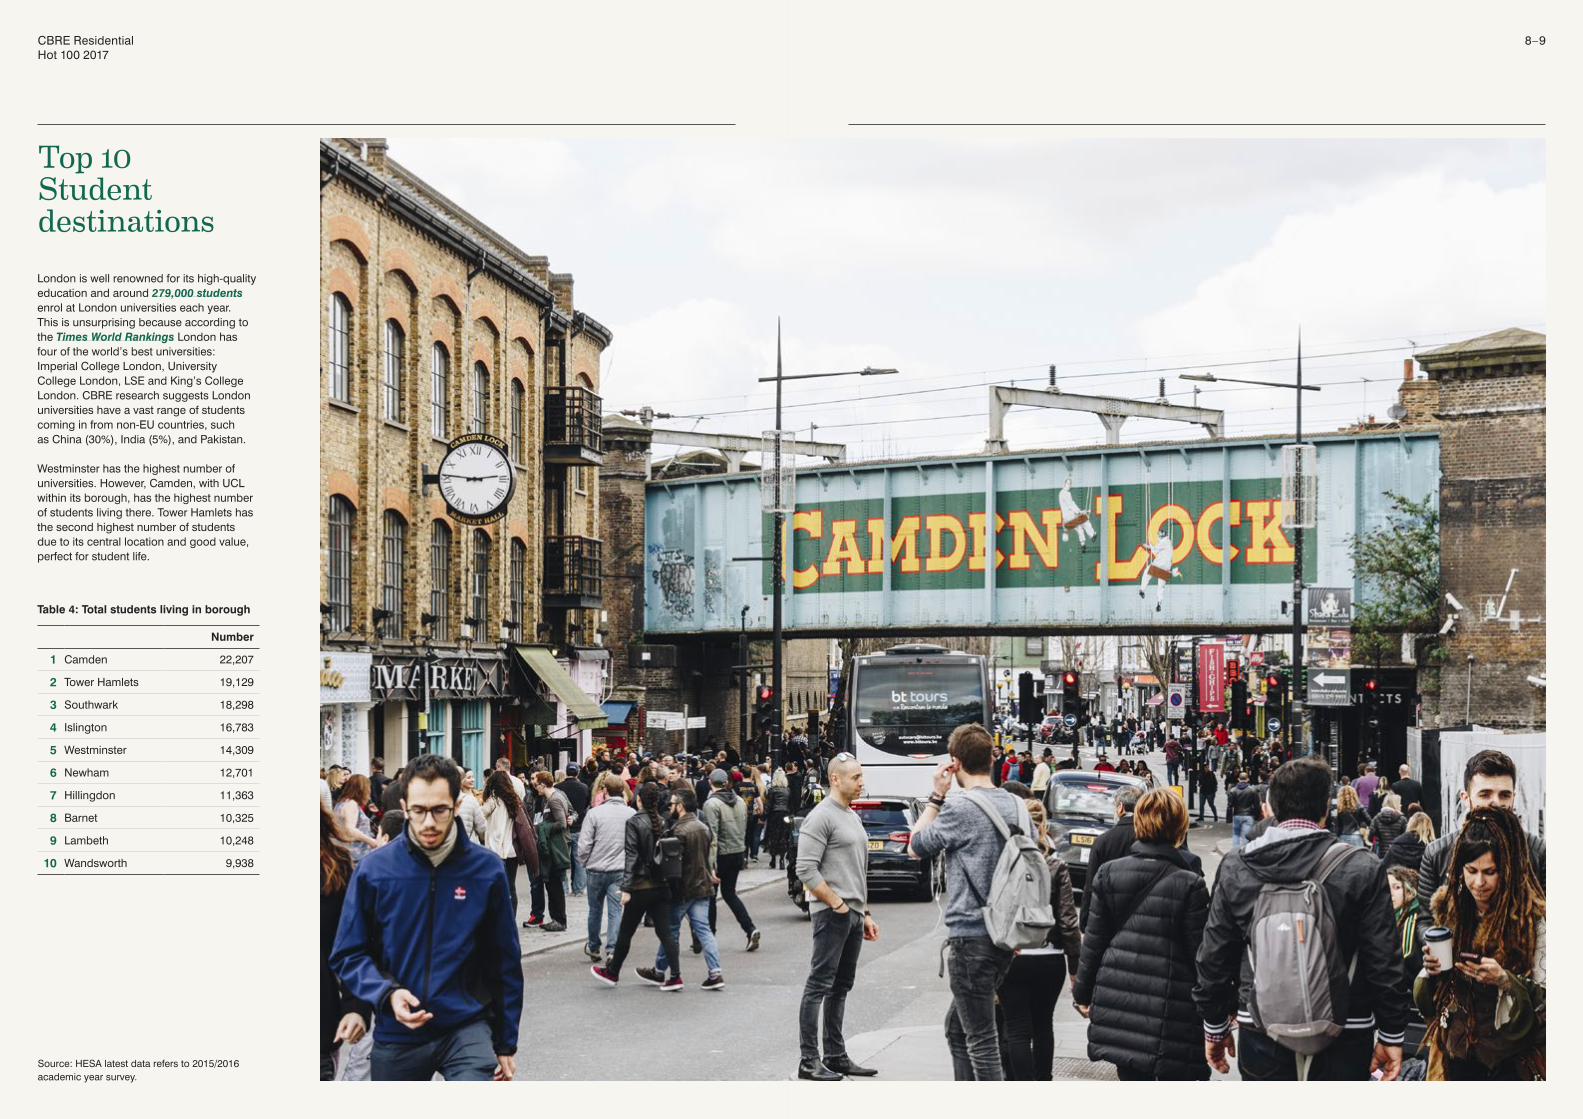
London is well renowned for its high-quality education and around 279,000 students enrol at London universities each year. This is unsurprising because according to the Times World Rankings London has four of the world’s best universities: Imperial College London, University College London, LSE and King’s College London. CBRE research suggests London universities have a vast range of students coming in from non-EU countries, such as China (30%), India (5%), and Pakistan.
Westminster has the highest number of universities. However, Camden, with UCL within its borough, has the highest number of students living there. Tower Hamlets has the second highest number of students due to its central location and good value, perfect for student life.
Top 10 Student destinations
Source: HESA latest data refers to 2015/2016 academic year survey.
Table 4: Total students living in borough
10–11CBRE Residential Hot 100 2017
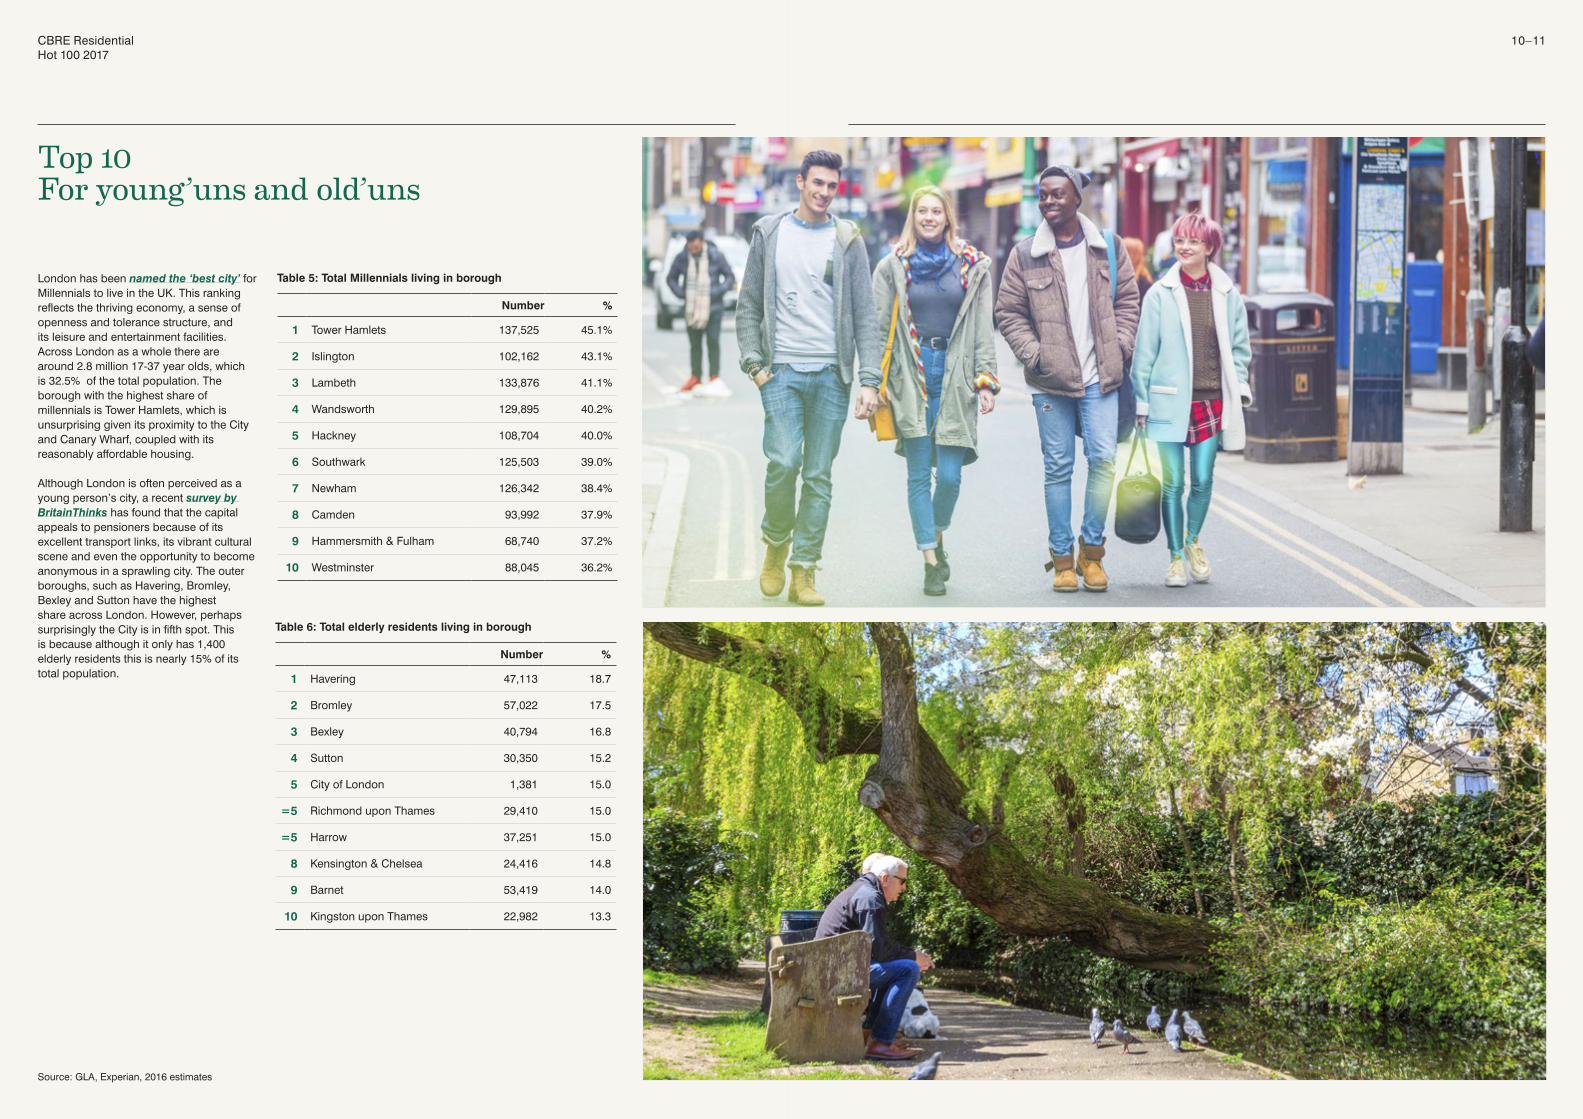
London has been named the ‘best city’ for Millennials to live in the UK. This ranking reflects the thriving economy, a sense of openness and tolerance structure, and its leisure and entertainment facilities. Across London as a whole there are around 2.8 million 17-37 year olds, which is 32.5% of the total population. The borough with the highest share of millennials is Tower Hamlets, which is unsurprising given its proximity to the City and Canary Wharf, coupled with its reasonably affordable housing.
Although London is often perceived as a young person’s city, a recent survey by BritainThinks has found that the capital appeals to pensioners because of its excellent transport links, its vibrant cultural scene and even the opportunity to become anonymous in a sprawling city. The outer boroughs, such as Havering, Bromley, Bexley and Sutton have the highest share across London. However, perhaps surprisingly the City is in fifth spot. This is because although it only has 1,400 elderly residents this is nearly 15% of its total population.
Top 10 For young’uns and old’uns
Number %
1 Tower Hamlets 137,525 45.1%
2 Islington 102,162 43.1%
3 Lambeth 133,876 41.1%
4 Wandsworth 129,895 40.2%
5 Hackney 108,704 40.0%
6 Southwark 125,503 39.0%
7 Newham 126,342 38.4%
8 Camden 93,992 37.9%
9 Hammersmith & Fulham 68,740 37.2%
10 Westminster 88,045 36.2%
Number %
1 Havering 47,113 18.7
2 Bromley 57,022 17.5
3 Bexley 40,794 16.8
4 Sutton 30,350 15.2
5 City of London 1,381 15.0
=5 Richmond upon Thames 29,410 15.0
=5 Harrow 37,251 15.0
8 Kensington & Chelsea 24,416 14.8
9 Barnet 53,419 14.0
10 Kingston upon Thames 22,982 13.3
Table 5: Total Millennials living in borough
Table 6: Total elderly residents living in borough
Source: GLA, Experian, 2016 estimates

12–13CBRE Residential Hot 100 2017
Top 10 Boroughs for turnover Over the past year there were just over 103,000 home sales in London. With a stock of just over 2.6 million private homes in London, this means 3.9% of all stock changed hands last year. However, the rate of churn differs significantly across the boroughs. Harrow has around 78,600 private homes, of these some 2,180 transacted last year, which translates to a turnover rate of 2.77%; the lowest rate of churn in London. In contrast, Islington, had at 4,550 sales, around double the number of transactions, but with a lower number of private homes than Harrow, its turnover rate is markedly higher at 7.41%.
%
1 Harrow 2.77
2 Ealing 2.87
3 Haringey 2.92
4 Camden 2.94
5 City of London 2.96
6 Enfield 2.97
7 Kensington & Chelsea 2.98
8 Redbridge 3.15
9 City of Westminster 3.16
10 Newham 3.20
%
1 Islington 7.41
2 Tower Hamlets 5.82
3 Greenwich 5.04
4 Wandsworth 4.93
5 Southwark 4.62
6 Lewisham 4.61
7 Sutton 4.53
8 Bromley 4.42
9 Lambeth 4.30
10 Havering 4.23
Table 7: Lowest turnover rate Table 8: Highest turnover rate
Source: Homes sales from Land Registry 2016 data; stock Experian 2016 estimates250 City Road, Islington
14–15CBRE Residential Hot 100 2017
Top 10 Boroughs for renters
%
1 City of London 44
2 Westminster 43
3 Kensington & Chelsea 39
4 Newham 38
5 Tower Hamlets 37
6 Camden 35
7 Hammersmith & Fulham 34
=7 Haringey 34
=7 Wandsworth 34
=10 Brent 33
=10 Hackney 33
£pcm
1 City of London £3,401
2 Kensington & Chelsea £3,350
3 Westminster £3,333
4 Camden £2,661
5 Hammersmith & Fulham £2,189
6 Lambeth £2,104
7 Islington £2,096
8 Tower Hamlets £2,079
9 Hackney £1,998
10 Wandsworth £1,961
£pcm
1 Bexley £1,058
2 Havering £1,136
3 Sutton £1,174
4 Barking & Dagenham £1,177
5 Bromley £1,266
6 Croydon £1,277
7 Enfield £1,300
8 Hillingdon £1,303
9 Redbridge £1,328
10 Bromley £1,399
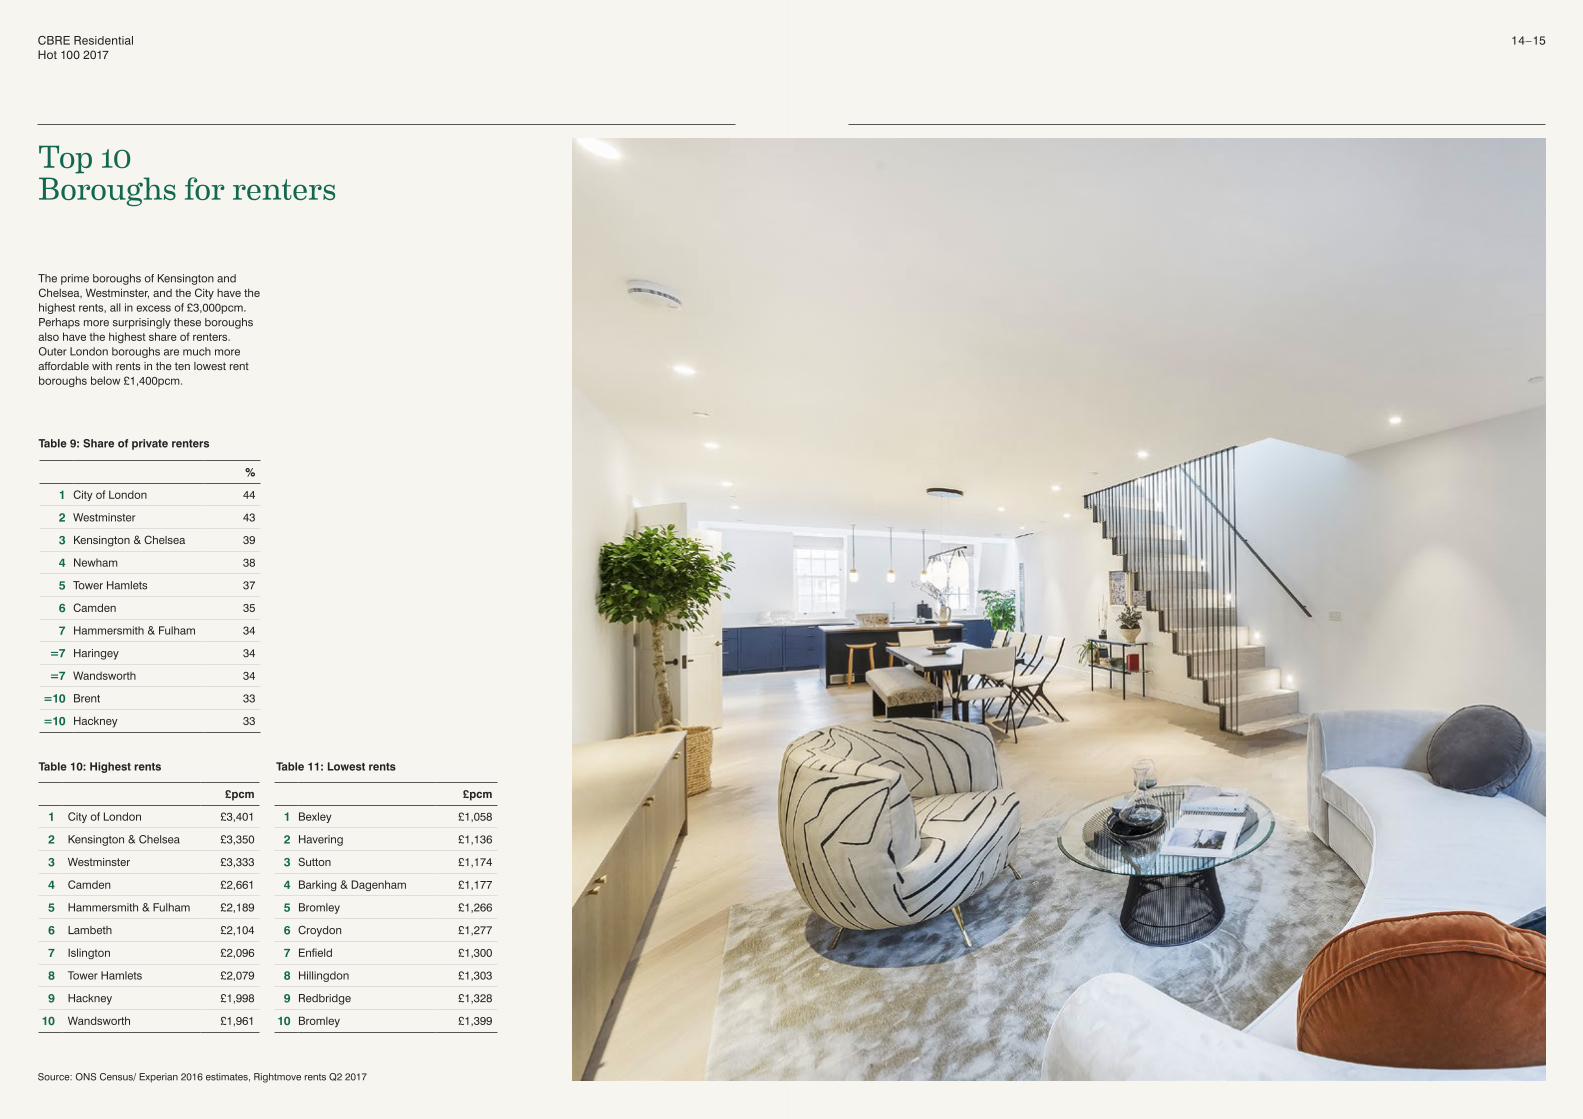
The prime boroughs of Kensington and Chelsea, Westminster, and the City have the highest rents, all in excess of £3,000pcm. Perhaps more surprisingly these boroughs also have the highest share of renters. Outer London boroughs are much more affordable with rents in the ten lowest rent boroughs below £1,400pcm.
Source: ONS Census/ Experian 2016 estimates, Rightmove rents Q2 2017
Table 9: Share of private renters
Table 10: Highest rents Table 11: Lowest rents

16–17CBRE Residential Hot 100 2017
mbps
1 Richmond upon Thames 50.8
2 Kingston upon Thames 49.6
3 Sutton 48.9
4 Hounslow 47.8
5 Bromley 47.0
6 Hillingdon 46.7
7 Merton 46.6
8 Enfield 46.3
9 Havering 45.9
10 Camden 45.5
mbps
1 Kingston upon Thames 4.6
2 Richmond upon Thames 4.5
=2 Sutton 4.5
4 Harrow 4.4
5 Hounslow 4.3
=5 Bromley 4.3
=5 Hillingdon 4.3
=5 Merton 4.3
=5 Havering 4.3
10 Barnet 4.1
Broadband internet speed isn’t just important for those wanting to check their social media accounts. According to the Department for Digital, Culture, Media and Sport digital transformation can help boost business productivity. A survey of 1,000 businesses found digital capabilities helped boost revenues by 4.4% and reduce costs by 4.3%. Although placed 23rd, the UK doesn’t fare too badly in the world’s rankings for fast internet speeds (the US is 20th, Australia 50th and China 111th ), it could learn something from its neighbour, Ireland which is placed second with an average speed of 44.85 mb/s.
As London is the tech capital of Europe with more than 130,000 companies based in the capital, digital speed is hugely important. However, the average speed for internet downloads varies significantly from borough to borough. Richmond upon Thames has the fastest download speed of 50.8 mbps. This is much higher than the London average of 39.4 mbps. Kingston upon Thames is a close second. Camden is the best performing Inner London borough with an average of 45.5 mb/s.
Top 10 For internet junkies
Table 12: Average download speeds
Table 13: Average upload speeds
Source: OFCOM survey period – year up to November 2016

18–19CBRE Residential Hot 100 2017
This year’s election had the highest turnout in a decade with 69% of the registered population voting. Turnout in many of London’s boroughs was higher than this. The largest turnout was in Haringey and Westminster at 75%, significantly surpassing the national average. They have a large student and millennial population contributing to the ‘youthquake’ that shook the election.
Top 10 Electoral turnout
Table 14: 2017 Voting results
Average turnout increased by around 4% in these high turnout boroughs compared with 2015 – the biggest increase in turnout was in Richmond upon Thames, which increased 11% from 56% in 2015 to 67% in 2017.
As illustrated in the political map of London below, Labour was the most popular political party in the majority of the boroughs; clearly this is in contrast to the resulting outcome.
Result Electorate Majority 2017 Turnout
Turnout increase
1 Haringey 152,749 49,389 75% 5%
2 Westminster 77,971 15,458 75% 5%
3 Camden 67,902 19,461 74% 2%
4 Lambeth 236,711 54,486 74% 5%
5 Southwark 170,644 22,734 73% 4%
6 Greenwich 129,684 10,651 73% 4%
7 Ealing 232,482 44,906 73% 4%
8 Bromley 288,898 63,399 73% 4%
9 Newham 150,708 45,505 72% 6%
10 Tower Hamlets 156,479 48,091 71% 4%
=10 Wandsworth 210,562 35,987 71% 3%
=10 Havering 154,221 31,703 71% 4%
=10 Kingston upon Thames 142,176 41,411 71% 5%
Source: Electoral Commission
Conservative
Labour
Liberal Democrat

20–21CBRE Residential Hot 100 2017
Top 10 Highest level of development
Units
1 Merton 257
2 Kensington & Chelsea 375
3 Bexley 378
4 Havering 400
5 Richmond upon Thames 485
6 Enfield 509
7 City of London 571
8 Kingston upon Thames 586
9 Sutton 739
10 Haringey 941
Units
1 Tower Hamlets 13,982
2 Newham 7,830
3 Greenwich 6,099
4 Wandsworth 5,257
5 Southwark 5,243
6 Brent 4,912
7 Hackney 4,058
8 Hammersmith & Fulham 3,761
9 Lambeth 3,278
10 Westminster 3,090
Units
1 Newham 14,650
2 Barnet 13,080
3 Greenwich 12,921
4 Hammersmith & Fulham 12,547
5 Tower Hamlets 12,107
6 Ealing 10,474
7 Wandsworth 9,794
8 Lewisham 8,390
9 Westminster 8,019
10 Southwark 7,270
Units
1 Richmond upon Thames 339
2 Redbridge 429
3 City of London 543
4 Sutton 575
5 Bromley 676
6 Merton 758
7 Kingston upon Thames 1,268
8 Hillingdon 1,435
9 Waltham Forest 1,693
10 Islington 1,789
As is typical across the whole of the UK, homebuilding in London falls woefully short of the levels needed. The Mayor has recently increased the target for London to 65,000 homes per annum to keep up with demand, yet for the last decade or so, we built an average of 19,000 units each year. However, some areas are leading the way; Tower Hamlets currently has 14,000 units under construction with a further 12,100 in the planning pipeline. However, Newham has the largest pipeline with nearly 15,000 units with planning permission.
Source: Molior as at November 2017. Data refers to number of units
Table 15: Highest planning permissions
Table 16: Lowest planning permisisons Table 18: Lowest under construction
Table 17: Highest under construction
London Dock, Tower Hamlets

22–23CBRE Residential Hot 100 2017
Top 10 Best economic performance
%
1 Newham 5.6
2 City of London 3.1
3 Southwark 2.9
4 Harrow 2.9
5 Islington 2.7
=5 Hounslow 2.7
7 Hackney 2.6
8 Hammersmith & Fulham 2.3
=8 Greenwich 2.3
=8 Havering 2.3
%
1 Southwark 34.4
2 Camden 34.0
3 Newham 31.2
4 Hackney 30.7
5 Islington 30.6
6 Tower Hamlets 29.5
=6 Harrow 29.5
8 Hounslow 28.9
9 Lambeth 28.8
10 Merton 28.0
%
1 City of London 1.5
2 Hammersmith & Fulham 2.6
3 Merton 3.0
4 Barnet 3.1
5 Wandsworth 3.2
6 Havering 3.4
=6 Hillingdon 3.4
8 Sutton 3.5
9 Kingston upon Thames 3.6
10 Bromley 3.7
%
1 Harrow 11.0
2 Camden 10.7
3 Greenwich 10.3
=3 Tower Hamlets 10.3
=3 Hackney 10.3
=3 Southwark 10.3
7 Redbridge 9.9
8 Havering 9.6
9 Islington 9.4
=9 Newham 9.4
The housing market is inextricably linked to the underlying economic performance of an area. As economic growth increases and as employment increases, the demand for housing increases. Last year’s second place borough, Newham, takes the top spot with the highest GDP growth last year and is expected to grow the third fastest over the next decade. Camden has both the second highest expected GDP growth and employment growth.
Notes: GDP and unemployment rate refers to current estimates for the average rate over 2017. Source: Oxford Economics
Table 19: Highest GDP growth
Table 20: Largest forecast GDP growth 2017 to 2027
Table 22: Highest employment growth 2017 to 2027
Table 21: Lowest unemployment rate

24–25CBRE Residential Hot 100 2017
Jennet SiebritsHead of Residential Research Senior Director
T: +44 (0)20 7182 2066 E: [email protected]
Mark CollinsLondon Residential Chairman
T: +44 (0)20 7182 2264 E: [email protected]
Photography Front Cover: © encrier / depositphotos.com, P8–9: © DaLiu /depositphotos.com, bottom image P10–11: © Wei Huang / Shutterstock.com, P22–23: © Marius_Comanescu / Shutterstock.com
Disclaimer 2017 CBRE
CBRE Limited confirms that information contained herein, including projections, has been obtained from sources believed to be reliable. While we do not doubt their accuracy, we have not verified them and make no guarantee, warranty or representation about them. It is your responsibility to confirm independently their accuracy and completeness. This information is presented exclusively for use by CBRE clients and professionals and all rights to the material are reserved and cannot be reproduced without prior written permission of CBRE.
© 2017 CBRE Ltd.