Cautious yet exciting - bfi.co.id · BFI Finance and Adira remain standouts Among peers, BFI...
16
Financial Services Sector outlook Multi-finance industry’s financing growth Source: CLSA, Financial Service Authority (OJK) Find CLSA research on Bloomberg, Thomson Reuters, Factset and CapitalIQ - and profit from our evalu@tor proprietary database at clsa.com For important disclosures please refer to page 12. 22.4% 15.8% 6.1% -0.7% 5.5% 5.6% 6.2% 7.2% 7.6% 7.5% 7.9% -5.0% 0.0% 5.0% 10.0% 15.0% 20.0% 25.0% 2012 2013 2014 2015 2016 Jan'17 Feb'17 Mar'17 Apr'17 May'17 June'17 Marisa Wijayanto [email protected] +62 21 2554 8825 Sarina Lesmina, CFA +62 21 2554 8820 21 August 2017 Indonesia Financial services www.clsa.com Cautious yet exciting Stronger financing growth, but still cautious on asset quality In the last six months, the multi-finance industry’s financing growth has increased from 5.5% YoY in December 2016 to 7.9% YoY in June 2017. The industry also managed to book double-digit bottomline growth in 1H17. However, the non-performing financing (NPF) ratio still crept up by 31bps QoQ to 3.47% in 2Q17. Among the listed companies, BFI Finance and Adira remain standouts. Increasing trend of financing growth In 1H17, several multi-finance firms booked quite impressive new financing. BFI Finance booked the highest new financing growth in 1H17 (+30% YoY). Astra’s 4W multi-finance firms, TAFS and ACC booked +10% and +8% YoY new financing growth, respectively, in 1H17. Meanwhile, bank-owned firms BCA Finance and Adira booked +8% and 5% YoY new financing growth, respectively, in 1H17. Stabilising double-digit net profit growth In 1H17, the multi-finance industry managed to book +11% YoY net profit growth. BFI Finance booked the highest net profit growth (+55% YoY) in 1H17. Meanwhile, Mandiri Tunas Finance (MTF) booked the lowest net profit growth due to portfolio shifting and higher provision expense. In terms of absolute amount, FIF booked the highest net profit amount, reaching Rp930bn in 1H17, followed by Adira (Rp681bn) and BCA Finance (Rp641bn). Still cautious asset quality The NPF ratio increased by 31bps QoQ to 3.47% in 2Q17. Cost of credit (CoC) also increased by 34bps QoQ to 3.1% in 2Q17. Several multi-finance firms claimed that the increasing NPF and CoC were mainly due to Lebaran. We still see increasing trend of cost of credit (CoC), mainly for Clipan. Clipan booked the highest cost of credit, reaching 4.7% in 1H17. Meanwhile, BCA Finance booked the lowest cost of credit (1.4%), followed by Toyota Astra Finance (1.7%). As asset quality is still vulnerable, most multi-finance firms focus more on Java. Interestingly, we saw more appetite in the heavy equipment segment. Astra’s HE financing firms SANF and KAF booked strong growth in the last two quarters. BFI Finance and Adira remain standouts Among peers, BFI Finance booked the strongest new financing and net profit growth. BFI Finance targets its 2017 new financing to grow above 21% YoY. With potentially lower CoF and CoC, Adira is optimistic to reach above 15% YoY net profit growth in 2017, after +52% YoY net profit growth in 2016. We appreciate your support in the Asiamoney Brokers Poll. Please click here to use our voting matrix for this year.
-
Upload
duonghuong -
Category
Documents
-
view
225 -
download
1
Transcript of Cautious yet exciting - bfi.co.id · BFI Finance and Adira remain standouts Among peers, BFI...
Financial Services Sector outlook
Multi-finance industry’s financing growth
Source: CLSA, Financial Service Authority (OJK)
Find CLSA research on Bloomberg, Thomson Reuters, Factset and CapitalIQ - and profit from our evalu@tor proprietary database at clsa.com
For important disclosures please refer to page 12.
22.4%
15.8%
6.1%
-0.7%
5.5% 5.6% 6.2%
7.2% 7.6% 7.5% 7.9%
-5.0%
0.0%
5.0%
10.0%
15.0%
20.0%
25.0%
2012 2013 2014 2015 2016 Jan'17 Feb'17 Mar'17 Apr'17 May'17 June'17
Marisa Wijayanto [email protected] +62 21 2554 8825
Sarina Lesmina, CFA +62 21 2554 8820
21 August 2017
Indonesia Financial services
www.clsa.com
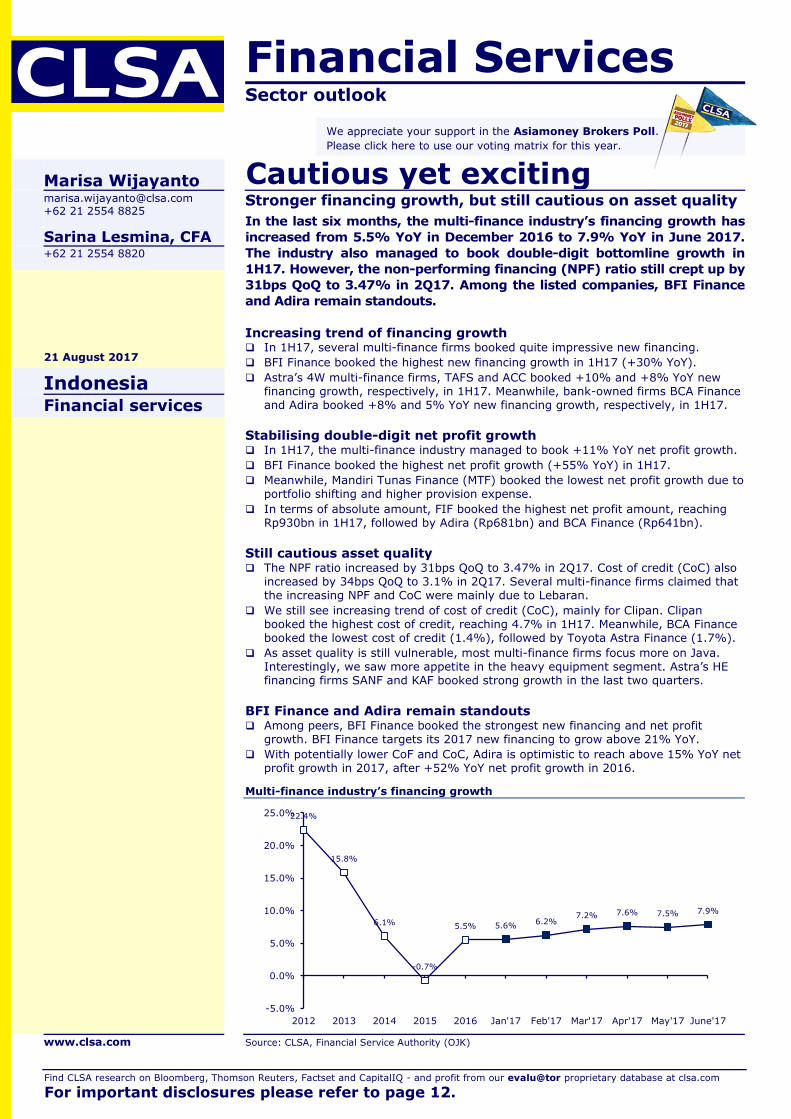
Cautious yet exciting Stronger financing growth, but still cautious on asset quality
In the last six months, the multi-finance industry’s financing growth has
increased from 5.5% YoY in December 2016 to 7.9% YoY in June 2017.
The industry also managed to book double-digit bottomline growth in
1H17. However, the non-performing financing (NPF) ratio still crept up by
31bps QoQ to 3.47% in 2Q17. Among the listed companies, BFI Finance
and Adira remain standouts.
Increasing trend of financing growth In 1H17, several multi-finance firms booked quite impressive new financing.
BFI Finance booked the highest new financing growth in 1H17 (+30% YoY).
Astra’s 4W multi-finance firms, TAFS and ACC booked +10% and +8% YoY new financing growth, respectively, in 1H17. Meanwhile, bank-owned firms BCA Finance and Adira booked +8% and 5% YoY new financing growth, respectively, in 1H17.
Stabilising double-digit net profit growth In 1H17, the multi-finance industry managed to book +11% YoY net profit growth.
BFI Finance booked the highest net profit growth (+55% YoY) in 1H17.
Meanwhile, Mandiri Tunas Finance (MTF) booked the lowest net profit growth due to portfolio shifting and higher provision expense.
In terms of absolute amount, FIF booked the highest net profit amount, reaching Rp930bn in 1H17, followed by Adira (Rp681bn) and BCA Finance (Rp641bn).
Still cautious asset quality The NPF ratio increased by 31bps QoQ to 3.47% in 2Q17. Cost of credit (CoC) also
increased by 34bps QoQ to 3.1% in 2Q17. Several multi-finance firms claimed that the increasing NPF and CoC were mainly due to Lebaran.
We still see increasing trend of cost of credit (CoC), mainly for Clipan. Clipan booked the highest cost of credit, reaching 4.7% in 1H17. Meanwhile, BCA Finance booked the lowest cost of credit (1.4%), followed by Toyota Astra Finance (1.7%).
As asset quality is still vulnerable, most multi-finance firms focus more on Java. Interestingly, we saw more appetite in the heavy equipment segment. Astra’s HE financing firms SANF and KAF booked strong growth in the last two quarters.
BFI Finance and Adira remain standouts Among peers, BFI Finance booked the strongest new financing and net profit
growth. BFI Finance targets its 2017 new financing to grow above 21% YoY.
With potentially lower CoF and CoC, Adira is optimistic to reach above 15% YoY net profit growth in 2017, after +52% YoY net profit growth in 2016.
We appreciate your support in the Asiamoney Brokers Poll.
Please click here to use our voting matrix for this year.
Cautious yet exciting Financial Services
21 August 2017 [email protected] 2
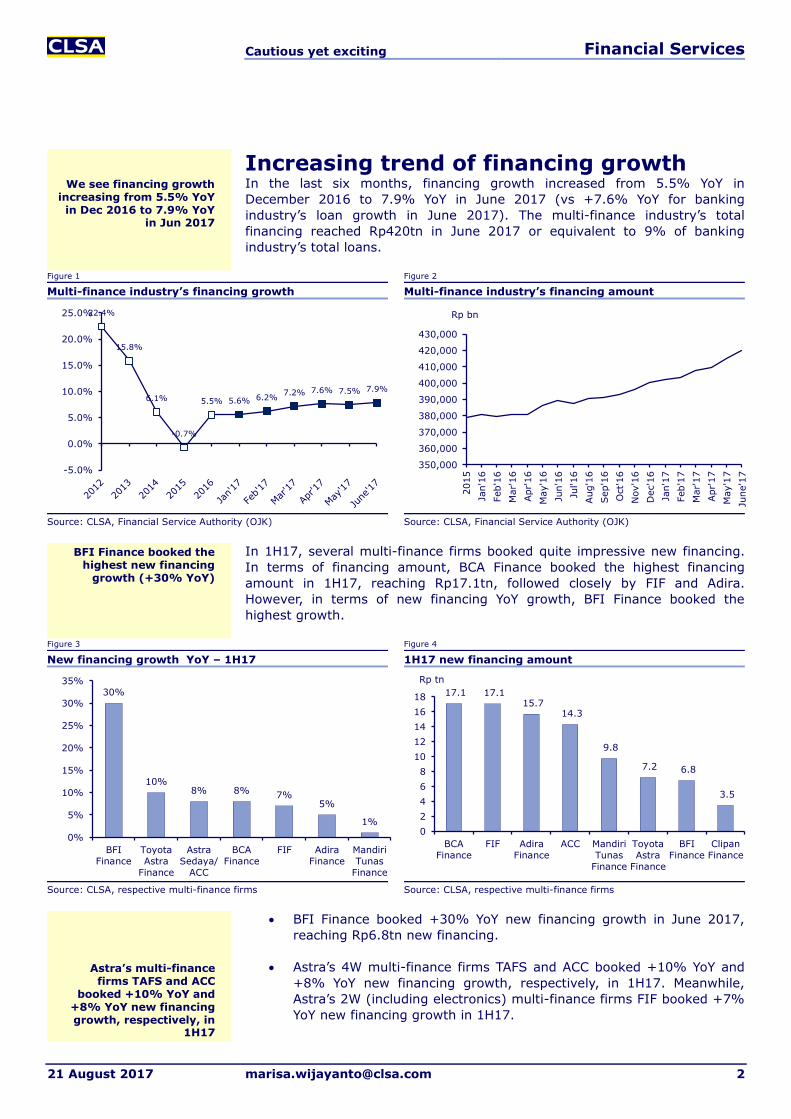
Increasing trend of financing growth In the last six months, financing growth increased from 5.5% YoY in
December 2016 to 7.9% YoY in June 2017 (vs +7.6% YoY for banking
industry’s loan growth in June 2017). The multi-finance industry’s total
financing reached Rp420tn in June 2017 or equivalent to 9% of banking
industry’s total loans.
Figure 1 Figure 2
Multi-finance industry’s financing growth Multi-finance industry’s financing amount
Source: CLSA, Financial Service Authority (OJK) Source: CLSA, Financial Service Authority (OJK)
In 1H17, several multi-finance firms booked quite impressive new financing.
In terms of financing amount, BCA Finance booked the highest financing
amount in 1H17, reaching Rp17.1tn, followed closely by FIF and Adira.
However, in terms of new financing YoY growth, BFI Finance booked the
highest growth.
Figure 3 Figure 4
New financing growth YoY – 1H17 1H17 new financing amount
Source: CLSA, respective multi-finance firms Source: CLSA, respective multi-finance firms
BFI Finance booked +30% YoY new financing growth in June 2017,
reaching Rp6.8tn new financing.
Astra’s 4W multi-finance firms TAFS and ACC booked +10% YoY and
+8% YoY new financing growth, respectively, in 1H17. Meanwhile,
Astra’s 2W (including electronics) multi-finance firms FIF booked +7%
YoY new financing growth in 1H17.
22.4%
15.8%
6.1%
-0.7%
5.5% 5.6% 6.2% 7.2% 7.6% 7.5% 7.9%
-5.0%
0.0%
5.0%
10.0%
15.0%
20.0%
25.0%
350,000
360,000
370,000
380,000
390,000
400,000
410,000
420,000
430,000
2015
Jan'1
6
Feb'1
6
Mar'
16
Apr'16
May'1
6
Jun'1
6
Jul'16
Aug'1
6
Sep'1
6
Oct'16
Nov'1
6
Dec'1
6
Jan'1
7
Feb'1
7
Mar'
17
Apr'17
May'1
7
June'1
7
Rp bn
30%
10% 8% 8% 7%
5%
1%
0%
5%
10%
15%
20%
25%
30%
35%
BFI
Finance
Toyota
Astra
Finance
Astra
Sedaya/
ACC
BCA
Finance
FIF Adira
Finance
Mandiri
Tunas
Finance
17.1 17.1 15.7
14.3
9.8
7.2 6.8
3.5
0
2
4
6
8
10
12
14
16
18
BCA
Finance
FIF Adira
Finance
ACC Mandiri
Tunas
Finance
Toyota
Astra
Finance
BFI
Finance
Clipan
Finance
Rp tn
We see financing growth increasing from 5.5% YoY in Dec 2016 to 7.9% YoY
in Jun 2017
BFI Finance booked the highest new financing
growth (+30% YoY)
Astra’s multi-finance firms TAFS and ACC
booked +10% YoY and +8% YoY new financing growth, respectively, in
1H17
Cautious yet exciting Financial Services
21 August 2017 [email protected] 3
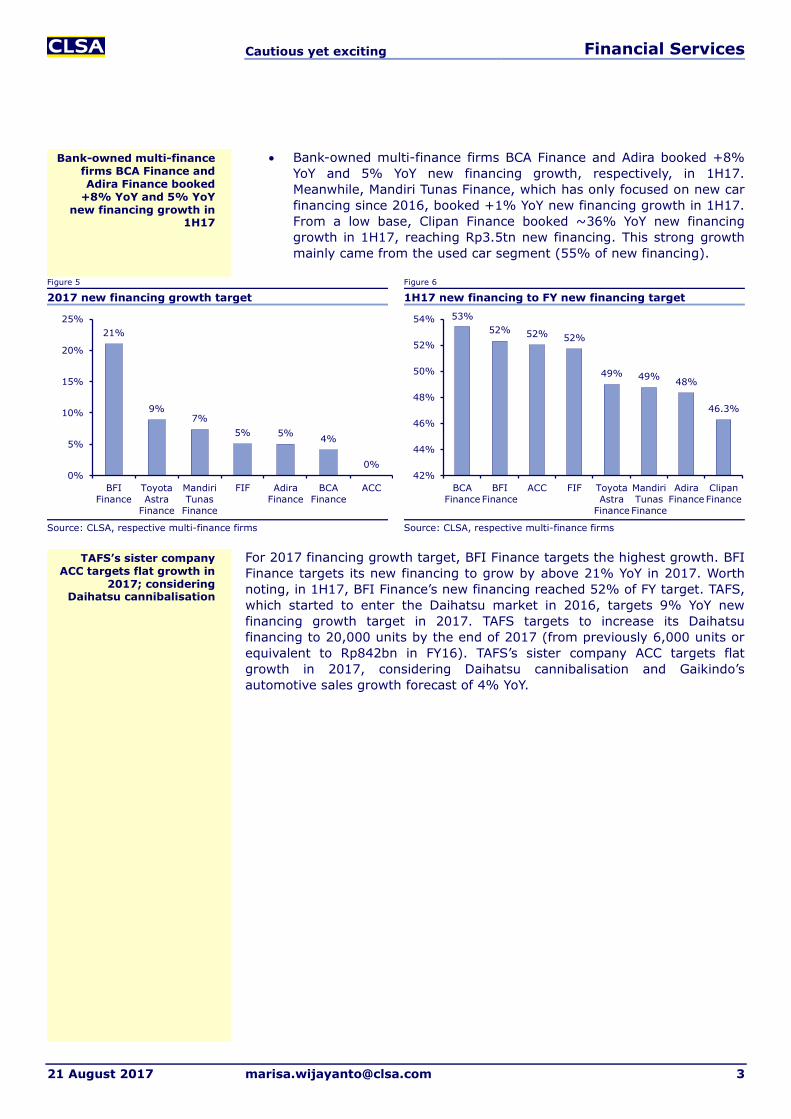
Bank-owned multi-finance firms BCA Finance and Adira booked +8%
YoY and 5% YoY new financing growth, respectively, in 1H17.
Meanwhile, Mandiri Tunas Finance, which has only focused on new car
financing since 2016, booked +1% YoY new financing growth in 1H17.
From a low base, Clipan Finance booked ~36% YoY new financing
growth in 1H17, reaching Rp3.5tn new financing. This strong growth
mainly came from the used car segment (55% of new financing).
Figure 5 Figure 6
2017 new financing growth target 1H17 new financing to FY new financing target
Source: CLSA, respective multi-finance firms Source: CLSA, respective multi-finance firms
For 2017 financing growth target, BFI Finance targets the highest growth. BFI
Finance targets its new financing to grow by above 21% YoY in 2017. Worth
noting, in 1H17, BFI Finance’s new financing reached 52% of FY target. TAFS,
which started to enter the Daihatsu market in 2016, targets 9% YoY new
financing growth target in 2017. TAFS targets to increase its Daihatsu
financing to 20,000 units by the end of 2017 (from previously 6,000 units or
equivalent to Rp842bn in FY16). TAFS’s sister company ACC targets flat
growth in 2017, considering Daihatsu cannibalisation and Gaikindo’s
automotive sales growth forecast of 4% YoY.
21%
9% 7%
5% 5% 4%
0% 0%
5%
10%
15%
20%
25%
BFI
Finance
Toyota
Astra
Finance
Mandiri
Tunas
Finance
FIF Adira
Finance
BCA
Finance
ACC
53%
52% 52% 52%
49% 49% 48%
46.3%
42%
44%
46%
48%
50%
52%
54%
BCA
Finance
BFI
Finance
ACC FIF Toyota
Astra
Finance
Mandiri
Tunas
Finance
Adira
Finance
Clipan
Finance
Bank-owned multi-finance firms BCA Finance and Adira Finance booked
+8% YoY and 5% YoY new financing growth in
1H17
TAFS’s sister company ACC targets flat growth in
2017; considering Daihatsu cannibalisation
Cautious yet exciting Financial Services
21 August 2017 [email protected] 4
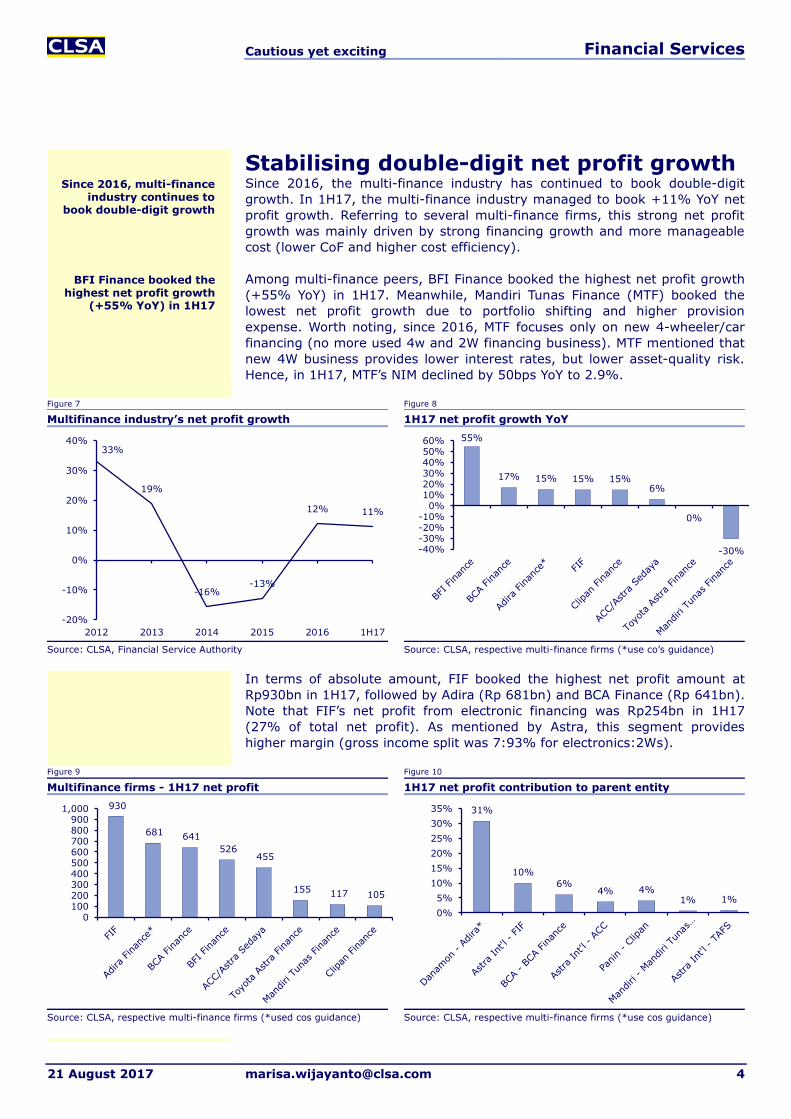
Stabilising double-digit net profit growth Since 2016, the multi-finance industry has continued to book double-digit
growth. In 1H17, the multi-finance industry managed to book +11% YoY net
profit growth. Referring to several multi-finance firms, this strong net profit
growth was mainly driven by strong financing growth and more manageable
cost (lower CoF and higher cost efficiency).
Among multi-finance peers, BFI Finance booked the highest net profit growth
(+55% YoY) in 1H17. Meanwhile, Mandiri Tunas Finance (MTF) booked the
lowest net profit growth due to portfolio shifting and higher provision
expense. Worth noting, since 2016, MTF focuses only on new 4-wheeler/car
financing (no more used 4w and 2W financing business). MTF mentioned that
new 4W business provides lower interest rates, but lower asset-quality risk.
Hence, in 1H17, MTF’s NIM declined by 50bps YoY to 2.9%.
Figure 7 Figure 8
Multifinance industry’s net profit growth 1H17 net profit growth YoY
Source: CLSA, Financial Service Authority Source: CLSA, respective multi-finance firms (*use co’s guidance)
In terms of absolute amount, FIF booked the highest net profit amount at
Rp930bn in 1H17, followed by Adira (Rp 681bn) and BCA Finance (Rp 641bn).
Note that FIF’s net profit from electronic financing was Rp254bn in 1H17
(27% of total net profit). As mentioned by Astra, this segment provides
higher margin (gross income split was 7:93% for electronics:2Ws).
Figure 9 Figure 10
Multifinance firms - 1H17 net profit 1H17 net profit contribution to parent entity
Source: CLSA, respective multi-finance firms (*used cos guidance) Source: CLSA, respective multi-finance firms (*use cos guidance)
33%
19%
-16% -13%
12% 11%
-20%
-10%
0%
10%
20%
30%
40%
2012 2013 2014 2015 2016 1H17
55%
17% 15% 15% 15% 6%
0%
-30% -40%-30%-20%-10%
0%10%20%30%40%50%60%
930
681 641
526 455
155 117 105
0100200300400500600700800900
1,000 31%
10%
6% 4% 4%
1% 1%
0%
5%
10%
15%
20%
25%
30%
35%
Since 2016, multi-finance industry continues to
book double-digit growth
BFI Finance booked the highest net profit growth
(+55% YoY) in 1H17
Cautious yet exciting Financial Services
21 August 2017 [email protected] 5
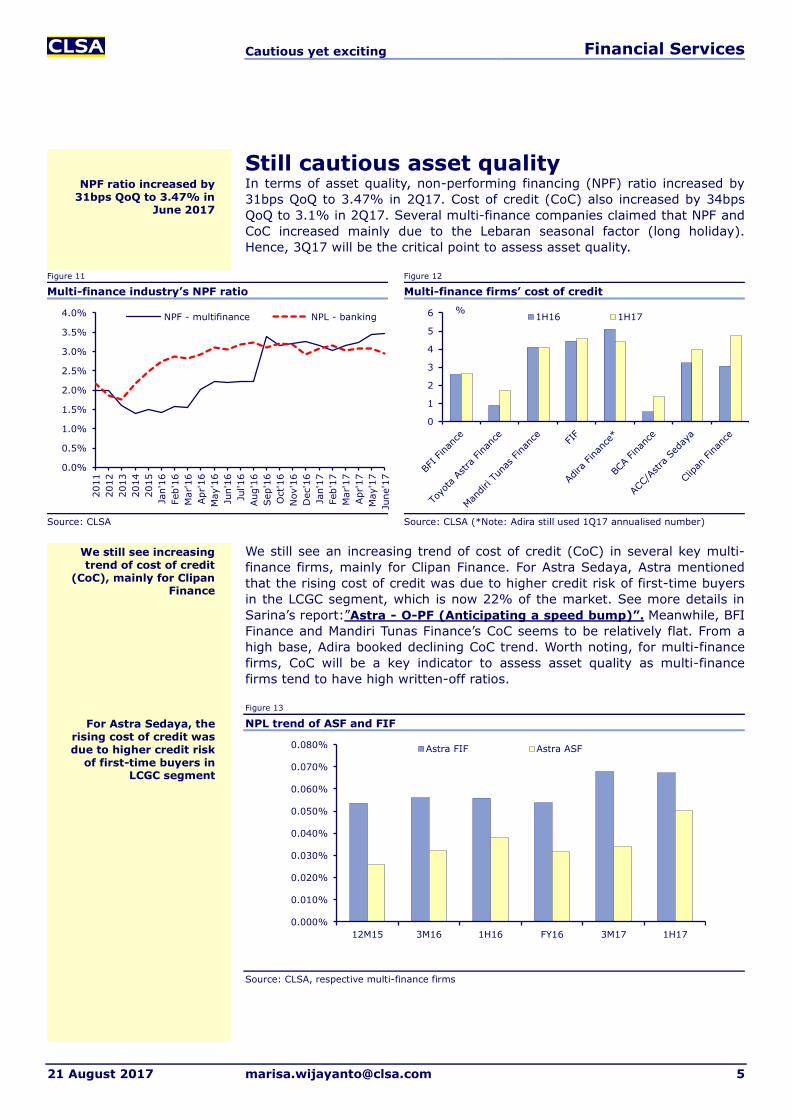
Still cautious asset quality In terms of asset quality, non-performing financing (NPF) ratio increased by
31bps QoQ to 3.47% in 2Q17. Cost of credit (CoC) also increased by 34bps
QoQ to 3.1% in 2Q17. Several multi-finance companies claimed that NPF and
CoC increased mainly due to the Lebaran seasonal factor (long holiday).
Hence, 3Q17 will be the critical point to assess asset quality.
Figure 11 Figure 12
Multi-finance industry’s NPF ratio Multi-finance firms’ cost of credit
Source: CLSA Source: CLSA (*Note: Adira still used 1Q17 annualised number)
We still see an increasing trend of cost of credit (CoC) in several key multi-
finance firms, mainly for Clipan Finance. For Astra Sedaya, Astra mentioned
that the rising cost of credit was due to higher credit risk of first-time buyers
in the LCGC segment, which is now 22% of the market. See more details in
Sarina’s report:”Astra - O-PF (Anticipating a speed bump)”. Meanwhile, BFI
Finance and Mandiri Tunas Finance’s CoC seems to be relatively flat. From a
high base, Adira booked declining CoC trend. Worth noting, for multi-finance
firms, CoC will be a key indicator to assess asset quality as multi-finance
firms tend to have high written-off ratios.
Figure 13
NPL trend of ASF and FIF
Source: CLSA, respective multi-finance firms
0.0%
0.5%
1.0%
1.5%
2.0%
2.5%
3.0%
3.5%
4.0%
2011
2012
2013
2014
2015
Jan'1
6
Feb'1
6
Mar'
16
Apr'16
May'1
6
Jun'1
6
Jul'16
Aug'1
6
Sep'1
6
Oct'16
Nov'1
6
Dec'1
6
Jan'1
7
Feb'1
7
Mar'
17
Apr'17
May'1
7
June'1
7
NPF - multifinance NPL - banking
0
1
2
3
4
5
6 % 1H16 1H17
0.000%
0.010%
0.020%
0.030%
0.040%
0.050%
0.060%
0.070%
0.080%
12M15 3M16 1H16 FY16 3M17 1H17
Astra FIF Astra ASF
NPF ratio increased by 31bps QoQ to 3.47% in
June 2017
We still see increasing trend of cost of credit
(CoC), mainly for Clipan Finance
For Astra Sedaya, the rising cost of credit was due to higher credit risk
of first-time buyers in LCGC segment
Cautious yet exciting Financial Services
21 August 2017 [email protected] 6
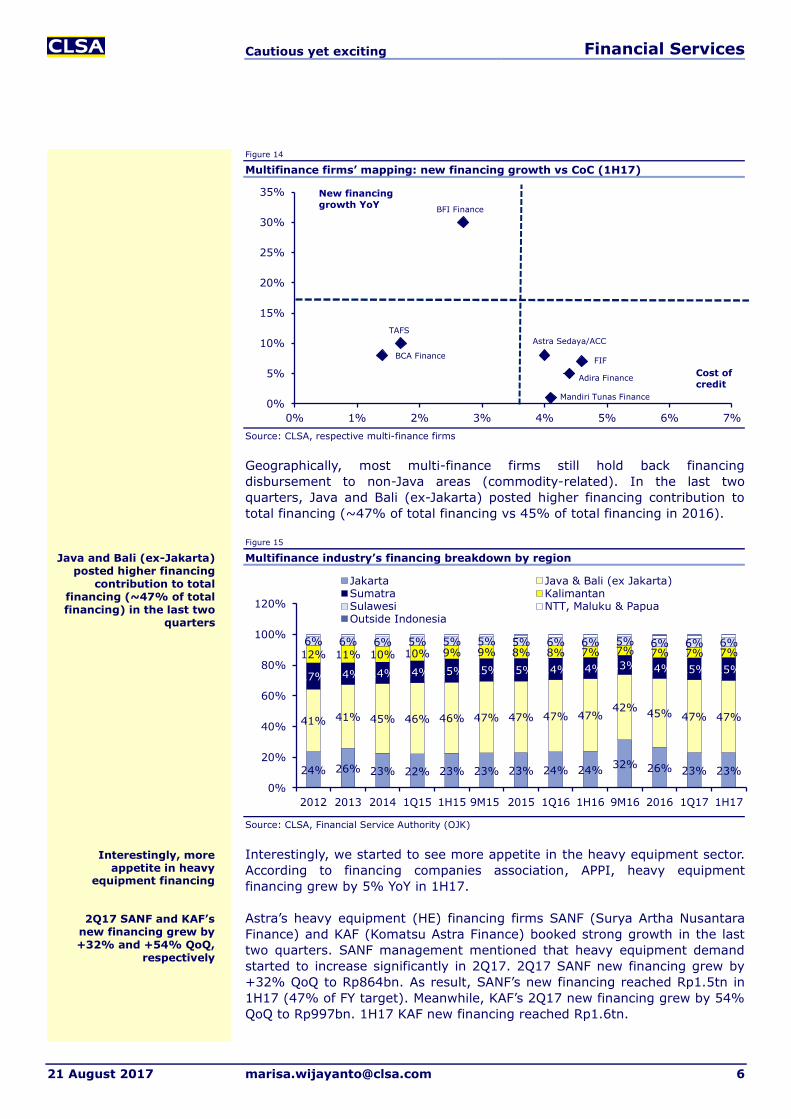
Figure 14
Multifinance firms’ mapping: new financing growth vs CoC (1H17)
Source: CLSA, respective multi-finance firms
Geographically, most multi-finance firms still hold back financing
disbursement to non-Java areas (commodity-related). In the last two
quarters, Java and Bali (ex-Jakarta) posted higher financing contribution to
total financing (~47% of total financing vs 45% of total financing in 2016).
Figure 15
Multifinance industry’s financing breakdown by region
Source: CLSA, Financial Service Authority (OJK)
Interestingly, we started to see more appetite in the heavy equipment sector.
According to financing companies association, APPI, heavy equipment
financing grew by 5% YoY in 1H17.
Astra’s heavy equipment (HE) financing firms SANF (Surya Artha Nusantara
Finance) and KAF (Komatsu Astra Finance) booked strong growth in the last
two quarters. SANF management mentioned that heavy equipment demand
started to increase significantly in 2Q17. 2Q17 SANF new financing grew by
+32% QoQ to Rp864bn. As result, SANF’s new financing reached Rp1.5tn in
1H17 (47% of FY target). Meanwhile, KAF’s 2Q17 new financing grew by 54%
QoQ to Rp997bn. 1H17 KAF new financing reached Rp1.6tn.
BFI Finance
TAFS
Mandiri Tunas Finance
FIF
Adira Finance
BCA Finance
Astra Sedaya/ACC
0%
5%
10%
15%
20%
25%
30%
35%
0% 1% 2% 3% 4% 5% 6% 7%
New financing
growth YoY
Cost of
credit
24% 26% 23% 22% 23% 23% 23% 24% 24% 32% 26% 23% 23%
41% 41% 45% 46% 46% 47% 47% 47% 47% 42%
45% 47% 47%
17% 14% 14% 14% 15% 15% 15% 14% 14% 13% 14% 15% 15%
12% 11% 10% 10% 9% 9% 8% 8% 7% 7% 7% 7% 7% 6% 6% 6% 5% 5% 5% 5% 6% 6% 5% 6% 6% 6%
0%
20%
40%
60%
80%
100%
120%
2012 2013 2014 1Q15 1H15 9M15 2015 1Q16 1H16 9M16 2016 1Q17 1H17
Jakarta Java & Bali (ex Jakarta)Sumatra KalimantanSulawesi NTT, Maluku & PapuaOutside Indonesia
Interestingly, more appetite in heavy
equipment financing
2Q17 SANF and KAF’s new financing grew by +32% and +54% QoQ,
respectively
Java and Bali (ex-Jakarta) posted higher financing
contribution to total financing (~47% of total financing) in the last two
quarters
Cautious yet exciting Financial Services
21 August 2017 [email protected] 7
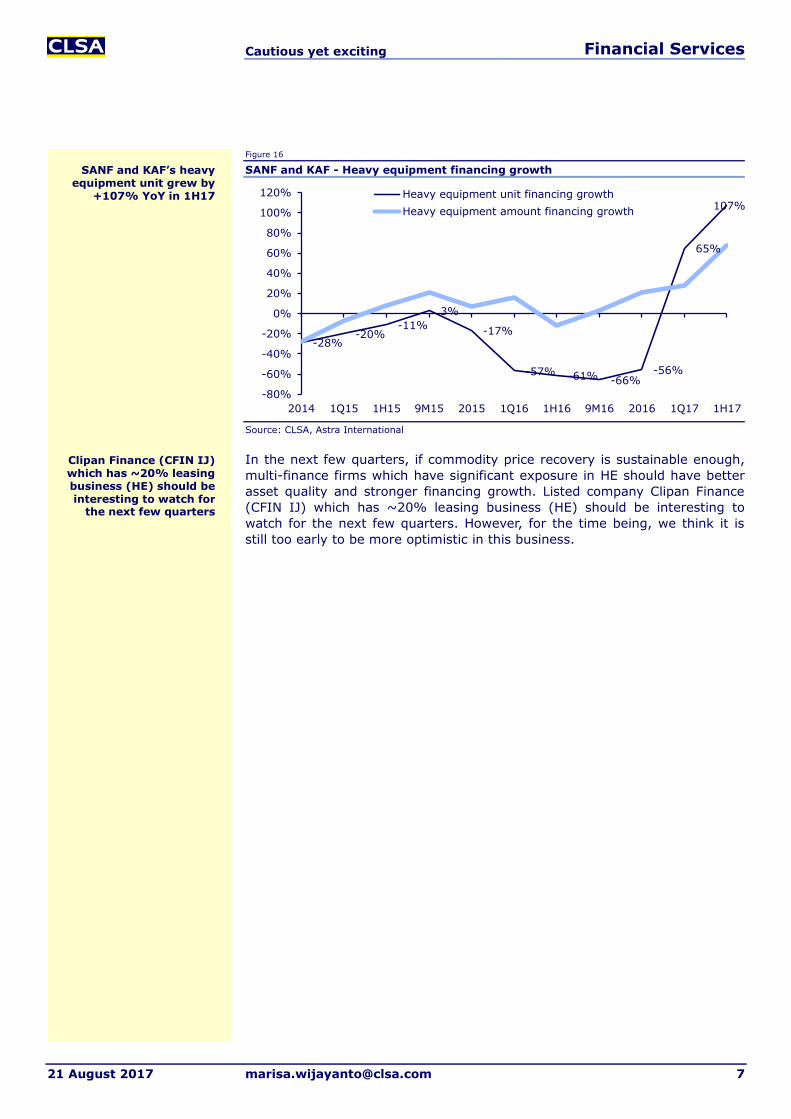
Figure 16
SANF and KAF - Heavy equipment financing growth
Source: CLSA, Astra International
In the next few quarters, if commodity price recovery is sustainable enough,
multi-finance firms which have significant exposure in HE should have better
asset quality and stronger financing growth. Listed company Clipan Finance
(CFIN IJ) which has ~20% leasing business (HE) should be interesting to
watch for the next few quarters. However, for the time being, we think it is
still too early to be more optimistic in this business.
-28% -20%
-11%
3%
-17%
-57% -61% -66% -56%
65%
107%
-80%
-60%
-40%
-20%
0%
20%
40%
60%
80%
100%
120%
2014 1Q15 1H15 9M15 2015 1Q16 1H16 9M16 2016 1Q17 1H17
Heavy equipment unit financing growth
Heavy equipment amount financing growth
Clipan Finance (CFIN IJ) which has ~20% leasing business (HE) should be interesting to watch for
the next few quarters
SANF and KAF’s heavy equipment unit grew by
+107% YoY in 1H17

Cautious yet exciting Financial Services
21 August 2017 [email protected] 8
BFI Finance and Adira remain standouts BFI Finance (BFIN IJ): Strong financing and profitability Among peers, BFI Finance booked the strongest new financing growth in
1H17. Worth noting, BFIN’s core business is refinancing. This has shielded BFI
Finance from intensifying competition with bank- and auto-owned multi-
finance firms. For 2017, BFIN targets its FY new financing to grow above 21%
YoY.
In 1H17, BFI Finance booked Rp6.8tn new financing (+30% YoY). 2Q17 new
financing reached Rp3.6tn (+14% QoQ). Geographically, the highest new
financing growth came from Bali and East Java. Java and Bali (55-57% of
total portfolio) booked +35% YoY new financing growth in 1H17. Sumatera
and Kalimantan showed some improvement. These regions booked +26% YoY
new financing growth in 1H17.
BFI Finance’s new financing growth by segment in 1H17 was as follows:
Non-dealer Used 2W (refinancing): +46% YoY (13% of total bookings)
Non-dealer Used 4W (refinancing): 30% YoY (54% of total bookings)
Dealer used car (refinancing): 16% YoY (17% of total bookings)
Dealer new car (non-refinancing): -5% YoY (2% of total bookings) Figure 17
BFI Finance’s financing portfolio details
Product type % to total average net receivables
Average ticket size
(Rp m)
Tenor % effective rate pa
YoY growth
NDF 4W 46% 90 2-3 years 19-25% 25%
DF Used 4W 23% 170 2-4 years 15-18% 10%
DF new 4W 9% 100 3-4 years 15-18% (40%)
Used 2W 7% 7 1-2 years 38-45% 45%
Machinery 4% 300 1-3 years 17-22% 46%
Heavy Equipment 9% 600 1-3 years 14-19% 18%
Property 2% 200 1-5 years 18-22% 88%
Source: CLSA. BFI Finance
In terms of profitability, 2Q17 NIM improved by +17bps QoQ/+179bps YoY to
10.25% due to lower CoF and portfolio shifting to lower ticket sizes. Cost of
funds (CoF) declined by 108bps YoY to 10.33%, supported by maturing
higher funding and lower new funding cost. BFIN expects declining CoF trend
to continue in 2H17. Management mentioned that corporate rating upgrade
by Fitch Rating to AA- by the end of 2016 has improved BFI’s credit profiles
and led to lower CoF. Combined with portfolio shifting, BFIN expects its NIM
to remain solid in 2H17.
Related to cost efficiency, BFI Finance’s cost to income improved to 43.5% in
1H17 (vs 47.5% in 1H16). As a result, 1H17 net profit reached Rp526bn
(+54% YoY), backed by normalised tax rate of 20%.
For asset quality, BFIN NPL ratio was 1.09% in 2Q17 (+8bps QoQ, -42bps
YoY). On a YoY basis, NPL ratio declined due to shorter written-off cycle since
December 2016 (Note: WO policy for 4Ws and 2Ws changed from 270 days to
210 days starting December 2017). BFI Finance’s cost of credit remained
manageable at 2.7% in 1H17 (vs 2.6% in 1H16).
On the back of strong new financing growth, solid NIM and manageable asset
quality, BFI Finance should be able to post double-digit net profit growth in
2017.
For 2017, BFIN targets its FY new financing to grow
above 21% YoY
Highest new financing growth came from Bali
and East Java
NIM improved due to lower CoF and portfolio shifting to lower ticket
size
1H17 net profit reached Rp526bn (+55% YoY)
BFIN NPL ratio was 1.09% in 2Q17 (+8bps
QoQ, -42bps YoY)
BFI Finance should be able to post double-digit
net profit growth in 2017
BFIN’s core business is refinancing

Cautious yet exciting Financial Services
21 August 2017 [email protected] 9
Adira (ADMF IJ): NIM expansion, lower CoC and opex Adira Finance booked Rp15.7tn new financing in 1H17 (+5% YoY; 48.3% of
FY target). Two-wheelers dominated 55% of total new financing, followed by
four-wheelers (42%). The highest financing growth came from used two-
wheelers (+17% YoY, 20% of new financing) and new cars (+8% YoY: 24% of
new financing). On the other hand, new two-wheelers (35% of new financing)
and used four-wheelers (18% of new financing) financing declined by 1% YoY,
respectively, in 1H17. For 2017, Adira targets its new financing to grow by 5-
10% YoY.
Adira mentioned that its cost of funding (CoF) from bank loans has started to
decline. Currently, Adira Finance can get ~8.8% cost of funds from banks (ie,
Danamon, BCA). Note that, Adira’s blended cost of funds reached 10.1% in
1Q17. Adira’s external funding reached Rp20.5tn in 1Q17, comprising 47%
bank loans and 53% bond issuances.
Related to bonds issuance, in July 2017, Adira raised Rp769bn with ~50bps
lower coupon rate from last issuance in March 2017. July 2017 bond issuance
offers 7.1% - 8.4% coupon rate for 370 days – 5-year tenor. Adira usually
raises Rp3-4tn bonds every year. With declining interest rates from both
banks loans and bonds, these should translate into lower CoF by the end of
2017.
Figure 18 Figure 19
Adira’s new financing breakdown – 1H17 Adira’s average lending rate by segment – June 2017
Source: CLSA, Adira Finance Source: CLSA, Adira Finance
For lending rate, Adira mentioned that the rates should be relatively flat as its
lending rate has been quite competitive in the market. Combined with
declining CoF, Adira mentioned its NIM should expand by the end of 2017.
In terms of cost of credit, Adira also claimed that its cost of credit has
declined to 4.4% in 1H17 vs ~5% in 2016. This improved CoC trend should
continue until the end of 2017. For operating expense, Adira targets its opex
to grow by less than 6% YoY in 2017.
On the back of these, Adira is optimistic to reach above 15% YoY net profit
growth in 2017, after +52% YoY net profit growth in 2016.
Used 2W
21%
New 2W
34% Used 4W
19%
New 4W
23%
Durable
goods
(gadget) 3%
0%
10%
20%
30%
40%
50%
60%
New 2W Used 2W New 4W Used 4W Durable
goods
(gadget)
Adira targets its new financing to grow by 5-
10% YoY in 2017
Currently, Adira can get ~8.8% cost of funds from banks (vs 10.1% blended
CoF in 1Q17)
In July 2017, Adira issued bonds with ~50bps lower
coupon rate from last issuance in March 2017
NIM should expand by the end of 2017
Cost of credit has declined to 4.4% in 1H17 from
~5% in 2016
Adira targets >15% YoY net profit growth in 2017,
after +52% YoY in 2016
Cautious yet exciting Financial Services
21 August 2017 [email protected] 10
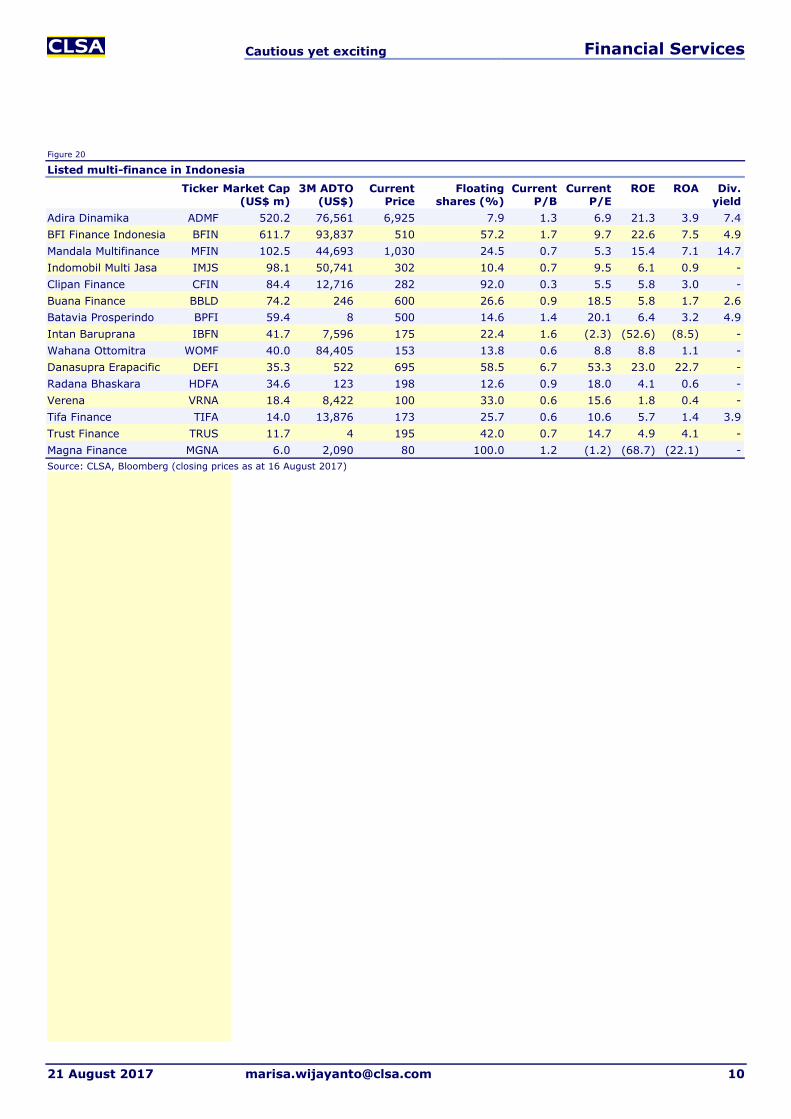
Figure 20
Listed multi-finance in Indonesia
Ticker Market Cap (US$ m)
3M ADTO (US$)
Current Price
Floating shares (%)
Current P/B
Current P/E
ROE ROA Div. yield
Adira Dinamika ADMF 520.2 76,561 6,925 7.9 1.3 6.9 21.3 3.9 7.4
BFI Finance Indonesia BFIN 611.7 93,837 510 57.2 1.7 9.7 22.6 7.5 4.9
Mandala Multifinance MFIN 102.5 44,693 1,030 24.5 0.7 5.3 15.4 7.1 14.7
Indomobil Multi Jasa IMJS 98.1 50,741 302 10.4 0.7 9.5 6.1 0.9 -
Clipan Finance CFIN 84.4 12,716 282 92.0 0.3 5.5 5.8 3.0 -
Buana Finance BBLD 74.2 246 600 26.6 0.9 18.5 5.8 1.7 2.6
Batavia Prosperindo BPFI 59.4 8 500 14.6 1.4 20.1 6.4 3.2 4.9
Intan Baruprana IBFN 41.7 7,596 175 22.4 1.6 (2.3) (52.6) (8.5) -
Wahana Ottomitra WOMF 40.0 84,405 153 13.8 0.6 8.8 8.8 1.1 -
Danasupra Erapacific DEFI 35.3 522 695 58.5 6.7 53.3 23.0 22.7 -
Radana Bhaskara HDFA 34.6 123 198 12.6 0.9 18.0 4.1 0.6 -
Verena VRNA 18.4 8,422 100 33.0 0.6 15.6 1.8 0.4 -
Tifa Finance TIFA 14.0 13,876 173 25.7 0.6 10.6 5.7 1.4 3.9
Trust Finance TRUS 11.7 4 195 42.0 0.7 14.7 4.9 4.1 -
Magna Finance MGNA 6.0 2,090 80 100.0 1.2 (1.2) (68.7) (22.1) -
Source: CLSA, Bloomberg (closing prices as at 16 August 2017)
Important disclosures Financial Services
21 August 2017 [email protected] 11
Research subscriptions To change your report distribution requirements, please contact your CLSA sales representative or email us at [email protected].
You can also fine-tune your Research Alert email preferences at https://www.clsa.com/member/tools/email_alert/.
Companies mentioned Adira Dinamika (N-R)
Astra (ASII IJ - RP7,900 - O-PF)
Astra Sedaya Finance (N-R)
Bank Central Asia (BBCA IJ - RP18,700 - BUY)
Bank Danamon (N-R)
Bank Mandiri (BMRI IJ - RP13,100 - O-PF)
Batavia Prosperindo (N-R)
BCA Finance (N-R)
BFI Finance (N-R)
Buana Finance (N-R)
Clipan Finance (N-R)
Danasupra Erapacific (N-R)
Federal International Finance (N-R)
Indomobil Multi Jasa (N-R)
Intan Baruprana Finance (N-R)
Komatsu Astra Finance (N-R)
Magna Finance (N-R)
Mandala Multi (N-R)
Mandiri Tunas Finance (N-R)
Panin Bank (N-R)
Radana Bhaskara (N-R)
Surya Artha Nusantara Finance (N-R)
Tifa Finance (N-R)
Toyota Astra Financial Services (N-R)
Trust Finance Indo (N-R)
Verena (N-R)
Wahana Otto (N-R)
Analyst certification The analyst(s) of this report hereby certify that the views expressed in this research report accurately reflect
my/our own personal views about the securities and/or the issuers and that no part of my/our compensation
was, is, or will be directly or indirectly related to the specific recommendation or views contained in this
research report.

Important disclosures Financial Services
21 August 2017 [email protected] 12
Important disclosures Recommendation history of Astra International Tbk ASII IJ
Date Rec Target Date Rec Target
30 Jul 2017 O-PF 9,000.00 03 Nov 2015 BUY 7,200.00
05 Jan 2017 BUY 10,250.00 04 Aug 2015 O-PF 7,200.00
01 Aug 2016 BUY 9,700.00 10 Apr 2015 O-PF 8,550.00
27 Apr 2016 BUY 8,460.00 10 Feb 2015 BUY 8,550.00
16 Feb 2016 BUY 7,900.00 05 Nov 2014 BUY 8,050.00
Source: CLSA
Recommendation history of Bank Mandiri (Persero) Tbk BMRI IJ
Date Rec Target Date Rec Target
21 Jul 2017 O-PF 14,500.00 14 Jan 2016 U-PF 10,000.00
06 Apr 2017 O-PF 13,100.00 29 May 2015 U-PF 11,000.00
29 Nov 2016 O-PF 11,500.00 17 Feb 2015 U-PF 11,800.00
01 Sep 2016 O-PF 12,400.00 20 Nov 2014 U-PF 11,600.00
25 May 2016 U-PF 8,650.00 28 Oct 2014 O-PF 11,600.00
08 Mar 2016 O-PF 11,000.00
Source: CLSA
6,000
7,000
8,000
9,000
10,000
Sto
ck p
rice (
Rp)
Sep 14 Jan 15 May 15 Sep 15 Jan 16 May 16 Sep 16 Jan 17 May 17
Sarina Lesmina, CFAOther analystsNo coverage
BUYU-PFN-R
O-PFSELL
8,000
10,000
12,000
14,000
Sto
ck p
rice (
Rp)
Sep 14 Jan 15 May 15 Sep 15 Jan 16 May 16 Sep 16 Jan 17 May 17
Sarina Lesmina, CFAOther analystsNo coverage
BUYU-PFN-R
O-PFSELL
Important disclosures Financial Services
21 August 2017 [email protected] 13
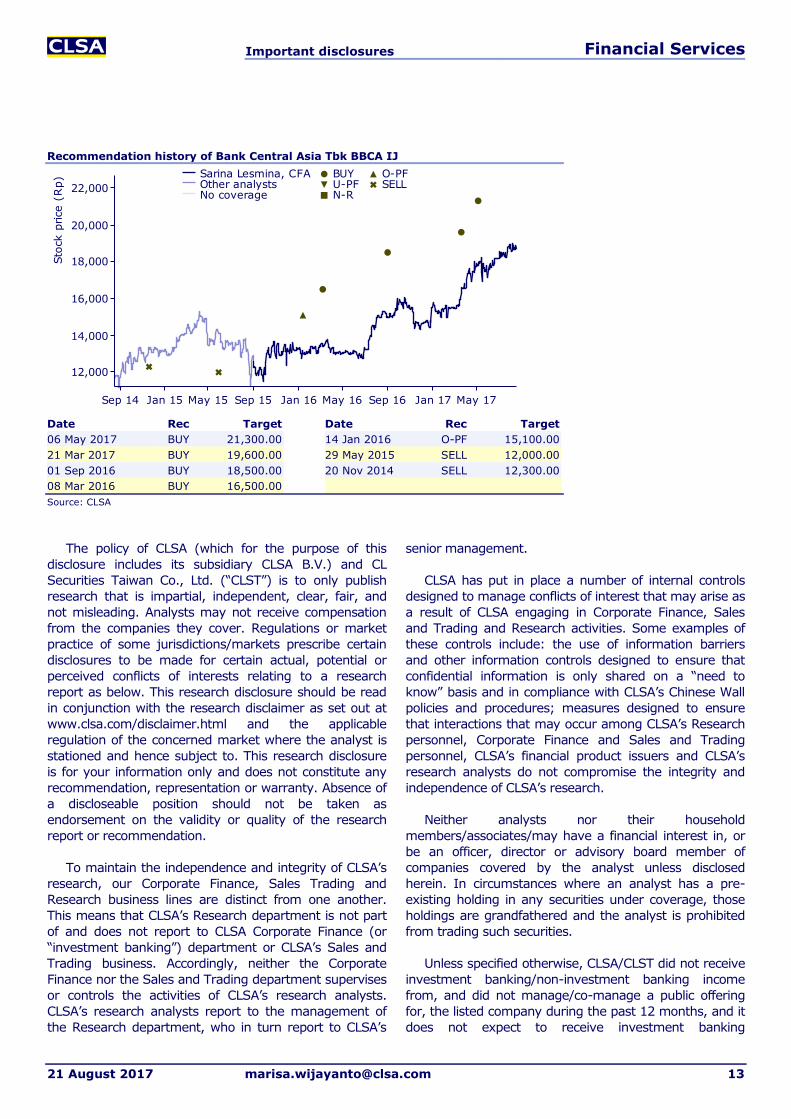
Recommendation history of Bank Central Asia Tbk BBCA IJ
Date Rec Target Date Rec Target
06 May 2017 BUY 21,300.00 14 Jan 2016 O-PF 15,100.00
21 Mar 2017 BUY 19,600.00 29 May 2015 SELL 12,000.00
01 Sep 2016 BUY 18,500.00 20 Nov 2014 SELL 12,300.00
08 Mar 2016 BUY 16,500.00
Source: CLSA
The policy of CLSA (which for the purpose of this
disclosure includes its subsidiary CLSA B.V.) and CL
Securities Taiwan Co., Ltd. (“CLST”) is to only publish
research that is impartial, independent, clear, fair, and
not misleading. Analysts may not receive compensation
from the companies they cover. Regulations or market
practice of some jurisdictions/markets prescribe certain
disclosures to be made for certain actual, potential or
perceived conflicts of interests relating to a research
report as below. This research disclosure should be read
in conjunction with the research disclaimer as set out at
www.clsa.com/disclaimer.html and the applicable
regulation of the concerned market where the analyst is
stationed and hence subject to. This research disclosure
is for your information only and does not constitute any
recommendation, representation or warranty. Absence of
a discloseable position should not be taken as
endorsement on the validity or quality of the research
report or recommendation.
To maintain the independence and integrity of CLSA’s
research, our Corporate Finance, Sales Trading and
Research business lines are distinct from one another.
This means that CLSA’s Research department is not part
of and does not report to CLSA Corporate Finance (or
“investment banking”) department or CLSA’s Sales and
Trading business. Accordingly, neither the Corporate
Finance nor the Sales and Trading department supervises
or controls the activities of CLSA’s research analysts.
CLSA’s research analysts report to the management of
the Research department, who in turn report to CLSA’s
senior management.
CLSA has put in place a number of internal controls
designed to manage conflicts of interest that may arise as
a result of CLSA engaging in Corporate Finance, Sales
and Trading and Research activities. Some examples of
these controls include: the use of information barriers
and other information controls designed to ensure that
confidential information is only shared on a “need to
know” basis and in compliance with CLSA’s Chinese Wall
policies and procedures; measures designed to ensure
that interactions that may occur among CLSA’s Research
personnel, Corporate Finance and Sales and Trading
personnel, CLSA’s financial product issuers and CLSA’s
research analysts do not compromise the integrity and
independence of CLSA’s research.
Neither analysts nor their household
members/associates/may have a financial interest in, or
be an officer, director or advisory board member of
companies covered by the analyst unless disclosed
herein. In circumstances where an analyst has a pre-
existing holding in any securities under coverage, those
holdings are grandfathered and the analyst is prohibited
from trading such securities.
Unless specified otherwise, CLSA/CLST did not receive
investment banking/non-investment banking income
from, and did not manage/co-manage a public offering
for, the listed company during the past 12 months, and it
does not expect to receive investment banking
12,000
14,000
16,000
18,000
20,000
22,000
Sto
ck p
rice (
Rp)
Sep 14 Jan 15 May 15 Sep 15 Jan 16 May 16 Sep 16 Jan 17 May 17
Sarina Lesmina, CFAOther analystsNo coverage
BUYU-PFN-R
O-PFSELL

Important disclosures Financial Services
21 August 2017 [email protected] 14
compensation from the listed company within the coming
three months. Unless mentioned otherwise, CLSA/CLST
does not own a material discloseable position, and does
not make a market, in the securities.
As analyst(s) of this report, I/we hereby certify that
the views expressed in this research report accurately
reflect my/our own personal views about the securities
and/or the issuers and that no part of my/our
compensation was, is, or will be directly or indirectly
related to the specific recommendation or views
contained in this report or to any investment banking
relationship with the subject company covered in this
report (for the past one year) or otherwise any other
relationship with such company which leads to receipt of
fees from the company except in ordinary course of
business of the company. The analyst/s also state/s and
confirm/s that he/she/they has/have not been placed
under any undue influence, intervention or pressure by
any person/s in compiling this research report. In
addition, the analysts included herein attest that they
were not in possession of any material, nonpublic
information regarding the subject company at the time of
publication of the report. Save from the disclosure below
(if any), the analyst(s) is/are not aware of any material
conflict of interest.
Key to CLSA/CLST investment rankings: BUY: Total
stock return (including dividends) expected to exceed
20%; O-PF: Total expected return below 20% but
exceeding market return; U-PF: Total expected return
positive but below market return; SELL: Total return
expected to be negative. For relative performance, we
benchmark the 12-month total forecast return (including
dividends) for the stock against the 12-month forecast
return (including dividends) for the market on which the
stock trades.
We define as “Double Baggers” stocks we expect to
yield 100% or more (including dividends) within three
years at the time the stocks are introduced to our
“Double Bagger” list. "High Conviction" Ideas are not
necessarily stocks with the most upside/downside, but
those where the Research Head/Strategist believes there
is the highest likelihood of positive/negative returns. The
list for each market is monitored weekly.
Overall rating distribution for CLSA/CLST only
Universe:
Overall rating distribution: BUY / Outperform - CLSA:
64.52%; CLST only: 67.61%, Underperform / SELL -
CLSA: 35.48%; CLST only: 32.39%, Restricted - CLSA:
0.00%; CLST only: 0.00%. Data as of 30 June 2017.
Investment banking clients as a % of rating category:
BUY / Outperform - CLSA: 4.77%; CLST only: 0.00%,
Underperform / SELL - CLSA: 2.98%; CLST only: 0.00%,
Restricted - CLSA: 0.00%; CLST only: 0.00%. Data for
12-month period ending 30 June 2017.
There are no numbers for Hold/Neutral as CLSA/CLST
do not have such investment rankings.
For a history of the recommendations and price
targets for companies mentioned in this report, as well as
company specific disclosures, please write to: (a) CLSA,
Group Compliance, 18/F, One Pacific Place, 88
Queensway, Hong Kong and/or; (b) CLST Compliance
(27/F, 95, Section 2 Dun Hua South Road, Taipei 10682,
Taiwan, telephone (886) 2 2326 8188). © 2017 CLSA
Limited and/or CLST.
© 2017 CLSA Limited, and/or CL Securities Taiwan
Co., Ltd. (“CLST”)
This publication/communication is subject to and
incorporates the terms and conditions of use set out on
the www.clsa.com website
(www.clsa.com/disclaimer.html.). Neither the
publication/communication nor any portion hereof may
be reprinted, sold, resold, copied, reproduced,
distributed, redistributed, published, republished,
displayed, posted or transmitted in any form or media or
by any means without the written consent of CLSA group
of companies (“CLSA”) and/or CLST.
CLSA and/or CLST have produced this
publication/communication for private circulation to
professional, institutional and/or wholesale clients only.
This publication/communication may not be distributed or
redistributed to retail investors. The information, opinions
and estimates herein are not directed at, or intended for
distribution to or use by, any person or entity in any
jurisdiction where doing so would be contrary to law or
regulation or which would subject CLSA and/or CLST to
any additional registration or licensing requirement within
such jurisdiction. The information and statistical data
herein have been obtained from sources we believe to be
reliable. Such information has not been independently
verified and we make no representation or warranty as to
its accuracy, completeness or correctness. Any opinions
or estimates herein reflect the judgment of CLSA and/or
CLST at the date of this publication/communication and
are subject to change at any time without notice. Where
any part of the information, opinions or estimates
contained herein reflects the views and opinions of a
sales person or a non-analyst, such views and opinions
may not correspond to the published view of CLSA
and/or CLST. This is not a solicitation or any offer to buy
or sell. This publication/communication is for information
purposes only and does not constitute any
recommendation, representation, warranty or guarantee
of performance. Any price target given in the report may
Important disclosures Financial Services
21 August 2017 [email protected] 15
be projected from one or more valuation models and
hence any price target may be subject to the inherent
risk of the selected model as well as other external risk
factors. This is not intended to provide professional,
investment or any other type of advice or
recommendation and does not take into account the
particular investment objectives, financial situation or
needs of individual recipients. Before acting on any
information in this publication/communication, you
should consider whether it is suitable for your particular
circumstances and, if appropriate, seek professional
advice, including tax advice. CLSA and/or CLST do/does
not accept any responsibility and cannot be held liable for
any person’s use of or reliance on the information and
opinions contained herein. To the extent permitted by
applicable securities laws and regulations, CLSA and/or
CLST accept(s) no liability whatsoever for any direct or
consequential loss arising from the use of this
publication/communication or its contents. Where the
publication does not contain ratings, the material should
not be construed as research but is offered as factual
commentary. It is not intended to, nor should it be used
to form an investment opinion about the non-rated
companies.
Subject to any applicable laws and regulations at any
given time, CLSA, CLST, their respective affiliates or
companies or individuals connected with CLSA /CLST
may have used the information contained herein before
publication and may have positions in, may from time to
time purchase or sell or have a material interest in any of
the securities mentioned or related securities, or may
currently or in future have or have had a business or
financial relationship with, or may provide or have
provided investment banking, capital markets and/or
other services to, the entities referred to herein, their
advisors and/or any other connected parties. As a result,
investors should be aware that CLSA, CLST and/or their
respective affiliates or companies or such individuals may
have one or more conflicts of interest. Regulations or
market practice of some jurisdictions/markets prescribe
certain disclosures to be made for certain actual,
potential or perceived conflicts of interests relating to
research reports. Details of the discloseable interest can
be found in certain reports as required by the relevant
rules and regulation and the full details are available at
http://www.clsa.com/member/research_disclosures/.
Disclosures therein include the position of CLSA and CLST
only. Unless specified otherwise, CLSA did not receive
any compensation or other benefits from the subject
company covered in this publication/communication, or
from any third party in connection with this report. If
investors have any difficulty accessing this website,
please contact [email protected] on +852 2600 8111.
If you require disclosure information on previous dates,
please contact [email protected].
This publication/communication is distributed for and
on behalf of CLSA Limited (for research compiled by non-
US and non-Taiwan analyst(s)), and/or CLST (for
research compiled by Taiwan analyst(s)) in Australia by
CLSA Australia Pty Ltd; in Hong Kong by CLSA Limited; in
India by CLSA India Private Limited, (Address: 8/F,
Dalamal House, Nariman Point, Mumbai 400021. Tel No:
+91-22-66505050. Fax No: +91-22-22840271; CIN:
U67120MH1994PLC083118; SEBI Registration No:
INZ000001735; in Indonesia by PT CLSA Sekuritas
Indonesia; in Japan by CLSA Securities Japan Co., Ltd; in
Korea by CLSA Securities Korea Ltd; in Malaysia by CLSA
Securities Malaysia Sdn Bhd; in the Philippines by CLSA
Philippines Inc (a member of Philippine Stock Exchange
and Securities Investors Protection Fund); in Thailand by
CLSA Securities (Thailand) Limited; in Taiwan by CLST
and in the United Kingdom by CLSA (UK).
India: CLSA India Private Limited, incorporated in
November 1994 provides equity brokerage services
(SEBI Registration No: INZ000001735), research
services (SEBI Registration No: INH000001113) and
merchant banking services (SEBI Registration
No.INM000010619) to global institutional investors,
pension funds and corporates. CLSA and its associates
may have debt holdings in the subject company. Further,
CLSA and its associates, in the past 12 months, may
have received compensation for non-investment banking
securities and/or non-securities related services from the
subject company. For further details of “associates” of
CLSA India please contact [email protected].
United States of America: Where any section is
compiled by non-US analyst(s), it is distributed into the
United States by CLSA solely to persons who qualify as
"Major US Institutional Investors" as defined in Rule 15a-
6 under the Securities and Exchange Act of 1934 and
who deal with CLSA Americas. However, the delivery of
this research report to any person in the United States
shall not be deemed a recommendation to effect any
transactions in the securities discussed herein or an
endorsement of any opinion expressed herein. Any
recipient of this research in the United States wishing to
effect a transaction in any security mentioned herein
should do so by contacting CLSA Americas.
Canada: The delivery of this research report to any
person in Canada shall not be deemed a
recommendation to effect any transactions in the
securities discussed herein or an endorsement of any
opinion expressed herein. Any recipient of this research in
Canada wishing to effect a transaction in any security
mentioned herein should do so by contacting CLSA

Important disclosures Financial Services
21 August 2017 [email protected] 16
Americas.
United Kingdom: In the United Kingdom, this research
is a marketing communication. It has not been prepared
in accordance with the legal requirements designed to
promote the independence of investment research, and is
not subject to any prohibition on dealing ahead of the
dissemination of investment research. The research is
disseminated in the EU by CLSA (UK), which is authorised
and regulated by the Financial Conduct Authority. This
document is directed at persons having professional
experience in matters relating to investments as defined
in Article 19 of the FSMA 2000 (Financial Promotion)
Order 2005. Any investment activity to which it relates is
only available to such persons. If you do not have
professional experience in matters relating to
investments you should not rely on this document.
Where the research material is compiled by the UK
analyst(s), it is produced and disseminated by CLSA
(UK). For the purposes of the Financial Conduct Rules this
research is prepared and intended as substantive
research material.
Singapore: In Singapore, research is issued and/or
distributed by CLSA Singapore Pte Ltd (Company
Registration No.: 198703750W), a Capital Markets
Services licence holder to deal in securities and an
exempt financial adviser, solely to persons who qualify as
an institutional investor, accredited investor or expert
investor, as defined in s.4A(1) of the Securities and
Futures Act. Pursuant to Paragraphs 33, 34, 35 and 36 of
the Financial Advisers (Amendment) Regulations 2005 of
the Financial Advisers Act (Cap 110) with regards to an
institutional investor, accredited investor, expert investor
or Overseas Investor, sections 25, 27 and 36 of the
Financial Adviser Act (Cap 110) shall not apply to CLSA
Singapore Pte Ltd. Please contact CLSA Singapore Pte Ltd
(telephone No.: +65 6416 7888) in connection with
queries on the report. MCI (P) 033/11/2016
The analysts/contributors to this
publication/communication may be employed by any
relevant CLSA entity, CLST or a subsidiary of CITIC
Securities Company Limited which is different from the
entity that distributes the publication/communication in
the respective jurisdictions.
MSCI-sourced information is the exclusive property of
Morgan Stanley Capital International Inc (MSCI). Without
prior written permission of MSCI, this information and
any other MSCI intellectual property may not be
reproduced, redisseminated or used to create any
financial products, including any indices. This information
is provided on an "as is" basis. The user assumes the
entire risk of any use made of this information. MSCI, its
affiliates and any third party involved in, or related to,
computing or compiling the information hereby expressly
disclaim all warranties of originality, accuracy,
completeness, merchantability or fitness for a particular
purpose with respect to any of this information. Without
limiting any of the foregoing, in no event shall MSCI, any
of its affiliates or any third party involved in, or related to,
computing or compiling the information have any liability
for any damages of any kind. MSCI, Morgan Stanley
Capital International and the MSCI indexes are service
marks of MSCI and its affiliates. The Global Industry
Classification Standard (GICS) was developed by and is
the exclusive property of MSCI and Standard & Poor's.
GICS is a service mark of MSCI and S&P and has been
licensed for use by CLSA.
EVA® is a registered trademark of Stern, Stewart &
Co. "CL" in charts and tables stands for CLSA and “CT”
stands for CLST estimates unless otherwise noted in the
source.