Cautionary statement - investors.nationalgrid.com/media/Files/N/National-Grid... · ~40% RAB...
51
Cautionary statement This presentation contains certain statements that are neither reported financial results nor other historical information. These statements are forward- looking statements within the meaning of Section 27A of the Securities Act of 1933, as amended, and Section 21E of the Securities Exchange Act of 1934, as amended. These statements include information with respect to National Grid’s financial condition, National Grid’s results of operations and businesses, strategy, plans and objectives. Words such as “anticipates”, “expects”, “intends”, “plans”, “believes”, “seeks”, “estimates”, “may”, “will”, “continue”, “project” and similar expressions, as well as statements in the future tense, identify forward-looking statements. These forward-looking statements are not guarantees of National Grid’s future performance and are subject to assumptions, risks and uncertainties that could cause actual future results to differ materially from those expressed in or implied by the forward-looking statements. Many of these assumptions, risks and uncertainties relate to factors that are beyond National Grid's ability to control or estimate precisely, such as delays in obtaining, or adverse conditions contained in, regulatory approvals and contractual consents, including those required to complete the proposed acquisition of KeySpan when or as planned, unseasonable weather affecting the demand for electricity and gas, competition and industry restructuring, changes in economic conditions, currency fluctuations, changes in interest and tax rates, changes in energy market prices, changes in historical weather patterns, changes in laws, regulations or regulatory policies, developments in legal or public policy doctrines, the impact of changes to accounting standards and technological developments. Other factors that could cause actual results to differ materially from those described in this presentation include the ability to integrate the businesses relating to announced acquisitions with our existing business and realise the expected synergies from such integration, the availability of new acquisition opportunities and the timing and success of future acquisition opportunities, the impact of the sales of businesses by National Grid, the failure for any reason to achieve reductions in costs or to achieve operational efficiencies, the failure to retain key management, the behaviour of UK electricity market participants on system balancing, the timing of amendments in prices to shippers in the UK gas market, the performance of National Grid's pension schemes and the regulatory treatment of pension costs, and any adverse consequences arising from outages on or otherwise affecting energy networks, including gas pipelines, owned or operated by National Grid. For a more detailed description of some of these assumptions, risks and uncertainties, together with any other risk factors, please see National Grid's filings with and submissions to the US Securities and Exchange Commission (the “SEC”) (and in particular the "Risk Factors" and "Operating and Financial Review" sections in its most recent Annual Report on Form 20-F and the “Risk Factors” section in its Registration Statement on Form F-3 filed with the SEC on 28 June 2006). Except as may be required by law or regulation, National Grid undertakes no obligation to update any of its forward-looking statements. The effects of these factors are difficult to predict. New factors emerge from time to time and National Grid cannot assess the potential impact of any such factor on its activities or the extent to which any factor, or combination of factors, may cause results to differ materially from those contained in any forward-looking statement.
Transcript of Cautionary statement - investors.nationalgrid.com/media/Files/N/National-Grid... · ~40% RAB...
Cautionary statement
This presentation contains certain statements that are neither reported financial results nor other historical information. These statements are forward-looking statements within the meaning of Section 27A of the Securities Act of 1933, as amended, and Section 21E of the Securities Exchange Act of 1934, as amended. These statements include information with respect to National Grid’s financial condition, National Grid’s results of operations and businesses, strategy, plans and objectives. Words such as “anticipates”, “expects”, “intends”, “plans”, “believes”, “seeks”, “estimates”, “may”, “will”, “continue”, “project” and similar expressions, as well as statements in the future tense, identify forward-looking statements. These forward-looking statements are not guarantees of National Grid’s future performance and are subject to assumptions, risks and uncertainties that could cause actual future results to differ materially from those expressed in or implied by the forward-looking statements. Many of these assumptions, risks and uncertainties relate to factors that are beyond National Grid's ability to control or estimate precisely, such as delays in obtaining, or adverse conditions contained in, regulatory approvals and contractual consents, including those required to complete the proposed acquisition of KeySpan when or as planned, unseasonable weather affecting the demand for electricity and gas, competition and industry restructuring, changes in economic conditions, currency fluctuations, changes in interest and tax rates, changes in energy market prices, changes in historical weather patterns, changes in laws, regulations or regulatory policies, developments in legal or public policy doctrines, the impact of changes to accounting standards and technological developments. Other factors that could cause actual results to differ materially from those described in this presentation include the ability to integrate the businesses relating to announced acquisitions with our existing business and realise the expected synergies from such integration, the availability of new acquisition opportunities and the timing and success of future acquisition opportunities, the impact of the sales of businesses by National Grid, the failure for any reason to achieve reductions in costs or to achieve operational efficiencies, the failure to retain key management, the behaviour of UK electricity market participants on system balancing, the timing of amendments in prices to shippers in the UK gas market, the performance of National Grid's pension schemes and the regulatory treatment of pension costs, and any adverse consequences arising from outages on or otherwise affecting energy networks, including gas pipelines, owned or operated by National Grid. For a more detailed description of some of these assumptions, risks and uncertainties, together with any other risk factors, please see National Grid's filings with and submissions to the US Securities and Exchange Commission (the “SEC”) (and in particular the "Risk Factors" and "Operating and Financial Review" sections in its most recent Annual Report on Form 20-F and the “Risk Factors” section in its Registration Statement on Form F-3 filed with the SEC on 28 June 2006). Except as may be required by law or regulation, National Grid undertakes no obligation to update any of its forward-looking statements. The effects of these factors are difficult to predict. New factors emerge from time to time and National Grid cannot assess the potential impact of any such factor on its activities or the extent to which any factor, or combination of factors, may cause results to differ materially from those contained in any forward-looking statement.

Sir John Parker
Chairman

Steve Lucas
Finance Director
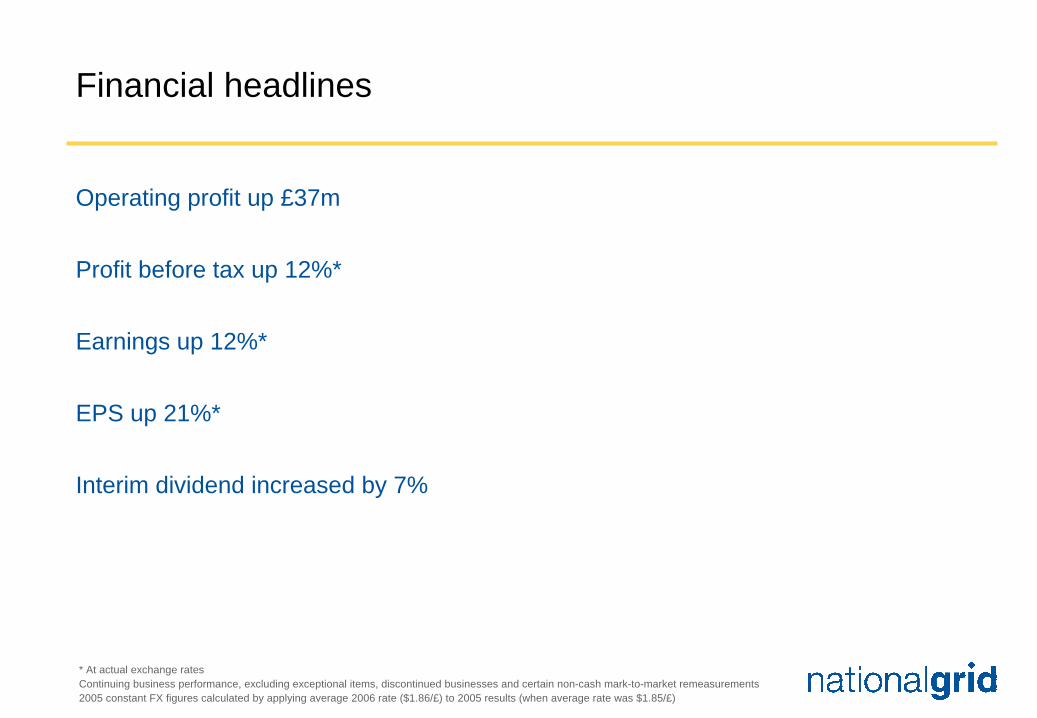
Financial headlines
Operating profit up £37m
Profit before tax up 12%*
Earnings up 12%*
EPS up 21%*
Interim dividend increased by 7%
* At actual exchange ratesContinuing business performance, excluding exceptional items, discontinued businesses and certain non-cash mark-to-market remeasurements2005 constant FX figures calculated by applying average 2006 rate ($1.86/£) to 2005 results (when average rate was $1.85/£)
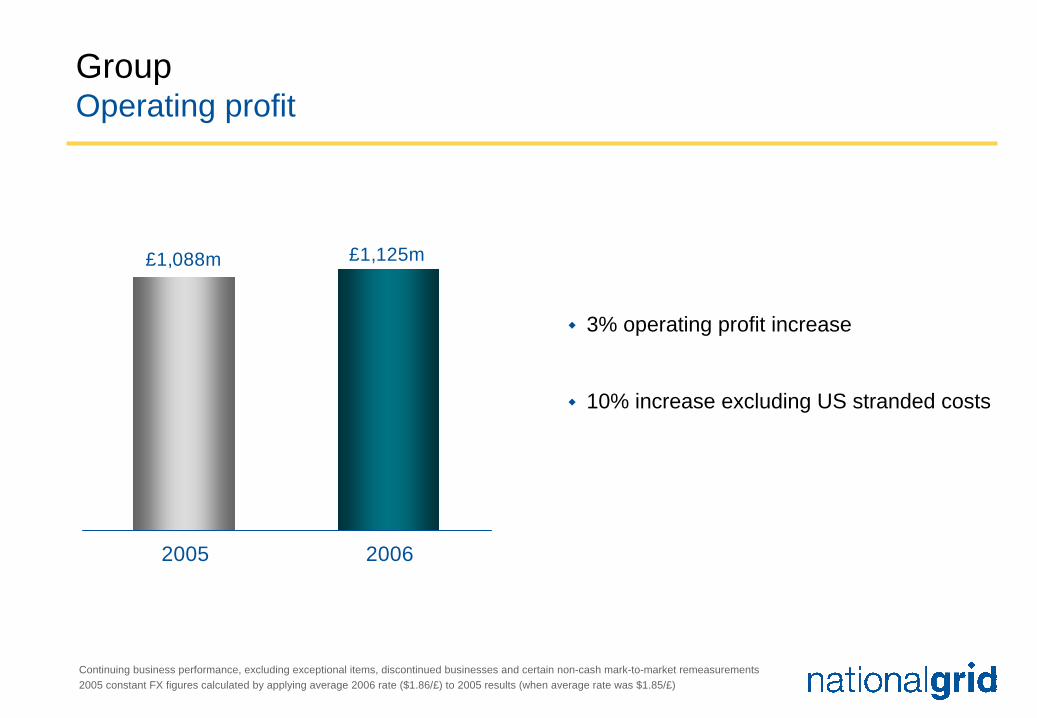
£1,088m £1,125m
2005 2006
GroupOperating profit
3% operating profit increase
10% increase excluding US stranded costs
Continuing business performance, excluding exceptional items, discontinued businesses and certain non-cash mark-to-market remeasurements2005 constant FX figures calculated by applying average 2006 rate ($1.86/£) to 2005 results (when average rate was $1.85/£)
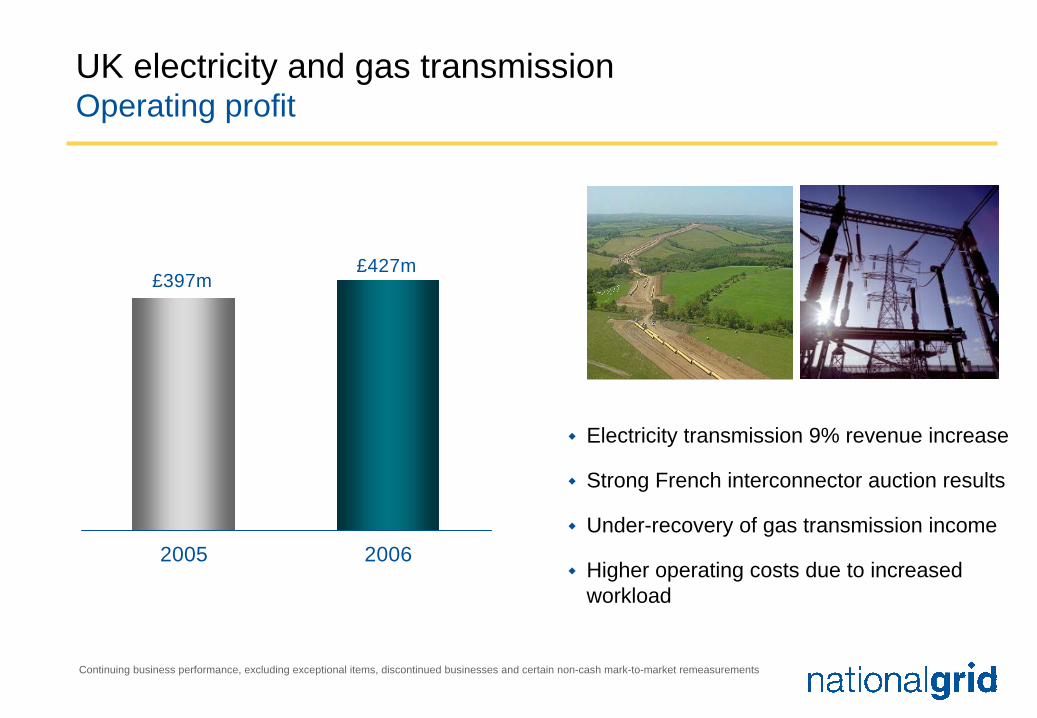
UK electricity and gas transmissionOperating profit
Electricity transmission 9% revenue increase
Strong French interconnector auction results
Under-recovery of gas transmission income
Higher operating costs due to increased workload
Continuing business performance, excluding exceptional items, discontinued businesses and certain non-cash mark-to-market remeasurements
£427m£397m
2005 2006
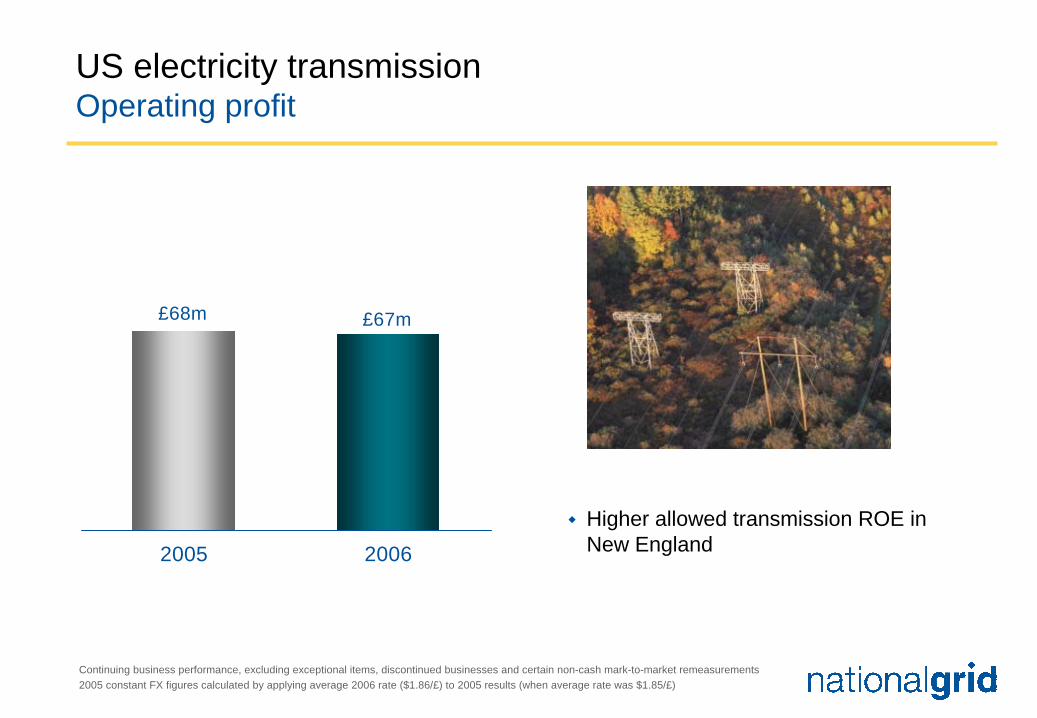
US electricity transmissionOperating profit
Higher allowed transmission ROE inNew England
Continuing business performance, excluding exceptional items, discontinued businesses and certain non-cash mark-to-market remeasurements2005 constant FX figures calculated by applying average 2006 rate ($1.86/£) to 2005 results (when average rate was $1.85/£)
£67m£68m
2005 2006

UK gas distributionOperating profit
Warm weather and lower volumesBusiness rate increase
9% gas distribution price increase in October
Other non-controllable costs Pensions and shrinkage gas
Continuing business performance, excluding exceptional items, discontinued businesses and certain non-cash mark-to-market remeasurements
£71m
£94m
2005 2006

US electricity and gas distribution Operating profit
New York deferral account recoveryTiming of pass through costs recoveryOther impacts:
Increased reliability andmaintenance spend
Lower delivery volumes
Continuing business performance, excluding exceptional items, discontinued businesses and certain non-cash mark-to-market remeasurements2005 constant FX figures calculated by applying average 2006 rate ($1.86/£) to 2005 results (when average rate was $1.85/£)
£251m
£169m
2005 2006

US stranded cost recoveriesOperating profit
Decline in stranded asset base
USGen settlement last year
Contract settlements flat
Continuing business performance, excluding exceptional items, discontinued businesses and certain non-cash mark-to-market remeasurements2005 constant FX figures calculated by applying average 2006 rate ($1.86/£) to 2005 results (when average rate was $1.85/£)
£202m
£249m
2005 2006

Wireless infrastructureOperating profit
17% operating profit growth
Strong Broadcast performanceTwo new channel contracts
Continued growth in mobile tenancies
Continuing business performance, excluding exceptional items, discontinued businesses and certain non-cash mark-to-market remeasurements
£42m
£36m
2005 2006
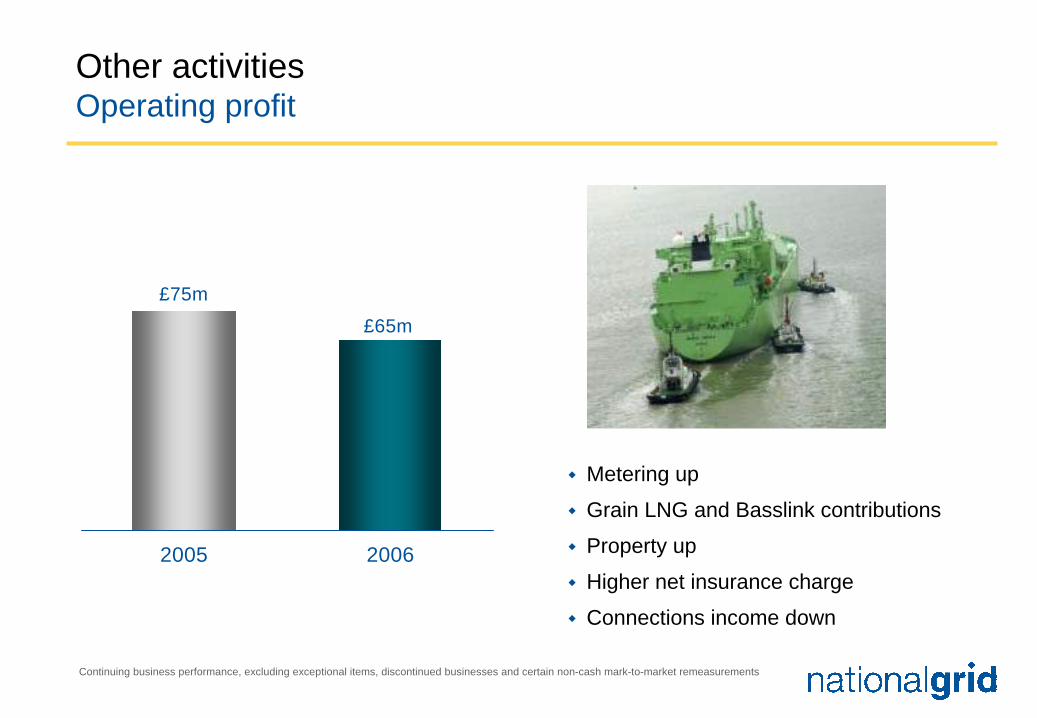
Other activitiesOperating profit
Metering up
Grain LNG and Basslink contributions
Property up
Higher net insurance charge
Connections income down
Continuing business performance, excluding exceptional items, discontinued businesses and certain non-cash mark-to-market remeasurements
£65m
£75m
2005 2006

Group Segmental operating profit
Continuing business performance, excluding exceptional items, discontinued businesses and certain non-cash mark-to-market remeasurements
4% 6%
38%
6%6%22%
18%
UK transmission US transmission
US stranded costs
UK gas distribution
Other activities
Wireless
US distribution
£1,125m£1,088m
2005 2006

Interest, tax, earnings and dividend
32%32%Effective Tax Rate*(317)(255)Net Finance Cost (actual FX)
10.2p10.9pDPS - ordinary
17.9p21.7pEPS
20052006For the 6 months ended 30 September (£m)
Note: The dividend per American Depository Share for the 6 months ending 30 September 2006 is $1.0279* Expressed as a % of profits pre-exceptional and remeasurement adjustments
Continuing business performance, excluding exceptional items, discontinued businesses and certain non-cash mark-to-market remeasurements2005 constant FX figures calculated by applying average 2006 rate ($1.86/£) to 2005 results (when average rate was $1.85/£)

£827m
£1,072m
2005 2006
Capital investment
Continuing business capital investment only* 2006 UK gas distribution includes £159m (2005 £139m) of replacement expenditure (repex)
Other activities
Wireless
US transmission
US distribution
UK gas distribution
UK transmission
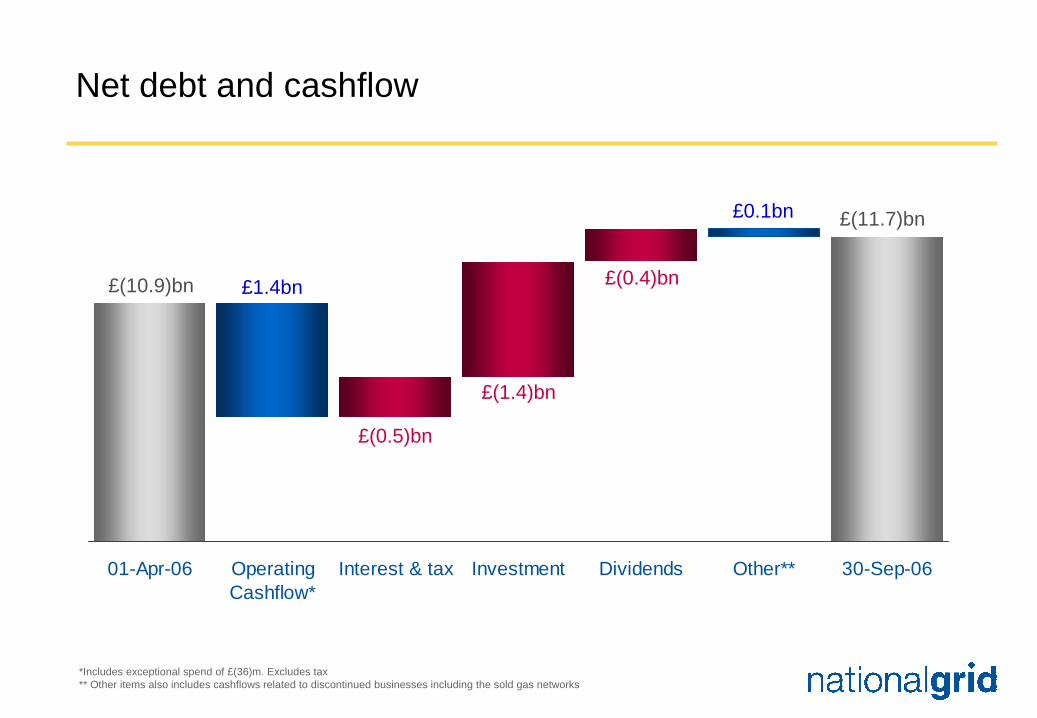
Net debt and cashflow
£(10.9)bn £1.4bn
£(0.5)bn
£(1.4)bn
£(0.4)bn
*Includes exceptional spend of £(36)m. Excludes tax ** Other items also includes cashflows related to discontinued businesses including the sold gas networks
01-Apr-06 OperatingCashflow*
Interest & tax Investment Dividends Other** 30-Sep-06
£(11.7)bn£0.1bn

Financial summary
Good first half
EPS up 21%
Interim dividend increased by 7%
Investment up 30%
Continuing business performance, excluding exceptional items, discontinued businesses and certain non-cash mark-to-market remeasurements2005 constant FX figures calculated by applying average 2006 rate ($1.86/£) to 2005 results (when average rate was $1.85/£)

Steve Holliday
Chief Executive Officer Designate

My priorities…
Strategy and growth
Driving performance
Senior management
Improving relationships
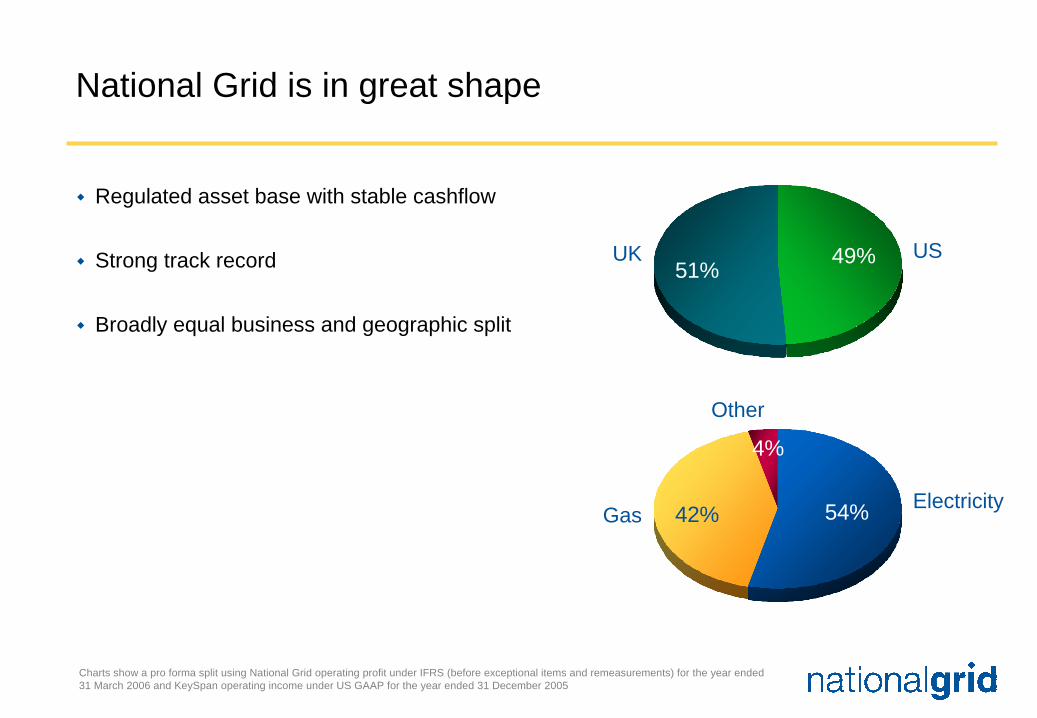
National Grid is in great shape
Regulated asset base with stable cashflow
Strong track record
Broadly equal business and geographic split
Charts show a pro forma split using National Grid operating profit under IFRS (before exceptional items and remeasurements) for the year ended 31 March 2006 and KeySpan operating income under US GAAP for the year ended 31 December 2005
54%42%
4%
ElectricityGas
Other
USUK 49%51%
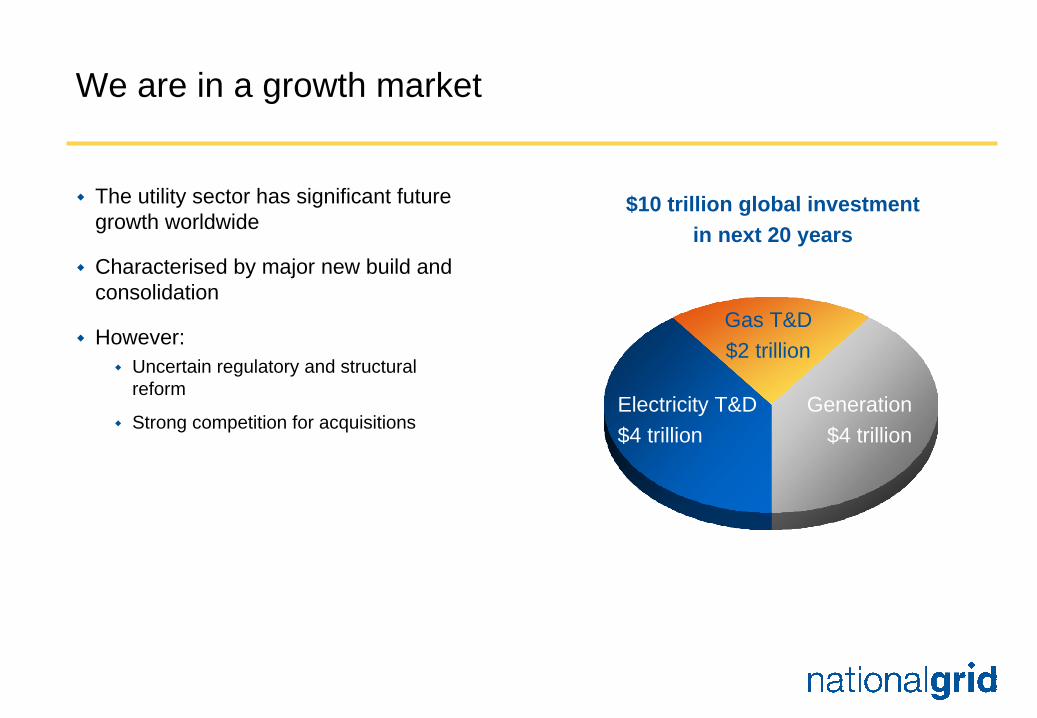
We are in a growth market
$10 trillion global investment in next 20 years
The utility sector has significant future growth worldwide
Characterised by major new build and consolidation
However:Uncertain regulatory and structural reform
Strong competition for acquisitionsElectricity T&D$4 trillion
Generation$4 trillion
Gas T&D$2 trillion
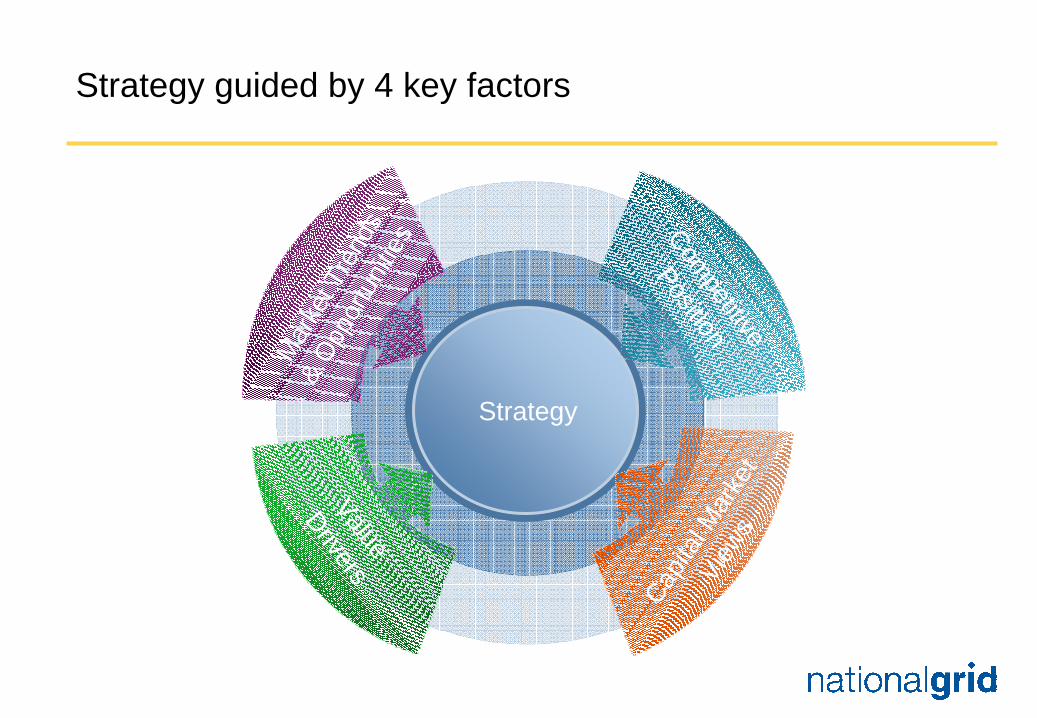
Strategy guided by 4 key factors
Strategy
Mar
ket T
rend
s
& Opp
ortu
nities
Competitive
Position
Capita
l Mar
ket
View
sValue
Drivers
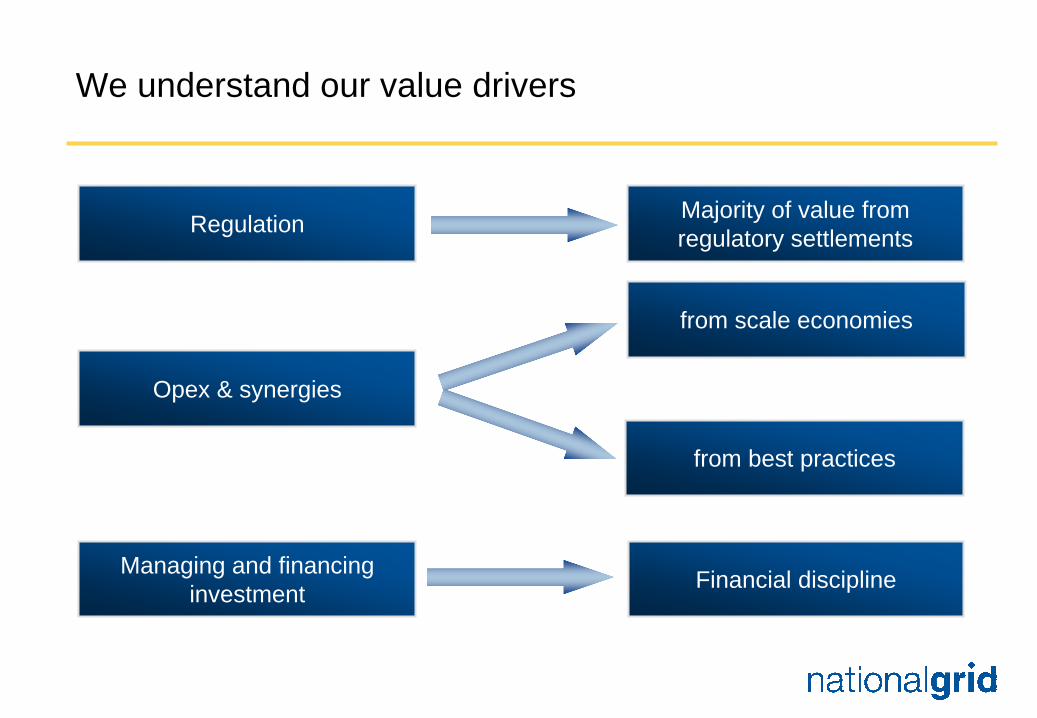
We understand our value drivers
Regulation
Opex & synergies
from best practices
from scale economies
Managing and financing investment
Majority of value from regulatory settlements
Financial discipline
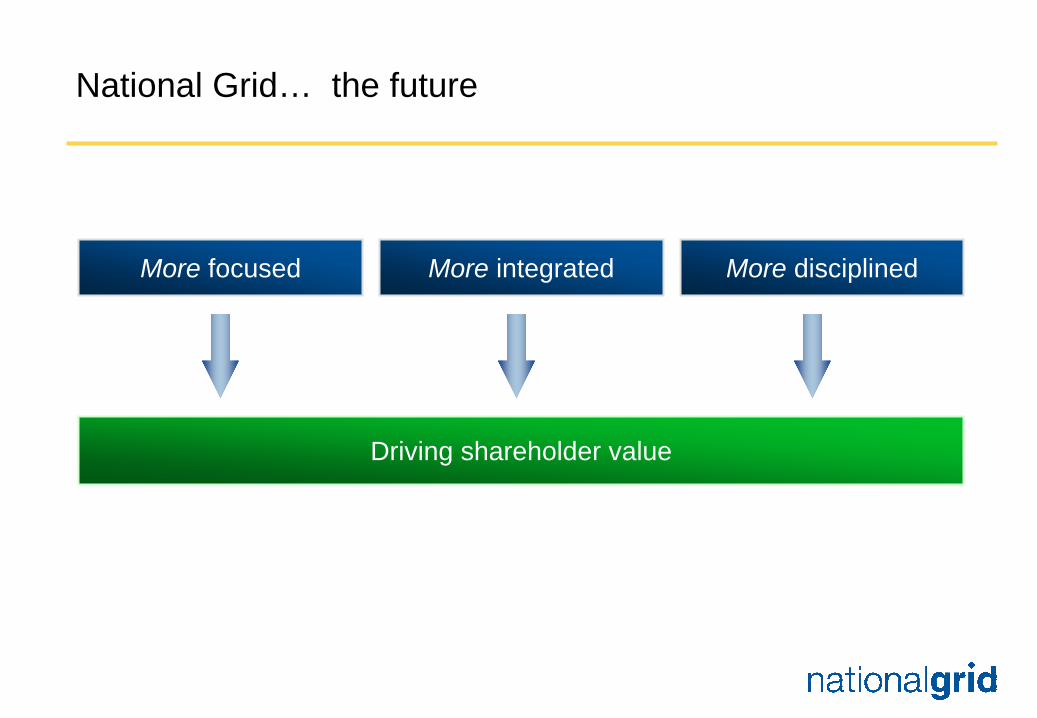
National Grid… the future
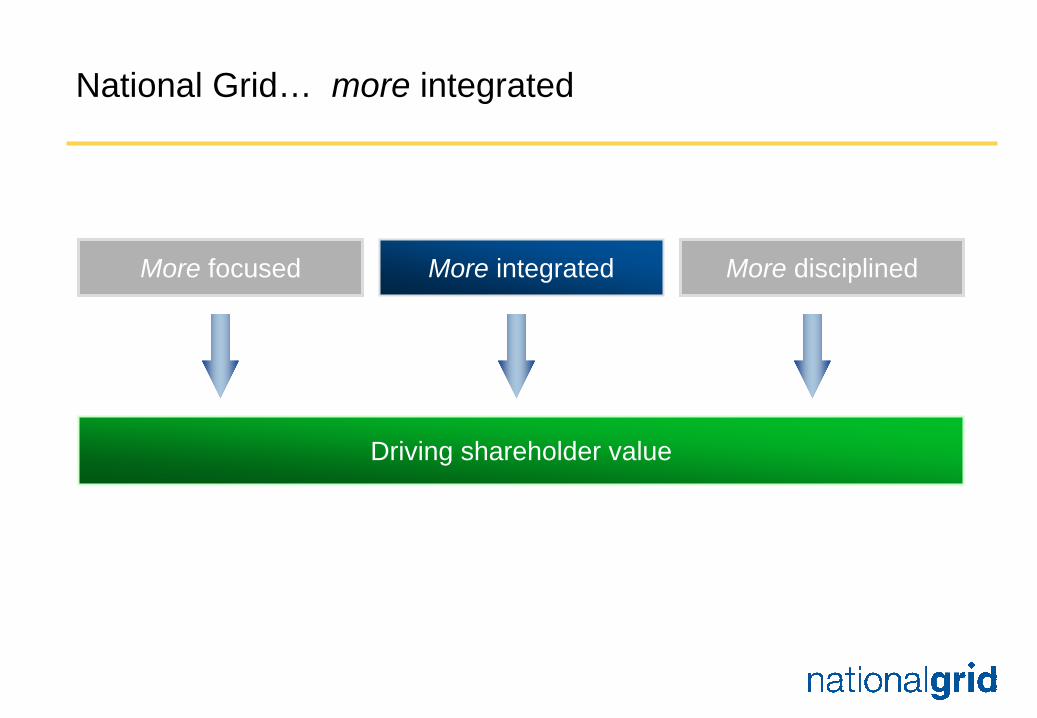
More focused More integrated More disciplined
Driving shareholder value
National Grid… more focused
More focused More integrated More disciplined
Driving shareholder value

More focused – a clear business model
Gas and electricity(including low-risk
generation)
Focus on prioritymarkets in the
UK and US
Own and operateasset-intensive
businesses
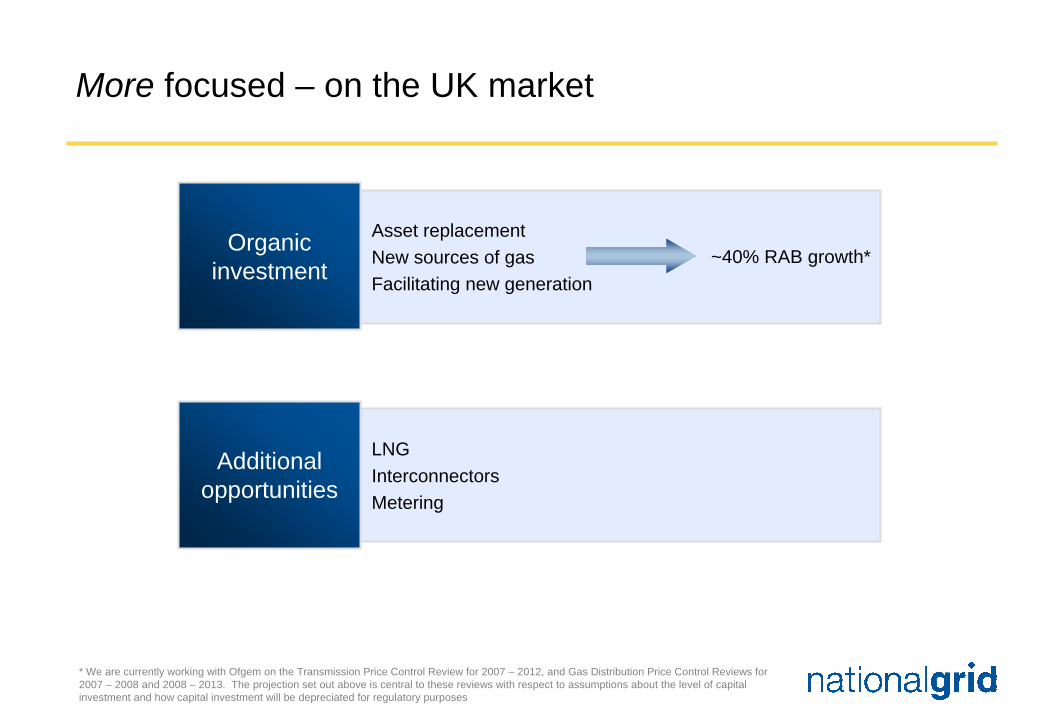
Asset replacementNew sources of gasFacilitating new generation
More focused – on the UK market
LNGInterconnectorsMetering
Organic investment
Additional opportunities
* We are currently working with Ofgem on the Transmission Price Control Review for 2007 – 2012, and Gas Distribution Price Control Reviews for 2007 – 2008 and 2008 – 2013. The projection set out above is central to these reviews with respect to assumptions about the level of capital investment and how capital investment will be depreciated for regulatory purposes
~40% RAB growth*
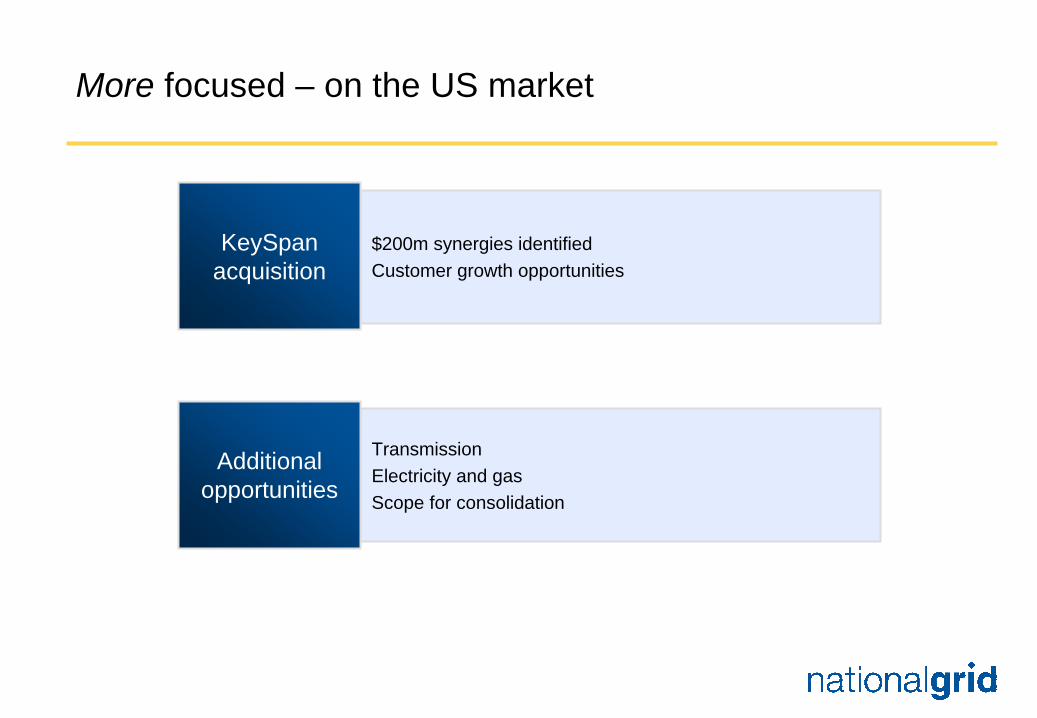
More focused – on the US market
$200m synergies identifiedCustomer growth opportunities
TransmissionElectricity and gasScope for consolidation
KeySpanacquisition
Additional opportunities
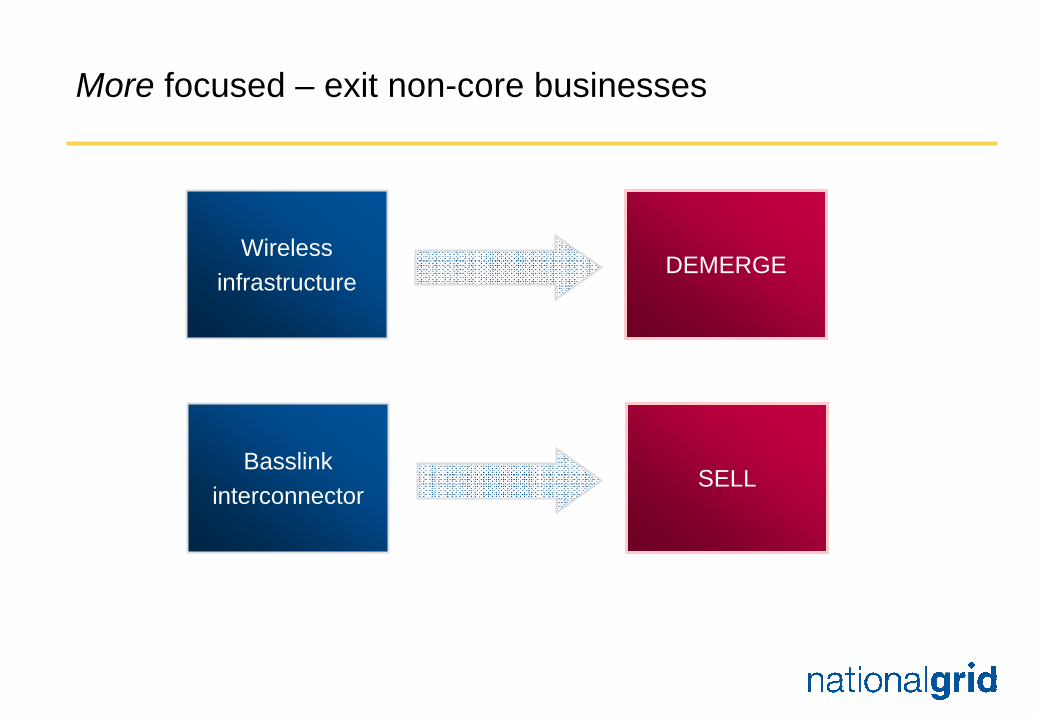
More focused – exit non-core businesses
Wirelessinfrastructure
DEMERGE
Basslinkinterconnector
SELL
National Grid… more integrated
More focused More integrated More disciplined
Driving shareholder value
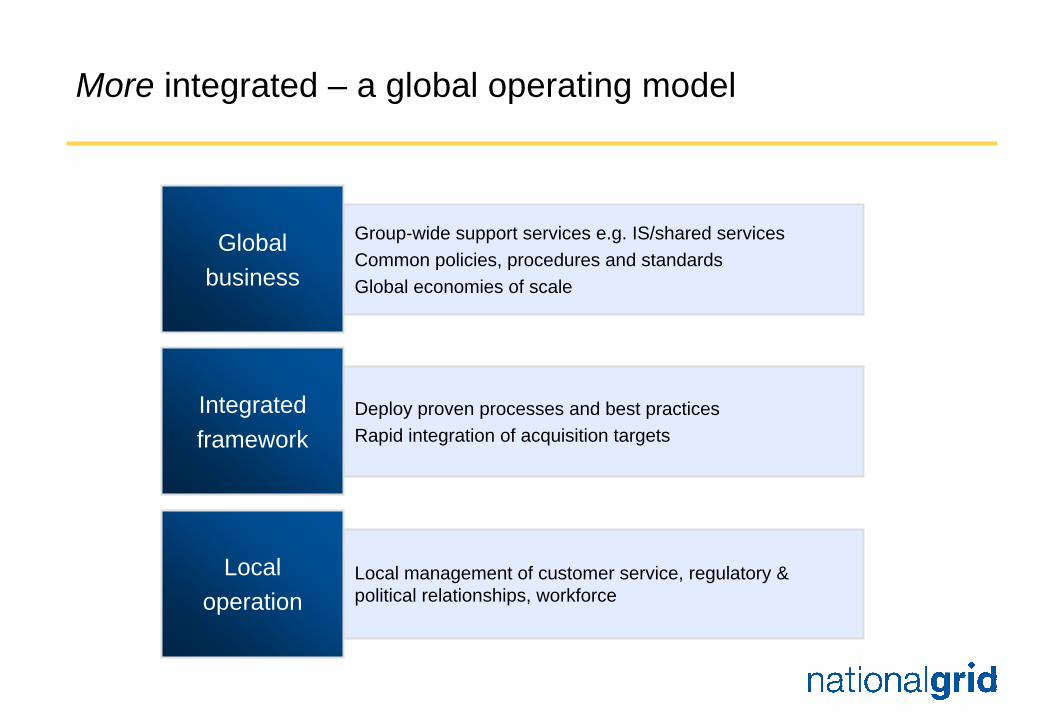
More integrated – a global operating model
Group-wide support services e.g. IS/shared servicesCommon policies, procedures and standardsGlobal economies of scale
Deploy proven processes and best practices Rapid integration of acquisition targets
Local management of customer service, regulatory & political relationships, workforce
Globalbusiness
Integratedframework
Localoperation
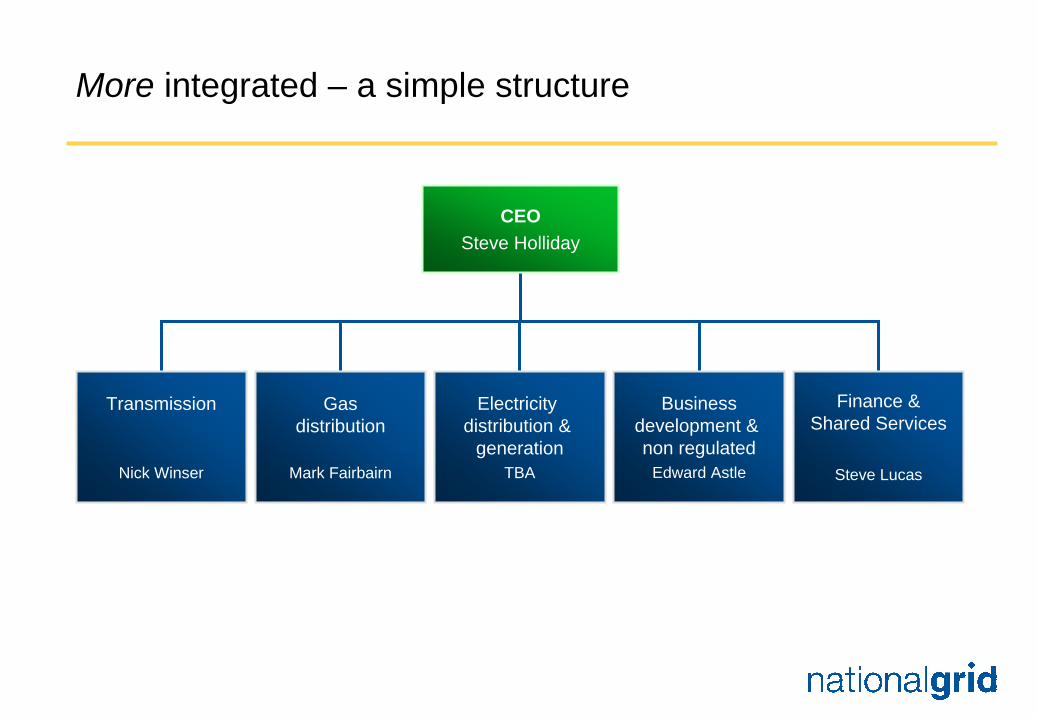
More integrated – a simple structure
Transmission
Nick Winser
Gasdistribution
Mark Fairbairn
Electricity distribution &
generationTBA
Finance &Shared Services
Steve Lucas
CEOSteve Holliday
Businessdevelopment & non regulated
Edward Astle

National Grid… more disciplined
More focused More integrated More disciplined
Driving shareholder value

More disciplined – balance sheet and dividend
Maintain efficient balance sheet followingthe KeySpan acquisition
Return surplus cash to shareholders
Balance Sheet
7% annual increase targeted through to March 2008
Return US stranded asset cash via a share buy-back
Dividend

National Grid… the future
Focus on principal growth markets in the UK and US
Demerge Wireless infrastructure
Sell Basslink
More focused
Global operating modelDriving efficiencies
KeySpan acquisition and integration
Simple organisation structure
More integrated
Maintain efficientbalance sheet
Return cash
More disciplined
Driving shareholder value

Appendix
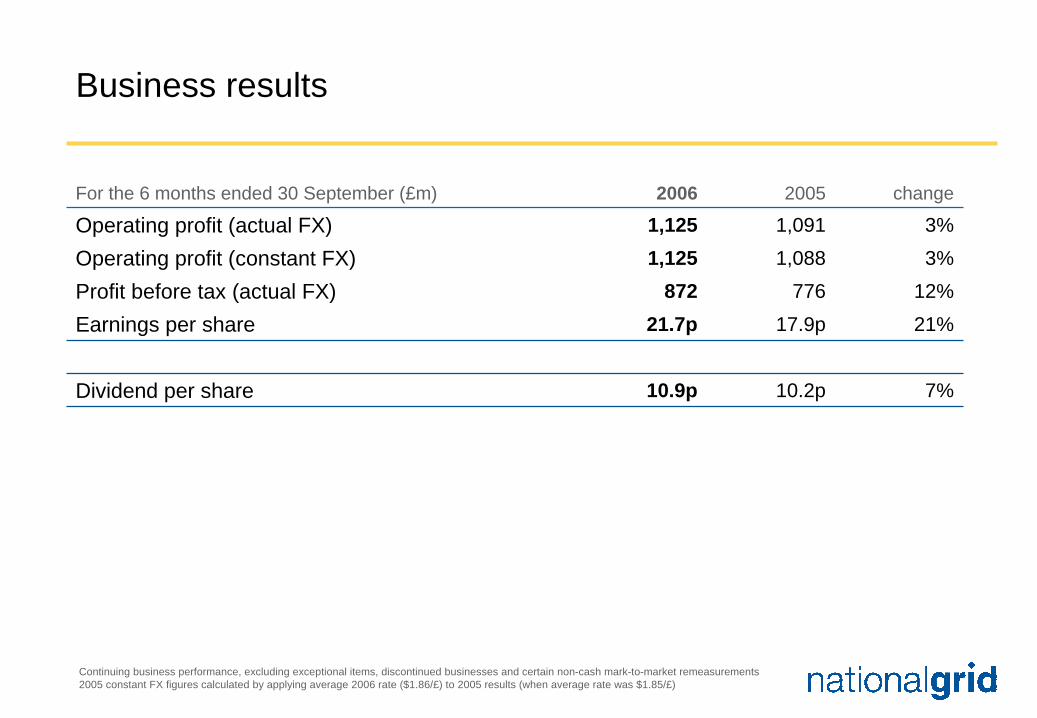
Business results
10.9p
21.7p872
1,1251,1252006
7%10.2pDividend per share
21%17.9pEarnings per share12%776Profit before tax (actual FX)3%1,088Operating profit (constant FX) 3%1,091Operating profit (actual FX)
change2005For the 6 months ended 30 September (£m)
Continuing business performance, excluding exceptional items, discontinued businesses and certain non-cash mark-to-market remeasurements2005 constant FX figures calculated by applying average 2006 rate ($1.86/£) to 2005 results (when average rate was $1.85/£)
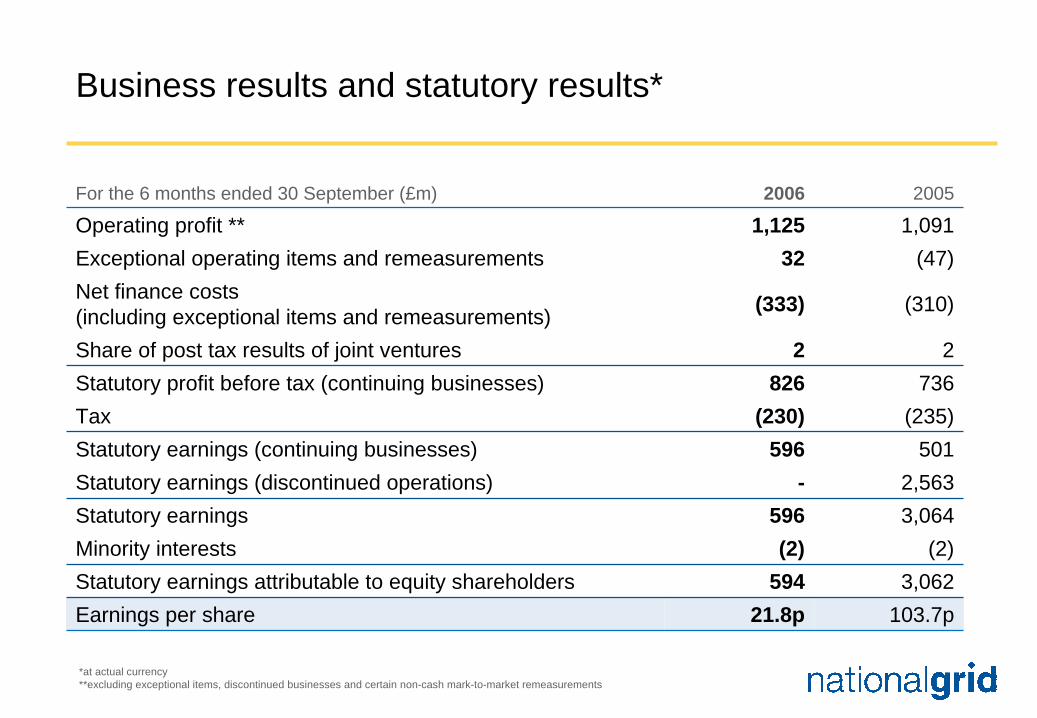
Business results and statutory results*
(47)32Exceptional operating items and remeasurements1,0911,125Operating profit **
501596Statutory earnings (continuing businesses)(235)(230)Tax
736826Statutory profit before tax (continuing businesses)22Share of post tax results of joint ventures
(310)(333)Net finance costs (including exceptional items and remeasurements)
103.7p21.8pEarnings per share3,062594Statutory earnings attributable to equity shareholders
(2)(2)Minority interests3,064596Statutory earnings2,563-Statutory earnings (discontinued operations)
20052006For the 6 months ended 30 September (£m)
*at actual currency**excluding exceptional items, discontinued businesses and certain non-cash mark-to-market remeasurements

UK electricity and gas transmissionOperating profit
2326Electricity System Operator252270Electricity Transmission Owner*
1-Other gas1825Gas System Operator6752Gas Transmission Owner
275298Sub total – UK electricity transmission-2Other electricity
397427Total – UK electricity & gas transmission3652Sub total – other1923LNG1729Interconnectors8677Sub total – UK gas transmission
20052006For the 6 months ended 30 September (£m)
Continuing business performance, excluding exceptional items, and certain non-cash mark-to-market remeasurements* Includes the Scottish Interconnector
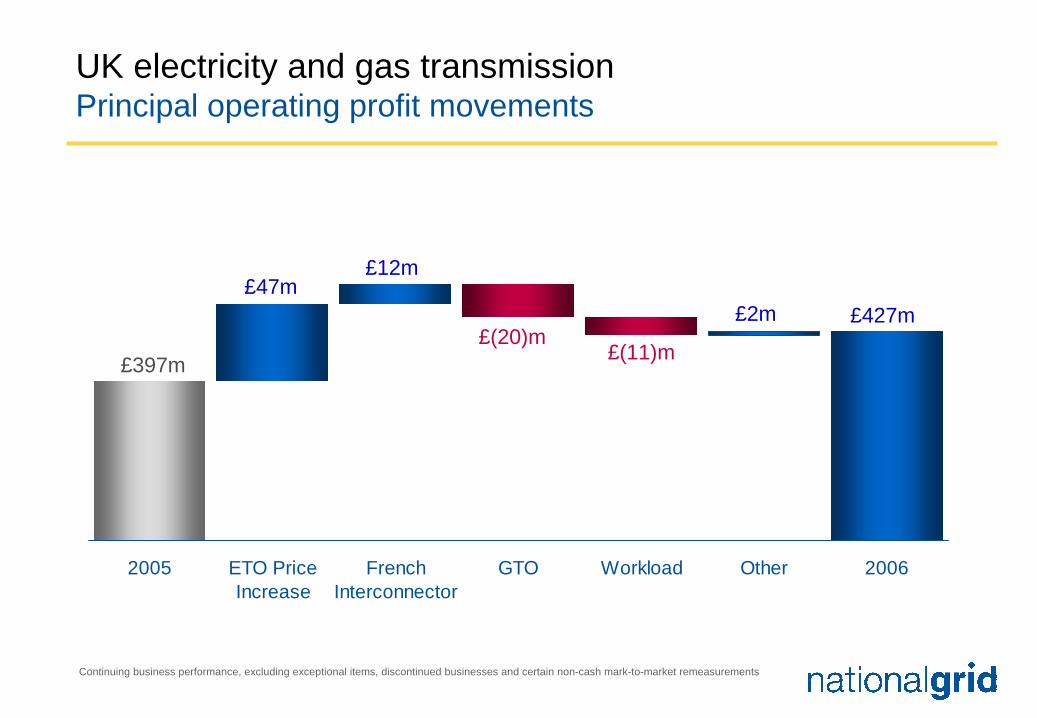
UK electricity and gas transmissionPrincipal operating profit movements
2005 ETO PriceIncrease
FrenchInterconnector
GTO Workload Other 2006
£427m
£397m
£47m£12m
£(20)m£(11)m
£2m
Continuing business performance, excluding exceptional items, discontinued businesses and certain non-cash mark-to-market remeasurements
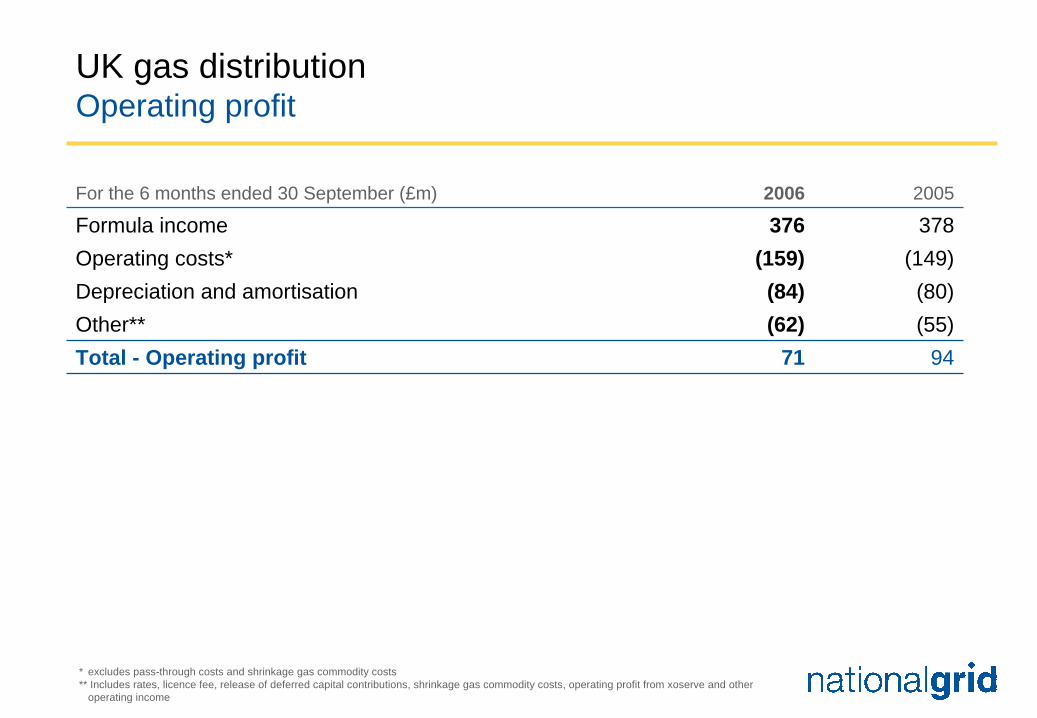
UK gas distributionOperating profit
(149)(159)Operating costs*378376Formula income
9471Total - Operating profit(55)(62)Other**(80)(84)Depreciation and amortisation
20052006For the 6 months ended 30 September (£m)
* excludes pass-through costs and shrinkage gas commodity costs** Includes rates, licence fee, release of deferred capital contributions, shrinkage gas commodity costs, operating profit from xoserve and other
operating income
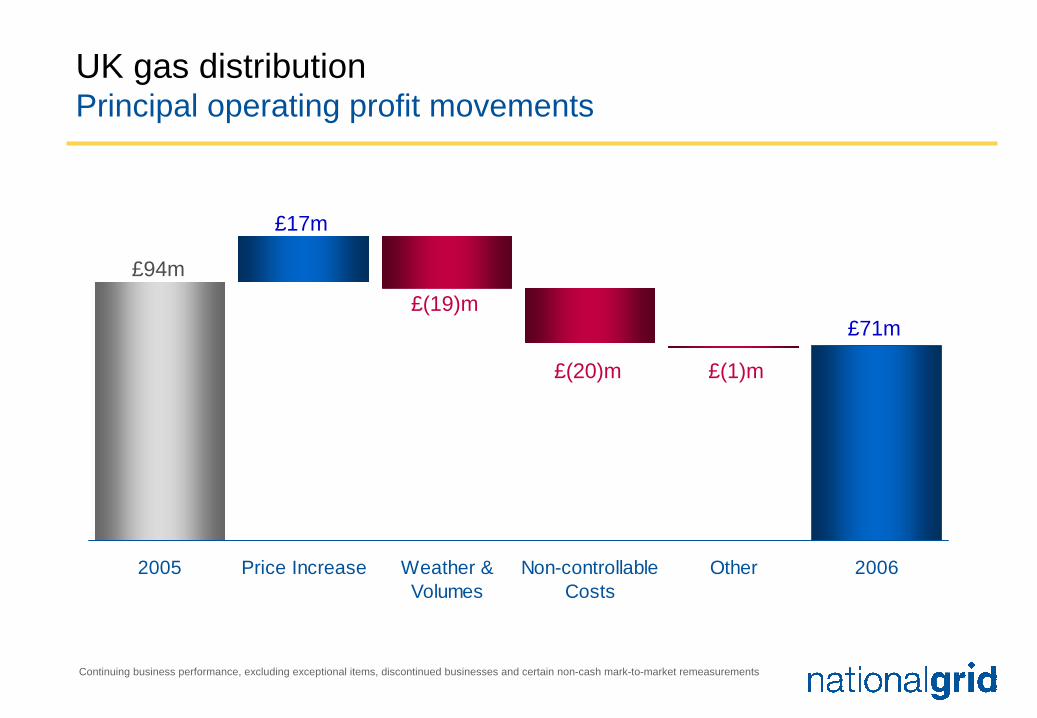
UK gas distributionPrincipal operating profit movements
2005 Price Increase Weather &Volumes
Non-controllableCosts
Other 2006
Continuing business performance, excluding exceptional items, discontinued businesses and certain non-cash mark-to-market remeasurements
£71m
£94m£(19)m
£(20)m
£17m
£(1)m

US businessesOperating profit
418453Sub total – US distribution businesses249202US stranded cost recoveries
6867US electricity transmission
169251US electricity and gas distribution
488522Total – US businesses22Wireless infrastructure (US operations)
20052006For the 6 months ended 30 September (£m)
Continuing business performance, excluding exceptional items, discontinued businesses and certain non-cash mark-to-market remeasurements2005 constant FX figures calculated by applying average 2006 rate ($1.86/£) to 2005 results (when average rate was $1.85/£)
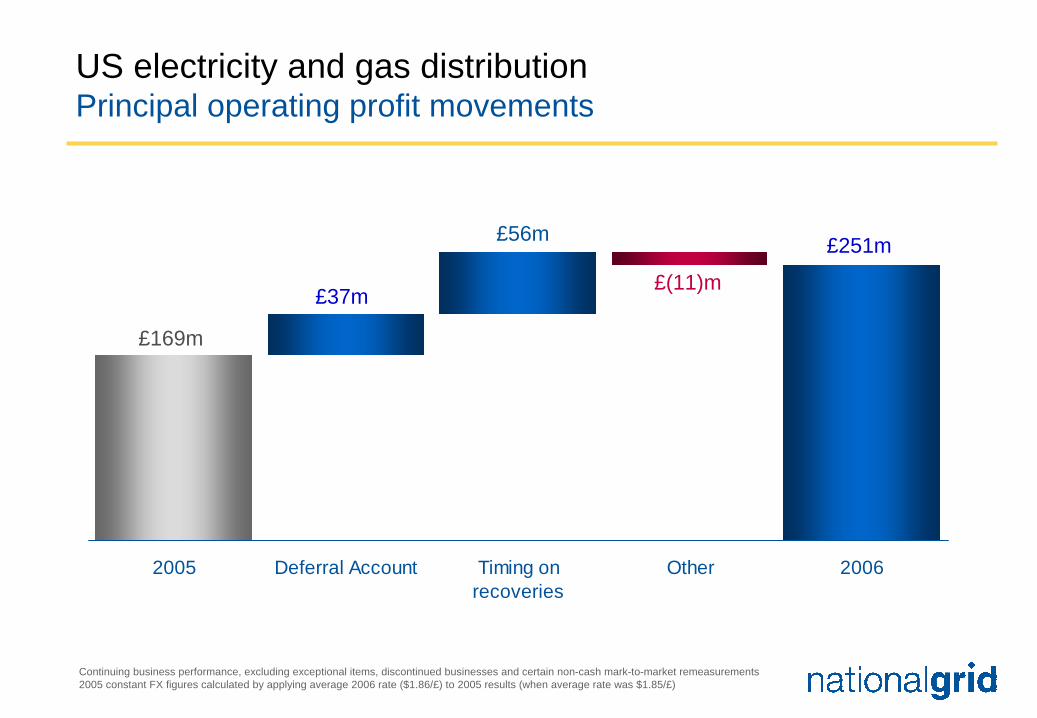
US electricity and gas distributionPrincipal operating profit movements
2005 Deferral Account Timing onrecoveries
Other 2006
Continuing business performance, excluding exceptional items, discontinued businesses and certain non-cash mark-to-market remeasurements2005 constant FX figures calculated by applying average 2006 rate ($1.86/£) to 2005 results (when average rate was $1.85/£)
£251m
£169m
£37m
£56m
£(11)m

Other activities
15Isle of Grain3132Property
-5Basslink
5254Metering
7565Total - Other activities(9)(31)Other
20052006For the 6 months ended 30 September (£m)
Continuing business performance, excluding exceptional items, discontinued businesses and certain non-cash mark-to-market remeasurements
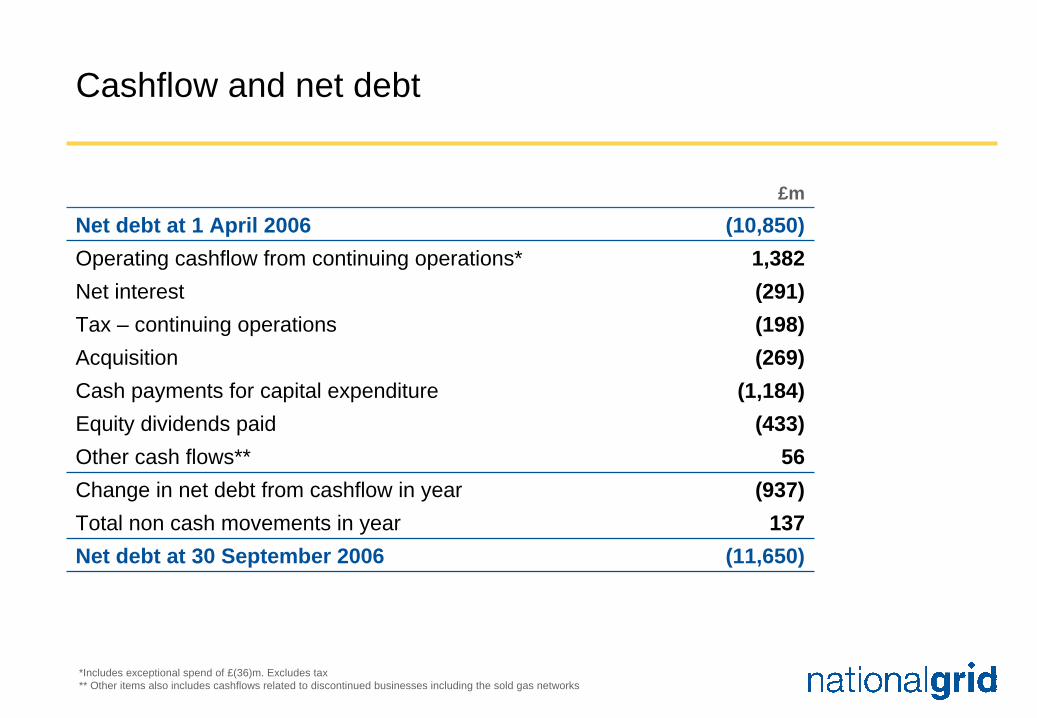
Cashflow and net debt
(10,850)Net debt at 1 April 20061,382Operating cashflow from continuing operations*(291)Net interest(198)Tax – continuing operations(269)Acquisition
(1,184)Cash payments for capital expenditure(433)Equity dividends paid
56Other cash flows**(937)Change in net debt from cashflow in year
137Total non cash movements in year(11,650)Net debt at 30 September 2006
£m
*Includes exceptional spend of £(36)m. Excludes tax ** Other items also includes cashflows related to discontinued businesses including the sold gas networks

Operating cashflow
1,125Operating profit *460Depreciation and amortisation
(203)Working capital and other1,382Operating cashflow **
For the 6 months ended 30 September (£m)
* Excluding exceptional items and certain non-cash mark-to-market remeasurements** Includes exceptional spend of £(36)m. Excludes tax
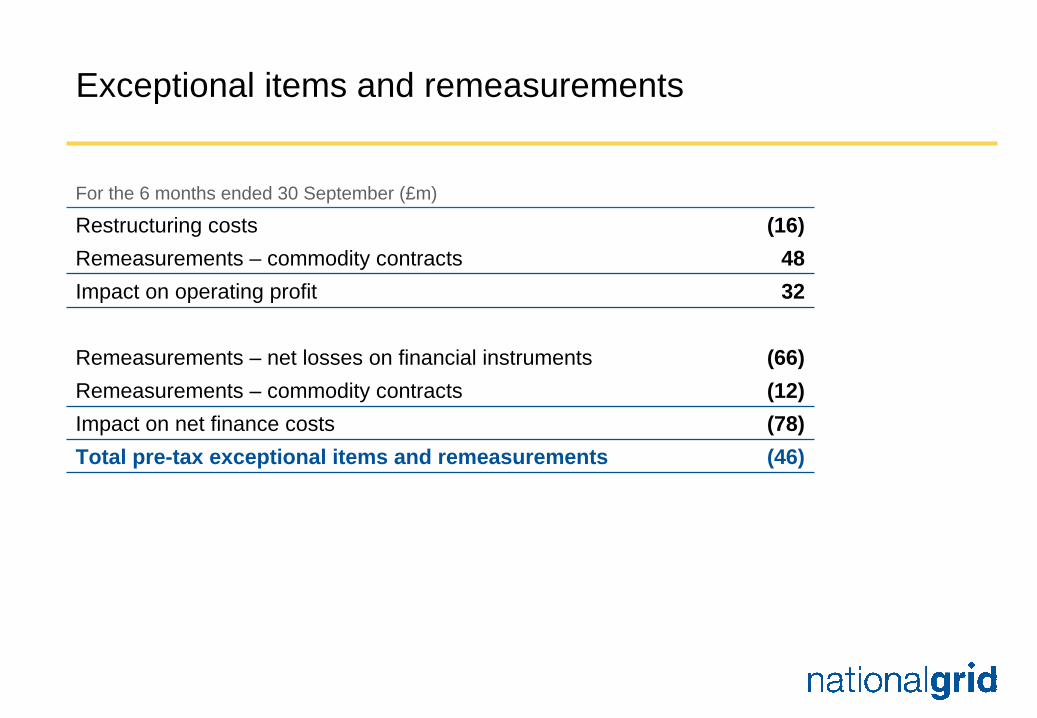
Exceptional items and remeasurements
32Impact on operating profit48Remeasurements – commodity contracts
(16)Restructuring costs
(12)Remeasurements – commodity contracts(66)Remeasurements – net losses on financial instruments
(78)Impact on net finance costs(46)Total pre-tax exceptional items and remeasurements
For the 6 months ended 30 September (£m)
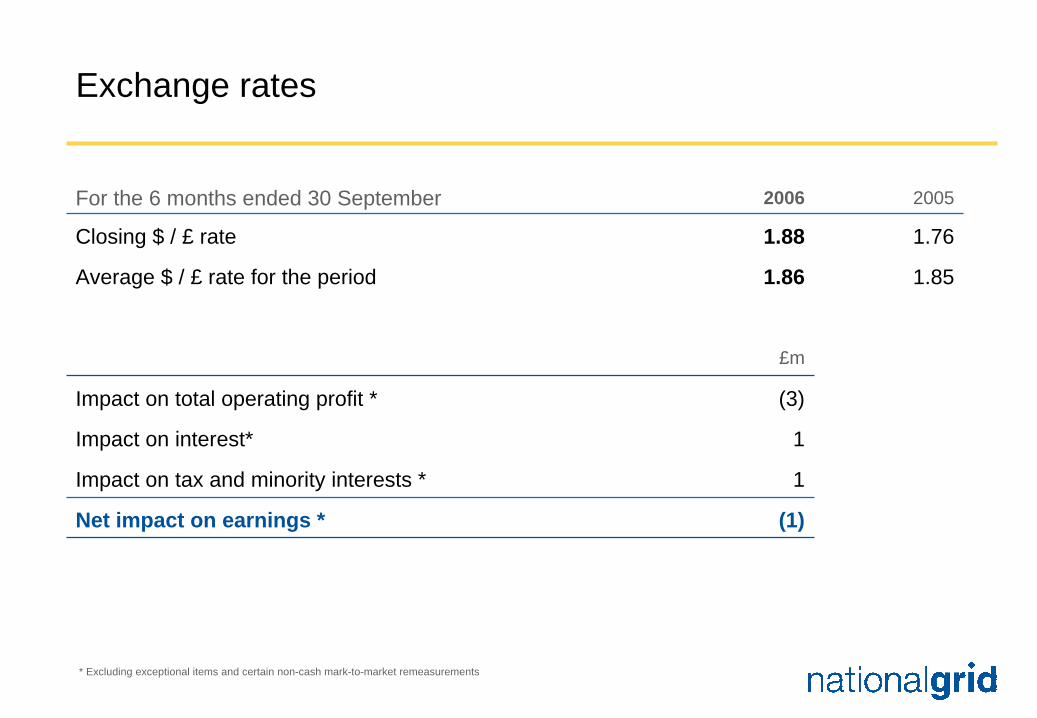
Exchange rates
(1)Net impact on earnings *
1Impact on tax and minority interests *
1Impact on interest*
(3)Impact on total operating profit *
£m
1.851.86Average $ / £ rate for the period
1.761.88Closing $ / £ rate
20052006For the 6 months ended 30 September
* Excluding exceptional items and certain non-cash mark-to-market remeasurements
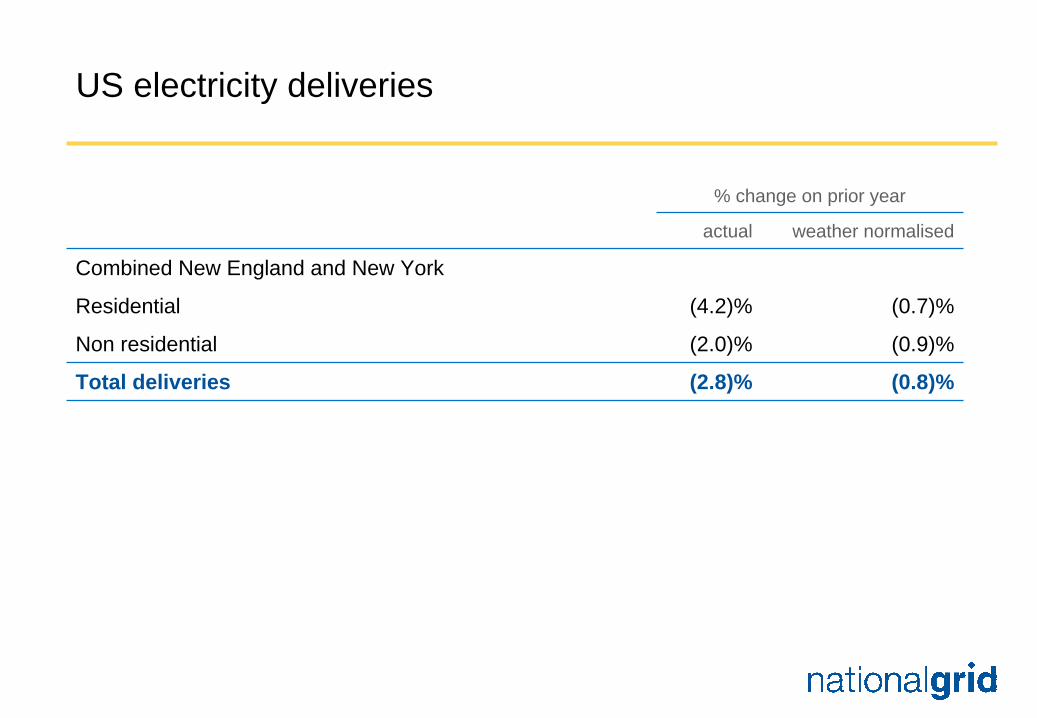
US electricity deliveries
(0.8)%(2.8)%Total deliveries
(0.9)%(2.0)%Non residential
(0.7)%(4.2)%Residential
Combined New England and New York
weather normalisedactual
% change on prior year
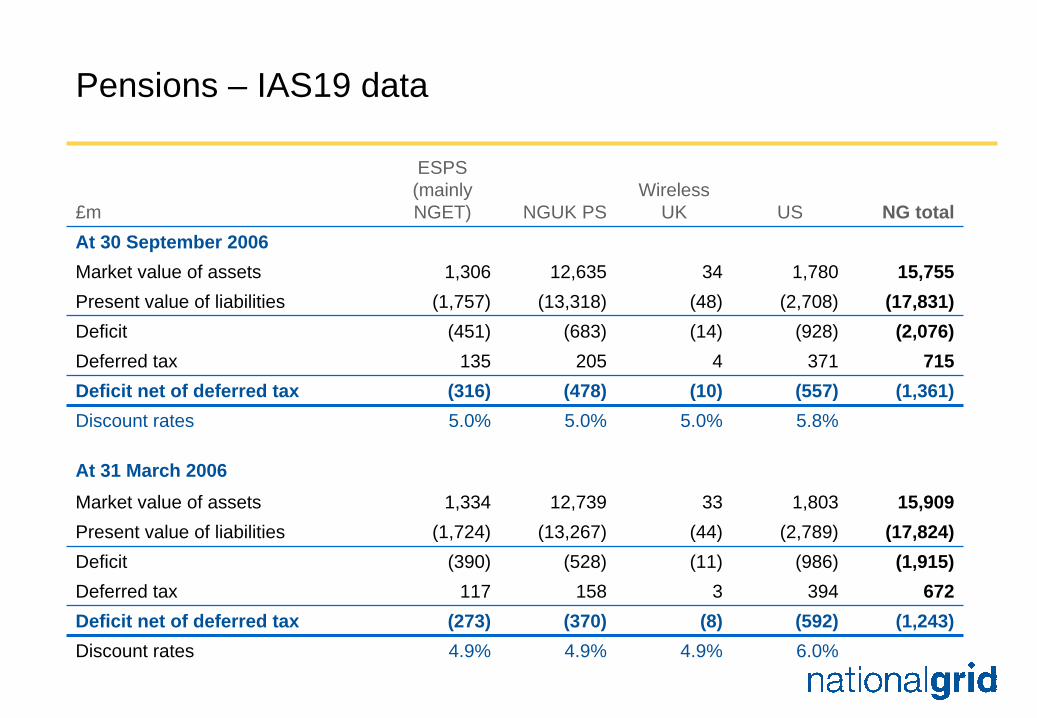
Pensions – IAS19 data
6.0%4.9%4.9%4.9%Discount rates(1,243)(592)(8)(370)(273)Deficit net of deferred tax
6723943158117Deferred tax(1,915)(986)(11)(528)(390)Deficit
(17,824)(2,789)(44)(13,267)(1,724)Present value of liabilities15,9091,8033312,7391,334Market value of assets
At 31 March 2006
5.8%5.0%5.0%5.0%Discount rates(1,361)(557)(10)(478)(316)Deficit net of deferred tax
7153714205135Deferred tax(2,076)(928)(14)(683)(451)Deficit
(17,831)(2,708)(48)(13,318)(1,757)Present value of liabilities15,7551,7803412,6351,306Market value of assets
At 30 September 2006NG totalUS
Wireless UKNGUK PS
ESPS (mainly NGET)£m