Case Study of Program Keluarga Harapan
41
Evaluation Design & Method: Case Study of Program Keluarga Harapan MONITORING & EVALUATION WORKING GROUP - TNP2K Jakarta, 27 Agustus 2014
Transcript of Case Study of Program Keluarga Harapan

TIM NASIONAL PERCEPATAN PENANGGULANGAN KEMISKINAN
Evaluation Design & Method: Case Study of Program Keluarga Harapan
MONITORING & EVALUATION WORKING GROUP - TNP2K Jakarta, 27 Agustus 2014

Evaluation • Operational evaluation examines how effectively
programs were implemented and whether there are gaps between planned and realized outcomes
• Impact evaluation studies whether the changes in well-being are indeed due to the program intervention and not to other factors – Specifically, impact evaluation tries to determine whether
it is possible to identify the program effect and to what extent the measured effect can be attributed to the program and not to some other causes
(Khandker, et.al, handbook on Impact Evaluation: Quantitative Methods and
Practices, World Bank, 2010)

SOME BACKGROUND & ILLUSTRATION
Impact Evaluation

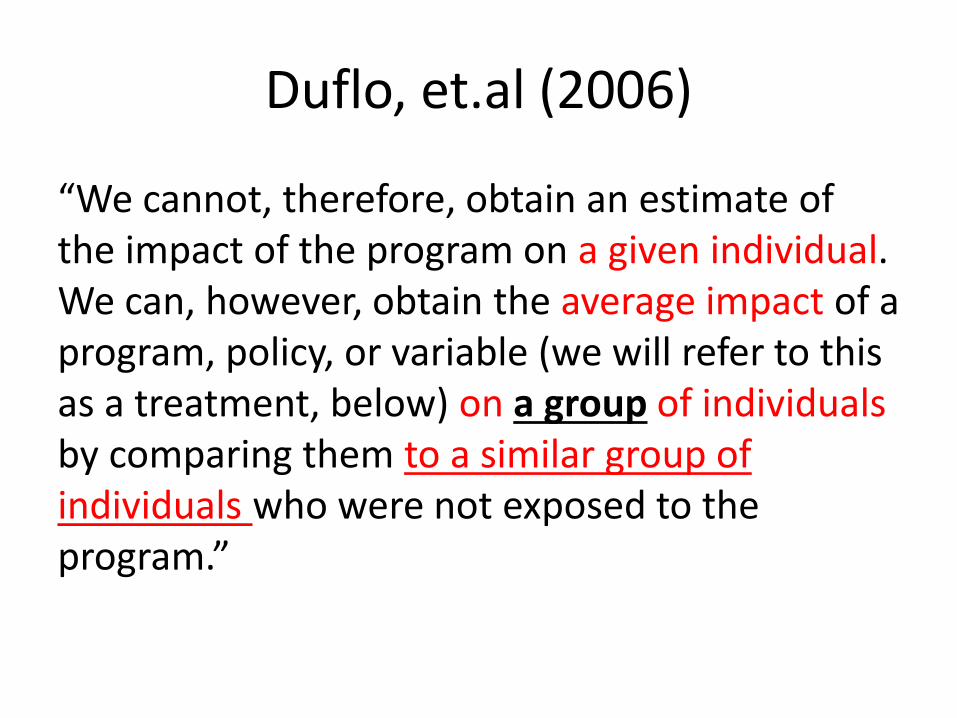
Duflo, et.al (2006)
“At a given point in time, an individual is either exposed to the program or not. Comparing the same individual over time will not, in most cases, give a reliable estimate of the program's impact since other factors that affect outcomes may have changed since the program was introduced.”
Duflo, et.al (2006)
“We cannot, therefore, obtain an estimate of the impact of the program on a given individual. We can, however, obtain the average impact of a program, policy, or variable (we will refer to this as a treatment, below) on a group of individuals by comparing them to a similar group of individuals who were not exposed to the program.”

In reality, use statistics Treatment Comparison
Average of outcomes=10 units Average of outcomes= 3 units
IMPACT=10-3=7 units
X
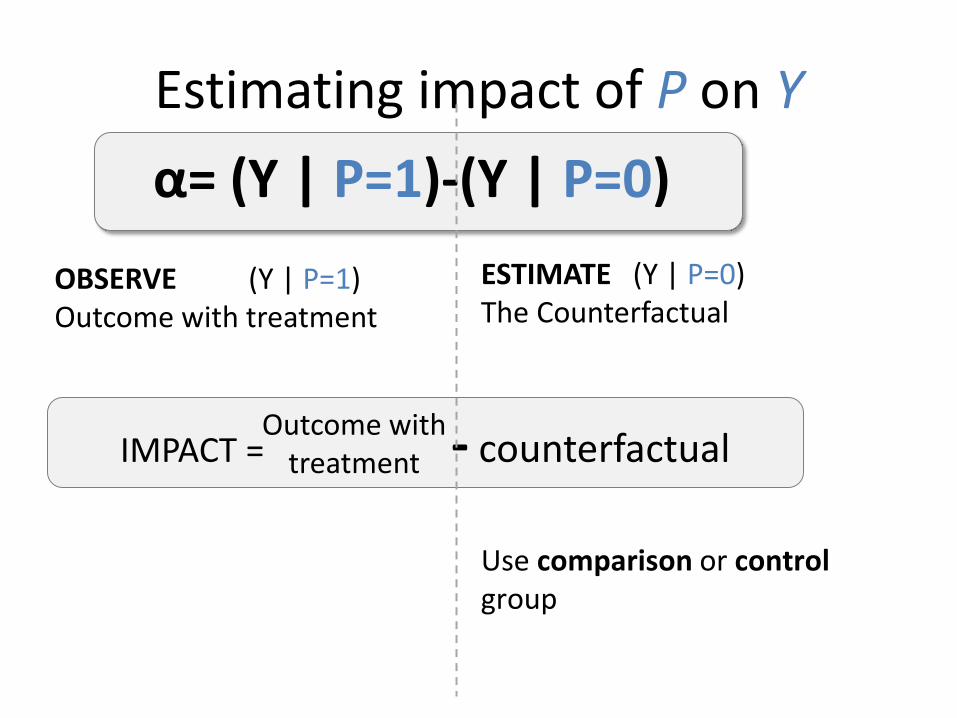
Estimating impact of P on Y
OBSERVE (Y | P=1) Outcome with treatment
ESTIMATE (Y | P=0) The Counterfactual
Use comparison or control group
α= (Y | P=1)-(Y | P=0)
IMPACT = - counterfactual Outcome with
treatment

Impact Evaluation
An assessment of the causal effect of a project , program or policy on beneficiaries. Uses a counterfactual… o to estimate what the state of the beneficiaries would have
been in the absence of the program (the control or comparison group), compared to the observed state of beneficiaries (the treatment group), and
o to determine intermediate or final outcomes attributable to the intervention .

Counterfactual Criteria
Treated & Counterfactual (1) Have identical characteristics, (2) Except for benefiting from the intervention.
No other reason for differences in outcomes of treated and counterfactual: Only reason for the difference in outcomes is due to the intervention

Evaluation Design
• Evaluation designs are determined by the choice of methods used to identify a comparison/control group, or in other words, a group of non-participants in a program or a project.
• This comparison/control group should be as similar to the target group as possible, but for the fact that its members do not participate in a program or receive the intervention.

Evaluation Design
• Evaluation designs can be broadly classified into three categories: experimental, quasi-experimental and non-experimental. – The term control group is used when the evaluation
employs an experimental design and the term comparison group is associated with a quasi-experimental design.
– In non-experimental design, program participants are compared to non-participants by controlling statistically for differences between participants and non-participants.
• These three evaluation designs vary in feasibility, cost, the degree of clarity and validity of results, and the degree of selection bias.
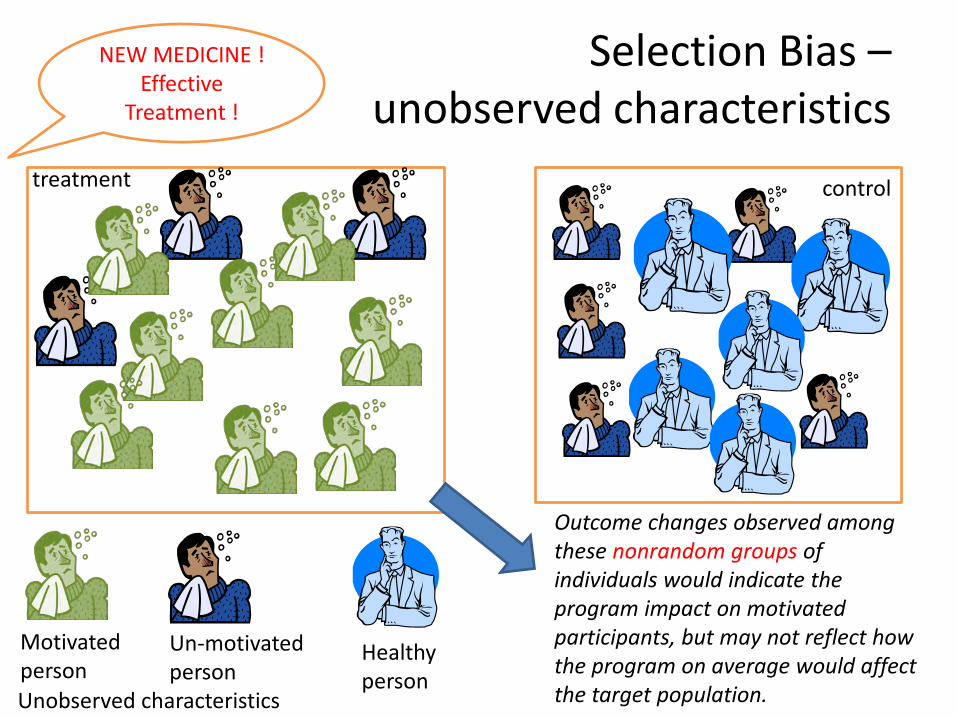
Selection Bias – unobserved characteristics
Motivated person
Un-motivated person
NEW MEDICINE !
Effective Treatment !
Outcome changes observed among these nonrandom groups of individuals would indicate the program impact on motivated participants, but may not reflect how the program on average would affect the target population.
control treatment
Unobserved characteristics
Healthy person

What's wrong? Selection bias: People choose to participate for specific reasons
1
2
3
o Job Training: ability and earning o Health Insurance: health status and medical
expenditures
Many times reasons are related to the outcome of interest
Cannot separately identify impact of the program from these other factors/reasons

Possible Solutions Need to guarantee comparability of treatment and control groups.
ONLY remaining difference is intervention.

Experimental (randomized)
• Randomized Evaluations go by many names – Randomized Controlled Trials – Social Experiments – Random Assignment Studies – Randomized Field Trials – Randomized Controlled
Experiments
• RCT can solve selection bias http
s://
ww
w.p
over
tyac
tionl
ab.o
rg/m
etho
dolo
gy/w
hat-
rand
omiza
tion

= Ineligible
Randomized treatments and comparisons
= Eligible
1. Population
External Validity
2. Evaluation sample
3. Randomize treatment
Internal Validity
Comparison
Treatment
X
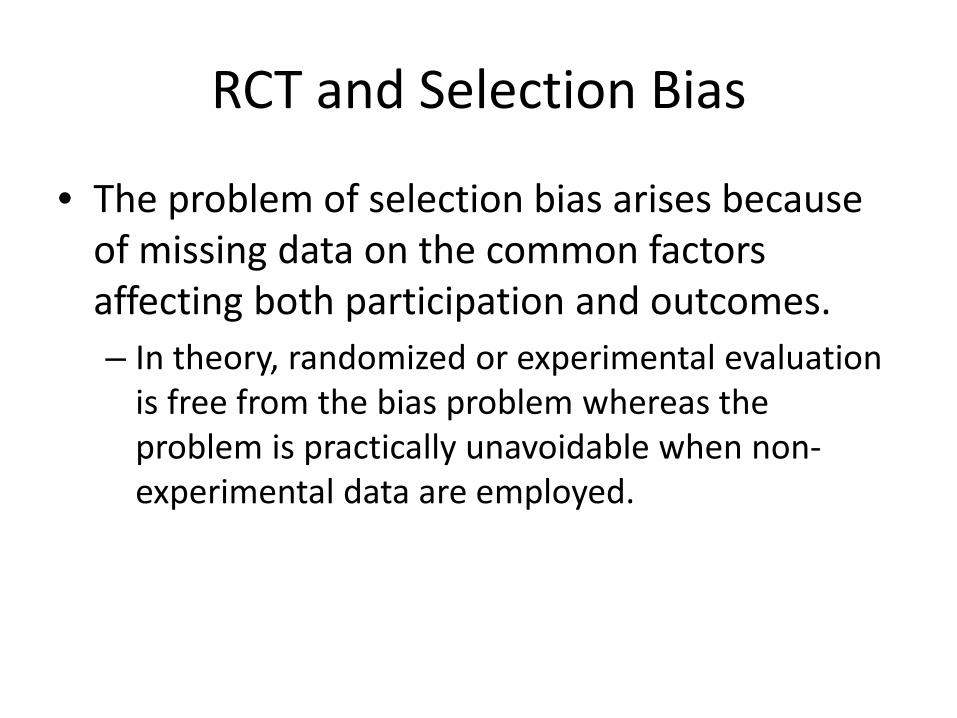
RCT and Selection Bias
• The problem of selection bias arises because of missing data on the common factors affecting both participation and outcomes. – In theory, randomized or experimental evaluation
is free from the bias problem whereas the problem is practically unavoidable when non-experimental data are employed.

Keep in Mind Randomized Assignment In Randomized Assignment, large enough samples, produces 2 statistically equivalent groups.
We have identified the perfect clone.
Randomized beneficiary
Randomized comparison
Feasible for prospective evaluations with over-subscription/excess demand.
Most pilots and new programs fall into this category.
!

PROGRAM KELUARGA HARAPAN (PKH) IMPACT EVALUATION DESIGN AND ESTIMATION METHOD
Case Study

Program Keluarga Harapan
• First household-based conditional cash transfer program, started in 2007 – Community based: PNPM Generasi – Pilot project for 3 years
• The program is intended to improve the welfare of extremely poor households by providing them with quarterly cash transfers

Program Keluarga Harapan
• At the same time, the program is designed to break the transmission of poverty to next generations by encouraging families to increase their use of public services to, over time, improve the health and education outcomes of their children – providing the transfer only to households with
pregnant women and/or children, provided that they fulfill specific health and education-related obligations.
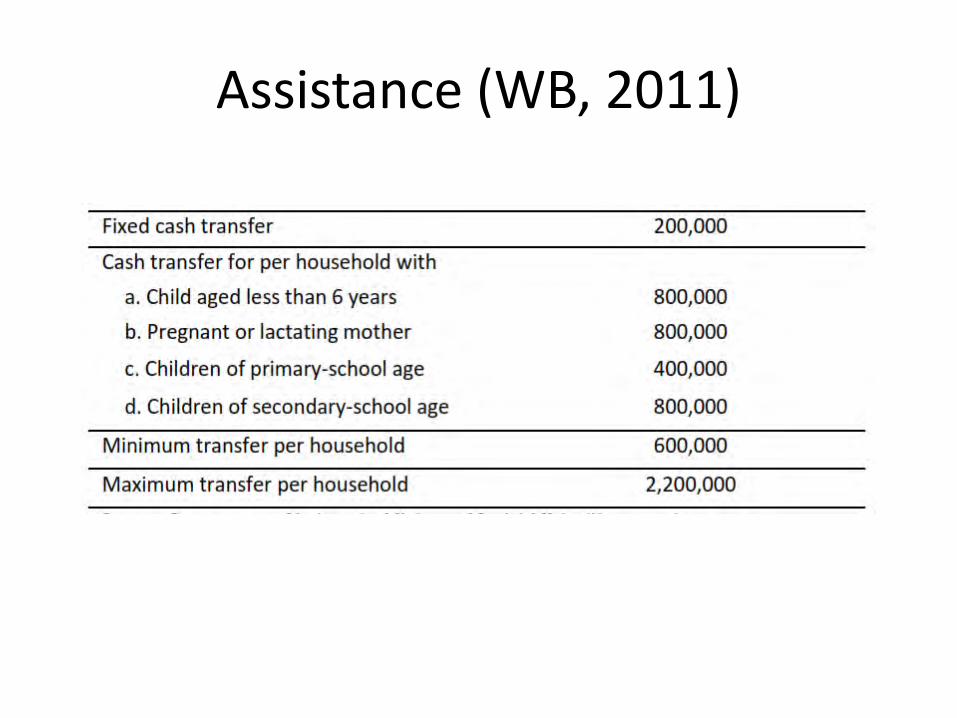
Assistance (WB, 2011)

BUMIL/NIFAS/BALITA USIA SD USIA SMP1 800.000,- 300.000,- - 500.000,- - -
1.000.000,- - - -- 1.000.000,- - Bila ada 2 anak SD- - 1.000.000,- -
1.000.000,- 500.000,- - -- 500.000,- 1.000.000,- -- 1.500.000,- - Bila ada 3 anak SD
1.000.000,- - 1.000.000,- -- - 2.000.000,- Bila ada 2 anak SMP
1.000.000,- 1.000.000,- - Bila ada 2 anak SD- 1.000.000,- 1.000.000,- Bila ada 2 anak SD
5 2.800.000,- 300.000,- 1.000.000,- 500.000,- 1.000.000,- -
BANTUAN TETAPKOMPONEN PKH
KETERANGAN
1.300.000,-2
3
4
NO NOMINAL BANTUAN/TAHUN
1.800.000,-
2.300.000,-
300.000,-
300.000,-
300.000,-
Sumber: kemensos (2014)
ASSISTANCE (KEMENSOS, 2014)

Results Chain of PKH INPUTS ACTIVITIES OUTPUTS OUTCOMES IMPACTS
Collect eligibility data;
set up services; check
compliance
Cash transfer; Pay staff; Staff to deliver service; Check compliance
Provide fund for cash transfer;
system to check
compliance
Increase use of education and
health services; increase
spending on goods
Reduction in current
poverty & future poverty,
increase in health status
•Budgeting •Staffing
•Data collection
•Train staff •Explain
•Cash transfer delivered
•Health and educ. Services
•Data collection
•Higher school enrolment
•Higher use of health services
•Higher years of education
•Better health •Lower poverty
Activities of implementing agencies (SUPPLY SIDE) Results (SUPPLY + BEHAVIOR)

PKH and PNPM Generasi
Sumber: World Bank, 2011a

PKH Recently
Sumber: kemensos

PKH Impact Evaluation Flow
BASELINE SURVEY
FOLLOW-UP SURVEY (2)
Baseline Measurement of outcome prior to intervention to improve program design
End-line Measurement of outcome after 6 years of intervention
Time
× Ex-ante √ Ex-post
2007 2009 2013
FOLLOW-UP SURVEY (1)
Mid-line Measurement of outcome after 2 years of intervention
√ Ex-post
INTERVENTION

Area Selection and Sub-District Randomization


EVALUATION DESIGN: PKH • RCT, 360 kecamatan
– Eligibility of Kecamatans was based on, for example: malnutrition prevalence characteristics, poverty rate, drop-out rate, supply side readiness (education, health)
– Treatment and control areas were selected randomly from the list of eligible kecamatans
– Household sample was selected from the list of eligible households in the selected kecamatans

EVALUATION DESIGN: PKH
• However: – There were conversion (from control-kecamatans
to treatment kecamatans) in 2009 & 2013 • Non-random conversion in control kecamatans,
introducing selection as well as endogeneity bias • Statistical power may deteriorate

Baseline and Endline Samples
Baseline Survey Sampling (2007) 6 provinces, 360 Kecamatans, 14.400 HH 180 treatment Kecamatans (PKH) 180 Kecamatan was allocated as control
End-line Survey Sampling (2013) 6 provinces, 450 Kecamatans, 18.000 HH 227 treatment Kecamatans, – 179 of which are
baseline panel 110 + 76 Kecamatans were used as control

Sample Status (2013)
PKH treatment areas randomly selected
769 sub-districts
PKH control areas randomly selected
316 sub-districts
Treatment areas sample randomly selected (stratified by
urban/rural) 180 sub-districts
Treatment
Area 2 PKH
implementation started in
2007/2009: 179 sub-districts
Control Area 1
PKH was not implemented:
110 sub-districts
Control Area 2
Converted into PKH
treatment area:
70 sub-districts
Control areas sample randomly selected (stratified
by urban/rural) 180 sub-districts
Treatment
Area 1 PKH not
implemented (as of 2013):
1 sub-districts
39% terkonversi menjadi Kec. PKH
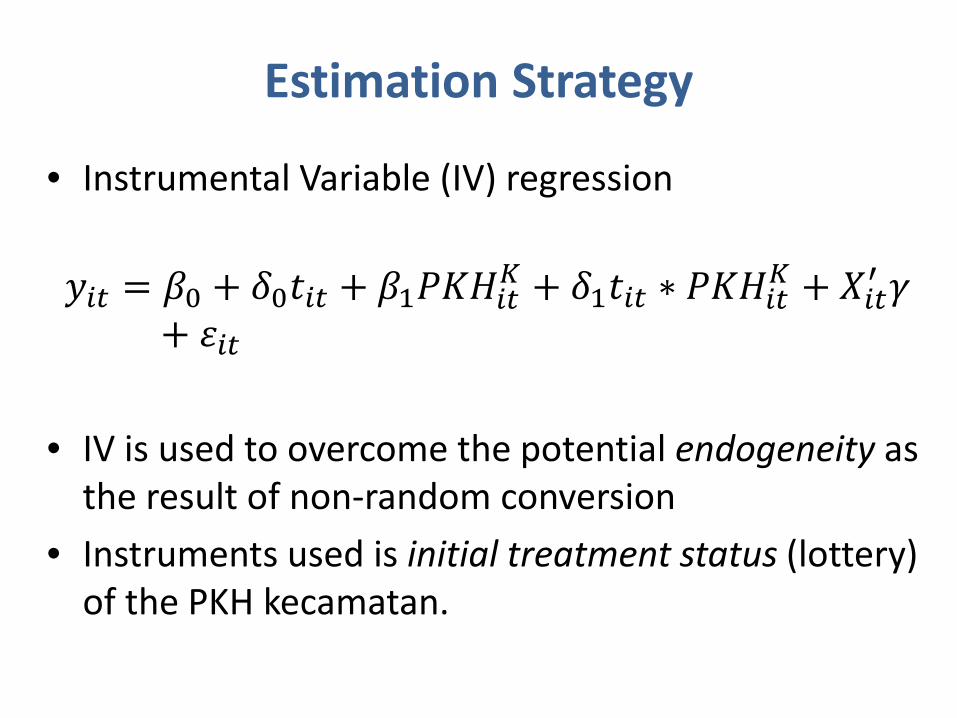
Estimation Strategy
• Instrumental Variable (IV) regression 𝑦𝑖𝑖 = 𝛽0 + 𝛿0𝑡𝑖𝑖 + 𝛽1𝑃𝑃𝑃𝑖𝑖𝐾 + 𝛿1𝑡𝑖𝑖 ∗ 𝑃𝑃𝑃𝑖𝑖𝐾 + 𝑋𝑖𝑖′ 𝛾
+ 𝜀𝑖𝑖 • IV is used to overcome the potential endogeneity as
the result of non-random conversion • Instruments used is initial treatment status (lottery)
of the PKH kecamatan.

Strategi Estimasi: Placement Effect
PKH treatment areas randomly selected
769 sub-districts
PKH control areas randomly selected
316 sub-districts
Treatment areas sample randomly selected (stratified by urban/rural)
180 sub-districts
Treatment Area 2 PKH implementation started in 2007/2009:
179 sub-districts
Control Area 1 PKH was not
implemented: 110 sub-districts
Control Area 2 Converted into PKH
treatment area: 70 sub-districts
Control areas sample randomly selected (stratified by urban/rural)
180 sub-districts
Group A PKH beneficiaries
in treatment areas:
3,175 HHs
Group B Non-beneficiaries
in treatment areas:
4,670 HHs
Treatment Area 1 PKH not
implemented (as of 2013):
1 sub-districts
50 HHs
4,744 HHs 842 + 2,225 HHs

Strategi Estimasi : Participation Effect
PKH treatment areas randomly selected
769 sub-districts
PKH control areas randomly selected
316 sub-districts
Treatment areas sample randomly selected (stratified by urban/rural)
180 sub-districts
Treatment Area 2 PKH implementation started in 2007/2009:
179 sub-districts
Control Area 1 PKH was not
implemented: 110 sub-districts
Control Area 2 Converted into PKH
treatment area: 70 sub-districts
Control areas sample randomly selected (stratified by urban/rural)
180 sub-districts
Group A PKH beneficiaries
in treatment areas:
3,175 HHs
Group B Non-beneficiaries
in treatment areas:
4,670 HHs
Treatment Area 1 PKH not
implemented (as of 2013):
1 sub-districts
50 HHs 4,744 HHs 842 + 2,225 HHs

Spill-Over Effect
PKH treatment areas randomly selected
769 sub-districts
PKH control areas randomly selected
316 sub-districts
Treatment areas sample randomly selected (stratified by urban/rural)
180 sub-districts
Treatment Area 2 PKH implementation started in 2007/2009:
179 sub-districts
Control Area 1 PKH was not
implemented: 110 sub-districts
Control Area 2 Converted into PKH
treatment area: 70 sub-districts
Control areas sample randomly selected (stratified by urban/rural)
180 sub-districts
Group A PKH beneficiaries
in treatment areas:
3,175 HHs
Group B Non-beneficiaries
in treatment areas:
4,670 HHs
Treatment Area 1 PKH not
implemented (as of 2013):
1 sub-districts
50 HHs 4,744 HHs 842 + 2,225 HHs

Note
• PKH has some significant impacts on some outcomes
• Nevertheless, it seems that the impact are still lower than some international results
38

THANK YOU

References • Duflo, E. et.al (2006), “Using Randomization in Development Economics Research:
A Toolkit, NBER Technical Working Paper Series 333 • Khandker, et. al (2010), Handbook on Impact Evaluation: Quantitative Methods
and Practices, World Bank • Gertler, et.al (2011), Impact Evaluation in Practice (including supplementary
material for presentation), World Bank • Pokja Monev TNP2K (2014), Evaluasi Dampak Program Keluarga Harapan, materi
presentasi internal • Purnagunawan, W. (2014), Introduction to Impact Evaluation: Basic Theory and
Concept, Training Materials for CEDS Econ Training Fest, Bandung • World Bank (2011), PKH Evidence and Policy Implications: summary of Results from
Impact Evaluation, Operation Analysis, and Spot Checks, Materials for Diskusi Pokja Kebijakan Monev TNP2K
• World Bank (2011), Program Keluarga Harapan: Main Findings from the Impact Evaluation of Indonesia’s pilot Household Conditional Cash Transfer Program
• World Bank website – http://web.worldbank.org/WBSITE/EXTERNAL/TOPICS/EXTPOVERTY/EXTISPMA/0,,contentMD
K:20188242~menuPK:412148~pagePK:148956~piPK:216618~theSitePK:384329,00.html#quasi

Qualitative Study: Sample & Data Collection • Selected area are PKH endline survey area • Sample : 22 villages in 6 districts/city of PKH pilot
(kohort 2007) from 6 pilot PKH province. • Control: 2 villages were selected from 2
Kecamatans , from 2 districts. • HH interviewed:
• Poor HH, stay poor • Pooh HH, welfare improved (not Poor HH anymore) • Poor HH, welfare deteriorate (from near poor to poor
or very poor) • Most Significance Change (MSC) & In-depth
interview methods were used to collect data