CASE CONTROL STUDY - Mahidolmed.mahidol.ac.th/ceb/sites/default/files/public/pdf... · ·...
65
14/08/57 1 Case-control study Patarawan Woratanarat, M.D., Ph.D. (Clin. Epid.) Department of Orthopaedics Faculty of Medicine Ramathibodi Hospital Objectives To understand A concept of case-control study Conduct a case-control study Selection of study population The principle of measurement Data collection Analysis
Transcript of CASE CONTROL STUDY - Mahidolmed.mahidol.ac.th/ceb/sites/default/files/public/pdf... · ·...

14/08/57
1
Case-control study
Patarawan Woratanarat, M.D., Ph.D. (Clin. Epid.)
Department of Orthopaedics
Faculty of Medicine Ramathibodi Hospital
Objectives
� To understand
� A concept of case-control study
� Conduct a case-control study
� Selection of study population
� The principle of measurement
� Data collection
� Analysis

14/08/57
2
Types of research
� Qualitative / quantitative
� Descriptive
� Exploratory/observational: case-control, cohort, cross-sectional study
� Experimental: RCT
4 groups
Think about your research question?

14/08/57
3
Study designs
� Guideline
� Therapy � RCT/Systematic review
� Diagnosis � Cross-section
� Screening � Cross-section
� Prognosis � Cohort
� Causation � Cohort, case-control
A concept of case-control study

14/08/57
4
Study designs
� Case-control study
Direction of the study
Population
People with disease
People withoutdisease
Exposed
Exposed
Not exposed
Not exposed
Study designs
� Case-control study
Direction of the study
Population
THR patientsWith DVT
THR patientWithout DVT
Spinal anesthesia
Spinal anesthesia
General anesthesia
General anesthesia

14/08/57
5
Case-control studies
� Advantages
� Valuable for rare conditions
� Short duration
� Inexpensive
� Small sample size
� Yield odds ratio
� Disadvantages
� Limit to one outcome
� Potential selection bias
� Measurement bias
� Survivor bias
� Do not establish a temporal sequence
� Do not yield absolute risk estimates
Conducting a case-control study

14/08/57
6
Research process
� Phase I: Identify the research question
� Phase II: Design the study
� Phase III: Methods
� Phase IV: Data analysis
� Phase V: Communication
Research question
� Hypothesis: � a statement in which an attempt is made to
generalize about the nature of the universe in which we live.
� To act as a guide in interpreting the wider meanings of a particular data set
� Research question� Identifies the issue to be addressed by the
research , it does not have to be stated in a testable form
14/08/57
7
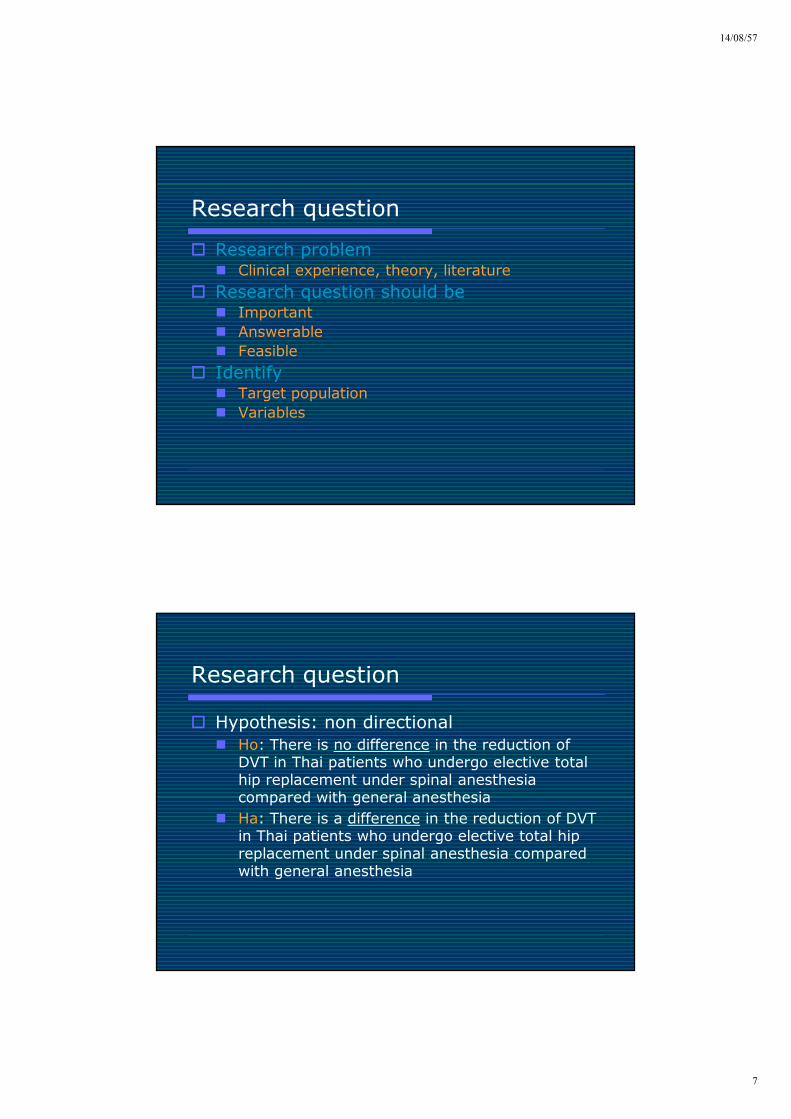
Research question
� Research problem� Clinical experience, theory, literature
� Research question should be� Important
� Answerable
� Feasible
� Identify� Target population
� Variables
Research question
� Hypothesis: non directional
� Ho: There is no difference in the reduction of DVT in Thai patients who undergo elective total hip replacement under spinal anesthesia compared with general anesthesia
� Ha: There is a difference in the reduction of DVT in Thai patients who undergo elective total hip replacement under spinal anesthesia compared with general anesthesia

14/08/57
8
Research question
� Hypothesis: directional
� Ho: spinal anesthesia does not reduce risk of DVT in Thai patients who undergo elective total hip replacement from 10% to 3% when compared with general anesthesia.
� Ha: spinal anesthesia reduce risk of DVT in Thai patients who undergo elective total hip replacement from 10% to 3% when compared with general anesthesia.
J Arthroplasty. 1999;14(4):456-63.Clin Orthop. 1989;247: 163-7.
Research question
� Research question
� Does spinal anesthesia reduce risk of DVT in Thai patients who undergo elective total hip replacement?
� Objective
� To determine the effect of spinal anesthesia to the occurrence of DVT in patients who undergo elective total hip replacement.

14/08/57
9
Literature review
� Literature search
� Source
� Primary: Medline, CINAHL, Ovid, Springer, Science direct
� Secondary: Cochrane database, Uptodate, DARE, ACP journal club, Tripdatabase, e-medicine
� Critical appraisal
Group discussion
Gr 1: New (incident) case or prevalence case
Gr 2: Case - definition, inclusion & exclusion criteria
Gr 3: Control – definition, inclusion & exclusion criteria
Gr 4: Matching – yes/no and why?

14/08/57
10
Design the study
� Population and sample
� Target population/reference population
� Study population
Target population
Accessible population
Study population
Thailand
Bangkok
Ramathibodi Hospital
Sampling bias…….
Selection of cases
� Definition
� Diseases, ICD-10
� Example: osteoporotic hip fracture definition
� Thai adults, age ≥≥≥≥ 51 years old whom are admitted in orthopedic wards with the first episode of osteoporotic hip fracture, ie. fracture of femoral neck, intertrochanter, subtrochanter sustained from low-velocity accident.
� (ICD-10, S72.0-72.9)

14/08/57
11
Selection of cases
� Probability samples (Random selection)
� Simple random sampling
� Systematic sampling
� Stratified random sampling
� Cluster sampling
� Non probability samples
� Convenience sampling
� Quota sampling
� Proposive sampling
� Snowball sampling (chain referral)
Sampling techniques
Selection of cases
� Whole population
� Hospital
� Incident cases
� Avoid prevalent cases (distort exposure)
� Example:
New case of spinal stenosisFloor activity
Chronic spinal stenosisFloor activity X
5 years

14/08/57
12
Selection of controls
� Definition: no outcome (case definition)
� Example:
� Thai adults who are neighborhoods ofcases aged 51 years and were not directrelatives of cases. No fracture offorearm, spine, and hip.
Selection of controls
� Sampling
� Site: the same as cases
� Hospital or community
� Has an opportunity to expose to the exposure
� Can be cases in the future
� Example:
� Controls of CACx: male?, child?

14/08/57
13
Population vs Hospitalbased case-control study
� Population based
� Can define source of population
� Cases and controls are from the same source
� Exposure in the controls represent real situations
� Hospital based
� Convenience
� Good cooperation
� Baseline characteristics are similar to cases
� Convenience for searching available exposure data
Examples
A case-control study
� Risk factors for Hip fracture
� Drugs vs. road traffic accident

14/08/57
14
Risk factors for hip fracture
� Frequency matching case-control study; 1:1 of cases :controls. Matched by sex and age + 5 years (not less than 51years old).
� Hospital controls: same hospital
� Community controls: neighborhoods� Search for address registry and national ID
� Pick up people who was in required age and lived within 1 km from case’s address
Risk factors for hip fracture
Total recent activity scores
Cases vs Hospital controls
Cases vs Community controls
OR (95%CI) P-value OR (95%CI) P-value
Inactive* 0.80
(0.51-1.25)
0.341 0.32
(0.20-0.50)
<0.0001
Active 0.53
(0.32-0.87)
0.012 0.20
(0.12-0.34)
<0.0001

14/08/57
15
DRUG vs. ROAD TRAFFIC INJURYDRUG vs. ROAD TRAFFIC INJURY
• Case verification by ER nurses• Informed consent
3. Alcohol breath testBlood for alcohol levelUrine collection
5. Case admissioninterview by ward nurseswithin 72 hours
4. Notification To ward & Research center
6. Specimen & questionnairepickup by Research center (Rama)
Mobile unit
1. Verify site from case RTI area
2. Search gas stations
3. Contact gas stations
4. Data collection
Controls

14/08/57
16
Selection of controls
Hospital-based?
� Recommendation� Unspecified disease (reflect real
exposure)
� New patients
� Low number of underlying diseases
� Avoid disease that correlated with the interesting exposure
� Example: Patients, aged 51 years, who are newly admitted (not 1st admission) in other wards in the same hospital and were not severely ill.

14/08/57
17
Matched??
� Advantages� More reliable for a
comparison between case and controls
� Need small samples
� More specific controls
� Discard confounding factors which were matched
� Disadvantages� Time and budget consuming
� Hard to find a specific control– discard matched case
� Unable to find a relationship between matched variables and outcome
� Residual difference if match for continuous or ordinal data
� Overmatching: cannot find the difference between cases and controls
Matched
� 1:1
� 1:2 – 1:4
� Decreased sample size of cases
Alpha Power Po OR Match N of cases
0.05 0.8 0.03 3 2
4
216
116

14/08/57
18
Frequency matching
� Match 2-3 variables
� Example
� Controls were matched to the cases according to sex and age + 5 years. And they were admitted to the same hospital within 90 days before or after the admission date of the cases.
Nested case-control study
Cohort studyDisease free + collect baseline characteristics
Follow-up
Diseases Disease free
Review previously collected dataObtaining additional exposures

14/08/57
19
Group discussion
Gr 1: What is the primary exposure, why?
Gr 2: Study factors and measurements
Gr 3: Data collection
Gr 4: Sample size calculation – what do you need to prepare?
Measurement of exposures
� Define exposures
� Try to retrieve hard data
� Measurement methods
� Interview
� Questionnaire
� Medical records
� Others: data registry, VDO, x-ray, etc.

14/08/57
20
Measurement of exposures
� Measurement
� Validity = accuracy
� Recall bias
� Incomplete data
� Precision
Precision
Methods
� Data collection
� Methods: interview (questionnaire), physical examination, laboratory test
� Sources: medical records, x-ray, patients

14/08/57
21
Sample size
� Formula
� Power and sample size program
� PS
� EpiInfo
� Internet access
Sample size
� Think about outcome first
� Categorical data eg. death: proportion
� 1 or 2 group?
� 2 proportions
� Paired/unpaired
� How clinical difference it is?
� 2 groups: How clinical difference they are?

14/08/57
22
Sample size
� Formula
� 2 proportions
� N = [2(Z(alpha)+ Z(beta))2P(1-P)]
(P1-P2)2
Note: P = (P1+P2)/2
Sample size
� Determine
� Alpha error
� Usually 0.05 or 0.1
� Beta error (1-power of study)
� Usually 0.2 or 0.1

14/08/57
23
Sample size calculation
Alphaerror
Betaerror
Physical activity among
controls
Odds ratio of physical
activity
N
0.05 0.2 0.8 0.62 401
0.05 0.2 0.8 0.6 349
0.05 0.2 0.8 0.55 253

14/08/57
24
Group discussion
Gr 1: analysis plan for primary exposureGr 2: analysis plan for study factorsGr 3: What is odds ratio?Gr 4: How can you apply the results?
Analysis
� Type of data
� Nominal scale: yes/no, male/female
� Ordinal scale (non equal distance between unit): mild/moderate/severe
� Interval scale (equal distance between unit): visual analog scale, range of motion
� Normal/non normal distribution

14/08/57
25
Statistical analysis
Parametric
Study group Continuous data Categorical data
1 group Mean + Standard deviation Proportion, percentage
2 group
- Independent Unpaired T-test Chi-square
- Matched pair, pre-/post) Paired T-test McNemar’s Chi-square
> 2 groups Analysis of variance Chi-square
Statistical analysis
nonparametric
Study group Continuous data Categorical data
1 group Sign test Proportion, percentage
2 Groups
- Independent Mann-Whitney U test Fisher’s exact
- Matched pair or pre-, post- Wilcoxon sign-rank test McNemar’s Chi-square
> 2 กลุ่ม Kruskall-Wallis Fisher’s exact

14/08/57
26
Case control study
Exposure Disease No disease
Total No. of cases
Poor work
Good work
Total
+ a b a+b > 10 80 10 90
- c d c+d < 10 20 90 110
a+c b+d n 100 100 200
Term General Example Definition
Odds ratio ad/bc 80x90/20x10
= 36
The odds of exposure in case/the odds of exposure in control (odds of having disease comparing exposed and unexposed)
[a/(a+b)] / [b/(a+b)] = a/b = ad[c/(c+d)] / [d/(c+d)] c/d bc
Stata . cci 80 20 10 90
Proportion
| Exposed Unexposed | Total Exposed
-----------------+------------------------+-------- ----------------
Cases | 80 20 | 100 0 .8000
Controls | 10 90 | 100 0.1000
-----------------+------------------------+-------- ----------------
Total | 90 110 | 200 0 .4500
| |
| Point estimate | [95% Conf. Interval]
|------------------------+------------------------
Odds ratio | 36 | 14.97669 89.7686 (exact)
Attr. frac. ex. | .9722222 | .9332 296 .9888602 (exact)
Attr. frac. pop | .7777778 |
+-------------------------------------------------
chi2(1) = 98.99 Pr>chi2 = 0.0000

14/08/57
27
McNemar test
Cases Controls Total
meditat+ meditat-
meditat+ 200 (a) 100 (b) 300
meditat- 150 (c) 450 (d) 600
Concordance pairs
χ2 = Σ (|O-E|-1/2)2/E
••Meditation vs. Degenerative spine Meditation vs. Degenerative spine
. . mcci mcci 200 100 150 450200 100 150 450
| Controls || Controls |
Cases | Exposed Unexposed | Tot alCases | Exposed Unexposed | Tot al
----------------------------------++------------------------------------------------++---------- ----------
Exposed | Exposed | 200 100 200 100 | | 300300
Unexposed | Unexposed | 150 450 150 450 | | 600600
----------------------------------++------------------------------------------------++---------- ----------
Total | Total | 350 550 350 550 | | 900900
McNemar's chiMcNemar's chi22((11) = ) = 1010..00 00 Prob > chiProb > chi2 2 = = 00..00160016
Exact McNemar significance probability = Exact McNemar significance probability = 00.. 00190019
Proportion with factorProportion with factor
Cases .Cases .33333333333333
Controls .Controls .3888889 3888889 [[9595% Conf. Interval]% Conf. Interval]
------------------ ----------------------------------------
difference difference --..0555556 0555556 --..0909079 0909079 --..02020320202032
ratio .ratio .8571429 8571429 ..7789666 7789666 ..94316489431648
rel. diff. rel. diff. --..0909091 0909091 --..1497595 1497595 --..03205870320587
odds ratio .odds ratio .66666676666667 ..512362 512362 ..86434298643429 (exact)(exact)

14/08/57
28
Logistic regression
� Categorical outcome� Extraneous variables associated with outcome
� Multiple� Continous/categorical data
� For case-control study� Matched: conditional logistic regression� Unmatched: unconditional logistic regression
� Output: Odds ratio, adjusted odds ratio
Logistic regression
� Probability of having disease� P = 1
1 + e (a+b1x1+…..+bixj)
� 95% confidence interval: � Significant value: should no include 1� Precision: narrow� Ex: Odds ratio = 5.3 (95% CI: 3.4,8.5)� Ex: Odds ratio = 5.3 (95% CI: 1.2, 16.9)

14/08/57
29
ปัจจยั SE Adjusted OR (95% CI) P-value
ผลแอลกอฮอลท์างลมหายใจ(mg/dl)
> 50 35.62 68.89 ( 25.01-189.78) <0.001
< 50 1
ประเภทของยา
ยาที�มฤีทธิ �ต่อจติประสาท 0.88 3.05( 1.73-5.37) <0.001
ยาอื�นๆ 1
Ethical considerations
� Scientifically accepted
� First do no harm
� Risk/Benificence
� Institutional Board Review
� Informed consent� Contact persons, background, what
patient will be done/have to do, risk/benefit, patient’s rights.

14/08/57
30
Results
� Results
� Dummy table
� Demographic data
� Main results
� Univariate analysis
� Multivariate analysis
Results (tentative)
� Dummy tables
Demographic data Case N = 81)
Control (N = 81)
P-value
Age, years (mean + SD)Male (%)Income, Baht (%)- 0 – 10,000- > 10,000 – 19,999- > 20,000 – 29,999- > 30,000Educational level (%)- No- Primary school- High school- Bachelor- Higher
*
Table 1 Demographic data

14/08/57
31
Results (tentative)
� Dummy tables
Factors Case (N = 81)
Control (N = 81)
P-value
BMI (mean + SD)Anitcoagulant use Underlying disease (%)Type of anesthesia (%)- Spinal - General
*
Table 2 Factors related to DVT in THR patients
Results (tentative)
� Dummy tables
Factors Odds ratio 95% confidence interval
P-value
AgeBMI (mean + SD)Anticoagulant useUnderlying disease (%)Type of anesthesia (%)- Spinal - General
*
Table 3 Univariate analysis of factors related to DVT in THR patients

14/08/57
32
Results (tentative)
� Dummy tables
Factors Adjusted odds ratio
95% confidence interval
P-value
AgeAnticoagulant useType of anesthesia (%)- Spinal - General
*
Table 4 Multivariate analysis of factors related to DVT in THR patients
Budget
� Researchers
� Statisticians
� Data collection/entry
� Materials: printing expenses, etc.
� Investigations

14/08/57
33
Time line
� Proposal writing
� Data collection
� Data entry
� Data analysis
� Results
� Writing a paper
Month1 2 3 4 5
Applicability
� Expected usefulness of this study

14/08/57
34
QUESTIONS
‘ Epidemiology of hip fracture in Thais ’

14/08/57
35
Introduction
� Hip fracture
� Neck
� Intertrochanter
� Subtrochanter
� Most common in elderly people
� Incidence:
White > Asians > Black
Neck
Intertrochanter
Subtrochanter
Introduction
� Recently increased incidence of hip fracture
� Cause of morbidity(50-70%) and mortality(20%) among elderly
� Contribute significantly to health care costs0
200
400
600
800
1000
1960-
1980
1983-
1985
HongKongNorway
Incidence of hip fracture (per 100000)

14/08/57
36
Rationale
� Big problems of hip fracture all over the world
� No support data of hip fracture in Thailand
� Incidence
� Risks & prevention
� Differences in incidence and risks among countries, race, and types of fracture.
Objectives
� To determine factors related to hip fracture in Thai adults, age 51 years or over, separately by sex.
� To compare factors related to intertrochanteric fracture and femoral neck fracture in Thai adults, age 51 years or over, separately by sex.

14/08/57
37
Literature reviewLiterature reviewFactors related to hip fractureFactors related to hip fracture
Conceptual frameworkConceptual framework
Hip fracture
High BMDEstrogen
Calcium Physical Activity
FallingSmoking
Cancer renal diseasemal-absorption
Drugs-sedatives-antihistamineAlcoholPoor mental status
CVAParkinsonism
Race
Steroid, traditional med.
IncreaseDecrease
BMI
Diuretics
MethodologyFactors related to hip fracture
� Setting: hospitals in Bkk and its vicinity
� Matched case:control = 1:1 by age + 5 y and sex
� Population: Thai adults age > 51 y� Cases: ICD 9 (820.0-820.9) by orthopaedists
� Hospital controls: patients in other wards admitted w/i 90 days from case admission date, w/o fx
� Community controls: neighborhood of cases w/o fx

14/08/57
38
MethodologyFactors related to hip fracture
� Main exposure variables:
� Physical activities, calcium intake
� Sample size: 401 (alpha error 0.05, beta error 0.2, OR of
physical activity 0.62, physical activity among controls 0.8)
� Data collection: interview with questionnaire
� Ethical consideration: verbal informed consent
� Statistical analysis: logistic regression (STATA 7.0 program)
ResultsFactors related to hip fracture (women)
Baseline characteristics
Case (%)
N = 231
Hospital controls (%)
N = 226
Community controls (%)
N = 224
Total (%)
N = 681
Age (years)
(mean+SD)
Race
Thai
Chinese
BMI (kg/m2)
(mean+SD)
Low
Medium
High
Mental status
Normal
Poor
75.3+9.1
141 (61.0)
90 (39.0)
22.2+4.0
83 (35.9)
62 (26.8)
86 (37.2)
203 (87.9)
28 (12.1)
74.4+8.5
187 (82.7)
39 (17.3)
23.5+4.1
58 (25.7)
80 (35.4)
88 (38.9)
207 (91.6)
19 (8.4)
73.9+8.4
176 (78.6)
48 (21.4)
23.5+4.6
76 (33.3)
75 (33.6)
73 (33.5)
220 (98.2)
4 (1.8)
74.6+8.7
504 (74.0)
177 (26.0)
23.1+4.3
217 (31.9)
217 (31.9)
247 (36.3)
630 (92.5)
51 (7.5)

14/08/57
39
ResultsFactors related to hip fracture (women)
Factor Case vs Hosp cont Case vs Com cont
OR (95%CI) P-value OR (95%CI) P-value
Race
Thai*
Chinese
Recent activity
Inactive*
Active
Very active
Past activity
Inactive*
Active
Very active
3.06 (1.95-4.81)
0.74 (0.46-1.20)
0.57 (0.33-0.99)
0.95 (0.60-1.49)
1.01 (0.61-1.68)
<0.0001
0.231
0.047
0.824
0.949
2.33 (1.36-3.99)
0.31 (0.17-0.57)
0.22 (0.11-0.44)
0.78 (0.46-1.33)
0.18 (0.09-0.37)
0.002
0.372
<0.0001
<0.0001
<0.0001
Multivariate analysis: adjusted for age
ResultsFactors related to hip fracture (women)
Multivariate analysis: adjusted for age (continue)Factor Case vs Hosp cont Case vs Com cont
OR (95%CI) P-value OR (95%CI) P-value
BMI
Low*
Medium
High
Calcium
Low*
Medium
High
CVA
Diuretics
Antihistamine
Traditional med.
0.52 (0.32-0.85)
0.70 (0.44-1.11)
1.08 (0.37-1.74)
1.11 (0.68-1.81)
-
-
-
-
0.010
0.131
0.728
0.653
-
-
-
-
1.12 (0.63-1.98)
0.90 (0.50-1.62)
0.36 (0.19-0.68)
0.66 (0.37-1.18)
8.98 (2.27-35.45)
3.40 (1.06-10.89)
13.45 (1.37-131.27)
6.06 (2.02-18.22)
0.690
0.740
0.002
0.167
0.002
0.039
0.025
0.001

14/08/57
40
ResultsResultsFactors related to hip fractureFactors related to hip fracture (women)(women)
Multivariate final model Multivariate final model
Hip fracture
High BMDEstrogen
Calcium** Physical Activityrecent* **past**
FallingNo of liveborn**
Diuretics **
Drugs-sedatives**-antihistamine**Poor mental status**
CVA**
Race* **
Traditional med.**
* Hosp. control** Com. control
Increase Decrease
BMI*
ResultsFactors related to hip fracture (men)
Baseline characteristics
Case (%)
N = 187
Hospital controls (%)
N = 186
Community controls (%)
N = 177
Total (%)
N = 550
Age (years)
(mean+SD)
Race
Thai
Chinese
BMI (kg/m2)
(mean+SD)
Low
Medium
High
Mental status
Normal
Poor
71.2+9.8
115 (61.5)
72 (38.5)
21.9+3.4
50 (26.7)
53 (28.3)
84 (44.9)
169 (90.4)
18 (9.6)
70.4+9.6
142 (76.3)
44 (23.7)
21.6+4.1
66 (35.5)
52 (28.0)
68 (36.6)
172 (92.5)
14 (7.5)
69.7+8.6
127 (71.7)
50 (28.3)
22.4+3.8
52 (29.4)
48 (27.1)
77 (43.5)
160 (96.0)
7 (4.0)
70.4+9.4
384 (69.8)
166 (30.2)
22.0+3.8
168 (30.6)
153 (27.8)
229 (41.6)
511 (92.9)
39 (7.1)
14/08/57
41
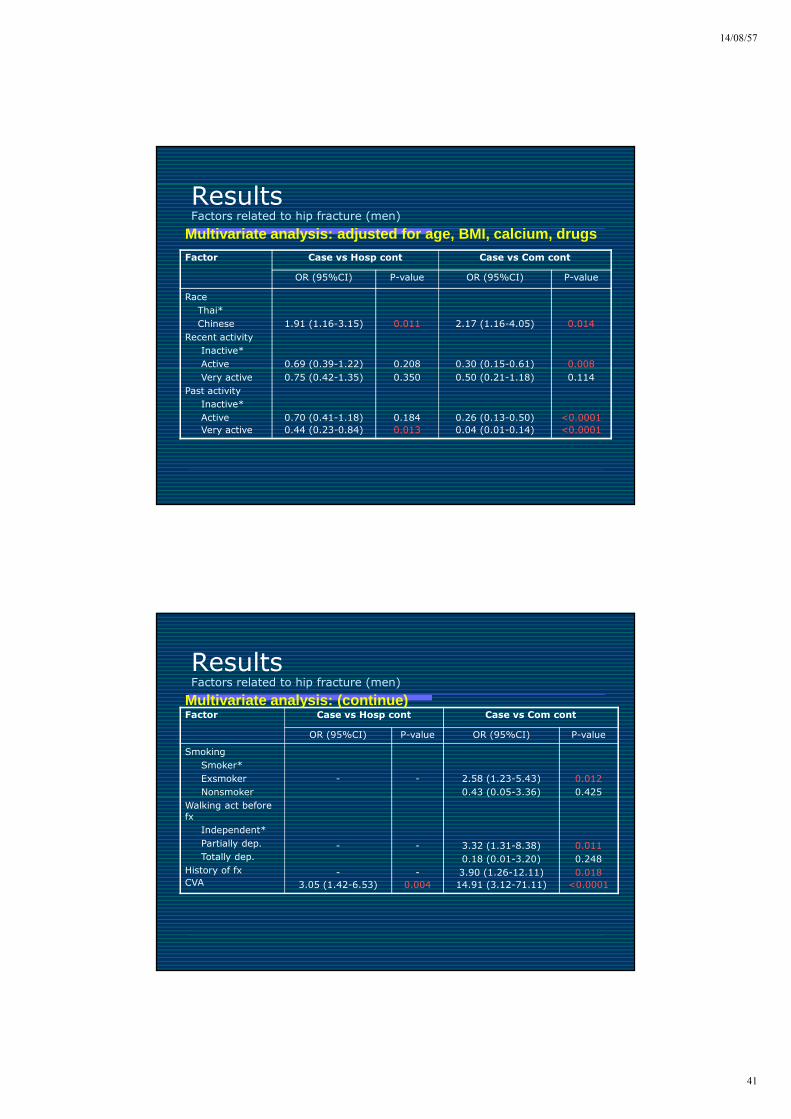
ResultsFactors related to hip fracture (men)
Factor Case vs Hosp cont Case vs Com cont
OR (95%CI) P-value OR (95%CI) P-value
Race
Thai*
Chinese
Recent activity
Inactive*
Active
Very active
Past activity
Inactive*
Active
Very active
1.91 (1.16-3.15)
0.69 (0.39-1.22)
0.75 (0.42-1.35)
0.70 (0.41-1.18)
0.44 (0.23-0.84)
0.011
0.208
0.350
0.184
0.013
2.17 (1.16-4.05)
0.30 (0.15-0.61)
0.50 (0.21-1.18)
0.26 (0.13-0.50)
0.04 (0.01-0.14)
0.014
0.008
0.114
<0.0001
<0.0001
Multivariate analysis: adjusted for age, BMI, calcium, drugs
ResultsFactors related to hip fracture (men)
Factor Case vs Hosp cont Case vs Com cont
OR (95%CI) P-value OR (95%CI) P-value
Smoking
Smoker*
Exsmoker
Nonsmoker
Walking act before fx
Independent*
Partially dep.
Totally dep.
History of fx
CVA
-
-
-
3.05 (1.42-6.53)
-
-
-
0.004
2.58 (1.23-5.43)
0.43 (0.05-3.36)
3.32 (1.31-8.38)
0.18 (0.01-3.20)
3.90 (1.26-12.11)
14.91 (3.12-71.11)
0.012
0.425
0.011
0.248
0.018
<0.0001
Multivariate analysis: (continue)

14/08/57
42
ResultsResultsFactors related to hip fractureFactors related to hip fracture (men)(men)
Conceptual frameworkConceptual framework
Hip fracture
High BMDEstrogen
Calcium Physical Activityrecent**past* **
FallingSmoking**
CVA* **
Race* *** Hosp control** Com. control
IncreaseDecrease
Walking activity before fx**
DiscussionFactors related to hip fracture (women)
Factors consistent associated with hip fracture according to
other literature
OR (95%CI)
References
OR (95%CI)
BMI: 0.52 (0.32-0.85)*
Physical activity
Recent:0.57(0.33-0.99)*, 0.22(0.11-0.44)**
Past: 0.18 (0.09-0.37)**
CVA: 8.98 (2.27-35.45)**
Mayer HE: 0.68 (0.63-0.72)
Michaelsson: 0.39 (0.24-0.62)
Jaglal SB
0.54 (0.41-0.90)
0.66 (0.45-0.96)
Grisso JA: 3.00 (1.30-7.00)
* Hospital control* Hospital control
** Community control** Community control

14/08/57
43
DiscussionFactors related to hip fracture (women)
Factors converselyassociated with hip fracture according to other literature
OR (95%CI)
References
OR (95%CI)
Diuretics: 2.10 (0.62-7.14)** Cummings: 0.8 (0.6-1.2)
* Hospital control* Hospital control
** Community control** Community control
DiscussionFactors related to hip fracture (women)
New factors associated with hip fracture
Reference
OR (95%CI)
Chinese race: 3.06 (1.95-4.81)*
2.33 (1.36-3.99)**
-
* Hospital control* Hospital control
** Community control** Community control

14/08/57
44
DiscussionFactors related to hip fracture (men)
Factors consistent associated with hip fracture according to other
literature
OR (95%CI)
References
OR (95%CI)
Physical activity
Recent: 0.30 (0.15-0.61)*
Past: 0.44 (0.23-0.84)8, 0.04 (0.01-0.14)**
CVA: 3.05 (1.42-6.53)*, 14.91 (3.12-71.11)**
Cummings (men & women)
0.50 (0.30-1.00)
0.50 (0.20-1.20)
Grisso: 3.2 (1.9-5.3)
* Hospital control* Hospital control
** Community control** Community control
DiscussionFactors related to hip fracture (men)
Factors converselyassociated with hip
fracture according to other literature
OR (95%CI)
References
OR (95%CI)
Smoking
Exsmoker: 1.33 (1.04-1.70)**
Eversmoker: 0.68 (0.39-1.71)**
Cummings
Exsmoker: 1.4 (0.6-2.5)
Eversmoker: 1.6 (1.0-2.6)
* Hospital control* Hospital control
** Community control** Community control

14/08/57
45
DiscussionFactors related to hip fracture (men)
New factors associated with hip fracture
Reference
OR (95%CI)
Chinese race: 1.91 (1.16-3.15)*
2.32 (1.22-4.40)**
-
* Hospital control* Hospital control
** Community control** Community control
DiscussionFactors related to hip fracture
� Limitation of the study� Selection bias: hospital controls
� Recall bias: calcium, past physical activity
� Measurement bias: calcium, BMI, physical activity
� Misclassification bias: underlying diseases, drugs
� Ascertainment bias: underlying diseases, drugs

14/08/57
46
Conclusion
� The important factors related to hip fracture are physical activity, Chinese race, and CVA.
� Physical activity and CVA also related to both IT & FN. Chinese race and sedative drugs are associated with FN whereas impaired walking ability is associated with IT.
Recommendation
� ICD register for evaluation and monitoring hip fracture incidence in Thailand.
� It is time to prevent hip fracture by exercise, prevent and give good care for CVA
� Verify calcium as a protective factor by prospective study with log diary.(CEA, CBA)
� Genetic study for verify risk (Chinese race)
� Cost-effectiveness analysis
� Cost-utility analysis

14/08/57
47
MMEDICINALEDICINAL DDRUGRUG UUSESE ANDAND RTI:RTI:A Case-Control Study.
Patarawan Woratanarat, MD, PhD.Patarawan Woratanarat, MD, PhD.
Atiporn Ingsathit, MD, PhD.Atiporn Ingsathit, MD, PhD.
Paibul Suriyawongpaisal, MD, Paibul Suriyawongpaisal, MD, MMSc.MMSc.
Faculty of Medicine Ramathibodi HospitalFaculty of Medicine Ramathibodi Hospital
Introduction
Vehicle factor
Human factors:Driving behaviorPhysical status AlcoholDrugsDrugs
Road environmentClimate
Road traffic injury (RTI)

14/08/57
48
Introduction
� Medicinal drugs compared with blood alcohol level
� Benzodiazepine: 50-79 mg%
� Benzodiazepine + Alcohol: risk 112 times
� Antidepressant/Barbiturates: 80-100 mg%
� Diphenhydramine: 50-100 mg%
Odds ratio between medicinal drugs & RTI
3.5
2.1
0.4
4.4
2
0.4
3.3
1.2 1.50.7
5.1
3
0.30.9
2.4
32.4
1.6
15.515.5
17.6
0.8
0
10
20
30
40
Amp Coc Can BZD Opi Alc
Not fault
Road block(Movig)Road block(Mathijssen)Non-severe

14/08/57
49
Odds ratio between medicinal drugs & RTI
3.52.1 0.44.4 2 0.4 3.31.21.50.7
5.1 3 0.3 0.92.4
32.4
1.6
15.515.517.6
0.86.1
24
0.2
112.2
179
0.60
50
100
150
200
Amp Coc Can BZD Opi Alc Multi Alc+drugs
Not fault
Road block(Movig)Road block(Mathijssen)Non-severe
Introduction
� Other factors as risks of RTI� Male
� Young age
� Alcohol
� Driving behavior
� Physical status
� Road environment
� Climate

14/08/57
50
Objectives
� To assess the relationship between medicinal drug use and road traffic accident
Materials & Methods
� Case-control study
� All drivers (general and private)
� March 1, 2006 – November 30, 2006

14/08/57
51
Materials & Methods
� Case
� All drivers with RTI admitted to the hospital within 24 hours after a crash
� Exclude: dead cases, unable to give consent/specimens/verbal responses
Materials & Methods
� Control
� All drivers stopped by gas stations without RTI requiring hospitalization within 6 months
� Exclude: unable to give consent/specimens/verbal responses

14/08/57
52
Materials & Methods
� Case: 3 Hospitals in Bangkok
Vajira
Lerdsin
Nopparat
Materials & Methods
� Control: gas station matched with cases (1:4) by
� Gender
� Place of accident (within 1 km)
� Time of accident (day/night)
� Type of vehicles

14/08/57
53
Materials & Methods
� Psychoactive/illicit drugs
� Psychoactive/medicinal drugs:
� Antihistamine
� Hypnotics
� Antidepressants
� Anti-convulsants
� Cough-suppressants
� Muscle relaxants
Predictors :•Demographic profile•Vehicles •Behavior risk•Alcohol
Materials & Methods
� Measurement of study factors
� Structured questionnaire
� Direct observations(helmet, belt, colors)
� Alcohol Breathalyzer(Lion alcoholmeter 400 series)
� Blood test for alcohol: 5 cc
� Urine test (GC/MS) for various drugs: 50 cc.

14/08/57
54
Materials & Methods
� Outcomes
� Severed RTI resulting in hospital admission
� Types of injuries, disability/death (ICD-10)
Materials & Methods
� Data collection
� Questionnaires
� Alcohol breath test
� Blood alcohol level (for case only)
� Urine drug test

14/08/57
55
1. Case verification by ER nurses2. Informed consent
3. Alcohol breath testBlood for alcohol levelUrine sample collection
5. Case admissioninterview by ward nurseswithin 72 hours
4. Notification To ward & Research center
6. Specimen & questionnairepickup by Research center (Rama)
CaseCase
Mobile unit
1. Verify site from case RTI area
2. Search gas stations
3. Contact gas stations
4. Data collection
Controls

14/08/57
56
Materials & Methods
� Data monitoring: site visit
� Data quality assurance: call subjects
� Data editing
� Double data entry: EpiInfo
Materials & Methods
� Data analysis
� Mean + SD, percentage
� Conditional logistic regression
� Univariate analysis
� Multivariate analysis (backward stepwise)
� PAR calculation (using data from survey study)
� Stata 9.0 (StataCorp, Texas)

14/08/57
57
Sample size
P0 OR Case:Control ratio
Subject (N)
0.02
(Probability of hypnotics)
3 4 Case (250)
Control (1000)
0.02
(Probability of hypnotics)
2.5 4 Case (400)
Control (1600)
Results
200 CASES850 CONTROLS

14/08/57
58
Diagram 1 Distribution of injury (cases)
41
106 5
59
21
5
0
10
20
30
40
50
60
Brain/head Chest Abdomen Spine Limbs Face Skin
Injury (%)
Table Table Table Table 1 1 1 1 Characteristics of cases and controlsCharacteristics of cases and controlsCharacteristics of cases and controlsCharacteristics of cases and controlsCharacteristics Cases
N = 200 (%)Controls
N = 850 (%)P-value
Age (years), mean (SD) 30.18(11.8) 35.45(10.6) <0.001*
Gender MaleFemale
189(94.5)11(5.5)
803(94.5)47(5.5)
-
Type of vehicles
Car/van/truck/bus 22(11.0) 91(10.7) 0.803
Motorcycle 178(89.0) 759(89.3)
Type of driving
General 161(80.5) 588(69.2) < 0.001*
Commercial 39 (19.5) 262 (30.8)
Experience of driving (years)
< 4 99(49.8) 176(20.7) < 0.001*
5-10 62(31.16) 353(41.5) 0.149
11-15 10(5.0) 96(11.3) 0.553
> 15 28(14.1) 225(26.5)

14/08/57
59
Table Table Table Table 1 1 1 1 Characteristics of cases and controls (contCharacteristics of cases and controls (contCharacteristics of cases and controls (contCharacteristics of cases and controls (cont’ ))))
Characteristics Cases N = 200 (%)
ControlsN = 850
(%)
P-value
Timing of driving
Night time/dawn/dust 52(26.0) 66(7.8) <0.001*
Daytime 148(74.0) 784(92.2)
Duration of driving (minutes)
> 90 66(33.9) 189(22.7) <0.001*
41-90 49(25.1) 199(23.9) 0.030*
21-40 43(22.1) 223(26.7) 0.465
<20 37(19.0) 223(26.7)
Protective gear + head light
No 76(38.0) 184(21.7) <0.001*
Yes 124(62.0) 666(78.4)
Table 2 Single variable conditional logistic regression of one-month recall of drug and substances use
Drugs Cases N = 200
(%)
ControlsN = 850
(%)
OR (95% Cl)
P-value
Antihistamine/nasal decongestant
36 (18.0) 148 (17.4) 1.03 (0 .69, 1.55) 0.869
Cough suppressant 8 (4.0) 23 (2.7) 1.61 (0 .69, 3.76) 0.275
Muscle relaxant 12 (6.0) 55 (6.5) 0 .92 (0.48, 1.76) 0.803
Anti-anxiety 5 (2.5) 5 (0.6) 4.53 (1.20, 17.09)
0.026*
Tea/coffee 97 (48.5) 537 (63.2) 0.53 (0.39, 0.73) <0.001*
Energy drinks 94 (47.0) 418 (49.2) 0.90 (0.65,1.23) 0.502
Alcohol 77 (38.5) 236 (27.8) 1.65 (1.18, 2.30) 0.003*
Any illicit psychoactive drug
11 (5.5) 38 (4.5) 1.43 (0.69, 2.95) 0.339

14/08/57
60
Table 3 Single variable conditional logistic regression of drugs and substances
Drugs Casen(%)
Controln(%)
OR(95% Cl)
P-value
Antihistamine 4 (2.0) 35 (4.1) 0.48 (0.17, 1.37) 0.169
Cough suppressants 2 (1.0) 5 (0.6) 1.6 (0.31, 8.25) 0.574
Antidepressants 1 (0.5) 1 (0.1) 4 (0.25, 63.95) 0.327
Cannabis 4 (2.0) 20 (2.4) 0.78 (0.25, 2.40) 0.667
Amphetamine 32 (16.0) 22 (2.6) 8.88 (4.54, 17.39) <0.001
Alcohol breath test (mg%)
< 50 116 (58.0) 910 (93.5) 20.80 (9.78, 44.25) <0.001*
>50 84 (42.0) 63 (6.5) 1
Table 3 Single variable conditional logistic regression of drugs and substances (cont’)
Drugs Casen(%)
Controln(%)
OR(95% Cl)
P-value
Type of drugs
Illicit psychoactive drugs 38 (19.0) 65 (7.7) 3.21 (2.00, 5.15) <0.001*
Licit psychoactive drugs 16 (8.0) 58 (6.8) 1.31 (0.73, 2.34) 0.364
Non-psychoactive drugs 146 (73.0) 726 (85.5) 1
Number of drug use
> 1 6 (3.00) 27 (3.18) 2.59 (1.73, 3.87) <0.001*
1 48 (24.00) 96 (11.31) 1.04 (0.43, 2.55) 0.929
0 146 (73.00) 726 (85.51)
1

14/08/57
61
Table 4 Multivariate analysis for factors related to RTI
Factors Adjusted OR (95% CI) p-value
Illicit psychoactive drugs vs. no drug 4.39 (2.13, 9.05) <0.001
Licit psychoactive drugs vs. no drug 4.71 (2.10, 10.53) <0.001
Alcohol breath test (> 50 mg% vs. < 50 mg%)
36.01 (13.54, 95.78) <0.001
Tea/coffee 0.49 (0.30, 0.82) 0.006
Experience of driving (years)
< 4 4.36 (2.18, 8.71) <0.001
5-10 1.41 (0.70, 2.84) 0.339
11-15 0.55 (0.16, 1.91) 0.348
> 15 1
Night time/dawn/dust vs. daytime driving 3.06 (1.56, 6.00) 0.001
Duration of driving (minutes)
> 90 5.41 (2.56, 11.43) <0.001
41-90 3.46 (1.63, 7.35) 0.001
21-40 1.19 (0.54, 2.63) 0.661
<20 1
Table 5 PAR for RTIFactor Adjusted OR
(95% CI)P-value Weight-
estimated prevalence
(%)
PAR
Type of drugs
Psychoactive drugs 4.52 (2.53,8.09) <0.001* 8.85 23.75
No drugs 1
Alcohol breath test (mg/dl)
> 50 35.81 (13.50, 95.00)
<0.001* 2.36 45.10
< 50 1

14/08/57
62
Discussion
� Psychoactive drugs
� Antihistamine
� Amphetamine
� Low prevalence of BZD
� Alcohol
� Tea/coffee (Phillip P. Ann Intern Med
2006;144:785-91.)
Discussion
3.52.1 0.44.4 2 0.4 3.31.21.50.7
5.1 3 0.3 0.92.4
32.4
1.6
15.515.517.6
0.8
36
6.1
24
0.24
112.2
179
0.60
50
100
150
200
Amp Coc Can BZD Opi Alc Multi Alc+drugs
Not fault
Road block(Movig)Road block(Mathijssen)Non-severe
This study

14/08/57
63
Discussion
� Limitation
� Population
� Respondents vs. non-respondents
� Case severity
� Big city
� Measurement
� Speed
� Time between accident and specimen collection
� Urine GC/MS: cannot detect muscle relaxant
� Contamination of therapeutic use of opioid
Discussion
� Suggestion
� Review prescription of psychoactive drug use
� Control illicit drugs and alcohol use
� Land transportation’ s drivers – training
� Driver/rider’s license

14/08/57
64
Conclusion
� Psychoactive drug use increased risk of RTI. It also contributed to RTI by 24%.
� It calls for legislative measures and/or publicity campaign to modify use of psychoactive drugs in addition to current measures for drink driving control.
Thank you for your attention
This study is funded by
�Road Safety Fund, Dept Land Transport
�Thai Health Promotion Foundation

14/08/57
65
THANK YOU