C.A.R.S. Project Design Report. - DIT Dublin Institute of ... · PDF fileResearch Synopsis ......
23
C.A.R.S. Project Design Report. PRODUCED BY: Browne, A. Kennedy, M. Dolan, N. Selman, C. STUDENT NO: C09365788-C09686908-D11125480-C08868352 DATE DUE: 20-April-2012 COURSE: Dt004/3 – Civil Engineering LECTURER: Valerie Fenton
Transcript of C.A.R.S. Project Design Report. - DIT Dublin Institute of ... · PDF fileResearch Synopsis ......
C.A.R.S. Project Design Report.
PRODUCED BY: Browne, A. Kennedy, M. Dolan, N. Selman, C.
STUDENT NO: C09365788-C09686908-D11125480-C08868352
DATE DUE: 20-April-2012
COURSE: Dt004/3 – Civil Engineering
LECTURER: Valerie Fenton

2
Table of Contents
Executive Summary ........................................................................................................... 3
Introduction ......................................................................................................................... 4 Purpose ........................................................................................................................................... 4 Overview of Information ........................................................................................................... 4 Research Synopsis ....................................................................................................................... 5 Background .................................................................................................................................... 5
Traffic Survey ....................................................................................................................... 7 Vehicular Traffic .......................................................................................................................... 7 Pedestrian Traffic ........................................................................................................................ 8
Future Mobility Plan ....................................................................................................... 10
Preliminary Design ......................................................................................................... 11 Need for the Proposed Scheme .............................................................................................11 Specific Objectives of the Proposed Project .....................................................................11
Collision History and Records ........................................................................................................ 12 Design Speed Calculations ............................................................................................................... 12 Options Considered ............................................................................................................................ 12 Constraints ............................................................................................................................................. 12 Geometric Features ............................................................................................................................ 12 Signs, Signalling, Furniture and Road Markings. .................................................................... 12 Drainage Requirements .................................................................................................................... 13 Junction treatment .............................................................................................................................. 13 Requirements of Non-drivers ........................................................................................................ 13 Relaxing and Departures .................................................................................................................. 13 Cost of Accidents ................................................................................................................................. 13
Design .................................................................................................................................. 14 Cost analysis ................................................................................................................................16
Culvert Tunnel ...................................................................................................................................... 16 Truss Bridge .......................................................................................................................................... 16
Conclusion .......................................................................................................................... 18
References .......................................................................................................................... 19
Appendix ............................................................................................................................. 20
Table of Figures Figure 1 - Traffic survey results..................................................................................... 7
Figure 2 - Pedestrian survey results ............................................................................... 8
Figure 4 - Pedestrian graph ............................................................................................ 9
Figure 3 - Traffic flow graph ......................................................................................... 9
Figure 5 - Present student numbers .............................................................................. 10
Figure 6 - Cost of accidents 2005-2009 ....................................................................... 13
Figure 7 - Cost of future accidents ............................................................................... 13
Figure 8 - Current junction layout ............................................................................... 14
Figure 9 - Proposed junction layout ............................................................................. 15
Figure 11 - Typical overpass design ............................................................................ 17
Figure 10 - 2.6 x 3.7m Underground culvert/Tunnel ................................................... 17

3
Executive Summary
As part of the Collage Awareness of Road Safety (CARS) Project the Civil
Engineering Group, have re-designed a junction with the main focus being on the
road safety regarding 17-24 year olds. Following extensive research into the Proposed
Grangegorman Development, the group identified pedestrians and cyclists as a main
priority. As stated in the Master Plan for the Grangegorman development, measures
will be put in place to ensure that pedestrian and cyclist traffic is of key importance.
The selected junction is adjacent to the proposed Broadstone Gate entrance, a main
pedestrian & cyclist access route. Plans to include car parking and a light rail tram
system are also nearby, resulting in high volumes of traffic movements.
In order to achieve a high standard of road safety the group examined a number of
options; these included a zebra crossing, a roundabout, alterations to on-street
furniture, diagonal crossing and on demand signalling. Following an assessment of all
the design possibilities, the group concluded, that there was two feasible design
solutions. The two solutions the group decided upon were, an underpass and an
overpass with preference being on pedestrian and cyclist safety.

4
Introduction
Purpose
For the ‘Cars Project’ as part of the Highways and Transportation II module, group
four have decided to assess the junction known as ‘Constitution Hill – Western Way’.
The junction was chosen, as it is adjacent to the proposed entrance to the ‘Dublin
Institute of Technologies’ (DIT) future campus at Grangegorman (according to the
‘Grangegorman Development Agency’).
It is the group’s intention to assess the junction from the point of view of future
students of DIT, as they will make up the majority of traffic using the junction. To
comply with the average student age bracket (17-24 years), the junction will be
redesigned from the point of view of pedestrians and cyclists.
Overview of Information
In order to redesign the junction for non-vehicular traffic the following was carried
out.
1. The junction was assessed, researched and selected
2. A peak hour traffic survey was preformed on the junction to assess the current
running capacities for both vehicular and non-vehicular traffic and the results
recorded.
3. Following the survey, some desk research was preformed to estimate the
number of people expected to use DIT’s new campus. From this the projected
future traffic on the junction was calculated.
4. 3 possible alterations to the junction were discussed and designed. A cost
benefit analysis was then preformed to identify which option was most
desirable.
5. Following the new design of the junction a report was produced and submitted
to the relevant persons.

5
Research Synopsis
In order to redesign the junction to make it safe for non-vehicular traffic substantial
research was required and is listed below.
Traffic Analysis Survey – The TAS gave the group important information regarding
the volumes of traffic using the junction, the pedestrian desire paths as well as
establishing times of peak flow and hazards.
Roadwork’s Unit Rate Database – This document, produced by the National Roads
Authority (NRA) allowed the group to compile a set of accurate costs relating to
highway related infrastructure in Ireland.
Grangegorman Development Plan – A study into the proposed plans in relation to
the proposed new DIT campus site. This document, produced by the Grangegorman
Development Agency, allowed the group to establish projected traffic routes and
desired paths.
Google – Using mapping databases such as ‘Google Maps’ & ‘Google Earth’ the
group was able to reproduce illustrations and elevated drawings of the junction.
Road Safety Authority – The RSA website provided the group with information about
recent collisions and incidents at the junction.
National Roads Authority – The Project Appraisal Guidelines document was helpful
as it gave information relating to the cost of accidents.
Background
In 1910 the governor of the house of Grangegorman decided to build a mental
institution for mentally ill patients. The Richmond asylum was opened in 1814 and
was designed by Francis Johnson. In 2006 the GGDA was set up in an attempt to
modernise and consolidate all of the DIT campuses and buildings, presently located in

6
a number of locations throughout Dublin City. The location for this new campus was
Grangegorman.
The campus will have a number of entrances; the major ones being on Constitution
Hill – Western Way, and other on the North Circular Road. These entrances are
expected to deal with the traffic associated with the 30,000 staff and students
occupying the Grangegorman Campus. (Grangegorman Development Plan 2012)
The focus of this report will be the Constitution Hill – Western Way junction, which
will see high volumes of traffic and pedestrians upon completion of the project.

7
Traffic Survey
A survey was taken on a representative day (mid-week, not school holiday) of
existing traffic flows between 7am and 10am to establish peak traffic flows and total
traffic flows in all directions.
Vehicular Traffic
Figure 1 - Traffic survey results

8
Pedestrian Traffic
Time Period
F1 F2 F3 F4 F5 F6 F7 F8
1 0700 - 0715 3 0 4 0 1 2 1 0
2 0715 - 0730 3 1 3 0 3 1 3 2
3 0730 - 0745 2 6 3 0 3 0 0 2
4 0745 - 0800 0 5 10 2 0 3 1 3
5 0800 - 0815 1 0 5 1 3 1 3 8
6 0815 - 0830 6 7 14 3 3 5 4 0
7 0830 - 0845 7 15 31 1 6 0 5 2
8 0845 - 0900 6 13 28 4 5 2 3 5
9 0900 - 0915 5 11 23 3 5 2 5 4
10 0915 - 0930 3 9 18 3 0 3 6 4
11 0930 - 0945 0 2 7 0 2 1 7 3
12 0945 - 1000 2 5 4 2 1 2 6 1
F9 F10 F11 F12 F13 F14 F15 F16
1 0700 - 0715 2 1 1 4 5 0 1 2
2 0715 - 0730 0 0 3 2 6 1 0 0
3 0730 - 0745 1 0 1 5 7 1 0 0
4 0745 - 0800 4 2 4 9 9 5 1 3
5 0800 - 0815 0 1 0 7 6 5 1 0
6 0815 - 0830 14 0 5 13 8 1 3 1
7 0830 - 0845 15 1 2 7 5 3 0 1
8 0845 - 0900 12 1 1 10 7 4 2 3
9 0900 - 0915 13 0 2 13 9 2 2 3
10 0915 - 0930 11 1 3 7 6 0 0 1
11 0930 - 0945 2 3 0 5 4 1 1 1
12 0945 - 1000 3 0 0 7 10 2 0 2
Figure 2 - Pedestrian survey results

9
Figure 4 - Pedestrian graph
17.525
4955
4639.5
51.5 5245 43
31.5 33
0
50
100
150
200
1 2 3 4 5 6 7 8 9 10 11 12
Pa
ssa
ng
er
Ca
r E
qu
iva
len
t
Time Interval - 15 Minutes
Traffic Flows
1 - 6
Flow 1
Flow 2
Flow 3
Flow 4
Flow 5
Flow 6
Figure 3 - Traffic flow graph

10
Future Mobility Plan
The present number of students is listed below. This number is expected to rise and
with it the need for services will also have to be upgraded.
Figure 5 - Present student numbers
It is estimated, that when the Grangegorman development becomes fully operational
20,000 students plus staff are expected to use the campus each day. This figure can be
broken down into the following:
Bus 28% 1,960 Students
Train 19% 1,330 Students
Luas 16% 1,120 Students
Car 7% 868 Students
Walk 11% 770 Students
Cycle 13% 910 Students
Metro N. 6% 420 Students
These results are estimated and based on a figure of 35% of the total student
population. Cars make up 7% of the total student population, of which, 62% enter
through the Broadstone Gate Entrance.
(See Appendix 1, for further details regarding the percentage breakdown)

11
Preliminary Design
Need for the Proposed Scheme
At present the junction in question is sufficiently designed to cope with the volumes
of traffic. However the Grangegorman campus was originally scheduled to open in
2017. The campus is expected to facilitate 23,000 students plus approximately 4,000
staff. This development will contribute to an extensive increase in the volumes of
both pedestrian and vehicular traffic to the area. The ‘Constitution Hill - Western
Way’ junction is adjacent to a proposed major entrance to the campus, this will
facilitate the majority of both traffic and pedestrians coming and going from the
college.
Following investigation and research into traffic flows at the ‘Constitution Hill -
Western Way’ junction, the authors have determined that the current state of the
junction will not suffice, to handle the demand into the Grangegorman development,
upon its opening.
Following a traffic survey it was found, that pedestrians using the junction have little
regard for the designated road-crossing points. With the opening of Grangegorman,
and the resulting increase of pedestrian traffic, the disregard for safe crossing paths
will become a major health and safety issue. Due to the nature of the Grangegorman
project the majority of traffic is expected to be pedestrian and cycling students
between the ages of 17-24. It is the group’s intention to re-design the junction to make
it safer for the above road users.
Specific Objectives of the Proposed Project
The group intends to increase road safety of the junction, from the point of
view of pedestrians and cyclists, without impeding the free-flow of traffic through the
junction. In order to achieve this goal, the group intends to examine all reasonable
options available and implement the most feasible approach.
12
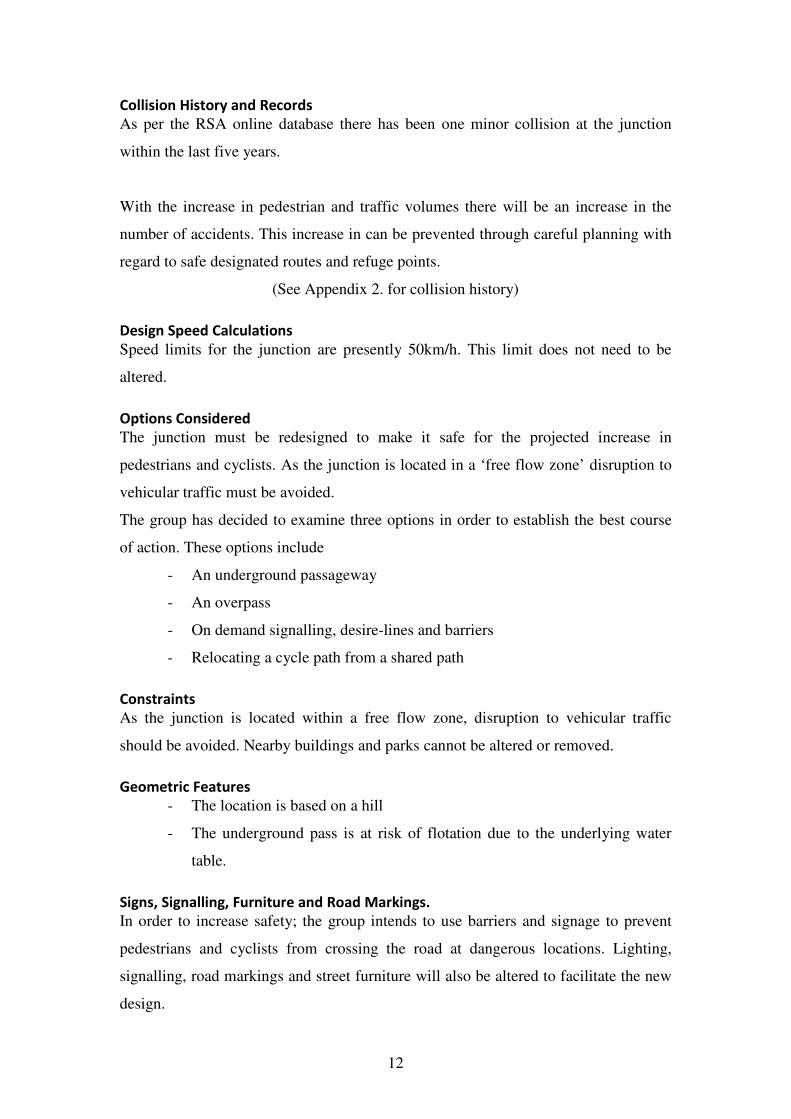
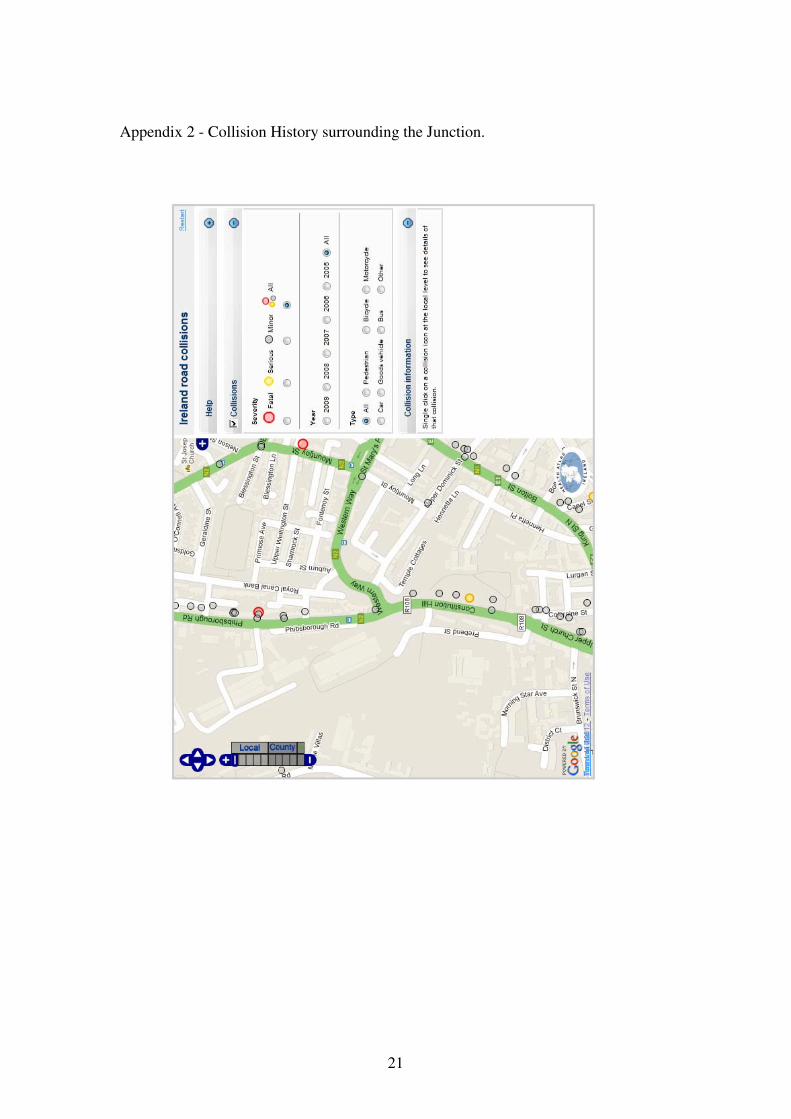
Collision History and Records
As per the RSA online database there has been one minor collision at the junction
within the last five years.
With the increase in pedestrian and traffic volumes there will be an increase in the
number of accidents. This increase in can be prevented through careful planning with
regard to safe designated routes and refuge points.
(See Appendix 2. for collision history)
Design Speed Calculations
Speed limits for the junction are presently 50km/h. This limit does not need to be
altered.
Options Considered
The junction must be redesigned to make it safe for the projected increase in
pedestrians and cyclists. As the junction is located in a ‘free flow zone’ disruption to
vehicular traffic must be avoided.
The group has decided to examine three options in order to establish the best course
of action. These options include
- An underground passageway
- An overpass
- On demand signalling, desire-lines and barriers
- Relocating a cycle path from a shared path
Constraints
As the junction is located within a free flow zone, disruption to vehicular traffic
should be avoided. Nearby buildings and parks cannot be altered or removed.
Geometric Features
- The location is based on a hill
- The underground pass is at risk of flotation due to the underlying water
table.
Signs, Signalling, Furniture and Road Markings.
In order to increase safety; the group intends to use barriers and signage to prevent
pedestrians and cyclists from crossing the road at dangerous locations. Lighting,
signalling, road markings and street furniture will also be altered to facilitate the new
design.

13
Drainage Requirements
The main risks associated with the project are that the culvert tunnel does not flood,
surface water is carried away from the junction and ground water drained to prevent
culvert flotation. The site is located higher than the nearby River Liffy, this means
that water can naturally flow down towards it.
Junction treatment
During construction compulsory diversions and lane closures will be necessary.
Where possible, work will be preformed at night and during off peak times. Upon
completion traffic and signalling will return to its previous form.
Requirements of Non-drivers
Pedestrians will be encouraged to use safe crossing and refuge points. This will be
done using barrier and minimal waiting times at crossing points. As a result the risk
and accidents at the junction will be greatly reduced.
Relaxing and Departures
The project has no relaxations or departures.
Cost of Accidents
The following takes into account previous 5 yearly accidents (2005-2009), and
assumes a linear relationship between population and accidents. The table below
shows projected population growth and a total cost of accidents to be €1,899,562.
Accident Number of Accidents Cost Per Accident € Total Cost €
Fatal 1 1,694,481 1,694,481
Serious 1 190,400 190,400
Minor 10 14,681 140,681
Figure 6 - Cost of accidents 2005-2009
If the design proposals are not implemented, due to the 17-24 year old, population
increase the estimated cost of accidents area as follows for the same duration
following completion of the Grangegorman development. The total accident cost is
€20,113,740.
Accident Number of Accidents Cost Per Accident € Total Cost €
Fatal 9.9 1,694,481 16,775,361
Serious 9.9 190,400 1,884,960
Minor 99 14,681 1,453,419
Figure 7 - Cost of future accidents

14
Design
On the basis of these measurements, and taking into account the lack of queuing, we
were able to establish that the junction is very well tailored to the traffic flows at that
location. However, Grange Gorman is going to generate a significant additional
volume of traffic and this must be taken into consideration when attempting to assess
the future efficiency and safety of this particular junction.
On these ground, we have decided that there are two best-practice solutions to the
increased traffic flows, especially with respect to vulnerable road users (cyclists,
pedestrians and the disabled).
The junction at present is shown below:
Figure 8 - Current junction layout
• GRASS
• FOOTPATHS
• BUILDINGS

15
The two proposed solutions are shown below:
Figure 9 - Proposed junction layout
• GRASS
• FOOTPATHS
• BUILDINGS
• TUNNEL & ENTRANCES
• BRIDGE & RUN-INS

16
Cost analysis
On the basis of these two proposals, the group performed cost appraisals on both.
Values for pricing were obtained from the NRA Roadwork’s Unit Rate Database. The
solutions are a precast section culvert tunnel and a truss bridge.
(For a detailed breakdown of costs please see Appendix 3 and 4)
Culvert Tunnel
• 110m in length
• 3.7m wide x 2.6m high
• Gradients not exceeding 1:12 on lead-ins
• Cost analysis includes for external and internal drainage and all associated
costs
• Total construction cost €649,883.75
Truss Bridge
• 55m clear span
• 2.5m deck width, including cycle path
• Gradients below 1:20 throughout
• Cost analysis includes lead-in and on-bridge lighting and all services
• Total construction cost €594,487.40

17
Figure 11 - Typical overpass design
Figure 10 - 2.6 x 3.7m Underground culvert/Tunnel

18
Conclusion
Following extensive research and design, the group felt that by introducing a
footbridge, the safety of vulnerable road users would be enhanced and vehicular
traffic not affected, even with the projected increase in volumes, both in the near
future and after the design year.
While the overall cost of the project is considerable, it is small with respect to the
overall cost of the Grangegorman Development and the cost of accidents per year.
The cost of the overpass was close to six hundred thousand euro. Over a five year
period the estimated total cost for fatal, serious and minor accidents was over twenty
million euro, following completion of the Grangegorman development. By
introducing an overpass the potential for loss of life and other accidents are greatly
reduced as well as the financial saving being astronomical.

19
References
• RSA – Road Safety Authority. Irish Road Collisions [online] Available at:
www.rsa.ie/Ireland-road-collisions. [Assessed on] 11-04-12.
• NRA Roadwork’s Unit Rate Database. A reference material for costs associated
with infrastructural development in the context of road networks. National Roads
Authority [online] Available at: www.nra.ie. [Assessed on] 11-04-12.
• Google – Google Maps and Google Earth are mapping database that provides
accurate GPS images and measurements. [onine] Available at: www.google.com.
[Assessed on] 11-04-12.
• Grangegorman Development Agency – A reference material that highlights the
plans and objectives planned to consolidate and modernise all of the DIT
campuses. [online] Available at: www.ggda.ie. [Assessed on] 11-04-12.
• Ferry Bridge [online] Available at http://www.geograph.ie/photo/504892
[Assessed on] 11-04-12.
• Collision Prevention Programme. An Garda Siochana. [online] Available at
www.garda.ie [Assessed on] 11-04-12.
• National Roads Authority – 2008. NRA. The Project Appraisal Guidelines.
Appendix 8 – TRL COBA report.

20
Appendix
Appendix 1 – Percentage breakdown for traffic
21
Appendix 2 - Collision History surrounding the Junction.

22
Appendix 3 – Cost analysis for Tunnel

23
Appendix 4 – Cost analysis for overpass