Cardiovascular disease and its associated risk factors in ...
109
Cardiovascular disease and its associated risk factors in Aboriginal and Torres Strait Islander peoples 2004–05
Transcript of Cardiovascular disease and its associated risk factors in ...

Cardiovascular disease and its associated risk factors in Aboriginal and Torres Strait Islander peoples
2004–05

The Australian Institute of Health and Welfare is Australia’s national health and welfare statistics and information agency. The Institute’s mission is better information and statistics for better health and wellbeing.
Please note that as with all statistical reports there is the potential for minor revisions of data over its life. Refer to the online version at <www.aihw.gov.au>.

CARDIOVASCULAR DISEASE SERIES Number 29
Cardiovascular disease and its associated risk factors in Aboriginal and Torres Strait Islander peoples
2004–05
Elizabeth Penm
June 2008
Australian Institute of Health and Welfare
Canberra
Cat. no. CVD 41

© Australian Institute of Health and Welfare 2008 This work is copyright. Apart from any use as permitted under the Copyright Act 1968, no part may be reproduced without prior written permission from the Australian Institute of Health and Welfare. Requests and enquiries concerning reproduction and rights should be directed to the Head, Media and Communication Unit, Australian Institute of Health and Welfare, GPO Box 570, Canberra ACT 2601. This publication is part of the Australian Institute of Health and Welfare’s Cardiovascular disease series. A complete list of the Institute’s publications is available from the Institute’s website <www.aihw.gov.au>. ISSN 1323 9236 ISBN 978 1 74024 792 4
Suggested citation
AIHW: Penm E 2008. Cardiovascular disease and its associated risk factors in Aboriginal and Torres Strait Islander peoples 2004–05. Cardiovascular disease series no. 29. Cat. no. CVD 41. Canberra: AIHW.
Australian Institute of Health and Welfare
Board Chair Hon. Peter Collins, AM, QC Director Penny Allbon Any enquiries about or comments on this publication should be directed to: Elizabeth Penm Australian Institute of Health and Welfare GPO Box 570 Canberra ACT 2601 Phone: (02) 6244 1000 Email: [email protected] Published by Australian Institute of Health and Welfare Printed by Union Offset Printers

v
Contents
Acknowledgments.............................................................................................................................vii Abbreviations................................................................................................................................... viii Symbols............................................................................................................................................. viii Summary .............................................................................................................................................. ix 1 Introduction....................................................................................................................................1
Purpose and structure of this report............................................................................................1 2 Data sources and methods...........................................................................................................2
Terminology used in this report ..................................................................................................2 Data sources....................................................................................................................................2 Data limitations and quality.........................................................................................................3 Statistical methods.........................................................................................................................6 Indigenous Australian population profile groups....................................................................8
3 Background: demographics and overall health status ...........................................................9 Demographic characteristics.........................................................................................................9 Health status .................................................................................................................................10 Long-term health conditions ......................................................................................................11
4 Cardiovascular disease...............................................................................................................13 Overview of cardiovascular disease .........................................................................................13 Coronary heart disease ...............................................................................................................18 Cerebrovascular disease .............................................................................................................21 Heart failure .................................................................................................................................23 Hypertension................................................................................................................................26 Rheumatic fever and rheumatic heart disease.........................................................................27 Summary and conclusion ...........................................................................................................31
5 Risk factors and conditions associated with cardiovascular disease ................................32 How many Indigenous Australians have a risk factor for cardiovascular disease? ..........33 How many Indigenous Australians with and without long-term cardiovascular disease have a risk factor? ..........................................................................................................35 Disparity in prevalence of each risk factor between Indigenous and non-Indigenous Australians....................................................................................................................................36 Tobacco smoking .........................................................................................................................37 Physical inactivity........................................................................................................................41 Poor nutrition ...............................................................................................................................45 Overweight and obesity..............................................................................................................51 Alcohol consumption ..................................................................................................................56

vi
Diabetes .........................................................................................................................................62 Long-term kidney disease...........................................................................................................66 Summary and conclusion............................................................................................................69
Appendix 1: Statistical methods ......................................................................................................71 Appendix 2: Detailed statistical tables...........................................................................................73 Glossary................................................................................................................................................90 References............................................................................................................................................94 List of tables ........................................................................................................................................97 List of figures ......................................................................................................................................99

vii
Acknowledgments
This report was prepared by Elizabeth Penm of the National Centre for Monitoring Cardiovascular Disease at the Australian Institute of Health and Welfare (AIHW).
Lynelle Moon, Susana Senes, and Fadwa Al-Yaman are gratefully acknowledged for their valuable advice and comments.
In recognition of the importance of monitoring cardiovascular disease and its risk factors among Aboriginal and Torres Strait Islander peoples, an expert working group was convened to provide strategic advice and feedback on the content of this report. Ian Ring, Gavin Turrell, Noel Hayman, Alex Brown, Alan Cass, Andrew Black and David Cummins provided valuable direction. Members of the National Heart Stroke and Vascular Health Data Working Group also provided valued input and comments on this report. Special thanks go to Ian Ring, Gavin Turrell, Noel Hayman, Andrew Tonkin and Mandy Thrift.
Staff of the Australian Government Department of Health and Ageing and the Australian Bureau of Statistics also provided valuable advice and comments.
Kelly Phillips from the Central Australian Rheumatic Heart Disease Program and Kay McGough from the Top End Rheumatic Heart Disease Program provided data from their respective rheumatic heart disease registers.
Appreciation is also extended to other colleagues at AIHW for their valuable input and helpful comments. These include: Michelle Gourley, Bin Tong, Indrani Pieris-Caldwell, Ilona Brockway, Tiffany Lamb, Chris Stevenson, Sharon Leigh, Claire Ryan, Sandra Ofei, Louise Catanzariti, Robert Van der Hoek and Anne-Marie Waters.
Funding from the Australian Government Department of Health and Ageing contributed to the production of this report.

viii
Abbreviations
ABS Australian Bureau of Statistics
AIHW Australian Institute of Health and Welfare
ANZDATA Australia and New Zealand Dialysis and Transplant Registry
ASR age-standardised rate
BMI body mass index
CI confidence interval
CURF Confidentialised Unit Record Files
ICD-10 International Classification of Diseases, 10th Revision
NATSIHS National Aboriginal and Torres Strait Islander Health Survey
NHMRC National Health and Medical Research Council
NHS National Health Survey
SMR standardised mortality ratio
SPR standardised prevalence ratio
WHO World Health Organization
Symbols
. . not applicable
– nil or rounded to zero

ix
Summary This report updates national-level information for Aboriginal and Torres Strait Islander peoples and non-Indigenous Australians on the prevalence of cardiovascular disease and exposure to its associated risk factors, as well as on cardiovascular deaths. Results are based mostly on analysis of the Australian Bureau of Statistics’ most recent National Aboriginal and Torres Strait Islander Health Survey and National Health Survey conducted in 2004–05.
Key findings
Cardiovascular prevalence, deaths and risk factors are high in Indigenous Australians • In 2004–05, one in eight Indigenous Australians had cardiovascular disease as a long-term
condition. The disease was more common in women and in older people. • Between 2002 and 2005, cardiovascular disease was the leading cause of death, accounting
for 27% of all Indigenous deaths (based on data from Queensland, Western Australia, South Australia and the Northern Territory).
• Over half (53%) of Indigenous Australians aged 18 years and over had three or four of the following risk factors for cardiovascular disease: daily smoking, physical inactivity, eating less than 2 serves of fruit daily, eating less than 5 serves of vegetables daily, high alcohol consumption, hypertension, obesity, diabetes and long-term kidney disease.
• Indigenous Australians with cardiovascular disease were more likely to have multiple risk factors than those without cardiovascular disease.
Disparities between the Indigenous and non-Indigenous populations are marked • Cardiovascular disease was more common in Indigenous Australians than in
non-Indigenous Australians—1.3 times as common. • Between 2002 and 2005, cardiovascular death rates in Indigenous Australians were 3 times
as high as in non-Indigenous Australians. • Nearly all cardiovascular risk factors were more common among Indigenous Australians
than in non-Indigenous Australians. Indigenous Australians were also more likely to have multiple risk factors, and a greater number of them.
• The disparity for tobacco smoking was greater among the populations with cardiovascular disease compared with those without the disease, whereas the disparities for diabetes and obesity were lower among the populations with cardiovascular disease compared with those without the disease.
The message These results reinforce the message that cardiovascular disease is a major health problem among Aboriginal and Torres Strait Islander peoples. Their unfavourable risk factor profile shows that effective primary and secondary interventions to meet the needs of Aboriginal and Torres Strait Islander peoples are necessary to reduce their risk of developing cardiovascular disease, increase their survival rate, and, ultimately, reduce the disparities with non-Indigenous Australians.

x
1
1 Introduction
Aboriginal and Torres Strait Islander peoples continue to have a greater burden of ill health than non-Indigenous Australians—they die at much younger ages and are more likely to experience disability and reduced quality of life (ABS & AIHW 2005). It has been well documented that the health disadvantage among Indigenous Australians begins at an early age and continues throughout adult life. This is a reflection of the broader social and economic disadvantages that impact on the health of the Aboriginal and Torres Strait Islander population—they have poorer educational outcomes, lower rates of home ownership, higher rates of unemployment and lower incomes than non-Indigenous Australians (ABS 2004; Anderson et al. 2006).
Cardiovascular disease is a major health problem in Australia, particularly among Aboriginal and Torres Strait Islander peoples. Indigenous Australians have higher rates of death and illness from cardiovascular disease than non-Indigenous Australians. Added to this is their less favourable risk factor profile—high levels of smoking, alcohol misuse, physical inactivity, excess body weight and diabetes—resulting in a higher risk of developing the disease than the non-Indigenous population.
Purpose and structure of this report This report updates previous information on cardiovascular disease among Indigenous Australians. Using self-reported data from the latest Australian Bureau of Statistics’ health survey of Indigenous Australians—the 2004–05 National Aboriginal and Torres Strait Islander Health Survey—it provides the most recent estimates of the prevalence of the major cardiovascular conditions, comorbidities and associated risk factors among Aboriginal and Torres Strait Islander peoples. Disparities in prevalence rates between Indigenous and non-Indigenous Australians are also looked at. In addition, this report investigates whether the prevalence of cardiovascular disease-related risk factors varies depending on the presence or absence of cardiovascular disease as a long-term health condition. Information on mortality from cardiovascular disease is also included.
Chapter 2 provides an overview of methods used and data quality issues (further details on methods are outlined in Appendix 1). It also presents an overview of the key high-level results on the prevalence of cardiovascular disease and risk factors among Aboriginal and Torres Strait Islander peoples. Chapter 3 presents background information on the demographics of the Aboriginal and Torres Strait Islander population, as well as overall health status and prevalence of long-term health conditions. Chapter 4 provides information on the prevalence of, and mortality from, cardiovascular conditions among Aboriginal and Torres Strait Islander peoples. This includes analysis of disparities between Indigenous and non-Indigenous Australians. Chapter 5 covers the prevalence of risk factors and conditions associated with cardiovascular disease among Aboriginal and Torres Strait Islander peoples. The prevalence of these factors is also analysed among the Indigenous and non-Indigenous populations that do and do not have cardiovascular disease as a long-term health condition.

2
2 Data sources and methods
This chapter provides an overview of the data sources, data quality and analytical methods used to provide the estimates presented in this report.
Terminology used in this report Throughout this report, the terms ‘Aboriginal and Torres Strait Islander peoples’ and ‘Indigenous Australians’ are used to refer to all persons who have identified as being of Aboriginal, Torres Strait Islander, or both Aboriginal and Torres Strait Islander origin.
‘Non-Indigenous Australians’ is used when referring to people who have said that they are non-Indigenous.
‘Other Australians’ refers to persons who identify as being non-Indigenous and persons whose Indigenous status has not been stated.
Data sources The main data sources used in this report are the Australian Bureau of Statistics (ABS) National Aboriginal and Torres Strait Islander Health Survey 2004–05, the ABS National Health Survey 2004–05 and the AIHW National Mortality Database. However, due to limitations of the health surveys (discussed later in this chapter), it is likely that the prevalence rates of some diseases and risk factors are underestimated. Where possible, these results are supplemented by data obtained from registries to help provide a more complete picture of the burden.
ABS health survey data National Aboriginal and Torres Strait Islander Health Survey (2004–05) The National Aboriginal and Torres Strait Islander Health Survey (NATSIHS) 2004–05 is the most recent and largest survey of Aboriginal and Torres Strait Islander peoples done by the ABS. This is a cross-sectional survey, which was conducted in remote (including very remote) and non-remote areas throughout Australia, and was designed to collect national information on the health status of Indigenous Australians, their use of health services and facilities, and health-related aspects of their lifestyle. It collected information from a sample of 10,400 persons (about 1 in 45 of the total Indigenous population) from August 2004 to July 2005 (ABS 2006).
The majority of the NATSIHS’ content is comparable to the 2004–05 National Health Survey. Future NATSIHSs are planned for every 6 years to coincide with every second National Health Survey.
National Health Survey (2004–05) The National Health Survey (NHS) is a series of surveys conducted by the ABS to collect information on the health status of Australians, their use of health services and facilities, and health-related aspects of their lifestyle. Both remote and non-remote areas in all states and

3
territories throughout Australia were included, but very remote areas of Australia were excluded. These are nationally representative cross-sectional surveys of the household population of Australia.
The 2004–05 NHS was conducted at the same time as the NATSIHS, and collected information from about 25,900 people throughout Australia. Results for the non-Indigenous component of the NATSIHS are obtained from the 2004–05 NHS.
Mortality data
AIHW National Mortality Database This database contains information on the cause of death for all deaths in Australia, collected by the state and territory registrars of Births, Deaths and Marriages. The medical practitioner certifying the death or a coroner supplies the information about the cause of death. The registrars provide this information to the ABS for coding the underlying and associated causes of death. In this report, death data relate only to the underlying cause of death (see Appendix 1 for definition of diseases according to ICD-10 codes).
Other data sources
Australia and New Zealand Dialysis and Transplant Registry The Australia and New Zealand Dialysis and Transplant Registry (ANZDATA) collects information to monitor dialysis and kidney transplant treatments from all renal units in Australia and New Zealand on all patients receiving kidney replacement therapy where the intention to treat is long-term, that is, kidney function will not recover. Cases of acute kidney failure are excluded. The registry is coordinated within the Queen Elizabeth Hospital in South Australia. Incidence data for treated end-stage kidney disease are for the period 2002–2005 and prevalence data are as at 31 December 2005.
Top End of the Northern Territory and Central Australian Rheumatic Heart Disease Registers These regional registers collect data related to rheumatic heart disease diagnosis, hospitalisations, compliance with preventive penicillin use, clinical progress, surgery and mortality (AIHW: Field 2004). They also collect information on recurrences, which are defined as cases diagnosed in someone with established rheumatic heart disease 3 months or more after their most recent episode of acute rheumatic fever. These registers are run by the Northern Territory Department of Health. Incidence data for acute rheumatic fever are for the period 2002–2006. Prevalence data for rheumatic heart disease are as at 31 December 2006.
Data limitations and quality There are a number of factors that limit the availability and quality of data presented in this report; these should be taken into consideration when interpreting results.

4
ABS health survey data The ABS health surveys provide an excellent source of nationally representative data on a range of health conditions, demographics, health service use and health-related aspects of lifestyle. However, the surveys do have some limitations, which are discussed below.
Self-reported data As data collected in the NATSIHS and NHS are self-reported, their accuracy relies on the respondent’s knowledge of their health status and accuracy in reporting it. The ABS made considerable effort to collect accurate information from respondents; this included a detailed consultative process for developing and testing the questionnaire design, use of trained interviewers and assistance of local Indigenous facilitators. Yet, the accuracy of some responses may be affected by misreporting, imperfect recall or an individual’s interpretation of the survey questions.
The majority of results presented in this report are survey estimates based on data reported by the respondent, including derived items for some risk factors. In the survey, respondents were asked whether they had ever been told by a doctor or nurse that they had a particular health condition, but these responses were not medically verified.
As the information collected is not medically verified or based on biological measurements, a respondent may have a condition but be unaware of it. For example, if they have never had their blood glucose level tested, they may not realise that they have diabetes. This would result in underestimation of the prevalence of certain conditions, such as high blood pressure, diabetes and long-term kidney disease.
Diseases or conditions that have a substantial impact on an individual’s health, functioning and lifestyle are expected to have a higher reporting accuracy than those that have a small or no noticeable effect. There may also be some under- or over-reporting of certain conditions or behaviours. In particular, it is expected that there would be some under-reporting of alcohol and tobacco consumption levels, as well as underestimation of weight or overestimation of height which would lead to underestimated body mass index.
Cross-sectional data As the NATSIHS and NHS are cross-sectional surveys, it is possible to recognise statistical associations between variables but not causal relationships. This means that we cannot infer whether a risk factor, such as tobacco smoking, leads to poor health, such as the development of coronary heart disease. Also, the presence or number of risk factors an individual has may change over time, and this may be influenced by the presence of cardiovascular disease. Such changes cannot be measured in a cross-sectional survey.
Exclusion of the institutionalised population Both the NATSIHS and NHS samples include only usual residents of private dwellings. People residing in non-private dwellings, such as hotels, motels, hostels, hospitals, nursing homes and short-stay caravan parks were excluded from the survey. As cardiovascular conditions and some risk factors are more common among the older population, this would result in an under-representation in the survey of people who are affected by these conditions.

5
Long-term condition classification Information on cardiovascular conditions in this report is based on long-term conditions. These are defined as medical conditions (illness, injury or disability) which were current at the time of the survey, and which have lasted at least 6 months, or which the respondent expects to last for 6 months or more.
Other limitations The health surveys were used to collect information on medical health conditions from individuals of any age (that is, total population). However, information on the majority of lifestyle risk factors was only collected from a sub-set of respondents in various age ranges, for example, those aged 12, 15 or 18 years and over. For this reason, throughout this report, estimates of self-reported prevalence of cardiovascular disease are presented for the total Aboriginal and Torres Strait Islander and non-Indigenous Australian populations, but estimates of risk factor prevalence and their association with the presence or absence of cardiovascular disease are only presented for populations aged 18 years and over.
Hypertension is a cardiovascular condition itself, as well as a risk factor for the development of other cardiovascular conditions. It has been included in the risk factor analysis for the total Indigenous and non-Indigenous populations aged 18 years and over, but excluded from analysis among the ‘with cardiovascular disease’ and ‘without cardiovascular disease’ populations.
Information on the prevalence of some health conditions, such as rheumatic heart disease and long-term kidney disease was collected from the non-Indigenous population. However, the information on these conditions is not available from the NHS or the NATSIHS Confidentialised Unit Record Files (CURF). Therefore, it is not possible to provide comparative information for these diseases between the Indigenous and non-Indigenous populations in this report.
With the NATSIHS, separate survey questionnaires were used to collect information from the non-remote and remote areas. The survey content for the NATSIHS conducted in remote community areas is a subset (approximately 80%) of the content collected in other areas. The survey content in these remote communities excluded topics for which data of acceptable quality could not be collected, such as daily intake of fruit and vegetable servings as well as levels of physical activity.
Certain questions in the surveys had high non-response rates. In the 2004–05 NATSIHS and NHS, information on height and weight measurements could not be obtained for approximately 15% of Indigenous Australians and 8% of non-Indigenous Australians surveyed. Analysis of overweight and obesity was restricted to those participants for whom height and weight were recorded.
Data for most risk factors were collected as categorical data (that is, allocated to pre-defined categories rather than recorded as continuous data). In addition, the continuous relationship between risk factor levels and risk of disease (for example, a rise in level of blood pressure also increases the risk of developing cardiovascular disease) could not be investigated using the health survey data (AIHW 2005b).

6
Mortality data The identification of Aboriginal and Torres Strait Islander peoples is not complete in the AIHW National Mortality Database. Although all death registration and medical cause of death forms include a standard question on Indigenous status of the deceased, this is not always recorded, or recorded correctly. This results in an underestimation of the number of deaths occurring in the Aboriginal and Torres Strait Islander population. Currently, mortality data for Queensland, South Australia, Western Australia and the Northern Territory (where approximately 60% of the Indigenous population reside) are deemed to be of sufficient coverage and quality to provide a reliable representative picture of Indigenous mortality (AIHW & ABS 2006).
Most deaths are registered in the year they occur but some of those registered in a given year occurred in previous years. Delays in registration can occur when deaths are awaiting coroner findings or when deaths occur in remote areas. Late death registrations are more common for Indigenous Australians than for non-Indigenous Australians (ABS & AIHW 2005). To improve the coverage of deaths of Indigenous Australians, the number of deaths is calculated from the year of registration data in the latest available year, and year of occurrence of death data for the previous years. Mortality data in this report have been extracted for deaths that occurred in 2002, 2003 and 2004 and deaths registered in 2005.
Mortality records where Indigenous status is recorded as not stated, missing or unknown were excluded from the analysis for deaths.
Top End of the Northern Territory and Central Australian Rheumatic Heart Disease registers Data from the Top End register cover the northern part of the Northern Territory including Darwin, East Arnhem, Lower Top End (Katherine region), Alligator, Daly, Finniss and Bathurst-Melville. Data from the Central Australian register cover the Barkley region and Central Northern Territory (Alice Springs region). The Central Australian register also covers parts of Western Australia and South Australia, but data from these areas have not been included due to difficulties in determining denominator populations for these regions.
The 2001 estimated resident Indigenous and non-Indigenous populations for the Top End of the Northern Territory and Central Australia have been used as the denominator populations for the calculation of rates. This is because Indigenous population data for the Top End and Central Australia are only available from the ABS for census years. Caution should therefore be used in interpreting the rates.
Statistical methods Several analytical and statistical methods have been used to compare the prevalence of diseases and risk factors between Indigenous and non-Indigenous Australians. These are described in this section.

7
Prevalence Prevalence refers to the number or proportion (of cases, etc.) present in a population at risk at a given time. Prevalence data in this report have been obtained mainly from the ABS health surveys.
Incidence Incidence refers to the number of new cases (of a disease, condition or event) occurring during a given period. Incidence data in this report have been obtained from registers.
Age standardisation Age standardisation is a method used to control the effect of age when comparing populations with different age structures. This method was used to allow comparisons of prevalence and deaths between the Indigenous and non-Indigenous populations, as a whole, and the populations with or without cardiovascular disease.
In this report, age-standardised rates were calculated using the indirect standardisation method. This method is recommended for use in calculating rates for small populations where there is some uncertainty about the stability of age-specific rates.
The indirect standardisation method compares the number of observed respondents or cases to the number expected if the age-specific rates of the standard population are applied to the study population. The non-Indigenous Australian population has been used as the standard population in these analyses (see Appendix 1 for calculation of indirect standardisation).
Standardised ratio and age-specific rate ratio Standardised ratios, such as standardised prevalence ratio and standardised mortality ratio, and age-specific rate ratios have been presented throughout the report to provide a more in-depth picture of patterns between populations. These ratios express the overall experience of a comparison population in terms of the standard population by calculating the ratio of observed to expected number in the comparison population (HDSC 2006) (see Appendix 1 for more information).
Significance testing Significance tests have been performed throughout this report, and are used to determine whether calculated rates for Indigenous and non-Indigenous Australians are meaningfully different from one another, taking into account random chance variation. The significance tests for differences between quantities (such as sample proportion estimates for survey data) were performed by constructing 95% confidence intervals around the ratio value. This confidence interval is a range within which there is 95% confidence that the true ratio lies. If the confidence interval does not contain the value 1.0, then the ratio is regarded as statistically significant at the 95% level and the difference is unlikely to have arisen by chance.
In this report, all standardised ratios and age-specific rate ratios of observed to expected prevalence estimates, cases or deaths are statistically significant unless otherwise stated.

8
Indigenous Australian population profile groups In this report, the total Aboriginal and Torres Strait Islander population is broken down into sub-populations and looked at according to: • whether they have at least one cardiovascular condition • whether they have at least one of the risk factors associated with cardiovascular disease.
Based on results from the 2004–05 NATSIHS, 12% of the Aboriginal and Torres Strait Islander population were estimated to have cardiovascular disease as a long-term health condition. This corresponds to an estimated 55,900 Indigenous Australians (Figure 2.1).
Due to survey limitations and data quality issues, analysis for all investigated risk factors is limited to a smaller portion of the Indigenous population. This population includes those aged 18 years and over and surveyed in non-remote areas, but excludes those for whom height and weight measurements were not available. The resulting population investigated for risk factors comprises an estimated 134,000 Indigenous Australians, with about 30,000 people with cardiovascular disease and 104,000 without cardiovascular disease (Figure 2.1).
+ Standardised prevalence ratios not statistically different from 1.0. That is, rates for Indigenous Australians are not significantly different from rates for non-Indigenous Australians.
(a) Population estimate are for those aged 18 years and over, surveyed in non-remote areas and excludes survey non-response for height and weight measurements used to derive the body mass index.
Notes
1. Based on self-reported data.
2. SPR (standardised prevalence ratio) is the ratio of the observed number of cases to the number of expected cases if Indigenous Australians had experienced the same age-specific prevalence rates as non-Indigenous Australians.
Source: AIHW analysis of the ABS 2004–05 NATSIHS CURF.
Figure 2.1: Aboriginal and Torres Strait Islander populations with or without cardiovascular disease, 2004–05
Aboriginal and Torres Strait Islander population at 31 December 2004
• 474,300 people • 134,000 people (for risk factor population)(a)
Indigenous Australians with cardiovascular disease
• 55,900 (SPR = 1.3)
• 30,000 (for risk factor population)(a) (SPR = 1.2)
Indigenous Australians without cardiovascular disease
• 418,400 (SPR = 0.9)
• 104,000 (for risk factor population)(a) (SPR = 1.0+)

9
3 Background: demographics and overall health status
Demographic characteristics The preliminary Indigenous resident population was estimated to be 517,000, or 2.5% of the total Australian population, at 30 June 2006 (ABS 2007b). In the 2006 Census of Population and Housing, 96% of Indigenous Australians were counted in private dwellings and the remainder (4%) in non-private dwellings, such as hotels/motels, corrective facilities, nursing homes, hospitals, cared accommodation and boarding houses. For the 2004–05 NATSIHS, the Indigenous population living in private dwellings was estimated to be 474,300 at 31 December 2004 (ABS 2006).
Among the Aboriginal and Torres Strait Islander population in 2006, 464,000 or around 90%, were estimated as being of Aboriginal origin only, 33,100, or 6%, were of Torres Strait Islander origin only, and 20,200, or 4%, were of both Aboriginal and Torres Strait Islander origin (ABS 2007b).
Age structure The Aboriginal and Torres Strait Islander population is relatively young, with more people in the younger age groups compared with the non-Indigenous population (Figure 3.1). In 2006, the median age of the Indigenous population was 20 years compared with 37 years for the non-Indigenous population. Around 37% of the total Indigenous population was aged under 15 years compared with 20% of the non-Indigenous population. And older Australians aged 65 years and over comprised 3% of the Indigenous and 12% of the non-Indigenous populations. This difference in age structure is a reflection of the higher fertility rate and lower life expectancy in the Indigenous population.
As age is closely associated with health, care should be taken when comparing the Indigenous and non-Indigenous Australian populations. To adjust for the difference in age structure of the two populations, comparisons between the Indigenous and non-Indigenous Australian populations are presented as standardised ratios, or by age group, as appropriate.
Life expectancy The estimated life expectancy at birth for Aboriginal and Torres Strait Islander peoples is much lower than for all Australians. For the period 1996–2001, experimental estimates of life expectancy at birth were 59 years for Indigenous males and 65 years for females. In contrast, the average life expectancy at birth for all Australians for the period 1998–2000 was 77 years for males and 82 years for females (ABS & AIHW 2005).

10
Note: See Appendix 2, Table A2.1 for detailed information.
Source: ABS 2007a.
Figure 3.1: Population profile, by Indigenous status, age and sex, 30 June 2006
Health status Self-assessed health status provides an indicator of overall health, reflecting an individual’s perception of their own health. A number of reviews of the measure have shown it to be a strong and consistent predictor of subsequent mortality (Idler & Benyamini 1997). But as this measure is dependent on individuals’ awareness and expectations about their health, it may be influenced by factors such as access to health services and health information.
In 2004–05, around 4 in 10 (43%) Indigenous Australians aged 15 years and over considered their health to be excellent or very good, 35% good and 22% fair or poor. After adjusting for differences in the age structure of the Indigenous and non-Indigenous populations, Indigenous Australians were nearly twice (1.9 times) as likely to consider their health as fair or poor compared with non-Indigenous Australians (Figure 3.2).
The proportion of Indigenous Australians who considered their health to be fair or poor increased with age, from 9% in those aged 15–24 years to over 50% in those aged 55 years and over. Across all age groups, Aboriginal and Torres Strait Islander peoples were more likely to consider their health as fair or poor compared with non-Indigenous Australians.
8 6 4 2 0 2 4 6 8
0–4
5–9
10–14
15–19
20–24
25–29
30–34
35–39
40–44
45–49
50–54
55–59
60–64
65–69
70–74
75+
Age group (years)
Percentage of total populations
Males Females
Indigenous AustraliansNon-Indigenous Australians

11
Notes
1. Based on self-reported data.
2. Rate ratio of the observed number of cases to the number of expected cases if Indigenous Australians had experienced the same age-specific prevalence rates as non-Indigenous Australians.
3. A rate ratio of 1.0 indicates that there is no difference between rates experienced by the Indigenous and non-Indigenous populations. All rate ratios are statistically significantly different from rates for non-Indigenous Australians.
4. Bars on columns represent 95% confidence intervals.
Source: AIHW analysis of the ABS 2004–05 NATSIHS CURF.
Figure 3.2: Self-assessed health status, Aboriginal and Torres Strait Islander peoples aged 15 years and over, 2004–05
Long-term health conditions Based on self-reported information from the 2004–05 NATSIHS, around two-thirds (65%) of Aboriginal and Torres Strait Islander peoples had at least one long-term health condition. After adjusting for differences in the age structure of the two populations, Indigenous and non-Indigenous Australians were equally likely to have a long-term health condition.
The proportion of Indigenous Australians with at least one long-term health condition increased with age, rising from 44% of Indigenous children aged 14 years and under to 97% of older Indigenous Australians (aged 55 years and over). This pattern was observed for both Indigenous males and females. The proportion of Indigenous Australians having three or more long-term health conditions also increased with age (Figure 3.3).
Indigenous Australians had an average of three long-term health conditions, slightly lower than the average of four for non-Indigenous Australians.
0.0
0.5
1.0
1.5
2.0
2.5
Excellent/very good Good Fair/poor
Self-assessed health status
Rate ratio
0.0
0.5
1.0
1.5
2.0
2.5
Excellent/very good Good Fair/poor
Self-assessed health status
Rate ratio

12
0%
20%
40%
60%
80%
100%
0–14 15–24 25–34 35–44 45–54 55–64 65+
Age group (years)
Per cent
One long-termhealth condition
Tw o long-termhealth conditions
Three or morelong-term healthconditions
Note: Based on self-reported data.
Source: AIHW analysis of the ABS 2004–05 NATSIHS CURF.
Figure 3.3: Number of long-term health conditions among Aboriginal and Torres Strait Islander peoples with a long-term health condition, by age group, 2004–05

13
4 Cardiovascular disease
Cardiovascular disease (diseases of the heart and circulatory system) is a major health problem in Australia. This disease often results in considerable burden from premature mortality, associated disability and poor quality of life. It is also responsible for the greatest proportion of direct health care expenditure in Australia (AIHW 2006a).
Aboriginal and Torres Strait Islander peoples have higher rates of developing and dying from cardiovascular disease than non-Indigenous Australians. The high prevalence rates of biomedical and behavioural health risk factors, such as tobacco smoking, excess body weight, poor nutrition and diabetes in Indigenous Australians can increase their risk of developing cardiovascular disease. Indigenous Australians also have greater social and economic disadvantages, poor access to health care services, and difficulties associated with living in rural and remote locations; factors that have been recognised as important contributors to the greater burden of cardiovascular disease among Indigenous Australians.
This chapter presents recent data on the prevalence of cardiovascular disease in the Aboriginal and Torres Strait Islander population. The main cardiovascular conditions investigated are: • coronary heart disease • cerebrovascular disease • heart failure • hypertension • rheumatic fever and rheumatic heart disease.
Analysis of these conditions by age group and sex was done where data are of sufficient quality. Comparisons of results for the Indigenous and non-Indigenous Australian population are presented where information is available.
Overview of cardiovascular disease Cardiovascular disease is the largest contributor to the disparity in health experienced by Indigenous Australians. It is also the leading cause of death among Indigenous Australians, with a death rate nearly three times that for non-Indigenous Australians (Brown et al. 2005). Coronary heart disease, cerebrovascular disease, heart failure and hypertension are the main cardiovascular conditions that contribute to this burden among Aboriginal and Torres Strait Islander peoples. Acute rheumatic fever and rheumatic heart disease are also major cardiovascular conditions among Indigenous Australians but not among non-Indigenous Australians.
What is cardiovascular disease? Cardiovascular disease includes all diseases and conditions that affect the normal structure and function of the heart and blood vessels. The common underlying cause of the main cardiovascular diseases is atherosclerosis, which is the build-up of hard, fatty substances (usually cholesterol) inside the channel of the arteries. Over time this build-up can result in narrowing of the channel leading to the reduction or complete blockage of the normal flow of blood. In the case of the arteries leading to the heart, this reduces the blood flow to the heart tissues, causing angina or heart attack, or to the brain, causing a stroke.

14
How many Indigenous Australians have cardiovascular disease? Based on self-reports in the 2004–05 NATSIHS: • an estimated one in eight (12%) Indigenous Australians (55,900 people) had a long-term
cardiovascular condition • after adjusting for differences in the age structure of the Indigenous and non-Indigenous
populations, Aboriginal and Torres Strait Islander peoples were 1.3 times as likely to have cardiovascular disease as non-Indigenous Australians.
Most cardiovascular conditions develop over time as a result of the impact that exposure to risk factors have on the body and the effects of biological ageing (AIHW 2006b). This is reflected in the prevalence of overall cardiovascular disease, which increases rapidly from 21% among Indigenous Australians aged 35–44 years to 61% in those aged 65 years and over. This pattern was similar to that of non-Indigenous Australians who were 10 years older (Figure 4.1).
Per cent
0
10
20
30
40
50
60
70
0–24 25–34 35–44 45–54 55–64 65+
Age group (years)
Indigenous Australians
Non-Indigenous Australians
Notes 1. Based on self-reported data. 2. See Appendix 2, Table A2.2 for detailed information.
Source: AIHW analysis of the ABS 2004–05 NATSIHS CURF.
Figure 4.1: Prevalence of cardiovascular disease, by Indigenous status and age group, 2004–05
Indigenous women were 1.4 times as likely as in men to have cardiovascular disease— a pattern also observed in the non-Indigenous population—driven mainly by the higher rate of rheumatic heart disease and heart failure in women. The difference was especially evident in the 55–64 years age group, with the prevalence of cardiovascular disease in women being 23 percentage points higher than in men.
Indigenous men and women were more likely to have cardiovascular disease than non-Indigenous Australians. After adjusting for the differences in the age structure of the two populations: • Indigenous men were 1.2 times as likely to have cardiovascular disease as non-Indigenous
men • Indigenous women were 1.4 times as likely.

15
Which cardiovascular conditions are most common? Hypertension and coronary heart disease are the most common cardiovascular conditions among Indigenous Australians. In 2004–05, the prevalence of the main cardiovascular conditions in the Aboriginal and Torres Strait Islander population were: • hypertension—7.1% • coronary heart disease—1.2% • heart failure—1.0% • rheumatic heart disease—0.7% • cerebrovascular disease—0.3%.
The prevalence pattern of the main cardiovascular conditions varied between Indigenous males and females (Table 4.1). Among Indigenous males, hypertension was the most common condition, followed by coronary heart disease and heart failure. For females, hypertension was also the most common condition, but this was followed by heart failure and coronary heart disease. Note that estimates for heart failure in Indigenous males have a relative standard error of 25% to 50% and should be interpreted with caution.
Table 4.1: Prevalence of main cardiovascular conditions in Aboriginal and Torres Strait Islander peoples, by sex, 2004–05
Indigenous males Indigenous females
Cardiovascular condition Number
Per cent(a)
ASR(b)
(95% CI) SPR(c) Number Per
cent(a) ASR(b)
(95% CI) SPR(c)
Coronary heart disease 2,800 1.2
35.3(24.5–46.0) 1.7 3,000 1.2
35.8 (25.6–46.0) 2.7
Cerebrovascular disease *700 *0.3
*7.4(2.8–12.0) *+1.5 700 0.3
8.4 (4.4–12.3) +1.9
Heart failure *1,400 *0.6 *17.4
(6.3–28.5) *+1.9 3,100 1.3 28.8
(17.0–40.7) +1.6
Hypertension 15,000 6.4 155.2
(134.3–176.0) 1.5 18,700 7.7 190.8
(155.3–226.3) 1.7
Rheumatic heart disease(d) *900 *0.4 . . . . 2,600 1.1 . . . .
Total cardiovascular disease(e) 22,000 9.5
197.4(175.2–219.7) 1.2 33,900 14.0
269.4 (234.1–304.6) 1.4
* Estimate has a relative standard error of 25% to 50% and should be interpreted with caution.
+ Standardised prevalence ratios not statistically different from 1.0. That is, rates for Indigenous Australians are not significantly different from rates for non-Indigenous Australians.
(a) Percentage of all Indigenous Australian males and females.
(b) ASR (age-standardised rate) refers to indirectly age-standardised rates using ‘Non-Indigenous Australians’ population as the standard population. Number per 1,000 population.
(c) SPR (standardised prevalence ratio) is the ratio of the observed number of cases to the number of expected cases if Indigenous Australians had experienced the same age–sex-specific prevalence rates as non-Indigenous Australians.
(d) Information on rheumatic heart disease is not available for non-Indigenous Australians from the 2004–05 NATSIHS CURF.
(e) Total includes other cardiovascular conditions not presented in the table.
Note: Based on self-reported data.
Source: AIHW analysis of the ABS 2004–05 NATSIHS CURF.

16
Disparity between Indigenous and non-Indigenous Australians Compared with non-Indigenous Australians, Indigenous Australians were more likely to have each of the main cardiovascular conditions (Figure 4.2). After adjusting for differences in the age structure of the Indigenous and non-Indigenous populations, disparities in prevalence rates for the conditions were as follows: • coronary heart disease—2.1 times as high as in non-Indigenous Australians • cerebrovascular disease and heart failure—1.7 times each • hypertension—1.6 times.
Information on the disparity in prevalence rates for rheumatic heart disease is not given as it was not available for non-Indigenous NHS respondents on the NATSIHS CURF.
Disparities in conditions differed between males and females (Table 4.1). For Indigenous males, heart failure had the greatest disparity followed by coronary heart disease, hypertension and cerebrovascular disease. For Indigenous females, coronary heart disease had the greatest difference in prevalence rates, followed by cerebrovascular disease, hypertension and heart failure.
Notes
1. Based on self-reported data.
2. Standardised prevalence ratio of the observed number of cases to the number of expected cases if Indigenous Australians had experienced the same age-specific prevalence rates as non-Indigenous Australians.
3. A standardised prevalence ratio of 1.0 indicates that there is no difference between rates experienced by the Indigenous and non-Indigenous populations. All standardised prevalence ratios are statistically significantly different from non-Indigenous Australians.
4. Bars on columns represent 95% confidence intervals
Source: AIHW analysis of the ABS 2004–05 NATSIHS CURF.
Figure 4.2: Standardised prevalence ratios for main cardiovascular conditions in Aboriginal and Torres Strait Islander peoples, 2004–05
How many Indigenous Australians die from cardiovascular disease? Between 2002 and 2005, in Queensland, Western Australia, South Australia and the Northern Territory, cardiovascular disease accounted for over one-quarter (27% or just over 1,500) of all deaths.
Standardised prevalence ratio
0.0
0.5
1.0
1.5
2.0
2.5
3.0
Coronary heart disease Cerebrovascular disease Heart failure Hypertension
Main cardiovascular condition
Standardised prevalence ratio
0.0
0.5
1.0
1.5
2.0
2.5
3.0
Coronary heart disease Cerebrovascular disease Heart failure Hypertension
Main cardiovascular condition
Standardised prevalence ratio
0.0
0.5
1.0
1.5
2.0
2.5
3.0
Coronary heart disease Cerebrovascular disease Heart failure Hypertension
Main cardiovascular condition
Standardised prevalence ratio
0.0
0.5
1.0
1.5
2.0
2.5
3.0
Coronary heart disease Cerebrovascular disease Heart failure Hypertension
Main cardiovascular condition
Standardised prevalence ratio
0.0
0.5
1.0
1.5
2.0
2.5
3.0
Coronary heart disease Cerebrovascular disease Heart failure Hypertension
Main cardiovascular condition

17
Men were twice as likely to die from cardiovascular disease as women, after adjusting for age. Coronary heart disease accounted for 17% and 13% of all deaths in Indigenous men and women, respectively. In men, this was followed by cerebrovascular disease (3%), rheumatic fever and rheumatic heart disease (0.6%) and heart failure (0.5%). The pattern was similar in women, with cerebrovascular disease accounting for 5% of all deaths, followed by rheumatic fever and rheumatic heart disease (2%) and heart failure (1%).
Disparity between Indigenous and non-Indigenous Australians Indigenous Australians experienced higher rates of death from cardiovascular disease overall and from each of the main cardiovascular conditions compared with non-Indigenous Australians in the four jurisdictions. After adjusting for differences in the age structure of the Indigenous and non-Indigenous populations, between 2002 and 2005: • Indigenous Australians were 2.9 times as likely to die from cardiovascular disease as
non-Indigenous Australians • rheumatic fever and rheumatic heart disease had the largest disparity in death rates, at
15.1 and 23.0 times those of non-Indigenous males and females, respectively (Table 4.2).
Table 4.2: Deaths from main cardiovascular conditions for Aboriginal and Torres Strait Islander peoples (a), by sex, 2002–2005(b)
Indigenous males Indigenous females
Cardiovascular condition No. of deaths(c) SMR(d) No. of deaths(c) SMR(d)
Coronary heart disease 141 3.3 83 2.8
Cerebrovascular disease 28 2.1 33 1.8
Heart failure 4 2.0 7 2.4
Rheumatic fever and rheumatic heart disease 5 15.1 13 23.0
Other cardiovascular conditions 38 3.0 35 3.1
Total cardiovascular disease(e) 217 3.1 170 2.7
(a) Data are for Indigenous deaths for usual residents of Queensland, Western Australia, South Australia and Northern Territory.
(b) Deaths are based on year of occurrence of death for 2002–2004 and year of registration of death for 2005.
(c) Number of deaths has been averaged over the period 2002–2005.
(d) SMR (standardised mortality ratio) is the ratio of the observed number of deaths to the number of expected deaths if Indigenous Australians had experienced the same age–sex-specific death rates as non-Indigenous Australians.
(e) Components do not equal total due to rounding of averages.
Note: All standardised mortality ratios are statistically significantly different from non-Indigenous Australians.
Source: AIHW National Mortality Database.
Indigenous Australians were more likely to die from cardiovascular disease in every age group, particularly in the younger ages, than non-Indigenous Australians in the four jurisdictions. In 2002–2005, age-specific death rates from cardiovascular disease in Indigenous Australians aged less than 65 years were between 5 and 12 times as high as rates for non-Indigenous Australians. This disparity was observed in both males and females (Figure 4.3).
Over the period 1991–1996 in Western Australia, South Australia and the Northern Territory combined, declines in mortality rates from cardiovascular disease among Indigenous Australians were not statistically significant (AIHW 2007). However, between 1997 and 2003 in the three jurisdictions, mortality rates from cardiovascular disease significantly declined. Over the same period, the disparity in cardiovascular disease death rates between Indigenous and other Australians (which includes deaths of non-Indigenous Australians and deaths for which the Indigenous status was not stated) has been narrowing.

18
Notes
1. Data are for Indigenous deaths for usual residents of Queensland, Western Australia, South Australia and Northern Territory.
2. Deaths are based on year of occurrence of death for 2002–2004 and year of registration of death for 2005.
3. See Appendix 2, Table A2.3 for detailed information.
Source: AIHW National Mortality Database.
Figure 4.3: Deaths from cardiovascular disease, by Indigenous status and age group, 2002–2005
Coronary heart disease Coronary heart disease, also known as coronary artery disease or ischaemic heart disease, is a major health problem among Aboriginal and Torres Strait Islander peoples. It is the most common form of heart disease among the Indigenous Australian population. The age-standardised prevalence rate for coronary heart disease is over twice as high as the rate for non-Indigenous Australians; this difference is greatest among younger people. Coronary heart disease is also the largest single cause of mortality in Australia and is the leading contributor to premature deaths and unnecessary deaths for Indigenous Australians (AIHW: Mathur et al. 2006; Brown 2004).
What is coronary heart disease? Coronary heart disease refers to those conditions that directly affect the blood vessels that supply blood to the heart muscle. The two main clinical forms of coronary heart disease are heart attack, also known as acute myocardial infarction, and angina. A heart attack is a life-threatening event that usually occurs when a coronary artery (artery that feeds the heart) becomes completely blocked, stopping the normal flow of blood to the heart muscle. If not promptly treated, this event may result in the death of some portions of the heart muscle, reducing its ability to function normally or, in the worst instance, sudden death. Angina is temporary chest pain, which is caused by a severe but incomplete blockage of one of the coronary arteries, resulting in a reduction in the normal blood supply to the heart muscle. This event is generally not life-threatening, but people with angina are more likely to experience sudden cardiac death or a heart attack than those without the condition.
Number per 100,000 population
0
500
1,000
1,500
2,000
2,500
3,000
0–24 25–34 35–44 45–54 55–64 65+ 0–24 25–34 35–44 45–54 55–64 65+
Age group (years) and sex
Indigenous Australians
Non-Indigenous Australians
Males Females

19
What are the risk factors for coronary heart disease? The development of coronary heart disease is usually associated with a number of risk factors. The major preventable biomedical and behavioural risk factors include tobacco smoking, high blood pressure, high blood cholesterol, insufficient physical activity, overweight and obesity, poor nutrition and diabetes. Socioeconomic disadvantage and psychosocial factors, including depression, social isolation and lack of social support have also been identified as risk factors for coronary heart disease (AIHW: Mathur et al. 2006; AIHW 2004).
How many Indigenous Australians have coronary heart disease? In 2004–05, based on results from the NATSIHS: • an estimated 5,800 (or 1.2%) Aboriginal and Torres Strait Islander peoples had coronary
heart disease • nearly two-thirds (62%) of Indigenous Australians with coronary heart disease had angina
and around one-third had had a heart attack • coronary heart disease was most common among the older Aboriginal and Torres Strait
Islander population, increasing from 5% among Indigenous Australians aged 45–64 years to 11% in those aged 65 years and over (Table 4.3).
Table 4.3: Prevalence of coronary heart disease in Aboriginal and Torres Strait Islander peoples, by age group and sex, 2004–05
Age group (years) All ages(a)
Sex 25–44 45–64 65+ Total SPR(b)
Males
Per cent *1.1 4.3 *15.3 1.2 . .
Rate ratio *2.9 +1.6 *+1.4 . . 1.7
Females
Per cent *0.6 *6.4 *7.2 1.2 . .
Rate ratio *5.5 *5.1 *+1.0 . . 2.7
Persons
Per cent 0.9 5.4 10.8 1.2 . .
Rate ratio 3.4 2.8 +1.2 . . 2.1
* Estimate has a relative standard error of 25% to 50% and should be interpreted with caution.
+ Rate ratios not statistically different from 1.0. That is, rates for Indigenous Australians are not significantly different from rates for non-Indigenous Australians.
(a) Includes those aged under 25 years.
(b) SPR (standardised prevalence ratio) is the ratio of the observed number of cases to the number of expected cases if Indigenous Australians had experienced the same age–sex-specific prevalence rates as non-Indigenous Australians.
Notes
1. Based on self-reported data.
2. See Appendix 2, Table A2.4 for detailed information.
Source: AIHW analysis of the ABS 2004–05 NATSIHS CURF.

20
Disparity between Indigenous and non-Indigenous Australians In 2004–05, after adjusting for differences in the age structure of the two populations, the age-standardised prevalence rate for coronary heart disease in Indigenous Australians was twice as high as that for non-Indigenous Australians (Table 4.3). In males, the disparity was 1.7 times as high as in non-Indigenous males and was even greater among females, at nearly 3 times as high as in non-Indigenous females.
How many Indigenous Australians die from coronary heart disease? Coronary heart disease was the leading cause of death among Aboriginal and Torres Strait Islander peoples in Queensland, Western Australia, South Australia and the Northern Territory. Between 2002 and 2005, in the four jurisdictions:
• coronary heart disease was the underlying cause of 894 deaths, accounting for 15% of all deaths or over half (58%) of deaths from cardiovascular disease
• heart attack accounted for nearly half (48%) of the deaths from coronary heart disease, the other half were from other complications and manifestations of coronary heart disease.
After adjusting for age, Indigenous males were nearly twice as likely as females to die from coronary heart disease, with the age-specific death rates of males aged 25–64 years being two to nearly 4 times as high as those of females.
Disparity between Indigenous and non-Indigenous Australians Indigenous Australians were more likely to die from coronary heart disease and at younger ages than non-Indigenous Australians (Figure 4.4).
Notes
1. Data are for Indigenous deaths for usual residents of Queensland, Western Australia, South Australia and Northern Territory.
2. Deaths are based on year of occurrence of death for 2002–2004 and year of registration of death for 2005.
Source: AIHW National Mortality Database.
Figure 4.4: Deaths from coronary heart disease, by Indigenous status and age group, 2002–2005
Num ber per 100,000 population
0
200
400
600
800
1,000
1,200
1,400
1,600
0–24 25–34 35–44 45–54 55–64 65+ 0–24 25–34 35–44 45–54 55–64 65+
Age group (years) and sex
Indigenous Australians
Non-Indigenous Australians
Males Fem ales

21
Between 2002 and 2005, in the four jurisdictions, Indigenous Australians were twice as likely to die from coronary heart disease as non-Indigenous Australians. The highest disparities were in the 25–34 year age group for men, at 15.9 times as high as non-Indigenous men, and in the 35–44 year age group for women at 21.3 times as high.
The high disparity in death rates from coronary heart disease may be attributed to several factors. Aboriginal and Torres Strait Islander peoples are considerably more likely to suffer a heart attack, to die from it without being admitted to hospital, and to die from it if admitted to hospital (AIHW: Mathur et al. 2006). In hospital, they are less likely to receive key medical treatment procedures, such as coronary bypass surgery or angioplasty. These disparities in use of procedures to treat Aboriginal and Torres Strait Islander peoples in hospitals have been confirmed by other studies (Coory & Walsh 2005; Cunningham 2002).
Cerebrovascular disease Cerebrovascular disease is one of the leading causes of death among Aboriginal and Torres Strait Islander peoples (Hayman 1997). Indigenous Australians experience death rates from this condition that are nearly double those for non-Indigenous Australians; they also experience it at younger ages (Pepper et al. 2006; Thrift & Hayman 2007). The prevalence rate of cerebrovascular disease in Indigenous Australians is nearly double that for non-Indigenous Australians.
What is cerebrovascular disease? Cerebrovascular disease includes any disease that affects the blood vessels that supply blood to the brain. These include stroke, transient ischaemic attack and others. Stroke is the most common form of cerebrovascular disease. There are two main forms of stroke: ischaemic stroke occurs when a blood vessel to the brain is suddenly blocked due to a blood clot and/or cholesterol build-up; and haemorrhagic stroke, which is caused by a blood vessel suddenly rupturing and bleeding within the brain. Both these events may result in part of the brain dying from lack of oxygen, leading either to death or brain damage and the loss of some sensory or motor functions, such as movement, thinking and communication (AIHW: Senes 2006). Ischaemic strokes are more common, occurring more than 5 times as often as haemorrhagic strokes. However, haemorrhagic strokes have a much higher fatality rate, with the majority of survivors having severe long-term disabilities (AIHW 2004). Transient ischaemic attack is another less severe form of cerebrovascular disease. This produces temporary (less than 24 hours) symptoms similar to those of stroke.
What are the risk factors for cerebrovascular disease? The risk of cerebrovascular disease, in particular stroke, increases with the presence of one or more of the following risk factors: previous transient ischaemic attack, high blood pressure, tobacco smoking, diabetes, excessive alcohol consumption, high blood cholesterol, insufficient physical activity, poor nutrition, atrial fibrillation (an irregular rapid heart rhythm), and narrowing of the carotid arteries that supply blood to the brain (AIHW: O’Brien 2005). Besides the modifiable and behavioural risk factors, socioeconomic factors are also likely to increase the risk of developing the condition, particularly among Aboriginal and Torres Strait Islander peoples (Thrift & Hayman 2007).

22
How many Aboriginal and Torres Strait Islander peoples have cerebrovascular disease? In 2004–05, based on results from the NATSIHS, the prevalence of cerebrovascular disease in Aboriginal and Torres Strait Islander peoples was: • around 0.3%, corresponding to an estimated 1,400 people • similar for men and women, after adjusting for age. Note that estimates for
cerebrovascular disease in Indigenous men have a relative standard error of 25% to 50% and should be interpreted with caution.
Disparity between Indigenous and non-Indigenous Australians After adjusting for differences in the age structure of the two populations, the prevalence rate of cerebrovascular disease in Indigenous Australians was: • nearly twice (1.7 times) as high as in non-Indigenous Australians • more common in Indigenous women, at 1.9 times as high as for non-Indigenous women • in men, similar to the prevalence rate in non-Indigenous men (Table 4.4). Note that
estimates for cerebrovascular disease in Indigenous men have a relative standard error of 25% to 50% and should be interpreted with caution.
Cerebrovascular disease affected Indigenous Australians at a younger age than their non-Indigenous counterparts—80% of cases were in Indigenous Australians aged 25–64 years whereas for non-Indigenous Australians, around 66% of cases were in those aged 65 years and over.
Table 4.4: Prevalence of cerebrovascular disease in Aboriginal and Torres Strait Islander peoples, by sex, 2004–05
Sex Per cent SPR(a)
Males *0.3 *+1.5
Females 0.3 1.9
Persons 0.3 1.7
* Estimate has a relative standard error of 25% to 50% and should be interpreted with caution.
+ Standardised prevalence ratios not statistically different from 1.0. That is, rates for Indigenous Australians are not significantly different from rates for non-Indigenous Australians.
(a) SPR (standardised prevalence ratio) is the ratio of the observed number of cases to the number of expected cases if Indigenous Australians had experienced the same age–sex-specific prevalence rates as non-Indigenous Australians.
Notes
1. Based on self-reported data.
2. See Appendix 2, Table A2.5 for detailed information.
Source: AIHW analysis of the ABS 2004–05 NATSIHS CURF.
How many Indigenous Australians die from cerebrovascular disease? Cerebrovascular disease was a major cause of death among Aboriginal and Torres Strait Islander peoples in Queensland, Western Australia, South Australia and the Northern Territory. Between 2002 and 2005, cerebrovascular disease accounted for 4% (243 deaths) of deaths from all causes and 16% of deaths from cardiovascular disease. The age-adjusted death rates were similar for males and females.
23
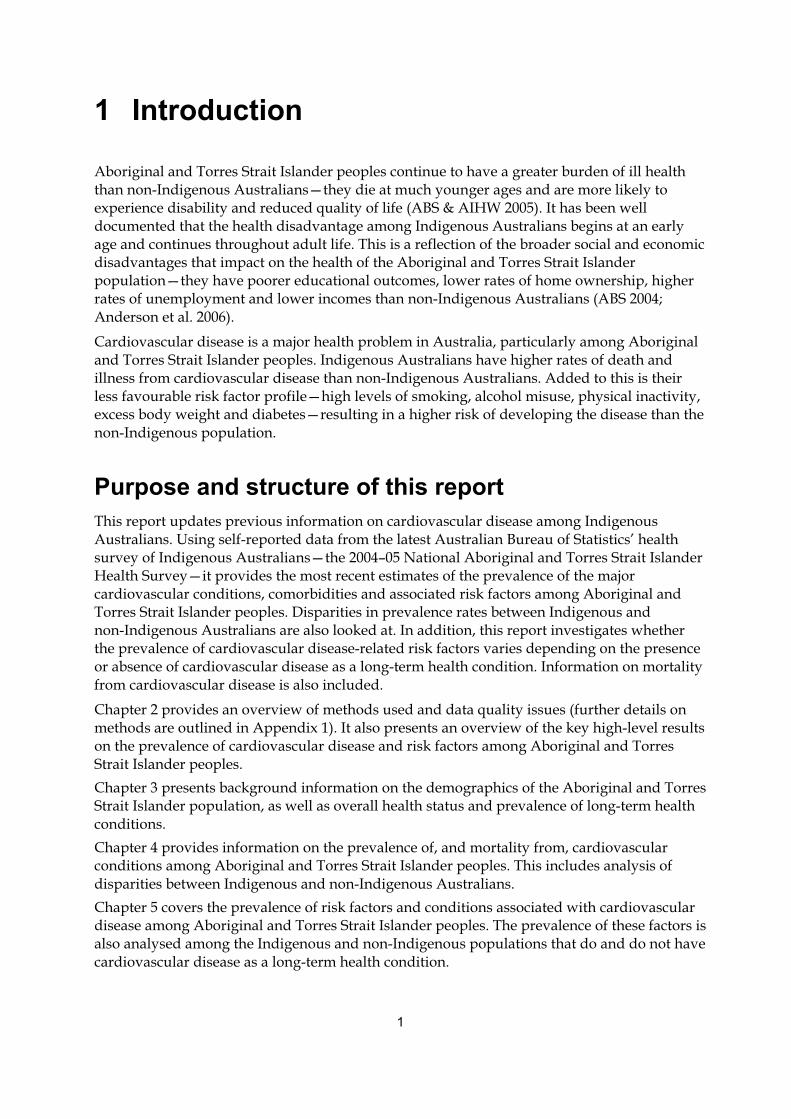
Males and females exhibited different age-specific death rate patterns for cerebrovascular disease. In males, from the age of 35–44 years, the death rate increased steadily with age. For females, death rates increased more gradually with age, with 58% of deaths occurring among those aged 65 years and over—this is similar to the non-Indigenous population (Figure 4.5).
Notes
1. Data are for Indigenous deaths for usual residents of Queensland, Western Australia, South Australia and Northern Territory.
2. Deaths are based on year of occurrence of death for 2002–2004 and year of registration of death for 2005.
Source: AIHW National Mortality Database.
Figure 4.5: Deaths from cerebrovascular disease, by Indigenous status and age group, 2002–2005
Disparity between Indigenous and non-Indigenous Australians Between 2002 and 2005, after adjusting for differences in the age structure of the two populations in the four jurisdictions, the death rates from cerebrovascular disease for Indigenous Australians were: • twice as high as for non-Indigenous males and females • particularly different in middle-aged people, with death rates in males aged 25–64 years
being 3 to 8 times as high as those of non-Indigenous Australians; while for females the corresponding disparity was 4 to 7 times as high.
Heart failure Heart failure is a major cause of illness and death among Aboriginal and Torres Strait Islander peoples. The prevalence of heart failure in Indigenous Australians was nearly twice as high as in non-Indigenous Australians, but just as common in males and in females of the two populations. Nearly double the proportion of Indigenous Australians die from heart failure compared with non-Indigenous Australians.
Number per 100,000 population
0
100
200
300
400
500
600
700
0–24 25–34 35–44 45–54 55–64 65+ 0–24 25–34 35–44 45–54 55–64 65+
Age group (years) and sex
Indigenous Australians
Non-Indigenous Australians
Males Females

24
What is heart failure? Heart failure occurs when the heart functions less effectively in pumping blood throughout the body. The condition develops progressively and is caused by a variety of diseases and conditions that damage or overload the heart. Eventually the heart becomes less able to cope with the increased load, and works less effectively, resulting in build-up or congestion of fluid (oedema) and reduced blood flow to the body. Heart failure is a life-threatening and chronic condition usually associated with poor survival (AIHW: Field 2003).
What is heart failure in this report? The 2004–05 NATSIHS CURF has combined prevalence estimates for heart failure with estimates for oedema. Oedema is the accumulation of excess fluid, mainly water, in an organ or tissue, causing it to swell. This condition may be caused by a wide range of factors, such as burns, pregnancy, hormones, high salt intake or the body’s reaction to hot weather. It is also one of the symptoms of heart failure, due to the heart’s inability to pump blood efficiently throughout the body, causing a build-up of fluid in the tissues, as well as a symptom of other serious conditions, such as kidney disease and liver disease. In this report, estimates for heart failure and oedema are referred to simply as ‘heart failure’.
What are the risk factors for heart failure? Heart failure commonly develops from conditions that impact on the heart, notably heart attack, coronary heart disease, hypertension or a damaged heart valve. Other associated risk factors include diabetes and excessive alcohol intake.
How many Aboriginal and Torres Strait Islander peoples have heart failure? From self-reported information in the 2004–05 NATSIHS, the estimated prevalence rate of heart failure as a long-term health condition was: • 1%, equating to an estimated 4,500 Indigenous Australians (Table 4.5) • more common in women, at 1.9 times as likely as in men after adjusting for age. Note that
estimates for heart failure in Indigenous men have a relative standard error of 25% to 50% and should be interpreted with caution.
Table 4.5: Prevalence of heart failure in Aboriginal and Torres Strait Islander peoples, by age group and sex, 2004–05
Sex Per cent SPR(a)
Males *0.6 *+1.9
Females 1.3 +1.6
Persons 1.0 1.7
* Estimate has a relative standard error of 25% to 50% and should be interpreted with caution.
+ Standardised prevalence ratios not statistically different from 1.0. That is, rates for Indigenous Australians are not significantly different from rates for non-Indigenous Australians.
(a) SPR (standardised prevalence ratio) is the ratio of the observed number of cases to the number of expected cases if Indigenous Australians had experienced the same age–sex-specific prevalence rates as non-Indigenous Australians.
Notes
1. Based on self-reported data.
2. See Appendix 2, Table A2.6 for detailed information.
Source: AIHW analysis of the ABS 2004–05 NATSIHS CURF.

25
Disparity between Indigenous and non-Indigenous Australians After adjusting for differences in the age structure of the Indigenous and non-Indigenous populations, the age-standardised prevalence rate for heart failure was: • 1.7 times as high as for non-Indigenous Australians • not significantly different for men and women in the two populations (Table 4.5). Note
that estimates for heart failure in Indigenous men have a relative standard error of 25% to 50% and should be interpreted with caution.
How many Indigenous Australians die from heart failure? Between 2002 and 2005, in Queensland, Western Australia, South Australia and the Northern Territory, among Aboriginal and Torres Strait Islander peoples: • heart failure accounted for 44 deaths—0.8% of deaths overall • age-adjusted death rates for heart failure were similar for men and women • deaths occurred mainly among the older age groups, with the age-specific death rates
being highest for men and women aged 65 years and over.
Disparity between Indigenous and non-Indigenous Australians After adjusting for differences in the age structure of the two populations in the four jurisdictions, in 2002–2005, the death rate from heart failure was: • over twice as high in Indigenous Australians as non-Indigenous Australians • more common in older people aged 65 years and over. However, death rates were also
high among middle-aged Indigenous Australians, with the rate in the 45–64 year age group being 6.4 times as high as for non-Indigenous Australians (Figure 4.6).
Number per 100,000 population
0
20
40
60
80
100
120
140
160
0–24 25–34 35–44 45–54 55–64 65+
Age group (years)
Indigenous Australians
Non-Indigenous Australians
Notes
1. Data are for Indigenous deaths for usual residents of Queensland, Western Australia, South Australia and Northern Territory.
2. Deaths are based on year of occurrence of death for 2002–04 and year of registration of death for 2005.
Source: AIHW National Mortality Database.
Figure 4.6: Deaths from heart failure, by Indigenous status and age group, 2002–2005

26
Hypertension Hypertension is the most common form of cardiovascular disease among Aboriginal and Torres Strait Islander peoples (ABS & AIHW 2005; Hayman 1997). As a proportion of the population, more Indigenous Australians have this condition than non-Indigenous Australians, with age-specific prevalence rates 1.5 to 2.5 times as high as those experienced by non-Indigenous Australians in the population aged 25–64 years. Hypertension is not a common direct cause of death, but it is a major risk factor for other fatal diseases, such as coronary heart disease, stroke, heart failure, peripheral vascular disease and kidney failure. The risk of developing these diseases increases as the level of blood pressure increases (AIHW 2004).
What is hypertension? Hypertension is the common name for prolonged elevation of the blood pressure. This has an impact on the heart, causing it to work harder, and slowly become enlarged and weakened (AIHW 2004). Blood pressure is the force exerted by blood on the walls of the blood vessels and is measured as systolic/diastolic. The systolic blood pressure is the highest pressure in the arteries when the heart muscle contracts to pump blood. Diastolic blood pressure is the lowest pressure in the arteries when the heart muscle relaxes. The World Health Organization defines high blood pressure as: • systolic blood pressure of 140mmHg or more • diastolic blood pressure of 90mmHg or more • receiving medication for high blood pressure. Source: WHO–ISH 1999.
What are the risk factors for hypertension?
Hypertension is associated with various lifestyle factors, such as insufficient physical activity, high salt intake, overweight and obesity and excessive alcohol consumption. However, as increased blood pressure levels have a strong relationship with the risk of cardiovascular disease, hypertension is itself considered a risk factor in the development of cardiovascular diseases, such as coronary heart disease, stroke and heart failure.
How many Aboriginal and Torres Strait Islander peoples have hypertension? Based on self-reported information in the 2004–05 NATSIHS, the prevalence of hypertension as a long-term health condition in the Aboriginal and Torres Strait Islander population was: • around 7%, equating to an estimated 33,600 people • similar in both men and women, after adjusting for age • more common in older Indigenous Australians with nearly half of those aged 65 years and
over having the condition, 6 times as high as the 8% in those aged 25–44 years (Table 4.6).

27
Disparity between Indigenous and non-Indigenous Australians After adjusting for differences in the age structure of the two populations, the prevalence of hypertension among Indigenous Australians was: • 1.6 times as high as for non-Indigenous Australians (Table 4.6) • 1.5 times and 1.7 times as high as in non-Indigenous males and females, respectively.
Aboriginal and Torres Strait Islander peoples were more likely to have hypertension from a younger age than non-Indigenous Australians. Indigenous Australians aged 25–44 years had hypertension at a rate 2.2 and 2.8 times as high as that in non-Indigenous males and females, respectively.
Table 4.6: Prevalence of hypertension in Aboriginal and Torres Strait Islander peoples, by age group and sex, 2004–05
Age group (years) All ages(a)
Sex 25–44 45–64 65+ Total SPR(b)
Males
Per cent 8.4 25.0 44.2 6.4 . .
Rate ratio 2.2 1.3 1.2 . . 1.5
Females
Per cent 7.4 30.4 49.3 7.7 . .
Rate ratio 2.8 1.6 1.2 . . 1.7
Persons
Per cent 7.8 27.8 47.1 7.1 . .
Rate ratio 2.5 1.5 1.2 . . 1.6
(a) Includes those aged less than 25 years.
(b) SPR (standardised prevalence ratio) is the ratio of the observed number of cases to the number of expected cases if Indigenous Australians had experienced the same age–sex-specific prevalence rates as non-Indigenous Australians.
Notes
1. Based on self-reported data.
2. All rate ratios are statistically significantly different from rates for non-Indigenous Australians.
3. See Appendix 2, Table A2.7 for detailed information.
Source: AIHW analysis of the ABS 2004–05 NATSIHS CURF.
Rheumatic fever and rheumatic heart disease Acute rheumatic fever and rheumatic heart disease are major conditions among Aboriginal and Torres Strait Islander peoples, with rates among the highest in the world. Those living in remote areas of Australia are particularly affected (Carapetis & Currie 1998; Carapetis et al. 1996). As acute rheumatic fever and subsequent rheumatic heart disease are linked with conditions associated with low socioeconomic status and poor access to adequate preventive medical care, they are both highly preventable causes of illness and death (Steer et al. 2002; Stollerman 1997).

28
What is rheumatic fever and rheumatic heart disease? Rheumatic heart disease is a serious complication resulting from long-term damage of the heart valves and heart muscles caused by acute rheumatic fever. Acute rheumatic fever is an inflammatory disease and commonly arises due to an untreated Group A streptococcus bacterial infection in the throat. There is ongoing investigation of the possibility that it may also be caused by streptococcal skin sores (Carapetis & Currie 1998). Those most at risk are children and young adults. It can affect the heart valves, the heart muscle and its lining, and the connective tissue throughout the body, joints and brain (AIHW: Field 2004).
What are the risk factors for rheumatic fever and rheumatic heart disease? Both acute rheumatic fever and rheumatic heart disease are commonly associated with poor living conditions, such as poor hygiene, overcrowding, lack of adequate clean water and proper sewerage facilities (Carapetis & Currie 1998). Lack of education and limited access to appropriate medical care have also been identified as contributing factors (Steer et al. 2002). Children and young adults are most at risk of developing acute rheumatic fever, which, without appropriate treatment and prevention of repeated episodes, can result in rheumatic heart disease.
How many Aboriginal and Torres Strait Islander peoples have rheumatic heart disease? Based on self-reports from the 2004–05 NATSIHS, the prevalence of rheumatic heart disease as a long-term condition in Aboriginal and Torres Strait Islander peoples was: • about 0.7%, corresponding to around 3,500 Indigenous Australians (see Appendix 2, Table
A2.8 for estimates of prevalence of rheumatic heart disease) • nearly 3 times as high in women as in men, after adjusting for age. Note that estimates for
rheumatic heart disease in Indigenous men have a relative standard error of 25% to 50% and should be interpreted with caution.
Registers of people with known or suspected acute rheumatic fever and rheumatic heart disease have been established in the Top End of the Northern Territory since 1997 and in Central Australia since 2002. These registers provide valuable information on the prevalence and incidence of the conditions in these locations. This information is presented below (see Chapter 2 for more information on these data sources).
What is the incidence of acute rheumatic fever among Aboriginal and Torres Strait Islander peoples? Between 2002 and 2006, there were 350 new or recurrent cases of acute rheumatic fever in the Top End of the Northern Territory (222 cases) and Central Australia (128 cases). Of these, all but 4 cases in the Top End and all those in Central Australia were Aboriginal and Torres Strait Islander peoples. In the Top End of the Northern Territory register, 27% of cases were recurrences, and all but one case were in Indigenous Australians. In the Central Australian register, 30% of cases were recurrences. The crude incidence rate of acute rheumatic fever among Indigenous Australians was around 1.1 per 1,000 population in the Top End and 1.4 per 1,000 population in Central Australia (Table 4.7).
Over half (57%) of new and recurrent cases of acute rheumatic fever in Indigenous Australians were in women (1.4 per 1,000 women) and 43% in men (1.0 per 1,000 men).

29
For the 5-year period 2002–2006, in the Top End of the Northern Territory and Central Australia, acute rheumatic fever in children aged 5–14 years: • accounted for over half (55%) of all new cases in Indigenous Australians • had a crude incidence rate of around 2.3 per 1,000 Indigenous boys and
3.4 per 1,000 Indigenous girls • accounted for one reported case in non-Indigenous children.
Cases of acute rheumatic fever were also rare in children aged under 5 years.
What is the prevalence of rheumatic heart disease among Aboriginal and Torres Strait Islander peoples? As at 31 December 2006, there were 1,053 cases of rheumatic heart disease in the Top End of the Northern Territory and 349 cases in Central Australia. Nearly all cases (91% and 94%, respectively) were in Indigenous Australians. The crude prevalence rate of rheumatic heart disease among Aboriginal and Torres Strait Islander peoples was 24.8 per 1,000 population in the Top End and 18.1 per 1,000 population in Central Australia (Table 4.7).
In both registers, the crude prevalence rate for rheumatic heart disease in Indigenous Australians was: • higher in women than men—29.6 per 1,000 women and 15.7 per 1,000 men • high in the 15–44 year age group—8.8 to 34.0 per 1,000 population—accounting for 60% of
cases.
Table 4.7: Incidence(a) of acute rheumatic fever and prevalence of rheumatic heart disease in Aboriginal and Torres Strait Islander peoples, by sex
Acute rheumatic fever Rheumatic heart disease
Number(b) Crude rate(c) (95% CI) Number(d) Crude rate(e) (95% CI) SPR(f)
Top End of the Northern Territory
Males 103 1.1 (0.6–1.5) 332 17.1 (15.2–18.9) 33.2
Females 115 1.2 (0.7–1.7) 627 32.5 (30.0–35.0) 35.6
Persons 218 1.1 (0.8–1.5) 959 24.8 (23.2–26.3) 34.7
Central Australia
Males 45 1.0 (0.3–1.6) 116 12.8 (10.5–15.2) 23.5
Females 83 1.8 (0.9–2.7) 213 23.4 (20.3–26.6) 34.4
Persons 128 1.4 (0.9–2.0) 329 18.1 (16.2–20.1) 29.6
(a) Includes new and recurrent cases of acute rheumatic fever.
(b) Over the period 2002–2006.
(c) Crude rate per 1,000 population for each region using the average number of registrations over the period 2002–2006 divided by the 2001 estimated resident Indigenous population for the Top End and for Central Australia.
(d) Number of cases as at 31 December 2006.
(e) Crude rate per 1,000 population for each region using the 2001 estimated Indigenous population for the Top End and for Central Australia.
(f) SPR (standardised prevalence ratio) is the ratio of the observed number of cases to the number of expected cases if Indigenous Australians had experienced the same age–sex-specific prevalence rates as non-Indigenous Australians.
Note: All standardised prevalence ratios are statistically significantly different from rates for non-Indigenous Australians.
Source: Top End Rheumatic Heart Disease Register; Central Australian Rheumatic Heart Disease Register.

30
Disparity between Indigenous and non-Indigenous Australians After adjusting for age differences in the age structure of the two populations, the rheumatic heart disease prevalence rate for Indigenous Australians was 34.7 times and 29.6 times as high as for non-Indigenous Australians from the Top End of the Northern Territory and Central Australia registers, respectively (Table 4.7).
How many Aboriginal and Torres Strait Islander peoples die from rheumatic fever and rheumatic heart disease? Between 2002 and 2005 in Queensland, Western Australia, South Australia and the Northern Territory, in Indigenous Australians, death from rheumatic fever and rheumatic heart disease was: • the underlying cause of 72 deaths (1.2% of deaths overall) • more common in women—2.3 times as high as in men, after adjusting for age. Older
women aged 65 years and over had the greatest difference in age-specific death rates, at around eight times as high as for men
• common in the 35–54 year age group, where nearly half of the deaths occurred—43% and 45% among men and women, respectively.
Disparity between Indigenous and non-Indigenous Australians In 2002–2005, after adjusting for differences in the age structure of the two populations, Indigenous males and females were far more likely to die from rheumatic fever and rheumatic heart disease than non-Indigenous Australians, at 15.1 and 23.0 times, respectively, in the four jurisdictions (Figure 4.7).
Notes
1. Data are for Indigenous deaths for usual residents of Queensland, Western Australia, South Australia and Northern Territory.
2. Deaths are based on year of occurrence of death for 2002–2004 and year of registration of death for 2005.
Source: AIHW National Mortality Database.
Figure 4.7: Deaths from rheumatic fever and rheumatic heart disease, by Indigenous status and age group, 2002–2005
Number per 100,000 population
0
10
20
30
40
50
60
70
80
90
0–24 25–34 35–44 45–54 55–64 65+ 0–24 25–34 35–44 45–54 55–64 65+
Age group (years) and sex
Indigenous Australians
Non-Indigenous Australians
Males Females

31
Summary and conclusion
Cardiovascular disease prevalence and deaths in Indigenous Australians In 2004–05, around one in eight Indigenous Australians had cardiovascular disease as a long-term condition. The prevalence of cardiovascular disease among Aboriginal and Torres Strait Islander peoples has not changed between 2001 and 2004–05 (AIHW 2007). In 2004–05, the disease was more common in Indigenous women than men. Hypertension was the most common cardiovascular condition, present in around 7% of the Indigenous population. This was followed by coronary heart disease (1.2%), heart failure (1.0%), rheumatic heart disease (0.7%) and cerebrovascular disease (0.3%).
Although mortality rates for cardiovascular disease continue to fall among Indigenous Australians, it is still the leading cause of death, accounting for over one-quarter (27%) of all Indigenous deaths between 2002 and 2005 (based on data from Queensland, Western Australia, South Australia and the Northern Territory, which have adequate identification of Indigenous deaths). The most common cardiovascular condition causing death was coronary heart disease, accounting for 17% of all deaths in males and 13% of all deaths in females; this was followed by cerebrovascular disease—3% and 5%, respectively.
Disparities between Indigenous and non-Indigenous Australians The disparity in prevalence rates for cardiovascular disease among Indigenous Australians compared with non-Indigenous Australians has not changed from 2001 to 2004–05. However, between 2002 and 2005, the disparity between death rates has reduced.
In 2004–05, cardiovascular disease was not only more common among Indigenous Australians, with a prevalence rate 1.3 times as high as in non-Indigenous Australians, it was prevalent at rates similar to those of non-Indigenous Australians who were 10 years older. These disparities were also seen in results from the 2001 National Health Survey (ABS 2002b). In 2004–05, the disparity between the Indigenous and non-Indigenous populations was greatest for coronary heart disease, followed by cerebrovascular disease, heart failure and hypertension.
Between 2002 and 2005, Aboriginal and Torres Strait Islander peoples continued to have higher death rates from cardiovascular disease than non-Indigenous Australians—3 times as high as in non-Indigenous Australians. Indigenous Australians were more likely to die from cardiovascular disease than non-Indigenous Australians, with the difference especially marked in those aged under 65 years, at between 5 and 12 times as high.
As much of the morbidity and mortality caused by cardiovascular disease is preventable, the persisting disparities in the prevalence and mortality rates from cardiovascular disease between Indigenous and non-Indigenous Australians highlight the fact that Indigenous Australians still suffer considerable health disadvantages from cardiovascular disease. In Australia, overall cardiovascular disease mortality rates have been declining significantly over the past 20–30 years (ABS 2002a). But only in the past 5 years has there been any significant decline in mortality rates from cardiovascular disease among Indigenous Australians in the Northern Territory, Western Australia and South Australia. Although this decline has narrowed the gap in rates between Indigenous and non-Indigenous Australians, the need to reduce it further remains.

32
5 Risk factors and conditions associated with cardiovascular disease
Risk factors are characteristics that can impact on the onset, progression and prognosis of chronic diseases and quality of life. For many chronic diseases, as the number of risk factors increases, so does the negative impact on the individual’s health (AIHW 2006a; AIHW: O’Brien 2005). Similarly, the more severe the risk factor, the higher the risk of developing chronic disease; for example, as blood pressure levels increase, so too does the likelihood of a person developing cardiovascular disease (AIHW: O’Brien 2005; NHFA 2003)
Many risk factors are modifiable, and so provide opportunities to prevent and manage the progression of a condition, as well as reduce the risk of developing further complications. Monitoring the prevalence and patterns of these risk factors can explain trends in health and why some sub-population groups have better or worse health than others. Analysing past trends in risk factors also provides an opportunity for researchers and policy makers to predict future trends, and in doing so, develop policies and programs for prevention and intervention.
Some risk factors are non-modifiable, such as age or gender, and help identify the profile of sub-population groups who are most at risk. They are also important factors to consider to ensure intervention and management strategies are appropriate for the intended population.
What are the modifiable risk factors for cardiovascular disease? Several factors contribute to an increase in risk of developing cardiovascular disease. These include behavioural and biomedical (physiological) risk factors as well as other influences, such as age, sex and a family history of cardiovascular disease. The major preventable and modifiable risk factors for cardiovascular disease presented in this report are: Behavioural factors • tobacco smoking • physical inactivity • poor nutrition • risky alcohol consumption. Biomedical factors • hypertension • overweight and obesity • diabetes • chronic kidney disease. Diabetes and chronic kidney disease are both risk factors for cardiovascular disease, as well as being diseases in their own right. Hypertension is also a condition of the circulatory system itself, but the strong relationship between increased blood pressure levels and the risk of developing other forms of cardiovascular disease, such as coronary heart disease and stroke, establish it as a risk factor as well.

33
Behavioural risk factors are based on an individual’s behaviour, such as tobacco smoking, but it is also widely acknowledged that they can be influenced by other underlying social, economic, psychological and cultural factors (ABS & AIHW 2005; AIHW 2004).
Biomedical risk factors are derived from body measurements; an example of this is excess weight. Their presence and severity can be reduced by the person changing their own behaviour, lifestyle or use of medical interventions (AIHW 2006b).
The risk factor profile of Aboriginal and Torres Strait Islander peoples is one reason why they have considerably higher levels of illness and death from cardiovascular disease than non-Indigenous Australians (AIHW 2004). Not only is the prevalence of a range of behavioural and biomedical risk factors high among Indigenous Australians, they are also likely to experience other broad factors that have been recognised as important contributors to the development of cardiovascular disease. These include environmental and socioeconomic factors, such as poor housing, low income and poverty, and psychosocial stressors, such as the death of a family member or close friend, serious illness or disability, and inability to get a job (ABS & AIHW 2005; Bunker et al. 2003; Marmot 2005; van Holst Pellekaan & Clague 2005). Cultural factors, including the loss of land, culture, language and identity, racism and the loss of opportunity have also been identified as barriers to access appropriate treatment and health services (Brown 2004; Thrift & Hayman 2007).
This chapter presents data on modifiable behavioural and biomedical risk factors that contribute to the risk of developing cardiovascular disease. It also investigates the association between individual risk factors and the presence or absence of cardiovascular disease as a long-term condition in the Aboriginal and Torres Strait Islander population. Analysis of these risk factors by age group and sex was done where data were of sufficient quality. Comparisons of results for the Indigenous to non-Indigenous Australian population are also included.
How many Indigenous Australians have a risk factor for cardiovascular disease? An estimated 134,000 Aboriginal and Torres Strait Islander peoples aged 18 years and over lived in non-remote areas in 2004–05, adjusting for those who did not provide height or weight measurements. Nearly all (132,000 or about 99%) had at least one of the following risk factors: tobacco smoking, risky/high-risk alcohol consumption, hypertension, low fruit consumption, low vegetable consumption, sedentary levels of physical activity, obesity, diabetes and long-term kidney disease. There was no statistically significant difference between males and females.
The presence of multiple risk factors, which can considerably increase the risk of developing cardiovascular disease, was common among Indigenous Australians. In 2004–05, proportions of Indigenous Australians aged 18 years and over with multiple risk factors were: • 53% with three or four risk factors • 13% with five or more risk factors.
Across all age groups, the most common number of risk factors present was three or four, ranging from 49% to 54% in men and from 46% to 59% in women. The estimated prevalence of five or more risk factors was highest in males aged 45–54 years (21%) and in females aged 35–44 years (20%).

34
Disparity between Indigenous and non-Indigenous Australians Aboriginal and Torres Strait Islander peoples had a higher number of coexisting risk factors compared with non-Indigenous Australians (Figure 5.1). In 2004–05, after adjusting for differences in the age structure of the two populations, Indigenous Australians were: • 3.9 times as likely as non-Indigenous Australians to have five or more risk factors • 2.3 times as likely to have four risk factors • less likely to have one or two risk factors.
Notes 1. Based on self-reported data.
2. Risk factors include: daily tobacco smoking, risky/high-risk alcohol consumption, hypertension, low fruit consumption, low vegetable consumption, sedentary levels of physical activity, obesity, diabetes and long-term kidney disease.
3. In non-remote areas only.
4. Adjusted for survey non-response for height and weight measurements used to derive the body mass index.
5. Rate ratio of the observed number of cases to the number of expected cases if Indigenous Australians had experienced the same age-specific prevalence rates as non-Indigenous Australians.
6. A rate ratio of 1.0 indicates that there is no difference between rates experienced by the Indigenous and non-Indigenous populations.
7. Bars on column represent 95% confidence intervals.
Source: AIHW analysis of the ABS 2004–05 NATSIHS CURF.
Figure 5.1: Rate ratio for number of risk factors, Aboriginal and Torres Strait Islander peoples aged 18 years and over, 2004–05
0.0
0.5
1.0
1.5
2.0
2.5
3.0
3.5
4.0
4.5
5.0
One Tw o Three Four Five or more
Number of risk factors
Rate ratio

35
How many Indigenous Australians with and without long-term cardiovascular disease have a risk factor? Nearly all Aboriginal and Torres Strait Islander peoples had at least one risk factor regardless of whether they had long-term cardiovascular disease. However, Indigenous Australians with cardiovascular disease were more likely to have multiple risk factors, and were 1.8 times as likely to have five or more risk factors as those without the disease.
In Indigenous Australians with long-term cardiovascular disease… In 2004–05, adjusting for those who did not provide height or weight measurements, an estimated 30,000 Indigenous Australians aged 18 years and over in non-remote areas had cardiovascular disease. Nearly all (99.8%) had at least one of the risk factors. These include tobacco smoking, risky/high-risk alcohol consumption, low fruit consumption, low vegetable consumption, sedentary levels of physical activity, obesity, diabetes and long-term kidney disease.
On average, men with cardiovascular disease had a higher number of multiple risk factors than women. In 2004–05, among men, the most common number of risk factors was five or more, at 27%; for women, it was four (28%).
Disparity between Indigenous and non-Indigenous Australians After adjusting for differences in the age structure of the two populations, compared with non-Indigenous Australians, Aboriginal and Torres Strait Islander peoples with cardiovascular disease were: • just as likely to have at least one modifiable risk factor • more likely to have a greater number of multiple risk factors • 1.5 times as likely to have three or four risk factors • 4.7 times as likely to have five or more risk factors.
In Indigenous Australians without long-term cardiovascular disease… In 2004–05, after adjusting for those who did not provide height or weight measurements, an estimated 104,000 Indigenous Australians aged 18 years and over in non-remote areas did not have cardiovascular disease. Nearly all (98.7%) had at least one of the risk factors for cardiovascular disease.
For both men and women the number of risk factors most likely to be present was three— 28% and 27% in men and women, respectively.
Three or four risk factors were the most common numbers present for both men and women across each of the age groups from the age of 18 years.

36
Disparity between Indigenous and non-Indigenous Australians After adjusting for differences in the age structure of the Indigenous and non-Indigenous populations without cardiovascular disease, Aboriginal and Torres Strait Islander peoples were: • just as likely to have at least one risk factor • 1.5 times as likely to have three or four risk factors • 3.4 times as likely to have five or more risk factors—this difference was notably high
among females, at 5.4 times; for males the disparity was 2.5 times.
Disparity in prevalence of each risk factor between Indigenous and non-Indigenous Australians Based on results from the 2004–05 NATSIHS, nearly all the risk factors investigated were more prevalent among Aboriginal and Torres Strait Islander peoples compared with non-Indigenous Australians. After adjusting for differences in the age structure of the two populations, the disparities in prevalence of each risk factor in Indigenous Australians were: • diabetes—nearly 4 times as high as in non-Indigenous Australians • daily tobacco smoking—2.1 times • obesity—1.9 times • hypertension—1.6 times • sedentary levels of physical activity—1.5 times • low fruit consumption—1.2 times.
Low vegetable consumption was the only risk factor that had no statistically significant difference in prevalence between the Indigenous and non-Indigenous populations.
The pattern of disparity in prevalence of risk factors was similar for the populations with and without cardiovascular disease (Table 5.1).
In both Indigenous populations, disparities were highest for: • diabetes—3 times and 4 times as high as in non-Indigenous Australians with
cardiovascular disease and those without the disease, respectively. • daily tobacco smoking—2.4 times and 2.1 times as high in those with the disease and those
without the disease, respectively.
The consumption of inadequate daily servings of vegetables did not differ between Indigenous and non-Indigenous Australians with or without cardiovascular disease.

37
Table 5.1 Prevalence of risk factors among Aboriginal and Torres Strait Islander peoples with and without cardiovascular disease compared with non-Indigenous Australians, aged 18 years and over, 2004–05
Indigenous Australians with cardiovascular disease
Indigenous Australians without cardiovascular disease
Risk factor Number Per cent SPR(a) Number Per cent SPR(a)
Daily tobacco smoking 25,000 47.3 2.4 104,000 50.7 2.1
Physical inactivity(b)(c) 21,000 58.5 1.6 69,400 46.3 1.5
Low fruit consumption(b) 19,700 55.2 1.3 90,800 60.6 1.2
Low vegetable consumption(b) 32,100 89.6 +1.1 135,000 90.0 +1.0
Obesity(d) 19,500 43.8 1.6 48,100 27.6 1.9
Alcohol consumption(e) 8,500 16.0 +1.3 34,100 16.6 1.2
Diabetes 14,600 27.6 3.0 14,600 7.1 4.0
Long-term kidney disease(f) 4,100 7.9 . . 3,400 1.6 . .
+ Standardised prevalence ratios not statistically different from 1.0. That is, rates for Indigenous Australians are not significantly different from rates for non-Indigenous Australians.
(a) SPR (standardised prevalence ratio) is the ratio of the observed number of cases to the number of expected cases if Indigenous Australians either with or without cardiovascular disease had experienced the same age-specific prevalence rates as non-Indigenous Australians either with or without cardiovascular disease.
(b) In non-remote areas only.
(c) Sedentary levels of physical activity.
(d) Adjusted for survey non-response for height and weight.
(e) Alcohol consumption at the long-term risky/high-risk level.
(f) Information on long-term kidney disease is not available for non-Indigenous Australians from the 2004–05 NATSIHS.
Note: Based on self-reported data.
Source: AIHW analysis of the ABS 2004–05 NATSIHS CURF.
Tobacco smoking Tobacco smoking is the single greatest contributor to the burden of disease in Australia. It increases the risk of coronary heart disease and stroke, as well as a range of cancers and other diseases and conditions. The prevalence of current tobacco smoking among Aboriginal and Torres Strait Islander peoples is high, at around 50% among those aged 18 years and over, and is equally prevalent in men and women. Indigenous Australians are also twice as likely to be daily smokers as non-Indigenous Australians (Brown et al. 2005).
What is tobacco smoking? Tobacco smoking refers to the smoking of tobacco products, including cigarettes, pipes, cigars and other tobacco products. The impact of tobacco smoking on an individual’s health increases with the frequency and duration of tobacco smoking. In this report, ‘daily smokers’ refers to those who are current smokers and smoke regularly (at least one cigarette per day), and ‘occasional smokers’ refers to those who are current smokers but do not smoke regularly (less than once a day).

38
Why is tobacco smoking a risk factor for cardiovascular disease? Tobacco smoking damages both the heart and blood vessels. The nicotine in tobacco smoke damages the blood vessels by causing atherosclerosis, which is the build-up of hard, fatty substances (usually cholesterol), leading to the blood vessels narrowing. Tobacco smoke also includes other harmful chemicals like tar and carbon monoxide. This results in increased heart rate, irregular heart beats and reduction in the blood’s ability to carry oxygen which puts strain on the heart muscle and increases blood pressure. These chemicals also increase the risk of blood clots forming. Exposure to environmental (second-hand or passive) tobacco smoke is also strongly associated with risk of cardiovascular disease.
How many Aboriginal and Torres Strait Islander peoples smoke? Tobacco smoking is highly prevalent among Aboriginal and Torres Strait Islander peoples. Based on results from the 2004–05 NATSIHS, among Indigenous Australians aged 18 years and over, the prevalence of daily smoking was: • around half the population, corresponding to an estimated 129,000 people, another
2% smoking occasionally • similar in males and females, after adjusting for age • highest in those aged 25–44 years, and decreasing in the older age groups.
Around 20% of Indigenous Australians aged 18 years and over were former smokers, and a further 28% had never smoked. There was no statistically significant difference between sexes in the age-adjusted prevalence rates for former smokers. However, women were more likely than men to have never smoked, at a statistically significant 1.1 times as high.
Disparity between Indigenous and non-Indigenous Australians In 2004–05, after adjusting for differences in the age structure of the Indigenous and non-Indigenous populations, Aboriginal and Torres Strait Islander peoples were: • twice as likely to be daily smokers as non-Indigenous Australians—the disparity was
greater between females than males, at 2.4 and 1.9 times as high, respectively • more likely to smoke daily in every age group. The greatest difference in age-specific
smoking rates was among those aged 65 years and older, at 3.6 and 2.7 times as high as non-Indigenous males and females, respectively (Figure 5.2).
Compared with non-Indigenous Australians, Indigenous Australians were less likely to be former smokers or to have never smoked.
How many Indigenous Australians who smoke daily also have cardiovascular disease? In Indigenous Australians aged 18 years and over who smoked daily, cardiovascular disease as a long-term health condition was also present in: • nearly one-fifth (19%) • more females—1.5 times as high as males, after adjusting for age • increasing proportions of people as they got older (64% of people aged 65 years and over).

39
Per cent
0
10
20
30
40
50
60
18–24 25–44 45–64 65+ 18–24 25–44 45–64 65+
Age group (years)
Indigenous Australians
Non-Indigenous Australians
Males Females
Notes 1. Based on self-reported data.
2. See Appendix 2, Table A2.9 for detailed information.
Source: AIHW analysis of the ABS 2004–05 NATSIHS CURF.
Figure 5.2: Daily smokers, by Indigenous status and age group, persons aged 18 years and over, 2004–05
In Indigenous Australians with long-term cardiovascular disease… In 2004–05, among Indigenous Australians aged 18 years and over with cardiovascular disease as a long-term condition, daily smoking was: • prevalent in just under half (47%) of the population, corresponding to an estimated
25,000 people (Table 5.2) • common in both men and women. • common in those aged 25–34 years, with nearly two-thirds (64%) of this age group being
smokers. Daily smoking was also high among young people aged 18–24 years, at 57%.
In 2004–05, around one in four Indigenous Australians aged 18 years and over with cardiovascular disease were former smokers. Men were more likely to be former smokers than women—1.4 times as likely as women, after adjusting for age. A similar proportion of Indigenous Australians had never smoked regularly (26%); however, Indigenous women with cardiovascular disease were 1.3 times as likely as men to have never smoked.
Disparity between Indigenous and non-Indigenous Australians After adjusting for differences in the age structure of the Indigenous and non-Indigenous populations, prevalence rates for daily smoking in Indigenous Australians with cardiovascular disease were: • over twice (2.4 times) as high as in non-Indigenous Australians with cardiovascular
disease • higher in all age groups 25 years and above (Table 5.2). The greatest difference in rates
were among older people aged 65 years and over, at nearly 4 times as high.

40
Table 5.2: Prevalence of daily tobacco smoking among Aboriginal and Torres Strait Islander peoples with long-term cardiovascular disease, by age group and sex, 2004–05
Age group (years) 18 years and over
Sex 25–44 45–64 65+ Total SPR(a)
Males
Per cent 58.3 40.0 *35.2 47.3 . .
Rate ratio 2.1 2.2 *4.4 . . 2.3
Females
Per cent 61.5 44.0 *16.2 47.3 . .
Rate ratio 2.1 3.1 *3.3 . . 2.4
Persons
Per cent 60.3 42.4 24.4 47.3 . .
Rate ratio 2.1 2.6 3.9 . . 2.4
* Estimate has a relative standard error of 25% to 50% and should be interpreted with caution.
(a) SPR (standardised prevalence ratio) is the ratio of the observed number of cases to the number of expected cases if Indigenous Australians had experienced the same age–sex-specific prevalence rates as non-Indigenous Australians.
Notes
1. Based on self-reported data.
2. All rate ratios are statistically significantly different from rates for non-Indigenous Australians.
Source: AIHW analysis of the ABS 2004–05 NATSIHS CURF.
After adjusting for age, Indigenous Australians with cardiovascular disease were less likely to be former smokers or have never smoked than non-Indigenous Australians with cardiovascular disease.
In Indigenous Australians without long-term cardiovascular disease… The prevalence of daily smoking in Indigenous Australians aged 18 years and over without cardiovascular disease as a long-term condition was: • just over half (51%) of the population, with a further 2% smoking occasionally • similar for men and women, with no statistically significant difference in their
age-adjusted prevalence rates • highest among adults aged 25–44 years and lowest in the older age groups. This habit was
also common among young Indigenous Australians, with about half of those aged 18–24 years being daily smokers.
Over one in six Indigenous Australians aged 18 years and over without cardiovascular disease were former smokers (18%). A higher proportion (29%) had never smoked regularly. After adjusting for age, there was no statistically significant difference in the rates of men and women who were former smokers or had never smoked.
Disparity between Indigenous and non-Indigenous Australians After adjusting for age, the prevalence of daily smoking in Indigenous Australians without cardiovascular disease was: • twice as high as for their non-Indigenous counterparts (Table 5.3) • more common in nearly all age groups, with disparities in age-specific daily smoking rates
being steady, at around twice as high.

41
Table 5.3: Prevalence of daily tobacco smoking among Aboriginal and Torres Strait Islander peoples without long-term cardiovascular disease, by age group and sex, 2004–05
Age group (years) 18 years and over
Sex 18–24 25–44 45–64 65+ Total SPR(a)
Males
Per cent 49.7 56.0 47.7 *28.0 52.1 . .
Rate ratio 1.7 1.9 2.0 *2.8 . . 1.9
Females
Per cent 50.7 51.8 44.7 *15.7 49.4 . .
Rate ratio 2.3 2.4 2.5 *+2.1 . . 2.3
Persons
Per cent 50.2 53.8 46.3 21.4 50.7 . .
Rate ratio 1.9 2.1 2.2 2.5 . . 2.1
* Estimate has a relative standard error of 25% to 50% and should be interpreted with caution.
+ Rate ratios not statistically different from 1.0. That is, rates for Indigenous Australians are not significantly different from rates for non-Indigenous Australians.
(a) SPR (standardised prevalence ratio) is the ratio of the observed number of cases to the number of expected cases if Indigenous Australians had experienced the same age–sex-specific prevalence rates as non-Indigenous Australians.
Note: Based on self-reported data.
Source: AIHW analysis of the ABS 2004–05 NATSIHS CURF.
The rates for Indigenous Australians without cardiovascular disease who were former smokers or had never smoked were lower than for non-Indigenous Australians.
Physical inactivity Low levels of physical activity are an important contributor to the risk of developing cardiovascular disease, particularly coronary heart disease, heart failure and stroke. Insufficient physical activity is also linked to higher rates of death from these conditions compared with those who are physically active. Prevalence rates of physical inactivity in Indigenous Australians are high, with Indigenous Australians being more likely to be physically inactive than non-Indigenous Australians.
What is physical inactivity? Physical inactivity is a term relating to low levels or lack of physical activity. In this report, ‘sedentary’ refers to people who reported no physical activity or participating in very low levels of physical activity (25 minutes or less in the 2 weeks before the survey interview).
Why is physical inactivity a risk factor for cardiovascular disease? Low levels of physical activity increase the risk of mortality and morbidity from a range of diseases and conditions. Regular physical activity is associated with better health and wellbeing; it improves strength, builds lean muscle, reduces body fat, burns calories and lowers blood pressure. These benefits are linked to a reduction in the risk of developing cardiovascular disease and some associated risk factors, such as overweight, hypertension, high levels of high-density lipoprotein and total blood cholesterol, and Type 2 diabetes. Being physically active also helps manage an existing disease and/or the levels of these risk factors.

42
How many Aboriginal and Torres Strait Islander peoples have a sedentary lifestyle? Based on self-reported results from the 2004-05 NATSIHS, nearly half (49%, corresponding to 90,300 people) of Aboriginal and Torres Strait Islander peoples aged 18 years and over in non-remote areas had not done any physical activity in the 2 weeks before the survey interview. Women were more likely to be physically inactive, at 1.2 times as high as in men. Physical inactivity was also more common among older people, with 60% of men and 70% of women aged 65 years and over being sedentary. (Figure 5.3).
In 2004–05, about one-third (32%) of Indigenous Australians aged 18 years and over in non-remote areas had done moderate or vigorous exercise in the 2 weeks before the survey. Examples of moderate activity include brisk walking, swimming, doubles tennis and cycling, while more vigorous physical activity includes jogging and active sports like football and basketball (AIHW 2006a).
Men were more likely than women to have done moderate or vigorous exercise (1.5 times as likely as women), as were young Indigenous Australians aged 18–24 years (42%).
Per cent
0
10
20
30
40
50
60
70
80
18–24 25–44 45–64 65+ 18–24 25–44 45–64 65+
Age group (years)
Indigenous Australians
Non-Indigenous Australians
Males Females
(a) Did 25 minutes or less of physical activity in the 2 weeks before the survey interview.
Notes
1. Based on self-reported data.
2. In non-remote areas only.
3. See Appendix 2, Table A2.10 for detailed information.
Source: AIHW analysis of the ABS 2004–05 NATSIHS CURF.
Figure 5.3: Physical inactivity(a), by Indigenous status and age group, persons aged 18 years and over, 2004–05

43
Disparity between Indigenous and non-Indigenous Australians After adjusting for differences in the age structure of the two populations, the prevalence rate for sedentary levels of physical activity in Aboriginal and Torres Strait Islander peoples in non-remote areas was: • 1.5 times as high as in non-Indigenous Australians • highest in the 45–64 year age group, at 1.6 times and 1.7 times as high as in
non-Indigenous males and females, respectively • similar to that in older non-Indigenous males and females aged 65 years and over.
Compared with the non-Indigenous Australian population, after adjusting for age, Indigenous Australians were less likely to have done moderate or vigorous exercise.
How many Indigenous Australians with sedentary levels of physical activity also have cardiovascular disease? Results from the survey estimated that 38,900 Indigenous men and 51,500 Indigenous women aged 18 years and over in non-remote areas had not done any physical activity in the 2 weeks before the survey interview. Of these, cardiovascular disease as a long-term health condition was present in: • 22% of men and 24% of women—this was not a statistically significant difference • 70% of older people aged 65 years and over, which reflects evidence that the prevalence
rate of cardiovascular disease increases with age.
In Indigenous Australians with long-term cardiovascular disease… Based on results from the 2004–05 NATSIHS, an estimated 35,800 Indigenous Australians aged 18 years and over in non-remote areas had long-term cardiovascular disease. Of these, over half (58% corresponding to an estimated 20,900 people) were physically inactive. Men and women had similar levels of physical inactivity, after adjusting for age. Physical inactivity increased with age, with nearly three-quarters (72%) of those aged 65 years and over being sedentary.
In 2004–05, 22% of Indigenous Australians aged 18 years and over with cardiovascular disease in non-remote areas did moderate or vigorous exercise; this did not differ by sex. The prevalence of moderate or vigorous levels of physical activity decreased with age, reflecting the higher sedentary rates among older Indigenous Australians with cardiovascular disease.
Disparity between Indigenous and non-Indigenous Australians Having long-term cardiovascular disease and being inactive was more common among Indigenous Australians than in their non-Indigenous counterparts (Table 5.4). After adjusting for age, the prevalence rates of sedentary levels of physical activity in Indigenous Australians with cardiovascular disease were: • 1.6 times as high as in non-Indigenous Australians • 1.8 and 1.5 times as high as in non-Indigenous men and women, respectively • high among those aged 45–64 years, being twice as high as in non-Indigenous men and
1.8 times as high as in non-Indigenous women.

44
Table 5.4: Prevalence of physical inactivity(a) among Aboriginal and Torres Strait Islander peoples with long-term cardiovascular disease, by age group and sex, 2004–05
Age group (years) 18 years and over
Sex 25–44 45–64 65+ Total SPR(b)
Males
Per cent 58.1 67.7 70.1 62.6 . .
Rate ratio 1.8 2.0 +1.7 . . 1.8
Females
Per cent 52.2 56.1 *73.9 55.9 . .
Rate ratio 1.6 1.8 *+1.4 . . 1.5
Persons
Per cent 54.2 60.6 72.1 58.5 . .
Rate ratio 1.7 1.9 +1.5 . . 1.6
* Estimate has a relative standard error of 25% to 50% and should be interpreted with caution.
+ Rate ratios not statistically different from 1.0. That is, rates for Indigenous Australians are not significantly different from rates for non-Indigenous Australians.
(a) Did 25 minutes or less of physical activity in the 2 weeks before the survey interview.
(b) SPR (standardised prevalence ratio) is the ratio of the observed number of cases to the number of expected cases if Indigenous Australians had experienced the same age–sex-specific prevalence rates as non-Indigenous Australians.
Notes
1. Based on self-reported data.
2. In non-remote areas only.
Source: AIHW analysis of the ABS 2004–05 NATSIHS CURF.
After adjusting for age, rates for moderate or vigorous physical activity were lower among Indigenous Australians than non-Indigenous Australians.
In Indigenous Australians without long-term cardiovascular disease… In 2004–05, according to the survey an estimated 150,000 Indigenous Australians in non-remote areas did not have cardiovascular disease, with a physically inactive lifestyle occurring in:
• nearly half (46%), equating to an estimated 69,400 people (Table 5.5)
• more women than men—1.2 times as likely as in men, after adjusting for age
• over half (55%) of those aged 65 years and over; reflecting the positive association that physical inactivity has with age.
In 2004–05, around one-third (34%) of Indigenous Australians without cardiovascular disease in non-remote areas did moderate or vigorous exercise in the 2 weeks before the survey. The age-adjusted prevalence rate was higher in males than females—1.7 times as high. Young Indigenous Australians aged 18–24 years were most likely to have done moderate or vigorous exercise (57% of males and 27% of females). This proportion decreased with age.

45
Table 5.5: Prevalence of physical inactivity(a) among Aboriginal and Torres Strait Islander peoples without long-term cardiovascular disease, by age group and sex, 2004–05
Age group (years) 18 years and over
Sex 18–24 25–44 45–64 65+ Total SPR(b)
Males
Per cent 35.7 40.0 53.4 *39.4 41.5 . .
Rate ratio 1.5 1.3 1.4 *+1.0 . . 1.4
Females
Per cent 49.3 50.2 53.9 *64.8 50.9 . .
Rate ratio 1.6 1.7 1.7 *+1.5 . . 1.6
Persons
Per cent 42.7 45.3 53.6 54.9 46.3 . .
Rate ratio 1.5 1.5 1.5 +1.3 . . 1.5
* Estimate has a relative standard error of 25% to 50% and should be interpreted with caution.
+ Rate ratios not statistically different from 1.0. That is, rates for Indigenous Australians are not significantly different from rates for non-Indigenous Australians.
(a) Did 25 minutes or less of physical activity in the 2 weeks before the survey interview.
(b) SPR (standardised prevalence ratio) is the ratio of the observed number of cases to the number of expected cases if Indigenous Australians had experienced the same age–sex-specific prevalence rates as non-Indigenous Australians.
Notes
1. Based on self-reported data.
2. In non-remote areas only.
Source: AIHW analysis of the ABS 2004–05 NATSIHS CURF.
Disparity between Indigenous and non-Indigenous Australians Sedentary levels of physical activity were also more common in Indigenous Australians without cardiovascular disease than in non-Indigenous Australians (Table 5.5). After adjusting for differences in the age structure of the two populations without cardiovascular disease, Indigenous Australians without cardiovascular disease were: • more likely to be sedentary than non-Indigenous Australians • 1.4 times and 1.6 times as likely as non-Indigenous men and women to be physically
inactive, respectively, after adjusting for age (Table 5.5) • more likely to be sedentary across all age groups up to the age of 65 years than
non-Indigenous Australians.
Both Indigenous men and women were less likely to have done moderate or vigorous exercise than non-Indigenous men and women.
Poor nutrition A diet containing a wide range of foods from the different food groups is most likely to offer protection against non-communicable chronic diseases. Many factors can influence the impact of diet on health. For Aboriginal and Torres Strait Islander peoples, this includes the change from a ‘traditional’ diet that was fibre-rich, high in protein and low in saturated fat to a diet that is high in fat and refined sugars. Other external factors, such as the physical environment, access to fresh food, socioeconomic status, and historical and cultural issues are all likely to have a role in the type and amount of foods Indigenous Australians eat (ABS & AIHW 2005; van Holst Pellekaan & Clague 2005).

46
The 2004–05 NATSIHS showed that a very high proportion of Indigenous Australians did not eat enough fruit and/or vegetables daily. Although Indigenous Australians were more likely to not eat enough fruit, they were just as likely as non-Indigenous Australians to not eat enough vegetables.
What are the recommended guidelines for nutrition? The Dietary Guidelines for Australian Adults (the Guidelines) developed by the National Health and Medical Research Council (NHMRC) recommend eating a wide variety of nutritious foods, including plenty of vegetables, legumes, fruits, cereals, lean meat, fish, poultry and/or alternatives, milks, yoghurts, and cheeses and/or alternatives, and to drink plenty of water (NHMRC 2003). The Guidelines also recommend moderating sugar and total fat intake, limiting saturated fat intake, choosing foods low in salt and limiting alcohol intake. For the consumption of fruit and vegetables, the Guidelines recommend that adults eat two to four serves of fruit and four to eight serves of vegetables per day. In the NATSIHS, a serve of vegetables was defined as half a cup of cooked vegetables (75 grams) or one cup of salad vegetables. A serve of fruit was defined as one medium piece, two small pieces or one cup of diced fruit, equivalent to about 150 grams of fresh or 50 grams of dried fruit (ABS 2006). In this report ‘low fruit consumption’ refers to daily intake of one or less serves of fruit and ‘low vegetable consumption’ a daily intake of four or less serves of vegetables.
Why is poor nutrition a risk factor for cardiovascular disease? A well-balanced diet that includes a wide variety of foods provides the body with nutrients that are necessary for tissue maintenance, repair and growth. Essential vitamins, minerals and proteins are also vital for maintaining good health. Poor nutrition has been linked to the development of various diseases including coronary heart disease, stroke, hypertension, atherosclerosis and Type 2 diabetes. A high consumption of certain foods, such as salt and fat (especially saturated fatty acids), has been associated with an increased risk of conditions such as blood pressure, high blood cholesterol levels or overweight and obesity, while a high consumption of fruit and vegetables, because of their high fibre and micronutrient content, can reduce the risk of developing atherosclerosis and chronic diseases, such as coronary heart disease and stroke, as well as lower blood cholesterol and blood pressure levels.
How many Aboriginal and Torres Strait Islander peoples do not usually eat fruit and/or vegetables each day? In 2004–05, the majority of Indigenous Australians aged 18 years and over usually ate some fruit and/or vegetables daily. Indigenous Australians who did not usually eat any fruit and/or vegetables each day were estimated at: • around one in seven (15%) not eating fruit on a usual daily basis, equating to around
38,300 people • 6% not eating vegetables—14,400 people • 3% not eating either fruit or vegetables.
These rates were higher in men—1.4 times as high for not eating any fruit or vegetables daily and 1.8 times as high for not consuming either fruit or vegetables compared with women, after adjusting for age.

47
Locality can be an important factor in the availability of fruit and vegetables, as these foods may be less accessible in remote areas (AIHW 2007). In remote areas, Indigenous Australians aged 18 years and over were 1.8 times as likely as those in non-remote areas to not consume fruit daily. The difference was even greater for vegetables, where the rate in remote areas was 8.5 times as high as the rate in non-remote areas.
Disparity between Indigenous and non-Indigenous Australians Compared with non-Indigenous Australians, after adjusting for differences in the age structure of the two populations, Indigenous Australians were twice as likely to not consume fruit daily as non-Indigenous Australians. This disparity was even greater for vegetables and both fruit and vegetables, at 6.2 times and 9.5 times as high as non-Indigenous Australians, respectively.
How many Aboriginal and Torres Strait Islander peoples have low fruit and/or low vegetable consumption? In 2004–05, in Indigenous Australians aged 18 years and over in non-remote areas, the prevalence of consumption of less than two serves of fruit per day was: • around 60%, corresponding to an estimated 111,000 people • generally more common in men than women—1.1 times as high as women • highest among younger people, with nearly two-thirds (65%) of those aged 18–24 years
not eating enough fruit each day.
The prevalence of consumption of less than five serves of vegetables per day in Aboriginal and Torres Strait Islander peoples was: • about 90%, corresponding to an estimated 167,000 people • similar for men and women, after adjusting for age • consistent across all age groups, at around 90%.
Over half (56%) of Indigenous Australians had low daily consumption of both fruit and vegetables.
Disparity between Indigenous and non-Indigenous Australians Indigenous Australians were 1.2 times as likely as non-Indigenous Australians to not consume the recommended daily servings of fruit. However, they were just as likely as non-Indigenous Australians to not consume the recommended daily servings of vegetables (Figure 5.4).

48
Notes 1. Based on self-reported data.
2. In non-remote areas only.
3. Low fruit consumption refers to the daily intake of one or less serves of fruit.
4. Low vegetable consumption refers to the daily intake of four or less serves of vegetables.
5. Low fruit and vegetable consumption refers to the daily intake of one or less serves of fruit and four or less serves of vegetables.
6. Standardised prevalence ratio of the observed number of cases to the number of expected cases if Indigenous Australians had experienced the same age–sex-specific prevalence rates as non-Indigenous Australians.
7. A standardised prevalence ratio of 1.0 indicates that there is no difference between rates experienced by the Indigenous and non-Indigenous populations.
8. Bars on column represent 95% confidence intervals.
9. See Appendix 2, Table A2.11 for detailed information.
Source: AIHW analysis of the ABS 2004–05 NATSIHS CURF.
Figure 5.4: Standardised prevalence ratio of low fruit and/or low vegetable consumption, by sex, Aboriginal and Torres Strait Islander peoples aged 18 years and over, 2004–05
How many Indigenous Australians who are low fruit or low vegetable consumers also have cardiovascular disease? Aboriginal and Torres Strait Islander peoples who ate less than two serves of fruit per day were just as likely as those who ate less than five serves of vegetables per day to have long-term cardiovascular disease. In both cases, more women than men had cardiovascular disease, the age-adjusted prevalence rate was 1.4 times as high as males for both low fruit or low vegetable consumption.
The proportion of Indigenous Australians who did not eat enough fruit or vegetable and who also had cardiovascular disease increased with age. For low fruit consumers, this increase was from 5% in those aged 18–24 years to 68% in those aged 65 years and over. Similarly, the proportions of low vegetable consumers with cardiovascular disease also increased from 4% among those aged 18–24 years to 64% among those aged 65 years and over.
Standardised prevalence ratio
0.0
0.2
0.4
0.6
0.8
1.0
1.2
1.4
1.6
Males Females Persons Males Females Persons Males Females Persons
Low consumption
Fruit Vegetables Fruit and vegetables

49
In Indigenous Australians with long-term cardiovascular disease… Of the estimated 35,800 Indigenous Australians aged 18 years and over in non-remote areas who had cardiovascular disease: • over half (55%) did not eat at least two serves of fruit per day (Table 5.6) • around 90% did not eat at least five serves of vegetables per day • half were both low fruit and vegetable consumers.
Indigenous men and women aged 18 years and over with cardiovascular disease were equally likely to not consume enough fruit or vegetables. However, men were more likely to be both low fruit and vegetable consumers than women—the age-adjusted prevalence rate for men was 1.4 times as high as for women.
Younger Indigenous Australians aged 18–24 years with cardiovascular disease were more likely than any other age group to not consume enough fruit (83%) or vegetables (98%). Fruit consumption increased with age, with less than half (46%) of those aged 65 years and over being low fruit consumers. Vegetable consumption also increased but at a lower rate than fruit consumption. These patterns were also observed in the non-Indigenous population with cardiovascular disease (Table 5.6).
Table 5.6: Prevalence of low fruit and /or vegetable consumption among Aboriginal and Torres Strait Islander peoples with long-term cardiovascular disease, 2004–05 (per cent)
Age group (years) 18 years and over
Sex 18–24 25–44 45–64 65+ Total SPR(a)
Males
Low fruit consumption(b) *95.8 76.8 52.3 *55.4 62.2 +1.2
Low vegetable consumption(c) *95.8 94.6 91.6 96.3 93.5 +1.1
Low fruit and vegetable consumption(d) *95.8 73.9 49.1 *54.6 59.6 1.3
Females
Low fruit consumption(b) *76.8 60.6 43.6 *38.0 50.9 1.4
Low vegetable consumption(c) *98.7 89.4 84.5 86.1 87.2 +1.0
Low fruit and vegetable consumption(d) *75.5 54.0 36.9 *33.5 44.8 1.3
Persons
Low fruit consumption(b) 83.4 66.1 47.0 46.2 55.2 1.3
Low vegetable consumption(c) 97.7 91.1 87.3 90.9 89.6 +1.1
Low fruit and vegetable consumption(d) 82.6 60.7 41.7 43.5 50.4 1.3
* Estimate has a relative standard error of 25% to 50% and should be interpreted with caution.
+ Standardised prevalence ratios not statistically different from 1.0. That is, rates for Indigenous Australians are not significantly different from rates for non-Indigenous Australians.
(a) SPR (standardised prevalence ratio) is the ratio of the observed number of cases to the number of expected cases if Indigenous Australians had experienced the same age–sex-specific prevalence rates as non-Indigenous Australians.
(b) Low fruit consumption refers to the daily intake of one or less serves of fruit.
(c) Low vegetable consumption refers to the daily intake of four or less serves of vegetables.
(d) Low fruit and vegetable consumption refers to the daily intake of one or less serves of fruit and four or less serves of vegetables.
Notes
1. Based on self-reported data.
2. In non-remote areas only.
Source: AIHW analysis of the ABS 2004–05 NATSIHS CURF.

50
Disparity between Indigenous and non-Indigenous Australians After adjusting for differences in the age structure of the Indigenous and non-Indigenous populations with cardiovascular disease, Indigenous Australians were: • more likely to be low fruit consumers—1.3 times as likely as non-Indigenous Australians
(Table 5.6) • just as likely to be low vegetable consumers • more likely to be both low fruit and vegetable consumers—1.3 times.
In Indigenous Australians without long-term cardiovascular disease… From results of the 2004–05 NATSIHS, of the estimated 150,000 Aboriginal and Torres Strait Islander peoples aged 18 years and over in non-remote areas who did not have cardiovascular disease: • more than half (61%) did not eat at least two serves of fruit per day • around 90% did not eat at least five serves of vegetables per day • over half (57%) were both low fruit and vegetable consumers.
Compared with Indigenous women, Indigenous men without cardiovascular disease were more likely to not consume enough fruit and more likely to not consume enough fruit and vegetables (Table 5.7). There was no statistically significant difference in the age-adjusted prevalence of low vegetable consumption between men and women.
Fruit consumption increased with age among Indigenous Australians without cardiovascular disease. Those aged 18–24 years and 65 years and over were the least likely to eat the recommended daily intake of vegetables.
Disparity between Indigenous and non-Indigenous Australians After adjusting for age, Indigenous Australians without cardiovascular disease were: • 1.2 times as likely to have low fruit consumption as non-Indigenous Australians
(Table 5.7) • low vegetable consumers at a rate similar to their non-Indigenous counterparts.
Compared with non-Indigenous Australians without cardiovascular disease, Indigenous Australians in the age groups under 65 years were more likely to not consume enough fruit. However, there was no statistically significant difference in low vegetable consumption in any of the age groups.

51
Table 5.7: Prevalence of low fruit and /or vegetable consumption among Aboriginal and Torres Strait Islander peoples without long-term cardiovascular disease, 2004–05 (per cent)
Age group (years) 18 years and over
Sex 18–24 25–44 45–64 65+ Total SPR(a)
Males
Low fruit consumption(b) 65.3 64.7 61.1 *29.4 63.6 1.1
Low vegetable consumption(c) 93.7 91.8 89.6 *89.0 91.9 +1.0
Low fruit and vegetable consumption(d) 61.5 61.1 59.0 **18.4 60.1 1.1
Females
Low fruit consumption(b) 62.4 60.1 45.4 *44.5 57.8 1.3
Low vegetable consumption(c) 91.7 86.5 87.4 96.2 88.3 +1.0
Low fruit and vegetable consumption(d) 60.2 54.7 42.1 *44.5 53.8 1.3
Persons
Low fruit consumption(b) 63.8 62.3 53.6 38.6 60.6 1.2
Low vegetable consumption(c) 92.7 89.1 88.6 93.4 90.0 +1.0
Low fruit and vegetable consumption(d) 60.9 57.7 50.9 34.3 56.9 1.2
* Estimate has a relative standard error of 25% to 50% and should be interpreted with caution.
** Estimate has a relative standard error greater than 50% and is considered too unreliable for general use.
+ Standardised prevalence ratios not statistically different from 1.0. That is, rates for Indigenous Australians are not significantly different from rates for non-Indigenous Australians.
(a) SPR (standardised prevalence ratio) is the ratio of the observed number of cases to the number of expected cases if Indigenous Australians had experienced the same age–sex-specific prevalence rates as non-Indigenous Australians.
(b) Low fruit consumption refers to the daily intake of one or less serves of fruit.
(c) Low vegetable consumption refers to the daily intake of four or less serves of vegetables.
(d) Low fruit and vegetable consumption refers to the daily intake of one or less serves of fruit and four or less serves of vegetables.
Notes
1. Based on self-reported data.
2. In non-remote areas only.
Source: AIHW analysis of the ABS 2004–05 NATSIHS CURF.
Overweight and obesity Overweight, and in particular obesity, is associated with higher rates of premature mortality and ill health. Prevalence rates of these risk factors among Indigenous Australians, especially those living in remote communities, are high (Thompson et al. 2003). Over half of the Indigenous population aged 18 years and over were overweight, with slightly over half of these being obese. Indigenous Australians were more likely to be overweight and much more likely to be obese than non-Indigenous Australians.
How many Aboriginal and Torres Strait Islander peoples are overweight or obese? Based on self-reported height and weight measurements and after adjusting for survey non-response, of the estimated 219,000 Indigenous Australians aged 18 years and over: • 60% were overweight, corresponding to an estimated 132,000 people • 31% were obese, with 13% of these being morbidly obese.

52
What is overweight and obesity? Overweight and obesity are conditions of excess body fat that results from an energy imbalance over a sustained period. The primary cause of excess body fat is due to the energy intake from the diet being greater than the energy used up through physical activity. Genetic and environmental factors may also influence a person’s weight. However, both healthy eating and physical activity are key factors in preventing weight gain, for weight loss and for the maintenance of body weight. The body mass index (BMI) is the most commonly used measure for body weight. BMI is calculated by dividing weight in kilograms by the square of height in metres (kg/m2). Classification of body weight is based primarily on the association between BMI and illness and mortality, and is the standard recommended by the WHO (WHO 2000) and the National Health Data Dictionary. For people aged 18 years and over, the BMI classifications are: • healthy weight (BMI 18.5 to 25) • overweight (BMI greater than or equal to 25; includes obese) • overweight but not obese (BMI 25 to 30) • obese (BMI greater than or equal to 30) • morbidly obese (BMI greater than or equal to 40). The BMI classification may not be suitable for all ethnic groups, who may have equivalent levels of risk at lower BMI (for example, Asians) or higher BMI (for example, Polynesians) compared with the standard. For children and adolescents aged 2–17 years, a separate classification of body weight based on age and sex has been developed. Although there is increasing evidence that waist circumference or, particularly, waist-hip ratio may be superior to BMI in predicting cardiovascular risk, BMI is used in this report, as more data related to this measure are available, particularly for Indigenous Australians. In this report, BMI was derived from self-reported height and weight measurements.
Why is being overweight a risk factor for cardiovascular disease? Overweight, particularly obesity, is linked to reduced life expectancy and increased risk of mortality and morbidity. It is associated with increased risk of developing a range of diseases, such as coronary heart disease, stroke, Type 2 diabetes, kidney disease, certain cancers, osteoarthritis, psychological disorders and social problems (AIHW 2006a; ABS & AIHW 2005). Excess body fat also increases the prevalence of risk factors for heart disease, such as high blood pressure, high blood cholesterol and high levels of triglycerides (blood fats). Among those who are overweight, weight loss would reduce the incidence, and improve levels, of these risk factors, as well as of Type 2 diabetes and osteoarthritis.
Overall men were statistically significantly more likely to be overweight than women— 1.1 times. However women were more likely to be obese than men—1.2 times. The difference was even greater among the morbidly obese with rates for Indigenous women being twice as high as for men.
The prevalence of obesity generally increased with age, and was high among those aged 45–64 years (39%) and 65 years and over (33%).
Disparity between Indigenous and non-Indigenous Australians Indigenous Australians were more likely to be overweight and much more likely to be obese than non-Indigenous Australians (Figure 5.5).

53
Notes
1. Based on self-reported data.
2. Adjusted for survey non-response for height and weight used to derive the body mass index.
3. Overweight refers to a BMI greater than or equal to 25, and includes obese.
4. Obese refers to BMI greater than or equal to 30.
5. Standardised prevalence ratio of the observed number of cases to the number of expected cases if Indigenous Australians had experienced the same age–sex-specific prevalence rates as non-Indigenous Australians.
6. A standardised prevalence ratio of 1.0 indicates that there is no difference between rates experienced by the Indigenous and non-Indigenous populations. 7. Bars on column represent 95% confidence intervals.
8. See Appendix 2, Table A2.12 for detailed information.
Source: AIHW analysis of the ABS 2004–05 NATSIHS CURF.
Figure 5.5: Standardised prevalence ratio for overweight and obese Aboriginal and Torres Strait Islander peoples aged 18 years and over, by sex, 2004–05
After adjusting for differences in the age structure of the Indigenous and non-Indigenous populations and survey non-response for height and weight measurements, Indigenous Australians aged 18 years and over were: • 1.2 times as likely as non-Indigenous Australians to be overweight • 1.9 times as likely to be obese • over 3 times as likely to be morbidly obese.
Interestingly, Indigenous Australians were less likely to be overweight but not obese than non-Indigenous Australians.
Across all age groups, Indigenous Australians were more likely than non-Indigenous Australians to be obese. The greatest difference in obesity rates were for young people aged 18–24 years (2.4 times as high as the rate for non-Indigenous Australians) and for people aged 65 years and over (2.1 times as high).
Standardised prevalence ratio
0.0
0.5
1.0
1.5
2.0
2.5
3.0
Males Females Persons Males Females Persons
ObeseOverweightExcess weight
Standardised prevalence ratio
0.0
0.5
1.0
1.5
2.0
2.5
3.0
Males Females Persons Males Females Persons
ObeseOverweightExcess weight
Standardised prevalence ratio
0.0
0.5
1.0
1.5
2.0
2.5
3.0
Males Females Persons Males Females Persons
ObeseOverweightExcess weight
Standardised prevalence ratio
0.0
0.5
1.0
1.5
2.0
2.5
3.0
Males Females Persons Males Females Persons
ObeseOverweightExcess weight
Standardised prevalence ratio
0.0
0.5
1.0
1.5
2.0
2.5
3.0
Males Females Persons Males Females Persons
ObeseOverweightExcess weight

54
How many Indigenous Australians who are obese also have cardiovascular disease? Around 29% of Indigenous Australians aged 18 years and over who were obese also had cardiovascular disease as a long-term condition. Among those who were morbidly obese, 35% also had the disease.
After adjusting for age, the cardiovascular disease prevalence rate did not differ between men and women who were obese. The prevalence of cardiovascular disease increased with age, with nearly three-quarters (74%) of the obese population aged 65 years and over also having the disease.
In Indigenous Australians with long-term cardiovascular disease… Among Indigenous Australians aged 18 years and over with cardiovascular disease, after adjusting for survey non-response: • 71% were overweight, corresponding to an estimated 31,800 people (Table 5.8) • 44% were obese, with around 16% of these people being morbidly obese.
Table 5.8: Prevalence of overweight and obesity among Aboriginal and Torres Strait Islander peoples with long-term cardiovascular disease, by age group and sex, 2004–05 (per cent)
Age group (years) 18 years and over
25–44 45–64 65+ Total SPR(a)
Males
Overweight but not obese(b) 36.5 32.7 *49.7 36.0 +0.9
Obese(c) 35.0 52.5 *35.8 42.0 1.4
Overweight(d) 71.5 85.3 85.5 78.0 +1.1
Females
Overweight but not obese(b) 17.4 23.2 *33.0 21.5 0.7
Obese(c) 38.8 53.4 *45.6 45.1 1.8
Overweight(d) 56.2 76.6 78.6 66.6 1.2
Persons
Overweight but not obese(b) 25.2 27.2 40.6 27.5 0.8
Obese(c) 37.3 53.0 41.1 43.8 1.6
Overweight(d) 62.5 80.2 81.8 71.3 1.2
* Estimate has a relative standard error of 25% to 50% and should be interpreted with caution.
+ Standardised prevalence ratios not statistically different from 1.0. That is, rates for Indigenous Australians are not significantly different from rates for non-Indigenous Australians.
(a) SPR (standardised prevalence ratio) is the ratio of the observed number of cases to the number of expected cases if Indigenous Australians had experienced the same age–sex-specific prevalence rates as non-Indigenous Australians.
(b) BMI greater than or equal to 25 and less than 30.
(c) BMI greater than or equal to 30.
(d) BMI greater than or equal to 25.
Notes
1. Based on self-reported data.
2. Adjusted for survey non-response for height and weight used to derive the BMI.
Source: AIHW analysis of the ABS 2004–05 NATSIHS CURF.

55
There was no statistically significant difference in the prevalence rates for overweight or obesity between Indigenous men and women. However, Indigenous men with cardiovascular disease were more likely to be overweight but not obese than women—1.7 times as likely as women.
In 2004–05, the prevalence of overweight among Indigenous Australians with cardiovascular disease increased with age, being highest among older people aged 65 years and over (82%). Being obese was also common in the middle to older age groups with over half (53%) of adults aged 45–64 years and 41% of older people aged 65 years and over with this condition.
Disparity between Indigenous and non-Indigenous Australians After adjusting for differences in the age structure of the Indigenous and non-Indigenous populations with cardiovascular disease, Indigenous Australians had disparities in each of the excess weight BMI categories, at: • 1.2 times as high as non-Indigenous Australians for overweight (Table 5.8) • 1.6 times as high for obesity • 2.4 times as high for morbid obesity.
In Indigenous Australians without long-term cardiovascular disease… In 2004–05, in Indigenous Australians aged 18 years and over without cardiovascular disease: • over half (57%) were overweight, corresponding to an estimated 99,700 people (Table 5.9) • 28% were classified as obese, with 12% being morbidly obese.
Overall, men without cardiovascular disease were more likely than women to be overweight but not obese—1.4 times as likely as women. The opposite was observed for obesity rates, with the rate in women being 1.2 times as high as men. Indigenous men and women had similar age-adjusted prevalence rates for overweight.
Disparity between Indigenous and non-Indigenous Australians After adjusting for differences in the age structure of the two populations, Indigenous Australians without cardiovascular disease had: • higher prevalence rates for overweight—1.2 times as high as non-Indigenous Australians
(Table 5.9) • obesity rates that were nearly twice (1.9 times) as high • morbid obesity rates that were 3.3 times as high.
Obesity prevalence rates among those who did not have cardiovascular disease were higher among Indigenous men and women—1.6 times and 2.4 times as high as in non-Indigenous men and women, respectively.
In 2004–05, Indigenous Australians aged 18–44 years without cardiovascular disease were 1.2 to 1.4 times as likely to be overweight as non-Indigenous Australians. The disparity in age-specific obesity rates between the two populations was even starker; the greatest difference for men was in the 18–24 year age group and for women in the 25–44 year age group, each at 2.5 times as high as for non-Indigenous men and women.

56
Table 5.9: Prevalence of overweight and obesity among Aboriginal and Torres Strait Islander peoples without long-term cardiovascular disease, by age group and sex, 2004–05 (per cent)
Age group (years) 18 years and over
Sex 18–24 25–44 45–64 65+ Total SPR(a)
Males
Overweight but not obese(b) 30.4 33.9 37.8 *52.0 34.1 0.8
Obese(c) 17.5 28.2 27.0 *11.4 24.9 1.6
Overweight(d) 47.9 62.1 64.7 *63.4 59.0 +1.0
Females
Overweight but not obese(b) 20.5 24.9 31.5 *21.4 24.8 +1.0
Obese(c) 18.5 35.5 33.2 *32.9 30.6 2.4
Overweight(d) 39.0 60.3 64.6 54.3 55.5 1.5
Persons
Overweight but not obese(b) 25.6 29.5 34.9 *37.1 29.6 0.9
Obese(c) 18.0 31.7 29.8 21.8 27.6 1.9
Overweight(d) 43.6 61.2 64.7 59.0 57.3 1.2
* Estimate has a relative standard error of 25% to 50% and should be interpreted with caution.
+ Standardised prevalence ratios not statistically different from 1.0. That is, rates for Indigenous Australians are not significantly different from rates for non-Indigenous Australians.
(a) SPR (standardised prevalence ratio) is the ratio of the observed number of cases to the number of expected cases if Indigenous Australians had experienced the same age–sex-specific prevalence rates as non-Indigenous Australians.
(b) BMI greater than or equal to 25 and less than 30.
(c) BMI greater than or equal to 30.
(d) BMI greater than or equal to 25.
Notes
1. Based on self-reported data.
2. Adjusted for survey non-response for height and weight used to derive the BMI.
Source: AIHW analysis of the ABS 2004–05 NATSIHS CURF.
Alcohol consumption Excessive alcohol consumption is a major health problem for Indigenous Australians, as it can adversely affect quality of life and lead to undesirable antisocial behaviour, including domestic violence and family breakdown (ABS & AIHW 2005). Alcohol is also a frequent contributor to morbidity and mortality due to its association with motor vehicle accidents, falls and suicide.
Indigenous Australians were more likely to abstain from drinking alcohol than non-Indigenous Australians. But those who did drink were more likely to consume alcohol at harmful levels (Thrift & Hayman 2007). This means that many Indigenous Australians may face higher health risks from alcohol than alcohol consumers in the non-Indigenous population (Hayman 1997).

57
What are the Australian alcohol guidelines for short-term and long-term patterns of drinking? Males who drink no more than four standard drinks a day on average or no more than 28 drinks in a week avoid the long-term risk of ill health and death related to alcohol. The equivalent amounts for females are two standard drinks per day on average or no more than 14 drinks over a week (because of their lower average body mass and the different way their bodies process alcohol). Males who drink more than six standard drinks in any 1 day considerably increase their short-term risk of health and social problems, including (but not only) risk of injury or death from accident, assault and self-harm. For females the equivalent limit is four standard drinks (NHMRC 2001).
What is alcohol consumption in this report? In this report, alcohol consumption relates to long-term risk. Long-term alcohol risk levels were derived from the average daily consumption of alcohol in the 7 days before the interview and grouped into three relative risk categories in accordance with the NHMRC alcohol guidelines. Note that one standard drink contains 12.5mls of alcohol. These categories are: • for males, ‘low-risk’ is the consumption of less than 50mls per day; ‘risky’ 50mls to 70mls per
day; and ‘high-risk’ greater than 75mls per day. • for females, ‘low-risk’ is the consumption of less than 25mls per day; ‘risky’ 25mls to 50mls per
day; and ‘high-risk’ greater than 50mls per day (ABS 2006). The term ‘abstain’ refers to those who last consumed alcohol 12 months or more ago or never consumed alcohol. Risks of harm in the long term are assessed in terms of average weekly consumption (AIHW 2003). It should also be noted that the risk level as defined by the NHMRC is based on regular consumption levels of alcohol, whereas the risk levels as derived in the NATSIHS do not take into account whether consumption in the reference week was more, less or the same as usual.
Why is alcohol consumption a risk factor for cardiovascular disease? Consumption of alcohol at harmful levels (risky and high-risk) is associated with elevated blood pressure and blood triglyceride levels, and increased risk of heart failure, stroke and abnormal heart rhythm. It can also increase the risk of certain cancers and other diseases, as well as contribute to obesity, alcoholism, suicide and accidents. Heavy drinking, particularly binge drinking, is associated with even higher blood pressure and blood triglyceride levels and increased risk of death from stroke. There is evidence that low to moderate consumption of alcohol, that is an average of one to two drinks per day for men and less than one drink per day for women, is protective against the development of coronary heart disease in people who are aged around 40 years and over (NHMRC 2001). However, the guidelines state that these potential health benefits should not encourage non-drinkers to start drinking alcohol or for drinkers to increase the amount that they drink. An increased consumption of alcohol would also increase calorie intake and increase the risk of gaining excess weight.

58
How many Indigenous Australians drink alcohol? In 2004–05, about half of Indigenous Australians aged 18 years and over had not consumed alcohol in the week before the survey interview. Of the remainder 49% of Indigenous Australians who drank alcohol, they did so at levels considered: • low-risk—around one-third (32%), equating to an estimated 82,900 people • risky/high-risk—16%; around 42,500 people • high-risk—8%; approximately 21,600 people.
Indigenous men drank at risky/high-risk levels 1.4 times as often as women. This difference was mainly driven by the much higher levels of high-risk consumption in men compared with women—twice as high. Proportions of risky/high-risk alcohol consumption were highest in women aged 25–34 years (16%) and men aged 35–44 years (24%) compared with the other age groups.
In Aboriginal and Torres Strait Islander peoples aged 18 years and over, abstaining from alcohol in the past 12 months was prevalent in: • nearly one-quarter (24%) of the population • almost twice as many women as men • more older people. The prevalence of abstaining from alcohol increased with age, from
12% and 20% in males and females aged 18–24 years to 41% and 71% in males and females aged 65 years and over.
Disparity between Indigenous and non-Indigenous Australians After adjusting for differences in the age structure of the two populations, Indigenous Australians aged 18 years and over were: • 1.2 times as likely to have drunk at risky/high-risk levels as non-Indigenous Australians
(Figure 5.6) • 1.5 times as likely to have drunk at the high-risk level.
Indigenous men and women were both 1.8 times as likely as non-Indigenous Australians to abstain from drinking alcohol. The greatest difference in age-specific rates between Indigenous and non-Indigenous Australians was in the 45–64 years age group for males and in the 65 years and over age group for females—2.7 times and 2.1 times as high as non-Indigenous males and females, respectively.
How many Indigenous Australians who drank alcohol at risky/high-risk levels also have cardiovascular disease? The prevalence rate of cardiovascular disease among Indigenous Australians aged 18 years and over who drank alcohol at levels considered to be harmful (risky/high-risk) to their health in the week before the interview was: • around one in five (20%) • similar for men and women, after adjusting for age • higher in the older age groups, increasing to 41% in those aged 45–64 years.

59
Notes
1. Based on self-reported data.
2. Level of risk from alcohol consumption in the week before the survey interview.
3. ‘Abstainers’ refers to no alcohol consumed in the past 12 months or more ago or never consumed alcohol.
4. ‘Low-risk’ refers to the consumption of less than 50mls per day for males and less than 25mls per day for females.
5. ‘Risky/high-risk’ refers to the consumption of 50mls and greater per day for males and 25mls and greater per day for females.
6. Standardised prevalence ratio of the observed number of cases to the number of expected cases if Indigenous Australians had experienced the same age–sex-specific prevalence rates as non-Indigenous Australians.
7. A standardised prevalence ratio of 1.0 indicates that there is no difference between rates experienced by the Indigenous and non-Indigenous populations. 8. Bars on column represent 95% confidence intervals.
9. See Appendix 2, Table A2.13 for detailed information.
Source: AIHW analysis of the ABS 2004–05 NATSIHS CURF.
Figure 5.6: Standardised prevalence ratio for risk of long-term harm from alcohol consumption for Aboriginal and Torres Strait Islander peoples aged 18 years and over, by sex, 2004–05
In Indigenous Australians with long-term cardiovascular disease… Based on results from the 2004–05 NATSIHS, around 41% of Indigenous Australians aged 18 years and over with long-term cardiovascular disease had also drunk alcohol in the week before the survey interview. Of Indigenous Australians with a long-term cardiovascular disease 16% drank at risky/high-risk levels, and 8% at the high-risk level.
Men were more likely to drink at harmful levels than women, with men drinking at: • risky/high-risk levels, at a rate 1.7 times as high as the rate for women • high-risk level over 4 times as high as for women. Note that estimates for alcohol
consumption at high-risk levels in Indigenous women have a relative standard error of 25% to 50% and should be interpreted with caution.
Similar results were also found in a study at Royal Darwin Hospital, where Indigenous male patients with premature cerebrovascular disease were more likely to drink excessive amounts of alcohol than female patients (Pepper et al. 2006).
Standardised prevalence ratio
0.0
0.5
1.0
1.5
2.0
2.5
Males Females Persons Males Females Persons Males Females Persons
Level of risk
Low -risk Risky/high-riskAbstainers

60
The prevalence of risky/high-risk alcohol consumption among those with cardiovascular disease fell with age. In 2004–05, among those who had long-term cardiovascular disease, females were 1.2 times as likely as males to have abstained from drinking alcohol in the past 12 months.
Disparity between Indigenous and non-Indigenous Australians After adjusting for age, Indigenous Australians with cardiovascular disease were: • less likely to drink alcohol at low-risk levels than non-Indigenous Australians • more likely to have drunk at high-risk levels—1.6 times. This disparity was primarily
driven by the difference in men, at 1.9 times as high as for non-Indigenous men (Table 5.10).
Compared with non-Indigenous Australians with cardiovascular disease, Indigenous Australians were more likely to have abstained—Indigenous men were 2.2 times as likely as non-Indigenous men, while Indigenous women were 1.7 times as likely as non-Indigenous women.
Table 5.10: Prevalence rate of risk of long-term harm from alcohol consumption among Aboriginal and Torres Strait Islander peoples with long-term cardiovascular disease, by sex, 2004–05
Males Females Persons
Per cent SPR(a) Per cent SPR(a) Per cent SPR(a)
Abstainers(b) 28.7 2.2 34.8 1.7 32.4 1.8
Level of risk(c)
Low-risk 26.5 0.5 24.3 0.6 25.2 0.6
Risky 6.2 *+0.8 8.6 +1.2 7.7 +1.1
High-risk 15.1 1.9 4.0 *+1.2 8.3 1.6
Total risky/high-risk 21.3 +1.3 12.6 +1.2 16.0 +1.3
* Estimate has a relative standard error of 25% to 50% and should be interpreted with caution.
+ Standardised prevalence ratios not statistically different from 1.0. That is, rates for Indigenous Australians are not significantly different from rates for non-Indigenous Australians.
(a) SPR (standardised prevalence ratio) is the ratio of the observed number of cases to the number of expected cases if Indigenous Australians had experienced the same age–sex-specific prevalence rates as non-Indigenous Australians.
(b) No alcohol consumed in the past 12 months or more ago or never consumed alcohol.
(c) The relative risk categories for alcohol-related harm are: For males — ‘low-risk’ is the consumption of less than 50mls per day; ‘risky’ 50mls to 70mls per day; and ‘high-risk’ greater than 75mls per day. ‘Risk/high-risk’ is the consumption of 50mls or greater per day. For females — ‘low-risk’ is the consumption of less than 25mls per day; ‘risky’ 25mls to 50mls per day; and ‘high-risk’ greater than 50mls per day. ‘Risk/high-risk’ is the consumption of 25mls or greater per day.
Notes
1. Based on self-reported data.
2. Level of risk from alcohol consumption in the week before the survey interview.
Source: AIHW analysis of the ABS 2004–05 NATSIHS CURF.
In Indigenous Australians without long-term cardiovascular disease… Just over half (51%) of Aboriginal and Torres Strait Islander peoples aged 18 years and over without cardiovascular disease had consumed some alcohol in the week before the survey. In 2004–05, of Indigenous Australians without cardiovascular disease 17% drank alcohol at risky/high-risk levels, and 8% at the high-risk level.

61
Indigenous men were more likely to drink alcohol at harmful levels than women, being: • 1.4 times as likely as women to have drunk at risky/high-risk levels • 1.7 times as likely to have drunk at the high-risk level.
Indigenous females were twice as likely as males without cardiovascular disease to have abstained from consuming alcohol.
Disparity between Indigenous and non-Indigenous Australians In 2004–05, after adjusting for differences in the age structure of the Indigenous and non-Indigenous populations without cardiovascular disease, the prevalence rate of drinking alcohol at levels considered as risky/high-risk was: • higher in Indigenous men, at 1.2 times as high as for non-Indigenous men • similar for women. However Indigenous women were nearly twice as likely to drink at
high-risk levels as non-Indigenous women (Table 5.11).
Indigenous Australians without cardiovascular disease were more likely to drink at levels considered to be harmful (risky/high-risk) at younger ages than non-Indigenous Australians. Nearly one in five (18%) Indigenous Australians aged 25–44 years drunk at these levels. In comparison, non-Indigenous Australians aged 45–64 years (16%) were most likely to have drunk at risky/high-risk levels compared with the other age groups.
After adjusting for age, Indigenous men and women were more likely to abstain from alcohol than non-Indigenous Australians—1.6 times and 1.8 times as likely as for non-Indigenous men and women without cardiovascular disease, respectively.
Table 5.11: Prevalence rate of risk of long-term harm from alcohol consumption among Aboriginal and Torres Strait Islander peoples without long-term cardiovascular disease, by sex, 2004–05
Males Females Persons
Per cent SPR(a) Per cent SPR(a) Per cent SPR(a)
Abstainers(b) 14.8 1.6 28.6 1.8 21.9 1.7
Level of risk(c)
Low-risk 40.6 0.7 27.5 0.6 33.9 0.7
Risky 8.5 +1.2 7.9 +0.9 8.2 +1.0
High-risk 10.6 1.3 6.2 1.9 8.4 1.5
Total risky/high-risk 19.1 1.2 14.2 +1.2 16.6 1.2
+ Standardised prevalence ratios not statistically different from 1.0. That is, rates for Indigenous Australians are not significantly different from rates for non-Indigenous Australians.
(a) SPR (standardised prevalence ratio) is the ratio of the observed number of cases to the number of expected cases if Indigenous Australians had experienced the same age–sex-specific prevalence rates as non-Indigenous Australians.
(b) No alcohol consumed in the past 12 months or more ago or never consumed alcohol.
(c) The relative risk categories for alcohol-related harm are: For males — ‘low-risk’ is the consumption of less than 50mls per day; ‘risky’ 50mls to 70mls per day; and ‘high-risk’ greater than 75mls per day. ‘Risk/high-risk’ is the consumption of 50mls or greater per day. For females — ‘low-risk’ is the consumption of less than 25mls per day; ‘risky’ 25mls to 50mls per day; and ‘high-risk’ greater than 50mls per day. ‘Risk/high-risk’ is the consumption of 25mls or greater per day.
Notes
1. Based on self-reported data.
2. Level of risk from alcohol consumption in the week before the survey interview.
Source: AIHW analysis of the ABS 2004–05 NATSIHS CURF.

62
Diabetes Diabetes is a considerable health problem among Aboriginal and Torres Strait Islander peoples, both as a disease itself and as a risk factor for cardiovascular disease. Indigenous Australians have one of the highest documented rates of diabetes, especially Type 2, in the world (AIHW 2004; Thrift & Hayman 2007). The high prevalence of diabetes coexisting with any of the other cardiovascular disease risk factors, which are also highly prevalent in the Aboriginal and Torres Strait Islander population, corresponds to a large increase in risk of developing cardiovascular disease (van Holst Pellekaan & Clague 2005; Wang & Hoy 2004).
What is diabetes? Diabetes (also known as diabetes mellitus) is a metabolic disease in which high blood sugar (glucose) levels (hyperglycaemia) result from defective insulin secretion, insulin action or both (WHO 1999). Insulin is a hormone produced in the pancreas that helps the body to use glucose for energy. There are three main types of diabetes: Type 1, Type 2 and gestational diabetes. • Type 1 diabetes is marked by a total or near-total lack of insulin and results from the body
destroying its insulin-producing cells in the pancreas. It is the most common type of childhood diabetes. People with this form of diabetes require daily insulin therapy to survive.
• Type 2 diabetes is marked by reduced levels of insulin or the inability of the body to use insulin properly (insulin resistance). It is more common among older people. It can be treated with oral hypoglycaemic (glucose-lowering) drugs, but some people may also need insulin therapy.
• Gestational diabetes is a transient form of diabetes that develops during pregnancy in some women and usually disappears after the baby is born. It involves high blood sugar levels appearing for the first time during pregnancy, and affects women who have not previously been diagnosed with other forms of diabetes. It is also a marker of increased risk of developing Type 2 diabetes later in life.
The majority (an estimated 98%–99%) of cases of diabetes among Indigenous Australians are Type 2, with only 1%–2% being Type 1. There is limited national data on the incidence rate of gestational diabetes among Indigenous women; however the incidence rate may be as high as 20% (ABS & AIHW 2005; AIHW 2002, 2006a). As the information provided by the survey is based on self-reports, high blood sugar levels can suggest pre-diabetes and an increased risk of developing Type 1 or Type 2 diabetes. In this report, the term ‘diabetes’ includes Type 1 diabetes, Type 2 diabetes, gestational diabetes and high sugar levels.
What are the risk factors for diabetes? Many factors contribute to the onset and development of diabetes. In particular, diabetes shares several risk factors with, and is itself a risk factor for cardiovascular disease. Type 1 diabetes is believed to be caused by particular biological interactions and exposure to environmental agents among people genetically predisposed to diabetes (Atkinson & Eisenbarth 2001). The presence of several behavioural and biomedical risk factors plays a role in the development of Type 2 diabetes. These include obesity, physical inactivity, poor nutrition, genetic predisposition and ageing. The risk factors for gestational diabetes are similar to those for Type 2 diabetes, with women being at higher risk if they are of relatively advanced age or obese when pregnant (Virjee et al. 2001).

63
Why is diabetes a risk factor for cardiovascular disease? People with diabetes have a two to four times higher risk of developing cardiovascular conditions, such as coronary heart disease and stroke compared with those without diabetes. People with diabetes also tend to develop heart disease or have a stroke at an earlier age than those without. Studies have found that poorly managed diabetes can result in chronic high blood glucose levels (hyperglycaemia) which is associated with long-term damage and dysfunction and failure of various organs, especially the eyes, kidneys, nerves, heart and blood vessels. Diabetes, particularly if poorly managed, is also known to amplify the effect of other risk factors for cardiovascular disease, such as high blood cholesterol levels, obesity, high blood pressure and smoking. People with diabetes are also more likely to have at least one of the other behavioural and/or biomedical risk factors for cardiovascular disease.
How many Indigenous Australians have diabetes? Based on results from the 2004–05 NATSIHS, among Indigenous Australians aged 18 years and over, diabetes (including high sugar levels) was a current, long-term condition in: • around 11% of the population, corresponding to an estimated 29,200 people • more women than men, with a prevalence rate 1.2 times as high as for men, after adjusting
for age.
Disparity between Indigenous and non-Indigenous Australians After adjusting for differences in the age structure of the two populations, the disparity in prevalence rates of diabetes among Indigenous Australians aged 18 years and over was: • 3.7 times as high as for non-Indigenous Australians • for Indigenous men, 3 times as high as for non-Indigenous men • for Indigenous women, 4.5 times as high as for non-Indigenous women.
The proportion of Indigenous Australians with diabetes was higher for all age groups 25 years and over compared with non-Indigenous Australians (Figure 5.7). The age group with the greatest disparity in prevalence rates was the 25–34 year age group, at 5.3 times as high as non-Indigenous Australians, followed closely by those aged 45–54 years, at 5.1 times as high.
How many Indigenous Australians with diabetes also have cardiovascular disease? Among Indigenous Australians aged 18 years and over with diabetes as a current, long-term condition, cardiovascular disease was also present as a long-term condition in: • half (50%) of this group • both men and women, at similar age-adjusted prevalence rate • more older people, with over two-thirds (67%) of those aged 65 years and over having
both conditions.

64
Per cent
0
5
10
15
20
25
30
35
40
25–34 35–44 45–54 55–64 65+
Age group (years)
Indigenous Australians
Non-Indigenous Australians
Notes
1. Based on self-reported data.
2. See Appendix 2, Table A2.14 for detailed information.
Source: AIHW analysis of the ABS 2004–05 NATSIHS CURF.
Figure 5.7: Prevalence of diabetes, by Indigenous status and age group, persons aged 25 years and over, 2004–05
In Indigenous Australians with long-term cardiovascular disease… In 2004–05, diabetes was a common condition among Aboriginal and Torres Strait Islander peoples aged 18 years and over with cardiovascular disease. The prevalence of diabetes as a current, long-term condition was: • over one-quarter (28%) of the population, corresponding to about 14,600 people
(Table 5.12) • similar for men and women, after adjusting for age • higher in the older age groups, with the disease being most common among those aged
65 years and over.
Disparity between Indigenous and non-Indigenous Australians After adjusting for differences in the age structure of the Indigenous and non-Indigenous populations, Indigenous Australians with cardiovascular disease were more likely to have diabetes: • at 2.8 times and 3.2 times as often as non-Indigenous men and women with cardiovascular
disease, respectively (Table 5.12) • across all age groups, with the greatest disparity in those aged 25–44 years, at around
3.7 times as high as non-Indigenous Australians with cardiovascular disease.

65
Table 5.12: Prevalence of diabetes among Aboriginal and Torres Strait Islander peoples with long-term cardiovascular disease, by age group and sex, 2004–05
Age group (years) 18 years and over
Sex 25–44 45–64 65+ Total SPR(a)
Males
Per cent 17.5 41.8 39.0 31.0 . .
Rate ratio *4.4 3.0 +1.9 . . 2.8
Females
Per cent 12.2 35.2 42.2 25.4 . .
Rate ratio *3.2 3.6 2.7 . . 3.2
Persons
Per cent 14.2 37.8 40.8 27.6 . .
Rate ratio 3.7 3.2 2.3 . . 3.0
* Estimate has a relative standard error of 25% to 50% and should be interpreted with caution.
+ Rate ratios not statistically different from 1.0. That is, rates for Indigenous Australians are not significantly different from rates for non-Indigenous Australians.
(a) SPR (standardised prevalence ratio) is the ratio of the observed number of cases to the number of expected cases if Indigenous Australians had experienced the same age–sex-specific prevalence rates as non-Indigenous Australians.
Note: Based on self-reported data.
Source: AIHW analysis of the ABS 2004–05 NATSIHS CURF.
In Indigenous Australians without long-term cardiovascular disease… In Indigenous Australians aged 18 years and over without cardiovascular disease, the prevalence rate of diabetes as a current, long-term health condition was: • 7%, corresponding to an estimated 14,600 people (Table 5.13) • higher in women than men—1.5 times as likely as for men • higher in the older age groups. However, these age-specific rates for diabetes among the
Indigenous population without cardiovascular disease were still lower than the rates among those with the disease in all age groups.
Disparity between Indigenous and non-Indigenous Australians After adjusting for age, Indigenous Australians without cardiovascular disease experienced disparities in the prevalence rates for diabetes, at: • 2.9 times and 5.4 times as high as non-Indigenous men and women, respectively • three and nearly 7 times as high as in non-Indigenous men and women aged
45–64 years, respectively (Table 5.13).

66
Table 5.13: Prevalence of diabetes among Aboriginal and Torres Strait Islander peoples without long-term cardiovascular disease, by age group and sex, 2004–05
Age group (years) 18 years and over
Sex 25–44 45–64 Total SPR(a)
Males
Per cent 4.0 14.2 5.9 . .
Rate ratio 2.7 3.0 . . 2.9
Females
Per cent 7.2 19.0 8.3 . .
Rate ratio 6.0 6.8 . . 5.4
Persons
Per cent 5.7 16.5 7.1 . .
Rate ratio 4.2 4.3 . . 4.0
(a) SPR (standardised prevalence ratio) is the ratio of the observed number of cases to the number of expected cases if Indigenous Australians had experienced the same age–sex-specific prevalence rates as non-Indigenous Australians.
Notes
1. Based on self-reported data.
2. All rate ratios are statistically significantly different from rates for non-Indigenous Australians.
Source: AIHW analysis of the ABS 2004–05 NATSIHS CURF.
Long-term kidney disease Chronic kidney disease, particularly end-stage kidney disease, is an important contributor to mortality and disability among Indigenous Australians. Their poorer social economic status and poor access to health services, particularly for those living in remote communities, contributes to the high prevalence rates of chronic kidney disease among Indigenous Australians (AIHW 2005a).
What is kidney disease? The kidney’s main functions are to filter waste products (such as urea) from the blood and regulate the
body’s water fluid levels. Kidney disease is the progressive loss of the kidney’s ability to perform these functions properly. This results in the waste building up in the blood and causing damage to the body. If the condition is long-term, the kidney’s ability to function is progressively lost and this damage is irreversible. This condition is known as chronic kidney disease.
End-stage kidney disease is where the kidney’s ability to function has deteriorated to the extent that the kidney’s ability to function is no longer sufficient and, if untreated, the individual’s health will deteriorate rapidly, resulting in premature death. People with end-stage kidney disease need dialysis or a kidney transplant to survive.
What is kidney disease as a long-term condition in this report? ‘Long-term kidney disease’ refers to those respondents who reported having kidney disease as a current
and long-term condition. The term ‘long-term kidney disease’ does not necessarily equate to chronic kidney disease (which
includes diabetic nephropathy, hypertensive renal disease, glomerular disease, chronic kidney failure and end-stage kidney disease), as there may be other reasons for kidney disease to be classified as long-term. However, as it is likely that many of those who responded to having this condition would have chronic kidney disease, it is useful to interpret the results with an understanding of chronic kidney disease.

67
What are the risk factors for chronic kidney disease? Many factors may contribute to the risk of developing chronic kidney disease. These include diabetes,
certain kinds of infections, metabolic syndrome, high blood pressure, heredity, injury, overweight and obesity, tobacco smoking and use of certain pain killers.
Why is chronic kidney disease a risk factor for cardiovascular disease? Chronic kidney disease is commonly associated with an increased prevalence of other cardiovascular
risk factors, such as hypertension, and can also increase the risk of developing various complications and diseases, such as heart disease. The risk of developing complications increases with the level at which the kidney is unable to function properly. Chronic kidney disease also shares several risk factors that are common with cardiovascular disease.
How many Indigenous Australians have kidney disease as a long-term condition? Based on self-reported information in the NATSIHS, the prevalence of kidney disease as a long-term health condition in Indigenous Australians aged 18 years and over was: • less than 3%, corresponding to an estimated 7,500 people • similar for men and women, after adjusting for age • higher in older people, increasing from 2% in those aged 25–44 years to 8% in those aged
65 years and over. Note that the estimate for long-term kidney disease among Indigenous Australians aged 65 years and over has a relative standard error of 25% to 50% and should be interpreted with caution.
As chronic kidney disease has few specific symptoms and often remains undetected until the late stages, many people may not be aware that they actually have the condition. Therefore, any self-reported information would underestimate its prevalence.
Although no national data on the prevalence of chronic kidney disease among Aboriginal and Torres Strait Islander peoples are available, several studies show that rates of chronic kidney disease and indicators of kidney damage are highly prevalent among Indigenous communities. One explanation for this disparity is the high prevalence of risk factors present in the Indigenous population, leading to an increased risk of developing chronic kidney disease. Another is their poor access to services that detect and treat the disease, particularly for those living in very remote regions of Australia (AIHW 2005a; Brady 2003).
Information on Indigenous Australians with treated end-stage kidney disease is available from the Australia and New Zealand Dialysis and Transplant Registry (ANZDATA). This registry collects information on people who have dialysis or kidney transplants, and provides a measure for estimating the incidence and prevalence of treated end-stage kidney disease (See Chapter 2 for more information).
What is the incidence of treated end-stage kidney disease among Aboriginal and Torres Strait Islander peoples? Between 2002 and 2005, just over 8,048 new patients beginning end-stage kidney disease treatment were registered with ANZDATA in Australia. Of these, 742 (around 9.2%) had identified as Aboriginal or Torres Strait Islander. This is a much higher proportion than the 2.5% Indigenous representation in the total Australian population at 30 June 2006.

68
Disparity between Indigenous and non-Indigenous Australians Aboriginal and Torres Strait Islander patients commencing end-stage kidney disease treatment were much younger than other Australians commencing treatment, with around two-thirds (61%) of Indigenous patients being aged less than 55 years, whereas less than one-third (32%) of other Australian patients were below that age. Indigenous Australians had higher age-specific incidence rates in every age group over 25 years compared with other Australians. The greatest disparities were among those aged 45–54 years and 55–64 years, at 17 times and 14 times as high as for other Australians (Figure 5.8).
After adjusting for differences in the age structure of the two populations, the incidence rate for treated end-stage kidney disease was much higher for Indigenous Australians than for other Australians—9 times as high.
Number per 1,000 population
0.0
0.5
1.0
1.5
2.0
2.5
3.0
0–24 25–34 35–44 45–54 55–64 65+
Age group (years)
Indigenous Australians
Other Australians
Note: ‘Other Australians’ includes non-Indigenous cases and cases for which Indigenous status was not stated.
Source: AIHW analysis of ANZDATA Registry; Excell & McDonald 2005.
Figure 5.8: Incidence of treated end-stage kidney disease, by Indigenous status and age group, 2002–2005
What is the prevalence of treated end-stage kidney disease among Aboriginal and Torres Strait Islander peoples? As at 31 December 2005, nearly 15,100 patients with end-stage kidney disease were registered with ANZDATA, of which 7% were Indigenous Australians.
Disparity between Indigenous and non-Indigenous Australians Of Indigenous patients registered, 87% were receiving dialysis to treat their condition, but only 13% had received a kidney transplant. In comparison, 54% of other Australian patients were reliant on dialysis and 46% had received a kidney transplant.

69
Indigenous Australians were 5.7 times as likely as other Australians to be treated for end-stage kidney disease. They were 11.4 times as likely to be reliant on dialysis as treatment as other Australians.
Once Indigenous patients begin dialysis treatment they are less likely to be placed on the active transplant waiting list and, even if they are on the waiting list, they are less likely to receive transplantations. Reasons for these disparities include miscommunication between Indigenous patients and health professionals, lack of understanding of their illness and its treatments, and lower rates of well-matched kidney donors for Indigenous patients than for other patients (Cass et al. 2003; McDonald & Russ 2003).
How many Indigenous Australians with long-term kidney disease also have cardiovascular disease? In Indigenous Australians aged 18 years and over with kidney disease as a long-term health condition, those who also had cardiovascular disease: • represented over half (55%) of the population • were just as likely to be men as women, after adjusting for age • were more likely to be in the older age group, with cardiovascular disease being most
common in those aged 55 years and over (75%).
From the ANZDATA register, between 2002 and 2005, Aboriginal and Torres Strait Islander patients beginning treatment for end-stage kidney disease were known or suspected to also have coronary heart disease at slightly higher proportions than other Australian patients—44% compared with 39%. For cerebrovascular disease, no statistically significant difference was observed between Indigenous and other Australian patients with end-stage kidney disease.
Summary and conclusion
Prevalence of risk factors and conditions associated with cardiovascular disease in Indigenous Australians In 2004–05, nearly all Aboriginal and Torres Strait Islanders peoples aged 18 years and over had at least one of the following risk factors for cardiovascular disease: daily tobacco smoking, physical inactivity, consumption of less than two serves of fruit each day, consumption of less than five serves of vegetables each day, long-term risky/high-risk alcohol consumption, hypertension, obesity, diabetes and long-term kidney disease. Over half (53%) of Indigenous Australians had three or four multiple risk factors and 13% had five or more.
Between 2001 and 2004–05, individual risk factor levels among Indigenous Australians had either worsened or changed little. The age-standardised prevalence rates for physical inactivity, long-term risky/high-risk alcohol consumption and long-term kidney disease had increased between the two periods (ABS 2002b; AIHW 2007). However, there were no statistically significant differences in the prevalence rates for daily smoking, consumption of less than two serves of fruit each day, hypertension, overweight and obesity, and diabetes. Information on the daily consumption of less than five serves of vegetables was not available in 2001.
70
Having cardiovascular disease as a long-term condition was associated with multiple coexisting risk factors. Indigenous Australians with cardiovascular disease were nearly twice as likely to have five or more risk factors as those without the disease. Diabetes and obesity were both more prevalent among Indigenous Australians with cardiovascular disease compared with those without the disease—1.9 times as high for diabetes and 1.5 times for obesity.
Disparities between Indigenous and non-Indigenous Australians Indigenous Australians had poorer risk factor profiles than non-Indigenous Australians for nearly all risk factors associated with cardiovascular disease investigated in this report; the exception was insufficient daily vegetable consumption. In 2004–05, diabetes had the largest disparity, at nearly 4 times as high as non-Indigenous Australians, followed by daily tobacco smoking (2.1 times), obesity (1.9 times), hypertension (1.6 times) and physical inactivity (1.5 times).
Indigenous Australians were also more likely to have multiple risk factors and a higher number of coexisting risk factors than non-Indigenous Australians, being nearly 4 times as likely as non-Indigenous Australians to have five or more coexisting risk factors.
Among those with cardiovascular disease, the disparities in risk factors between Indigenous and non-Indigenous Australians were greatest for diabetes, followed by daily tobacco smoking, obesity and physical inactivity. This disparity pattern was also observed among those without the disease.
Comparison of the disparities in risk factors between the Indigenous and non-Indigenous populations showed a greater disparity in the prevalence rates for tobacco smoking in those with cardiovascular disease than those without the disease. However, among those with cardiovascular disease, the disparity for diabetes and obesity was smaller compared with those without cardiovascular disease. In addition, disparity in rates for the consumption of alcohol at risky/high-risk levels was present in those without cardiovascular disease but there was no statistical significant difference in rates in those with the disease.
These risk factors are all highly preventable and manageable, and their high prevalence highlights the continuing need for effective interventions to prevent and reduce their impact, as well as the risk of developing chronic disease (AIHW: Tong & Stevenson 2007; Brown et al. 2005). Public education campaigns and changing attitudes of the community have led to the decline in some risk factor rates, such as daily smoking which has been declining since the 1950s in the total Australian population, but is still common among Indigenous Australians (ABS 2007c; AIHW 2006a; Thompson et al. 2003). In addition, treatment and care for the prevention and control these risk factors in Indigenous Australians may be affected by several factors, such as distance to health services, availability of transport to access these services, as well as language and cultural differences (ABS & AIHW 2005; AIHW 2004; Brady 2003).

71
Appendix 1: Statistical methods
Cause of death classification Australia uses the International Statistical Classification of Diseases and Related Health Problems, Tenth Revision (ICD-10) for coding of causes of death. The table below lists the ICD-10 disease and procedure codes used in this report.
Table A1.1: Codes for death data used in this report
Disease ICD-10 codes
Acute rheumatic fever and chronic rheumatic heart disease I00–I09
Cerebrovascular disease I60–I69
Coronary heart disease I20–I25
Acute myocardial infarction I21
Angina I20
Heart failure I50
Cardiovascular disease I00–I99
Rates This report presents age-specific rates, standardised prevalence ratios, standardised mortality ratios and rate ratios in examining the level of inequality between Indigenous Australians and other Australians. These analytical concepts are described below.
Age-specific rates Age-specific rates were calculated by dividing the number of events (such as prevalence, or deaths) occurring in each specified age group by the population at risk for the corresponding age group.
Crude rates Crude rates were calculated by dividing the total number of events (such as incidence) by the total population at risk.
Rate ratios Standardised ratios, including standardised prevalence ratios for prevalence rates and standardised mortality ratios for death rates, were used to remove the influence of age when comparing populations with different age structures. In this report, indirect age standardisation has been used, as the Indigenous Australian population is relatively small and there is some uncertainty about the stability of age-specific rates. The non-Indigenous Australian population has been used as the standard population and the Aboriginal and Torres Strait Islander population has been used as the study population in these analyses. The method used for indirect age standardisation entails four steps:

72
Step 1: Calculate the age-specific rates for each age group in the standard population.
Step 2: Apply these age-specific rates to the number in each age group of the study population and sum to derive the total expected number of cases for the study population.
Step 3: Sum the observed cases in the study population and divide this number by the expected number derived in Step 2 to calculate the rate ratio.
Step 4: The 95% confidence intervals were calculated.
A rate ratio of 1.0 indicates that there were the same number of observed cases as were expected, suggesting rates in the study and standard populations are similar. A result greater than 1.0 indicates more cases than expected. A result less than 1.0 indicates fewer cases than expected. For example, if there are twice as many deaths as expected (standardised mortality ratio of 2.0) then the rate of death in Indigenous Australians can be assumed to be twice that of non-Indigenous Australians.
The 95% confidence intervals around the ratio values are used to provide an approximate indication of the differences between rates. If a rate ratio value of 1.0 is not within the confidence interval, then the ratio is regarded as statistically significant at the 95% level and therefore, there is at least 95% confidence that the difference is unlikely to have arisen by chance.

73
Appendix 2: Detailed statistical tables
Table A2.1: Estimated resident population, 31 December 2004 and 30 June 2006.
At 31 December 2004 At 30 June 2006
Age group (years) Indigenous Non-Indigenous Indigenous Non-Indigenous
Males
0–4 30,825 622,390 32,592 639,591
5–9 32,826 636,745 33,261 654,096
10–14 29,116 674,923 33,156 686,102
15–19 29,309 665,460 28,233 698,033
20–24 16,521 682,692 22,525 725,402
25–29 16,399 649,969 18,315 690,061
30–34 16,175 718,151 17,822 725,564
35–39 15,020 699,729 16,721 742,822
40–44 12,166 739,479 14,578 748,001
45–49 11,320 699,924 12,175 728,961
50–54 7,492 640,675 9,726 669,307
55–59 5,675 597,178 6,956 629,767
60–64 4,097 456,558 4,626 491,446
65–69 2,977 364,529 2,936 382,290
70–74 1,904 291,162 1,879 300,899
75 or over 539 460,845 1,980 520,515
Total 232,362 9,600,410 257,481 10,032,857
Females
0–4 29,358 575,648 31,430 605,038
5–9 31,333 605,880 31,686 621,736
10–14 27,211 644,424 31,293 650,162
15–19 24,263 638,527 26,494 661,906
20–24 21,974 649,520 22,035 699,470
25–29 17,398 651,719 18,716 679,374
30–34 19,800 741,515 18,665 731,102
35–39 18,792 709,808 18,224 749,664
40–44 13,079 750,550 15,808 756,322
45–49 12,272 709,328 13,041 741,111
50–54 8,494 655,653 10,315 674,332
55–59 6,015 597,087 7,585 627,251
60–64 5,142 448,601 5,147 486,628
65–69 3,215 373,293 3,605 390,338
70–74 2,011 316,346 2,466 323,894
75 or over 1,590 624,078 3,183 753,129
Total 241,948 9,691,977 259,693 10,151,457
Source: ABS 2007a; AIHW analysis of the ABS 2004–05 NATSIHS CURF.

74
Table A2.2: Populations with cardiovascular disease and without cardiovascular disease, by Indigenous status, sex and age group, 2004–05
With cardiovascular disease Without cardiovascular disease
Indigenous Non-Indigenous Indigenous Non-Indigenous
Age group (years) Number
Age-specific
rate(a) Number
Age-specific
rate(a) Number
Age-specific
rate(a) Number
Age-specific
rate(a)
Males
0–17 1,500 13.0 40,900 17.5 110,000 987.0 2,302,000 982.5
18–24 *800 *29.1 *26,300 *28.0 25,900 970.9 913,000 972.0
25–34 2,500 77.3 77,100 56.3 30,100 922.7 1,291,000 943.7
35–44 5,000 183.1 144,000 100.1 22,200 816.9 1,295,000 899.9
45–54 5,400 286.0 263,000 196.0 13,400 714.0 1,078,000 804.0
55–64 3,700 376.2 362,000 343.8 6,100 623.8 691,000 656.2
65+ 3,200 590.9 631,000 565.0 2,200 409.1 486,000 435.0
Total 22,000 . . 1,544,000 . . 210,400 . . 8,056,000 . .
Females
0–17 *1,600 *15.7 24,400 11.1 102,000 984.3 2,172,000 988.9
18–24 1,800 61.4 39,500 43.1 28,200 938.6 878,000 956.9
25–34 5,100 137.1 141,000 101.4 32,100 862.9 1,252,000 898.6
35–44 7,300 228.2 214,000 146.3 24,600 771.8 1,247,000 853.7
45–54 7,000 339.2 342,000 250.4 13,700 660.8 1,023,000 749.6
55–64 6,800 606.0 410,000 391.6 4,400 394.0 636,000 608.4
65+ 4,200 622.6 758,000 576.8 2,600 377.4 556,000 423.2
Total 33,900 . . 1,928,000 . . 208,000 . . 7,764,000 . .
Persons
0–17 3,100 14.3 65,300 14.4 213,000 985.7 4,474,000 985.6
18–24 2,600 46.2 65,800 35.4 54,100 953.8 1,791,000 964.6
25–34 7,600 109.2 218,000 79.1 62,200 890.8 2,543,000 920.9
35–44 12,300 207.4 358,000 123.4 46,800 792.6 2,542,000 876.6
45–54 12,400 313.9 604,000 223.4 27,200 686.1 2,101,000 776.6
55–64 10,400 498.7 772,000 367.6 10,500 501.3 1,328,000 632.4
65+ 7,400 608.6 1,389,000 571.4 4,800 391.4 1,042,000 428.6
Total 55,900 . . 3,472,000 . . 418,000 . . 15,820,000 . .
* Estimate has a relative standard error of 25% to 50% and should be interpreted with caution.
(a) Age-specific rates per 1,000 population.
Note: Based on self-reported data.
Source: AIHW analysis of the ABS 2004–05 NATSIHS CURF.

75
Table A2.3: Deaths from cardiovascular disease, by Indigenous, sex and age group, 2002–2005
Indigenous Non-Indigenous
Age group (years) Number Age-specific rate(a) Number Age-specific rate(a)
Males
0–24 20 6.6 77 1.7
25–34 55 84.2 139 9.0
35–44 167 329.8 499 30.5
45–54 197 614.1 1,447 94.7
55–64 171 1,076.5 2,932 254.4
65+ 255 2,469.5 26,857 2,204.5
Total(b) 868 . . 31,956 . .
Females
0–24 19 6.5 37 0.9
25–34 26 36.9 68 4.4
35–44 93 166.9 198 12.0
45–54 117 333.0 430 28.2
55–64 107 584.9 931 84.0
65+ 315 2,322.7 32,042 2,169.1
Total(b) 680 . . 33,708 . .
Persons
0–24 39 6.6 114 1.3
25–34 81 59.7 207 6.7
35–44 260 244.4 697 21.2
45–54 314 467.2 1,877 61.5
55–64 278 813.4 3,863 170.9
65+ 570 2,386.1 58,899 2185.1
Total(b) 1,548 . . 65,664 . .
(a) Age-specific rates per 100,000 population.
(b) Includes deaths at unknown ages.
Notes
1. Data are for Indigenous deaths for usual residents of Queensland, Western Australia, South Australia and Northern Territory.
2. Deaths are based on year of occurrence of death for 2002–2004 and year of registration of death for 2005.
Source: AIHW National Mortality Database.

76
Table A2.4: Prevalence of coronary heart disease, by Indigenous status, sex and age group, 2004–05
Indigenous Non-Indigenous
Age group (years) Number Age-specific rate(a) Number Age-specific rate(a)
Males
0–24 **100 **0.7 **500 **0.2
25–44 *700 *11.2 *10,800 *3.8
45–64 1,200 42.9 64,500 26.9
65+ *800 *152.6 125,000 111.8
Total 2,800 . . 201,000 . .
Females
0–24 **30 **0.2 **500 **0.1
25–44 *400 *6.2 *3,200 *1.1
45–64 *2,100 *64.5 30,300 12.6
65+ *500 *71.9 96,300 73.3
Total 3,000 . . 130,000 . .
Persons
0–24 **100 **0.4 **1,000 **0.1
25–44 1,100 8.5 *14,000 *2.5
45–64 3,300 54.3 94,800 19.7
65+ 1,300 107.6 221,000 91.0
Total 5,800 . . 331,000 . .
* Estimate has a relative standard error of 25% to 50% and should be interpreted with caution.
** Estimate has a relative standard error greater than 50%and is considered too unreliable for general use.
(a) Age-specific rates per 1,000 population.
Note: Based on self-reported data.
Source: AIHW analysis of the ABS 2004–05 NATSIHS CURF.

77
Table A2.5: Prevalence of cerebrovascular disease, by Indigenous status, sex and age group, 2004–05
Indigenous Non-Indigenous
Age group (years) Number Age-specific rate(a) Number Age-specific rate(a)
Males
0–24 – . . **2,000 **0.6
25–44 **100 **1.1 **2,500 **0.9
45–64 *500 *17.5 *10,200 *4.3
65+ **100 **17.7 31,900 28.6
Total *700 . . 46,700 . .
Females
0–24 – . . – . .
25–44 **200 **2.8 **1,500 **0.5
45–64 *300 *10.6 *14,000 *5.8
65+ **200 **26.8 26,400 20.1
Total 700 . . 41,900 . .
Persons
0–24 – . . **2,000 **0.3
25–44 *300 *2.0 **4,000 **0.7
45–64 *800 *13.9 24,300 5.1
65+ *300 *22.8 58,300 24.0
Total 1,400 . . 88,600 . .
* Estimate has a relative standard error of 25% to 50% and should be interpreted with caution.
** Estimate has a relative standard error greater than 50%and is considered too unreliable for general use.
(a) Age-specific rates per 1,000 population.
Note: Based on self-reported data.
Source: AIHW analysis of the ABS 2004–05 NATSIHS CURF.

78
Table A2.6: Prevalence of heart failure, by Indigenous status, sex and age group, 2004–05
Indigenous Non-Indigenous
Age group (years) Number Age-specific rate(a) Number Age-specific rate(a)
Males
0–24 **200 **1.2 **600 **0.2
25–44 **300 **5.4 **3,400 **1.2
45–64 **800 **26.7 26,300 11.0
65+ **200 **32.1 55,700 49.8
Total *1,400 . . 85,900 . .
Females
0–24 **200 **1.1 **1,000 **0.3
25–44 *500 *7.8 20,600 7.2
45–64 *1,900 *60.5 63,700 26.4
65+ *500 *73.1 84,200 64.1
Total 3,100 . . 170,000 . .
Persons
0–24 *300 *1.2 *1,600 *0.2
25–44 *900 *6.7 24,000 4.2
45–64 *2,700 *44.6 90,100 18.7
65+ *700 *55.0 140,000 57.6
Total 4,500 . . 255,000 . .
* Estimate has a relative standard error of 25% to 50% and should be interpreted with caution.
** Estimate has a relative standard error greater than 50%and is considered too unreliable for general use.
(a) Age-specific rates per 1,000 population.
Note: Based on self-reported data.
Source: AIHW analysis of the ABS 2004–05 NATSIHS CURF.

79
Table A2.7: Prevalence of hypertension, by Indigenous status, sex and age group, 2004–05
Indigenous Non-Indigenous
Age group (years) Number Age-specific rate(a) Number Age-specific rate(a)
Males
0–24 **400 **3.1 *7,400 *2.3
25–44 5,000 84.0 106,000 37.7
45–64 7,100 249.5 464,000 193.6
65+ 2,400 442.4 409,000 366.2
Total 15,000 . . 986,000 . .
Females
0–24 *500 *3.9 *6,700 *2.2
25–44 5,100 73.6 75,000 26.3
45–64 9,700 303.6 454,000 188.3
65+ 3,400 492.9 548,000 417.0
Total 18,700 . . 1,084,000 . .
Persons
0–24 *1,000 *3.5 *14,100 *2.2
25–44 10,100 78.4 181,000 32.0
45–64 16,800 278.1 918,000 190.9
65+ 5,800 470.5 957,000 393.7
Total 33,600 . . 2,069,000 . .
* Estimate has a relative standard error of 25% to 50% and should be interpreted with caution.
** Estimate has a relative standard error greater than 50%and is considered too unreliable for general use.
(a) Age-specific rates per 1,000 population.
Note: Based on self-reported data.
Source: AIHW analysis of the ABS 2004–05 NATSIHS CURF.

80
Table A2.8: Prevalence of rheumatic heart disease in Aboriginal and Torres Strait Islander peoples, by sex and age group, 2004–05
Age group (years) Number Age-specific rate(a)
Males
0–24 **300 **2.0
25–44 **100 **2.0
45–64 **500 **16.3
65+ **30 **5.0
Total *900 . .
Females
0–24 *1,000 *7.6
25–44 1,000 14.8
45–64 *500 *14.8
65+ **100 **17.6
Total 2,600 . .
Persons
0–24 *1,300 *4.8
25–44 1,100 8.8
45–64 *900 *15.5
65+ **100 **12.0
Total 3,500 . .
* Estimate has a relative standard error of 25% to 50% and should be interpreted with caution.
** Estimate has a relative standard error greater than 50%and is considered too unreliable for general use.
(a) Age-specific rates per 1,000 population.
Note: Based on self-reported data.
Source: AIHW analysis of the ABS 2004–05 NATSIHS CURF.

81
Table A2.9: Prevalence of daily tobacco smoking, by Indigenous status, sex and age group, persons aged 18 years and over, 2004–05
Indigenous Non-Indigenous
Age group (years) Number Age-specific rate(a) Number Age-specific rate(a)
Males
18–24 13,500 504.1 277,000 294.4
25–44 33,600 563.0 823,000 293.2
45–64 12,900 452.5 540,000 225.7
65+ 1,700 322.5 99,000 88.7
Total 61,800 . . 1,739,000 . .
Females
18–24 15,200 505.7 207,000 225.7
25–44 37,000 535.7 651,000 228.3
45–64 14,200 444.0 410,000 169.9
65+ 1,100 160.3 77,400 58.9
Total 67,400 . . 1,346,000 . .
Persons
18–24 28,600 505.0 484,000 260.5
25–44 70,600 548.4 1,474,000 260.5
45–64 27,100 448.0 950,000 197.7
65+ 2,800 232.2 176,000 72.6
Total 129,000 . . 3,085,000 . .
(a) Age-specific rates per 1,000 population.
Note: Based on self-reported data.
Source: AIHW analysis of the ABS 2004–05 NATSIHS CURF.

82
Table A2.10: Prevalence of physical inactivity(a), by Indigenous status, sex and age group, persons aged 18 years and over, 2004–05
Indigenous Non-Indigenous
Age group (years) Number Age-specific rate(b) Number Age-specific rate(b)
Males
18–24 7,100 349.2 229,000 247.1
25–44 17,400 418.4 840,000 303.0
45–64 12,200 577.9 874,000 369.7
65+ 2,100 604.3 441,000 398.2
Total 38,900 . . 2,383,000 . .
Females
18–24 10,800 487.6 289,000 317.6
25–44 24,600 505.1 860,000 305.6
45–64 13,000 548.1 757,000 318.8
65+ 3,100 703.1 642,000 490.8
Total 51,500 . . 2,548,000 . .
Persons
18–24 17,900 421.3 517,000 282.1
25–44 42,000 465.2 1,700,000 304.3
45–64 25,200 562.2 1,630,000 344.2
65+ 5,200 659.5 1,084,000 448.4
Total 90,300 . . 4,931,000 . .
(a) Did 25 minutes or less of physical activity in the 2 weeks before the survey interview.
(b) Age-specific rates per 1,000 population.
Notes
1. Based on self-reported data.
2. Non-remote areas only.
Source: AIHW analysis of the ABS 2004–05 NATSIHS CURF.

83
Table A2.11: Prevalence of low fruit and/or vegetable consumption, by Indigenous status, sex and age group, persons aged 18 years and over, 2004–05
Indigenous Non-Indigenous
Age group (years) Number Age-specific rate(a) Number Age-specific rate(a)
Low fruit consumption(b)
Males
18–24 13,500 662.1 569,000 615.5
25–44 27,400 658.9 1,630,000 588.1
45–64 12,400 584.2 1,118,000 473.4
65+ 1,600 471.6 428,000 386.4
Total 54,900 . . 3,746,000 . .
Females
18–24 14,000 631.3 450,000 494.2
25–44 29,300 602.2 1,264,000 449.1
45–64 10,500 446.0 818,000 344.7
65+ 1,800 405.6 406,000 310.4
Total 55,600 . . 2,938,000 . .
Persons
18–24 27,400 646.1 1,019,000 555.3
25–44 56,800 628.3 2,894,000 518.1
45–64 22,900 511.3 1,937,000 408.9
65+ 3,400 434.7 834,000 345.2
Total 111,000 . . 6,683,000 . .
Low vegetable consumption(c)
Males
18–24 19,100 937.4 855,000 925.1
25–44 38,300 921.2 2,506,000 904.1
45–64 19,100 902.3 2,014,000 852.4
65+ 3,300 939.7 906,000 817.7
Total 79,800 . . 6,281,000 . .
Females
18–24 20,400 920.4 825,000 907.2
25–44 42,400 869.9 2,424,000 861.5
45–64 20,400 861.8 1,880,000 792.1
65+ 4,000 900.8 1,075,000 821.3
Total 87,100 . . 6,204,000 . .
Persons
18–24 39,500 928.5 1,681,000 916.3
25–44 80,700 893.5 4,930,000 882.6
45–64 39,500 880.9 3,894,000 822.2
65+ 7,200 918.0 1,981,000 819.7
Total 167,000 . . 12,486,000 . .
(continued)

84
Table A2.11 (continued): Prevalence of low fruit and/or vegetable consumption, by Indigenous status, sex and age group, persons aged 18 years and over, 2004–05
Indigenous Non-Indigenous
Age group (years) Number Age-specific rate(a) Number Age-specific rate(a)
Low fruit and vegetable consumption(d)
Males
18–24 12,700 625.2 543,000 587.1
25–44 25,900 623.4 1,531,000 552.4
45–64 11,800 559.3 1,022,000 432.5
65+ 1,500 431.7 370,000 334.3
Total 52,000 . . 3,466,000 . .
Females
18–24 13,500 610.0 423,000 465.0
25–44 26,600 545.7 1,137,000 404.2
45–64 9,400 399.1 707,000 298.0
65+ 1,700 378.4 360,000 275.4
Total 51,200 . . 2,628,000 . .
Persons
18–24 26,200 617.3 966,000 526.5
25–44 52,500 581.5 2,668,000 477.7
45–64 21,300 474.8 1,729,000 365.1
65+ 3,200 401.9 731,000 302.4
Total 103,000 . . 6,094,000 . .
(a) Age-specific rates per 1,000 population.
(b) Low fruit consumption refers to the daily intake of one or less serves of fruit.
(c) Low vegetable consumption refers to the daily intake of four or less serves of vegetables.
(d) Low fruit and vegetable consumption refers to the daily intake of one or less serves of fruit and four or less serves of vegetables.
Notes
1. Based on self-reported data.
2. Non-remote areas only.
Source: AIHW analysis of the ABS 2004–05 NATSIHS CURF.

85
Table A2.12: Prevalence of overweight and obesity, by Indigenous status, sex and age group, persons aged 18 years and over, 2004–05
Indigenous Non-Indigenous
Age group (years) Number Age-specific rate(a) Number Age-specific rate(a)
Overweight but not obese(b)
Males
18–24 7,100 300.5 247,000 283.4
25–44 18,900 342.1 1,199,000 449.4
45–64 9,300 361.4 1,066,000 468.7
65+ *2,200 *506.5 442,000 418.7
Total 37,500 . . 2,954,000 . .
Females
18–24 4,700 200.5 159,000 193.6
25–44 13,100 235.0 657,000 253.1
45–64 7,300 278.8 687,000 318.3
65+ 1,300 287.0 369,000 326.5
Total 26,400 . . 1,873,000 . .
Persons
18–24 11,800 250.9 406,000 239.9
25–44 32,000 288.3 1,856,000 352.6
45–64 16,600 319.7 1,753,000 395.4
65+ 3,500 392.3 811,000 371.0
Total 63,900 . . 4,827,000 . .
Obese(c)
Males
18–24 4,100 171.7 61,900 70.9
25–44 16,000 290.5 540,000 202.2
45–64 9,100 352.2 550,000 241.8
65+ *1,100 *253.6 156,000 148.2
Total 30,200 . . 1,308,000 . .
Females
18–24 4,400 189.2 65,800 80.1
25–44 20,100 360.8 392,000 151.0
45–64 11,000 419.5 475,000 219.9
65+ 1,900 408.7 194,000 171.9
Total 37,400 . . 1,127,000 . .
Persons
18–24 8,500 180.4 128,000 75.4
25–44 36,100 325.8 932,000 177.0
45–64 20,100 386.2 1,024,000 231.1
65+ 3,000 334.3 351,000 160.5
Total 67,700 . . 2,435,000 . .(continued)

86
Table A2.12 (continued): Prevalence of overweight and obesity, by Indigenous status, sex and age group, persons aged 18 years and over, 2004–05
Indigenous Non-Indigenous
Age group (years) Number Age-specific rate(a) Number Age-specific rate(a)
Overweight(d)
Males
18–24 11,200 472.1 309,000 354.3
25–44 34,900 632.7 1,739,000 651.6
45–64 18,400 713.6 1,615,000 710.5
65+ 3,300 760.1 598,000 567.0
Total 67,700 . . 4,262,000 . .
Females
18–24 9,100 389.7 225,000 273.8
25–44 33,200 595.8 1,049,000 404.1
45–64 18,300 698.3 1,162,000 538.2
65+ 3,300 695.7 564,000 498.4
Total 63,800 . . 3,000,000 . .
Persons
18–24 20,200 431.3 534,000 315.2
25–44 68,000 614.1 2,788,000 529.6
45–64 36,700 705.9 2,777,000 626.6
65+ 6,500 726.6 1,162,000 531.5
Total 132,000 . . 7,261,000 . .
* Estimate has a relative standard error of 25% to 50% and should be interpreted with caution.
(a) Age-specific rates per 1,000 population.
(b) body mass index greater than or equal to 25 and less than 30.
(c) body mass index greater than or equal to 30.
(d) body mass index greater than or equal to 25.
Notes
1. Based on self-reported data.
2. Adjusted for survey non-response for height and weight used to derive the BMI.
Source: AIHW analysis of the ABS 2004–05 NATSIHS CURF.

87
Table A2.13: Prevalence of risk of long-term harm from alcohol consumption, by Indigenous status, sex and age group, persons aged 18 years and over, 2004–05
Indigenous Non-Indigenous
Age group (years) Number Age-specific rate(a) Number Age-specific rate(a)
Abstainers(b)
Males
18–24 3,100 115.7 99,900 106.3
25–44 7,600 127.3 222,000 79.2
45–64 7,800 272.4 244,000 102.0
65+ 2,200 413.3 203,000 181.9
Total 20,700 . . 770,000 . .
Females
18–24 6,000 200.7 113,000 123.2
25–44 18,200 263.9 440,000 154.1
45–64 12,400 387.0 501,000 207.6
65+ 4,800 707.9 450,000 342.3
Total 41,400 . . 1,503,000 . .
Persons
18–24 9,100 160.7 213,000 114.7
25–44 25,800 200.6 662,000 116.9
45–64 20,100 332.9 745,000 155.0
65+ 7,100 577.4 653,000 268.6
Total 62,200 . . 2,273,000 . .
Low-risk(c)
Males
18–24 10,100 377.6 467,000 496.7
25–44 25,100 419.1 1,618,000 576.4
45–64 9,200 321.3 1,327,000 554.1
65+ *1,700 *320.1 618,000 553.8
Total 46,100 . . 4,030,000 . .
Females
18–24 8,700 291.0 407,000 443.1
25–44 19,900 288.5 1,282,000 449.2
45–64 7,500 233.4 1,071,000 444.2
65+ *700 *103.5 455,000 346.6
Total 36,800 . . 3,215,000 . .
Persons
18–24 18,800 331.8 873,000 470.2
25–44 45,000 349.1 2,900,000 512.3
45–64 16,600 274.9 2,397,000 499.0
65+ 2,400 199.4 1,074,000 441.8
Total 82,900 . . 7,245,000 . .
(continued)

88
Table A2.13 (continued): Prevalence of risk of long-term harm from alcohol consumption, by Indigenous status, sex and age group, persons aged 18 years and over, 2004–05
Indigenous Non-Indigenous
Age group (years) Number Age-specific rate(a) Number Age-specific rate(a)
Risky/high-risk(d)
Males
18–24 5,200 194.4 143,000 152.7
25–44 12,500 209.7 442,000 157.4
45–64 5,500 192.5 432,000 180.5
65+ **200 **43.8 98,700 88.4
Total 23,500 . . 1,116,000 . .
Females
18–24 4,100 136.0 114,000 123.8
25–44 10,700 155.3 343,000 120.0
45–64 4,000 126.5 318,000 132.1
65+ *200 *30.1 99,300 75.6
Total 19,000 . . 874,000 . .
Persons
18–24 9,300 163.5 257,000 138.4
25–44 23,300 180.5 784,000 138.6
45–64 9,500 157.6 751,000 156.2
65+ *400 *36.2 198,000 81.5
Total 42,500 . . 1,990,000 . .
High-risk(e)
Males
18–24 2,100 78.5 79,900 85.1
25–44 7,900 132.2 241,000 85.8
45–64 3,600 126.0 216,000 90.1
65+ **100 **19.8 42,600 38.2
Total 13,700 . . 579,000 . .
Females
18–24 *2,100 *69.7 31,900 34.8
25–44 4,300 62.3 92,100 32.3
45–64 *1,500 *45.4 86,200 35.8
65+ **40 **5.5 26,000 19.8
Total 7,900 . . 236,000 . .
Persons
18–24 4,200 73.8 112,000 60.2
25–44 12,200 94.7 333,000 58.8
45–64 5,100 83.5 302,000 62.9
65+ *100 *11.8 68,600 28.2
Total 21,600 . . 815,000 . .
* Estimate has a relative standard error of 25% to 50% and should be interpreted with caution.
** Estimate has a relative standard error greater than 50%and is considered too unreliable for general use.
(a) Age-specific rates per 1,000 population.
(b) No alcohol consumed in the past 12 months or more ago or never consumed alcohol.

89
(c) Low-risk refers to the consumption of less than 50mls per day for males and less than 25mls per day for females.
(d) Risky/high-risk refers to the consumption of 50mls or greater per day for males and 25mls or greater per day for females.
(e) High-risk refers to the consumption of more than 75mls per day for males and more than 50mls per day for females.
Notes
1. Based on self-reported data.
2. Level of risk from alcohol consumption in the week before the survey interview.
Source: AIHW analysis of the ABS 2004–05 NATSIHS CURF.
Table A2.14: Prevalence of diabetes(a), by Indigenous status, sex and age group, persons aged 18 years and over, 2004–05
Indigenous Non-Indigenous
Age group (years) Number Age-specific rate(b) Number Age-specific rate(b)
Males
18–24 *300 *13.0 **4,200 **4.4
25–44 3,400 56.9 46,700 16.6
45–64 6,500 229.0 173,000 72.2
65+ *1,900 *359.4 190,000 170.0
Total 12,200 . . 413,000 . .
Females
18–24 *400 *14.8 *8,900 *9.7
25–44 5,600 81.1 43,600 15.3
45–64 8,300 260.3 121,000 50.1
65+ 2,600 376.9 162,000 123.4
Total 16,900 . . 335,000 . .
Persons
18–24 *800 *14.0 *13,100 *7.0
25–44 9,000 69.9 90,300 15.9
45–64 14,900 245.5 294,000 61.1
65+ 4,500 369.2 352,000 144.8
Total 29,200 . . 749,000 . .
* Estimate has a relative standard error of 25% to 50% and should be interpreted with caution.
(a) Diabetes or high sugar levels as a current, long-term condition.
(b) Age-specific rates per 1,000 population.
Note: Based on self-reported data.
Source: AIHW analysis of the ABS 2004–05 NATSIHS CURF.

90
Glossary
Aboriginal A person who identifies as an Aboriginal and is accepted as such by the community in which he or she lives. Aboriginal and Torres Strait Islander peoples and Indigenous Australian Terms used interchangeably when referring to people who have identified as Aboriginal and/or Torres Strait Islander. Age-specific rate A rate for a specific age group. The numerator and denominator relate to the same age group. Age standardisation A method of removing the influence of age when comparing populations with different age structures. Indirect age standardisation has been used in this report. A standardised ratio is calculated by comparing the actual number of events with the number expected if the age-specific rates in the non-Indigenous Australian population applied to the Indigenous population. A ratio of greater than 1.0 indicates more events than expected, whereas a ratio of less than 1.0 indicates fewer events than expected. Angina Temporary chest pain or discomfort when the heart’s own blood supply is inadequate to meet extra needs, for example during exercise. Atherosclerosis A process in which fatty and fibre-like deposits build up on the inner walls of arteries, often forming plaques that can then cause blockages. It is the main underlying condition in heart attack, angina, and stroke. Body mass index (BMI) The most commonly used method of assessing whether a person is normal weight, underweight, overweight or obese. It is calculated by dividing the person’s weight (in kilograms) by their height (in metres) square; that is, kg/m2. For both men and women, underweight is a BMI below 18.5, acceptable weight is from 18.5 to less than 25, overweight but not obese is 25 to 30, obese is 30 and over, morbidly obese is 40 and over and overweight is 25 and above (includes obese). Biomedical Relating to medicines which are concerned with the effects of the environment on the human body. Cardiovascular disease Any disease of the circulatory system, namely the heart (cardio) or blood vessels (vascular). Includes heart attack, coronary heart disease, angina, heart failure, rheumatic fever, rheumatic heart disease and stroke. Cerebrovascular disease Any disorder of the blood vessels supplying the brain or its covering membranes. A notable and major form of cerebrovascular disease is stroke.

91
Chronic Persistent and long-lasting. Chronic kidney disease Long-term condition where kidney function is lost progressively and irreversibly. End-stage renal disease is the final stage in the progressive deterioration of kidney function. In this situation, a person needs dialysis or a kidney transplant to remain alive. Circulatory system The heart along with the blood vessels, comprising the system that circulates blood around the body to supply oxygen and nutrients to all body tissues and to carry away waste products from them. Also known as the cardiovascular system. Confidence interval A statistical term describing a range (interval) of values within which we can be confident that the true value lies, usually because it has a 95% or higher chance of doing so. Coronary heart disease Its primary feature is insufficient blood supply to the heart itself. The two major clinical forms are heart attack (the insufficient blood supply is sudden and extreme) and angina. The underlying problem is atherosclerosis, a complex process where fatty and fibre-like deposits build up on the inner walls of the arteries, often forming plaques. Coronary heart disease is also known as ischaemic heart disease. Also see heart attack and angina. Crude incidence rate The number of new cases of a condition or disease within a specified time period divided by the total population at risk. Diabetes (diabetes mellitus) A chronic condition in which the body makes too little of the hormone insulin or cannot use it properly. This raises the blood level of the body’s major energy source, the sugar glucose, and causes other widespread disturbance of the body’s energy processes. Heart attack Life threatening emergency that occurs when a vessel supplying blood to the heart muscle is suddenly blocked completely by a blood clot. The medical term commonly used for a heart attack is myocardial infarction. Heart failure A condition where the heart cannot pump strongly enough to keep the blood circulating around the body at an adequate rate. High blood cholesterol The main cause of the process by which the blood vessels that supply the heart and other parts of the body become clogged. Hyperglycaemia High blood glucose levels. Hypertension Disease occurring when high blood pressure (hypertension) is severe or prolonged enough to cause damage to the heart, brain or kidneys.

92
Incidence The number of new cases of a condition or disease occurring in a population within a specified time period. Indigenous A person who identifies as Aboriginal and/or Torres Strait Islander and is accepted as such by the community with which he or she lives. International Classification of Diseases The World Health Organization’s internationally accepted classification of death and disease. The 10th Revision (ICD-10) is currently in use. Long-term kidney disease Refers to those respondents who reported having kidney disease as a current and long-term condition. Mortality
Death. Myocardial infarction Term still commonly used to mean a heart attack, but more correctly refers only to hose heart attacks which have caused some death of heart muscle. Non-Indigenous Australian Refers to people who have said they are non–Indigenous. Obese Defined as a body mass index 30 or over. Oedema Build-up or congestion of fluid in the tissues of the body, causing swelling. Other Australian Refers to people who have said they are non-Indigenous and people whose Indigenous status has not been stated. Overweight Defined as a body mass index 25 or over. Prevalence The number or proportion (of cases, instances, and so forth) present in a population at a given time. Compare with incidence. Rate ratio Relative measure of inequality which is calculated as the rate for Indigenous Australians divided by the rate for non-Indigenous Australians. For the age-standardised case, it is the ratio of the observed to the expected number of cases had the rates for other Australians applied. Rheumatic fever An acute, serious disease that affects mainly children and young adults and can damage the heart valves, the heart muscle and its lining, the joints and the brain. It is brought on by a reaction to a throat infection by a particular bacterium. See rheumatic heart disease.

93
Rheumatic heart disease Chronic disease from damaged heart valves caused by earlier attack(s) of rheumatic fever. Risk factor Any factor that represents a greater risk of a health disorder or unwanted condition or event. Statistical significance An indication from a statistical test that an observed difference or association may be significant or real because it is unlikely to be due just to chance. A statistical result is usually said to be significant if it would occur by chance only once in 20 times or less often. Stroke A condition where an artery supplying blood to the brain suddenly becomes blocked or bleeds. It often causes paralysis of parts of the body normally controlled by that area of the brain, or speech problems and other symptoms. Torres Strait Islander A person who identifies as a Torres Strait Islander and is accepted as such by the community in which he or she lives. Triglycerides The more common form in which fats exist in the body in which three lipid (fat) molecules are packaged with proteins and cholesterol and are found in both the blood plasma and adipose (fatty) tissue. Underlying cause of death The condition, disease or injury initiating the sequence of events leading to death, that is, the primary, chief, main or principal cause.

94
References
ABS (Australian Bureau of Statistics) 2002a. Australian social trends 2002. ABS cat. no. 4102.0. Canberra: ABS.
ABS 2002b. National Health Survey: Aboriginal and Torres Strait Islander results, Australia 2001. ABS cat. no. 4715.0. Canberra: ABS.
ABS 2004. National Aboriginal and Torres Strait Islander social survey 2002. ABS cat. no. 4714.0. Canberra: ABS.
ABS 2006. National Aboriginal and Torres Strait Islander Health Survey, 2004–05. ABS cat. no. 4715.0. Canberra: ABS.
ABS 2007a. Australian demographic statistics, March quarter 2007. ABS cat. no. 3101.0. Canberra: ABS.
ABS 2007b. Population distribution, Aboriginal and Torres Strait Islander Australians, 2006. ABS cat. no. 4705.0. Canberra: ABS.
ABS 2007c. Tobacco smoking, Aboriginal and Torres Strait Islander people: a snapshot, 2004–05. ABS cat. no. 4722.0.55.004. Canberra: ABS. Viewed October 2007, <www.abs.gov.au>.
ABS & AIHW (Australian Institute of Health and Welfare) 2005. The health and welfare of Australia’s Aboriginal and Torres Strait Islander peoples. ABS cat. no. 4704.0. Canberra: ABS.
AIHW 2002. Diabetes: Australian facts 2002. Cat. no. CVD 20. Canberra: AIHW.
AIHW 2003. Indicators of health risk factors: the AIHW view. Cat no. PHE 47. Canberra: AIHW.
AIHW 2004. Heart, stroke and vascular diseases – Australian facts 2004. Cat. no. CVD 27. Canberra: AIHW & NFA.
AIHW 2005a. Chronic kidney disease in Australia, 2005. Cat. no. PHE 68. Canberra: AIHW.
AIHW 2005b. Living dangerously: Australians with multiple risk factors for cardiovascular disease. Bulletin no. 24. Cat. no. AUS 57. Canberra: AIHW.
AIHW 2006a. Australia’s health 2006. Cat. no. AUS 73. Canberra: AIHW.
AIHW 2006b. Chronic diseases and associated risk factors in Australia, 2006. Cat. no. PHE 81. Canberra: AIHW.
AIHW 2007. Aboriginal and Torres Strait Islander Health Performance Framework, 2006 report: detailed analyses. AIHW cat. no. IHW 20. Canberra: AIHW.
AIHW & ABS 2006. Recent developments in the collection of Aboriginal and Torres Strait Islander health and welfare statistics 2005. Cat. no. IHW 15; ABS cat. no. 4704.0.55.001. Canberra: AIHW & ABS.
AIHW: Field 2003. Heart failure… what of the future? Bulletin no. 6. Cat. no. AUS34. Canberra: AIHW.
AIHW: Field 2004. Rheumatic heart disease: all but forgotten in Australia except among Aboriginal and Torres Strait Islander peoples. Bulletin no. 16. Cat. no. AUS 48. Canberra: AIHW.
AIHW: O’Brien K 2005. Living dangerously: Australians with multiple risk factors for cardiovascular disease. Bulletin no. 24. Cat. no. AUS 57. Canberra: AIHW.

95
AIHW: Mathur S, Moon L, Leigh S 2006. Aboriginal and Torres Strait Islander people with coronary heart disease: further perspectives on health status and treatment. Cardiovascular diseases series no. 25. Cat. no. CVD 33. Canberra: AIHW.
AIHW: Senes S 2006. How we manage stroke in Australia. Cat. no. CVD 31. Canberra: AIHW.
AIHW: Tong B & Stevenson C 2007. Comorbidity of cardiovascular disease, diabetes and chronic kidney disease in Australia. Cardiovascular disease series no. 28. Cat. no. CVD 37. Canberra: AIHW.
Anderson I, Crengle S, Kamaka ML et al. 2006. Indigenous health in Australia, New Zealand, and in the Pacific. The Lancet 367:1775–1785.
Atkinson MA & Eisenbarth GS 2001. Type 1 diabetes: new perspectives on disease pathogenesis and treatment. The Lancet 358:221–229.
Brady M 2003. Health care in remote Australian Indigenous communities. The Lancet 362:36-37.
Brown A 2004. The context of Indigenous cardiovascular disease. CARPA newsletter 36:7–14.
Brown A, Walsh W, Lea T et al. 2005. What becomes of the broken hearted? Coronary heart disease as a paradigm of cardiovascular disease and poor health among Indigenous Australians. Heart, Lung and Circulation 14:158-162.
Bunker SJ, Colquhoun DM, Esler MD et al. 2003. “Stress” and coronary heart disease: psychosocial risk factors. Medical Journal of Australia 178(6): 272-276. Viewed May 2007, <www.mja.com.au/public/issues/178_06_170303/bun10421_fm.html >.
Carapetis JR & Currie BJ 1998. Preventing rheumatic heart disease in Australia. Medical Journal of Australia 168:428–429.
Carapetis JR, Wolff DR & Currie BJ 1996. Acute rheumatic fever and rheumatic heart disease in the Top End of Australia’s Northern Territory. Medical Journal of Australia 164:146–149.
Cass A, Cunningham J, Snelling P et al. 2003. Renal transplantation for Indigenous Australians: identifying the barriers to equitable access. Ethnicity and Health 8(2):111–19.
Coory MD & Walsh WF 2005. Rates of percutaneous coronary interventions and bypass surgery after acute myocardial infarction in Indigenous patients. Medical Journal of Australia 182:507–512.
Cunningham J 2002. Diagnostic and therapeutic procedures among Australian hospital patients identified as Indigenous. Medical Journal of Australia 176:58–62.
Excell L & McDonald S (eds) 2005. Appendix II. Australia and New Zealand Dialysis and Transplant Registry (ANZDATA) 2005 report. Adelaide: ANZDATA.
Hayman N 1997. Cardiovascular disease amongst Indigenous Australians. Aboriginal and Islander Health Worker journal 21(4):15-17.
HDSC (Health Data Standards Committee) 2006. National health data dictionary, Version 13. Canberra: AIHW.
Idler EL & Benyamini Y 1997. Self-rated health and mortality: a review of twenty-seven community studies. Journal of Health and Social Behavior 38(1):21–37.
Marmot M 2005. Social determinants of health inequalities. The Lancet 365:1099-104.
McDonald SP & Russ GR 2003. Burden of end-stage renal disease among Indigenous peoples in Australia and New Zealand. Kidney International 63 Suppl. 83:S123–7.

96
NHFA (National Heart Foundation of Australia) 2003. Hypertension management guide for doctors 2004. Viewed October 2007, <www.heartfoundation.com.au>.
NHMRC (National Health and Medical Research Council) 2001. Australian alcohol guidelines: health risks and benefits. Canberra: NHMRC.
NHMRC 2003. Food for health: dietary guidelines for Australian adults. Canberra: NHMRC.
Pepper EM, Cadilhac DA, Pearce DC et al. 2006. Stroke among Indigenous Australians at Royal Darwin Hospital, 2001–02. Medical Journal of Australia 184(4):195.
Steer AC, Carapetis JR, Nolan TM et al. 2002. Systematic review of rheumatic heart disease prevalence in children in developing countries: the role of environmental factors. Journal of Paediatric Child Health 38:229-234.
Stollerman GH 1997. Rheumatic fever. The Lancet 349:935-942.
Thompson PL, Bradshaw, Veroni M & Wilkes ET 2003. Cardiovascular risk among urban Aboriginal people. Medical Journal of Australia 179(3): 143-146.
Thrift AG & Hayman N 2007. Aboriginal and Torres Strait Islander peoples and the burden of stroke. International Journal of Stroke 2:57-59.
van Holst Pellekaan SM & Clague L 2005. Toward health and wellbeing for Indigenous Australians. Postgraduate Medical Journal 81:618-624.
Virjee S, Robinson S & Johnston DG 2001. Screening for diabetes in pregnancy. Journal of the Royal Society of Medicine 94:502-9.
Wang Z & Hoy WE 2004. Association between diabetes and coronary heart disease in Aboriginal people: are women disadvantaged? Medical Journal of Australia 180:508-511.
WHO (World Health Organization) 1999. Definition, diagnosis and classification of diabetes mellitus and its complications. Part 1: diagnosis and classification of diabetes mellitus. Geneva: WHO.
WHO 2000. Obesity: preventing and managing the global epidemic. Report of a WHO consultation. WHO Technical Report Series 894. Geneva: WHO.
WHO–ISH (World Health Organization–International Society of Hypertension) 1999. 1999 guidelines for the management of hypertension. CVD Prevention 2(2):76-111.

97
List of tables
Table 4.1: Prevalence of main cardiovascular conditions in Aboriginal and Torres Strait Islander peoples, by sex, 2004–05...............................................................................15
Table 4.2: Deaths from main cardiovascular conditions for Aboriginal and Torres Strait Islander peoples, by sex, 2002–2005 ................................................................17
Table 4.3: Prevalence of coronary heart disease in Aboriginal and Torres Strait Islander peoples, by age group and sex, 2004–05 ....................................................19
Table 4.4: Prevalence of cerebrovascular disease in Aboriginal and Torres Strait Islander peoples, by sex, 2004–05...............................................................................22
Table 4.5: Prevalence of heart failure in Aboriginal and Torres Strait Islander peoples, by age group and sex, 2004–05 ...................................................................24
Table 4.6: Prevalence of hypertension in Aboriginal and Torres Strait Islander peoples, by age group and sex, 2004–05 ...................................................................27
Table 4.7: Incidenceof acute rheumatic fever and prevalence of rheumatic heart disease in Aboriginal and Torres Strait Islander peoples, by sex..........................29
Table 5.1 Prevalence of risk factors among Aboriginal and Torres Strait Islander peoples with and without cardiovascular disease compared with non-Indigenous Australians, aged 18 years and over, 2004–05.............................37
Table 5.2: Prevalence of daily tobacco smoking among Aboriginal and Torres Strait Islander peoples with long-term cardiovascular disease, by age group and sex, 2004–05 ...........................................................................................................40
Table 5.3: Prevalence of daily tobacco smoking among Aboriginal and Torres Strait Islander peoples without long-term cardiovascular disease, by age group and sex, 2004–05 ...........................................................................................................41
Table 5.4: Prevalence of physical inactivity among Aboriginal and Torres Strait Islander peoples with long-term cardiovascular disease, by age group and sex, 2004–05 ...........................................................................................................44
Table 5.5: Prevalence of physical inactivity among Aboriginal and Torres Strait Islander peoples without long-term cardiovascular disease, by age group and sex, 2004–05 ...........................................................................................................45
Table 5.6: Prevalence of low fruit and /or vegetable consumption among Aboriginal and Torres Strait Islander peoples with long-term cardiovascular disease, 2004–05 (per cent) .........................................................................................................49
Table 5.7: Prevalence of low fruit and /or vegetable consumption among Aboriginal and Torres Strait Islander peoples without long-term cardiovascular disease, 2004–05 (per cent) ..........................................................................................51
Table 5.8: Prevalence of overweight and obesity among Aboriginal and Torres Strait Islander peoples with long-term cardiovascular disease, by age group and sex, 2004–05 (per cent)..........................................................................................54
Table 5.9: Prevalence of overweight and obesity among Aboriginal and Torres Strait Islander peoples without long-term cardiovascular disease, by age group and sex, 2004–05 (per cent)..........................................................................................56

98
Table 5.10: Prevalence rate of risk of long-term harm from alcohol consumption among Aboriginal and Torres Strait Islander peoples with long-term cardiovascular disease, by sex, 2004–05 ....................................................................60
Table 5.11: Prevalence rate of risk of long-term harm from alcohol consumption among Aboriginal and Torres Strait Islander peoples without long-term cardiovascular disease, by sex, 2004–05 ....................................................................61
Table 5.12: Prevalence of diabetes among Aboriginal and Torres Strait Islander peoples with long-term cardiovascular disease, by age group and sex, 2004–05...........................................................................................................................65
Table 5.13: Prevalence of diabetes among Aboriginal and Torres Strait Islander peoples without long-term cardiovascular disease, by age group and sex, 2004–05...........................................................................................................................66
Table A1.1: Codes for death data used in this report...................................................................71
Table A2.1: Estimated resident population, 31 December 2004 and 30 June 2006...................73
Table A2.2: Populations with cardiovascular disease and without cardiovascular disease, by Indigenous status, sex and age group, 2004–05 ...................................74
Table A2.3: Deaths from cardiovascular disease, by Indigenous, sex and age group, 2002–2005.......................................................................................................................75
Table A2.4: Prevalence of coronary heart disease, by Indigenous status, sex and age group, 2004–05.......................................................................................................76
Table A2.5: Prevalence of cerebrovascular disease, by Indigenous status, sex and age group, 2004–05.......................................................................................................77
Table A2.6: Prevalence of heart failure, by Indigenous status, sex and age group, 2004–05...........................................................................................................................78
Table A2.7: Prevalence of hypertension, by Indigenous status, sex and age group, 2004–05...........................................................................................................................79
Table A2.8: Prevalence of rheumatic heart disease in Aboriginal and Torres Strait Islander peoples, by sex and age group, 2004–05 ....................................................80
Table A2.9: Prevalence of daily tobacco smoking, by Indigenous status, sex and age group, persons aged 18 years and over, 2004–05.....................................................81
Table A2.10: Prevalence of physical inactivity, by Indigenous status, sex and age group, persons aged 18 years and over, 2004–05.....................................................82
Table A2.11: Prevalence of low fruit and/or vegetable consumption, by Indigenous status, sex and age group, persons aged 18 years and over, 2004–05...................83
Table A2.12: Prevalence of overweight and obesity, by Indigenous status, sex and age group, persons aged 18 years and over, 2004–05..............................................85
Table A2.13: Prevalence of risk of long-term harm from alcohol consumption, by Indigenous status, sex and age group, persons aged 18 years and over, 2004–05...........................................................................................................................87
Table A2.14: Prevalence of diabetes, by Indigenous status, sex and age group, persons aged 18 years and over, 2004–05 ................................................................................89

99
List of figures
Figure 2.1: Aboriginal and Torres Strait Islander populations with or without cardiovascular disease, 2004–05 ...................................................................................8
Figure 3.1: Population profile, by Indigenous status, age and sex, 30 June 2006 ...................10
Figure 3.2: Self-assessed health status, Aboriginal and Torres Strait Islander peoples aged 15 years and over, 2004–05 ................................................................................11
Figure 3.3: Number of long-term health conditions among Aboriginal and Torres Strait Islander peoples with a long-term health condition, by age group, 2004–05 ......12
Figure 4.1: Prevalence of cardiovascular disease, by Indigenous status and age group, 2004–05...........................................................................................................................14
Figure 4.2: Standardised prevalence ratios for main cardiovascular conditions in Aboriginal and Torres Strait Islander peoples, 2004–05 .........................................16
Figure 4.3: Deaths from cardiovascular disease, by Indigenous status and age group, 2002–2005.......................................................................................................................18
Figure 4.4: Deaths from coronary heart disease, by Indigenous status and age group, 2002–2005.......................................................................................................................20
Figure 4.5: Deaths from cerebrovascular disease, by Indigenous status and age group, 2002–2005.......................................................................................................................23
Figure 4.6: Deaths from heart failure, by Indigenous status and age group, 2002–2005.......25
Figure 4.7: Deaths from rheumatic fever and rheumatic heart disease, by Indigenous status and age group, 2002–2005................................................................................30
Figure 5.1: Rate ratio for number of risk factors, Aboriginal and Torres Strait Islander peoples aged 18 years and over, 2004–05..................................................................34
Figure 5.2: Daily smokers, by Indigenous status and age group, persons aged 18 years and over, 2004–05 .........................................................................................................39
Figure 5.3: Physical inactivity, by Indigenous status and age group, persons aged 18 years and over, 2004–05..........................................................................................42
Figure 5.4: Standardised prevalence ratio of low fruit and/or low vegetable consumption, by sex, Aboriginal and Torres Strait Islander peoples aged 18 years and over, 2004–05..........................................................................................48
Figure 5.5: Standardised prevalence ratio for overweight and obese Aboriginal and Torres Strait Islander peoples aged 18 years and over, by sex, 2004–05 ..............53
Figure 5.6: Standardised prevalence ratio for risk of long-term harm from alcohol consumption for Aboriginal and Torres Strait Islander peoples aged 18 years and over, by sex, 2004–05..................................................................................59
Figure 5.7: Prevalence of diabetes, by Indigenous status and age group, persons aged 25 years and over, 2004–05..........................................................................................64
Figure 5.8: Incidence of treated end-stage kidney disease, by Indigenous status and age group, 2002–2005...................................................................................................68