
Carbon Neutral Adelaide Foundation Report
97
transport | community | industrial & mining | carbon & energy Carbon Neutral Adelaide – Foundation Report Prepared for: SA Department of Environment, Water and Natural Resources Date: November 2015
Transcript of Carbon Neutral Adelaide Foundation Report

transport | community | industrial & mining | carbon & energy
Carbon Neutral Adelaide – Foundation Report
Prepared for: SA Department of Environment, Water and Natural Resources
Date: November 2015

pitt&sherry ref: HB15535H002 final rep 31P Rev00/PH i
Prepared by: ……… …………… Date: 27 November 2015 Phil Harrington
Reviewed by: ………… ……… Date: 27 November 2015 Mark Johnston
Authorised by: ………… ………… Date: 27 November 2015 Phil Harrington
Revision History
Rev No.
Description Prepared by Reviewed by Authorised by Date
00 Final PH MJ PH 27/11/15
© 2015 pitt&sherry This document is and shall remain the property of pitt&sherry. The document may only be used for the purposes for which it was commissioned and in accordance with the Terms of Engagement for the commission. Unauthorised use of this document in any form is prohibited.

pitt&sherry ref: HB15535H002 final rep 31P Rev00/PH ii
Table of Contents Acknowledgement .......................................................................................................................................... iv Executive Summary ......................................................................................................................................... v 1. Introduction .......................................................................................................................................... 1
1.1 Strategic Context........................................................................................................................ 1 1.2 What are other cities doing? ..................................................................................................... 2 1.2.1 C40 Cities Climate Leadership Group ......................................................................................................................2
1.2.2 Carbon Neutral Cities Alliance ................................................................................................................................3
1.2.3 World’s First? ..........................................................................................................................................................3
1.2.4 Melbourne’s Zero Net Emissions Strategy ..............................................................................................................4
1.3 Project Scope and Team ............................................................................................................ 7 2. Accounting for Adelaide’s Greenhouse Gas Emissions ......................................................................... 7
2.1 Carbon Accounting Framework ................................................................................................. 7 2.1.1 The ‘scopes framework’ ..........................................................................................................................................7
2.1.2 The ‘city-induced framework’ .................................................................................................................................8
2.1.3 Data integrity ..........................................................................................................................................................8
2.1.4 Emissions boundary ................................................................................................................................................9
2.1.5 Verification of carbon neutrality ...........................................................................................................................10
2.1.6 Certification and consumer law ............................................................................................................................10
2.2 Inventory Methodology Issues and Enhancements ................................................................. 11 2.2.1 Calculating Scope 2 emissions ..............................................................................................................................11
2.2.2 Scope 2 (Electricity) Emissions – With Measures ..................................................................................................15
2.2.3 Reporting levels ....................................................................................................................................................16
2.2.4 Documentation/Standardisation ..........................................................................................................................17
2.3 Current Emissions Profile and Trends ...................................................................................... 18 2.3.1 GHG Profile by Sector ...........................................................................................................................................18
2.3.2 Emissions Profile by Fuel.......................................................................................................................................19
3. Emissions Trends to 2050 – Business-as-Usual Scenario .................................................................... 25 3.1 Introduction ............................................................................................................................. 25 3.2 Projections Methodology and Data Sources ........................................................................... 25 3.3 Stationary Energy Emissions - Energy Supply .......................................................................... 28 3.4 Stationary Energy Emissions - Energy Consumption ............................................................... 28 3.5 Transport Emissions ................................................................................................................. 31 3.5.1 Overview ...............................................................................................................................................................31
3.5.2 Passenger, Light Commercial Vehicles and Trucks ................................................................................................32
3.5.3 Public Transport ....................................................................................................................................................33
3.6 Waste Emissions ...................................................................................................................... 34 3.6.1 Overview ...............................................................................................................................................................34
3.6.2 BAU Projections ....................................................................................................................................................36
3.7 Total Emissions Trends – Business as Usual ............................................................................ 37 4. Towards a Carbon Neutral Adelaide Strategy ..................................................................................... 38
4.1 Success and Quality Factors ..................................................................................................... 38 Leadership .............................................................................................................................................................38
Selecting the right measures .................................................................................................................................40
Transparency and accountability ..........................................................................................................................43

pitt&sherry ref: HB15535H002 final rep 31P Rev00/PH iii
Strengthening the capacity to deliver ...................................................................................................................44
4.2 Strategy Workshop Outcomes ................................................................................................. 44 4.3 Overview of Abatement Opportunities ................................................................................... 46
5. Carbon Neutral Pathways ................................................................................................................... 47 5.1 100% Renewable Electricity ..................................................................................................... 47 Inside the city ........................................................................................................................................................48
Outside the city .....................................................................................................................................................48
Local renewables ..................................................................................................................................................48
Utility scale renewables ........................................................................................................................................49
5.2 An Energy Efficient Built Environment ..................................................................................... 51 Residential buildings .............................................................................................................................................53
Commercial buildings ............................................................................................................................................54
Energy Efficiency vs Renewables? .........................................................................................................................55
Efficiency vision, targets and master plan? ...........................................................................................................56
New buildings .......................................................................................................................................................56
Existing buildings ..................................................................................................................................................58
5.3 Emissions Free Urban Mobility ................................................................................................ 59 Zero-carbon transport ...........................................................................................................................................61
Low-carbon transport ...........................................................................................................................................68
5.4 Iconic Offsets ........................................................................................................................... 70 The Carbon Farming Initiative and the Emissions Reduction Fund .......................................................................70
Offsets and Carbon Neutral Adelaide ...................................................................................................................71
Treatment of renewable energy ...........................................................................................................................73
5.5 Waterfall Chart......................................................................................................................... 76 5.6 Additional Abatement Opportunities ...................................................................................... 77
6. Conclusions and Recommendations ................................................................................................... 79 6.1 Summary and Conclusions ....................................................................................................... 79 Context ..................................................................................................................................................................79
Doing the maths....................................................................................................................................................79
Emissions trends – business as usual ....................................................................................................................79
Key success factors ................................................................................................................................................80
Key Abatement Measures .....................................................................................................................................80
6.2 Recommendations ................................................................................................................... 81
pitt&sherry ref: HB15535H002 final rep 31P Rev00/PH iv
Acknowledgement
pitt&sherry wishes to acknowledge the close co-operation it has been offered during the course of this project by the Adelaide City Council and by Government of South Australia agencies, including by:
Richard Day, Principal Industry Development Officer – Cleantech, Department of State Development
Lucy Dodd, Project Manager, Department of Environment, Water and Natural Resources
Michelle English, Manager – Climate Change Unit, Department of Environment, Water and Natural Resources
Gareth Evans, Manager - Public Transport Investment and Planning, Department of Transport, Planning and Infrastructure
Marnie Hope, Team Leader, Sustainability Policy, Adelaide City Council
Sara Hurditch, Senior Policy Advisor, Department of Transport, Planning and Infrastructure
Lorraine Irwin, Sustainability Projects Officer, Adelaide City Council
Peter Nattrass, Sustainability Advisor, Adelaide City Council
Dr Adrian Stokes, Program Manager, City Sustainability and Park Lands, Adelaide City Council
Alan Richards, Principal Policy Officer – Environment Management, Department of Transport, Planning and Infrastructure
Olessya Vitkovskaya, Principal Policy Officer, Department of Environment, Water and Natural Resources
Stephanie Ziersch, Director - Strategy and Advice, Department of Environment, Water and Natural Resources
pitt&sherry ref: HB15535H002 final rep 31P Rev00/PH v
Executive Summary
The Government of South Australia and Adelaide City Council have announced the goal of making Adelaide the world’s first carbon neutral city. This ambitious target is designed not only to respond to the critical issue of climate change, but also to reinvigorate the Adelaide and South Australian economy, building its competitiveness and resilience in an increasingly carbon-constrained global economy. The Carbon Neutral Adelaide strategy will offer short term benefits, such as energy cost savings and enhancements to the liveability of the city, but will also help create a sustainable long term basis for future employment and wellbeing. This Report addresses some key questions including:
What does carbon neutrality mean, precisely?
What would it mean to be world’s first?
How could the Government substantiate a claim of carbon neutrality?
Is it possible to achieve?
What are the key pathways and measures that would deliver this outcome most cost effectively?
What does it mean?
To be carbon neutral means that emissions of greenhouse gases attributable to the Adelaide City Council (ACC) local government area would need to be reduced to zero or else offset. Offsets are strategies that reduce or sequester emissions outside the ACC boundary. They need to comply with the Australian Governments rules and methodologies established under its Emission Reduction Fund (ERF) and should be accredited under the National Carbon Offsets Standard (NCOS). On current information, ‘world’s first’ would mean ‘before 2020’, as Melbourne is already targeting carbon neutrality by 2020. Copenhagen is aiming to be carbon neutral, without relying on offsets, by 2025. Cities could, of course, change their current targets. More information about the context and rationale for the Strategy is set out in Chapter 1, while the underpinning carbon accounting concepts, including how a claim of carbon neutrality can be substantiated, are set out in Chapter 2.
Is it possible?
The short answer is ‘Yes!’ – and indeed, it would be beneficial from economic, social and environmental perspectives. However we answer this question in several steps. First, in Chapter 3 we examine historical emissions trends in Adelaide over the FY2007 – FY2013 period and make projections of emissions to 2050 period under ‘business as usual’ conditions. In effect, this sets out the scale of the challenge. In Chapter 4 we consider how an effective strategy could be developed, while Chapter 5 sets out some of the key abatement pathways and measures that could be used to achieve the outcome.
Past Emissions Trends
Adelaide’s greenhouse gas emissions have fallen by some 20% (from 1,175 kilotonnes of CO2-e to 939.5 kilotonnes of CO2-e) over the FY2007 to FY2013 period (see Figure ES1 below).1 This result has been driven largely by reductions in the greenhouse gas intensity of electricity supplied to Adelaide over this period, which in turn reflects the growing share of renewable energy in the generation mix in South Australia. Also over this period there was a moderation of demand for energy, and particularly electricity,
1 Emissions data in this Report may differ from earlier publications due to both data and methodological changes –
see Chapter 2 for details.

pitt&sherry ref: HB15535H002 final rep 31P Rev00/PH vi
as was the case across Australia, following sharp rises in the price of electricity, and also the progressive impact of energy efficiency and renewable energy policies. Finally there was increased ridership of public transport during this period, leading to a decline in transport emissions (see Chapter 2 for details).
Figure ES1: Total GHG Emissions by Sector in 2007 vs 2013 Source: pitt&sherry
Figure ES2: Business-as-Usual Greenhouse Gas Emissions by Sector: Adelaide LGA: 2007 - 2050 Source: pitt&sherry
Next we examine how emissions are likely to change in the absence of new abatement measures.
Future Emissions under a ‘Business-as-Usual’ Scenario
Despite the progress with emissions reductions to date, there are challenges for a major city like Adelaide to move to carbon neutrality. Rising populations (residential, workers, visitors), building floor area,
0
200,000
400,000
600,000
800,000
1,000,000
1,200,000
1,400,000
Commercial Sector
Residential Sector
Industrial Sector
T&D electricity losses
Transport Waste Total
Ton
ne
s C
O2
-e
FY2007 GHG Emissions FY2013 GHG Emissions
0
200,000
400,000
600,000
800,000
1,000,000
1,200,000
1,400,000
ton
ne
s C
O2
-e
BAU Projections - all sectors Stationary Energy Transport Waste
pitt&sherry ref: HB15535H002 final rep 31P Rev00/PH vii
economic activity, and the resulting transport task and waste streams, all tend to place upward pressure on emissions. Unless these trends are more than offset by market factors (such as technological change) and/or abatement measures, then greenhouse gas emissions will rise. Also, numerous policies and measures that have contributed to emissions abatement in Australia are currently either not being updated or have been weakened or abolished. These include minimum energy performance standards for many kinds of buildings, equipment and appliances (which have not been updated for five or more years); the national Renewable Energy Target (which has recently been reduced in size); and the Carbon Pricing Mechanism (which has been abolished). These policy decisions at a national level will put upward pressure on greenhouse gas emissions, including in Adelaide. Despite this, we expect that emissions will fall sharply in the short term, following the announced closures of the Northern and Torrens Island A power stations (see the later years of Figure ES2 above). Further, we expect that energy demand in Adelaide’s small industrial sector will continue to fall, reflecting a shift in the make-up of city towards commercial and high-rise residential buildings. In the transport sector, a gradual improvement in the average fuel efficiency of vehicles, fuel switching to diesel engines and increasingly to electric vehicles, and continued growth in the use of walking, cycling and public transport as transport modes, will tend to moderate growth in emissions. We expect that by around 2040, transport emissions will begin to fall, even without new abatement measures. Waste emissions tend to rise, in this scenario, driven by higher populations and economic activity. When all these trends are compiled, total emissions (the top line in blue) are expected to continue to fall until around 2019, in a business-as-usual scenario, before rising thereafter. Overall, we expect that emissions in FY2050 would be some 29% lower than they were in FY2007, but on a rising trend.
Towards a Carbon Neutral Adelaide Strategy
How would South Australia set about making Adelaide the world’s first carbon neutral city? We identify two key elements:
1. Leadership and engagement: The Government of South Australia and Adelaide City Council will need to offer leadership – as indeed is already the case – and also work closely with the widest possible range of interested communities, institutions and businesses, to identify the most innovative ideas and effective interventions. Chapter 3 provides further details on leadership and engagement strategies.
2. Effective and cost-effective abatement measures: There are numerous measures and strategies to reduce greenhouse gas emissions in ways that are not only effective, but also highly cost-effective, that often reduce costs for businesses, households and for government as well. We provide an overview of the opportunities in Chapter 4.
Key Abatement Pathways
Chapter 5 provides information on key opportunities or pathways that are likely to do much of the heavy lifting in any strategy to achieve carbon neutrality, noting that other measures will no doubt also contribute. They include:
Moving to 100% renewable electricity supply – generated inside or outside the city;
Transforming the energy efficiency of the city’s built environment;
Moving towards emissions-free urban mobility – through a wide range of strategies; and
Securing high-quality, iconic offsets – to deliver multiple benefits in addition to carbon sequestration.
The potential for measures like these to contribute to carbon neutrality before FY2020 is broadly indicated in Figure ES3. The exact shares that these and other measures might contribute to the overall

pitt&sherry ref: HB15535H002 final rep 31P Rev00/PH viii
abatement task will depend on the detail of the measures eventually adopted. Figure ES3 is therefore indicative only, but it is based on quantitative analysis that pitt&sherry has undertaken for Adelaide and other cities.
Figure ES3: Major Abatement Pathways Waterfall Chart: Scenarios for Carbon Neutrality by 2019 Source: pitt&sherry
Because of limited time before FY2020, there can only be a certain amount of emissions savings garnered in that time from the transport, buildings and waste sectors. To achieve transformation in the underlying energy and/or emissions efficiency of these sectors is a longer term venture, requiring sustained policy effort over years and decades. However it would be possible to contract for the supply of 100% renewable electricity in the relatively short term. The balance of emissions not abated by these (or other) measures would need to be offset in order to claim carbon neutrality. Cost effective abatement measures have the potential to drive down emissions very significantly – we estimate by 68% or more by FY2050 – and thereby substantially reduce the requirement for emissions offsets through time. An indicative trace for emissions, with an effective set of new measures in place, is shown in Figure ES4 below. The declining requirement for offsets over time is shown by the shrinking gap between the bottom (blue) line on this figure and the horizontal axis, which represents zero emissions.
-
200,000
400,000
600,000
800,000
1,000,000
1,200,000
1,400,000
2007 Base 2019 BAU Waste Transport Energy Efficiency Renewable Electricity
Offsets
ton
nes
of
CO
2-e
Total impact of measures by sector in 2019
4.1% 12.7%
72.9% 2.1% 8.2%
BAU = 728 kt CO2-e
2007 Base = 1,175 kt CO2-e

pitt&sherry ref: HB15535H002 final rep 31P Rev00/PH ix
Figure ES4: Potential Emissions Savings by Sector: Adelaide LGA: 2016 – 2050 Source: pitt&sherry
ES5 below indicates that while BAU emissions would have grown by FY2050, as compared to FY2020, measures to reduce emissions in all sectors would also have grown in impact, reducing the requirement for offsets very significantly.
Figure ES5: Major Abatement Pathways Waterfall Chart: Scenarios for Carbon Neutrality by 2019 Source: pitt&sherry
0
200,000
400,000
600,000
800,000
1,000,000
1,200,000
1,400,000
2007 2012 2017 2022 2027 2032 2037 2042 2047
ton
ne
s C
O2
-e
Energy Efficiency Measures Waste Measures Transport Measures
Renewable Energy Measures BAU
-
200,000
400,000
600,000
800,000
1,000,000
1,200,000
1,400,000
2007 Base 2050 BAU Waste Transport Energy Efficiency Renewable Electricity
Offsets
ton
nes
of
CO
2-e
Total impact of measures by sector in 2050
21.7% 13%
23.2%
4.7%
37.4%
BAU = 832.9 kt CO2-e
2007 Base = 1,175 kt CO2-e
~68%

pitt&sherry ref: HB15535H002 final rep 31P Rev00/PH x
What Are The Benefits?
There would be very significant economic, social and environmental benefits flowing from the Carbon Neutral Adelaide strategy. First, a cost-effective set of abatement measures – including renewable energy, energy efficiency, waste minimisation, public transport, encouraging electric vehicles, encouraging walking and cycling, etc – would significantly reduce expenditure by households, businesses and governments in areas such as fuels and electricity, waste disposal fees, vehicle operating and/or ownership costs. Second, many such measures would create ‘spillover’ benefits for the community such as jobs, the development of valuable knowledge capital and innovative technologies, health benefits (for example, from more active and electric transport modes), and reduced noise, air pollution and congestion (from switching to public transport and electric vehicles, for example). Third, international promotion of the Carbon Neutral Adelaide strategy and abatement measures will help to attract inward investment by companies with low-carbon or high-efficiency solutions. These developments would help to build a more resilient and ‘future proof’ economy in South Australia, as the world becomes increasingly carbon-constrained over time.
What Are The Costs?
While the measures noted above are for the most part highly cost-effective – meaning that the value of benefits exceeds the value of costs – still there are investments to be made to achieve this outcome. Investments would be required, for example in public transport or electric vehicle recharging infrastructure, in upgrading buildings, and in additional waste recovery and treatment. Quantifying these costs falls outside the scope of this report. However, based on our past work, we are confident that these costs would be more than offset by the value of the direct, and even more so indirect, benefits as noted above.
Recommendations
We are confident to recommend that the Government of South Australia and Adelaide City Council implement a Carbon Neutral Adelaide strategy, to position Adelaide as the world’s first carbon neutral city. Quite apart from the significant reduction in greenhouse gas emissions that would result, South Australia’s leadership in this area would create economic, social and wider environmental benefits for the state, attract inward investment, and create jobs and economic activity that will be resilient and sustainable into the future. We also recommend that the Government of South Australia and Adelaide City Council consult and engage widely to ensure that many different communities and stakeholders have the opportunity to contribute to its development and implementation. Our detailed recommendations are summarised below.

pitt&sherry ref: HB15535H002 final rep 31P Rev00/PH xi
Table ES1: Recommendations
Theme Recommendation Comments
Carbon neutrality
1. Set a target date before 1/1/2020, with the final date to be considered by Government following further analysis of optimal pathways and costs.
Melbourne is targeting 1/1/2020, and this currently sets the outer boundary of Adelaide’s target date. We note that the costs of achieving carbon neutrality will not vary greatly regardless of whether the target date is 2019 or 2018, for example, as there is limited time between now and these dates to influence the emissions trajectory.
Carbon neutrality
2. That the Government of South Australia/ACC monitor ongoing developments with international reporting methodologies – notably those of the C40 and Carbon Neutral Cities Alliance – and consider further adjustments to its own methodology, where warranted, to maintain consistency with other cities (including Melbourne and Sydney).
Using a methodology that is consistent with other major cities reduces the risk of eventual claims of carbon neutrality being criticised by those cities.
Carbon neutrality
3. Adelaide may wish to consider joining at least the Carbon Neutral Cities Alliance, and potentially also the C40.
Primary benefit is confidence that the accounting basis of Adelaide’s future claim of carbon neutrality will be accepted as credible by other key cities. In addition, there will be learning benefits from participation.
Success/quality factors
4. We recommend that the Government:
Maintains an inclusive, bottom-up approach to the development and delivery of this strategy, including making a clear statement of the values and character of the responses that it wishes to see embodied in it;
Allows sufficient time – at least 6 months – for inquiry, research, analysis and widespread engagement with the broadest possible spread of communities...and not only those who self-identify as stakeholders. A second round of consultation on the ‘micro-design’ of preferred measures is recommended – and this could be limited to more directly-affected stakeholders;
Ensures that there is strong but also inclusive governance of the process of developing and implementing the strategy, along with transparent and regular progress reporting;
Ensures that the strategy development process – including community engagement process but also data compilation, research and analysis – is adequately resourced;
Agrees and publicises a set of decision-making criteria, including objectives and KPIs, to clearly communicate to all parties how measures will be selected and their performance assessed through time;
Recognises the need for various kinds of ‘capacity building’, as part of this strategy. This should include at least:
o A community education program, to ensure that the underlying need and rationale for the strategy is clearly understood (including ensuring that the key words and concepts used in the strategy are widely understood).
o Engaging actively in the public debate and not allowing unreasoned criticism of the strategy to go unanswered.
o A willingness to assist specific sectors to build their capacity in a more targeted way – eg, being responsive to requests for assistance, at a minimum,

pitt&sherry ref: HB15535H002 final rep 31P Rev00/PH xii
Theme Recommendation Comments
or actively targeting communication and capacity building strategies for certain sectors.
Recognises the importance of delivering visible and tangible outcomes and quick wins, to help reinforce the credibility of the overall strategy and reduce cynicism;
Identifies opportunities for community and government leaders and institutions to model appropriate (low/zero carbon) behaviours, and avoid high-carbon ones to the extent possible, in order to build and maintain credibility
Emissions reporting
5. Retain the Greenhouse Gas Protocol for Community-Scale Greenhouse Gas Emission Inventories, or GPC, as the basis for reporting emissions and tracking progress towards carbon neutrality.
This framework closely aligns with the IPCC 2006 inventory methodology used by Australia and other (Annex 1) signatories to the UNFCCC.
Emissions reporting
6. That ACC make a number of enhancements to its current inventory approach:
Prepare an inventory each year (to enable progress tracking);
That the inventory be expanded to include all seven classes of greenhouse gases covered by the Kyoto Protocol, subject to further investigation of data availability;
Investigate the ‘market-based’ method of reporting Scope 2 (electricity emissions);
Adopt the full Basic+ reporting methodology under the GPC;
Estimate and include Scope 1 emissions associated fugitive emissions, notably of methane from gas use;
Consider reporting Scope 3 emissions associated with water consumption inside the City
Consider investigating and reporting Scope 3 aviation emissions
The market-based method of Scope 2 reporting may provide greater emissions benefits when contracting for renewable electricity supply and recognises the contribution of embedded PV in the city.
Reporting the full scope of gases, emission sources and sectors under the GPC will reduce the risk of criticism of carbon neutrality claims, and also open up additional abatement opportunities (eg, carbon sequestration inside the city boundary).
Reporting emissions associated with water consumption is not required under GPC, but is reported by Melbourne, and water pumping is a major emissions generator for South Australia/Adelaide.
Emissions reporting
7. Once the above inventory methodology changes are implemented:
backcast the changes to past inventories for each year back to 2007, if possible, or at least for those years for which an inventory was produced;
Also, document a detailed set of methodologies, or a ‘Handbook’, to assist in the accurate and consistent compilation of annual inventories.
Backcasting the revised inventory methodology would overcome a discontinuity in the time series induced by a change of methodology for the 2012-13 inventory.
Documenting a detailed set of methodologies and data sources will ensure that future inventories to be compared and aligned with those of other cities, as needed, and will meet the transparency requirements of the GPC, helping to support a claim of carbon neutrality.
Offsets 8. Agree an offsets policy for this strategy that delivers integrity to the claim of carbon neutrality.
This should be based on high quality, verifiable and additional abatement projects certified under Australia’s National Carbon Offset Standard.

pitt&sherry ref: HB15535H002 final rep 31P Rev00/PH 1
1. Introduction
1.1 Strategic Context
On 10 February 2015, on the occasion of the opening of Parliament for 2015, the Governor of South Australia, His Excellency Hieu Van Le, AO, announced that the Government of South Australia will establish an ‘Adelaide Green Zone’ – to make Adelaide the world’s first carbon neutral2 city. In the same speech, the Governor (on behalf of the Government) announced a range of related targets including that:
50% of South Australia’s electricity will be generated from renewable sources by 2025;
within a decade, electric and hybrid vehicles will be the preferred form of transport within Adelaide’s Central Business District;
access to Adelaide will be made easy by improvements made to cycling infrastructure and measures to make the city more attractive to pedestrians; and
planning laws will be updated encouraging an urban form which creates affordable living in our neighbourhoods, well supported by public transport and walking/cycling infrastructure.
The strategic context for these announcements is clear. Some key elements are reviewed below.
Economic transition
First, the Governor noted that South Australia’s economy is in a state of rapid transition, as traditional industries decline as a result of global forces – the rise of Asia and shifts in international competitiveness. This creates an economic imperative to innovate, adapt and pursue new opportunities to create a sustainable economy.
Climate change
A second global ‘mega-trend’ is climate change. Last year in South Australia was the second warmest year on record. Nationally, seven of Australia’s ten warmest years on record have been experienced since 2002. As more and more countries and cities around the world recognise and respond to the challenges of climate change, the nature of demand for fuels, energy supply solutions, end-use designs (like buildings) and end-use technologies in all areas (from cars to household appliances) is undergoing rapid transformation. Increasingly, low-carbon solutions will be the only solutions in demand in the global market place. Increasingly, low-carbon and globally competitive will mean the same thing.
Economic opportunities
As the Governor noted, “South Australia has shown that transitioning to a low carbon economy can attract investment, drive innovation and create jobs.” He also noted that the ambitious renewable energy target, of 50% of electricity by 2025 to come from renewable sources, “...was made because it is both good for our environment and the right thing to do for our economy.” There is an opportunity for South Australia to embrace low carbon development as a key response to the structural challenges facing its traditional industries. This approach will not only stimulate investment and job creation in the short term, but also position South Australia to be a globally competitive player in
2 ‘Carbon neutral’ means that emissions of greenhouse gases attributable to activities within the City of Adelaide Local
Government Area (including North Adelaide) will either be reduced to zero, or else ‘offset’. Offsets generally involve sequestration of carbon, for example by planting and maintaining new trees or other carbon stores. For a more careful definition of key terms and concepts, please refer to Chapter 2.1 below.

pitt&sherry ref: HB15535H002 final rep 31P Rev00/PH 2
a low carbon future over the medium and longer term. Realising the opportunities will require careful planning and consideration, beyond the scope of this Foundation Report. There will be a need for structured research, as well as deep reflection and engagement with the communities, to identify a successful path. That path will draw on sound and local competitive advantages and Adelaide’s and South Australia’s existing assets – including people, skills and culture – and also on the values and character that the Government brings to the difficult choices that will sometimes be entailed. These issues are discussed further in Chapter 3. The Government has consulted with the community on a new and comprehensive Climate Change Strategy for South Australia. Within the overall State-wide approach, however, the Government has identified a special role for the City of Adelaide. As Governor Le noted:
“Investors and business leaders, and perhaps most importantly young people deciding where best to pursue their dreams, intuitively judge a state by the energy, vitality and values expressed by its capital city....We must seize this moment to make Adelaide more attractive to businesses looking to lower their carbon footprint, and to residents, students and tourists attracted to festivals, sporting events and live music. Our capital city should also embody the State’s commitment to achieving a sustainable future for our children.”
In setting an ambitious goal, such as making Adelaide the world’s first carbon neutral city, the Government is seeking to stimulate innovation, lateral thinking and new solutions.
1.2 What are other cities doing?
Many cities around the world are committed and acting to reduce their greenhouse gas emissions, including the achievement of carbon neutrality. Indeed, cities and regions are a primary focus of abatement effort globally – with initiatives like the Compact of Mayors3, the Compact of States and Regions4, EnergyCities5 and others growing rapidly. This reflects both a widespread frustration with a lack of progress on climate change action at national and international levels, but also a growing realisation that action to address climate change is ultimately everyone’s responsibility, and that cities and regions are an ideal scale to create sustainable and positive local solutions. Two particular city-scale initiatives stand out as particularly relevant to Adelaide.
1.2.1 C40 Cities Climate Leadership Group
The C40 Cities Climate Leadership Group is a network of the world’s largest cities that are committed to addressing climate change. It was formed in 2005, when the then Mayor of London, Ken Livingstone, convened representatives from 18 megacities to pursue action and cooperation on reducing greenhouse gas emissions.6 The Clinton Climate Initiative became the ‘delivery partner’ of the C40 in 2006. Currently there are 75 cities that are members of C40, including Sydney and Melbourne. Melbourne is the leadership city for the C40’s Sustainable Urban Development Network, while Sydney is co-lead, with Tokyo, of the C40’s Private Buildings Efficiency Network. C40 cities represent 25% of global GDP and 1 in 12 people worldwide, and their actions are leading to hundreds of millions of tonnes of greenhouse gas abatement. The cities share research, resources and information through a range of networks, with the aim of providing mutual support for cities to reach their abatement goals.7
3 Adelaide is a member - see http://www.compactofmayors.org/
4 South Australia is a member - see http://www.theclimategroup.org/what-we-do/programs/compact-of-states-
and-regions/ 5 http://www.energy-cities.eu/
6 http://www.c40.org/history
7 http://www.c40.org/cities

pitt&sherry ref: HB15535H002 final rep 31P Rev00/PH 3
Figure 1.1: C40 Cities
1.2.2 Carbon Neutral Cities Alliance
In March 2015, a new network known as the Carbon Neutral Cities Alliance (CNCA) was established. This group currently comprises 17 cities, including Sydney and Melbourne. Other cities in the Alliance are Boulder, Boston, Copenhagen, London, Minneapolis, New York City, Oslo, Portland, San Francisco, Seattle, Stockholm, Vancouver, Washington DC and Yokohama. As the name implies, these cities are targeting either carbon neutrality or at least deep cuts in greenhouse gas emissions. The Alliance notes that “...urban areas account for nearly three quarters of humanity’s emissions” and that “...averting the worst impact climate change will require cutting GHG emissions by at least 80% by 2050”. Reaching this goal “...will depend in large part on our ability to reimagine and reinvent cities in ways that promote economic prosperity, social equity, enhanced quality of life, and climate resilience”.8 The CNCA is staffed by the Urban Sustainability Directors Network in partnership with the C40 Cities Climate Leadership Group and the Innovation Network for Communities. We note that the first priority of the CNCA is to work with their members to develop “...approaches, analysis, and tools to support carbon neutrality; [including] standardizing measurement and verification methodologies for tracking progress.”9 There may be advantage in Adelaide joining the CNCA and participating directly in this project, and potentially adapting its current measurement and verification methodologies, as necessary, based on an emerging consensus in this group. Alternatively, Adelaide may be able to achieve a similar result through close collaboration with Melbourne and/or Sydney.
1.2.3 World’s First?
Cities around the world have a range of greenhouse and related targets, sometimes focusing on specific sectors. According to the C40, the City of Melbourne is aiming to be carbon neutral by 2020, while Sydney is aiming to reduce its emissions by 70% over 2006 levels by 2030. 10 Copenhagen is aiming to be carbon neutral by 2025. Oslo is targeting carbon neutrality for its space heating task by 2020 and for most other sectors by 2050. Stockholm aims to be “a fossil fuel free city by 2050”.
8 http://usdn.org/public/Carbon-Neutral-Cities.html, viewed 18/5/2015.
9 Ibid.
10 https://data.cdp.net/Cities/C40-Cities-Emissions-Reduction-Targets-2014/pe2x-jtp3
pitt&sherry ref: HB15535H002 final rep 31P Rev00/PH 4
When would Adelaide need to be carbon neutral in order to claim that it is the world’s first city to achieve this benchmark? At this time, it appears that Melbourne is the city with the nearest term carbon neutral target, of 1 January 2020. We note that some cities, including those that are members of C40 and/or CNCA, have not declared what their targets are. Subject to any new target announcements by other cities, Adelaide would need to reach carbon neutrality before 1/1/2020 – just over four years from now. Chapter 3 describes the pathways that can be used to reach this target. Given that Melbourne is the city with the nearest term carbon neutrality target, the following section reviews its approach and strategy in more detail.
1.2.4 Melbourne’s Zero Net Emissions Strategy
Melbourne’s target of carbon neutrality (or ‘zero net emissions’) was set in 2003. The target is defined as meaning that ‘net greenhouse gas emissions associated with [the city’s] activities [must be] equal to zero...through reducing greenhouse gas emissions and purchasing of carbon offsets”.11 Melbourne has conducted significant research to inform its carbon neutral strategy. First, it has documented and published emissions inventories every year. Second, it has crafted three major strategy documents (2003, 2008, 2014) and accompanying ‘implementation plans’ (which don’t appear to be public documents). The last two Reports acted both as ‘updates’ or progress reports and also to reset the abatement strategy as needed. Third, it commissioned ClimateWorks to undertake projections of emissions to 2020, and also careful opportunity assessment analysis. This work was used to inform its 2014 update, including the construction of a tailored ‘marginal abatement cost’ (or MAC) curve (see Figure 1.2 below). pitt&sherry has previously undertaken similar work for Sydney and Canberra. MAC curves can appear a little intimidating, as they carry a great deal of information. Each block represents a specific ‘opportunity’, such as ‘retrofit commercial lighting’, or ‘shift to more efficient vehicles’. The width of each bar indicates how many kilotonnes (kt) CO2-e are expected to be saved in 2020 if the opportunity is implemented. The height of the bar indicates the net cost of implementing the opportunity. If the bar is negative (below the x axis), then this indicates that there are more financial savings than costs associated with the opportunity, and so the net cost is negative. This is often the case when the opportunity saves energy costs, fuel costs or reduces capital/investment costs. Buying a smaller, more fuel efficient car, for example, might save both investment costs (cheaper purchase price) and running costs (fuel). Measures that have a negative abatement cost are sometimes referred to as ‘no regrets’ measures – that is, we’d be better off if we implemented them, regardless of the ‘co-benefit’ of reducing greenhouse gas emissions that they bring.
11
City of Melbourne, Zero Net Emissions by 2020: update 2014, available from https://www.melbourne.vic.gov.au/enterprisemelbourne/environment/Pages/Zeronetemissions.aspx

pitt&sherry ref: HB15535H002 final rep 31P Rev00/PH 5
Figure 1.2: City of Melbourne 2020 Marginal Abatement Cost Curve Source: City of Melbourne: Zero Net Emissions – Update 2014, p. 14.
Informed by this research, Melbourne has then designed a series of key strategies and targets, as set out in the table below. Within each, there is a range of individual measures resolved, not those that the City will do (or continue to do), those that others will do, and often, ‘what else needs to happen’ – ie, things that may reflect national or State policy settings or legislation. Table 1.1: City of Melbourne Strategy Targets
Section Strategy Targets
Council operations and leadership Maintain carbon neutrality
Reduce ghg emissions by 10% by 2018 (baseline year 2010-11)
Commercial buildings and industry Increase the average NABERS or equivalent rating of commercial buildings to 4 by 2018. This roughly equates to an average increase in energy efficiency of 40% per building.

pitt&sherry ref: HB15535H002 final rep 31P Rev00/PH 6
Residential buildings City of Melbourne will establish a baseline and develop a long term target in the first year of the implementation plan.
Stationary energy supply 25% of electricity from renewable sources by 2018.
Transport and freight Increase the percentage of all trips using low emissions transport from 51% in 2009 to 60% in 2018.
Waste management Decrease waste to landfill per resident by 5% by 2018. City of Melbourne to trial 7 precinct waste solutions by 2018.
Source: City of Melbourne: Zero Net Emissions – Update 2014, p. 4.
Despite this effort, Melbourne is not on track to meet its commitment, other than by purchasing offsets. Its Zero Net Emissions by 2020: update 2014 notes that on its current trajectory, greenhouse emissions are expected to grow by some 60% over 2010 levels by 2020. It also notes that if Melbourne were to implement all currently viable abatement opportunities (based on the ClimateWorks research), emissions in 2020 would still exceed 2010 levels. It notes that offsets of around 3 million tonnes CO2-e would need to be purchased to offset remaining emissions in 2020, at a cost it estimates of around $30 million.12 A range of scenarios for Melbourne in 2020, including the potential offsets task, are shown in Figure 1.3.
Figure 1.3: City of Melbourne 2010 Emissions Profile and Possible Future Emissions Scenarios Source: City of Melbourne: Zero Net Emissions – Update 2014, p. 3.
For Adelaide as well as Melbourne, there is a whole range of strategies that can be employed to achieve this outcome, which are discussed in Chapters 4 and 5. They include measures such as improving the energy efficiency of buildings, increasing the share of renewable energy, changing transport or energy using behaviours, planting trees, investing in public and low carbon transport options, using biofuels, creating incentives and/or providing information to influence investment and consumption choices, and many others. Many such measures can be highly cost effective, by saving costs such as gas, electricity or fuel purchases. Other measures could involve net economic costs in direct terms, but create a range of other economic, social or environment co-benefits.
12
Ibid, pp 2 – 3.
pitt&sherry ref: HB15535H002 final rep 31P Rev00/PH 7
1.3 Project Scope and Team
This project has been undertaken by Dr Elena Tinch, Economist; Dr Phil McLeod, Building Scientist; Dr Hugh Saddler, Principal Consultant – Energy Strategies (the projections modelling and analysis team, also carbon accounting input from Dr Saddler); with inputs from Sven Rand, Program Leader – Climate Change Adaptation (offsets issues) and Mark Gjerek, Senior Consultant – Transport and Environment (transport issues); and co-ordinated by Phil Harrington, Principal Consultant and Team Leader – Carbon & Energy.
2. Accounting for Adelaide’s Greenhouse Gas Emissions
2.1 Carbon Accounting Framework
A key issue for this Foundation Report was to recommend a framework for reporting against and substantiating a claim of carbon neutrality. Adelaide has been using the Greenhouse Gas Protocol for Community-Scale Greenhouse Gas Emission Inventories, or GPC for short, developed by the World Resources Institute, C40 and ICLEI. Indeed we note that Adelaide was one of a number of cities around the world that participated in a trial of this protocol in 2013-14. As its name suggests, this document is a modification of the very widely used and highly regarded Greenhouse Gas Protocol, to meet the requirements of compiling an inventory of an administrative region, rather than a corporate entity. As such, it is fully consistent with the 2006 IPCC (Intergovernmental Panel on Climate Change) Guidelines for National Greenhouse Gas Inventories protocol used by national states and others reporting under the UN Framework Convention on Climate Change. While there are many carbon accounting frameworks available, most relate to project based emissions accounting – developed for private companies or for permit trading under the Clean Development Mechanism or other programs. These frameworks are not relevant or applicable to a spatial construct such as a city. Our assessment is that the GPC is the best and most appropriate available approach for compiling emissions inventories for Adelaide, particularly because of its consistency with the 2006 IPCC Guidelines. The basic emissions accounting approach embodied in the GPC is that the city should account for emissions that are attributable to activities and consumption patterns of the city. This includes emissions that actually occur inside the inventory boundary (see below), but also those that occur elsewhere but are induced by (or attributable to activities within) the city. Both need to be recorded and reported separately, to ensure that double-counting risks between reporting entities can be managed transparently.
2.1.1 The ‘scopes framework’
The Protocol requires cities to report their emissions using two distinct but complementary approaches. The ‘scopes framework’ clearly identifies emissions that occur inside the geographic boundary of the city (Scope 1), those that occur outside the boundary associated with electricity use inside the boundary (Scope 2), and other emissions outside the boundary associated with activities inside the boundary (Scope 3). Rules and protocols for accounting for Scope 1 and 2 emissions are quite clear cut; but this is less so for Scope 3, as there is room for interpretation about what is or is not an ‘activity attributable to the city’. An illustrative example for Adelaide would be public transport. The City has attractions, shops and employment. These induce travel on public transport within the City; they also cause people to use public transport to travel to and from the City area. The energy consumed by public transport to move people within the City’s boundary are Scope 1 carbon emissions. The energy consumed outside the city

pitt&sherry ref: HB15535H002 final rep 31P Rev00/PH 8
boundaries by buses, trams and trains coming or going to the City are Scope 3 emissions. The ‘scopes framework’ is demonstrated in Figure 2.1 below.
Figure 2.1: The Scopes Framework Source: GPC, p. 32.
2.1.2 The ‘city-induced framework’
The city-induced framework is a more limited reporting approach, with two levels – BASIC and BASIC+. The BASIC standard is a simplified emissions inventory that includes stationary energy, in-boundary transportation (only) and in-boundary generated waste. The BASIC+ standard adds reporting of emissions associated with industrial processes and product use; agriculture, forestry and other land use; trans-boundary transportation and energy transmission and distribution losses. As noted in Section 2.2 below, the current Adelaide City Council inventory includes two elements of BASIC+ (electricity transmission plus distribution losses and trans-boundary transportation excluding air travel) but not the other BASIC+ elements. We propose that the other elements should be included in future, subject to a significance test.
2.1.3 Data integrity
Cities must account for all required emissions sources within the inventory boundary using a consistent approach, boundary and methodology. A key requirement is transparency: all activity data, emission sources and accounting methodologies must be fully documented and disclosed to enable verification. A key test is that the inventory methodology should be able to be repeated by a third party, using the same data sources, and achieve the same result (in terms of calculated emissions). Data accuracy is important but this is qualitatively defined: it must be sufficient to give ‘reasonable assurance of the integrity of the reported information’, and it must not systematically overstate or understate actual emissions. The Protocol recognises that data is neither free nor likely to be complete, and allows for notation keys (such

pitt&sherry ref: HB15535H002 final rep 31P Rev00/PH 9
as ‘included elsewhere’, ‘not estimated’, ‘not occurring’ or ‘confidential’) to be used to flag known data limitations, exclusions or partial accounting for emission sources. 13 At the same time, the Protocol asks cities to report all emissions for which reliable data are available.
2.1.4 Emissions boundary
The emissions boundary for reporting purposes is not simply the physical boundary of the city, but also includes the number of greenhouse gases reported, the timeframe, the number of sources of and sinks for emissions. A key concept is ‘you can’t manage what’s not measured’. That is, if an emission is counted, then it creates the opportunity for that emission source to be managed, including minimised. If an emission source is defined outside the boundary, then there is likely to be no incentive for that emission to be managed, and reduced, over time. As a general rule, then, we encourage the City of Adelaide to be as inclusive as possible in defining its inventory boundary – noting (as above) that data limitations and other factors can place practical limits on the extent to which this is possible. The geographic boundary for Adelaide, for the purposes of this Strategy, is the local government area of the City of Adelaide. This definition has many practical advantages, including that the Adelaide City Council is the relevant administrative entity for this boundary and, as a result, has appropriate reporting frameworks already established. It is also consistent with the normal understanding of the City of Adelaide, as being the area enclosed by the Adelaide Parklands (Figure 2.2).
Figure 2.2: Adelaide City Local Government Area/Spatial Boundary
13
World Resources Institute et al, Global Protocol for Community Scale Greenhouse Gas Emission Inventories, 2014, p. 26.

pitt&sherry ref: HB15535H002 final rep 31P Rev00/PH 10
Source: ACC
With respect to the time period, inventories are required to cover a consistent time period (eg, calendar or financial year), and are recommended to be compiled annually. The City of Adelaide has used financial years for each inventory it has compiled; however, it does not compile an inventory every year. A key reason for this is that there has not been a suitable process in place for verifying trip data each year. This is a resource-hungry process, as it requires the compilation, ‘cleansing’ and then sophisticated analysis of very large amount of primary data, including AADT traffic counts. For the purposes of tracking progress against the carbon neutral target, and for eventually verifying the attainment of that target, however, we believe that annual inventories will be essential, and we recommend this practice going forward. With respect to greenhouse gases, cities are required to report emissions of all seven gases (or gas classes) required under the Kyoto Protocol:
carbon dioxide (CO2)
methane (CH4)
nitrous oxide (N2O)
hydrofluorocarbons (HFCs)
perfluorocarbons (PFCs)
sulphur hexafluoride (SF6)
nitrogen trifluoride (NF3) ACC’s current inventory reports emissions of the first three gases only. The remaining four are likely to be responsible for relatively low levels of emissions, however this can’t be accurately substantiated due to data unavailability – hence their exclusion from the inventory. As discussed in Section 2.2.3 below, we believe that there should be some consideration of expanding coverage to all seven gas classes, subject to further investigation into data availability.
2.1.5 Verification of carbon neutrality
The GPC itself does not define the term ‘carbon neutral’. However, the methodology does provide a framework for goal setting and accounting for performance. Indeed the GPC document cites the case of Melbourne’s carbon neutral target and notes minimum inventory reporting requirements needed to substantiate such a claim (which are a current inventory, a 2020 inventory and offsets equivalent to net emissions in 2020).14 The Protocol also sets out a process for verification of emissions inventories, but notes that verification can occur by an external party (such as an auditor) or could be carried out internally. Audit standards that must be applied are ASAE 3000 Assurance Engagements other than Audits or Reviews of Historical Financial Information; or ISO 14064-3:2006 Greenhouse gas specification with guidance for the validation and verification of greenhouse gas assertions. We recommend, for transparency, that Adelaide’s eventual claim of carbon neutrality is conducted by a suitably qualified third party, via inspection and review of the annual emissions inventory for the relevant year (eg, 2019) and of the documentation for all required offsets for that year.
2.1.6 Certification and consumer law
The NCOS (p.19) reminds parties that:
“When making Carbon Neutral Claims in conjunction with this Standard [the NCOS], users must be mindful of their obligations under the Australian Consumer Law. The Australian Consumer Law applies to all forms of marketing, including claims on packaging, labelling and in advertising and promotions across all mediums (print, TV, radio and internet). Consumers are entitled to rely on
14
Ibid, p. 142

pitt&sherry ref: HB15535H002 final rep 31P Rev00/PH 11
any carbon neutral claims you make under this Standard and expect these claims to be truthful. Organisations must ensure that any claims made regarding compliance with this Standard are accurate and appropriately substantiated. The Government has registered a certification trade mark which can be used under licence to market products, events and organisations as carbon neutral in compliance with the NCOS where those organisations are certified under the NCOS Carbon Neutral Program.”
We note that it may be possible to achieve certification of Adelaide’s (future) carbon neutral status under the National Carbon Offset Standard (NCOS) Carbon Neutral Program. The program is primarily aimed at individual companies, organisations and projects, and it is not clear whether a spatial unit such as Adelaide could be certified. In principle, however, it could be and this avenue could be further explored with its administrator, the Federal Department of the Environment. The Guide to this Program sets out the required process and notes that applicants must execute an NCOS Carbon Neutral Administration Agreement and Certification Trade Mark Licence (Figure 2.3). 15
Figure 2.3: NCOS Carbon Neutral Certification Trade Mark Source: https://www.environment.gov.au/climate-change/carbon-neutral/ncos
2.2 Inventory Methodology Issues and Enhancements
2.2.1 Calculating Scope 2 emissions
Introduction
Scope 2 emissions are emissions associated with the consumption of electricity, in this case, attributable to the ACC local government area, regardless of whether the electricity is produced in Adelaide or elsewhere. Broadly the emissions intensity of electricity use is affected by the fuel mix (including renewable vs fossil fuel energy share) that is used to generate the electricity, but other factors such as transmission and distribution losses may also affect the results. Adelaide and indeed South Australia are, of course, embedded within the National Energy Market (NEM) that runs from South Australia to Tasmania and North Queensland. In reality, the fuel mix associated with the set of generators operating in the NEM is constantly changing, literally from moment to moment. Further, the fuel and power generation technology mix varies dramatically by state. Therefore Scope 2 emissions factors are very sensitive to assumptions made about geography and time. Further, when we consider future Scope 2 emissions factors – as we must do to project future emissions associated with electricity consumption – the uncertainty is magnified by the fact that the policy environment for renewable electricity is currently undefined post 2020, in practice, when the national Renewable Energy Target scheme is currently scheduled to plateau. This does not, of course, mean that
15
http://www.environment.gov.au/climate-change/publications/carbon-neutral-program-guidelines

pitt&sherry ref: HB15535H002 final rep 31P Rev00/PH 12
there will be no new investment in renewable power generation post-2020, but that the quantum of new capacity and generation is more than usually uncertain. Due to these factors, our detailed analysis of Scope 2 emissions intensity below extends only to 2030, and thereafter we assume constant emissions intensity to 2050. A more sophisticated analysis of likely emissions intensity trends to 2050 could be undertaken but is outside the scope of the current project. As noted, the GPC describes the two methods for estimating Scope 2 emissions that are allowed under the GPC: the location-based and the market-based methods. The essential difference between the two approaches is that the location-based approach uses the physical flows of electrical energy as the basis of selecting the generators from which supply is sourced for consumption in a particular geographic area, while the market-based approach uses financial flows, and identifies that the generators that are receiving payment for the electricity consumption in the relevant geographic area. In many ways the distinction between the two approaches is analogous to the distinction in the operation of the National Electricity Market (NEM) between the physical flows of electricity from generators through local networks to consumers, as determined by the Australian Energy Market Operator (AEMO), and the financial flows from consumers to retailers and thence to generators, as determined by the array of financial hedging contracts between retailers, generators and market intermediaries. Under the location-based method, the relevant ‘location’ or physical boundary is South Australia. South Australia is a NEM region and therefore well described in both NEM and National Greenhouse Accounts Factors data. Under the location based approach, Adelaide is assumed to have the same Scope 2 emissions intensity as the rest of South Australia. This is the default assumption under the GPC and therefore is used in this report. Adelaide may also report its emissions using the market based method as an option. The following section details the methodology we have used to calculate and forecast Scope 2 emissions factors using both methods.
Demand
We begin by calculating demand for electricity in both the state as a whole and in the ACC LGA. The state projections are the AEMO “medium” case in its 2015 National Electricity Forecasting Report. Demand projections for Adelaide, for the purposes of these calculations, are those prepared by pitt&sherry under the BAU scenario below (see Section 2.3). The AEMO projections for South Australia do not include any output from rooftop PV, which AEMO treats as a reduction in demand. However, total electricity supplied to customers, obtained from the AER RIN data report for SA Power Networks includes PV exported to the network, but not PV consumed behind the meter. The distinction is relevant, because total supply is the basis for calculating LRET obligations and it is also what has been provided by SA Power Networks for this project. It is termed consumer demand and is shown at Row 30. The share of this sourced from local rooftop PV exports is calculated using an “export percentage”. This is projected to gradually decline as an increasing share of capacity is taken by large commercial installations, which are typically designed to displace purchased electricity with little or no export.
Market method
The market method calculation consists of several parts. The first part calculates supply from the various renewable electricity sources of supply which ACC customers are paying for in their electricity bills. The analysis is conducted at the whole of state level, and then applied to ACC consumption. The most important renewable supply source by far is the LRET. The initial analysis is based on the modelling done by ACIL Allen for the RET Review. We use the modelling reference case, for a target of 41,000 GWh, and

pitt&sherry ref: HB15535H002 final rep 31P Rev00/PH 13
pro-rate the results down to the now legislated 33,000 GWh target. The Renewable Power Percentage is first calculated; this will be used to calculate the “share” of total LRET generation being notionally paid for by ACC consumers. Secondly the share of ACIL Allen’s new LRET generation being notionally paid for by SA consumers is calculated; this is needed at a later stage of the calculation to calculate how much electricity must be supplied to SA from other sources. Some consumption of electricity by Emissions Intensive Trade Exposed activities does not attract an LRET obligation; the “rebate” is expressed in terms of entitlement to Partial Exemptions Certificates (PECs). The ACIL Allen report contains just a single national figure for the total number of PECs, with no allocation between states. We assume that the allocation to large electricity users in SA is 800 GWh; this is considerably less than a pro-rata share, because SA has no really large users, such as aluminium smelters. The second component of renewable electricity is Green Power, which is relatively small. It is assumed that ACC consumers are buying a quantity of total SA GreenPower purchases proportional to their share of total state electricity consumption, and that the ratio of GreenPower to total consumption in both the state and the ACC stays constant at the 2014 level throughout the projection period. The third component is electricity generated by rooftop PV. For the reasons explained above, this is not required for the Market method calculation, but the quantity of PV generated electricity that is exported to the local network, i.e. the export percentage, is required. The current ratio of exports to total PV output is calculated from the AER RIN data. For the reason explained above, it is assumed that this proportion will fall gradually over the projection period, and that it will fall faster in the ACC area than in the state as a whole, because of the relatively small number of residential electricity customers and the much large number of commercial and public sector customers. The next task is to estimate Scope 2 emissions associated with that part of total electricity consumption which is not being supplied from the various renewable sources analysed in the first part of the calculation, or the portion supplied by fossil fuels. This quantity is first calculated as the difference between total state consumer demand and the quantity of this demand being notionally supplied for renewable generators. Then the quantity of electricity likely to be supplied by fossil fuel generators located in SA is projected, based on supply in recent years. The projection assumes that: 1) Northern and Torrens Island A will both close in 2017,
2) Pelican Point will generate at about the same level as it did prior to 2013, and
3) all the other gas fuelled stations, both combined and open cycle gas turbine, and also Torrens Island
B, will generate at about the same level as achieved in the past two or three years.
Year by year total sent out generation and emissions are calculated from these projections for individual power stations. The next step is to calculate by how much total operational demand (defined as consumer demand plus distribution losses plus transmission losses) exceeds supply from the total of all contracted renewable generators plus fossil fuel generators located in SA. There is a significant shortfall in every year. In FY2015 just under 2,100 GWh was imported into SA from Victoria. Examination of generation data for Victoria in recent years shows that each of the four main brown coal power stations has been operating at close to maximum capacity; it is therefore assumed that annual supply from Victoria will be capped at 2,100 GWh for the entire projection period. This assumes that neither Hazelwood nor Yallourn W will be closed during this period (Anglesea and Morwell have already closed or are about to close). This may well prove to be an unrealistic assumption, and may therefore over-estimate emissions in future years, but we have no definite basis for making any alternative assumption under the business as usual convention.

pitt&sherry ref: HB15535H002 final rep 31P Rev00/PH 14
Both total generation and total emissions are calculated allowing year by year emissions intensity of Victorian fossil fuel electricity to be calculated. On completion of this step, it is found that there still remains a shortfall of supply of around 2 TWh annually. It is assumed that this electricity is sourced from NSW, where all the coal fired power stations at currently operating at well below maximum capacity. The calculation procedure applied to Victorian coal generators is applied to NSW generators, to calculate year by year sent out emissions intensity of NSW electricity. The final step of this part of the calculation is to combine the estimates of quantities of fossil fuel electricity notionally supplied from each state with the calculated year by year state-wide sent out emissions intensity, so as to calculate total Scope 2 emissions for the state and a corresponding year by year emissions intensity of fossil fuel electricity. We then calculate the total quantity of fossil fuel electricity supplied to ACC consumers (including pro-rata shares of electricity lost in transmission and distribution), and express the emissions and express the associated emissions over total electricity consumption to derive the average Scope 2 emissions intensity for Adelaide.
Location method
The key requirement of the location method is the proportion of new national LRET generation that will be located in SA to 2030. Two different assumptions are used: 25% and 15%. Unsurprisingly, it is found that LRET generators meet a large proportion of total state demand in all projections years so that, except in 2018, immediately after the closures of Northern and Torrens Island A, imports from Victoria are not required. From 2020 on, there is a surplus of generation in SA. It is assumed that all the remaining gas fired generators will continue to operate, as in the market method calculation, and that surplus wind generation is exported to Victoria. A state-wide emissions intensity is then calculated for each assumption and applied to ACC electricity demand to calculate total emissions over the period to 2030. Figure 2.4 below shows the historical values for the location based method, and projections for both methods. The plateau that can be seen in both traces in the 2020 – 2030 period reflects no increase in the renewable power percentage under the nRET post 2020, while we assume that Torrens Island B, Pelican Point and Osborne power stations continue to operate at high capacity factors through this period. As with the market-based projection, we then assume that emissions intensity remains constant to 2050. While this is in fact unlikely, the key point is to highlight the gap between the two traces, rather than their absolute heights.
Figure 2.4: Emissions Intensity of Electricity Supply (Scope 2 Emissions) – Reference Case
0.00
0.10
0.20
0.30
0.40
0.50
0.60
0.70
0.80
0.90
1.00 kt CO2-e per GWh
Location Based Market Based

pitt&sherry ref: HB15535H002 final rep 31P Rev00/PH 15
Source: pitt&sherry
2.2.2 Scope 2 (Electricity) Emissions – With Measures
The previous section describes the methodology and results of using both location-based and market-based methodologies for projecting the emissions intensity of electricity supply in the reference or BAU scenario. However, these emissions values could change if new investments are made in renewable energy as part of the Carbon Neutral Adelaide strategy. To illustrate this, in this section of the report we examine the effect on the two Scope 2 emissions projections of a (hypothetical) large scale power purchase agreement (PPA) for renewable electricity. Under the location-based approach, the trace in Figure 2.5 below barely differs from that in Figure 2.4, because the measures induce a quite small change in the total renewable energy generation in South Australia, and therefore, a very small change in South Australia’s average greenhouse intensity of electricity supply. However, a very different picture emerges with the market-based approach. A large PPA would reduce to zero the emissions associated with potentially all or a significant percentage of total electricity consumption in Adelaide. As a result, the average emissions intensity of electricity consumption would also fall dramatically. Indeed it is projected on these particular assumptions to fall to very similar values as in the location-based method.
Figure 2.5: Emissions Intensity of Electricity Consumption (Scope 2 Emission) – Location-Based and Market-based Methods, With New Renewable Energy Measures Source: pitt&sherry
While Figure 2.5 shows that, with one of the power purchase agreement (PPA) or Green Power measures proceeding as modelled, the two Scope 2 methods produce very similar results, it is also the case that if there were less take-up of new renewable energy measures than modelled, then emissions intensity under the market-based method would be higher than shown. Conversely, the market based method could enable Scope 2 emissions to fall to zero, potentially very quickly, if a sufficiently large contract for renewable electricity supply were written. Under the location-based method, emissions intensity of electricity consumption is unlikely to reach zero for decades.
0.00
0.10
0.20
0.30
0.40
0.50
0.60
0.70
0.80
0.90
1.00
kt CO2-e per GWh
Location based - Adjusted for renewable energy measures
Market based - Adjusted for renewable energy measures
pitt&sherry ref: HB15535H002 final rep 31P Rev00/PH 16
Scope 2 emissions - conclusions
Our key conclusions and recommendations from this discussion of Scope 2 emissions factors are as follows:
1. ACC is required under the GPC to report emissions using the location-based method and may also report using the market-based method;
2. Depending upon the set of (renewable energy) measures that actually proceeds in future, the market-based approach could lead to Scope 2 emissions factors that are lower or higher than those generated by the location-based method;
3. The full abatement benefit (and therefore true cost of abatement) of renewable energy measures in reducing greenhouse gas emissions attributable to Adelaide is revealed only by the market-based method. This method, for example, would enable zero emissions to be reported for all electricity consumption attributable to Adelaide provided PPA or Green Power contracts are large enough to cover actual demand;
4. For transparency, and noting the potential for competing claims from other cities (at least Canberra, but possibly Melbourne in future), we recommend that ACC reports future inventories using both the location-based and the market-based methods;
5. To optimise the set of abatement measures, including offsets, to underpin an eventual claim of carbon neutrality at a particular date in future, the volume of abatement measures/offsets should be sized to cover the higher of the two emissions observations, in order to forestall any criticism of such a claim by other cities.
2.2.3 Reporting levels
The Protocol defines what it calls reporting levels, of which there are two: BASIC and BASIC+. The latter includes some additional emission sources, which are: 1) Industrial Processes and Product Use (IPPU); 2) Agriculture, Forestry and Other Land Use (AFOLU); 3) Transboundary transportation emissions; and 4) Energy transmission and distribution losses. The Adelaide inventories currently include sources 3) and 4). Source 2) Agriculture, forestry and other land use - is likely to be very small for Adelaide as either source or sink within the city boundaries. (1) - Industrial processes and product use - includes emissions attributable to leakage for HCFC and HFC refrigerant gases. This is likely to be a negligible emission source for Adelaide. However, for subsequent inventory updates, it would be reasonable to investigate this issue in greater detail and an estimate developed of emissions from this source. Currently, the state inventories prepared by the Commonwealth Department of the Environment use a pro-rating of the national stock model figures estimated for the NGGI. (4) - Energy transmission and distribution losses (T&D losses) – Scope 3 emissions from T&D losses have now been included in the overall total of the GHG emissions for the City of Adelaide.
Waste
The current inventory includes emissions from waste treated both inside and outside the city boundary. Applying current emissions factors and addressing other methodological issues, waste-related emissions will be significantly lower than previously reported. We note that waste represents a small share of total emissions in any case, so the impact of this change on total emissions is not large. Further work to improve visibility and accuracy of solid waste disposal volumes would be worthwhile.

pitt&sherry ref: HB15535H002 final rep 31P Rev00/PH 17
Fugitive energy emissions
Fugitive emissions from methane leaking from natural gas distribution systems are included in the Protocol as part of BASIC reporting. These are a Scope 1 emission source, and not be confused with energy transmission and distribution losses, which effectively apply only to electricity and are a Scope 2 source. Emissions from this source are not included in the current Adelaide inventory template. Ideally, these should be estimated pro-rata on the basis of length of distribution pipelines within the city area (not gas consumption), if that data can be provided by Australian Gas Networks. (Total length in the state is available.)
Water Consumption
Emissions associated with water consumption in Adelaide are not required to be reported under the GPC. However, we note that Melbourne does report emissions (Scope 3) for industrial and residential water consumption, although Sydney does not. While not a major issue, since Adelaide has expressed the desire to have a consistent reporting methodology with Sydney and Melbourne in particular, this issue may be worth further discussion with Melbourne in particular. Also, we noted in Chapter 1 that an advantage of defining emissions as ‘in scope’ is that it opens up additional opportunities for abatement projects to be realised. Water pumping and desalination (when required) are very large consumers of electricity in South Australia and potentially, therefore, large sources of greenhouse gas emissions – depending upon whether renewable or fossil energy is used to generate the electricity.
2.2.4 Documentation/Standardisation
As noted, the GPC requires that Cities must account for all required emissions sources within the inventory boundary using a consistent approach, boundary and methodology, while data issues, including sources and limitations, must be dealt with transparently. Second, we noted in Chapter 1 that Adelaide wishes to achieve as much consistency, in terms of its emissions accounting practices, as practically possible with at least Sydney and Melbourne, but ideally also with other international cities reporting against carbon neutral targets. Finally we have noted above a range of specific issues where further consideration or investigation may be necessary to determine the optimal pathway for future inventories and progress reporting. Taken together, we believe that it be optimal to create an emissions inventory/reporting guide, to support continuity and repeatability of inventories annually, to a standard suitable for ultimate certification of carbon neutrality. pitt&sherry has recently undertaken this task for the Australian Capital Territory, for the same purpose of aligning with current IPCC Guidelines. The guide would nominate appropriate data sources, metrics, sector-specific methodologies and an annual work program/timeline. This task could be undertaken by ACC, or else by an external party working closely with ACC and the State Government. The project should extend to resolving points of difference in methodology with Sydney and Melbourne, and also outreach to the CNCA, for the purposes of ensuring as much methodological alignment as possible, with the ultimate goal being to underpin the credibility of an eventual claim of carbon neutrality. We note that new data sources will become available over time, and also that accounting and reporting protocols are revised from time to time. These changes should be reflected in new versions of the Guide as needed.

pitt&sherry ref: HB15535H002 final rep 31P Rev00/PH 18
2.3 Current Emissions Profile and Trends
This section of the Report draws heavily on work by the Adelaide City Council, undertaken by P. Nattrass and L. Irwin in particular, and pitt&sherry would like to acknowledge their contribution to the Report. In particular, the data draws on 2012-13 (FY2013) inventory of emissions compiled by ACC taking into account the latest revisions outlined in more detail in the previous section. The key revisions are:
Revised electricity consumption data.
Updated emissions factors as per the National Greenhouse Accounts Factors, August 2015.
Revised transport emissions based on the improved data both for public and private transport.
Revised waste emissions due to the updated emissions factor for diverted green waste and revised commercial and industrial volumes.
2.3.1 GHG Profile by Sector
In FY13 the total amount of GHG emissions was just under 0.94 million tonnes of CO2-equivalent. Carbon Dioxide (CO2) was by far the most significant gas, contributing 95% to total amount. Figure 2.6 shows the summary of the Adelaide City GHG emissions in FY2013 by Sector. As can be seen below, commercial and transport sectors are the two largest sub-sectors in terms of emissions, contributing 43% and 35% to the total respectively. Scope 3 emissions as a result of transmission and distribution losses accounted for a further 9% of the total. The other sectors, such as waste, residential and industrial sectors, contributed 5%, 3% and 5% each.
Figure 2.6: Adelaide City GHG Emissions by Sector (tonnes CO2-e).
Source: Data – ACC; Analysis - pitt&sherry
Total greenhouse gas emissions declined steadily over the period from FY2007 to FY2013 with the total decline amounting to 20%. The commercial sector experienced the largest reduction in GHG emissions, having reduced its emissions by 32% over a 6 year period, largely due to reduced GHG intensity of the
43%
3% 5% 9%
35%
5%
Commercial energy use
Residential energy use
Industrial energy use
electricity network losses
Transport fuels
Waste to landfill

pitt&sherry ref: HB15535H002 final rep 31P Rev00/PH 19
grid16. The other sectors experienced somewhat slower, nonetheless significant reduction with the exception of the waste sector, where emissions went up by just under 1%.
Figure 2.7: Adelaide City GHG Emissions by Sector (tonnes CO2-e) – FY2007 vs FY2013.
Source: Data – ACC; Analysis - pitt&sherry
2.3.2 Emissions Profile by Fuel
Commercial sector
As described in the previous section, the commercial sector is the largest consumer of electricity. Electricity consumption17 in the commercial sector has reached its peak in FY2010 and has been declining since. This can be predominantly attributed to national energy efficiency policies, including the energy performance requirements in the National Construction Code, along with measures such as Commercial Building Disclosure and NABERS. On the other hand, gas consumption has actually increased by 10% during the period from FY2007 to FY2013 (see Figure 2.8). While we do not have explanatory data, this is likely to be partly explained by new use of cogeneration and tri-generation systems.
16
The greenhouse intensity of South Australia’s electricity grid has fallen from 0.89 kg CO2-e/kWh in 2004-05 to 0.55 kg CO2-e/kWh in 2012-13. 17
We understand the SAPN data reports metered sales to ‘commercial’ customer classes; this will exclude, therefore, any electricity generated on-site (“behind the meter”) from PV, cogeneration, tri-generation or other sources.
0
200,000
400,000
600,000
800,000
1,000,000
1,200,000
1,400,000
Commercial Sector
Residential Sector
Industrial Sector
T&D electricity losses
Transport Waste Total
Ton
ne
s C
O2
-e
FY2007 GHG Emissions FY2013 GHG Emissions

pitt&sherry ref: HB15535H002 final rep 31P Rev00/PH 20
Figure 2.8 Stationary energy consumption in Commercial Sector (FY2007 to FY2013)
Source: Data by ACC; Analysis by pitt&sherry
Average energy consumption per square metre of commercial floor area has improved. Alongside falling energy consumption in the commercial sector, Adelaide City has been experiencing annual growth in workers of 1.4% from FY2007 to FY2013, which resulted in the overall drop in energy consumption per capita of workers in the city by nearly 5% over this period (see Figure 2.9).
Figure 2.9: Energy Intensity trends in Commercial Sector
Source: Data by ACC; Analysis by pitt&sherry
Residential sector
Electricity consumption in the residential sector has largely followed the same trend as the commercial. Electricity consumption began to decline in FY2010. In fact according to SA Power Networks data and as can be seen in Figure 2.10, electricity consumption in residential sector is at its lowest since 2006.18
18
Growing residential PV output is appears in this data as declining consumption.
50,000
70,000
90,000
110,000
130,000
150,000
0
500,000
1,000,000
1,500,000
2,000,000
2,500,000
3,000,000
3,500,000
FY2007 FY2008 FY2009 FY2010 FY2011 FY2012 FY2013
Cap
ita
GJ/
year
Gas Electricity Workers population
0.75
0.8
0.85
0.9
0.95
1
20
22
24
26
28
30
32
34
FY2007 FY2008 FY2009 FY2010 FY2011 FY2012 FY2013
GJ
(gas
an
d e
lect
rici
ty)
per
m2
GJ
(gas
an
d e
lect
rici
ty)
per
cap
ita
of
wo
rker
s
Energy consumption per capita of workers Energy intensity

pitt&sherry ref: HB15535H002 final rep 31P Rev00/PH 21
Figure 2.10: Electricity and Gas Consumption Trends in Residential Sector
Source: data - ACC; analysis – pitt&sherry
There are a number of factors contributing to such a drop in electricity consumption, such as rooftop photovoltaic (PV) installations, consumer responses to electricity price rises and increased energy efficiency initiatives19 (ACC, 2014). At the same time, total gas consumption has remained relatively stable. Energy consumption per capita of residential population has declined for both gas and electricity over the period from FY2007 to FY2013. Over this period, the residential population has been growing at an average annual rate of 3% per year.
Figure 2.11: Energy Intensity Trends in Residential Sector
Source: data - ACC; analysis – pitt&sherry
19 Australian Energy Market Operator, 2013 South Australian Electricity Report, http://www.aemo.com.au/Electricity/Planning/South-Australian-Advisory-Functions/South-Australian-Electricity-Report
0
5,000
10,000
15,000
20,000
25,000
0
50,000
100,000
150,000
200,000
250,000
300,000
FY2007 FY2008 FY2009 FY2010 FY2011 FY2012 FY2013
Cap
ita
GJ/
year
Gas Electricity Residential populaiton
2
2.4
2.8
3.2
3.6
4
6
8
10
12
14
16
FY2007 FY2008 FY2009 FY2010 FY2011 FY2012 FY2013
GJ
(gas
) p
er c
apit
a
GJ
(ele
ctrc
ity)
per
cap
ita
Electricity consumption per capita of residents Gas consumption per capita of residents

pitt&sherry ref: HB15535H002 final rep 31P Rev00/PH 22
Industrial Sector
Both gas and electricity consumption in the industrial sector has been falling consistently since FY2008 with the exception of a peak for gas in FY2011 followed by a sharp decrease. This is the only sector where gas consumption in FY2013 was lower compared to FY2007 (6.5% drop). At the same time, electricity consumption fell by more than half (57%) over the same period. In contrast to the previous two sectors, the industrial sector in Adelaide City consumes more gas than electricity (see Figure 2.12 below). In FY2013 electricity consumption was only 6% of the total stationary energy consumption. This may be due to the drop in activity of industrial sector (ACC, 2015) or that the energy intensity of activity in the industrial sector has changed, for example due to energy-intensive activity being relocated outside the LGA or ceasing.
Figure 2.12: Industrial Energy Consumption by Fuel
Source: data - ACC; analysis – pitt&sherry
Transport
Transport is the second largest contributor of GHG emissions in Adelaide City. 35% of the total GHG emissions was attributed to this subsector in FY2013. According to the ACC GHG Emissions Inventories, in a period from FY2007 to FY2013, total emissions from transport sector decreased by 2%. Private vehicles are by far the most dominant transport mode contributing as much as 91% of the total transport emissions in FY201320. Petrol is the most popular type of fuel for passenger vehicles with 88% of the total, followed by diesel and LPG. We note that the share of emissions attributed to ‘trucks21 and light commercial vehicles’, appears to be very low. No emissions are reported for such vehicles in the ‘internal’ transport task. Ideally this data would be revisited.
20
Motorcycles contribute approximately 2% of the total 99%. 21
“Trucks” category includes rigid, articulated and non-freight carrying trucks
600,000
650,000
700,000
750,000
800,000
850,000
FY2007 FY2008 FY2009 FY2010 FY2011 FY2012 FY2013
GJ
per
yea
r
Gas Electricity

pitt&sherry ref: HB15535H002 final rep 31P Rev00/PH 23
Figure 2.13: GHG Emissions from Transport Sub-sectors (tonnes CO2-e) in FY2013.
Source: data - ACC; analysis – pitt&sherry
Public transport contributes 8% of the total net emissions with trains and buses contributing 38% and 55% respectively.
Figure 2.14: GHG Emissions from Public Transport (tonnes CO2-e) in FY2013
Source: data - ACC; analysis – pitt&sherry
91%
1%
0% 8% Passenger vehicles
emissions
Motorcycles emissions
Trucks emissions
Public Transport emissions
55%
7%
0%
38%
Buses
Trams
Maritime
Trains
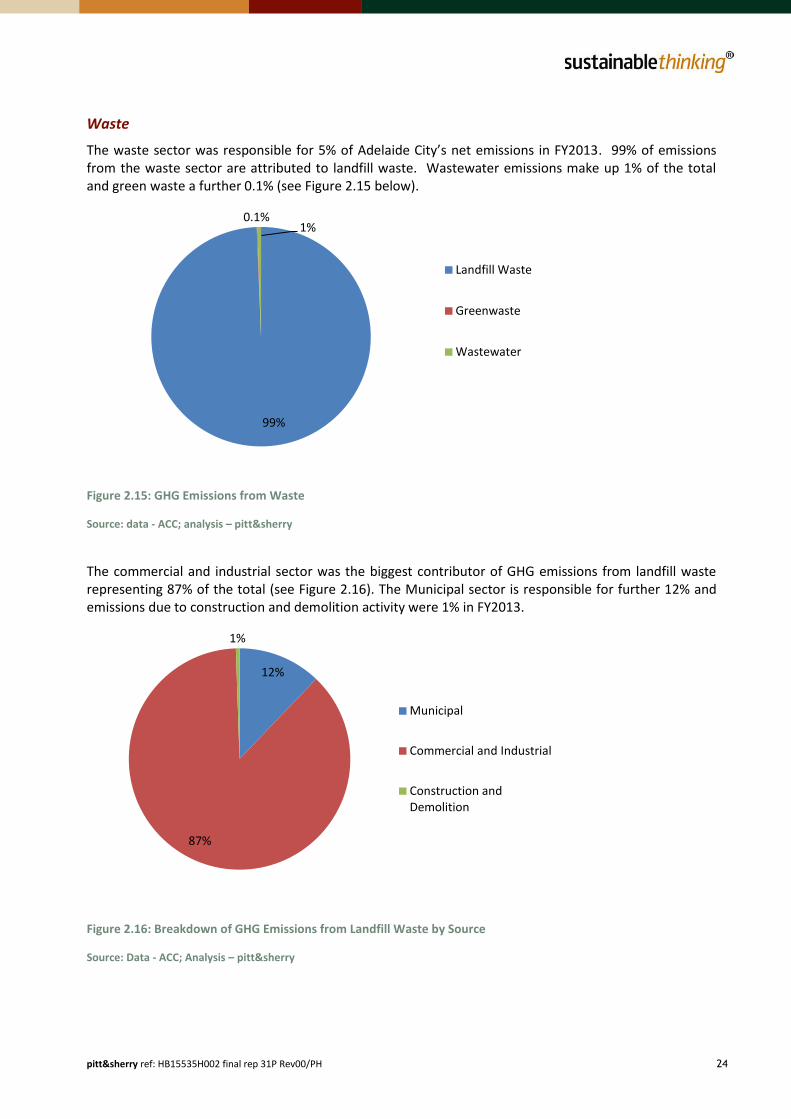
pitt&sherry ref: HB15535H002 final rep 31P Rev00/PH 24
Waste
The waste sector was responsible for 5% of Adelaide City’s net emissions in FY2013. 99% of emissions from the waste sector are attributed to landfill waste. Wastewater emissions make up 1% of the total and green waste a further 0.1% (see Figure 2.15 below).
Figure 2.15: GHG Emissions from Waste
Source: data - ACC; analysis – pitt&sherry
The commercial and industrial sector was the biggest contributor of GHG emissions from landfill waste representing 87% of the total (see Figure 2.16). The Municipal sector is responsible for further 12% and emissions due to construction and demolition activity were 1% in FY2013.
Figure 2.16: Breakdown of GHG Emissions from Landfill Waste by Source
Source: Data - ACC; Analysis – pitt&sherry
99%
0.1% 1%
Landfill Waste
Greenwaste
Wastewater
12%
87%
1%
Municipal
Commercial and Industrial
Construction and Demolition

pitt&sherry ref: HB15535H002 final rep 31P Rev00/PH 25
3. Emissions Trends to 2050 – Business-as-Usual Scenario
3.1 Introduction
This chapter indicates the trajectory of greenhouse gas emissions, by sector and in total that would be expected under a reference scenario. That scenario is most often called ‘business as usual’ (BAU), but also may be referred to as a ‘no new policy’ or ‘frozen policy’ scenario. The BAU convention assumes that current policy measures remain in place (unless they are already scheduled to end, such as nRET in 2020) and that no new ones are introduced. This is because we do not have knowledge of the nature of possible future policy interventions (other than those studied in Chapter 3). It also assumes that other trends, such as market, demographic and technological developments, continue as currently expected. Clearly there is uncertainty about these factors, and different assumptions about them will change the results presented here. For example, it would be possible to model the effect of changes in national policies, such as an extension/expansion of the nRET or the reintroduction of a carbon price. All key assumptions in this report are referenced, using reputable sources. Where ranges of assumptions are cited, we have used more conservative values to avoid overstating impacts. We begin with an overview of our projections methodology and key assumptions. The subsequent sections explain our projections by sector.
3.2 Projections Methodology and Data Sources
pitt&sherry has compiled an emissions projections model for City of Adelaide local government area. We note that this task was greatly facilitated by the excellent emissions inventories, and existing projections model, previously compiled by Adelaide City Council staff, and also by the excellent cooperation that we received during this project from those same staff. We also note that Council staff updated inventory calculations in line with methodological recommendations. The model uses historical data from a range of sources (notably the emissions inventories) to create a picture of emissions by sector (stationary energy – including by building type – transport and waste) and by fuel, annually from FY2007 to FY2050. The FY2007 base year is chosen as the Adelaide City Council undertook a detailed emissions inventory, including transport task analysis, in that year. Also, it is early enough to reveal important historical trends. We estimate business-as-usual emissions with reference to a hypothetical ‘frozen efficiency’ projection, which show what emissions would look like if there were no improvements in energy efficiency or greenhouse gas intensity through time. The gap between frozen efficiency and BAU is an indicator of the effect that technology and market trends and existing policy measures are having on the current trajectory of emissions. The projections model we have developed treats growth as ‘endogenous’ to the model; that is, emissions respond to a range of variables such as gross regional product, population projections (residents and workers) and floor area ratios (per resident, per worker, etc). Key assumptions about growth in the city’s population, activity level and footprint can readily be changed in the model in order to understand the impacts of these changes on emissions growth and the magnitude of the task required to achieve carbon neutrality. Table 3.1 provides further details on the methodology and data sources used in the model for each sector.

pitt&sherry ref: HB15535H002 final rep 31P Rev00/PH 26
Table 3.1: Emissions projections model – methodology and data sources
Sector Methodology and data sources Limitations
Stationary Energy
(gas and electricity
consumption)
for
Commercial, Industrial and
Residential Sectors
Electricity and gas consumption has been modelled separately for commercial, residential and industrial sector. Total energy consumption has been calculated as a function of a total floor area for each sub-sector and energy intensity. Gas and electricity usage is based on the historic trend. Electricity consumption data for Adelaide City Council community (postcodes 5000, 5001, 5005 and 5006) was provided by SA Power Networks and Adelaide City Council. Electricity consumption data was provided for Commercial, Industrial and Domestic users, with further categories for Off-Peak Storage and Public Lighting. Off-Peak Storage relates to electricity used during off-peak times for hot water storage and has been allocated to Domestic in the spreadsheet for the analysis. Gas usage data has also been obtained from the spreadsheet files underlying the annual inventories and new data has been obtained from APA Group22. The detailed database of land use and floor area in the City of Adelaide Council area was provided by ACC for the years FY0607 and FY1415. This data has been aggregated and energy consumption calculated separately for each of the following categories of building types:
- Commercial: offices, hotels, health care, education (tertiary), education (schools), retail (shops), retail (pub, restaurants, etc.), carparks (open), carparks (closed), other.
- Residential: detached and semi-detached, and multi-unit dwellings.
- Industrial: Factories, breweries, manufacturing etc. Energy intensity for each of the sub-sectors and building types above was based on the previous pitt&sherry’s work23.
pitt&sherry was not able to obtain high voltage consumption data, so this has been excluded from the current analysis.
Transport pitt&sherry’s modelling of the transport sector is based on the transport data provided by the ACC, which has also been used in FY2013 emissions inventory and ACC emissions projections model. pitt&sherry used the same “travel distance” approach as the Adelaide City Council which includes car, truck and motorbike trips as well as public transport. Emissions from transport were calculated for the following categories:
- Work-related and non-work related travel. - Internal and external travel. - Passenger vehicles and motorcycles, trucks and light
commercial vehicles and public transport (trains, trams, buses and maritime).
- Petrol, diesel, LPG and electricity consumption.
Below is the list of selected key data that was referenced by ACC (L.Irwin) in their transport inventory and as such of direct relevance here:
- 2006 and 2011 Australian Bureau of Statistics Census data provided vehicle counts for work-related vehicle trips into/out of or within ACC.
- RAA travel calculator for average kilometres by suburb data. - The ABS traffic data. - Non work-related travel has been estimated from the City
User Profile Survey data. - ABS census data was used for a profile of vehicle and fuel
It should be noted that trucks and light commercial vehicles data has only been included as an external travel and as such there is risk that the overall transport emissions have been underrepresented.
22
ACC, 2015 23 pitt&sherry (2015) Energy Efficiency Master Plan – Foundation Report: For the City of Sydney.
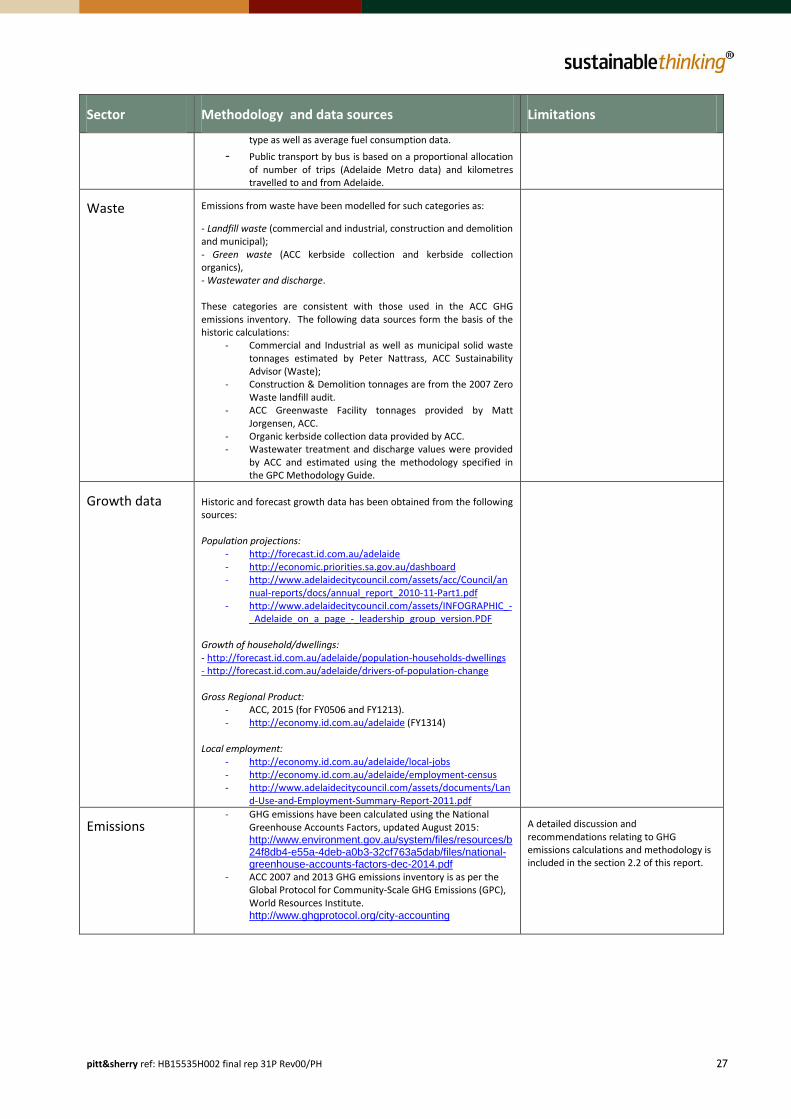
pitt&sherry ref: HB15535H002 final rep 31P Rev00/PH 27
Sector Methodology and data sources Limitations
type as well as average fuel consumption data.
- Public transport by bus is based on a proportional allocation of number of trips (Adelaide Metro data) and kilometres travelled to and from Adelaide.
Waste Emissions from waste have been modelled for such categories as:
- Landfill waste (commercial and industrial, construction and demolition and municipal); - Green waste (ACC kerbside collection and kerbside collection organics), - Wastewater and discharge. These categories are consistent with those used in the ACC GHG emissions inventory. The following data sources form the basis of the historic calculations:
- Commercial and Industrial as well as municipal solid waste tonnages estimated by Peter Nattrass, ACC Sustainability Advisor (Waste);
- Construction & Demolition tonnages are from the 2007 Zero Waste landfill audit.
- ACC Greenwaste Facility tonnages provided by Matt Jorgensen, ACC.
- Organic kerbside collection data provided by ACC. - Wastewater treatment and discharge values were provided
by ACC and estimated using the methodology specified in the GPC Methodology Guide.
Growth data Historic and forecast growth data has been obtained from the following sources: Population projections:
- http://forecast.id.com.au/adelaide - http://economic.priorities.sa.gov.au/dashboard - http://www.adelaidecitycouncil.com/assets/acc/Council/an
nual-reports/docs/annual_report_2010-11-Part1.pdf - http://www.adelaidecitycouncil.com/assets/INFOGRAPHIC_-
_Adelaide_on_a_page_-_leadership_group_version.PDF
Growth of household/dwellings: - http://forecast.id.com.au/adelaide/population-households-dwellings - http://forecast.id.com.au/adelaide/drivers-of-population-change Gross Regional Product:
- ACC, 2015 (for FY0506 and FY1213). - http://economy.id.com.au/adelaide (FY1314)
Local employment:
- http://economy.id.com.au/adelaide/local-jobs - http://economy.id.com.au/adelaide/employment-census - http://www.adelaidecitycouncil.com/assets/documents/Lan
d-Use-and-Employment-Summary-Report-2011.pdf
Emissions - GHG emissions have been calculated using the National
Greenhouse Accounts Factors, updated August 2015: http://www.environment.gov.au/system/files/resources/b24f8db4-e55a-4deb-a0b3-32cf763a5dab/files/national-greenhouse-accounts-factors-dec-2014.pdf
- ACC 2007 and 2013 GHG emissions inventory is as per the Global Protocol for Community-Scale GHG Emissions (GPC), World Resources Institute. http://www.ghgprotocol.org/city-accounting
A detailed discussion and recommendations relating to GHG emissions calculations and methodology is included in the section 2.2 of this report.

pitt&sherry ref: HB15535H002 final rep 31P Rev00/PH 28
3.3 Stationary Energy Emissions - Energy Supply
In this report (and as per the ACC inventory) we consider only major stationary energy fuels/carriers, being electricity and gas. Emissions associated with gas consumption are derived from the Australian Government’s National Greenhouse Accounts Factors Workbook (August 2015), applied to gas consumption data sourced from ACC, but ultimately from Australian Gas Networks. Similarly, emissions associated with electricity consumption are derived by applying Scope 2 and Scope 3 emissions factors (as described in Chapter 2) to electricity consumption data sourced from ACC, but ultimately from South Australian Power Networks.
3.4 Stationary Energy Emissions - Energy Consumption
The key mechanism driving energy savings in the BAU scenario is that existing energy efficiency measures are steadily improving the energy efficiency of the building and appliance/equipment stock as it is replaced or refurbished through time. The key policy measures that are contributing to this outcome include:
the National Construction Code (NCC) energy efficiency provisions;
Minimum Energy Performance Standards (MEPS) and labelling of equipment and appliances; and
Green Star, NABERS and Commercial Building Disclosure;
REES (the South Australia Retailer Energy Efficiency Scheme).
With respect to appliances and equipment, the savings estimates take into account known trends, for example, increasing penetration rates and installed capacity of air conditioners in houses, at least to the extent to which these trends have been quantitatively analysed (see “MEPS and Labelling” below for further details).
As an overall caution, it should be noted that modelling multiple policy measures that operate on the same energy end-uses is complex, as measures can interact in positive or negative ways. While we have taken care to avoid double-counting of savings, it is beyond the scope of this study to undertake a definitive analysis of all possible policy interactions. Also, we are reliant on published estimates of the savings attributable to specific measures, and not all of these have been verified by retrospective and independent analyses. Finally, other measures and trends may also be affecting energy consumption in a BAU scenario, but these have not been modelled.
National Construction Code 2006 (previously Building Code of Australia 2006 – BCA2006)
Savings attributed to BCA2006 are based on estimates from the Regulatory Impact Statement (RIS). We note that some analysts believe the savings (particularly gas savings) attributable to BCA2006 were overestimated in the RIS. However, we are not aware of any retrospective analysis to determine what the realised savings from BCA2006 actually were, as distinct from what they were expected to be. Also, it should be noted that not all building types covered in this study were modelled in the relevant RIS’, and therefore some assumptions have had to be made about the expected impact of those provisions on certain building types.
National Construction Code 2010 (previously Building Code of Australia 2010 – BCA2010)
Savings attributed to BCA10 are based on the relevant RIS. The ‘stringency’ of these provisions is higher than BCA2006. Savings are quite significant as new buildings (including replacements of those demolished) and buildings subject to major refurbishment are required to comply with these provisions. There is some uncertainty within the buildings community itself about what exactly constitutes ‘major refurbishment’ sufficient to trigger the application of the current version of the BCA, and also about

pitt&sherry ref: HB15535H002 final rep 31P Rev00/PH 29
which elements or sub-systems of a building have to comply, depending upon the nature of the refurbishment undertaken. For the purposes of this study, we assume that 1% of each building class is refurbished annually to the extent that the BCA savings measures apply. Similarly, we assume 1% of the stock is demolished and replaced annually. Incremental savings attributable to BCA2010, over and above those attributable to BCA2006, are estimated to avoid double counting the two measures.
Under compliance with the Code
It is highly unlikely that every building subject to the energy provisions of the Code realises the estimated energy savings they will provide. A reasonable level of under-compliance for several reasons is likely, because of poor building practice or design changes that occur through the building stage, which can be overlooked in the certification process. To account for this we have assumed that under BAU, that only 90% of the potential energy savings are achieved (a reduction in the level of savings assumed in the relevant Regulation Impact Statements of 10%). There is no hard data on what the actual level of under-performance of new building stock may be. However, our National Energy Efficient Buildings Project report24 cited significant stakeholder concerns about this in all states and territories, including South Australia.
NABERS/CBD/Green Star
We have modelled these three measures together. NABERS (the National Australian Built Environment Rating System) has been modelled in line with our own previous studies, drawing on estimates of performance improvements published by the NSW Office of Environment and Heritage which manages the program. For the Commercial Building Disclosure program (CBD) we assume a assume a declining savings rate over the longer term due to saturation effects and no change in current policy settings (eg, no expansion to new building types). Energy savings attributable to Green Star are also estimated from official estimates available from the Green Building Council.
Mandatory Energy Performance Certificates (MEPS) and Labelling
The MEPS and labelling program is a long-standing and highly successful regulatory program that requires, depending upon the product, increasing energy efficiency and/or efficiency labelling, as a form of ‘mandatory disclosure’. Energy savings associated with the program have been estimated in the past in GWA (2009), and these estimates are employed in this study.25 Savings are estimated in groups of residential and non-residential appliances/equipment. Since savings estimates are only available to 2020, we extended these to 2030 assuming a 25% saturation effect, due to appliances and equipment already sold to MEPS standards being replaced, at the end of its economic life, with equipment at the same efficiency level, leading to no additional savings. As with other measures, we assume no expansion of the program or increase in the stringency of individual measures over the period to 2030 in the business-as-usual scenario.
Residential Energy Efficiency Scheme (REES)
Savings attributable to REES for residential buildings have been taken into account in the BAU. These are based on previous work undertaken by pitt&sherry (2012) which estimated total REES savings for all SA dwellings. They have been factored down to reflect the proportion of all SA dwellings in Adelaide City. The REES was extended to the commercial sector at the beginning of 2015 but because of lack of data we have not included any additional energy savings in the BAU. This is likely to be a minor effect.
24
Available from http://www.pittsh.com.au/projects/carbon-and-energy/energy-efficiency/national-energy-efficient-building-project 25
George Wilkenfeld and Associates (GWA), 2009, Prevention is Cheaper than Cure – Avoiding Carbon Emissions through Energy Efficiency, published by the MCE E3 Committee, Canberra. Note that we understand that new estimates have been prepared in 2013 but these are not yet published.

pitt&sherry ref: HB15535H002 final rep 31P Rev00/PH 30
Summary – All Stationary Energy
Figure 3.1 below shows the frozen efficiency versus BAU total stationary energy consumption (commercial, residential and industrial), which takes the above measures into account. It can be seen that by 2050 under the BAU scenario, energy consumption would be expected to be around 1,400,000 GJ lower than it would have been under frozen efficiency.
Figure 3.1 – Frozen efficiency versus BAU (all stationary energy) Source: pitt&sherry
Figure 3.2 below shows the frozen efficiency versus BAU greenhouse gas emissions from stationary energy (commercial, residential and industrial).
Figure 3.2 – Frozen efficiency versus BAU (greenhouse gas emissions) Source: pitt&sherry
-
1,000,000
2,000,000
3,000,000
4,000,000
5,000,000
6,000,000
7,000,000
Tota
l En
erg
y (G
J)
Frozen efficiency
BAU
-
50,000
100,000
150,000
200,000
250,000
300,000
350,000
400,000
450,000
500,000
CO
2-e
(to
nn
es)
Frozen efficiency
BAU

pitt&sherry ref: HB15535H002 final rep 31P Rev00/PH 31
3.5 Transport Emissions
3.5.1 Overview
The BAU projections of transport sector emissions have been developed using detailed transport data obtained from the Adelaide City Council (ACC) and Department of Planning, Transport and Infrastructure (DPTI).26 We adopt known or expected future trends in vehicle technology, economic growth, demography and improvements in fuel efficiency that are expected to occur without any new policy interventions. We adopt BITRE’s projections for the long-term trends in fuel intensity and anticipated fuel switch (petrol to diesel), calibrated to the ACC area. The underlying assumption is that trends in Adelaide will follow national ones. Economic growth going forward is assumed to continue at the average rate of the last 10 years.27 Demographic projections adopted in the model are consistent with the ACC’s forecast of population based on ID forecast data28. Uptake in electric vehicles has been modelled using AEMO’s 2015 projections29. The table below shows the vehicle kilometers travelled for different transport modes. Table 3.2: Business as Usual Assumptions for Vehicle Kilometres Travelled
Business As
Usual – vkm
per year
2012/13 2018/19 2024/25 2030/31 2036/37 2042/43 2049/50
Cars and LCV's 1,183,935,210 1,259,486,586 1,339,419,816 1,413,394,619 1,475,542,224 1,522,853,099 1,558,492,110
Motorcycles 24,299,222 25,458,152 25,818,806 25,977,932 26,018,808 25,917,056 25,640,994
Trucks (all
types) 34,114 37,208 40,615 43,966 47,152 50,136 53,398
Buses 18,387,482 20,030,603 21,835,803 23,611,089 25,296,894 26,874,771 28,596,557
Trains 3,034,538 3,308,793 3,606,611 3,899,483 4,177,523 4,437,766 4,721,741
Trams 2,543,068 2,810,486 3,063,773 3,312,863 3,549,397 3,770,788 4,012,371
Source: pitt&sherry
As can be seen from the Figure 3.3 below, total transport-related emissions in the BAU scenario have fallen since 2007 primarily due to mode switching from private vehicles to public transport. For example, Adelaide City Council notes that ridership of buses increased by nearly 30% between 2001 and 2015. There is also evidence of increased walking and cycling and mode switching to all forms of public transport. However, growth in the residential population, workers and visitors tends to drive emissions higher, until around FY2040, when emissions peak. Emissions begin to decline post FY2041 mainly as a result of improved fuel efficiency due to global technological progress, fuel switching to diesel and growing uptake of electric vehicles.
26
For a detailed description of the data, see Foundation Report. 27
Economic growth data provided by ACC. 28
Source: id forecast data http://forecast.id.com.au/adelaide/home 29
Source: http://www.aemo.com.au/News-and-Events/News/News/2015-Emerging-Technologies-Information-Paper

pitt&sherry ref: HB15535H002 final rep 31P Rev00/PH 32
Figure 3.3: Frozen Efficiency vs BAU Projections for the Transport Sector Source: pitt&sherry
Figure 3.4: Business as Usual Projections for the Transport Sector (FY07 to FY50) Source: pitt&sherry
3.5.2 Passenger, Light Commercial Vehicles and Trucks
Private passenger and light commercial vehicles are by far the largest contributors to total transport emissions, contributing 89% of total emissions in 2050 in the BAU scenario (see Figure 3.4 above). The combined impact of improvements in fuel efficiency, uptake of EVs and fuel switching result in a reduction in passenger motor vehicle related emissions, from around 2040 onwards, despite continued growth in the transport task (population, trips) – see Figure 3.5 below.
0
100,000
200,000
300,000
400,000
500,000
600,000
ton
ne
s C
O2
-e
Total emissions - BAU Total emissions - Frozen efficiency
0
50,000
100,000
150,000
200,000
250,000
300,000
350,000
400,000
450,000
2006/07 2011/12 2016/17 2021/22 2026/27 2031/32 2036/37 2041/42 2046/47
ton
ne
s C
O2
-e
Total emission public transport - BAU Total emissions passenger vehicles, motorcycles and LCVs - BAU

pitt&sherry ref: HB15535H002 final rep 31P Rev00/PH 33
Figure 3.5: BAU vs Frozen Efficiency Projections from passenger, light commercial vehicles and trucks Source: pitt&sherry
Figure 3.6 below shows the same information but with a different scale, to accentuate the underlying trend. Note that emissions from trucks are too small, as a share of the total, to be visible in these figures.
Figure 3.6: BAU projections from passenger, light commercial vehicles and trucks Source: pitt&sherry
Note that the proportion of all types of trucks in the total ACC vehicle fleet is currently based on the ACC’s inventory values for FY2013 and projected forward using the GDP per capita growth. These estimates appear to be low, particularly when compared to national values. As such, there is currently a risk of understating the significance of any potential carbon abatement from freight and these estimates should be further revisited.
3.5.3 Public Transport
Estimates of public transport emissions contained in this Report have been updated to reflect refined public transport data obtained from the Department of Planning, Transport and Infrastructure. Buses remain the largest contributors to the total public transport emissions with their share of 54% followed by the trains (39%) and trams (7%), as shown in Figure 3.7 below.
0
100,000
200,000
300,000
400,000
500,000
20
12
/13
2
01
3/1
4
20
14
/15
2
01
5/1
6
20
16
/17
2
01
7/1
8
20
18
/19
2
01
9/2
0
20
20
/21
2
02
1/2
2
20
22
/23
2
02
3/2
4
20
24
/25
2
02
5/2
6
20
26
/27
2
02
7/2
8
20
28
/29
2
02
9/3
0
20
30
/31
2
03
1/3
2
20
32
/33
2
03
3/3
4
20
34
/35
2
03
5/3
6
20
36
/37
2
03
7/3
8
20
38
/39
2
03
9/4
0
20
40
/41
2
04
1/4
2
20
42
/43
2
04
3/4
4
20
44
/45
2
04
5/4
6
20
46
/47
2
04
7/4
8
20
48
/49
2
04
9/5
0
ton
ne
CO
2-e
Total car emissions Total motorcycles emissions
Total trucks emissions Total emissions - Frozen efficiency
280,000
290,000
300,000
310,000
320,000
330,000
20
12
/13
20
13
/14
20
14
/15
20
15
/16
20
16
/17
20
17
/18
20
18
/19
20
19
/20
20
20
/21
20
21
/22
20
22
/23
20
23
/24
20
24
/25
20
25
/26
20
26
/27
20
27
/28
20
28
/29
20
29
/30
20
30
/31
20
31
/32
20
32
/33
20
33
/34
20
34
/35
20
35
/36
20
36
/37
20
37
/38
20
38
/39
20
39
/40
20
40
/41
20
41
/42
20
42
/43
20
43
/44
20
44
/45
20
45
/46
20
46
/47
20
47
/48
20
48
/49
20
49
/50
ton
ne
s C
O2
-e
Total car emissions Total motorcycles emissions Total trucks emissions

pitt&sherry ref: HB15535H002 final rep 31P Rev00/PH 34
Figure 3.7: Public Transport Emissions in FY20 Source: pitt&sherry
Despite overall declining trend in GHG emissions in the transport sector, public transport emissions are projected to grow (see Figure 3.8 below). This results from the underlying growth in the population and transport task, combined with the fact that fuel efficiency gains in the bus fleet in particular are projected to be less than in the passenger motor vehicle fleet. Also, ‘dieselisation’ of the bus fleet is not possible, as diesel already dominates.
Figure 3.8: Business As Usual Projections for Emissions from Public Transport Sector Source: pitt&sherry
3.6 Waste Emissions
3.6.1 Overview
The model for projecting emissions from the waste sector begins with the ‘frozen efficiency’ approach (as used for all sectors). Waste related data and estimates provided by the Adelaide City Council (ACC) and
54%
39%
7% 0% Total bus emissions - BAU
Total trains emissions - BAU
Total trams emissions - BAU
Total maritime emissions - BAU
0
5,000
10,000
15,000
20,000
25,000
30,000
35,000
40,000
45,000
50,000
ton
ne
s C
O2
-e
Total trams emissions - BAU Total trains emissions - BAU
Total bus emissions - BAU Total maritime emissions - BAU
Total emission public transport - Frozen Efficiency

pitt&sherry ref: HB15535H002 final rep 31P Rev00/PH 35
informed by the Waste Management Association of Australia (SA Branch) underpin the projections in the model. Waste categories considered are landfill waste (commercial and industrial, construction and demolition and municipal), green waste (ACC kerbside collection and kerbside collection organics), and wastewater and discharge. Historical data on waste generated from FY2007 to FY2013, in each category, are used in the model. The frozen efficiency projections show waste generation rising each year thereafter in response to applicable growth drivers. Drivers include higher population, more dwellings, higher visitor numbers and estimated change in Gross Regional Product. Efficiency is frozen under this scenario as waste generation per person, business, etc stays at the same level – so total generation rises in response to applicable growth factors. Each tonne of waste generated produces a certain amount of emissions – the emissions factor. The factors used to estimate emissions under the frozen efficiency and BAU scenarios were taken from the latest version of the National Greenhouse Account Factors, published in August 2015. Please note emissions projected to result from green waste for composting are much lower than those previously estimated by ACC. This difference is due to the correction of the emissions factor used for green waste diverted from landfill. This particular factor is not directly provided in the Account Factors publication. It can be derived from other factors, but this is somewhat complicated as the formula must take into account methane and nitrous dioxide which have large Global Warming Potentials (GWP). Complexities aside, the main point is that green waste, when diverted from landfill and composted, produces only small quantities of emissions. This is one of the important reasons for diverting green waste from landfill – to prevent the anaerobic process of decay which produces high methane emissions. Measures to negate wastewater and discharge emissions are ongoing. These measures are assumed to remain in place to 2050 with zero CO2e emissions from this area of waste. The trend since FY2007 and frozen efficiency projections for waste tonnages and the resultant emissions are shown in Figure 3.9 below.
Figure 3.9: ACC Waste and Emissions Projections - Frozen Efficiency
30,000
35,000
40,000
45,000
50,000
55,000
60,000
65,000
70,000
75,000
20
06
/07
20
08
/09
20
10
/11
20
12
/13
20
14
/15
20
16
/17
20
18
/19
20
20
/21
20
22
/23
20
24
/25
20
26
/27
20
28
/29
20
30
/31
20
32
/33
20
34
/35
20
36
/37
20
38
/39
20
40
/41
20
42
/43
20
44
/45
20
46
/47
20
48
/49
Ton
ne
s
Year
Total Landfill & Greenwaste tonnes Total Waste Emissions tonnes of CO2e

pitt&sherry ref: HB15535H002 final rep 31P Rev00/PH 36
Source: pitt&sherry
Emissions from landfill waste dominate the sector’s emissions. In 2016 emissions from diverted green-waste are estimated at 59 tonnes CO2e compared with land fill waste emissions of 50,330 tonnes CO2e.
3.6.2 BAU Projections
The Business as Usual projection of emissions from the waste sector is that emissions will fall from the FY2013 level in FY2014 and FY2015. Thereafter the frozen efficiency assumption is applied – so that waste to landfill intensity is locked with changes in waste generation and emissions only occurring in response to changes in activity (growth drivers). The rate that BAU emissions are estimated to fall for two years following FY2013 (the last year of strong data) is 3.8% which is the average rate of decline recorded over the period FY2007 to FY2013. This continued decline is attributed to measures in effect under South Australia’s Waste Strategies for 2005-10 and 2011-15 and complementary ACC measures. This trend is assumed to continue only to the end of FY2015 because waste policy settings are currently in the process of being reset. South Australia’s Waste Strategy for 2015 to 2020 is in the consultation phase. Similarly ACC is working on a raft of new measures (whose likely impact is estimated in the new measures section). The result is that from FY2016 onwards, the BAU tracks the frozen efficiency projection. The BAU emissions start from a slightly lower base due to the decline in BAU emissions to FY15. This is shown in Figure 3.10 below.
Figure 3.10: Waste Emissions - BAU vs Frozen Efficiency projections Source: pitt&sherry
Note that while the historical trend of declining waste emissions is assumed to cease and gently reverse under the BAU case, this does not mean all impacts of past South Australian Waste Strategies and ACC waste management measures disappear (if this were the case, efficiency of waste-to-landfill by activity would be projected to worsen). Rather, the BAU scenario does assume that the lasting impact of past
45,000
50,000
55,000
60,000
65,000
70,000
75,000
Ton
ne
s C
O2
e
Year
Waste Emissions Frozen Efficiency Waste Emissions BAU

pitt&sherry ref: HB15535H002 final rep 31P Rev00/PH 37
measures holds waste-to-landfill efficiency at the current rate. The BAU scenario demonstrates the assumption that further improvement in waste-to-landfill cannot occur without new policy effort.
3.7 Total Emissions Trends – Business as Usual
Figure 3.11 below shows the aggregated BAU emissions projection, and the contribution to that projection from the major sectors: stationary energy, transport and waste. Our projection of business-as -usual emissions attributable to the Adelaide City Council local government area shows that total greenhouse gas emissions are projected to be 11% lower in 2050 than they were in FY2013. This is composite result of a projected 28% reduction in emissions from stationary energy; a 53% increase in emissions in the waste sector (from a small base); and a 9% increase in the transport sector. The large reduction in stationary energy emissions, which occurs in the first few years, is a result of the announced closures of Northern and Torrens Island A power stations in 2017. Apart from that effect, overall emissions are projected to rise over the period, reflecting the underlying growth in population and economic activity which tend to drive emissions upwards.
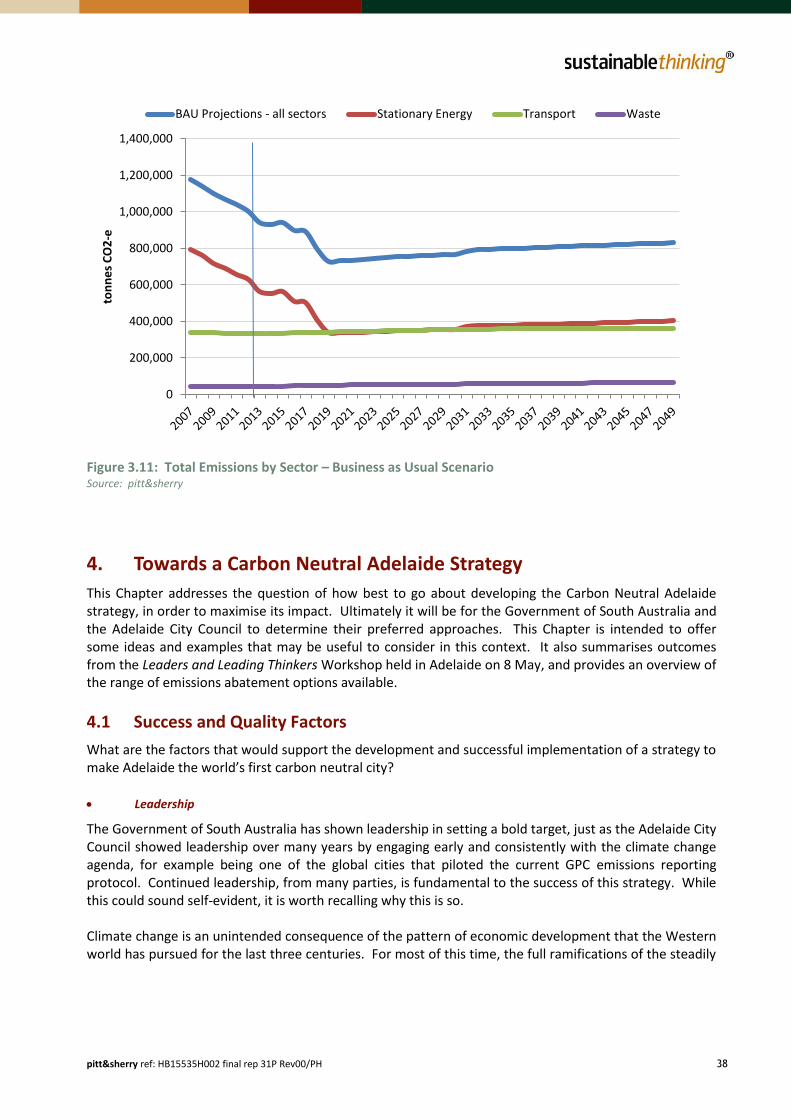
pitt&sherry ref: HB15535H002 final rep 31P Rev00/PH 38
Figure 3.11: Total Emissions by Sector – Business as Usual Scenario Source: pitt&sherry
4. Towards a Carbon Neutral Adelaide Strategy
This Chapter addresses the question of how best to go about developing the Carbon Neutral Adelaide strategy, in order to maximise its impact. Ultimately it will be for the Government of South Australia and the Adelaide City Council to determine their preferred approaches. This Chapter is intended to offer some ideas and examples that may be useful to consider in this context. It also summarises outcomes from the Leaders and Leading Thinkers Workshop held in Adelaide on 8 May, and provides an overview of the range of emissions abatement options available.
4.1 Success and Quality Factors
What are the factors that would support the development and successful implementation of a strategy to make Adelaide the world’s first carbon neutral city?
Leadership
The Government of South Australia has shown leadership in setting a bold target, just as the Adelaide City Council showed leadership over many years by engaging early and consistently with the climate change agenda, for example being one of the global cities that piloted the current GPC emissions reporting protocol. Continued leadership, from many parties, is fundamental to the success of this strategy. While this could sound self-evident, it is worth recalling why this is so. Climate change is an unintended consequence of the pattern of economic development that the Western world has pursued for the last three centuries. For most of this time, the full ramifications of the steadily
0
200,000
400,000
600,000
800,000
1,000,000
1,200,000
1,400,000
ton
ne
s C
O2
-e
BAU Projections - all sectors Stationary Energy Transport Waste

pitt&sherry ref: HB15535H002 final rep 31P Rev00/PH 39
rising concentrations of greenhouse gases in the atmosphere were not generally understood.30 However, particularly since the Intergovernmental Panel on Climate Change was created by the United Nations Environment Program and the World Meteorological Organisation in 1988, ignorance of climate change has progressively been replaced with denial and/or (legitimate) fear of its consequences. But climate change will not be solved by fear or denial. Only concerted action, taken in our collective interests, will do this. And indeed, this is what defines leadership – the willingness to act not for our narrow and immediate personal interests, but on behalf of the greater good. What does good leadership look like in this context? We suggest that the most important aspect is that a supportive, enabling environment is created in which people are encouraged to offer their creativity and full capacity for innovation is unlocked. An audacious and challenging goal, like carbon neutrality, is a very strong starting point – something which is consciously designed to stretch beyond conventional thinking. But there are additional elements. First, there is the degree of willingness of leaders to ‘hold the space’ – that is, to leave open key questions for inquiry and discussion in depth, rather than rushing to make decisions too early. The latter approach would disenfranchise those wanting to engage, while not challenging many parties not already engaged to do so. The currency of ‘consultation’ has unfortunately been devalued in recent years. Discussing decisions that have already made – even if not yet announced – is not consultation. The words ‘engagement’, ‘inquiry’ and ‘inclusiveness’ may better describe the processes required – to engage with an open mind and open ears, and inquire with genuine interest into the full range of perspective and opportunities. Also, we suggest that the Government engages very widely with as many communities, disciplines and actors (and not just ‘stakeholders’), including those who may not yet be engaged with this debate or who may be overlooked in conventional consultation processes. Youth, for example, are the most important stakeholder of all in this discussion, as the inheritors of the consequences of our actions or inactions. Second, a key role of leaders is to set and model the tone of the discussion. In particular, the Government of South Australia should be clear about the values and the character of the responses that it wishes to see reflected in the strategy. We noted above that there will be choices to be made in implementing the Carbon Neutral Adelaide strategy, sometimes difficult ones. Some measures could be rapid and low cost, but deliver little in the way of genuine, local and credible change. Other solutions may be harder, more expensive and slower to realise, but would deliver genuine, long term and credible change. For example, were the Government of South Australia simply to purchase international carbon offsets to cover the emissions of the city – without taking any abatement action – it could expect little in the way of recognition, community/business engagement, innovation investment, in South Australia, employment creation or any other of the co-benefits sought. There could even be reputational damage. In designing a strategy for carbon neutrality, the easiest path will not be the best. This is not to suggest that there is no role for offsets – this will be a necessary component of a rapid path to carbon neutrality, and it is discussed in more detail in Section 4.4 below. Nevertheless, a key and unavoidable question is ‘how credible will this measure appear – to Adelaide city residents and workers, to South Australians and in the eyes of other cities that are also targeting low or zero carbon outcomes?’ The Government should be transparent – even forthright – about the values that it wishes to embody in this strategy.
30
Although French physicist and mathematician Jean Baptiste Joseph Fourier did describe the "greenhouse effect" in a paper delivered to Paris's Académie Royale des Sciences in 1824). In it he noted that the atmosphere could work in a similar fashion to a pane of glass, in that it was more transparent to sunlight than to heat from the Earth’s surface.

pitt&sherry ref: HB15535H002 final rep 31P Rev00/PH 40
Relatedly, it will be critical for clear and strong governance of the strategy through each stage of its implementation and development. Already, strong arrangements have been put in place at the top level, including oversight by the Premier’s Climate Change Council and the Climate Change and Carbon Neutral Adelaide Cabinet Task Force. In addition, there needs to be a champion organisation and organisational unit, with a strong and clear mandate to lead the process of engagement and community engagement. Centralised control and delivery is not necessary or desirable, but co-ordination and coherence in the overall process is. Finally, a key role of leaders is to ensure there are sufficient resources to support the research and consultation, as well as implementation and monitoring phases (see below). The resources are not only those required by government agencies, but the needs of the community and parties that the Government wishes to engage with must also be considered.
Selecting the right measures
Engagement and inquiry is designed to ensure that no potential opportunities or solutions are overlooked. However, to turn a set of ideas and opportunities into a successful strategy requires additional steps. The first is to have a clear and agreed set of decision-making criteria to apply to the sorting and evaluation process. As a reference point, the City of Melbourne identified the following set of principles for prioritising potential actions and strategies to attain its goal of carbon neutrality:
Figure 4.1: City of Melbourne: Principles for Selecting and Prioritising of Actions Source: City of Melbourne: Zero Net Emissions – Update 2014, p. 11.
Such a framework does not indicate how to weight or integrate these considerations when making policy choices. In multi-criteria analysis, or full social benefit cost analysis, an attempt is made to construct objective indicators of the relative performance of measures across the full range of criteria that are

pitt&sherry ref: HB15535H002 final rep 31P Rev00/PH 41
considered relevant. The integration of these indicators into decision-making is then left to those empowered to do so. Reflecting the above discussion, we put forward for consideration a balanced set of criteria, each associated with the underlying objective or objectives, along with associated KPIs (for quantifying and monitoring progress). These may be used to inform the development of the overall strategy, the selection of measures to implement the strategy, and key performance indicators to monitor in order to assess progress through time. Ideally, the measures selected will rate well on all or at least most of these criteria (see Table 4.1 below). The final objective – visibility – may seem an unusual inclusion in a set of policy criteria. However, it is important to recognise that visibility and tangibility are key aspects of any effective climate response – and not only more conventional considerations such as cost effectiveness. Measures such as carbon pricing and offsets may be important elements of an overall greenhouse solution, but they are remote and difficult for most people to understand (particularly carbon pricing), let alone to engage with and feel ownership of. Yet humans are tactile and visual creatures – we have a genuine psychological need to know that we and our community leaders are doing something credible to address those things that we perceive as threats and that, therefore, affect our sense of wellbeing. Climate change is a key such threat. Visible and local solutions, that engage local players in their conception, design, construction and/or ownership, are a key strategy to meet that need. The reward for the effort involved will be the engagement and commitment of a wide range of communities to the overall strategy.

pitt&sherry ref: HB15535H002 final rep 31P Rev00/PH 42
Table 4.1: Carbon Neutral Adelaide: Proposed Objectives, Criteria and KPIs
Objective Decision Making Criteria Key Performance Indicators
(KPIs)
Significant impact Is the measure expected to make a significant contribution to emissions abatement (in Adelaide) by 2020?
If not, is the measure an important enabler/ facilitator of abatement action?
Expected abatement in 2020 relative to ‘business as usual’ or ‘without measure’ baseline, in t (or kt) CO2-e
Cost effectiveness/least cost Is the measure cost effective? (BCR>1)
Is it the most cost-effective of the available options?
If not, does it nevertheless contribute to a least cost strategy overall?
Expected average cost of abatement achieved in 2020 in $/t CO2-e
Economic benefit for South Australia
To what extent is the measure expected to lead to investment and job creation in South Australia?
Investment $ in South Australia
Employment creation in South Australia
% of project/measure economic value that accrues to South Australia.
Co-benefits To what extent does the measure create economic, social or environmental value other than greenhouse gas abatement?
o Co-benefits could include health, amenity, affordability/cost of living or other benefits, innovation, technology, leverage, influence
Social benefit cost ratio at least greater than 1, and the highest of the available options
Engagement To what extent will this measure/strategy engage the community, businesses and other SA organisations in action?
No. of persons/organisations directly engaged in design and delivery of the measure
Credibility Is the measure consistent with the recommended measurement protocols and best practices, including those used in other cities targeting carbon neutrality?
Will it deliver genuine and lasting change?
Positive assessment by/feedback from C40/CNCA cities
Visibility, quick wins Will the measure have high visibility (locally) and profile (nationally, internationally)?
How soon will this occur?
Qualitative assessment
Time to complete project (months/years)

pitt&sherry ref: HB15535H002 final rep 31P Rev00/PH 43
An objective that is often implicit in policy making, but which could be made explicit as a way of communicating ‘strategic intent’ to all those who will be engaged in the strategy development process, is to identify the set of policies and measures set that maximises social welfare. This set could include no interventions at all, at least in principle. If we have good information about policy costs and benefits, then it is generally possible to identify a single optimal combination of measures (including their individual micro-design and stringency) that creates the greatest net social welfare, or the greatest margin between social benefit and social cost. In reality, there will be incomplete information, and uncertainties of many kinds will mean that a more risk managed approach may include a somewhat wider diversity of measures and options, to guard against unexpected outcomes from one or more of them. Still, decisions should be informed by the best possible evidence-based analysis of the consequences of the available choices – and measures rejected, no matter how passionately advocated – if they fail an evidence based review process. This should include social benefit cost analysis of all major measures, and comparative analysis of the expected outcomes of a full range of measures. Also, there is no need to ‘re-invent the wheel’. Many successful policy measures and interventions have been demonstrated across Australia and, even more so, in other nations where active greenhouse gas abatement strategies have been in place for decades. Of course, measures cannot simply be transplanted across jurisdictional boundaries with understanding the context that made them successful in the first instance, and whether and how it might be possible to adapt them to local conditions in South Australia and Adelaide. A second round of consultation, different from that described above, is required around the ‘micro-design’ of individual measures. At this point, the overall strategy fit and relevance of the measure’s objective is clear, but it still remains to hit the target. This is where stakeholder consultation is most relevant – engaging with those most directly involving in or impacted by the delivery of the measure, with aim of optimising its effectiveness and minimising any unintended and unwelcome consequences. Moving towards delivery, a useful approach may be to divide the overall response into ‘sector strategies’ (as for example the City of Sydney is doing). This approach recognises not only the diversity of players and measures involved, but also the existing structures that can be employed efficiently for this purpose. Existing agencies possess expertise and networks that can be harnessed to enable a more efficient but also more effective engagement and ultimate delivery process.
Transparency and accountability
Once the community is engaged in the development and implementation of the Carbon Neutral Adelaide strategy, a key element of keeping faith with the various communities is transparency. When decisions are made – and especially where they differ (including for good reasons) from the communities wishes – it is important to explain the basis upon which decisions were made (noting, as above, that the criteria should also be made transparent to the community in advance). Regular monitoring and reporting on progress with measures – including where there are blockages or delays – will be important to maintain engagement and commitment through time, and to forestall the development of cynical responses. Silence and non-engagement is the most fertile soil for cynicism. Arguably a key error of the Rudd national government, at the time it was developing in good faith an ambitious climate change policy program, was its failure to publically and persuasively counter the extensive but generally poorly-founded criticism of the strategy or individual measures, notably carbon pricing. The failure to defend the policies or their objectives enabled the interpretation that they were not in fact dearly or passionately held, and that perhaps the critics were correct. There will be some community cynicism regarding the Carbon Neutral Adelaide. The best antidote for this will be for leaders to carefully and respectfully correct any factual or logical errors implicit in these criticisms, but also to allow their passion for the objectives of the

pitt&sherry ref: HB15535H002 final rep 31P Rev00/PH 44
strategy to be clearly seen. Passion – that does not tip over into stridency – is highly motivating and will lead to greater engagement in the strategy from a wider range of communities.
Strengthening the capacity to deliver
A final quality criterion to consider is capacity to deliver. Carbon neutrality – indeed, the need to respond, quickly and effectively, to anthropogenic climate change – is a new challenge, not one that has faced before. There is a need to transition from technologies and structures that have in other ways served us well. There is a need to embrace change. All of this is challenging and we should not assume that all of the ideas and capabilities that we will need are readily available. Innovation demands a tolerance for experimentation and for failure; a willingness to suspend judgement and encourage controlled risk-taking. We noted above the need for community education about climate change, carbon neutrality and the pathways for its achievement. There may also be a need to invest in the development of new knowledge and skills in many sectors. These enabling investments will not have an immediate payback, but should be seen as lubrication for an efficiently working machine. Without it, failure is likely. Practically this could include resources for community based education programs; support for industry associations to deliver training programs in required new skill areas; focussed development programs inside government agencies and businesses alike; and support for data collection, research and analysis. The latter – data and analysis – is essential to craft and deliver an evidence-based and least-cost strategy. While much of the required data exists, often the diversity of ownership of this data, and concerns regarding privacy and/or confidentiality, prevent its access and use to inform policy development and delivery. Some knowledge gaps have already been identified in this Report, and more will come to light as the strategy moves forward. Anticipating this, the Government should create an expectation that voluntary and controlled data sharing is a quality criterion for the strategy, and encourage data owners to find ways to pool their knowledge and insights in a collaborative spirit, without of course compromising genuine privacy or confidentiality requirements.
4.2 Strategy Workshop Outcomes
On 8 May 2015, a high level ‘leaders and leading thinkers’ workshop was held at the Adelaide Town Hall, bringing together over 50 key people including the Hon Ian Hunter MLC, Minister for Climate Change; the Right Honourable The Lord Mayor of Adelaide, Martin Haese; heads of government departments; senior ACC officials and others. The purpose of this event was to identify the ideas and levers that offer the prospect of rapid and deep change. Figure 4.2 below give an impression of the creative energy that went into this process, and also the key outcomes. Table 4.2 then summarises the key ideas that emerged from this event. The measures are presented in declining order of the subjective rating scores they are were assigned by the Workshop participants. The overall scores are the product of two ratings (1 – 5): the first reflecting the potential impact of the measure in reducing emissions, and the second reflecting the expected economic benefit for South Australia. Note that there is overlap between some of these measures, and they are not intended to be fully worked proposals – rather indications of where there may be significant opportunities.

pitt&sherry ref: HB15535H002 final rep 31P Rev00/PH 45
Figure 4.2: Workshop – Strategy as Work-in-Progress Source: Waterfield Pty Ltd
Table 4.2: Workshop Outcomes – What are the Biggest Levers for Change?
Measure Score Description
100% renewable electricity
15 Ensure – by contractual means – that 100% of the electricity consumed in the city is sourced from renewable energy sources.
Zero carbon travel
12 Pursue a range of strategies to reduce carbon emissions from the travel task inside the city boundary to zero. These could include walking, cycling, trains/trams/electric vehicles using 100% renewable electricity, electric or hydrogen buses, etc, and associated infrastructure investments.
Iconic offsets 10 The ‘iconic’ tag refers to a major project or projects in South Australia – candidates could include very large scale ecological restoration and tree planting (inside or outside the city); and potentially other abatement actions outside the city boundary, provided those actions can be certified as offsets under the National Carbon Accounting Standard.
Better use of buildings and assets
9 A range of measures to improve the energy (and other resources including water, materials) efficiency and/or productivity of buildings, transport tasks, street lighting and other infrastructure.
Low carbon access
8 A set of measures to incentivise appropriate behaviours and choices in all areas, preferencing low/zero carbon choices over high carbon choices. Examples might include changes to the structure of ratings, charges, land tax, government services (and fees), licences, permits, etc; but also green infrastructure investments or measures to improve access to low carbon opportunities.
Efficient planning and design
6 Planning and infrastructure measures to create ‘green’ infrastructure, evolve a low carbon urban footprint, transport infrastructure, urban mobility, etc.
Electricity independence
6 Progressive moves towards electricity independence, including renewable electricity generation (inside the city) and local storage solutions.
These opportunities are discussed further in Chapter 5 below.
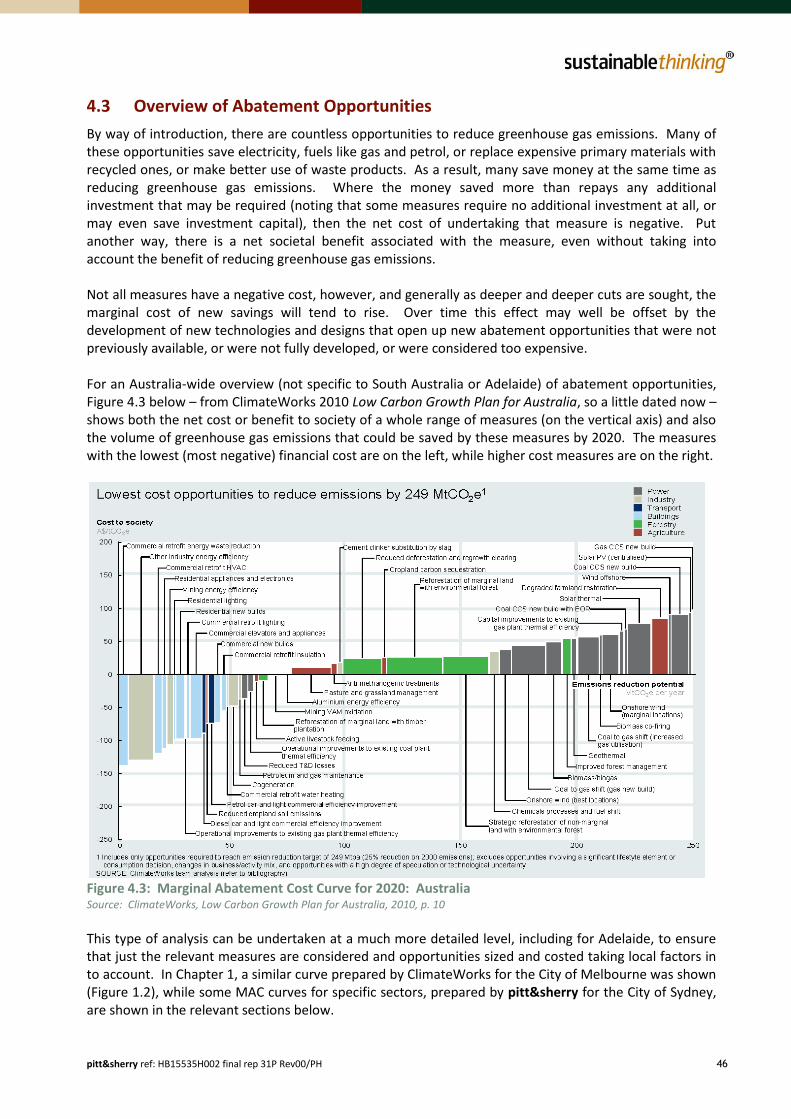
pitt&sherry ref: HB15535H002 final rep 31P Rev00/PH 46
4.3 Overview of Abatement Opportunities
By way of introduction, there are countless opportunities to reduce greenhouse gas emissions. Many of these opportunities save electricity, fuels like gas and petrol, or replace expensive primary materials with recycled ones, or make better use of waste products. As a result, many save money at the same time as reducing greenhouse gas emissions. Where the money saved more than repays any additional investment that may be required (noting that some measures require no additional investment at all, or may even save investment capital), then the net cost of undertaking that measure is negative. Put another way, there is a net societal benefit associated with the measure, even without taking into account the benefit of reducing greenhouse gas emissions. Not all measures have a negative cost, however, and generally as deeper and deeper cuts are sought, the marginal cost of new savings will tend to rise. Over time this effect may well be offset by the development of new technologies and designs that open up new abatement opportunities that were not previously available, or were not fully developed, or were considered too expensive. For an Australia-wide overview (not specific to South Australia or Adelaide) of abatement opportunities, Figure 4.3 below – from ClimateWorks 2010 Low Carbon Growth Plan for Australia, so a little dated now – shows both the net cost or benefit to society of a whole range of measures (on the vertical axis) and also the volume of greenhouse gas emissions that could be saved by these measures by 2020. The measures with the lowest (most negative) financial cost are on the left, while higher cost measures are on the right.
Figure 4.3: Marginal Abatement Cost Curve for 2020: Australia Source: ClimateWorks, Low Carbon Growth Plan for Australia, 2010, p. 10
This type of analysis can be undertaken at a much more detailed level, including for Adelaide, to ensure that just the relevant measures are considered and opportunities sized and costed taking local factors in to account. In Chapter 1, a similar curve prepared by ClimateWorks for the City of Melbourne was shown (Figure 1.2), while some MAC curves for specific sectors, prepared by pitt&sherry for the City of Sydney, are shown in the relevant sections below.

pitt&sherry ref: HB15535H002 final rep 31P Rev00/PH 47
5. Carbon Neutral Pathways
This Chapter section describes some of the major opportunities and measures that are most likely to be prospective in the context of reaching carbon neutrality for Adelaide: it does not try to present an exhaustive compilation or detailed analysis of all possible options. It draws on the Leaders and Leading Thinkers Workshop output noted above, but also on our own research undertaken for Adelaide and other cities and states, and also on external literature – sources are referenced where used. We note that energy, transport and waste sectors all have very different investment time horizons, costs, barriers and opportunities associated with their decarbonisation, which may affect the timing and prioritisation of different abatement measures.
5.1 100% Renewable Electricity
Opportunities
Renewable electricity is fundamental to any strategy that aims at deep cuts to greenhouse gas emissions, including carbon neutrality. If Adelaide were able to ensure that 100% of its electricity requirements – or at least close to this figure – were being met from renewable energy sources, then there would be widespread and systemic benefits. Not only would the direct emissions associated with electricity consumption fall dramatically, but it would be a critical enabler of emissions reductions in other sectors – such as transport, industry and waste. In the transport sector, certainty that electricity supply was 100% renewable would enable electric vehicles – including bicycles, scooters, cars and potentially heavier road vehicles, but also trams – to provide transport services without greenhouse gas emissions31. In all sectors, 100% renewable electricity would facilitate fuel switching from fossil fuels, thereby avoiding the emissions associated with fossil fuel use. Currently some 11% of emissions associated with the stationary energy sector are from direct combustion of fossil fuels within the city boundary. The International Energy Agency has recently warned that:
When considering what package of short-term measures to deploy, countries should also keep in mind consistency with longer-term decarbonisation. For example, switching to natural gas power generation can reduce emissions from coal, but by 2030 power generation must be moving beyond natural gas to a greater share of zero-carbon options.32
Switching to 100% renewable electricity would be the largest impact measure that could be undertaken reasonably quickly, to put Adelaide on a rapid path to carbon neutrality. As noted in Chapter 2, in FY2013 electricity consumption inside the city boundary was responsible for 49% of greenhouse gas emissions attributable to Adelaide, excluding Scope 3 emissions due to transmission and distribution losses33. Also, electricity represents around 88%34 of all greenhouse gas emissions associated with the stationary energy sector (residential, commercial and industrial). These could be reduced to zero, at modest cost and with significant economic and other benefits for Adelaide and South Australia. These are discussed further below.
31
Noting, as discussed in Section 2.2, that the choice of Scope 2 emissions methodology will affect the quantity of emissions abatement reported. 32
International Energy Agency, The Way Forward: five key actions to achieve a low-carbon energy sector, 2014, p. 3 (emphasis added). 33
See Figure 2.6 in Section 2.3.1 for a breakdown of emissions that includes transmission and distribution losses (electricity network losses). 34
This is a 2013 figure.

pitt&sherry ref: HB15535H002 final rep 31P Rev00/PH 48
Inside the city
Some of the available renewable energy technologies and solar PV in particular, are suitable for use inside the city boundary. By displacing the (Scope 2) emissions associated with electricity that would otherwise have needed to have been purchased from outside the boundary (and their associated electrical losses), such ‘in boundary’ renewable electricity production directly reduces greenhouse gas emissions attributable to the city. As noted in Chapter 2, there was around 2.6 GWh of electricity being produced from PV inside the city boundary in January 2014, but this represents much less than 1% of the electricity consumed in the FY2014. To determine the maximum feasible extent to which renewable electricity could be produced inside the city boundary, a solar access mapping exercise is recommended. Such an exercise calculates the maximum potential installed capacity of solar PV in particular, based on the area of suitably oriented roof-spaces, over-shading considerations and planning overlays (such as heritage considerations). To maximise the potential for producing solar electricity inside the city boundary, the ACC could consider solar access planning provisions, to ensure that access to light (for solar PV and other purposes) is not unwittingly lost due to overshadowing of existing buildings by new ones, and generally to optimise the productiveness of solar facades in the city. As discussed further below, there may well be opportunities to secure renewable electricity at lower cost than from PV within the city boundary. However, PV within the city boundary would potentially tick other boxes, including visible and tangible demonstrations of commitment and quick wins.
Outside the city
A larger opportunity for Adelaide would be to contract with one or more large-scale and cost-efficient renewable energy supplier - from any source including wind, solar or others - which could be located in South Australia or elsewhere (but which would tick the investment and employment boxes for South Australia more strongly if it were located inside the State). The ACT Government has recently followed such a path (as advised by pitt&sherry), procuring three significant supply contracts, including the largest one with a wind producer in South Australia (the Hornsdale windfarm near Port Augusta). The mechanism used to achieve this is described below. South Australia has vast regions of the State that are ideally suited to the production of renewable electricity at least cost. The renewable energy industry is already a large employer in South Australia, and there is an active research program in this area supported by the University of Adelaide and others. In principle it would be possible to contract for the supply of renewable electricity to cover the whole electrical load of Adelaide. As noted in Chapter 2, provided a ‘market-based’ approach to greenhouse accounting is adopted, this would enable greenhouse emissions associated with this electricity consumption to fall to zero. That said, there would be challenges in structuring such a contract that will need careful consideration, as discussed further below.
Measures
Local renewables
We suggest that South Australia considers actions both to maximise the take-up of renewable energy within the city, and also considers contracting for the balance of its electrical demand to be met by renewable energy. As noted, there would be considerable demonstration and engagement value in measures that led to a greater take-up of renewable (probably mostly solar, but which could also be wind or biomass) in Adelaide. The community energy model, whereby communities are enabled to co-invest in facilities (which might be located on a local school, community centre or other facility) has been shown

pitt&sherry ref: HB15535H002 final rep 31P Rev00/PH 49
elsewhere to help strengthen local communities, in addition to providing more tangible benefits, such as reduced power bills. Enabling measures should be fit-for-purpose and address genuine barriers. At the community scale, and potential for households and smaller businesses, access to finance on attractive terms may be a key issue. The Government of South Australia could work with local financial institutions, the Clean Energy Finance Corporation or others to create an appropriate financing mechanism. There also may be an opportunity to link such a mechanism to the Building Upgrade Finance mechanism now being developed by the Government of South Australia. A second potential measure may be to simplify connection arrangements for embedded renewable energy generation. The Government could work with SA Power Networks and others as needed to ensure that the connection process is as easy to understand and as accessible as possible, to ensure that this does not act as a barrier to ‘greening’ the city. In this context, we note that SA Power Networks has recently announced that it will apply higher network charges to households that have solar systems when compared to those who don’t.35 We view such steps as retrograde, potentially discriminatory and not reflective of underlying costs and benefits. We encourage the Government of South Australia to work with a range of industries to ensure that, to the greatest extent possible, pricing and regulatory signals align with the overall strategy of transitioning to a low and eventually zero carbon economy. Third, the ACC and/or others may need to consider whether there are any planning barriers that could potentially be addressed, to ensure that these do not unnecessarily restrict the take-up of renewable energy. At the same time, there may be a need to engage the community in a conversation about any limitations to take-up, or qualitative factors associated with renewable energy installations, that are deemed essential for widespread community acceptance. We note that ‘solar facades’, or building-integrated solar – where the solar generation surfaces are integrated into the structure of facades rather than being ‘bolted on’ – offer the prospect of greater urban renewable energy generation in future, albeit that this is not currently the least cost option.36 Fourth, the ACC or others could conduct a solar mapping exercise to identify suitable solar facades in the city, both to draw these to the attention of building owners, communities and renewable energy developers, but also to identify potential planning issues, such as risks of overshadowing. Some cities such as Sydney already have solar access provisions in their planning schemes, and Melbourne is understood to be investigating solar access provisions as well.
Utility scale renewables
A key mechanism to deliver rapid and genuine progress towards the carbon neutral Adelaide goal would be to contract for the supply of renewable energy to cover the expected electrical load of the city (net of current and expected future embedded renewable energy generation within the city limits). A mechanism similar to that successfully used by the Australian Capital Territory is likely to provide the most prospective pathway. The ACT has set a target of 90% renewable electricity supply by 202037, as part of its wider goal of achieving a 40% reduction of greenhouse gas emissions over 1990 levels by 2020 (en route to carbon neutrality by 2060). These targets informed the ACT’s Climate Change Action Plan 2, which was underpinned by pitt&sherry research and advice. In particular, the ACT created a ‘Renewable Energy
35
http://www.businessspectator.com.au/article/2015/5/27/energy-markets/sa-power-networks-inconsistent-penalty-solar?utm_source=exact&utm_medium=email&utm_content=1378424&utm_campaign=cs_daily&modapt= 36
http://apvi.org.au/sites/default/files/documents/Solar2011/Building%20integrated%20PV%20-%20Snow.pdf 37
http://www.environment.act.gov.au/energy/90_percent_renewable

pitt&sherry ref: HB15535H002 final rep 31P Rev00/PH 50
Local Investment Framework’ that aims to position Canberra as ‘...an internationally recognised centre for renewable energy innovation and investment’.38 The Framework, which is underpinned by the Electricity Feed-in (Large-scale Renewable Energy Generation) Act 2011, uses a feed-in tariff mechanism and competitive, reverse auction process to achieve its goals, which include co-benefits such as local employment and knowledge creation. A related Renewable Energy Industry Development Strategy supports the latter objectives and, to date, 25 organisations have signed on as inaugural partners to the Strategy.39 The key mechanism underpinning the recent 200MW renewable energy procurement (with at least another 250 MW planned by 2020) is a contract for differences (see Figure 5.1 below). This is a conventional energy market contract between a renewable energy generator and another party, normally an electricity retailer. The contract ‘hedges’ risks for both parties by agreeing a ‘strike price’ (determined by way of reverse auction). Once the strike price is set, the generator first invests in and builds new renewable energy capacity (this is critical to ensure that the arrangement is genuinely ‘additional’ abatement and not simply a rearranging of existing market arrangements). The generator then produces and sells the electricity at the prevailing wholesale market price every 30 minutes. Where the market price is lower than the strike price, the counterparty (eg, retailer) compensates the generator for the price gap; and when the market price is above the strike price, the generator compensates the retailer for the price gap. This ensures that both parties only pay/are paid the strike price, regardless of the large variability in the underlying wholesale market price. Additional and similar hedge contracts can be structured to cover periods when the renewable energy generator may not be able to generate. Also, the ACT is progressively building a portfolio of hedge contracts with generators in a range of locations and using a range of generation types, to spread risks.
Figure 5.1: An Indicative Contract-for-Difference Mechanism Source: Dylan McConnell and Annie Kallies, Climate Spectator, 22 May 2015
The ACT’s large-scale feed-in tariff scheme is recognised by the Australian Energy Regulator (AER) as a ‘jurisdictional scheme’ under sub-clause 6.18.7A of the National Electricity Rules – NER. This allows ActewAGL to recover any actual net costs associated with the scheme through its annual network pricing review process, under a cost methodology determined by the AER. The NER sets out the requirements of
38
http://www.environment.act.gov.au/__data/assets/pdf_file/0003/581700/Renewable-Energy-Local-Investment-Framework-v2.pdf 39
http://www.environment.act.gov.au/__data/assets/pdf_file/0016/721501/Renewable-Energy-Industry-Development-Strategy.pdf

pitt&sherry ref: HB15535H002 final rep 31P Rev00/PH 51
a ‘jurisdictional scheme’, and the Government of South Australia would need to ensure that any arrangement for Adelaide would be eligible to be deemed a jurisdictional scheme by the AER if it wished to use a similar cost pass-through mechanism. The ACT notes that its recent reverse auction process secured 200 MW of renewable energy supply for the ACT at what is understood to be an Australian record low price of $89/MWh (8.9 cents per kilowatt hour). It expects the net cost per household in the ACT of this arrangement to be $1.79 per week, or $93/year.40 A challenge for South Australia/Adelaide would be to determine the appropriate counter-party to enter into such an arrangement. It will also be necessary to determine the number and size of such arrangements in order to achieve the zero carbon electricity supply for Adelaide. This will require careful projections of ‘business as usual’ electrical demand, together with the expected impact on any new energy efficiency or local renewable energy supply measures. pitt&sherry’s emissions projection model for Adelaide developed for this project could be used as the basis of this analysis, but it would require additional development to achieve the necessary standard of accuracy.
Potential impacts and estimated costs
In principle, this measure could reduce greenhouse gas emissions attributable to Adelaide by almost half, noting that electricity consumption (excluding Scope 3 emissions) currently accounts for some 49% of greenhouse gas emissions associated with the city. The timeframe to implement this measure would be between 2 and 3 years, including 6 months to a year for design and legislative development, and between 1 – 2 years for construction of new renewable energy capacity. This is well within the ‘before 2020’ timeline discussed earlier. In terms of expected costs, it would be reasonable to assume that prices in the same order of magnitude as recently realised by the ACT could be secured in this case, or possibly better. Clearly this would have to be market tested. However, we note that the recent uncertainty surrounding the national Renewable Energy Target scheme, and now the significant reduction in the large-scale generation component of that scheme, means that there is a long ‘pipeline’ of renewable energy projects – including in South Australia – just waiting for suitable contractual arrangements to begin construction.
5.2 An Energy Efficient Built Environment
The vast majority of emissions associated with the stationary energy sector (representing 51% of Adelaide’s total emissions in FY2013) are ultimately determined by activities within the built environment – houses, offices, shopping centres, and other commercial and light industrial buildings within the city boundary. These emissions are driven, in a technical sense, by three factors: the fuel mix (discussed above); activity levels (how many square meters of buildings, how many people, how much economic activity); and the efficiency or productivity of energy use in these buildings (energy use per square meter or per unit of output, such as ‘value added’ for commercial buildings).
Opportunities
Around the world, energy efficiency is recognised as the single largest opportunity to reduce greenhouse gas emissions cost effectively. Improvements in energy efficiency show the greatest potential of any single strategy to abate global GHG emissions from the energy sector, and also represent the least cost opportunities. In the International Energy Agency’s World Energy Outlook 450 ppm Scenario, almost half of the estimated global abatement potential for 2050 (from actions that can be taken before 2020) is
40
http://www.environment.act.gov.au/__data/assets/pdf_file/0009/688275/150048-Renewable-energy-brochure-ACC.pdf

pitt&sherry ref: HB15535H002 final rep 31P Rev00/PH 52
energy efficiency measures. The IEA notes that these efficiency measures would have a net zero cost to GDP – that is, all incremental investment costs would be fully offset by energy savings.41
Figure 5.2: International Energy Agency’s ‘Four Key Actions’ pitt&sherry has made similar findings in a range of studies. In our Energy Efficiency Master Plan – Foundation Report for the City of Sydney, for example, we noted that emissions savings of at least 43% (based on energy savings of around 32%) could be realised by 2030 through energy efficiency improvements to the city’s buildings, while realising a net economic gain of over $500 million in present value terms. These results were realised despite an expected 29% growth in Sydney’s floor area by 2030. Higher savings (of up to 70%) could be achieved if the full technical potential were captured – although at very high levels of abatement, eventually net abatement costs would turn positive. For the savings levels reported above, the average cost of abatement of all measures considered for Sydney was -$35/tonne for commercial buildings and -$69/tonne for residential buildings.42 Similarly, in work undertaken for the Australian Government, we found that it would be cost effective for new commercial buildings to save between 58% and 68% of the energy currently allowed under the National Construction Code’s energy performance requirements by 2020.43 To this point, we do not have a fully detailed characterisation of the energy efficiency of Adelaide’s built environment, although we have calculated average energy intensities for each major building type that balance with known total energy consumption by sector. There is reason to believe that the office stock in Adelaide is likely to be reasonably energy efficient, as the Government of South Australia has for many years had a policy of requiring new government office leases to attain five stars under the National Australian Built Environment Ratings Scheme, or NABERS. Our initial assessment, however, is that average energy intensities across the building stock appear to be similar to those in Sydney. Therefore we would expect that energy savings of a similar order of magnitude could be identified. Further, as
41
International Energy Agency, The Way Forward: five key actions to achieve a low-carbon energy sector, 2014, p.3. 42
http://www.google.com.au/url?sa=t&rct=j&q=&esrc=s&frm=1&source=web&cd=1&ved=0CB0QFjAA&url=http%3A%2F%2Fsydneyyoursay.com.au%2Fenergy-efficiency-master-plan%2Fdocuments%2F19823%2Fdownload&ei=V01hVdXILcbc8AWSzYCACw&usg=AFQjCNHnRNS7OdUYPBvM5r2Tv-h84zwoNw&sig2=y6f5q-pLjnCyAquet15PSw&bvm=bv.93990622,d.dGc 43
http://www.industry.gov.au/Energy/Energy-information/Documents/pathwayto2020newbuildingenergyefficiencystandards.pdf

pitt&sherry ref: HB15535H002 final rep 31P Rev00/PH 53
Adelaide’s climate is more severe than Sydney’s, there may be greater savings available. Also, the value of those savings may be higher than in Sydney, due to somewhat higher electricity prices.
Residential buildings
Adelaide like other cities is currently witnessing a rapid growth in Class 2 or apartment style residential buildings. In a range of other studies, pitt&sherry has noted that these are generally significantly more energy intensive than Class 1 dwellings. There is also very considerable concern being expressed in Melbourne and Sydney regarding the overall quality and liveability of these apartment developments.44 There is therefore a risk that the combination of the Government’s targets to rapidly grow the population of Adelaide, together with the relatively poor energy performance of Class 2 buildings, could lead to an intensification of energy use and greenhouse gas emissions in the residential sector. While as noted in Chapter 2 the residential sector is much smaller than the commercial sector, in terms of energy use and emissions, still this would be a retrograde trend which would also be highly cost effective to avoid. That is, social welfare would be improved if the performance of new Class 2 buildings was lifted, quite apart from the resulting greenhouse gas emission benefits. Based on very detailed analysis conducted for the City of Sydney and elsewhere, we are confident that there are many cost effective policy measures that could be promoted and adopted in this sector. Policy measures are discussed further below, but the follow marginal abatement cost curve from our City of Sydney EEMP shows negative abatement costs for all technical opportunities considered (note this curve is for low-medium rise multi-unit dwellings; high rise have a different energy signature. Also note the abatement cost of higher efficiency new builds is also shown on this curve, with the width of the bar indicated its very large abatement potential, still at negative cost).
Figure 5.3: Marginal Abatement Cost Curve: Technical Opportunities: Low-Mid Rise Multi-Unit Dwellings: City of Sydney Source: pitt&sherry
44
http://delwp.vic.gov.au/planning/policy-and-strategy/better-apartments
-180
-160
-140
-120
-100
-80
-60
-40
-20
0
0 3 6 9 12 15 18 21 24 27 30 33 36 39 42 45 48 51
$/t
on
ne
kt CO2-e
Pools/pumps
HVAC
Fans/VSDs
Lighting
New Builds
Hot water
Low flow showerheads
Timers/sensors
Voltage reduction
BMS

pitt&sherry ref: HB15535H002 final rep 31P Rev00/PH 54
Commercial buildings
Commercial buildings are the single largest emissions generator in the City of Adelaide. As with residential buildings, there are likely to be large and very cost effective opportunities to reduce energy use and emissions, both in existing and in new commercial buildings. The marginal abatement cost curve from the City of Sydney Energy Efficiency Master Plan Foundation Report is indicative – noting that the scale of this figure is affected by the very high abatement costs associated with lift upgrades, which were found not to be cost effective as a stand-alone measure. Note that this curve also shows that higher standards for new commercial buildings have a very large and cost effective potential for abatement. Amongst the many highly prospective opportunities for efficiency upgrades would be the many carparks within the City of Adelaide. Our partner in the City of Sydney EEMP, then Exergy Australia Pty Ltd (now Energy Action Pty Ltd), noted that in certain carparks in Sydney, energy consumption has been reduced by 95% through simple measures such as installing lighting sensors (or undertaking other lighting upgrades), and CO sensors and variable speed drives on ventilation fans. Where mechanical ventilation is demand driven, and carparks have access to reasonable natural ventilation, energy consumption for ventilation can fall to virtually zero without detrimental consequences for air quality.
Figure 5.4: Marginal Abatement Cost Curve: Commercial Buildings: Technical Opportunities: City of Sydney Source: pitt&sherry
In short, we have every reason to believe that measures to reduce the energy consumption associated with Adelaide’s built environment would offer the potential for very large and highly cost effective reductions in associated greenhouse gas emissions. We do note that, when compared to a measure such as switching to renewable electricity, improving the energy efficiency of the built environment is an ongoing project. Some time will be required to design and effective new policy measures or to strengthen existing ones, although we note that the Government of South Australia is already committed to implementing a Building Upgrade Finance mechanism, and this will lift the rate of energy efficiency refurbishments in the existing building stock. Investment levels in the built environment follow cycles that are broadly linked to overall economic growth but also to more specific factors such as vacancy rates
-200
0
200
400
600
800
1000
0
30
0
60
0
90
0
12
00
15
00
18
00
21
00
24
00
27
00
30
00
33
00
36
00
39
00
42
00
45
00
48
00
51
00
54
00
57
00
$/t
on
ne
kt CO2-e
Appliance/DHW upgrades
Lighting upgrades
HVAC upgrades
New Builds
Lift upgrades

pitt&sherry ref: HB15535H002 final rep 31P Rev00/PH 55
in particular building types. Often, energy efficiency retrofits of existing buildings occur at a time when the building is being renovated more generally, in readiness for sale or lease, for example. That said, appropriately designed energy efficiency policy measures will have the effect of lifting the underlying rate of investment in the building stock, creating wider economic benefits in addition to reducing energy consumption and greenhouse gas emissions. Energy efficiency investments have a strong local content as they create demand for services from designers, architects, engineers, equipment suppliers and installers. In addition, South Australia manufactures insulation products, for example, and so a significant push to lift the energy efficiency of Adelaide’s built environment would create flow-on benefits in the manufacturing sector as well.
Energy Efficiency vs Renewables?
If we assume for the moment that the 100% renewable electricity measure is implemented, does it still make sense to address energy efficiency in the built environment? Are these measures complementary or competitors? In fact these measures are complementary and can be linked through the optimal policy concept outlined earlier. From an optimal policy perspective, the least (social) cost opportunities should be utilised first. Reducing energy consumption is generally a more cost effective strategy than fuel switching to renewables, as the yield from the efficiency investment includes valuable energy cost reductions. In many cases, there will also be significant monetised co-benefits, such as operational labour savings from long-lived lighting solutions fluorescent or (increasingly) LEDs replacing incandescent or halogen lamps. With cooling being the dominant energy load in most commercial buildings, many efficiency investments (such as improved lighting, office equipment, refrigeration, etc) also reduce internal heat loads, leading to secondary benefit in reduced HVAC power consumption. Certain efficiency investments can also improve power factor and reduce energy bills further, particularly when the customer faces ‘kVA tariffs’ that explicitly reward power factor correction. In short, energy efficiency measures typically offer the lowest cost abatement and should be prioritised over other, higher cost measures, other things being equal.
Measures
It should be noted that some of the important policy levers are not directly controlled by the Government of South Australia or Adelaide City Council, such as the low level of stringency of the mandatory minimum energy performance standards in the National Construction Code, notably for commercial buildings and apartment buildings.45 Over time, however, South Australia may be able to advocate for changes in these national policy settings. Energy performance requirements in the National Construction Code, for example, have not been lifted since 2009 (taking effect from 2010) and, on current national policy, will not have opportunity to be lifted again until 2019. This lack of attention to the fundamentals of energy efficiency policy is without precedent internationally and will work against the attempts of South Australia and others to reduce their greenhouse gas emissions. In the meantime, we suggest that other and more direct means are both required and necessary to at least limit the growth of emissions. To a greater extent that the 100% renewable electricity opportunity, realising the building energy efficiency opportunity requires a carefully targeted mix of measures. This is because the different building types have different purposes, ownership structures and financial arrangements.
45
Ibid, or see pitt&sherry and Swinburne University of Technology, National Energy Efficient Buildings Project Phase 1 Report, available from https://www.sa.gov.au/__data/assets/pdf_file/0004/135544/NEEBP-final-report-November-2014.pdf
pitt&sherry ref: HB15535H002 final rep 31P Rev00/PH 56
Efficiency vision, targets and master plan?
We suggest that an overall strategy – such as an Energy Efficiency Master Plan – be articulated as a vessel to give coherence and structure to actions in this sector. This could start with an energy efficiency target, which should be linked to an overall vision. For example, the Government of South Australia could also articulate an objective of making Adelaide Australia’s most energy efficient city – including for the built environment but also for its transport task. With more and more cities now publically reporting an emissions inventory, it would be possible to construct key performance indicators for at least major cities in Australia, for comparative purposes. We note that many C40 cities articulate a range of targets, including at the sectoral level, presumably because they feel they are more tangible than emissions targets. A vision and target or targets for energy efficiency are, in many ways, more concrete and indeed challenging than carbon neutrality. They can’t be met by offsets or contracts – they require transformative projects and investments that work directly on the thermal performance of building precincts, envelopes, the efficiency of end-use equipment or the behaviours of energy users. A range of target metrics could be defined, including energy use per square meter for different building types (and overall for the city); residential and/or commercial (and total) energy use per capita. These could be compared with other cities, and potentially normalised for climate differences, to provide a strong indication of relative performance, as well as progress through time. We suggest that no particular timeframe be put on a target such as ‘making Adelaide Australia’s most energy efficient city’, as efficiency indicators for all cities will continually evolve, and ongoing effort will be required to keep Adelaide at the top. It would be possible to undertake some specific analysis to determine whereabouts on a national ‘league table’ of energy efficiency Adelaide now sits, and the degree of difficulty and feasible timeframe for reaching the top, if required. pitt&sherry compiled the Commercial Building Baseline Study for the Australian Government, which includes energy efficiency data on a wide range of building types that could be used for benchmarking purposes46. If a master planning approach is adopted, we suggest that sectoral strategies be developed, informed by objective research but also developed bottom-up, through genuine engagement with a wide range of stakeholders. This should include but extend well beyond the major industry associations, and include known innovators in the commercial sphere, research institutions, major corporations such as banks, universities and others that may be interesting in achieving at levels well beyond mandatory minimums. Different building classes have very different ownership and management structures, hence the need for a tailored approach if real change is to be engendered. An updated Property Sector Agreement with the Property Council of Australia, or an initiative similar to the Better Buildings Partnership in Sydney, or adopting other proven and successful models from other states, such as City Switch, Smart Green Apartments, are all likely to valuable opportunities.
New buildings
A typical figure for the rate of ‘turnover’ or renewal of the building stock is quite low – perhaps 1% – 2% per year – the cumulative effective of new building energy efficiency requirements is dramatic and long lasting. We noted in compiling the City of Sydney Energy Efficiency Master Plan, for example, that modest differences in assumptions about the actual rate of application of existing energy performance requirements in the National Construction Code had the potential to halve or double the cumulative energy savings from Sydney’s building stock over the period to 2030. The faster the rate of growth/turnover (including demolition and rebuild, but also repurposing/major renovation), the more dramatic the impacts of measures that target the energy efficiency of new building work. Note that
46
http://www.industry.gov.au/ENERGY/ENERGYEFFICIENCY/NON-RESIDENTIALBUILDINGS/Pages/CommercialBuildingsBaselineStudy.aspx

pitt&sherry ref: HB15535H002 final rep 31P Rev00/PH 57
recent research (including by pitt&sherry47 but also CSIRO48) casts doubt over the rate of compliance with the building code’s energy performance requirements, and underperformance in this area will tend to undermine the realisation of the large and cost-effective savings that are available in this sector. While we urge the Government of South Australia to exercise influence in the national policy arena, with the aim of lifting minimum energy performance requirements in the Code inter alia49, this is likely to be a longer term project. Therefore it is necessary to consider measures that can be rolled out in Adelaide and/or South Australia with any assumption of Federal support. We do suggest that South Australia consults with other State and Territory Governments – notably Victoria and the ACT – to determine whether collaborative action on new building standards may be possible. This could include lifting standards for all new classes of new buildings. We note that there is ample evidence of the cost effectiveness of such a step, including in pitt&sherry’s Pathway to 2020 report cited earlier. The advantages of collaborative action with other states would be many: first, it would help to defray concerns about relative competitiveness or affordability considerations; second, it would provide ‘safety in numbers and prevent the Australian Government in particular from criticising South Australia for ‘going it alone’; and finally, it would significantly help to build momentum for lifting standards in other States and Territories, which provide a very material lift to the effectiveness of Australia’s overall greenhouse gas response. Short of this, we encourage South Australia to consider lifting its own building energy performance requirements unilaterally if necessary, based on a strong, evidence-based case (which could readily be constructed) that doing so would both improve economic welfare as well as significantly reduce greenhouse gas emissions through time. A third and more limited option would be for the Adelaide City Council to follow the lead of Melbourne, numerous smaller Victorian Councils and North Sydney (at least, with the City of Sydney actively considering this step currently) of setting above minimum energy (or sustainability) performance requirements via its planning scheme. Since 2013, the City of Melbourne has required new developments to meet a range of sustainability performance criteria, including ‘an additional star’ for residential developments and an additional 10% in the energy efficiency of non-residential developments.50 Other metrics, such as a minimum NABERS star rating, could be used for certain important building types, including offices and retail. Following a hearing (at which pitt&sherry provided expert witness services) the Victorian Civil and Administrative Tribunal (VCAT) upheld the right of Yarra, Port Phillip, Stonnington, Banyule, Whitehorse and Moreland councils to do the same.51 We have had indications from the Council Alliance for a Sustainable Built Environment (CASBE) that a further 25 Councils across Victoria are considering a similar move.52
47
pitt&sherry, National Energy Efficient Buildings Project, December 2014, available from http://www.pittsh.com.au/projects/carbon-and-energy/energy-efficiency/national-energy-efficient-building-project 48
CSIRO, The Evaluation of the 5-Star Energy Efficiency Standard for Residential Buildings, December 2013, available from http://www.industry.gov.au/Energy/Documents/Evaluation5StarEnergyEfficiencyStandardResidentialBuildings.pdf 49
Many other national energy and building efficiency policies are languishing at present, including all 44 recommendations of the 2010 Report of the Prime Minister’s Task Group on Energy Efficiency. 50
See https://www.melbourne.vic.gov.au/BuildingandPlanning/Planning/planningschemeamendments/Pages/AmendmentC187.aspx 51
See for example http://www.moreland.vic.gov.au/planning-building/planning-scheme-amendments/current-amendments/amendment-c71/ 52
Personal communication.

pitt&sherry ref: HB15535H002 final rep 31P Rev00/PH 58
Existing buildings
As important as new buildings are in the quest for higher energy efficiency and lower greenhouse gas emissions, still the large stock of existing buildings represents the largest abatement opportunity, particularly in short term. Policy measures that could be adopted to leverage action in this sector include:
Mandatory disclosure of the energy performance of at least residential, office and retail buildings/spaces;
Building tune-up program(s);
Major retrofit program (although this may be covered by the new Building Upgrade Finance facility);
Measures to improve/ensure compliance with existing energy performance requirements;
Widespread adoption of Green leases;
A renewed focus on government energy efficiency (which could include higher star rating requirements for offices, or more careful application of the existing policy, or simple but potentially very powerful measures such as disclosing the real time energy consumption data already available on many government-occupied buildings, to enable the private sector to diagnose issues and offer competitive solutions.
Indicative cost-effectiveness values can again by taken from the City of Sydney EEMP, as below, although this does not represent a complete description of all possible measures, but rather the subset that were preferred by the City of Sydney. Specific measures that may be of particular relevance to Adelaide – noting the more severe summer climate – could include heat recovery on ventilation air; advanced HVAC strategies more generally; advanced glazing and facade strategies, including retrofit shading; and improved building management strategies including widespread use of strategies such as night-time purging. Recent advances in ‘intelligent’ building management systems and diagnostic software offer the prospect of significant energy efficiency improvements even for high star rated buildings.
Figure 5.5: Marginal Abatement Cost Curve: Commercial Building Policy Measures: City of Sydney Source: pitt&sherry
Estimated impacts and cost effectiveness
Estimates of the expected cost effectiveness of a range of measures have been provided above, although Adelaide-specific analyses could be prepared.
-60
-40
-20
0
20
40
60
0
25
0
50
0
75
0
10
00
12
50
15
00
17
50
20
00
22
50
25
00
27
50
30
00
32
50
35
00
37
50
40
00
42
50
45
00
47
50
$/t
on
ne
kt CO2-e
Improved compliance
Building tune-up program
New builds
NABERS mandatory disclosure
Building retrofit program

pitt&sherry ref: HB15535H002 final rep 31P Rev00/PH 59
5.3 Emissions Free Urban Mobility
Adelaide’s transport task is its second largest source of greenhouse gas emissions, with a substantial 35% share of total emissions in FY2013 (see Chapter 2). With the population of Adelaide expected to expand over time, and with growth in economic activity (area of buildings, numbers of workers in the city, number of visitors to the city), it is almost inevitable that the transport task in Adelaide will continue to grow. It is fair to say that reducing greenhouse gas emissions associated with the transport task may be the most challenging of all the sectors. The reasons for this include:
The underlying transport task is complex and highly varied – meaning that many different options and solutions are required to meet all task needs;
Choice of transport modes is highly influenced by individual values and choices, but also needs, affordability considerations, age/demographics and, not least, by the quality and affordability of the choices available, including the supporting infrastructure – greenhouse gas emissions intensity may be one factor influencing travel choices, but is likely to be overwhelmed by the other considerations;
The underlying costs of low- or zero-carbon vehicles are still very high, when compared with conventional vehicles, and may also suffer from real or perceived technical limitations (availability/product choice, in-service reliability, range anxiety, servicing costs, end-of-life or disposal value, etc).
pitt&sherry has noted its Carbon Emissions Index product (CEDEX) that over the five years from June 2009 – June 2014, emissions associated with electricity consumption Australia-wide fell by some 33 Mt CO2-e. However, over the same period, emissions associated with petroleum fuels increased by around 10 Mt CO2-e (see Figure 5.6). These two very different trends occurred in the same economic and social context, including factors such as income levels, confidence and other factors that might otherwise be assumed to influence demand (for both electricity and transportation).
Figure 5.6: Change in Total Greenhouse Gas Emissions by Sector: Australia: 2009 - 2014
-8.0%
-7.0%
-6.0%
-5.0%
-4.0%
-3.0%
-2.0%
-1.0%
0.0%
1.0%
2.0%
3.0%
-40
-35
-30
-25
-20
-15
-10
-5
0
5
10
15
Jun 09 Jun 10 Jun 11 Jun 12 Jun 13 Jun 14 Jun 15
Mt C
O2-e
Changes in emissions since June 2009
Combined % change
(right axis)
Electricity
Petroleum
Other natural gas

pitt&sherry ref: HB15535H002 final rep 31P Rev00/PH 60
Source: CEDEX (http://www.pittsh.com.au/latest-news/cedex/)
A more nuanced picture emerges when individual fuels are taken into account. In Figure 5.7 below it can be seen that the recent growth in overall fuel use is dominated by growth in diesel – which is primarily attributable to the growth the mining sector over this period, but would also reflect some dieselisation of the passenger vehicle fleet – and secondly by growth in aviation fuels. Use of petrol, LPG and other domestic liquid fuels has declined in recent years.
Figure 5.7: Changes in Greenhouse Gas Emissions: Liquid Fuels: Australia: 2009 - 2014 Source: CEDEX (http://www.pittsh.com.au/latest-news/cedex/)
Overall, this data is consistent with the view that demand for transport services is less responsive to changes in income levels, or the prices of different fuels, or other factors that conventionally might be assumed – from a purely economic perspective – to have an impact on consumption behaviours, than is the demand for electricity. This probably reflects the fact that much of the overall transport task is perceived to be non-discretionary, at least in the short term: children have to get to school, people have to get to work and do the shopping, freight needs to reach the port, regardless of changes in the operating environment such as income levels or fuel prices. Consumer economics notes that that households (or individuals) maximise their perceived wellbeing by making consumption (or investment) choices based on their unique set of preferences and also constrained by their overall budget constraint (income). If the price of one consumption good changes then in the short term (eg, a substantial increase in fuel prices), or if their budget constraint changes (loss of employment), then they rearrange their consumption patterns to once again optimise their wellbeing, again informed by their preferences and budget. We could, however, usefully add to this model the idea of discretion. Preferences may inform consumption choices, but only where there is discretion involved. If you are locked into certain expenditure patterns – or at least, if you believe you are – such as the need
-4.0
-2.0
0.0
2.0
4.0
6.0
8.0
10.0
12.0
14.0
16.0
Jun 09 Jun 10 Jun 11 Jun 12 Jun 13 Jun 14 Jun 15
Em
issio
ns
(M
t C
O2-e
)
Changes in domestic petroleum emissions since 2009
Domestic aviation fuels
Diesel
Petrol plus auto LPG
All other domestic fuels

pitt&sherry ref: HB15535H002 final rep 31P Rev00/PH 61
to pay to drive to work every day if there are no feasible alternatives – then the entire household budget adjustment task falls on the other elements of your consumption basket. In effect, the discretionary elements of the budget do all the work of change; at least until new options present themselves (relocate the kids to a different school, change where you live and/or work, etc). In short, when considering options for the transport sector, it is critical to bear in mind the users of the transport system and the reasons behind their transport patterns. Without this, investments in alternative transport solutions could fail to meet the travellers’ requirements, attracting poor patronage and failing to lead to significant emissions abatement. Despite the challenges, it is clear that transport must be a major focus of the Carbon Neutral Adelaide strategy, given both the significant footprint of the transport sector together with the projected growth in the transport task and related greenhouse gas emissions.
Opportunities
Opportunities bifurcate into two broad choices – those that are (or could be) zero carbon, and those that might encourage lower carbon intensity in the transport task – and therefore reduce the demand for and cost of emissions offsets to reach carbon neutrality – but which do not allow actual transport emissions to fall to zero. These are considered in turn.
Zero-carbon transport
The key opportunities to move towards zero carbon mobility in Adelaide include:
Travel reduction (through better planning decisions, better understanding of travel needs and behaviours, Travel Smart programs, etc)
Mode switching to zero carbon modes (walking, cycling, electric or hydrogen fuelled vehicles where renewable energy is used)
Fuel switching of vehicles to zero carbon fuels (renewable electricity, biofuels)
Avoided travel
Avoided travel is emissions-free travel. Engineering a genuine and sustained reduction in the demand for mobility is challenging but not impossible. Travel reduction or avoidance strategies can merge into mode switching – discussed further below – for example where successful programs like Travel Smart encourage a reduction in trips by car, but an increase in trips by public transport or walking and cycling. A preliminary requirement is to understand, in depth, the mobility demands of the population, segment by segment; to understand why trips (by all modes) are being undertaken; what are the drivers of the demand for mobility, including within the city and transboundary trips. This requires primary research – conducting regular surveys with an adequate sample of and section of the community and all mobility demands. Analysis of objective data, like AADT data collected from sensor loops in roads, will also help to inform this understanding. Much of this understanding is likely to exist already – between the Adelaide City Council, the State Transport Department and university researchers. However, there may be an opportunity to distil this knowledge and ensure that it informs planning and infrastructure investment decisions. With this knowledge, better planning decisions could then lead to a reduction in the demand for mobility over time. A key opportunity, for example, would be to understand the mobility needs of the current residents of the city, and also of those who move into the city in coming years. If these residents have needs that they believe are best met by travelling – to take kids to schools outside the city; to go shopping in large suburban shopping malls; to travel to workplaces or healthcare facilities outside the city, as some examples, it may be that planning solutions can help alleviate these demands over time by
pitt&sherry ref: HB15535H002 final rep 31P Rev00/PH 62
seeking to ensure that these needs can be met locally, inside the city. Second, this understanding can inform the nature and location of transport infrastructure provision, to help optimise its utilisation. Infrastructure that does not meet the underlying mobility needs of its intended users is very likely to be underutilised – meaning that the investment choice was not a good one. Realistically, travel minimisation is a longer term strategy, and its main impact may be to minimise the growth in demand for mobility, rather than to achieve actual reductions. Nevertheless, we recommend that opportunities in this area be explored, with the aim of maximising the effectiveness of the overall mobility strategy.
Mode switching – walking and cycling
The second zero-carbon strategy is mode-switching to modes that are, or can be, zero emissions. The choices begin with walking and cycling. These modes, of course, have significantly co-benefits for the population, including health benefits, improved air quality (reduced tailpipe emissions from cars) and reduced travel costs, quite apart from the greenhouse gas abatement benefit. Adelaide has the major advantage, compared with cities like Sydney or Hobart, of being quite level, making these human-powered modes potentially more attractive. To facilitate these modes, the key requirements are firstly to provide infrastructure that creates a safe and enabling environment; and second, to promote and/or incentivise switching. A safe, enabling environment for walking should be evolved via consultation with the working and residential population of the city. It is likely to feature:
pedestrian friendly and traffic calming infrastructure (speed bumps, longer pedestrian crossing times, raised pedestrian crossings, more pedestrian malls, etc)
adequate (and energy efficient) public lighting
covered walkways (to encourage walking in both heat and rain) – these may provide opportunities for solar energy generation on their roofs.
Walkways would become an important element of the streetscape, and so it would be important to ensure there is adequate consultation with a range of stakeholders regarding their design and location. Similarly for cycling, consultation with the current and potential future cycling community is the place to start. However, we would expect to find that providing safe and enabling infrastructure would be the key opportunity including:
Fully separated bike lanes (separated by physical boundaries) in addition to those on the Frome Street in Adelaide.
On street highly visible bicycle parking facilities.
Shower and changing room facilities.
Lighting and way-finding signage. The cost-effectiveness and the likely take-up of on-street public bike sharing schemes could be investigated to identify its potential for Adelaide. Storage and shower facilities may be required in new buildings and for major refurbishments (and often are in any case, as they are encouraged by Green Star, inter alia). For refurbishments, the Government’s Building Upgrade Finance facility could leverage this and other desired outcomes as a condition of accessing the facility, for example. For existing buildings where these facilities are not yet available, a consultation process such as a new Property Sector Agreement with the Property Council of Australia, or a process similar to the Better Buildings Partnership in Sydney, may be effective in persuading building owners to retrofit these facilities. There may also be a need to ensure that the current scheme does not create barriers to the provision of such facilities. Finally, there could be opportunities to create a modest financial incentive via the structure of Council rates.

pitt&sherry ref: HB15535H002 final rep 31P Rev00/PH 63
Other facilitative options could include:
ensuring that rail, tram and bus services are also able to accommodate bicycles, to encourage longer journeys to be undertaken by low/zero emissions modes;
considering ‘bicycle park and ride’ facilities at key locations, to make optimal use of existing zero (or potentially zero) carbon transport infrastructure, such as electrified trams or rail.
Once a) travel needs are well understood and b) appropriate infrastructure has been created reflecting this understanding, then incentives for and promotion of mode switching are likely to be successful strategies. Without these two preconditions, they may be much less so. Many incentive options (which include disincentives) exist to help encourage mode switching – not only to walking and cycling, but also to public transport and low/zero carbon vehicles, as discussed further below. A key opportunity, of course, is to dis-incentivise car use, for example by:
facilitating at-home or on-street parking in residential areas during the day, so that residents are encouraged to leave their cars at home;
raising parking fees in the city – particularly the all-day rate;
providing park and ride facilities outside the city boundary, with zero carbon public transport and cycling/walking infrastructure (lock up storage, etc);
discourage employers/developers from providing car parking in the city (and ensuring that the planning scheme does not encourage this), while encouraging them to offer incentives for alternative modes (public transport, cycling).
In the cycling area, the purchase costs of a bicycle – and in particular of electric bicycles – may discourage cycling as a commuter mode. More widespread use of electric bicycles (recharged with 100% renewable electricity as above) could encourage cycling over longer distances and/or by people that would not otherwise feel physically capable of cycling. However, they are currently quite expensive to purchase in Australia (although are very cheap and ubiquitous in China, where many are manufactured). Even conventional commuter bicycles can cost somewhere between $500 - $1000, enough to create a barrier for some. Therefore there may be an opportunity to work with local bicycling shops, importers and/or manufacturers to encourage a ‘market transformation’ initiative for commuter bikes and electric bikes, which would aim to a) increase sales (benefiting these businesses, including through subsequent servicing) and b) offer significantly reduced prices to purchasers of these bicycles. Market transformation is a generic policy design approach which uses strategic interventions (which may include temporary incentives) to engender changes in market arrangements which then become permanent and self-sustaining, without any need for ongoing incentive or interventions.53 Electric scooters and motor cycles are also becoming more widely available, while their range and performance is improving with advances in battery technology in particular. For those commuting longer distances, these may be a viable zero carbon mode. These vehicles differ from bicycles in that they have sufficient power to maintain similar average speeds as conventional vehicles, and therefore do not require separated infrastructure. To encourage their use, similar strategies as with electric bicycles could be explored, with the aim of increasing the number of models available, reducing their price and increasing awareness of them as a viable commuting mode. Promotional strategies could assist with this task. As also with bicycles, ensuring that there is adequate and safe storage/parking areas for electric scooters and motor cycles, and/or waiving parking fees for them, would provide material incentives for their use.
53
See, for example: http://www.imt.org/about

pitt&sherry ref: HB15535H002 final rep 31P Rev00/PH 64
Another requirement would be to provide recharging facilities for electric bicycles (and scooters/motor cycles) at storage/parking locations. This will require some careful design work - for example in consultation with building owners, planners, cyclists and power companies - to evolve charging and payment arrangements that are suited (also for electric cars, as discussed further below). Easy payment infrastructure, based on smart cards, credit cards, phone apps or others, could help to facilitate use of the physical infrastructure (recharging points) by a wide range of users. Strategies to promote mode-shifting (as distinct from facilitate or incentivise, as considered above) are many and varied, and will not be reviewed in detail here. There is an extensive body of literature available to help design effective campaigns. Strategies can include TV and print campaigns, social media campaigns, messaging and modelling of appropriate behaviours by civic leader and high-profile figures, and many others. The keys to success include consistency in signalling and messaging through time and across all levels of government/leadership, and avoiding inconsistencies in modelling behaviours. For example, if leaders and advocates of low/zero carbon transport modes are not themselves using them, this could lead to adverse media stories and public cynicism. Similarly, if there are high parking fees on electric motor cycles, or no secure parking facilities or recharging opportunities, then promotional campaigns are unlikely to be effective. This harks back to our earlier point that effective strategies must be based in detailed consultation with and understanding of the needs of commuters.
Mode switching – public transport (zero carbon)
Mode switching to public transport is likely to reduce greenhouse gas emissions, almost regardless of the fuel used by the public transport mode, due to their greater load factors and lower emissions on a per-capita/per-km basis relative to the private motor car. However, to achieve zero carbon urban mobility, we also need to address the emissions of the public transport mode itself. Therefore mode switching for zero carbon public transport merges into the next strategy, considered later, of fuel switching to zero carbon fuels. Key options for zero carbon public transport include:
Trams/light rail (using renewable electricity);
Trains (using renewable electricity);
Electric buses (using renewable electricity);
Hydrogen buses (where the hydrogen is produced with renewable electricity);
Buses (or trains) powered by biofuels such as biodiesel.
Trams
Adelaide already has a tram service, and there is scope (and, we understand, ambitions) to expand this network over time. We strongly encourage this, of course with the proviso that the electricity is secured from renewable sources. An expanded tram/light rail network could be an integral part of a zero carbon mobility strategy, which would include giving more road space to these modes and less to cars and other vehicles (as there will be less need for cars in the city).
Trains
We understand that the train network that services Northern Adelaide and Belair is currently diesel electric powered. Options would include electrification of the entire network – but this is likely to be very expensive – or repowering the locomotives with biodiesel. Since the (commuter) train network extends well beyond the Adelaide LGA, of course, then a greater volume of biodiesel would be required. Biofuel issues are discussed further below. Before leaving trains, however, we note that there is at least one example of trains being powered by hydrogen fuel cells (‘hydrail’).54 Fuel cell technology is discussed
54
http://www.railway-technology.com/features/feature122016/feature122016-3.html

pitt&sherry ref: HB15535H002 final rep 31P Rev00/PH 65
further below in the context of buses. For the time being, however, hydrogen fuel cells remain a very expensive, niche technology that is not fully commercialised.
Buses
Due to the current state of battery storage technologies, and also their cost, there is limited albeit growing ability for buses and other heavy vehicles to be powered by stored (renewable) electricity. To electrify the bus fleet servicing Adelaide, for example, would be very expensive, but might also lead to capacity reductions (fewer seats per bus) and may or may not allow for the whole of the current bus network to be serviced by these vehicles. That said, there are rapid advances occurring in battery and related electric vehicle technologies (charging/discharging efficiency, etc), as well as rapid commercialisation of these technologies, leading to reductions in the economic and technical barriers, and these are certain to continue to reduce in coming years. As a practical way forward, we would suggest that electric buses (recharged with renewable electricity) be introduced progressively into in-boundary routes and near-boundary routes, where smaller buses, shorter round-trips and/or shorter total trip lengths are available. The electric bus network can then be progressively expanded over time as technology and economics allow. pitt&sherry is currently conducting an electric bus trial for the city of Noosa.
Figure 5.8: Noosa Electric Bus Trial Source: http://www.brisbanetimes.com.au/queensland/noosa-introduces-pollutionbeating-electric-buses-20150615-ghom2h.html
A potential alternative ‘energy carrier’ for renewable energy in buses or other heavy vehicles is hydrogen. Hydrogen can be combusted in spark ignition engines (not compression ignition ones like diesel), or can be converted to electricity (on board the bus) via a fuel cell. Hydrogen has high energy density (and therefore is capable of powering heavy vehicles); has zero tailpipe and zero greenhouse gas emissions at the point of combustion; and it can be stored more readily than electricity in batteries. That said, hydrogen is much more difficult and expensive to store than liquid fuels, or gases such as compressed natural gas, as it cannot be contained by steel (the hydrogen molecules are so small that they leach out through the molecular matrix of steel vessels or pipes) and instead requires carbon fibre fuel tanks. Also,

pitt&sherry ref: HB15535H002 final rep 31P Rev00/PH 66
fuel cells in particular are still extremely expensive (fuel cell buses trialled in Western Australia cost around $2million each). There would also be practical – albeit temporary – issues such as a lack of familiarity with this fuel and related technologies in the services/maintenance industries. However, there are fleets of hydrogen buses in service around the world. Aberdeen in Scotland is one example (using fuel cells), while Hino and Toyota very recently announced the development and trial of a new 77 seat fuel cell bus in Tokyo. This option could be explored for Adelaide but is likely to be reasonably expensive at this stage.
Figure 5.9: Hydrogen Fuel Cell Buses Source: http://www.hino.com.au/news/hino-helps-develop-fuel-cell-bus/
Fuel switching - electric passenger motor vehicles
Electric vehicles are most likely the future of the motor car. Not only can they be a zero-carbon transport mode, when recharged with renewable electricity, they offer a longer term solution to the declining availability (and rising greenhouse gas intensity) of liquid fuels, and also directly address the severe air quality concerns in the world’s megacities, by generating no tailpipe emissions at all. For these reasons inter alia, major countries like China and India are embracing electric vehicles as a critical domestic solution to their urbanisation, fuel security and mobility challenges. As a spin-off from that, the overall technology suite (batteries, chargers, controllers, etc) is being pushed through a rapid commercialisation curve, leading to rapid improvements in performance and reductions in costs, to the overall benefit of the global transportation task. Noting that, as discussed above, there is a great diversity of mobility needs, and an equal need for matching transport solutions, there is likely to be an ongoing demand and role for private motor vehicles (and taxis, etc). Therefore, a fleet of renewably powered electric vehicles is very likely to have a significant place in a zero carbon urban mobility strategy for Adelaide, and indeed other cities, in the future.

pitt&sherry ref: HB15535H002 final rep 31P Rev00/PH 67
The question for some time now has been how quickly that future arrives. There are extremely powerful vested interests in the conventional motor vehicle and also fossil fuel industries, in Australia and globally. These interests are reluctant to see their market shares decline, let alone their products become redundant. And yet these trends appear inevitable, and not only because of climate change, as noted above. As a result of these factors – but also that the major countries above are consuming the majority of the electric vehicles they produce in their domestic markets, and not exporting them – today there are limited numbers of electric vehicles available in the Australian market. Those that are available are still very expensive when compared with similar-sized conventional vehicles and also suffer from limited range and a lack of recharging infrastructure and supporting standards and protocols. In the short term at least, ‘plug-in electric hybrids’ – which both store electricity but can also produce it on-board from conventional petrol engines and generators – are bridging a gap, offering to overcome the ‘range anxiety’ of consumers while providing the potential for zero carbon trips over shorter distances. For Adelaide, a key question is ‘what can be done to accelerate and bring forward in time the roll-out of electric vehicles?’ This question will take some answering, no doubt in a dedicated study. Opportunities may include:
use of government and government business enterprise purchasing power, or other market transformation strategies, to buy-down capital costs for EVs;
encouraging or incentivising private fleets, taxis, hire car companies and others to do the same;
identifying suitable transport tasks for heavier or special purpose vehicles that may be able to be switched to an electric drive-train, such as garbage trucks, light commercial vehicles, street sweepers;
undertaking trials and demonstration programs, and publicising the results, to reduce the ‘shock of the new’ and inform fleet and private buyers about the economics of electric vehicle ownership;
establishing standards and protocols and physical/virtual infrastructure for recharging and payment for recharging of EVs;
identifying key routes and hubs for progressive development of recharging infrastructure;
utilising existing ACC assets such as car parks for EV charging points
working with private property owners (supermarkets, shopping centres, offices, etc) to encourage them to do the same;
providing EV owners with free or reduced registration charges, parking charges, stamp duty, etc, or priority access to car parking facilities, on- and off-street.
Fuel switching - biofuels
There are numerous biofuel options and feedstocks, from biodiesels (from waste oils, oilseeds, tallow or other sources) to bioethanols (from starch-based (grains), sugar-based or lignocellulosic (woody) sources) and bio-oils (from seaweeds, micro-organisms and other sources). At this point in time, most of these fuels are both expensive, relative to conventional fuels. They are also generally only available in very limited quantities, due to limited availability of the underlying feedstocks. Biodiesel, for example, is often made from tallow sourced from abattoirs – the availability of which will be limited by the abattoir throughput. Also, there is a limited range within which it is cost effective to transport feedstocks to a biofuels facility (without consuming more energy than is produced), and therefore biofuels facilities are likely operate at small to modest scales. Also, while they are classed as renewable fuels, some biofuels have quite high life cycle emissions (greenhouse gas emissions associated with their production/conversion processes). Finally, there are technical limitations associated with some biofuels, in that some engines may be damaged and/or their warranties voided, by running on pure biodiesel/bioethanol, for example. Some biofuels have lower energy density, octane ratings, poorer performance under certain operating conditions (eg, cold weather) than fossil fuels.

pitt&sherry ref: HB15535H002 final rep 31P Rev00/PH 68
The key advantages of biofuels - beside the possibility that they can be produced from renewable sources - include that, as liquid fuels, they may be able to be used directly, or with limited modifications, by the majority of the existing vehicle fleet, including heavy vehicles like trucks and trains for which there are limited zero carbon options available. Biofuels are also commonly blended with fossil fuels, both to extend the limited biofuel supplies, but also to address some technical limitations noted above. Euro 6 standard buses are warrantied to run on up to 100% biodiesel (B100). As the Adelaide bus fleet is upgraded to this standard through time, then there would be an opportunity to deliver public transport services with zero emissions (at the point of combustion). Also, it is likely that the cost premium for this fuel would be very low, or indeed there may be no premium at all. Overall, we suggest that a detailed biofuels assessment and strategy be compiled, examining feedstock availability, production capabilities and matching of supply to potential end-users, taking into account technical suitability considerations.
Low-carbon transport
A second broad strategy to move Adelaide’s transport system towards zero carbon would be to encourage low-carbon solutions and discourage high-carbon ones via a range of strategies. As with blended biofuels, this strategy would not on its own lead to a zero carbon transport task in Adelaide, but it a) could reduce the quantity and cost of offsets required and b) may be much more cost effective (including generating cost savings for transport users in some cases) than some zero carbon options. In brief, low-carbon transport options include:
Feebates that reward the selection of fuel efficient (or low or zero carbon) vehicles and penalise the selection of fuel inefficient vehicles, within an overall budget neutral envelope;
Lobbying for the setting of stringent national fuel efficiency standards for all vehicles sold in Australia;
Using government, government business enterprise and (willing) private fleet owners’ purchasing power to buy only highly fuel efficient vehicles (which would have flow on benefits over time into the second hand car market – an important consideration from a social equity perspective, as lower-income families often can only afford to purchase older and less fuel efficient vehicles);
Promoting to the public the financial benefits of purchasing smaller and more fuel efficient cars;
Promoting ride-sharing, car-pooling and other strategies, and providing incentives for this when high fuel efficiency/low/zero carbon vehicles are used;
Promoting operational and network efficiencies via strategies such as use of double-decker buses, optimised network/route planning, etc;
Reducing driving speeds in the city.
Measures
Numerous policy measures and program ideas have been noted above. We recommend that, as a next step, a detailed Zero Carbon Adelaide Mobility (ZCAM) plan be developed for Adelaide, drawing on the above, but undertaking careful planning and business case assessment. As noted, key immediate steps would be to compile all existing relevant knowledge on the nature of the transport task in Adelaide, and also to conduct careful and genuine consultations with the wider community and specific stakeholders (business owners in the city, transport service providers, key traffic attractors such the University) around preferred and non-preferred options. This would then lead into business case assessment and a review of the range financing options (for infrastructure elements).
Estimated impacts and costs
Transportation infrastructure investments are much less amenable to ‘a priori’ cost estimation than stationary energy projects, as many factors are contingent on local conditions, usage patterns and other

pitt&sherry ref: HB15535H002 final rep 31P Rev00/PH 69
factors. It is indicative that in the well-regarded 2008 McKinsey Report, An Australian Cost Curve for Greenhouse Gas Reduction, the transport sector (Australia wide) was found to offer the smallest abatement volume (13 Mt CO2-e in 2020) of all of the sectors, albeit with a negative average abatement cost of -$55/t.55 In the 2010 Low Carbon Growth Plan for Australia, by ClimateWorks, there were similar findings. Only 6 MtCO2-e of abatement (6% of BAU transport sector emissions) was found to be cost effective (at that time, defined as a marginal cost of carbon less than $25/t). The key opportunities considered were diesel car and light commercial vehicle fuel efficiency improvements (eg, through fuel efficiency standards), followed by petrol vehicle fuel efficiency standards, heavy vehicle fuel efficiency improvements, and then hybrid electric vehicles. Electric vehicles and biofuels were found to have quite high abatement costs at that time, although it should be stressed that EV costs in particular have fallen since this analysis was conducted.
Figure 5.10: Transport Sector Abatement Cost Curve for 2020 Source: ClimateWorks Low Carbon Growth Plan for Australia, p. 73.
These analyses are examining underlying technical efficiency opportunities, and from that perspective may miss simpler, more readily available opportunities. For example, they do not consider mode shifting opportunities, as discussed above, or public transport investments. A further opportunity that may well be available to South Australia is the use of feebates or other mechanism that encourage the selection of more fuel efficient vehicles. As noted earlier, such vehicles may be less expensive to purchase, as well as to run, than less fuel efficient vehicles (although this is not always the case), and so generally offer negative abatement costs. This is confirmed in the abatement cost curve commissioned specifically for the City of Melbourne’s Zero Net Emissions by 2020 Strategy (shown in Chapter 1 of this Report), which shows ‘shifting to more efficient vehicles’ as the most cost effective measure of all at close to -$400/t. Note, however, that limited tonnes of abatement are associated with this opportunity, presumably reflecting an expectation of low take-up of the measure.
55
McKinsey & Co, An Australian Cost Curve for Greenhouse Gas Reduction, 2008, p. 11.

pitt&sherry ref: HB15535H002 final rep 31P Rev00/PH 70
In short, detailed analysis of opportunities that are available to SA/Adelaide would be required to construct an optimal and cost effective strategy for Zero Carbon Mobility, and this is beyond the scope of the current project.
5.4 Iconic Offsets
The National Carbon Offset Standard (NCOS) defines an offset as “...reductions or removals of greenhouse gases from the atmosphere by sinks, relative to a business-as-usual baseline. Carbon offsets are tradeable and often used to negate (or offset) all or part of another entity’s emissions.”56 Sinks are defined as “A natural or manmade [carbon] reservoir, such as a forest, that stores carbon”.57 This definition focuses on sequestration, but a second important offsets pathway is afforded by the Government’s Carbon Farming Initiative (CFI).58
The Carbon Farming Initiative and the Emissions Reduction Fund
The CFI existed under the previous Australian Government’s Carbon Pricing Mechanism (since repealed) to provide a mechanism for land-use based sequestration to be recognised and credited as offsets. The current Australian Government has recently amended the Carbon Credits (Carbon Farming Initiative) Act 2011 in order to accommodate its Emissions Reduction Fund (ERF). This will have the effect of enabling a much wider range of project types to be credited under the CFI. These projects will be able to be certified by the Clean Energy Regulator as generating credits (ACCUs or Australian Carbon Credit Units) – provided they meet the relevant criteria using approved methodology determinations. The credits can then be sold to the Australian Government via the ERF auction process, or they can be sold privately as voluntary offsets. A set of transitional arrangements for the CFI are in place (as set out below), but essentially, from 1 July 2015, the new ERF methodologies is required to be used to calculate credit amounts and for offsets certification. Specifically, the Federal Environment Department’s website currently notes:
“After 1 July 2015 parts of the 26 existing CFI determinations, made before the commencement of the Emissions Reduction Fund will be inconsistent with the new legislation and rules. These determinations need to be either amended to clarify how they can be applied after 1 July 2015, or revoked. There will be no reduction in the activities covered by the ERF as a result of the proposed revocations and no existing projects will be affected. It is proposed that nine CFI determinations (covering activities across the land sector including agriculture, vegetation management and landfill and alternative waste treatment) are updated to transition to the ERF and that the remaining 17 CFI determinations are revoked. Transition and revocation of these methods is not intended to affect the types of activities eligible under the ERF. All activities which could have been carried out under the 17 methods proposed to be revoked are covered by either the transitioning methods or the new land sector methods made
56
Australian Government, Department of Climate Change and Energy Efficiency, National Carbon Offset Standard Version 3, June 2013, p. iii. 57
ibid 58
Note that there are other pathways again, including international offsets of different classes, credits from the (closed) Greenhouse Friendly program, and credits under the (closed) Carbon Pricing Mechanism.
pitt&sherry ref: HB15535H002 final rep 31P Rev00/PH 71
under the ERF. The transitioning methods are also being updated to ensure that the determinations are streamlined, easy to use and consistent with the new ERF legislation.”59
There will be a need to examine the CFI amendments and determinations carefully, post July 2015, to ensure that planned offsets projects will indeed be eligible under the CFI, and also to accurately estimate certified abatement amounts.
Offsets and Carbon Neutral Adelaide
Offsets will need to be a part of the Carbon Neutral Adelaide strategy, particularly to meet a short term goal of carbon neutrality, as it will not be possible in the time available (that is, before 2020) to reduce actual emissions attributable to the city’s activities to zero. Provided offsets are properly certified, they are a legitimate abatement strategy, on the grounds that a new and additional abatement investment occurs, reducing emissions outside the city, which would not otherwise have occurred. These tests are applied under the Australian Government’s National Carbon Offset Standard. Climate change is driven by overall concentrations of greenhouse gases in the atmosphere, and therefore it does not matter whereabouts emissions or abatement occur. Despite this, offsets are generally held to have a lower credibility than direct abatement action. For example, no C40 cities (other than Melbourne) are announcing that they will include offsets to help reach their abatement targets. Copenhagen – which is targeting carbon neutrality by 2025 – has specifically stated that it will not use offsets to reach this target. The reasons behind the reduced credibility of offsets are varied. Some international schemes that generate offset certificates, such as the Clean Development Mechanism or Joint Implementation, have been condemned as generating fictional abatement, as projects that actually create new emissions (such as a gas fired power station) can be awarded certificates on the grounds that there would have been more emissions if a coal fired power station had been built instead. If certificates arising from such project are then sold to a third party (eg Adelaide) and used to take the place of actual emissions reductions there, then the net result of this transaction is that emissions rose at the point of origin of the certificates and did not fall at the point of purchase of the certificates, leading to a clear net increase in global emissions. To claim that such transactions are genuine offsets is fanciful: ‘what the atmosphere sees’ is simply rising emissions. There is also concern about the consequences of such offsets for global equity. In effect, wealthy emitters in Western countries are purchasing the abatement effort (even if genuine) of developing countries, which then removes that abatement as an offset against that country’s own emissions. As a developing country, it is likely that its emissions will be growing. Eventually that country will need to find higher cost abatement opportunities to abate these emissions, as its lower cost abatement opportunities will already have been sold. There is also a concern regarding the permanency of offsets, notwithstanding that ‘permanency’ is an agreed offset principle, as set out below. A requirement to keep a particular plot of land under vegetation for 100 years was selected based on the length of the natural carbon cycle, but of course leaves open the fate of that plot of land thereafter, and also raises questions about the governance and security of the abatement in the meantime. That said, other forms of abatement or offsets that are based on technological investments could in principle be reversed in future as well, eg, when the capital equipment wears out.
59
http://www.environment.gov.au/climate-change/emissions-reduction-fund/carbon-farming-initiative-project-transition, viewed 29/5/2015

pitt&sherry ref: HB15535H002 final rep 31P Rev00/PH 72
Offsets in Australia may be certified under NCOS when they meet the following principles (noting that similar but not identical principles apply under the CFI):
(a) Additional: Abatement must go beyond what would be required to meet regulatory obligations or undertaken as part of ‘business-as-usual’; and additional to Australia’s international emissions targets.
(b) Permanent: Offsets must represent permanent reductions in greenhouse gas emissions. In the case of sinks, this requires that the carbon stored is sequestered and will not be released into the atmosphere for a
period of 100 years. 60
(c) Measurable: Methodologies used to quantify the amount of emissions reductions generated must be robust and based on defensible scientific methods. Methodologies must clearly define the greenhouse gas assessment boundary, emissions sources and sinks, and methods for calculating baseline emissions and project abatement.
(d) Transparent: Consumers and other interested stakeholders must have access to information about offset projects, including the applied methodology, abatement estimates and project monitoring arrangements.
(e) Demonstrate avoidance of leakage: An offset project must not cause material increases in emissions elsewhere which nullify or reduce the abatement that would otherwise result under the project.
(f) Independently audited: Greenhouse gas emissions reductions generated by offset projects must be audited by an independent, qualified third party.
(g) Registered: Offset units must be listed and tracked in a publicly transparent registry.
Opportunities
The concept of ‘iconic’ offsets emerged from the Leaders and Leading Thinkers workshop held of 8 May, as reported in Section 4.2 above. The term ‘iconic’ connotates a project or projects that are large scale, highly credible and which would bring significant co-benefits to the State. For example, a large scale ecological/landscape restoration project in South Australia, which addressed multiple objectives including carbon sequestration, habitat/wildlife corridor restoration, addressing riverine erosion or watertable/salinisation, etc, while also generating employment in South Australia, may pass the ‘iconic’ test. Noting the CFI discussion above, the choices available for the type of abatement project are (from 1 July) effectively limited to those for which a methodology determination has been made under the ERF61. These include: Table 5.1: ERF Method Determinations by Sector
Sector Methods
Agriculture Beef cattle herd management Destruction of methane from piggeries using engineered biodigesters Destruction of methane generated from dairy manure in covered anaerobic ponds Destruction of methane generated from manure in piggeries Estimating sequestration of carbon in soil using default values Fertiliser use efficiency in irrigated cotton Reducing greenhouse gas emissions in beef cattle through feeding nitrate containing supplements
60
Note that Proponents of new Emissions Reduction Fund carbon storage projects can nominate a 100- or 25-year permanence
period. Projects with a 25-year permanence period will be subject to a 20 per cent discount on the number of credits that would otherwise be issued for the project. The five per cent risk of reversal buffer will also apply. See http://www.environment.gov.au/climate-change/emissions-reduction-fund/publications/factsheet-emissions-reduction-fund-carbon-farming-initiative-transition viewed 29/5/2015 61
Or international units issued under the Kyoto Protocol or credits issued under the Gold Standard and Verified Carbon Standard.

pitt&sherry ref: HB15535H002 final rep 31P Rev00/PH 73
Sector Methods
Reducing greenhouse gas emissions in milking cows through feeding dietary additives Sequestering carbon in soils in grazing systems
Energy efficiency Aggregated small energy users Commercial and public lighting Commercial building energy efficiency Industrial Electricity and Fuel Efficiency Refrigeration and Ventilation Fans
Facilities Facilities
Mining, oil and gas Coal mine waste gas Oil and gas fugitives
Transport Aviation Land and sea transport
Vegetation management
Avoided clearing of native regrowth Avoided Deforestation Designated Verified Carbon Standard projects Human-induced regeneration of a permanent even-aged native forest Measurement based methods for new farm forestry plantations Native forest from managed regrowth Reforestation and Afforestation Reforestation by Environmental or Mallee Plantings - FullCAM Savanna fire management
Waste and wastewater
Alternative waste treatment Landfill gas Wastewater treatment
Source: http://www.environment.gov.au/climate-change/emissions-reduction-fund/methods viewed 11 November 2015
Further draft methods are in preparation. Projects must occur outside the boundary of the city to be certified as offsets. Projects that have the character of those in Table 5.1 above that occur inside the ACC emissions boundary will contribute to emissions abatement (captured in the ACC inventory), and will mean that less offsets will need to be purchased from elsewhere. To avoid confusion, projects of the latter type should not be described as offsets.
Treatment of renewable energy
Renewable energy is excluded from the list of offsets eligible under the CFI, on the grounds that it would not be additional to the requirements of the national Renewable Energy Scheme. However, purchase and voluntary cancellation of GreenPower RECS (from renewable energy sources outside the boundary) are treated as equivalent to the direct use of renewable energy under the NCOS, and therefore this amounts to an effective offset. In effect, renewable energy can be used to displace Scope 2 emissions associated with electricity consumption inside the boundary, but may not be used as an offset against other emissions inside the boundary.
Measures
The ‘measure’ here is effectively one or more offsets projects. To proceed, the sequence of events for procuring the required offsets could be as follows:
1. Identify which party will contract (and pay) for offsets;
pitt&sherry ref: HB15535H002 final rep 31P Rev00/PH 74
2. Confirm the period for which offsets must be secured (the target carbon neutrality date); 3. Complete a full emissions projections model to at least 2020, including careful accounting for
business as usual impacts, as well as the effects of any new measures expected to be implemented before that time, including any ‘optimised’ measures under this Carbon Neutral Adelaide strategy, in order to estimate the volume of offsets required;
4. Compile a careful qualitative as well as quantitative specification of the volume and character of eligible ‘iconic’ offsets, including for example a set of principles, criteria, inclusions or exclusions (and any other desired criteria, such as price expectations) – this phase could and should include extensive consultations, including with those sectors potentially able to supply offsets;
5. Issue a tender for the supply of offsets, based on the above specification; 6. Evaluate tenders and award one or more contracts (multiple contracts would spread risks); 7. Commence an ongoing monitoring and QA program to ensure that projects are delivered and
remain on-track. Note that it would be prudent to over-contract the estimated volume of offsets to allow for a) unexpectedly rapid emissions growth and/or underperformance of particular offsets projects. Note that any offsets that were eventually surplus to requirements would be able to be resold into at least voluntary carbon offsets markets. By contrast, if the volume of required offsets is under-estimated, then it may be necessary to purchase additional offsets units from carbon markets, with consequent price and quality uncertainties.
Estimated impacts and costs
In principle, any volume of offsets could be secured, as necessary. However, depending upon the character of ‘iconic’ offsets that may be required, judgements about the credibility of different offset classes, and the requirements pertaining to offset certification, the practical volumes of offsets able to be secured over just the next four years may be more limited (but are still likely to be sufficient for the purposes of this strategy). If we consider large-scale sequestration, such as an ecological restoration project somewhere in South Australia, it will take some time to design and implement an offsets program (as described above); to award tenders; and then for the project to be literally put in the ground. Then – subject to the exact climate zone and nature of the species intended to be planted – the rate of carbon sequestration may be quite slow in the early years. For example, Figure 5.11 below shows the expected rate of carbon sequestration calculated for a project in Southern Tasmania (a dry colder climate). The model suggests that after the first four years, sequestration rates will have reached only around 4 t C/ha.year62, compared to around 100 t C/ha.year in the longer term. If this were the only source of offsets relied upon, then at this sequestration rate, it would necessary to secure 100/4 or 25 times the area of sequestration (hectares) actually needed in the longer term, at 25 times the cost. This indicates that this will not be an optimal approach.
62
NB: 1 tonne carbon = 3.67 tonnes CO2.

pitt&sherry ref: HB15535H002 final rep 31P Rev00/PH 75
Figure 5.11: Indicative Rate of Carbon Sequestration: Eucalypt Forest: Southern Tasmania Source: pitt&sherry
Instead, a ‘basket’ or portfolio of sequestration projects should be identified, with carbon yields or maturities that in aggregate at least match (or rather, exceed by an agreed risk margin) the projected offsets requirements, while minimising overall costs. In terms of costs, these will of course vary with sequestration type, but some indication can be gleaned from the recent auction process under the ERF, where the average of abatement realised was $13.95/t CO2-e (Figure 5.12). This value compares well with the figure we estimated for the ACT Government, albeit four years ago now, of around $16/t CO2-e.63 We note that the first round ERF auction did purchase considerable abatement from pre-existing CFI investments, not new ones, and therefore the price may under-estimate the cost of new sequestration projects. Also, with the Australia Government effectively the only, or at the major, purchasers of local, high-quality carbon credits in the Australian market, it is likely be able to extract price discounts that may not be available elsewhere. As the Australian Government intends to publish the average price (only) of abatement from each successive ERF auction round, there will be more information available to the market over time. There are, of course, price observations available for various international carbon units – including very low prices for units under the Clean Development Mechanism – but these are not considered here as we consider that they fail on numerous aspects of the decision making criteria set out at the beginning of this Chapter.
63
http://www.environment.act.gov.au/__data/assets/pdf_file/0004/581476/Final_Report_27July2011.pdf
-20
0
20
40
60
80
100
120
0 50 100 150 200 250
t Carbon per year
Years

pitt&sherry ref: HB15535H002 final rep 31P Rev00/PH 76
Figure 5.12: Highlights of ERF Auction Round 1 Source: http://www.mycarbonfarming.com.au/news-and-events/erf-auction-infographic-and-news/
5.5 Waterfall Chart
The major pathways described above require further detailed analysis, including cost benefit analysis, in order to identify the optimal and least shares of these measures, together with others not considered in as much detail in this Report but listed in Section 5.6 below. Therefore the following ‘pathways’ analysis, or waterfall chart, should be understood as indicative only, and subject to revision following more considered analysis (Figure 5.13).
Figure 5.13: Major Abatement Pathway Waterfall Chart: Scenarios for Carbon Neutrality by 2019 Source: pitt&sherry
-
200,000
400,000
600,000
800,000
1,000,000
1,200,000
1,400,000
2007 Base 2019 BAU Waste Transport Energy Efficiency Renewable Electricity
Offsets
ton
nes
of
CO
2-e
Total impact of measures by sector in 2019
4.1% 12.7%
72.9% 2.1% 8.2%
BAU = 728 kt CO2-e
2007 Base = 1,175 kt CO2-e
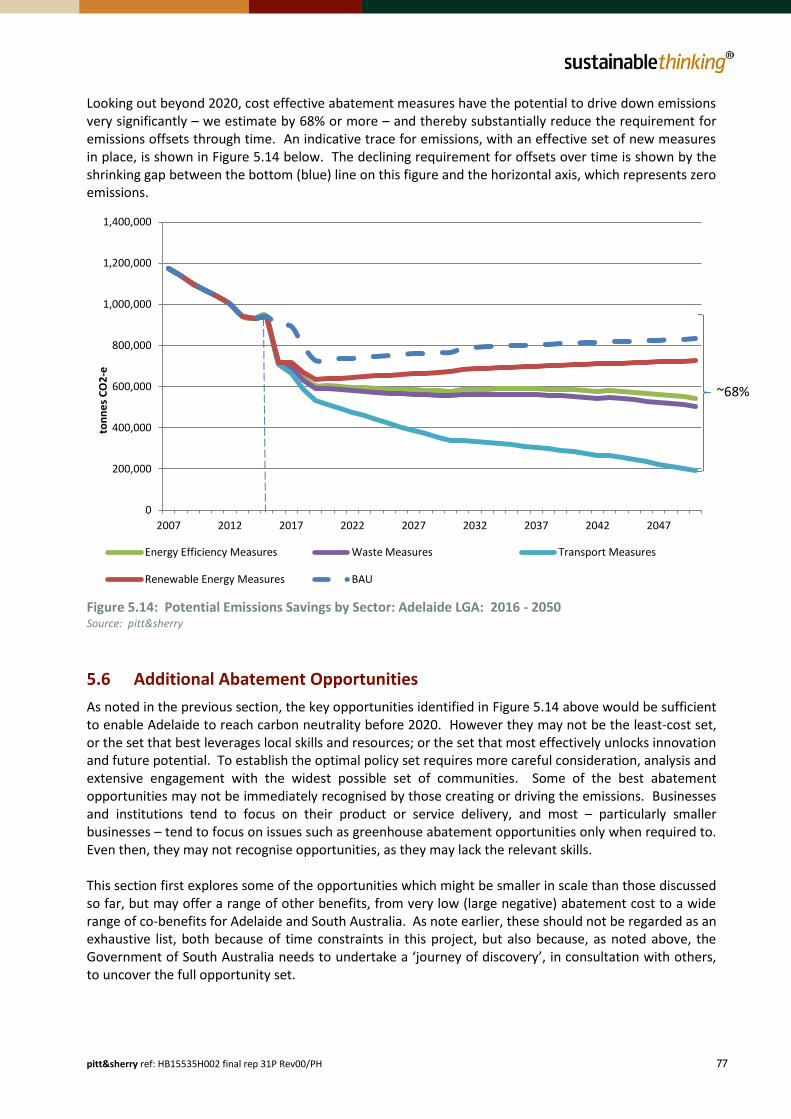
pitt&sherry ref: HB15535H002 final rep 31P Rev00/PH 77
Looking out beyond 2020, cost effective abatement measures have the potential to drive down emissions very significantly – we estimate by 68% or more – and thereby substantially reduce the requirement for emissions offsets through time. An indicative trace for emissions, with an effective set of new measures in place, is shown in Figure 5.14 below. The declining requirement for offsets over time is shown by the shrinking gap between the bottom (blue) line on this figure and the horizontal axis, which represents zero emissions.
Figure 5.14: Potential Emissions Savings by Sector: Adelaide LGA: 2016 - 2050 Source: pitt&sherry
5.6 Additional Abatement Opportunities
As noted in the previous section, the key opportunities identified in Figure 5.14 above would be sufficient to enable Adelaide to reach carbon neutrality before 2020. However they may not be the least-cost set, or the set that best leverages local skills and resources; or the set that most effectively unlocks innovation and future potential. To establish the optimal policy set requires more careful consideration, analysis and extensive engagement with the widest possible set of communities. Some of the best abatement opportunities may not be immediately recognised by those creating or driving the emissions. Businesses and institutions tend to focus on their product or service delivery, and most – particularly smaller businesses – tend to focus on issues such as greenhouse abatement opportunities only when required to. Even then, they may not recognise opportunities, as they may lack the relevant skills. This section first explores some of the opportunities which might be smaller in scale than those discussed so far, but may offer a range of other benefits, from very low (large negative) abatement cost to a wide range of co-benefits for Adelaide and South Australia. As note earlier, these should not be regarded as an exhaustive list, both because of time constraints in this project, but also because, as noted above, the Government of South Australia needs to undertake a ‘journey of discovery’, in consultation with others, to uncover the full opportunity set.
0
200,000
400,000
600,000
800,000
1,000,000
1,200,000
1,400,000
2007 2012 2017 2022 2027 2032 2037 2042 2047
ton
ne
s C
O2
-e
Energy Efficiency Measures Waste Measures Transport Measures
Renewable Energy Measures BAU
~68%
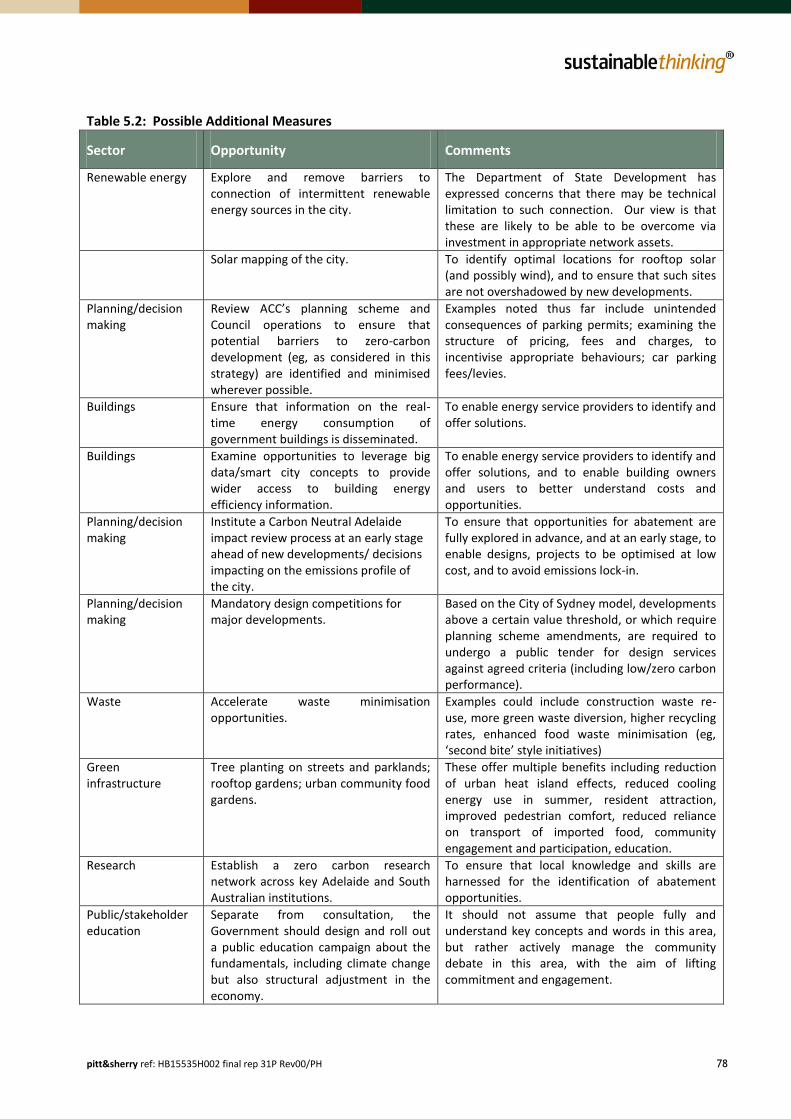
pitt&sherry ref: HB15535H002 final rep 31P Rev00/PH 78
Table 5.2: Possible Additional Measures
Sector Opportunity Comments
Renewable energy Explore and remove barriers to connection of intermittent renewable energy sources in the city.
The Department of State Development has expressed concerns that there may be technical limitation to such connection. Our view is that these are likely to be able to be overcome via investment in appropriate network assets.
Solar mapping of the city. To identify optimal locations for rooftop solar (and possibly wind), and to ensure that such sites are not overshadowed by new developments.
Planning/decision making
Review ACC’s planning scheme and Council operations to ensure that potential barriers to zero-carbon development (eg, as considered in this strategy) are identified and minimised wherever possible.
Examples noted thus far include unintended consequences of parking permits; examining the structure of pricing, fees and charges, to incentivise appropriate behaviours; car parking fees/levies.
Buildings Ensure that information on the real-time energy consumption of government buildings is disseminated.
To enable energy service providers to identify and offer solutions.
Buildings Examine opportunities to leverage big data/smart city concepts to provide wider access to building energy efficiency information.
To enable energy service providers to identify and offer solutions, and to enable building owners and users to better understand costs and opportunities.
Planning/decision making
Institute a Carbon Neutral Adelaide impact review process at an early stage ahead of new developments/ decisions impacting on the emissions profile of the city.
To ensure that opportunities for abatement are fully explored in advance, and at an early stage, to enable designs, projects to be optimised at low cost, and to avoid emissions lock-in.
Planning/decision making
Mandatory design competitions for major developments.
Based on the City of Sydney model, developments above a certain value threshold, or which require planning scheme amendments, are required to undergo a public tender for design services against agreed criteria (including low/zero carbon performance).
Waste Accelerate waste minimisation opportunities.
Examples could include construction waste re-use, more green waste diversion, higher recycling rates, enhanced food waste minimisation (eg, ‘second bite’ style initiatives)
Green infrastructure
Tree planting on streets and parklands; rooftop gardens; urban community food gardens.
These offer multiple benefits including reduction of urban heat island effects, reduced cooling energy use in summer, resident attraction, improved pedestrian comfort, reduced reliance on transport of imported food, community engagement and participation, education.
Research Establish a zero carbon research network across key Adelaide and South Australian institutions.
To ensure that local knowledge and skills are harnessed for the identification of abatement opportunities.
Public/stakeholder education
Separate from consultation, the Government should design and roll out a public education campaign about the fundamentals, including climate change but also structural adjustment in the economy.
It should not assume that people fully and understand key concepts and words in this area, but rather actively manage the community debate in this area, with the aim of lifting commitment and engagement.

pitt&sherry ref: HB15535H002 final rep 31P Rev00/PH 79
6. Conclusions and Recommendations
6.1 Summary and Conclusions
This Report confirms that it is indeed feasible for Adelaide to achieve the target of becoming the world’s first carbon neutral city before 2020. The Report outlines the broad pathways and provides an overview of the key measures for achieving this outcome.
Context
Chapter 1 places the Carbon Neutral Adelaide into its wider context of climate change, but also of the structural adjustment pressures affecting the South Australian people and economy. A key strategic objective is not only to address the critical issue of climate change, but also to reinvigorate the Adelaide and South Australian economy, building its competitiveness and resilience in the emerging, low-carbon global market place. The Carbon Neutral Adelaide strategy offers short term benefits, such as energy cost savings and enhancements to the liveability of the city, but will also help create a sustainable long term basis for future employment and wellbeing. Chapter 1 notes that cities (and regions) are key drivers of global action on climate change. This reflects their large influence over global emissions – estimated at 70% of global total – but even more importantly, it reflects their leadership and willingness to accept accountability for working the necessary changes in local – and eventually global – economies. Sydney and Melbourne are both members of the C40 Cities Climate Leadership Group and also the newly formed Carbon Neutral Cities Alliance. There may be advantage in Adelaide considering joining one or both groups, including to benefit from ongoing projects to develop an agreed and shared methodologies for reporting progress against their carbon abatement targets. With Melbourne targeting carbon neutrality by 2020, we describe in some detail their approach. Melbourne’s 2020 target is the nearest term one we have been able to identify, and essentially sets the benchmark for Adelaide. While Melbourne’s emissions are rising, not falling, it has indicated an intention to use offsets to reach its 2020 target. Other cities such as Copenhagen are targeting carbon neutrality but without the use of offsets, in their case by 2025.
Doing the maths
Chapter 2 sets out how Adelaide can validate a claim of carbon neutrality. It covers the basics of carbon accounting, including recommending that Adelaide retains its current use of the World Resources Institute’s Global Protocol for Community-Scale Greenhouse Gas Emissions Inventories (GPC). It makes a number of recommendations for enhancements that would increase its already high integrity. We also note that emissions inventories will need to be compiled annually in future, to enable progress towards the carbon neutral target to be monitored and the strategy refined as necessary.
Emissions trends – business as usual
Chapter 3 describes Adelaide current emissions profile and trends since 2007, which is the base year for this study. It is clear that commercial buildings and transport are by far the dominant sources and drivers of emissions growth in Adelaide. This indicates that these sectors must the primary focus of any abatement strategy, and this is reflected in the measures set out in Chapter 5 in particular. Also, it is evident that total emissions have fallen over the period 2007 – 2013 due to two key factors: the decline in the emission intensity of electricity supplied to Adelaide (due to the growth of renewable electricity

pitt&sherry ref: HB15535H002 final rep 31P Rev00/PH 80
production in South Australia) and also a reduction in electricity use in the commercial, residential and industrial sectors. This latter trend has been seen widely across Australia, reflecting the impact of energy efficiency policy measures, but also the impact of the electricity price rises that occurred across Australia, and including in South Australia, over this period. Still, the reduction in emissions and recent reduction in energy use in the stationary energy sector occurred despite growth in many factors – the floor area of the city, its working and residential population, and overall economic activity. This provides a strong base upon which to build a carbon neutral strategy. Finally, Chapter 2 includes the results of our initial emissions projections model build. This model projects emissions by sector and fuel annually to 2050. It draws heavily on similar work by the Adelaide City Council, and we wish to acknowledge the close collaboration that ACC offered to pitt&sherry during this project. At this stage, the projections are largely based on a ‘frozen efficiency’ scenario – that is, the emissions that would occur if the emissions-intensity of activity did not improve through time. A key next step is to make a full ‘business-as-usual’ projection, taking into account not only the impacts of existing policy measures at all levels of government, but also known and expected technological and structural changes impacting on Adelaide’s future emissions. We have made ‘BAU’ projections for the stationary energy sector, however, and this shows that there is a danger of emissions growth in this sector resuming its historical upward path – in the absence of new and additional measures – and this primarily reflects that current weakening of the national policy environment, including the removal of carbon pricing, weakening of the national Renewable Energy Target and the stagnation of national energy efficiency policies in all sectors. The model treats emissions growth drivers as endogenous, meaning that the impact for emissions growth of changes in the floor area of the city, in economic activity (gross regional product) and in the residential and working/visitor population can be readily demonstrated.
Key success factors
Chapter 4 sets out an approach to developing a Carbon Neutral Adelaide strategy that engages and excites a wide range of communities and stakeholders. We set out our assessment of the factors that will determine the quality and success of the overall strategy. The key ingredients we identify are leadership; clarity about the values and character of the responses that the Government wishes to see emerge in response to this strategy; genuine engagement, inquiry and inclusiveness, to ensure that all communities have the opportunity to contribute to defining and implementing the strategy. We suggest a set of objectives, decision criteria and KPIs for the strategy; and note the need for transparency in its governance and management, in order to attain and maintain commitment and focus. We also suggest some ‘capacity building’ measures to strengthen the community’s overall capacity to deliver zero carbon innovation. Chapter 4 ends with description of the outcomes of the Leaders and Leading Thinkers Workshop held in Adelaide on 8 May, and also an overview of the range of abatement measures that could be considered.
Key Abatement Measures
In Chapter 5, we describe in some detail the key measures that are likely to form the main lines of the Carbon Neutral Adelaide strategy. These include:
100% renewable electricity;
An energy efficiency built environment;
Emissions-free urban mobility;
Iconic offsets. For each we describe the nature of the opportunity or opportunities, key measures that could be used to access the opportunities, and provide an indication of the expected impact and cost effectiveness of each. Section 5.5 shows an indicative pathway – a waterfall chart and a wedges chart – indicating the

pitt&sherry ref: HB15535H002 final rep 31P Rev00/PH 81
likely contribution of each measure to the overall task of achieving carbon neutrality before 2020, noting that the actual results will depend upon the detail of the measures adopted. We have recommended a significant engagement and consultation phase prior to alighting on a final set of measures, and then that further detailed analysis is undertaken to inform the selection and micro-design of the preferred intervention set. This Chapter ends with the reminder that many other measures, beyond the bigger four, may find their way into the preferred set, as they may be very cost effective, strategic or bring a range of co-benefits beyond their abatement impacts.
6.2 Recommendations
This final section summarises the advice and recommendations embedded throughout the report on how to take the Carbon Neutral Adelaide strategy forward. The recommendations are grouped by theme and are not prioritised.

pitt&sherry ref: HB15535H002 final rep 31P Rev00/PH 82
Table 6.1: Recommendations
Theme Recommendation Comments
Carbon neutrality
1. Set a target date before 1/1/2020, with the final date to be considered by Government following further analysis of optimal pathways and costs.
Melbourne is targeting 1/1/2020, and this currently sets the outer boundary of Adelaide’s target date. We note that the costs of achieving carbon neutrality will not vary greatly regardless of whether the target date is 2019 or 2018, for example, as there is limited time between now and these dates to influence the emissions trajectory.
Carbon neutrality
2. That the Government of South Australia/ACC monitor ongoing developments with international reporting methodologies – notably those of the C40 and Carbon Neutral Cities Alliance – and consider further adjustments to its own methodology, where warranted, to maintain consistency with other cities (including Melbourne and Sydney).
Using a methodology that is consistent with other major cities reduces the risk of eventual claims of carbon neutrality being criticised by those cities.
Carbon neutrality
3. Adelaide may wish to consider joining at least the Carbon Neutral Cities Alliance, and potentially also the C40.
Primary benefit is confidence that the accounting basis of Adelaide’s future claim of carbon neutrality will be accepted as credible by other key cities. In addition, there will be learning benefits from participation.
Success/quality factors
4. We recommend that the Government:
Maintains an inclusive, bottom-up approach to the development and delivery of this strategy, including making a clear statement of the values and character of the responses that it wishes to see embodied in it;
Allows sufficient time – at least 6 months – for inquiry, research, analysis and widespread engagement with the broadest possible spread of communities...and not only those who self-identify as stakeholders. A second round of consultation on the ‘micro-design’ of preferred measures is recommended – and this could be limited to more directly-affected stakeholders;
Ensures that there is strong but also inclusive governance of the process of developing and implementing the strategy, along with transparent and regular progress reporting;
Ensures that the strategy development process – including community engagement process but also data compilation, research and analysis – is adequately resourced;
Agrees and publicises a set of decision-making criteria, including objectives and KPIs, to clearly communicate to all parties how measures will be selected and their performance assessed through time;
Recognises the need for various kinds of ‘capacity building’, as part of this strategy. This should include at least:
o A community education program, to ensure that the underlying need and rationale for the strategy is clearly understood (including ensuring that the key words and concepts used in the strategy are widely understood).
o Engaging actively in the public debate and not allowing criticism (whether reasoned or otherwise) of the strategy to go unanswered.
o A willingness to assist specific sectors to build their capacity in a more targeted way – eg, being responsive to requests for assistance, at a minimum,

pitt&sherry ref: HB15535H002 final rep 31P Rev00/PH 83
Theme Recommendation Comments
or actively targeting communication and capacity building strategies for certain sectors.
Recognises the importance of delivering visible and tangible outcomes and quick wins, to help reinforce the credibility of the overall strategy and reduce cynicism;
Identifies opportunities for community and government leaders and institutions to model appropriate (low/zero carbon) behaviours, and avoid high-carbon ones to the extent possible, in order to build and maintain credibility
Emissions reporting
5. Retain the Greenhouse Gas Protocol for Community-Scale Greenhouse Gas Emission Inventories, or GPC, as the basis for reporting emissions and tracking progress towards carbon neutrality.
This framework closely aligns with the IPCC 2006 inventory methodology used by Australia and other (Annex 1) signatories to the UNFCCC.
Emissions reporting
6. That ACC make a number of enhancements to its current inventory approach:
Prepare an inventory each year (to enable progress tracking);
That the inventory be expanded to include all seven classes of greenhouse gases covered by the Kyoto Protocol, subject to further investigation of data availability;
Investigate the ‘market-based’ method of reporting Scope 2 (electricity emissions);
Adopt the full Basic+ reporting methodology under the GPC;
Estimate and include Scope 1 emissions associated fugitive emissions, notably of methane from gas use;
Consider reporting Scope 3 emissions associated with water consumption inside the city
Consider investigating and reporting Scope 3 aviation emissions
The market-based method of Scope 2 reporting may provide greater emissions benefits when contracting for renewable electricity supply and recognises the contribution of embedded PV in the city.
Reporting the full scope of gases, emission sources and sectors under the GPC will reduce the risk of criticism of carbon neutrality claims, and also open up additional abatement opportunities (eg, carbon sequestration inside the city boundary).
Reporting emissions associated with water consumption is not required under GPC, but is reported by Melbourne, and water pumping is a major emissions generator for South Australia/Adelaide.
Emissions reporting
7. Once the applicable inventory methodology changes are implemented:
backcast the changes to past inventories for each year back to 2007, if possible, or at least for those years for which an inventory was produced;
Also, document a detailed set of methodologies, or a ‘Handbook’, to assist in the accurate and consistent compilation of annual inventories.
Backcasting the revised inventory methodology would overcome a discontinuity in the time series induced by a change of methodology for the 2012-13 inventory.
Documenting a detailed set of methodologies and data sources will ensure that future inventories to be compared and aligned with those of other cities, as needed, and will meet the transparency requirements of the GPC, helping to support a claim of carbon neutrality.
Offsets 8. Agree an offsets policy for this strategy that delivers integrity to the claim of carbon neutrality.
This should be based on high quality, verifiable and additional abatement projects certified under Australia’s National Carbon Offset Standard.
E: [email protected] W: www.pittsh.com.au
incorporated as Pitt & Sherry (Operations) Pty Ltd ABN 67 140 184 309
transport | community | industrial & mining | carbon & energy
Brisbane Level 2 276 Edward Street Brisbane QLD 4000 T: (07) 3221 0080 F: (07) 3221 0083 Canberra LGF, Ethos House 28-36 Ainslie Place Canberra City ACT 2601 PO Box 122 Civic Square ACT 2608 T: (02) 6274 0100
Launceston Level 4 113 Cimitiere Street PO Box 1409 Launceston TAS 7250 T: (03) 6323 1900 F: (03) 6334 4651 Melbourne Level 1, HWT Tower 40 City Road Southbank VIC 3006 PO Box 259 South Melbourne VIC 3205 T: (03) 9682 5290 F: (03) 9682 5292
Devonport Level 1 35 Oldaker Street PO Box 836 Devonport TAS 7310 T: (03) 6424 1641 F: (03) 6424 9215 Hobart 199 Macquarie Street GPO Box 94 Hobart TAS 7001 T: (03) 6210 1400 F: (03) 6223 1299
Contact Philip Harrington Principal Consultant – Carbon & Energy [email protected] (03) 6210 1489 0419 106 449