
Carbon Nanofiber with Selectively Decorated Pt Both on...
17
Carbon Nanofiber with Selectively Decorated Pt Both on Inner and Outer Walls as an Efficient Electrocatalyst for Fuel Cell Applications Beena K Balan, Sreekuttan M Unni, and Sreekumar Kurungot* Abstract A novel electrocatalyst with excellent Pt dispersion on the inner and outer wall of a carbon nanofiber (CNF) was prepared by a modified polyol process in which both the surface tension and polarity characteristics of the medium were properly adjusted to favor solution entry into the tubular region by capillary filling and homogenous wetting of the inner wall surface by the solvents. The pristine CNF, which possesses inherently active inner wall surface and inactive outer wall surface, lead to selective Pt deposition along the inner wall, whereas activation of the outer wall with chemical functionalization resulted into excellent dispersion of Pt along both the inner and outer walls. Structural and morphological characterizations using high resolution transmission electron microscopy (HRTEM) and X-ray diffraction (XRD) revealed that when Pt could be dispersed along the inner as well as the outer walls of CNF, the Pt particle size reduces to almost half as compared to the one with Pt decoration only along a single wall of the substrate material. Further, electrochemical studies using cyclic voltammetry (CV) and rotating disk electrode (RDE) measurements revealed enhanced methanol oxidation and oxygen reduction properties, respectively. The electrochemical active area obtained for the catalyst with both inner and outer wall Pt decoration is nearly two times higher than that corresponding to the one with only inner wall Pt decoration. Similarly, the rate constant for oxygen reduction reaction displayed by this sample was four times higher in comparison with the sample prepared by utilizing only one wall for Pt decoration. Keywords: Carbon nanofibers, Selective decoration, Electrocatalyst, Oxygen reduction, Rate constant. 1. Introduction Platinum supported on carbon has attracted great interest owing to its versatility in catalysis, particularly for fuel cells. 1-3 A great deal of effort has been devoted to improve the performance of Pt in fuel cells. By the advent of nanomaterials, electrode development for fuel cell has been considerably benefited and sizeable performance could be obtained so far even with microgram loading of the Pt catalyst. 4-5 However, looking at the designing of the membrane electrode assemblies (MEAs) for PEMFC on a commercial point of view, apart from controlling the size of Pt and its dispersion, a proper tuning of mass transfer rate is also important. A smooth surface geometry of the carbon support material is always desirable to effectively establish the ionomer-catalyst-gas pore triple-phase boundary around the Pt particles and thereby enable the later to participate in the reaction with a concomitant improvement in the Pt utilization level. 6 In view of overcoming these two prevailing issues on mass transfer and mass activity, one-dimensional nanostructures of carbon such as nanotubes and
Transcript of Carbon Nanofiber with Selectively Decorated Pt Both on...

Carbon Nanofiber with Selectively Decorated Pt Both on Inner and Outer Walls as an Efficient Electrocatalyst for Fuel Cell Applications Beena K Balan, Sreekuttan M Unni, and Sreekumar Kurungot*
Abstract
A novel electrocatalyst with excellent Pt dispersion on the inner and outer wall of a carbon nanofiber (CNF) was prepared by
a modified polyol process in which both the surface tension and polarity characteristics of the medium were properly
adjusted to favor solution entry into the tubular region by capillary filling and homogenous wetting of the inner wall surface
by the solvents. The pristine CNF, which possesses inherently active inner wall surface and inactive outer wall surface, lead
to selective Pt deposition along the inner wall, whereas activation of the outer wall with chemical functionalization resulted
into excellent dispersion of Pt along both the inner and outer walls. Structural and morphological characterizations using
high resolution transmission electron microscopy (HRTEM) and X-ray diffraction (XRD) revealed that when Pt could be
dispersed along the inner as well as the outer walls of CNF, the Pt particle size reduces to almost half as compared to the one
with Pt decoration only along a single wall of the substrate material. Further, electrochemical studies using cyclic
voltammetry (CV) and rotating disk electrode (RDE) measurements revealed enhanced methanol oxidation and oxygen
reduction properties, respectively. The electrochemical active area obtained for the catalyst with both inner and outer wall Pt
decoration is nearly two times higher than that corresponding to the one with only inner wall Pt decoration. Similarly, the
rate constant for oxygen reduction reaction displayed by this sample was four times higher in comparison with the sample
prepared by utilizing only one wall for Pt decoration.
Keywords: Carbon nanofibers, Selective decoration, Electrocatalyst, Oxygen reduction, Rate constant.
1. Introduction
Platinum supported on carbon has attracted great interest owing to its versatility in catalysis, particularly for fuel cells.1-3
A great deal of effort has been devoted to improve the performance of Pt in fuel cells. By the advent of nanomaterials,
electrode development for fuel cell has been considerably benefited and sizeable performance could be obtained so far even
with microgram loading of the Pt catalyst.4-5 However, looking at the designing of the membrane electrode assemblies
(MEAs) for PEMFC on a commercial point of view, apart from controlling the size of Pt and its dispersion, a proper tuning
of mass transfer rate is also important. A smooth surface geometry of the carbon support material is always desirable to
effectively establish the ionomer-catalyst-gas pore triple-phase boundary around the Pt particles and thereby enable the later
to participate in the reaction with a concomitant improvement in the Pt utilization level.6 In view of overcoming these two
prevailing issues on mass transfer and mass activity, one-dimensional nanostructures of carbon such as nanotubes and
nanofibers have triggered wide interest, mainly due to their exciting features such as anisotropy, unique structure and surface
properties.7-9 However, irrespective of all the much hyped advantages of these classes of materials for fuel cell electrode
applications, the inherently low surface area pocessed by many of these materials restricts the amount of active component
like Pt dispersible on these materials. A catalyst with higher carbon to Pt ratio leads to thick layer of catalyst and
concomitantly higher mass transfer and electric resistances. A strategic approach to obviate the issues related to mass
transfer, water management and conductivity is to develop MEAs with thin electrodes by using catalysts pocessing high Pt
loading and dispersion. This enables one to achieve a desired level of Pt loading while restricting the carbon content in the
minimum possible level. Tubular morphologies of some carbon nanomaterials with open tips are interesting in the context of
developing low carbon loaded, metal-rich catalysts since the morphology offers a possibility to access both the inner and
outer surfaces of thin carbon for metal dispersion. However, metal dispersion along the inner wall of such materials can be
accomplished by surmounting the geometry and surface affinity related issues. Even though there have been reports on
introducing nanoparticles inside the tubular morphologies of carbon by different strategies, in most of the cases, the
nanoparticles exist in the form of nanowires, rods or particle aggregates by blocking the tubular channels of the materials.10
In this study, we report a novel electrocatalyst based on a hollow tubular morphology with significantly high Pt dispersion
and active area formed by successfully utilizing the inner and outer walls of the support material. This catalyst has immense
scope as an electrode material for PEMFCs because for a fixed catalyst loading, the available surface area will be doubled
leading to better dispersion and a concomitantly low electrode thickness due to the effective utilization of the carbon surface.
In view of utilizing the outer as well as the inner walls for Pt dispersion, a new type of carbon nanofiber (CNF) having
open tips and comparatively larger inner diameter was purchased and used as the support material for the present study. To
facilitate metal dispersion into the tubular region of the carbon nanofibers (CNF-Pt), simultaneous metal ion dispersion and
reduction was accomplished through a polyol process by carefully optimizing the polyol-water ratio to achieve balanced
surface tension and polarity characteristics. The modification of the polyol process by using a proper composition of polyol
and water is a critical step to facilitate reactants entry into the tubular region and homogeneous wetting of the inner wall
surface by the solvents. To reveal the importance of modifying the polyol process to achieve inner wall Pt deposition, a
catalyst was also prepared by adopting traditional polyol process by using the same carbon substrate and ethylene glycol as
the solvent. Further, to utilize the inactive outer surface for decoration of Pt nanoparticles, chemical functionalization was
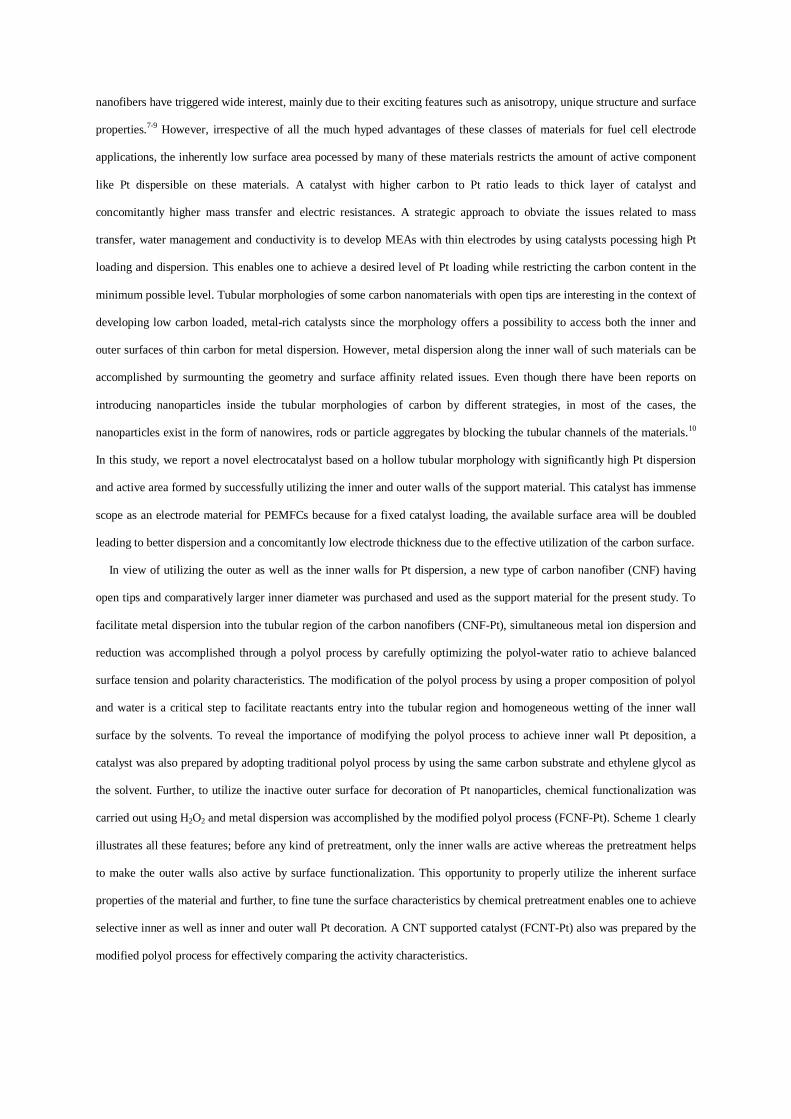
carried out using H2O2 and metal dispersion was accomplished by the modified polyol process (FCNF-Pt). Scheme 1 clearly
illustrates all these features; before any kind of pretreatment, only the inner walls are active whereas the pretreatment helps
to make the outer walls also active by surface functionalization. This opportunity to properly utilize the inherent surface
properties of the material and further, to fine tune the surface characteristics by chemical pretreatment enables one to achieve
selective inner as well as inner and outer wall Pt decoration. A CNT supported catalyst (FCNT-Pt) also was prepared by the
modified polyol process for effectively comparing the activity characteristics.

Scheme 1. Outline of the steps for the preparation of Pt decorated carbon nanofiber. (a) Carbon nanofiber before functionalization, (b) Carbon nanofiber after functionalization, (c) Selective inner wall decoration of Pt on carbon nanofiber, (d) Inner and outer wall decoration of Pt on carbon nanofibers.
2. Materials and Methods
2.1 Functionalization of carbon supports:
For the functionalization of the carbon support, 1 g of the support material was dispersed well in 200 ml of 30 % H2O2
solution. This was then refluxed at a temperature of 60 0C for 5 h. Subsequently, the mixture was filtered, washed with DI
water and dried at100 0C for 5 h.
2.2 Synthesis of electrocatalysts by traditional polyol process:
In a typical synthesis, ethylene glycol was used as the solvent as well as the reducing agent. For the preparation of
40 wt % catalyst, the required amount of support material (CNF, FCNF, and FCNT) was dispersed well in the solvent by
ultrasonication prior to the addition of the Pt precursor. In the next step, the precursor, H2PtCl6 dissolved in the same
solvent, was added drop by drop with stirring. Subsequently, the mixture was kept for stirring for 5 h at ambient
temperature to achieve well dispersion of the components in the mixture. Followed by this ageing process, the mixture
was heated upto 140 0C for 8 h to assure complete reduction of Pt ions. The reaction mixture was then cooled and filtered
though a filter paper (0.2 m pore size). The wet cake was washed repeatedly with hot water and then with acetone to
remove excess solvent. Finally, few more washings with deionized (DI) water were done and the product was dried at100
0C for 5-6 h.
2.3 Synthesis of electrocatalysts by modified polyol process:
To facilitate Pt decoration along the inner as well as the outer wall of the substrate, the electrocatalyst was prepared by
a modified polyol process. In a typical synthesis, the solvent used was 3:2 v/v mixture of ethylene glycol and water. For
the preparation of 40 wt % Pt loaded catalyst, the required amount of support material (CNF, FCNF, and FCNT) was
dispersed well in the solvent mixture by ultrasonication prior to the addition of the Pt precursor. In the next step, H2PtCl6
dissolved in the same solvent mixture was added drop by drop with stirring. Subsequently, the mixture was kept stirring
for 5 h at ambient temperature to achieve well dispersion of the components in the mixture. Especially in case of

nanofibers, this ageing time is important because the precursor solution has to be reached inside the tubes of the support
material. Followed by this ageing process, the mixture was heated upto 140 0C for 8 h to assure complete reduction of Pt
ions. The reaction mixture was then cooled and filtered though a filter paper (0.2 m pore size). The wet cake was washed
repeatedly with hot water and subsequently with acetone to remove excess solvent. Finally, few more washings with DI
water were done and the product was dried at 100 0C for 5-6 h.
2.4 Characterization:
The structure and morphology of these electrocatalysts were characterized using a high resolution transmission
electron microscope (HR-TEM) JEOL model 1200 EX instrument operated at an accelerating voltage of 120 kV. TEM
samples were prepared by placing a drop of the catalyst sample dispersed well in isopropanol onto a carbon-coated Cu
grid (3 nm thick, deposited on a commercial copper grid for electron microscope), dried in air and loaded into the electron
microscopic chamber. X-ray diffraction (XRD) was recorded on a Philips 1730 instrument using Cu-K radiation at a
step of 0.02 0 (2). X-ray photoelectron spectroscopic (XPS) measurements were carried out on a VG Micro Tech ESCA
3000 instrument at a pressure of > 1 x 10⁻⁹ Torr (pass energy of 50 eV, electron take off angle 60 oand the overall
resolution was ~ 0.1 eV).
2.5 Electrochemical Studies:
All electrochemical studies were performed on an Autolab PGSTAT30 (Eco Chemie) instrument using a conventional
three electrode test cell with a reversible hydrogen electrode (RHE) and a platinum foil as the reference and counter
electrodes, respectively. A glassy carbon (GC) electrode for working electrode was polished using 0.3 and 0.05 m
alumina slurries, followed by washing with water and acetone. The working electrode was prepared as follows: 10 l
aliquot of the slurry made by sonicatoing 1 mg of the catalyst in 1 ml isopropyl alcohol was drop-coated on glassy carbon
electrode. After this, 2 l of 0.01 wt % Nafion diluted with ethanol was coated on the surface of the catalyst layer to yield
a uniform thin film. This electrode was then dried in air and was used as the working electrode for all electrochemical
studies. An aqueous solution of 0.5 M H2SO4 was used as the electrolyte for normal cyclic voltammetric and rotating disc
electrode studies. For methanol oxidation, 0.5 M methanol solution was used as the electrolyte with 0.5 M H2SO4 as the
supporting electrolyte. Rotating disc electrode (RDE) studies were carried out using the same setup. Prior to ORR
experiments the electrolyte was deaerated with N2 gas.
3. Results and Discussion
The structure and morphology of the catalyst support as well as the catalyst were explored using HR-TEM.
Accordingly, Figure 1(a-d) shows the HR-TEM images of carbon nanofiber support. It is clear from Figure 1(a) and (b)
that, these nanofibers are having large central hollow core and open tips. The open tips are encircled in Figure 1(a).
Figure 1(c), which is the enlarged view of the inner portion of the nanofiber support, clearly depicts that unlike carbon
nanotubes, which are made by the simple rolling of graphene sheets, this material is made up of truncated conical
graphene layers. Because of this peculiar rolling of graphene sheets, carbon nanofiber exhibits a large central hollow core,

which in turn imposes a significant portion of exposed and reactive edges in the inner channel created within the carbon
nanofibers. However, as can be evident from Figure 1(d), the edge sites on the outer surface of the nanofibers are clearly
covered by the deposition of a pyrolitic carbon layer (duplex structure) induced by the high reaction temperature in the
synthesis of this material. Tibbetts et al. have reported a similar kind of structural features in vapor-grown carbon
nanofibers.11 Deposition of pyrolytic carbon layer on the outer surface of carbon nanofibers during graphitization at high
temperatures has been reported by Paredes et.al and Carneiro et. Al.12-13 This peculiar morphology of the material leaves
its inner wall inherently active and outer wall inert. At the same time, the relatively large inner diameter, open tips, active
inner wall and possibility of activating the inert outer wall by facile chemical treatments make this a potential support
material for effectively dispersing Pt.14
Figure 1. HR-TEM images of (a) Pristine carbon nanofiber support [CNF]; encircled regions represent the open tips of carbon nanofiber support, (b) A single carbon nanofiber with deactivated outer wall due to the deposition of a pyrolitic carbon layer (duplex structure), (c) An enlarged view of inner portion marked by the black box in (b) of carbon nanofiber clearly indicating conical graphene layers, (d) Enlarged view of the portion marked by the blue box in (b) of the nanofiber with active inner wall and inactive outer wall due to the deposition of pyrolitic carbon layer.
Figure 2(a) shows HR-TEM image of Pt nanoparticles dispersed on the pristine nanofiber support (CNF-Pt). It is
evident that Pt nanoparticles are decorated only on the inner wall of the support. As discussed before, in the case of
pristine nanofiber, only the inner wall will be active (due to the presence of the pyrolytic carbon layer on the outer
surface) and the metal dispersion by the modified process will result into a selective decoration only on the inner wall
(CNF-Pt). A closer inspection of Figure 2(b) reveals that these Pt nanoparticles are randomly dispersed with a size
distribution of ca 6-7 nm and some of them aggregate to form larger particles or clusters. Interestingly, it is clear from
Figure 2(c) that after the functionalization, Pt nanoparticles of size ca. 3 ± 0.5 nm are excellently dispersed on the inner as
well as on the outer walls of the nanofiber (FCNF-Pt). Small nanocrystalline catalyst particles are well separated from

each other and monodispersity of nanoparticles is essentially maintained, indicating that the synthesis method could
effectively prevent agglomeration of Pt nanoparticles. The observed uniformity in size and shape of the nanoparticles
could be due to two reasons: first, chemical functionalization leads to the formation of functional group like -OH and -
COOH on the outer surface (as evident from XPS analysis given in SI 2 and 3), which are known to act as the anchoring
sites for catalyst nanoparticles; second, after functionalization since the inactive outer surface has also become active, the
carbon surface area available for holding the metal species is almost doubled and in this way high dispersion quality could
be achieved.14 The selected-area electron diffraction (SAED) pattern [inset of Figure 2(b) and 2(d)] shows three rings
indexed to the {111}, {200} and {220} diffraction, respectively. It can be concluded that the as-prepared Pt nanoparticles
are crystallized in a face-centered cubic (fcc) structure in both the cases, which is in accordance with the XRD pattern
obtained.15
Figure 2. HR-TEM images of (a) CNF-Pt, (b) High magnification image of CNF-Pt, (c) FCNF-Pt, (d) High magnification image of FCNF-Pt. Insets of Figure 1b & 1c are the diffraction pattern of CNF-Pt and FCNF-Pt, respectively
Figure S1 (a) and (b) in the supporting information displays the images of pristine and functionalized nanofiber
supported catalyst synthesized using a conventional polyol process based on solvent like ethylene glycol (polyol) for the
metal dispersion. The images clearly indicate that the dispersion of the Pt particles obtained is very poor and they are
forming islands of nanoparticles by agglomeration, especially in the case of the catalyst synthesized from the pristine
CNF [Figure S1 (a)]. In contrast to this, a slightly improved dispersion can be seen in case of functionalized nanofiber
support [Figure S1 (b)]. The above results point out that the inner wall of the nanofiber can not be accessed using a
traditional polyol process. It may be attributed to the fact that due to the high viscosity of the solvent (for e.g.: ethylene

glycol), the solvent filling into the tube by capillary action is impeded leading to the unutilization of the inner wall for Pt
dispersion.16 The above investigations underline the fact that in this system due the peculiar morphology and contrasting
differences in the activity characteristics of the inner and outer walls, a process modification is important for the
simultaneous metal ion dispersion and reduction. Both the surface tension of the medium and the contact angle between
the liquid and surface play a decisive role to achieve fine metal particle dispersion along the inner wall by significantly
eliminating the possibilities of channel blocking which can be caused by any entrapped particles or their aggregates. Thus,
by an appropriate manipulation of the polyol to water ratio, the capillary action by the tubes can be properly utilized to
suck the solution into the channels of the support material. Our detailed investigations reveal that the metal particle size
and distribution strongly depend on the amount of water addition. When polyol-water v/v ratio is 3:2, small metal
particles are formed whether the metal is supported or unsupported. On the other hand, at still higher water content, even
though fine Pt particles seemed to be formed, their dispersion along the inner and outer walls is poor owing to the increase
in the surface tension of the medium. Therefore, the polyol to water ratio of 3:2 has been assigned as the best solvent
composition with respect to particle size and dispersion resulting from balanced surface tension and wettability
characteristics.
The XRD pattern of FCNF-Pt compared with the CNF-Pt in Figure 3 (a, b) reveals a high degree of crystallinity in both
of the prepared catalysts. XRD patterns for both the samples are consistent with previous reports.17 Both the catalysts
exhibit strong diffractions at around 2 40.1 0, 46.4 0 and 67.7 0, which can be indexed as platinum {111}, {200}, and
{220} reflections, respectively, indicating that the catalysts have face-centered cubic (fcc) structure. Also, the diffraction
peaks of FCNF-Pt are broader than those of the CNF-Pt catalyst. This shows that the average size of the Pt on FCNFs is
smaller than that on CNFs. The average particle sizes of the Pt nanoparticles supported on CNFs and FCNFs estimated
using the Scherrer equation are 6.5 nm and 3.2 nm, respectively. The size of the Pt nanoparticles calculated using XRD is
in good agreement with those obtained from HR-TEM results. The diffraction peak at around 2 26.6 0 of both the
samples is attributed to the carbon nanofiber support.

Figure 3. XRD of (a) FCNF-Pt, (b) CNF-Pt, revealing reflections from (111), (200) and (220) planes.
TGA of both catalysts in flowing air (100 sccm) shows interesting differences in the oxidation behavior as shown in
Figure 4(a) and (b) for CNF-Pt and FCNF-Pt, respectively. The slight initial weight loss till 441 0C, which is more or less
similar for both the samples, is expected to be due to the loss of residual water and functional groups. However, from 468
0C to 800 0C, TGA of CNF-Pt shows only a single stage weight loss during heat-treatment, whereas FCNF-Pt shows clear
two-stage weight loss. Since presence of Pt can facilitate oxidation, a fast decomposition of the Pt decorated surface can
be expected followed by the other parts of the tubes. As the level of Pt dispersion is significantly high on FCNF-Pt, the
oxidation of carbon assisted by Pt was fast in this system and accordingly the TGA profile displayed a quick weight loss
region followed by a tail of the gradual decomposition. Finally, from the residue content, the amount of Pt in case of
CNF-Pt and FCNF-Pt catalyst is quantified to be 39 wt % and 36 wt %, respectively.
Figure 4. Superimposed TG/ DTA curves of (a) CNF-Pt, (b) FCNF-Pt at a heating rate of 10 C/ min to 800 0C under air atmosphere.

Electrochemical Studies
Figure 5 shows the cyclic voltammograms (CV) of nanofiber supported catalysts in comparison with a carbon nanotube
supported catalyst (FCNT-Pt) in 0.5 M H2SO4 solution saturated by ultra-high purity nitrogen at a scan rate of 50 mV/s.
The Pt loadings on the electrode surface for CNF-Pt, FCNF-Pt and FCNT-Pt catalysts are 0.0195 mg, 0.018 mg and
0.0195 mg, respectively. The CV features resemble very similar to that of a polycrystalline Pt electrode in acid solution.18
In the cyclic voltammograms, the H2 region appeared in the potential range of 0.13 V to 0.45 V Vs RHE and oxygen
reduction showed a peak at 0.8 V Vs RHE for all the three catalysts. Even though the voltammetric profiles look similar
for all the three catalysts, significant difference in the current densities can be observed. Further, the electrochemical
active area (EAA) of the Pt evaluated from the electric charge for the desorption of H2 (QH) [assuming that QH = 210
C/cm2 for a smooth polycrystalline Pt] also displayed significant difference.19 The EAA of 233 cm2/mg-Pt obtained for
FNF-Pt is almost two times higher as compared to 107 cm2/mg-Pt obtained for CNF-Pt (pristine support). This
improvement in Pt area when Pt is dispersed by utilizing two walls instead of one is in agreement with the Pt particle size
distribution already observed by HR-TEM analysis. The conventional CNT catalyst (FCNT-Pt) displayed an active Pt
area of 207 cm2/mg-Pt which was lower than that of FCNF-Pt. It should be mentioned that the Pt dispersion quality was
poor on CNT compared to that on CNF and fine Pt particles appeared as clusters at different locations of this system.
Therefore, consistent results were not obtained using this system. Along with the significantly high EAA of Pt possessed
by FCNF-Pt, the high current density obtained also underlines the excellent performance of this catalyst. The current
density observed for FCNF-Pt is 640 mA/cm2 which is 200 mA/cm2 and 100 mA/cm2 higher than that the respective
values for CNF-Pt (420 mA/cm2) and FCNT-Pt (550 mA/cm2).
Figure 5. Superimposed cyclic voltammograms of CNF-Pt, FCNF-Pt and FCNT-Pt coated on a 3 mm diameter glassy carbon tip in 0.5 M in H2SO4 using RHE as reference electrode and Pt foil as counter electrode at room temperature; sweep rate 50mVs-1. Inset of the figure is the expanded H2 region of CNF-Pt and FCNF-Pt, clearly indicating almost double electro-active area of FCNF-Pt.

Figure 6 compares the methanol oxidation reactions of all the three catalysts in 0.5 M methanol solution with 0.5
M H2SO4 as the supporting electrolyte. The high electrocatalytic activity of FCNF-Pt is confirmed by its superior
performance for the electro-oxidation reaction of methanol. The onset potential for methanol oxidation on both the
nanofiber supported catalysts is (0.39 V), which is 200 mV more negative than that (0.59 V) observed on the FCNT-
Pt system. The reduction in the onset anodic potential shows the significant enhancement in the kinetics of the methanol
oxidation reaction. The cyclic voltammetry for methanol oxidation obtained here is characterized by well-separated
anodic peaks in the forward and reverse scans similar to that of the methanol oxidation reaction on Pt-based
electrocatalysts in acid media.20 The magnitude of the anodic peak current in the forward scan is also directly proportional
to the amount of methanol oxidized at the respective electrocatalysts. Accordingly, in the forward scan, methanol
oxidation produces prominent anodic peaks with current densities 2.2, 1.9 and 1.6 mA cm-2 for FCNF-Pt, CNF-Pt and
FCNT-Pt, respectively. The significantly negatively shifted onset potential and high anodic peak current on the FCNF-Pt
electrode confirms that FCNF-Pt exhibits higher electrocatalytic activity as compared to the other two catalysts.21 It can
also be concluded from the above results that carbon nanofiber supported catalysts have higher electrocatalytic activity for
methanol oxidation than the conventional CNT supported electrocatalyst. Moreover, in slight contrast to the observed
oxygen reduction property of these catalysts, which will be discussed in the following section, better performance of the
nanofiber supported catalysts towards methanol oxidation can be explained as follows: in case of pristine nanofiber
supported catalysts the Pt nanoparticles are inside the wall of the fibers and the reacting species have to be diffused into
the walls of the fibers so as to be accessible for the reaction. Since the penetration power of methanol is high as compared
to H2SO4, it is relatively easy for methanol to reach inside the walls and can effectively be oxidized by Pt deposited along
the inner as well as the outer walls.
Figure 6. Current – Potential curves for methanol oxidation of CNF-Pt, FCNF-Pt and FCNT-Pt coated on a 3 mm diameter glassy carbon tip in 0.5 M methanol + 0.5 M H2SO4 using RHE as reference electrode and Pt foil as counter electrode at room temperature at a sweep rate of 50 mVs-1.

Figure 7 shows hydrodynamic voltammograms recorded using a rotating disk electrode (RDE) at 2500 rpm for
oxygen reduction reaction (ORR) on the catalyst modified glassy carbon (GC) disc electrode in 0.5 M H2SO4 at room
temperature. The observed ORR limiting current density is in the order FCNF-Pt > FCNT-Pt > CNF-Pt. In addition to the
limiting current, the onset potential and half wave potentials are also indicative of the performance of an electrocatalyst.22
In the present case, even though there is only slight difference in the onset potentials, significant difference in the half
wave potentials can be observed. The corresponding values are 0.820 V, 0.806 V and 0.801 V for FCNF-Pt, FCNT-Pt and
CNF-Pt, respectively. From these results, the lowest half wave potential displayed by CNF-Pt can be accounted by a
dominant effect by diffusion limitation in the aqueous solution of H2SO4. However, because of the high degree of Pt
dispersion on FCNF-Pt, this system could manage to display excellent performance irrespective of the diffusion effects
that still could act as a limiting factor in accessing the channels of the tube. Thus, it can be clearly concluded from these
results that the best catalytic activity is obtained for FCNF-Pt which is in excellent agreement with the CV results.
Bearing in mind the observed higher methanol oxidation activity for CNF-Pt, compared to FCNT-Pt, the reverse order in
their activity towards ORR in 0.5 M H2SO4 clearly suggests that a reaction medium with lower surface tension like
methanol is more effective in accessing Pt particles inside the tubes.
Figure 7. Polarization curves obtained with a rotating disk electrode for the ORR on (a) CNF-Pt, (b) FCNT-Pt and (c) FCNF-Pt in O2-saturated 0.5 M H2SO4. Sweep rate: 10 mV/s.
The RDE measurements complemented by the corresponding Koutecky-Levich plot (plot of 1/jRDE Vs -1/2, where jRDE
is the current density and is the rotation speed) can furnish a direct comparison of electrochemical performance in a

straightforward manner.23 Assuming that the resistance of Nafion film coated on the catalyst layer is negligible, kinetic
current densities can be adjusted to the simple Koutecky-Levich equation.24
2/16/10
3/2062.0
11111
vCnFADjjjj kdk
Thus a plot of 1/jRDE vs. -1/2 will give a straight line whose intercept corresponding to 1/jk and slope corresponding to
1/jd. As already described in literature, at infinite rotation speeds, current can be considered as kinetic current free from
external mass transfer limitation. From the kinetic current, the apparent rate constant k can be evaluated using oxygen
solubility and diffusion coefficient of 1.22 x 10⁻⁶ mol/cm3 and 1.04 x 10⁻⁵ cm2/s, respectively obtained in 0.5 M H2SO4 at
25 0C.25 Accordingly, Figure 8 shows the Koutecky-Levich plots of all the three catalysts at a potential of 0.6 V. The
rate constants are respectively 1.91 x 10⁻³ cm/s, 8.46 x 10⁻³ cm/s1 and 3.88 x 10⁻³ cm/s for CNF-Pt, FCNF-Pt and FCNT-
Pt. Thus, the four times higher rate constant on FCNF-Pt, compared to CNF-Pt clearly indicates the superior efficiency for
ORR of FCNF-Pt, possibly obtained by the excellent dispersion quality of Pt along the wall surfaces of the substrate.
Figure 8. Koutecky-Levich plots obtained from RDE studies in O2-saturated 0.5 M H2SO4 for (a) CNF-Pt, (b) FCNT-Pt and (c) FCNF-Pt at a potential of 0.6 V. Sweep rate: 10 mV/s. In the inset of the figure the limiting current values obtained from the Koutecky-Levich plots of the three catalysts are plotted against the corresponding potential values.
Further, the kinetic current values obtained by RDE are plotted against the corresponding potentials to understand the
current-voltage relation as in the case of a polarization plot in normal fuel cell experiments. The results are presented in

the inset of Figure 8. As expected, the superior performance obtained for FCNF-Pt can be visualized clearly from this data
where the current obtained per mg of Pt is notably high as compared to the other two electrocatalysts at any potential
point in the represented potential window in the figure. Moreover, the least value of current obtained for pristine
nanofiber supported catalyst may be attributed to the diffusional limitation by the aqueous reaction medium. However, the
gaseous or vapor atmosphere in PEMFCs based on direct hydrogen or alcoholic fuels is more suited to effectively access
the hollow core of the material and in that way the diffusion effects will be less pronounced and in that way higher cell
performance can be expected. Research in this direction is currently being progressed in our lab.
Conclusions
In conclusion, we here demonstrated a new strategy for the selective decoration of Pt on the inner and outer walls of CNF
by a proper tuning of the reaction medium composition to have a balanced surface tension and polarity characteristics. Pt
decoration along the inner and outer walls of the substrate with significantly fine Pt particle dispersion could be maintained.
The cyclic voltammetry and RDE studies demonstrated that the new catalyst prepared with Pt nanoparticles on both the
walls showed almost double electrochemical active area and four times higher rate constant as compared to the one with only
single wall Pt decoration. The enhanced electrocatalytic activity displayed by these materials opens up great scope in fuel
cell electrode fabrication because appropriate Pt loadings can be achieved at significantly low carbon content in the system.
Also, the gaseous or vapor atmosphere in PEMFCs based on direct hydrogen or alcoholic fuels is more suited to effectively
access the hollow core of the material.
ACKNOWLEDGMENT
Beena K. Balan gratefully acknowledges the Council of Scientific and Industrial Research (CSIR), New Delhi for the
award junior research fellowship. The authors also thank Dr. S. Sivaram, Director NCL, for the start-up grant and Dr. K.
Vijayamohanan for helpful discussions.
References:
[1] Lin, Y. H.; Cui, X. L.; Yen, C.; Wai, C. M. J. Phys. Chem. B 2005, 109,14410.
[2] Li , W.; Liang , C.; Qiu , J.; Zhou , W.; Han , H.; Weia, Z.; Sun, G.; Xin , Q. Carbon 2002,
. 40, 791
[3] Lin, S. D.; Hsiao, T.C.; Chang, J.R.; Lin, A. S. J. Phys. Chem. B 1999, 103, 97.
[4] Zhang, X.; Lu, W.; Da, J.; Wang, H.; Zhao, D.; Webley P. A. Chem.Commun. 2009,125,
195.
[5] Tang, J. M.; Jensen, K.; Waje, M.; Li, W.; Larsen, P.; Pauley, K.; Chen, Z.; Ramesh, P.; Itkis, M.E.;
Yan, Y.; Haddon, R. C. J. Phys. Chem. C 2007, 111, 17901.
[6] Wilson, M. S.; Gottesfeld, S. J. Applied Electrochemistry 1992, 22, 1.

[7] Zhao, G.; He, J.; Zhang, C.; Zhou, J.; Chen, X.; Wang, T. J. Phys. Chem. C 2008, 112,
1028.
[8] Wang, X.; Li, W.; Chen, Z.; Waje, M.; Yan, Y. J. Power Sources 2006, 158, 154.
[9] Yang, W.; Wang, X.; Yang, F.; Yang, C.; Yang, X.; Adv. Mater. 2008, 20, 2579.
[10] Pan, X.; Bao, X.; Chem. Commun. 2008, 47, 6271.
[11] Tibbetts, G. G.; Doll, G. L.; Gorkiewicz, D.W.; Moleski, J. J.; Perry, T. A.; Dasch, C.J.; Balogh M.
J. Carbon 1993, 31, 1039.
[12] Paredes, J.I.; Burghard, M.; Mart ı́nez-Alonso, A.; Tasc´on, J.M.D. Appl. Phys. A. 2005, 80, 675.
[13] Carneiro, O. C.; Kim, M. S.; Yim, J. B.; Rodriguez, N. M.; Baker, R. T. K. J. Phys. Chem. B
2003, 107, 4237.
[14] Joo, S. H.; Choi, S. J.; Oh, I.; Kwak, J.; Liu, Z.; Terasaki, O.; Ryoo, R. Nature 2001, 412, 169.
[15] Mu, Y.; Liang, H.; Hu, J.; Jiang, L.; Wan, L. J. Phys. Chem. B. 2005, 109, 22212.
[16] Zhou, Z.; Wang, S.; Zhou, W.; Wang, G.; Jiang, L.; Li, W.; Song, S.; Liu, J.; Suna, G.; Xin, Q.
Chem. Commun, 2003, 394.
[17] Mahima, S.; Kannan, R.; Vijayamohanan, K. Langmuir 2008, 24, 3576.
[18] Susut, C.; Chapman, G.B.; Samjeske, G.; Osawac, M.; Tong, Y. Phys. Chem. Chem. Phys.
2008, 10, 3712.
[19] Kim, H.J.; Kim, D.Y.; Han, H.; Shul, Y.G. J. Power Sources 2006, 159, 484.
[20] Jiang, S. P.; Liu, Z.; Tang, H. L.; Pan, M. Electrochim. Acta 2006, 51, 5721.
[21] Yoo, E.; Okata, T.; Akita, T.; Kohyama, M.; Nakamura, J.; Honma, I. Nano Lett. 2009, 9,2255.
[22] Matsumoto, T.; Komatsu, T.; Arai, K.; Yamazaki, T.; Kijima, M.; Shimizu, H.; Takasawa, Y.;
Nakamura, J. Chem. Commun. 2004, 7, 840.
[23] Komanicky, V.; Menzel, A.; You, H. J. Phys. Chem. B 2005, 109, 23550.
[24] Paulus, U. A.; Wokaun, A.; Scherer, G. G.; Schmidt, T. J.; Stamenkovic, V.; Markovic, N. M.;
Ross P. N. Electrochim. Acta. 2002, 47, 3787.
[25] Markovic, N. M.; Gasteiger, H. A.; Ross, P. N. J. Phys. Chem. 1995, 99, 3411.

Supporting Information
Results:
Figure S1: HR-TEM images of (a) of pristine (CNF-Pt) and (b) functionalized (FCNF-Pt) nanofiber supported catalyst synthesized using a conventional polyol process.
Figure S2: XPS spectra of CNF-Pt where core levels of (a) C1s (b) O1s and (c) Pt4f are deconvoluted separately the circles represent the experimental data, red line represent the fitting data for overall signal, the black lines are the deconvoluted individual peaks for different species present in the sample.
The XPS analysis of core level spectra of CNF-Pt (Figure 4) and FCNF-Pt (Figure 5 confirms the formation of Pt-
carbon nanofiber hybrid electrocatalyst. The peak position, line shape and peak to peak separation are the standard

measure of the Pt oxidation state. For example, the B.E. for Pt4f doublet (71 eV and 75 eV) is consistent with Pt0oxidation
state in case of both the catalysts [Figure 4(c) and5(c)]. Interestingly, this analysis suggests that, a slight shift in the
binding energy (BE) of 4f peak occurs due to the catalyst support, where a charge transfer could occur from the electron
rich nanofiber support to the Platinum metal.
Figure 4(a) shows C1s XP spectrum of CNF-Pt, where the deconvolation of the peak with respect to Gaussian fitting
shows two distinct peaks at 284.5 eV and 286.1 eV, respectively. We have taken 284.5 eV peak as the reference peak for
sp2 carbon of nanotubes, while peak at 286.1 eV is attributed to the C1s peak for physisorbed C-Pt linkage. In case of
FCNF-Pt [Figure 5(a)] other than the above mentioned two peaks, two peaks at 288.2 eV and 289.7 eV is also observed.
These peaks confirms the presence of other oxygenated functional groups like –OH, -COOH on the nanofiber side walls
after functionalization and since the peak positions are assigned on the basis of the C1s peak at 284.5 eV, all these do not
affect the other B.E. values.
A comparison of O1s XP spectra of both samples also confirms the functionalization of nanofiber support.
Accordingly, Figure 4(b) shows two different peaks after a similar fitting procedure; a peak at binding energy 532.4 eV
could be due to the presence of small amount of oxygenated species and the peak at 535.5 eV might be due to the
adsorbed moisture. However, XP spectra of FCNF-Pt [Figure 5 (b)] clearly indicate two different functionalities after the
functionalization. Accordingly, a peak at 531.2 eV could be assigned to the double bonded oxygenated groups like –
COOH. Similarly, a peak at 533.2 eV could be assigned to the single bonded oxygenated species like –OH species. In
addition, a broad and less intense peak at 535 eV is assigned to the adsorbed moisture.

Figure S3: XPS spectra of FCNF-Pt where core levels of (a) C1s, (b) O1s and (c) Pt 3d are deconvoluted separately; the circles represent the experimental data, red line represents the fitting data for overall signal, the black lines are the deconvoluted individual peaks for different species present in the sample.


