
Capstone2015 arashkamiar
38
The Impact of Three Strike Laws on Crime Rates, Imprisonment Rates and Average Time Served Public Policy Institute 2015 Capstone Project Arash Kamiar
-
Upload
arash-kamiar -
Category
Documents
-
view
212 -
download
0
description
Â
Transcript of Capstone2015 arashkamiar

The Impact of Three Strike Laws on Crime Rates, Imprisonment Rates and Average
Time Served
Public Policy Institute
2015 Capstone Project
Arash Kamiar
ABSTRACT
This study analyzes 29 states that implemented three-strike laws (TSL) between the years
of 1994-1996 and compares the imprisonment rate, crime rates and length of prison terms
to 19 states that have not implemented TSLs, in order to determine the efficacy of this
type of habitual offender law. Calculations were made on the crime and imprisonment
rate Pre-1994, 1978–1993, and then again in Post-1996, 1997-2012, for both groups. The
percent change for each crime category and imprisonment rate was calculated and
compared to determine if TSLs had a brought about a distinguishable impact on crime.
For all crime categories, except one, non-TSL states seem to outperform TSL states in
reducing crime. Both groups experienced increases in their imprisonment rate. Non-TSL
states had a higher rate of increase. This would seem to indicate that TSLs are not
necessarily the cause of increased imprisonment rates. When reviewing the average
length of time served, TSL and non-TSL states have similar prison terms for property and
violent crimes. This similarity is seen for both groups before implementation of TSLs as
well as after implementation of TSLs.

The Impact of Three Strike Laws on Crime Rates, Imprisonment Rates and Average Time Served
Introduction The purpose of this study is to contribute to the literature an analysis of what are
commonly referred to as three strike laws (TSL), a type of habitual offender law. This study
looks at the 29 states that have implemented TSLs and compares the imprisonment rate, crime
rates and length of prison terms to 19 states that have not implemented TSLs to determine the
efficacy of such laws.
Despite 45 years of unprecedented growth in the American imprisonment rate there was a
fixed period of time when the imprisonment rate was mostly static. From 1925 to 1972 the
number of prisoners fluctuated around 110 to 137 for every 100,000 citizens (National Research
Council, 2014). As of 2012, the United States has more people in jail by percentage and total
numbers than any other nation in the world. State and federal policies have led to a 266 percent
increase in the imprisonment rate from 131 prisoners in 1978 to 480 state and federal prisoners in
2012. The International Centre of Prison Studies, a partner of the University of Essex, pegs the
number of all incarcerated people in the United States at 737 for every 100,000 citizens in 2012.
The nation with the next highest imprisonment rate is Russia at 615 for every 100,000
citizens in 2012. The American prison epidemic when compared to other “westernized”
European regions/nations becomes even more apparent. By Comparison, the United States has
over 400 percent more people in prison for every 100,000 than the next highest, England/Wales,
where 148 out of 100,000 citizens are imprisoned (See Table 2).
From 1978 to 1993, crime rates increased but not with as much magnitude as the
imprisonment rate. For instance, violent crime grew by 34 percent and the imprisonment rate
grew by 63 percent from 1978-1993. In 1994-2012, the violent crime rate had fallen by nearly 85
percent and the property crime rate had fallen by 63 percent but the imprisonment rate still

The Impact of Three Strike Laws on Crime Rates, Imprisonment Rates and Average Time Served
increased by nearly 19 percent (see Table 1). Uniform Crime Statistics defines “violent crime”
as any crime of murder, rape, robbery or aggravated assault. “Property crime” includes crimes of
burglary, larceny-theft and motor vehicle theft.
Table 1: Comparing violent crime and property crime rates to the imprisonment rate.
Year Violent Crime Rate
Percent Change Property Crime Rate
Percent Change Imprisonment Rate
Percent Change
1978-1993 34.30% 5.33% 63.61% 1994-2012 -84.44% -62.99% 18.62% 1978-2012 -28.66% -62.37% 72.29%

The Impact of Three Strike Laws on Crime Rates, Imprisonment Rates and Average Time Served
Table 2: Nations with the highest prison population and imprisonment rate as of 2012.
"WESTERN" NATIONS RANKED BY PRISON POPULATION RATE
Country Total Population Population per 100,00
UNITED STATES 2,193,798 737 ENGLAND/WALES 80,002 148 SPAIN 63,991 144 SCOTLAND 6,872 134 NETHERLANDS 21,013 128 PORTUGAL 12,765 120 AUSTRIA 8,766 105
RANKED BY PRISON POPULATION RATE
Country Total Population Population per 100,00
UNITED STATES 2,193,798 737 RUSSIA 874,161 615 UKRAINE 162,602 350 SOUTH AFRICA 158,501 334 POLAND 89,546 235 MEXICO 214,450 196 BRAZIL 371,482 193
RANKED BY TOTAL PRISON POPULATION
Country Total Population Population per 100,00
UNITED STATES 2,193,798 737 CHINA 1,548,498 118 RUSSIA 874,161 615 BRAZIL 371,482 193 INDIA 332,112 30 MEXICO 214,450 196 UKRAINE 162,602 350 Source: Source: International Centre of Prison Studies.

The Impact of Three Strike Laws on Crime Rates, Imprisonment Rates and Average Time Served
History and Overview of Three Strike Laws in America
Habitual offender laws are not new. Increasing punishments for repeat criminals has
been a part of the American criminal justice paradigm for much of the 20th century (Zimring,
Hawkins and Kamin, 2001). What is unique about TSLs is the greater potential for a
consequence that is disproportional to the crime committed, which deals with the criminal justice
issue of proportionality (Kovandzic, 2002). TSLs have the potential to make a crime that most
would consider “not a big deal” equal to crimes that many would consider heinous.
Stories in which individuals are sent to prison for long periods of time for petty crimes
are not uncommon. For example, Curtis Wilkerson was sentenced to 25 years in prison in 1995
for stealing $2.50 white tube socks (Taibbi, 2013). As of 2013, Wilkerson has spent 18 years in
prison, costing California taxpayers $846,000. Leandro Andrade was sentenced to 50 years in
1995 for stealing $153.00 worth of children’s videotapes from K-mart. He had stolen the tapes
from two different K-marts, which meant he was prosecuted for two third-strike offenses (25
years in prison per third-strike conviction) (Jaffe, 2009).
The average prison sentence for murder is under 21 years in jail according the Federal
Bureau of Justice Statistics. If either Wilkerson or Andrade had committed murder they would
have received punishments similar to the ones they received for theft. It is possible that Andrade
would have received a lighter sentence if he had committed murder, as he would have been
convicted under only one third-strike for murder.
There are multiple systemic and policy changes that occurred throughout the United
States over the last three decades that are potential causes for the increase in the imprisonment
rate. The longer prison terms is one factor for the increase. The average prisoner released in
2012 spends 36 percent more time (nine months more) in prison than the average prisoner

The Impact of Three Strike Laws on Crime Rates, Imprisonment Rates and Average Time Served
released in 1990 (Pew, 2012).
“Get tough on crime”, is a political mantra that embodied a reigning perspective in the
1980s and 1990s that meant the harsher the punishments the more likely it was for crime rates to
drop and for recidivism rates to decrease (Greene, 2002). As attempts were made to mitigate
judicial discretion various types of legislation were passed that mandated prison terms. TSL’s
along with other sentencing laws such as “truth in sentencing” and mandatory minimum laws
moved the United States from an indeterminate sentencing system, which provided judges with
flexibility to decide punishments; to a system leaning towards determinate sentencing, which
lessened a judge’s flexibility to determine sentencing as they saw fit (Walsh, 2007).
Alabama, Mississippi, Missouri and Texas had implemented TSLs within their states
prior to the mid-1990s; However, Washington was the first of 29 states to implement a TSL
between 1994 and 1996. Zimring, Hawkins and Kamin have referred to the adaptation of these
laws as a “populist preemption of criminal justice policy-making” (15). Stories of individuals
committing more crimes after being released from prison, combined with political rhetoric
insisting on policies that “get tough on crime” led to wide spread support of sentencing policy
changes. For example, in Washington, the TSL measure was approved by 75 percent of voters.
California’s TSL referendum was approved by 71 percent of voters.

The Impact of Three Strike Laws on Crime Rates, Imprisonment Rates and Average Time Served
Table 3: States that implemented TSLs between 1994–1996.
States Year State Year Alaska 1996 New Jersey 1995 Arizona 1996 New Mexico 1994 Arkansas 1995 North Carolina 1994 California 1994 North Dakota 1995 Colorado 1994 Pennsylvania 1995 Connecticut 1994 South Carolina 1996 Delaware 1994 Tennessee 1994 Florida 1995 Utah 1995 Georgia 1995 Vermont 1995 Illinois 1994 Virginia 1994 Indiana 1994 Washington 1994 Louisiana 1994 Wisconsin 1994 Maryland 1994
Montana 1996 Nevada 1995
Figure 1: Three Strike Law States. Green indicates states with three strike policies. The figures show the imprisonment rate as of 2012.

The Impact of Three Strike Laws on Crime Rates, Imprisonment Rates and Average Time Served
Impact of Three Strike Laws The intended purpose of TSLs is to remove repeat offenders from society and to
discourage potential (and current) offenders from committing new crimes thereby creating safer
environments. TSLs are intended to keep the most severe of criminals behind bars. Not all TSLs
are the same. Although each state has similar attributes there are variances. The similarities
revolve around violent offences, which are universally considered strike worthy. There is a bit of
a crime potpourri in the delineation of TSLs throughout the nation. Some states, like Indiana and
Louisiana include drug sales as a strikeable offense; Washington includes treason in their TSL
measure; Florida includes prison escape and South Carolina includes embezzlement (Obeta 32).
Of the 31 states that have some iteration of a TSL California’s three-strike law is the
most consistently applied (Chen, 2008). A 2004 study by the Justice Policy Institute showed
that California’s TSL had little impact on violent crime but cost taxpayers $8 billion from 1994
to 2004 to imprison tens of thousands of individuals for nonviolent offenses (Schiraldi, 2004).
In 2012, the result of a study titled “Worse Policy After Bad: How and Why California's 'Three-
strikes' is a Complete Failure as Crime and Economic Policy, and What to Do About Either”
was released that demonstrated California’s higher imprisonment rate and harsher penalties did
not lower the crime rate (Parker, 2012).
The debate over the effectiveness of TSLs on a national level is a continuous one. A study
conducted by Radha Iyengar regarding California’s TSL concluded that participation in criminal
activity was reduced by 20 percent for second-strike offenders and declined by 28 percent for
third-strike eligible offenders. In the same report Iyengar demonstrates that third-strike eligible
criminals were more likely to commit violent crimes because punishment levels were the same
as lesser crimes. Further, criminals that were second or third-strike eligible were more likely to
migrate to surrounding states to commit crimes (Iyengar, 2008).
The Impact of Three Strike Laws on Crime Rates, Imprisonment Rates and Average Time Served
In contrast, a report published in 2000, Three Strikes and You’re Out: The
Implementation and Impact of Strike Laws states in regards to TSL’s “that this form of
legislation was carefully crafted to be largely symbolic.” According to Austin et al, TSL’s have
not impacted crime rates and virtually all states already had some form of habitual offender
statute:
From a national perspective the “three strikes and you’re out” movement was largely symbolic. It was not designed to have a significant impact on the criminal justice system. The laws were crafted so that in order to be “struck out” an offender would have to be convicted two or more, often three times for very serious, but rarely committed crimes. Most states knew that very few offenders have more than two prior convictions for these types of crimes. More significantly, all of the states had existing provisions which allowed the courts to sentence these types of offenders for very lengthy prison terms. Consequently, the vast majority of the targeted offender population was already serving long prison terms for these types of crimes. From this perspective the three strikes law movement is much to ado about nothing-and is having virtually no impact on current sentencing practices (emphasis added) (Austin et al, 2000).
A 2011 doctoral dissertation by Ngozi Anadi Obeta demonstrated that TSL’s have an
“overall statistically insignificant positive relationship with crime rates.” His analysis controlled
for demographic and economic variables such as unemployment rate, poverty rate and household
incomes (Obeta, 2011).
One reason TSL’s seem to show an insignificant impact on the crime rate may relate to
prosecutorial discretion. Even if TSLs could have been effective, the impact of the law may be
unseen as a result of prosecutorial circumvention. Aside from California and Alabama very few
states are applying TSLs on a grand scale. This is largely a result of a prosecutor’s authority to
charge bargain, fact bargain and ultimately drop charges if they so desire (Worral and Nugent-
Borakove, 2008).
The Impact of Three Strike Laws on Crime Rates, Imprisonment Rates and Average Time Served
TSL policy expanded the powers of a prosecutor, which was already fairly significant, by
allowing a more threatening starting point in the negotiation process. In a sense, prosecutors play
the role of a judge. They can decide if the required punishment fits the crime. If they do not
agree with a sentencing policy they are usually within their legal limits to reduce charges in order
to apply a more fitting consequence. Still, TSLs, provide prosecuting attorneys a more powerful
starting negotiating point with defendants.
Shichor and Sechrest (1996) echo this claim by asserting that charge bargaining is a
common occurrence in the negotiation stages between the prosecuting attorney and the
defendant. Prosecuting attorneys will bargain with strikes. This way a defendant is more likely to
take a plea deal rather than face a trial, especially when a second or third-strike could mandate a
much longer prison sentence if the defendant is found guilty.
Several studies claim TSLs actually increase crime severity. Kovandzic et al, analyzed
188 cities between 1980-1999 attempting to determine the “homicide promoting effects to three-
strike laws”. They found that cities in TSL states experienced a 13 to 14 percent increase in the
short-term homicide rate and an increase of 16 to 24 percent over the long-term compared to
cities without TSL (399-424).
The Kovandzic et al research, expanded upon a study conducted by Marvel and Moody in
2001, which described how criminals facing a third-strike were more inclined to “reduce the
chances of being caught” by killing individuals that could potentially implicate them. They
describe how, as a result of a TSL statute, a criminal is more inclined to escalate a crime to
ensure they are not apprehended because the consequences of crimes are the same whether it is a
“little” crime or a “big” crime.

The Impact of Three Strike Laws on Crime Rates, Imprisonment Rates and Average Time Served
Research Methodology
This study required multiple types of data sets. The following data were used to develop this
study and to evaluate the impact of TSL on the crime rate, imprisonment rate and prison term
length.
1. Imprisonment rates of all states from 1978 – 2012, provided by Bureau of Justice
Statistics.
2. Crime rates of all states from 1978 – 2012, provided by Uniform Crime Reporting
Statistics.
3. Average prison terms pre and post TSL implementation, provided by the Pew Center on
the States.
4. Identifying the TSL statute for each TSL state and the year of implementation.
A total of 31 states were identified as having a TSL. For the purpose of this study;
however, only 27 states were included in the TSL group, as these were the states that had
implemented a TSL between 1994 and 1996. The purpose for this delineation was to ensure that
an equitable analysis was conducted between TSL and non-TSL states.
The TSL states that were not included in the analyses were Alabama, implemented TSL
in 1977; Mississippi, implemented TSL in 1977; Missouri, implemented TSL in 1982; And,
Texas, implemented TSL in 1982.
The imprisonment rate and crime rates were analyzed by treating TSL states as one group
and non-TSL states as another group. Calculations were conducted on the crime and
imprisonment rate Pre-1994, 1978–1993, and then again Post-1996, 1997 – 2012, for both
groups. The percent change for each crime category and imprisonment rate was calculated and
compared to determine if TSLs had a distinguishable impact on crime rates, imprisonment rates

The Impact of Three Strike Laws on Crime Rates, Imprisonment Rates and Average Time Served
and prison terms.
The years 1994, 1995 and 1996 were not included in the analyses. These years were in
flux as the legislation passed and implementation occurred throughout TSL states. By 1997, all
TSLs were implemented. Additionally, by setting clear and consistent time periods non-TSL
states were able to undergo the same analysis as TSL states.
Table 4
States Organized for Crime and Imprisonment Comparisons
TSL States Non-TSL States Alaska Hawaii Arizona Idaho Arkansas Iowa California Kansas Colorado Kentucky Connecticut Maine Delaware Massachusetts Florida Michigan Georgia Minnesota Illinois Nebraska Indiana New Hampshire Louisiana New York Maryland Ohio Montana Oklahoma Nevada Oregon New Jersey Rhode Island New Mexico South Dakota North Carolina West Virginia North Dakota Wyoming Pennsylvania
South Carolina Tennessee Utah Vermont Virginia Washington Wisconsin

The Impact of Three Strike Laws on Crime Rates, Imprisonment Rates and Average Time Served
By utilizing a smaller subset of TSL and non-TSL states analysis was made comparing
average prison terms of TSL and non-TSL states. In 2012, The Pew Center on the States, a
division of the Pew Charitable Trust, conducted a study in which they calculated the
average time served in prison for 35 states. They calculated the average length of stay
(LOS) for prisoners released in 1990 and in 2009.
Pew organized crimes in three different categories to determine LOS by crime
type: 1) Violent Crimes 2) Property Crimes and 3) Drug Crimes. Their data were derived
from National Corrections Reporting Program, U.S. Census Bureau and the Bureau of
Justice Statistics (Time Served, 2012).
Of the 35 states in the Pew report 31 were utilized and separated into two different
groups as TSL States and non-TSL States. Only the violent crimes and property crimes
categories were used to compare if LOS between TSL states and non-TSL states were
impacted by TSLs.
The Impact of Three Strike Laws on Crime Rates, Imprisonment Rates and Average Time Served
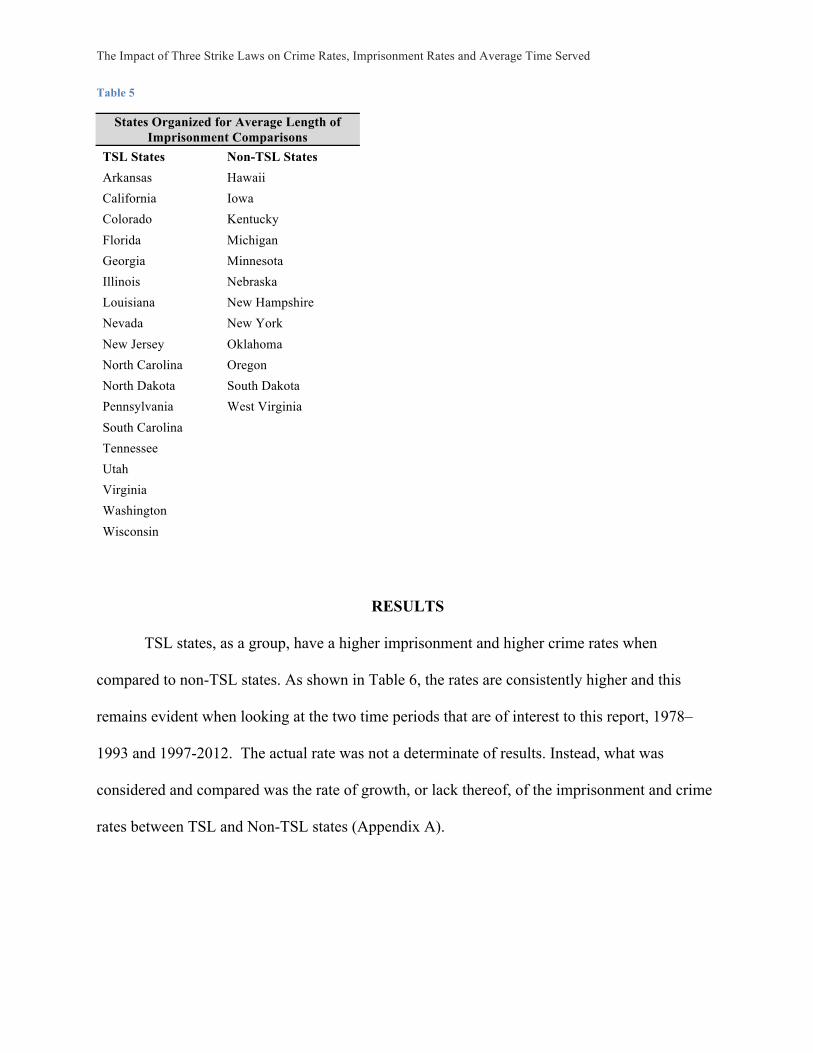
Table 5
States Organized for Average Length of Imprisonment Comparisons
TSL States Non-TSL States Arkansas Hawaii California Iowa Colorado Kentucky Florida Michigan Georgia Minnesota Illinois Nebraska Louisiana New Hampshire Nevada New York New Jersey Oklahoma North Carolina Oregon North Dakota South Dakota Pennsylvania West Virginia South Carolina
Tennessee Utah Virginia Washington Wisconsin
RESULTS TSL states, as a group, have a higher imprisonment and higher crime rates when
compared to non-TSL states. As shown in Table 6, the rates are consistently higher and this
remains evident when looking at the two time periods that are of interest to this report, 1978–
1993 and 1997-2012. The actual rate was not a determinate of results. Instead, what was
considered and compared was the rate of growth, or lack thereof, of the imprisonment and crime
rates between TSL and Non-TSL states (Appendix A).
The Impact of Three Strike Laws on Crime Rates, Imprisonment Rates and Average Time Served
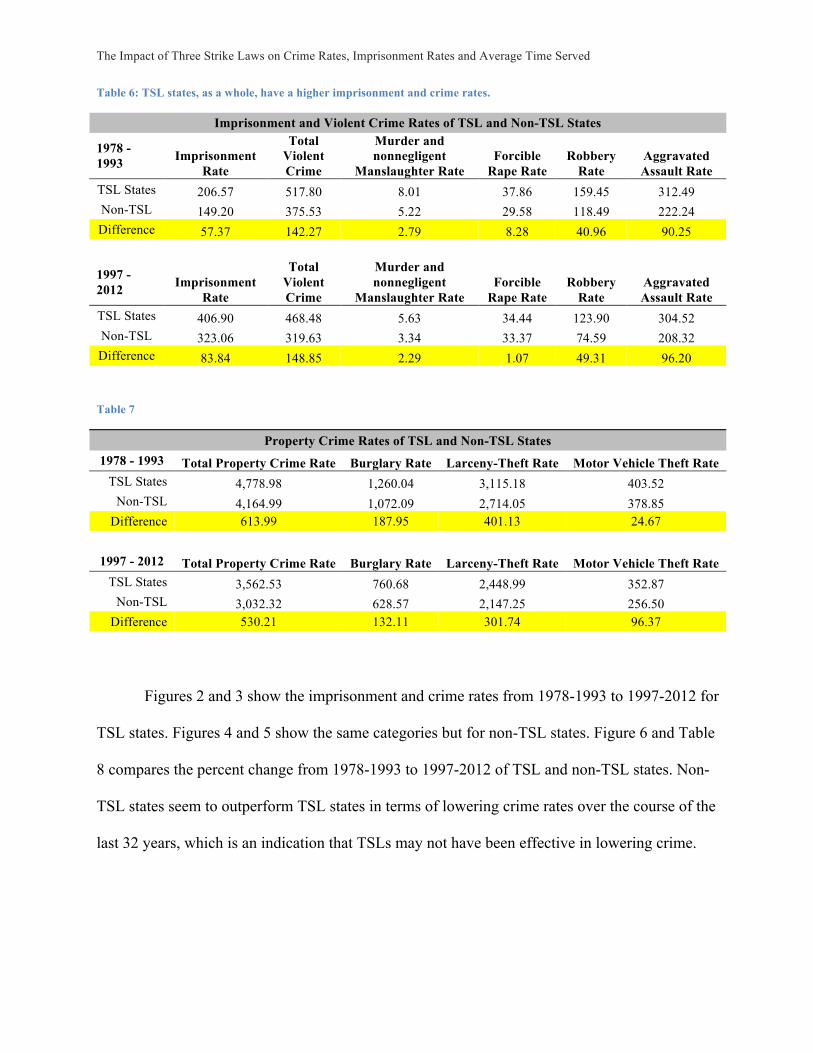
Table 6: TSL states, as a whole, have a higher imprisonment and crime rates.
Imprisonment and Violent Crime Rates of TSL and Non-TSL States
1978 - 1993 Imprisonment
Rate
Total Violent Crime
Murder and nonnegligent
Manslaughter Rate Forcible
Rape Rate Robbery
Rate Aggravated Assault Rate
TSL States 206.57 517.80 8.01 37.86 159.45 312.49 Non-TSL 149.20 375.53 5.22 29.58 118.49 222.24 Difference 57.37 142.27 2.79 8.28 40.96 90.25
1997 -
2012 Imprisonment Rate
Total Violent Crime
Murder and nonnegligent
Manslaughter Rate Forcible
Rape Rate Robbery
Rate Aggravated Assault Rate
TSL States 406.90 468.48 5.63 34.44 123.90 304.52 Non-TSL 323.06 319.63 3.34 33.37 74.59 208.32 Difference 83.84 148.85 2.29 1.07 49.31 96.20 Table 7
Property Crime Rates of TSL and Non-TSL States 1978 - 1993 Total Property Crime Rate Burglary Rate Larceny-Theft Rate Motor Vehicle Theft Rate
TSL States 4,778.98 1,260.04 3,115.18 403.52 Non-TSL 4,164.99 1,072.09 2,714.05 378.85
Difference 613.99 187.95 401.13 24.67
1997 - 2012 Total Property Crime Rate Burglary Rate Larceny-Theft Rate Motor Vehicle Theft Rate
TSL States 3,562.53 760.68 2,448.99 352.87 Non-TSL 3,032.32 628.57 2,147.25 256.50
Difference 530.21 132.11 301.74 96.37
Figures 2 and 3 show the imprisonment and crime rates from 1978-1993 to 1997-2012 for
TSL states. Figures 4 and 5 show the same categories but for non-TSL states. Figure 6 and Table
8 compares the percent change from 1978-1993 to 1997-2012 of TSL and non-TSL states. Non-
TSL states seem to outperform TSL states in terms of lowering crime rates over the course of the
last 32 years, which is an indication that TSLs may not have been effective in lowering crime.

The Impact of Three Strike Laws on Crime Rates, Imprisonment Rates and Average Time Served
Figure 2
Figure 3
Imprisonment Rate
Violent Crime
Murder and
nonnegligent
Manslaughter Rate
Forcible Rape Rate
Robbery Rate
Aggravated
Assault Rate
1978 -‐ 1993 206.57 517.80 8.01 37.86 159.45 312.49 1997 -‐ 2012 406.90 468.48 5.63 34.44 123.90 304.52 Percent Change 49.23% -‐10.53% -‐42.27% -‐9.93% -‐28.69% -‐2.62%
0.00 100.00 200.00 300.00 400.00 500.00
Violent Crime Rate per 100,000 TSL States: Change in Violent Crime
Imprisonment Rate
Property Crime Rate
Burglary Rate
Larceny-‐Theft Rate
Motor Vehicle Theft Rate
1978 -‐ 1993 206.57 4778.98 1260.04 3115.18 403.52 1997 -‐ 2012 406.90 3562.53 760.68 2448.99 352.87 Percent Change 49.23% -‐34.15% -‐65.65% -‐27.20% -‐14.35%
0.00
1000.00
2000.00
3000.00
4000.00
5000.00
Property Crime Rate per 100,000 TSL States: Change in Property Crime

The Impact of Three Strike Laws on Crime Rates, Imprisonment Rates and Average Time Served
Figure 4
Figure 5
Imprisonment Rate
Violent Crime
Murder and
nonnegligent
Manslaughter Rate
Forcible Rape Rate
Robbery Rate
Aggravated
Assault Rate
1978-‐1993 149.20 375.53 5.22 29.58 118.49 222.24 1997-‐2012 323.06 319.63 3.34 33.37 74.59 208.32 Percent Change 53.82% -‐17.49% -‐56.20% 11.38% -‐58.85% -‐6.68%
0.00
100.00
200.00
300.00
400.00
Violent Crime Rate per 100,000
Non-‐TSL States: Change in Violent Crime Rate
Imprisonment Rate
Property Crime Rate
Burglary Rate
Larceny-‐Theft Rate
Motor Vehicle Theft Rate
1978-‐1993 149.20 4164.99 1072.09 2714.05 378.85 1997-‐2012 323.06 3032.32 628.57 2147.25 256.50 Percent Change 53.82% -‐37.35% -‐70.56% -‐26.40% -‐47.70%
0.00
1000.00
2000.00
3000.00
4000.00
5000.00
Property Crime Rate per 100,000 Non-‐TSL: Change in Property Crime Rates
The Impact of Three Strike Laws on Crime Rates, Imprisonment Rates and Average Time Served
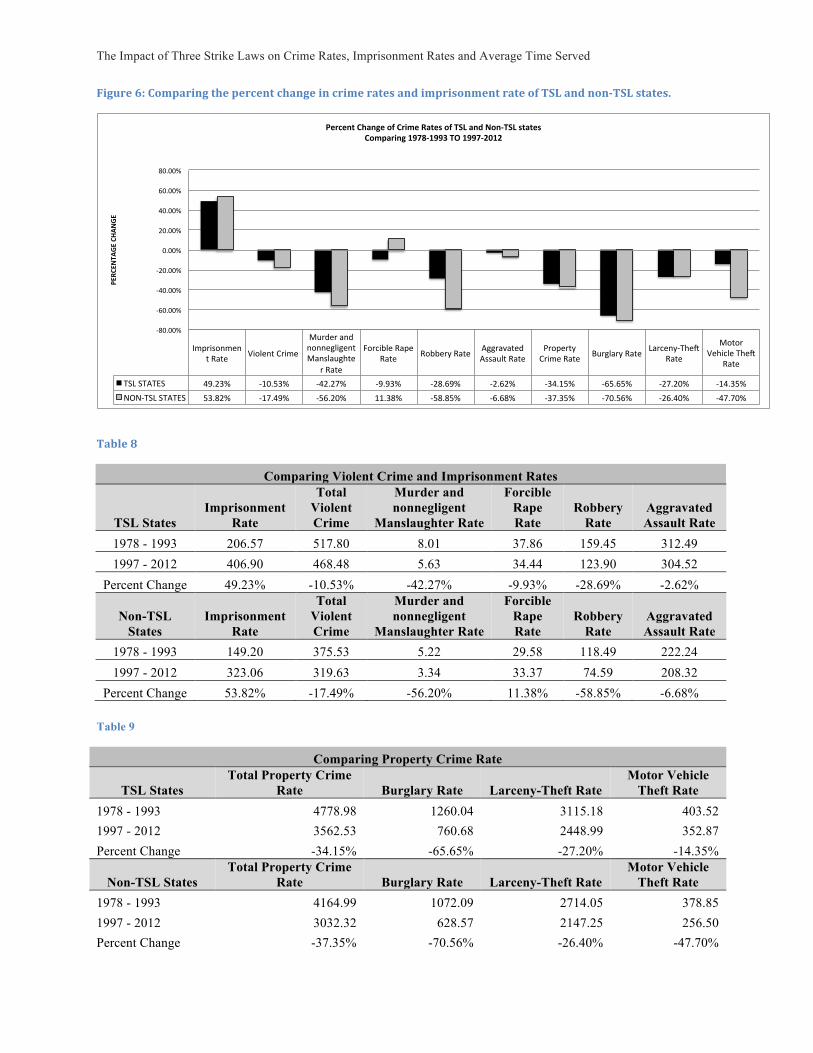
Figure 6: Comparing the percent change in crime rates and imprisonment rate of TSL and non-‐TSL states.
Table 8
Comparing Violent Crime and Imprisonment Rates
TSL States Imprisonment
Rate
Total Violent Crime
Murder and nonnegligent
Manslaughter Rate
Forcible Rape Rate
Robbery Rate
Aggravated Assault Rate
1978 - 1993 206.57 517.80 8.01 37.86 159.45 312.49 1997 - 2012 406.90 468.48 5.63 34.44 123.90 304.52
Percent Change 49.23% -10.53% -42.27% -9.93% -28.69% -2.62%
Non-TSL States
Imprisonment Rate
Total Violent Crime
Murder and nonnegligent
Manslaughter Rate
Forcible Rape Rate
Robbery Rate
Aggravated Assault Rate
1978 - 1993 149.20 375.53 5.22 29.58 118.49 222.24 1997 - 2012 323.06 319.63 3.34 33.37 74.59 208.32
Percent Change 53.82% -17.49% -56.20% 11.38% -58.85% -6.68% Table 9
Comparing Property Crime Rate
TSL States Total Property Crime
Rate Burglary Rate Larceny-Theft Rate Motor Vehicle
Theft Rate 1978 - 1993 4778.98 1260.04 3115.18 403.52 1997 - 2012 3562.53 760.68 2448.99 352.87 Percent Change -34.15% -65.65% -27.20% -14.35%
Non-TSL States Total Property Crime
Rate Burglary Rate Larceny-Theft Rate Motor Vehicle
Theft Rate 1978 - 1993 4164.99 1072.09 2714.05 378.85 1997 - 2012 3032.32 628.57 2147.25 256.50 Percent Change -37.35% -70.56% -26.40% -47.70%
Imprisonment+Rate+ Violent+Crime++
Murder+and+nonnegligent+Manslaughte
r+Rate+
Forcible+Rape+Rate+ Robbery+Rate+ Aggravated+
Assault+Rate+Property+Crime+Rate+ Burglary+Rate+ Larceny?TheA+Rate+
Motor+Vehicle+TheA+
Rate+
TSL+STATES+ 49.23%+ ?10.53%+ ?42.27%+ ?9.93%+ ?28.69%+ ?2.62%+ ?34.15%+ ?65.65%+ ?27.20%+ ?14.35%+NON?TSL+STATES+ 53.82%+ ?17.49%+ ?56.20%+ 11.38%+ ?58.85%+ ?6.68%+ ?37.35%+ ?70.56%+ ?26.40%+ ?47.70%+
?80.00%+
?60.00%+
?40.00%+
?20.00%+
0.00%+
20.00%+
40.00%+
60.00%+
80.00%+
PERC
ENTA
GE)CHA
NGE
))
Percent)Change)of)Crime)Rates)of)TSL)and)Non;TSL)states))Comparing)1978;1993)TO)1997;2012)
)

The Impact of Three Strike Laws on Crime Rates, Imprisonment Rates and Average Time Served
The crime rate decreases are generally greater in non-TSL states. This is true for all crime
categories except for the crime category of “forcible rape”. It cannont be shown that TSL’s are
responsible for the large increases in the imprisonment rate. The rate of increase between TSL
and non-TSL states are similar. Both groups increased their imprisonment rate by approximately
50 percent. TSL states increased imprisonment by 49 percent and non-TSL states increased by
54 percent. If TSLs were responsible for increased rates of imprisonment the analysis may have
indicated a larger percentage of increase among TSL states. Instead, non-TSL states had a higher
rate of increase.
The results demonstrate that TSLs do not seem to have a measurable impact on the crime
rates or the imprisonment rate. This becomes more evident when crime and imprisonment trends
are compared over the last 32 years between TSL and non-TSL states. As Figures 7-9 show,
although TSL states have higher crime and imprisonment rates, the increases and decreases seem
to move in parallel with non-TSL states (Appendix B).

The Impact of Three Strike Laws on Crime Rates, Imprisonment Rates and Average Time Served
Figure 7
Figure 8
0.00
100.00
200.00
300.00
400.00
500.00
600.00
700.00
1975 1980 1985 1990 1995 2000 2005 2010 2015
Violent Crime Rate of TSL and Non-TSL States. From 1978-2012.
TSL States Non-TSL States
0.00
1,000.00
2,000.00
3,000.00
4,000.00
5,000.00
6,000.00
1975 1980 1985 1990 1995 2000 2005 2010 2015
Property Crime Rate of TSL and Non-TSL States. From 1978-2012.
TSL States Non-‐TSL States

The Impact of Three Strike Laws on Crime Rates, Imprisonment Rates and Average Time Served
Figure 9
Both TSL and Non-TSL states experienced an increase in the average length of stay
(LOS) from 1990 to 2009. Figures 10 and 11 show the LOS remains consistent between both
groups for both crime categories in 1990, before TSL implementation, and in 2009, after TSL
implementation. The results demonstrate that TSLs may not have had a measurable impact on
LOS. In fact, non-TSL states have longer prison terms for property crimes in 2009 (Appendix C).
0 50 100 150 200 250 300 350 400 450 500
1975 1980 1985 1990 1995 2000 2005 2010 2015
Imprisonment Rate of TSL and Non-TSL States. From 1978-2012.
TSL States Non-‐TSL States

The Impact of Three Strike Laws on Crime Rates, Imprisonment Rates and Average Time Served
Figure 10
Figure 11
1990 2009 Percent Change TSL States 3.51 4.71 25.48% Non-‐TSL States 3.59 4.58 21.62%
0 0.5 1
1.5 2
2.5 3
3.5 4
4.5 5
YEARS
Violent Crimes Average Length of Stay
1990 2009 TSL States 1.87 2.18 14.22% Non-‐TSL States 2.01 2.33 13.73%
0
0.5
1
1.5
2
2.5
YEARS
Property Crimes Average Length of Stay

The Impact of Three Strike Laws on Crime Rates, Imprisonment Rates and Average Time Served
Conclusion
For all of the categories that this study looked at, none could demonstrate clearly that
TSLs have had any type of significant impact. For all crime categories, except one, non-TSL
states seem to outperform TSL states in reducing crime. This may indicate that the threat of a
harsher punishment via a TSL is not necessary to experience a reduction in crime. Both groups
experienced increases in their imprisonment rate. Non-TSL states actually had a higher rate of
increase at 53 percent, while TSL states rate increased by 49 percent. This would seem to
indicate that TSLs are not necessarily the cause of the increased imprisonment rates.
As shown in Figures 15-17, this was seen when the crime rates and imprisonment rate of
TSL and non-TSL states are looked at over the course of 32 years. The violent crime rates,
property crime rates and imprisonment rate of TSL and non-TSL states look to parallel each
other prior to TSL implementation and after TSL implementation.
For all crime categories, except one, non-TSL states seem to outperform TSL states in
reducing crime. This may indicate that the threat of a harsher punishment via a TSL is not
necessary to experience a reduction in crime. Both groups experienced increases in their
imprisonment rate. Non-TSL states actually had a higher rate of increase at 53 percent, while
TSL states rate increased by 49 percent. This would seem to indicate that TSLs are not
necessarily the cause of the increased imprisonment rates.
When reviewing the average length of time served, TSL and non-TSL states have very
similar prison terms for property and violent crimes. This similarity is seen for both groups
before implementation of TSLs as well as after implementation of TSLs.
Although TSLs may not be a direct cause of the increases in the imprisonment rate nor
the decreases in the crime rate they do have an impact. The impact is experienced on a personal
level. The stories of Curtis Wilkerson and Leandro Andrade, both sentenced to what are

The Impact of Three Strike Laws on Crime Rates, Imprisonment Rates and Average Time Served
effectively life-terms for petty theft are not unique. Tens of thousands of individuals are in prison
for non-violent offenses as a result of TSLs.
The states with TSL and other “get tough on crime” measures like mandatory minimum
and truth in sentencing laws may have unintentionally encouraged an environment where the
punishments measured out are not fitting to the crime. Also, TSL states have equated crimes of
violence with lesser crimes.
Continued research in the area of TSLs and other types of sentencing laws may want to
focus on sub-sets of states within the research topic. For instance, further dividing TSL states and
non-TSL states into sub-groups based on crime rates, demographics, economic trends or regions
of the United Stats may provide a more even comparison.
In the last few years states have begun to roll back some of their harsher sentencing laws.
California voters, for instance, passed Proposition 36, Three Strikes Reform Act in 2012, which
has resulted in the release of over 1,500 prisoners (Proposition 36 Progress Report, 2014).
Louisiana and Texas are working towards changing policies to encourage greater participation in
incarceration alternatives (Kaste, 2014).
There is value in pinpointing which specific sentencing policies caused an increase or
decrease in crime rate, imprisonment rate or prison term length. There is also value in the broad
overview of sentencing policies that make up national trends. In the case of the United States, the
greater question may be less about which policies have caused the prison rate to increase and
more about whether prison, as a consequence, is effective in reducing crime and creating a more
stable society in the first place.

BIBLIOGRAPHY Anadi, Ngozi Obeta. The Impact of Three Strike Laws on Crime Rates in the United States: A
Panel Data Analysis. New Orleans: n.p., 2011. Print. UMI Number: 3487395 Austin, James, John Clark, Patrcia Handyman, and Alan Henry. : Three Strikes and You’re Out:
The Implementation and Impart of Strike Laws. N.p.: n.p., n.d. Print. Funded by the U.S. Department of Justice. Document No: 181297. Award Number: 96CEVX0009
Beckett, K., & Sasson, T. (2013, April 24). The origins of the current conservative discourse of law and order [PDF]. Sommerville: Political Research Associates. http://www.publiceye.org/defendingjustice/pdfs/chapters/toughcrime.pdf
Brown, B., & Jolivette, G. (2005). A Primer: Threestrikes The impact after more than a decade (United States of America, The Legislative Analyst's Office of California). Los Angeles, CA: The Legislative Analyst's Office.
California Department of Corrections and Rehabilitation: Inmates Sentenced under the Three Strikes Law and a Small Number of Inmates Receiving Specialty Health Care Represent Significant Costs. Sacramento, CA: California State Auditor, Bureau of State Audits, 2010. Print.
Carson, A. (2013, November 19). Imprisonment Rate of Sentenced Prisoners under the Jurisdiction of State or Federal Correctional Authorities per 100,000 U.S. Residents, December 31, 19782012 (United States, Bureau of Justice Statistics). Data source(s): National Prisoner Statistics Program
Carson, A. E., & Sabol, W. J. (2012, December). Prisoners in 2011 (United States of America, U.S. Department of Justice, Bureau of Justice Statistics). Retrieved from http://www.bjs.gov/content/pub/pdf/p11.pdf NCJ 239808
Chen, Elsa. "Impacts of "Three Strikes and You're Out" on Crime Trends in California and Throughout the United States." Annual Meeting of the American Society of Criminology. Atlanta Marriott Marquis, Atlanta. 22 Apr. 2015. Reading.
Cooper, A. D., Durose, M. R., & Snyder, H. N. (2014, April 22). Bureau of Justice Statistics (BJS) Recidivism of Prisoners Released in 30 States in 2005: Patterns from 2005 to 2010. Retrieved from http://www.bjs.gov/index.cfm?ty=pbdetail&iid=4986
Collier, Lorna. "Incarceration Nation." Monitor on Psychology 45.9 (2014): 56. Print. Currie, E. (2013). Crime and punishment in America. New York, FL: Picador. Greene, J. (2002). Getting tough on crime: The history and political context of sentencin
reform development leading to the passage of the 1994 Crime Act. In C. Tata & N. Hutton (Eds.), Sentencing and Society: International Perspectives. Hampshire: Ashgate Publishing Limited.
Highest to Lowest Prison Population Total. (n.d.). Retrieved from http://www.prisonstudies.org/highesttolowest/prisonpopulationtotal

Iyengar, R. (2008, February). I'd rather be hanged for a sheep than a lamb: The unintended consequences of 'threestrikes' laws (Working paper No. 13784). Retrieved http://www.nber.org/papers/w13784.pdf
Iyengar, R. (n.d.). The unintended consequences of ‘ThreeStrikes’ laws (Rep.). Robert Wood Johnson Health Policy Scholar; University of Harvard; NBER
Jaffe, I. (2009, October 30). Cases Show Disparity Of California's 3 Strikes Law. Retrieved from http://www.npr.org/templates/story/story.php?storyId=114301025
LappiSeppälä, T. (2007). Penal Policy in Scandinavia. Crime and Justice, 36(1), 217295. doi: 10.1086/592812
LappiSeppälä, T. (n.d.). Imprisonment and Penal Policy in Finland. Imprisonment and Penal Policy in Finland, 54(17). Retrieved from http://www.scandinavianlaw.se/pdf/54 17.pdf
Larson, D. (2013, September 24). Why Scandinavian prisons are superior [Editorial]. The Atlantic. Retrieved from http://www.theatlantic.com/international/archive/2013/09/whyscandinavianprisons aresuperior/279949/
Mason, C. (2013). International Growth Trends in Prison Privatization (p. 1, Publication). Washinton D.C.: The Sentencing Project.
Mears, B. (2003, March 5). Supreme Court upholds long sentences under 3strikesyou'reout law. CNN. Retrieved from http://www.cnn.com/2003/LAW/03/05/scotus.three.strikes/
Parker, R. N. (2012). Why California’s ‘Threestrikes’ Fails as Crime and Economic Policy, California Journal of Politics and Policy, 5(2). doi:10.1515/cjpp20120008
Schiraldi, V., Colburn, J., & Lotke, E. (2009). 3Strike Laws: 10 Years after their enactment(Publication). Washington D.C.: Justice PolicyInstitute. Stanford Threestrikes Project. (n.d.). Retrieved from http://www.law.stanford.edu/organizations/programsandcenters/stanfordthree strikesproject/threestrikesbasics
Shichor, David, and Dale K.. Sechrest. Three Strikes and You're out Vengeance as Policy. Thousand Oaks: Sage Publications, 1996. Print.
Tiabbi, M. (2013, March 27). Cruel and Unusual Punishment: The Shame of Threestrikes Laws. Retrieved from http://www.rollingstone.com/politics/news/cruelandunusual punishmenttheshameofthreestrikeslaws20130327
Time Served:The High Cost, Low Return of Longer Prison Terms (p. 2, Publication). (2012). Washinton D.C.: The Pew Charitable Trusts.
Travis, J., & Western, B. (2014). The growth of incarceration in the United States: Exploring causes and consequences. Washington D.C.: National Research Council.

Worrall, John L., and M. Elaine NugentBorakove. "Have Sentencing Reforms Displaced Discretion over Sentencing From Judges to Prosecutors." The Changing Role of the American Prosecutor. Albany, NY: State U of New York, 2008. N. pag. Print.
Zimring, Franklin E., Gordon Hawkins, and Sam Kamin. Punishment and Democracy: Three Strikes and You're out in California. Oxford: Oxford UP, 2001. Print.

APPENDICIES

APPENDIX A
This table shows the average imprisonment and crime rates of all states within two different time periods. “Pre1994” includes the years 1978 – 1993. “Post1996” includes the years 1997 – 2012. The table also shows the percent change of the imprisonment and crimes rates from Pre1994 to Post1996.
States
Three-Strike State
Time Imprisonment Rate
Violent Crime
Murder and nonnegligent
Manslaughter Rate
Forcible Rape Rate
Robbery Rate
Aggravated Assault Rate
Property Crime Rate
Burglary Rate
Larceny-Theft Rate
Motor Vehicle Theft Rate
Alabama 1.00 Pre1994 280.64 560.96 10.99 29.50 123.47 397.03 3998.46 1202.78 2500.44 294.78
Post1996 596.05 453.49 7.47 33.15 132.51 280.32 3918.24 971.38 2658.09 288.83
Percent Change
52.92% -23.70% -47.11% 11.01% 6.82% -41.63% -2.05% -23.82% 5.93% -2.06%
Alaska 1.00 Pre1994 267.63 564.48 10.45 77.35 97.09 379.62 5187.42 1093.46 3528.36 559.20
Post1996 399.89 628.33 5.45 76.54 84.29 462.05 3456.69 562.41 2554.58 339.68
Percent Change
33.07% 10.16% -91.74% -1.05% -15.18% 17.84% -50.07% -94.42% -38.12% -64.62%
Arizona 1.00 Pre1994 276.28 605.69 8.26 41.61 156.54 399.28 6780.55 1773.14 4461.47 545.94
Post1996 534.92 508.64 7.29 33.40 142.11 325.85 4860.06 985.23 3120.29 754.49
Percent Change
48.35% -19.08% -13.38% -24.57% -10.16% -22.53% -39.52% -79.97% -42.98% 27.64%
Arkansas 1.00 Pre1994 219.41 415.36 8.93 32.32 90.61 283.48 3683.04 1064.51 2391.33 227.21
Post1996 480.17 489.08 6.40 39.99 89.31 353.40 3810.88 1023.67 2543.68 243.49
Percent Change
54.31% 15.07% -39.55% 19.19% -1.46% 19.78% 3.35% -3.99% 5.99% 6.69%
California 1.00 Pre1994 210.04 560.96 10.99 29.50 123.47 397.03 3998.46 1202.78 2500.44 295.26
Post1996 455.81 453.49 7.47 33.15 132.51 280.32 3918.24 971.38 2658.09 288.83
Percent Change
53.92% -23.70% -47.11% 11.01% 6.82% -41.63% -2.05% -23.82% 5.93% -2.23%
Colorado 1.00 Pre1994 151.70 509.77 6.07 44.46 127.41 331.83 6051.58 1546.55 4064.86 440.19
Post1996 420.54 351.28 3.63 43.55 74.92 229.18 3463.74 643.49 2437.91 382.34
Percent Change
63.93% -45.12% -67.13% -2.08% -70.07% -44.79% -74.71% -140.34%
-66.74% -15.13%
Connecticut 1.00 Pre1994 154.68 438.56 4.91 24.10 202.58 206.97 4737.26 1289.23 2843.83 604.19
Post1996 380.38 312.66 3.38 20.35 118.71 170.21 2671.81 491.79 1879.80 300.19

Percent Change
59.33% -40.27% -45.37% -18.43% -70.66% -21.60% -77.31% -162.15%
-51.28% -101.27%
Deleware 1.00 Pre1994 288.16 524.14 5.29 55.48 140.79 322.56 5010.23 1200.00 3442.72 367.51
Post1996 468.13 662.44 4.15 46.99 184.30 427.04 3632.94 753.19 2559.83 319.88
Percent Change
38.44% 20.88% -27.41% -18.06% 23.61% 24.47% -37.91% -59.32% -34.49% -14.89%
Florida 1.00 Pre1994 276.58 1013.16 11.49 51.91 336.33 613.42 7010.26 2101.30 4301.86 607.13
Post1996 493.78 727.07 5.73 37.68 188.24 495.41 4432.50 1041.46 2947.09 443.96
Percent Change
43.99% -39.35% -100.76% -37.77% -78.67% -23.82% -58.16% -101.77%
-45.97% -36.75%
Georgia 1.00 Pre1994 277.90 598.86 12.36 42.85 209.28 334.38 5104.33 1498.72 3148.17 457.43
Post1996 541.15 472.93 6.85 25.00 161.06 280.04 4118.14 941.54 2734.67 441.93
Percent Change
48.65% -26.63% -80.38% -71.40% -29.93% -19.40% -23.95% -59.18% -15.12% -3.51%
Hawaii 0.00 Pre1994 125.11 259.00 4.83 33.28 121.98 98.92 5972.43 1404.53 4142.97 424.93
Post1996 313.08 260.10 2.26 28.37 87.76 141.70 4460.09 799.68 3143.68 516.68
Percent Change
60.04% 0.42% -114.13% -17.29% -38.98% 30.19% -33.91% -75.64% -31.79% 17.76%
Idaho 0.00 Pre1994 145.99 259.06 3.34 22.34 26.96 206.43 3832.08 939.01 2704.76 188.33
Post1996 442.31 244.31 2.19 35.24 17.21 189.64 2624.93 537.80 1934.44 152.69
Percent Change
66.99% -6.04% -52.57% 36.60% -56.64% -8.85% -45.99% -74.60% -39.82% -23.34%
Illinois 1.00 Pre1994 173.92 823.01 9.78 35.31 346.41 431.51 4,909.16 1,226.36 3,072.89 609.91
Post1996 356.34 580.16 6.79 31.62 193.43 348.31 3,236.71 645.21 2,269.79 321.65
Percent Change
51.19% -41.86% -44.01% -11.68% -79.09% -23.89% -51.67% -90.07% -35.38% -89.62%
Indiana 1.00 Pre1994 178.50 373.71 6.70 31.51 109.54 225.95 4003.21 1008.89 2609.77 384.54
Post1996 383.98 358.11 5.68 28.36 110.91 213.15 3380.89 729.41 2341.54 309.91
Percent Change
53.51% -4.36% -17.93% -11.08% 1.23% -6.01% -18.41% -38.32% -11.46% -24.08%
Iowa 0.00 Pre1994 111.06 231.71 2.09 14.91 43.57 171.14 3895.22 893.03 2818.46 183.73
Post1996 281.99 282.89 1.60 27.21 39.81 214.30 2789.81 598.93 2018.67 172.26
Percent Change
60.62% 18.09% -30.47% 45.22% -9.43% 20.14% -39.62% -49.11% -39.62% -6.66%
Kansas 0.00 Pre1994 182.58 415.36 8.93 32.32 90.61 283.48 3683.04 1064.51 2391.33 227.21
Post1996 318.07 489.08 6.40 39.99 89.31 353.40 3810.88 1023.67 2543.68 243.49
Percent Change
42.60% 15.07% -39.55% 19.19% -1.46% 19.78% 3.35% -3.99% 5.99% 6.69%

Kentucky 0.00 Pre1994 168.71 339.61 7.71 24.31 84.56 223.05 2918.92 863.09 1840.08 215.76
Post1996 430.31 272.32 4.74 30.66 84.96 151.95 2623.32 668.48 1753.76 201.08
Percent Change
60.79% -24.71% -62.80% 20.71% 0.47% -46.79% -11.27% -29.11% -4.92% -7.30%
Louisiana 1.00 Pre1994 333.91 755.80 15.01 40.07 220.52 480.20 5003.06 1393.53 3166.58 442.95
Post1996 814.28 665.96 12.27 32.61 153.00 468.04 4316.26 1040.59 2892.79 382.91
Percent Change
58.99% -13.49% -22.36% -22.86% -44.13% -2.60% -15.91% -33.92% -9.46% -15.68%
Maine 0.00 Pre1994 92.73 160.84 2.34 16.65 27.01 114.82 3595.06 944.94 2466.84 183.28
Post1996 141.53 115.89 1.70 25.80 24.53 63.93 2563.05 546.81 1913.62 102.60
Percent Change
34.48% -38.78% -37.87% 35.47% -10.09% -79.61% -40.27% -72.81% -28.91% -78.64%
Maryland 1.00 Pre1994 282.95 855.44 9.99 40.05 351.96 453.43 5017.70 1285.98 3186.46 545.25
Post1996 403.90 680.55 8.76 24.75 241.14 405.94 3679.09 714.63 2464.38 500.14
Percent Change
29.95% -25.70% -14.13% -61.82% -45.96% -11.70% -36.38% -79.95% -29.30% -9.02%
Massachusetts 0.00 Pre1994 96.91 619.11 3.73 29.49 199.25 386.65 4577.44 1250.93 2394.85 931.66
Post1996 157.34 488.74 2.46 26.98 108.26 351.01 2499.63 547.77 1640.38 311.47
Percent Change
38.41% -26.67% -51.27% -9.31% -84.04% -10.15% -83.12% -128.37%
-45.99% -199.12%
Michigan 0.00 Pre1994 252.65 720.64 10.33 62.26 254.65 393.39 5507.64 1442.88 3369.66 695.09
Post1996 475.43 531.00 6.59 49.73 128.10 346.57 3244.09 732.44 2056.03 455.62
Percent Change
46.86% -35.71% -56.59% -25.21% -98.79% -13.51% -69.77% -97.00% -63.89% -52.56%
Minnesota 0.00 Pre1994 61.88 262.96 2.49 30.95 95.36 134.15 4127.81 1023.18 2801.39 303.26
Post1996 159.36 273.16 2.24 40.48 81.58 148.87 3092.65 553.86 2290.10 248.72
Percent Change
61.17% 3.73% -10.86% 23.54% -16.89% 9.89% -33.47% -84.74% -22.33% -21.93%
Mississippi 1.00 Pre1994 243.65 323.41 11.76 31.64 81.66 198.34 3192.76 1139.64 1859.63 193.51
Post1996 673.26 323.49 8.52 35.95 102.70 176.29 3424.92 1002.44 2151.34 271.18
Percent Change
63.81% 0.02% -38.08% 12.00% 20.48% -12.51% 6.78% -13.69% 13.56% 28.64%
Missouri 1.00 Pre1994 207.33 581.82 9.41 30.61 194.79 347.00 4321.59 1239.68 2651.35 430.59
Post1996 503.83 510.48 6.55 26.39 125.25 352.25 3844.09 760.91 2677.79 405.36
Percent Change
58.85% -13.97% -43.70% -15.96% -55.52% 1.49% -12.42% -62.92% 0.99% -6.22%
Montana 1.00 Pre1994 137.23 188.44 3.76 20.22 26.86 137.61 4278.96 783.01 3241.14 254.80
Post1996 354.82 294.24 2.96 31.56 23.41 236.30 3096.02 405.13 2497.44 195.74

Percent Change
61.32% 35.96% -27.06% 35.94% -14.77% 41.77% -38.21% -93.28% -29.78% -30.17%
Nebraska 0.00 Pre1994 116.77 261.94 3.27 23.98 57.83 176.84 3752.91 767.88 2784.60 200.44
Post1996 232.54 322.03 3.09 30.88 66.28 221.82 3389.95 543.51 2552.75 293.69
Percent Change
49.79% 18.66% -5.87% 22.35% 12.76% 20.28% -10.71% -41.28% -9.08% 31.75%
Nevada 1.00 Pre1994 367.79 740.76 12.53 61.96 330.61 335.68 6286.39 1928.39 3764.28 593.72
Post1996 487.40 648.91 7.65 42.78 230.57 367.85 3788.06 942.13 2120.24 725.68
Percent Change
24.54% -14.15% -63.81% -44.82% -43.39% 8.75% -65.95% -104.68%
-77.54% 18.18%
New Hampshire 0.00 Pre1994 81.38 139.38 2.28 24.12 28.51 84.48 3481.46 850.01 2397.51 233.96
Post1996 196.59 153.16 1.23 33.06 32.28 86.39 2174.05 373.29 1680.56 120.16
Percent Change
58.60% 9.00% -85.71% 27.05% 11.69% 2.21% -60.14% -127.71%
-42.66% -94.71%
New Jersey 1.00 Pre1994 177.01 577.05 5.63 30.48 271.89 269.04 4811.06 1216.84 2846.17 748.07
Post1996 317.99 361.96 4.20 14.67 156.05 187.06 2530.11 511.77 1692.16 326.18
Percent Change
44.33% -59.43% -34.08% -107.80% -74.23% -43.82% -90.15% -137.77%
-68.20% -129.34%
New Mexico 1.00 Pre1994 153.71 713.12 10.37 48.28 123.07 531.39 5614.91 1629.93 3637.57 347.42
Post1996 303.07 704.07 7.89 51.33 117.23 527.65 4300.11 1116.48 2768.77 414.89
Percent Change
49.28% -1.29% -31.46% 5.94% -4.99% -0.71% -30.58% -45.99% -31.38% 16.26%
New York 0.00 Pre1994 219.06 1023.05 11.97 29.99 564.47 416.61 5082.66 1388.57 2904.39 789.70
Post1996 331.87 478.74 4.63 17.51 190.36 266.27 2276.75 405.73 1658.52 212.49
Percent Change
33.99% -113.70%
-158.43% -71.33% -196.53%
-56.46% -123.24% -242.24%
-75.12% -271.63%
North Carolina 1.00 Pre1994 254.74 505.13 9.52 26.63 109.86 359.14 4259.54 1368.01 2661.22 230.32
Post1996 355.69 464.81 6.35 25.88 141.47 291.08 4131.44 1197.23 2649.88 284.29
Percent Change
28.38% -8.67% -49.90% -2.87% 22.35% -23.38% -3.10% -14.26% -0.43% 18.99%
North Dakota 1.00 Pre1994 51.13 62.57 1.35 12.81 9.03 39.37 2679.28 424.68 2118.01 136.60
Post1996 185.47 148.86 1.76 33.03 10.81 103.29 2147.38 347.56 1641.28 158.53
Percent Change
72.43% 57.97% 23.40% 61.20% 16.47% 61.89% -24.77% -22.19% -29.05% 13.83%
Ohio 0.00 Pre1994 218.77 457.96 6.33 38.99 180.16 232.50 4286.30 1119.76 2752.49 414.02
Post1996 421.43 343.41 4.39 38.31 149.17 151.54 3593.56 866.00 2420.87 306.71
Percent Change
48.09% -33.36% -44.10% -1.76% -20.78% -53.42% -19.28% -29.30% -13.70% -34.99%

Oklahoma 0.00 Pre1994 288.22 466.88 8.17 39.45 115.43 303.84 4802.92 1533.33 2761.56 508.03
Post1996 652.19 505.19 5.78 42.16 89.03 368.24 3939.28 1007.41 2579.89 351.99
Percent Change
55.81% 7.58% -41.30% 6.43% -29.65% 17.49% -21.92% -52.20% -7.04% -44.33%
Oregon 0.00 Pre1994 167.28 513.43 4.83 45.84 163.04 299.73 5875.39 1598.09 3853.06 424.24
Post1996 343.30 307.38 2.41 34.45 77.68 192.86 4142.24 710.84 3025.48 405.93
Percent Change
51.27% -67.03% -100.52% -33.07% -109.90%
-55.41% -41.84% -124.82%
-27.35% -4.51%
Pennsylvania 1.00 Pre1994 130.47 369.96 5.86 23.99 163.16 176.91 2964.14 789.18 1779.48 395.48
Post1996 345.87 404.89 5.39 27.86 146.89 224.79 2459.64 461.42 1759.73 238.48
Percent Change
62.28% 8.63% -8.70% 13.87% -11.08% 21.30% -20.51% -71.03% -1.12% -65.84%
Rhode Island 0.00 Pre1994 109.48 385.73 3.83 22.68 113.12 246.09 4787.37 1322.09 2689.16 776.10
Post1996 199.06 270.78 2.90 32.91 75.87 159.13 2923.19 581.13 1987.73 354.35
Percent Change
45.00% -42.45% -31.90% 31.07% -49.10% -54.65% -63.77% -127.50%
-35.29% -119.02%
South Carolina 1.00 Pre1994 343.46 751.25 10.28 43.48 125.54 571.94 4605.50 1410.73 2892.54 302.21
Post1996 521.13 768.18 7.31 41.41 136.38 583.09 4366.80 1038.70 2958.20 367.70
Percent Change
34.09% 2.20% -40.63% -4.98% 7.95% 1.91% -5.47% -35.82% 2.22% 17.81%
South Dakota 0.00 Pre1994 143.19 143.68 2.04 24.86 15.91 100.86 2666.13 562.21 1983.99 119.91
Post1996 390.24 211.90 2.41 51.63 17.19 140.69 2056.23 392.31 1554.13 109.83
Percent Change
63.31% 32.20% 15.06% 51.85% 7.42% 28.31% -29.66% -43.31% -27.66% -9.19%
Tennessee 1.00 Pre1994 179.97 529.58 9.69 41.80 184.06 294.04 3968.58 1273.72 2230.41 464.44
Post1996 415.89 705.26 7.01 38.17 163.13 496.96 4102.04 1024.01 2686.32 391.79
Percent Change
56.73% 24.91% -38.27% -9.51% -12.83% 40.83% 3.25% -24.39% 16.97% -18.54%
Texas 1.00 Pre1994 257.68 621.33 14.00 47.91 217.96 341.44 6172.51 1807.09 3686.18 679.26
Post1996 690.42 521.13 5.81 35.74 150.18 329.39 4233.30 941.49 2893.79 398.09
Percent Change
62.68% -19.23% -141.12% -34.07% -45.14% -3.66% -45.81% -91.94% -27.38% -70.63%
Utah 1.00 Pre1994 104.58 274.49 3.26 29.48 63.61 178.14 5172.91 995.43 3922.30 255.18
Post1996 236.65 240.42 2.04 37.25 50.48 150.66 3909.33 615.11 2990.06 304.11
Percent Change
55.81% -14.17% -59.63% 20.87% -26.03% -18.24% -32.32% -61.83% -31.18% 16.09%
Vermont 1.00 Pre1994 95.64 139.88 2.59 26.61 19.92 90.73 4115.82 1136.08 2775.61 204.12
Post1996 229.50 124.23 1.88 22.79 14.22 85.31 2509.43 566.14 1835.71 107.57

Percent Change
58.33% -12.60% -37.87% -16.79% -40.09% -6.34% -64.01% -100.67%
-51.20% -89.76%
Virginia 1.00 Pre1994 223.38 318.24 8.08 27.43 116.78 165.97 3880.17 878.09 2752.66 249.44
Post1996 457.54 270.86 5.29 23.16 91.68 150.74 2698.64 428.83 2061.87 207.97
Percent Change
51.18% -17.49% -52.72% -18.46% -27.38% -10.10% -43.78% -104.77%
-33.50% -19.94%
Washington 1.00 Pre1994 147.60 453.09 4.94 55.03 131.35 261.75 6018.68 1624.50 4017.06 377.11
Post1996 260.56 350.81 3.08 42.89 97.26 207.56 4472.84 910.93 2994.71 567.13
Percent Change
43.35% -29.15% -60.77% -28.30% -35.05% -26.11% -34.56% -78.34% -34.14% 33.51%
West Virginia 0.00 Pre1994 80.72 170.95 5.76 18.19 42.21 104.76 2247.95 654.99 1419.58 173.39
Post1996 282.33 282.01 3.81 19.94 42.74 215.49 2388.36 589.38 1619.71 179.27
Percent Change
71.41% 39.38% -51.15% 8.77% 1.24% 51.39% 5.88% -11.13% 12.36% 3.28%
Wisconsin 1.00 Pre1994 118.94 318.24 8.08 27.43 116.78 165.97 3880.17 878.09 2752.66 249.44
Post1996 381.52 270.86 5.29 23.16 91.68 150.74 2698.64 428.83 2061.87 207.97
Percent Change
68.82% -17.49% -52.72% -18.46% -27.38% -10.10% -43.78% -104.77%
-33.50% -19.94%
Wyoming 0.00 Pre1994 172.29 303.76 4.99 27.33 26.68 244.78 4042.18 746.76 3090.36 205.08
Post1996 369.15 240.84 2.71 28.79 15.11 194.24 3022.10 463.79 2423.78 134.51
Percent Change
53.33% -26.12% -84.10% 5.10% -76.58% -26.02% -33.75% -61.01% -27.50% -52.46%

APPENDIX B
This table shows the average violent crime rate, average property crime rate and average imprisonment rate for TSL and Non-TSL states from1978-2012.
1978 1979 1980 1981 1982 1983 1984 1985 1986 1987 1988 1989
TSL States Violent Crime Rate 432.96 474.92 496.05 496.97 484.76 447.24 452.96 469.32 504.69 483.64 510.45 531.06
Property Crime Rate 4586.89 4985.49 5244.61 5197.11 4935.09 4550.20 4420.69 4612.90 4790.04 4863.48 4904.85 4915.49
Imprisonment Rate 126.00 130.00 136.00 152.00 170.00 179.00 187.00 198.00 209.00 221.00 231.00 255.00
Non-TSL States Violent Crime Rate 318.41 351.96 370.05 367.43 348.18 336.11 336.02 346.55 365.12 364.62 379.82 389.88
Property Crime Rate 4088.13 4396.52 4680.45 4586.77 4343.64 4003.42 3812.46 3917.82 4097.17 4171.13 4116.41 4124.16
Imprisonment Rate 84.85 88.14 91.82 100.96 111.83 119.24 125.90 137.76 149.69 159.22 169.87 190.64
1990 1991 1992 1993 1994 1995 1996 1997 1998 1999 2000 2001 TSL States Violent Crime Rate 593.54 624.44 627.93 639.61 626.14 613.95 582.31 569.72 534.01 495.89 479.00 482.35
Property Crime Rate 5000.71 5045.62 4856.11 4760.29 4783.31 4830.37 4692.61 4638.52 4362.06 4009.66 3867.95 3870.08
Imprisonment Rate 270.00 283.00 293.00 313.00 332.00 349.00 363.00 378.00 397.00 410.00 416.00 422.00
Non-TSL States Violent Crime Rate 422.27 435.21 438.06 438.75 425.58 410.51 376.81 371.87 358.83 334.60 326.89 317.88
Property Crime Rate 4169.63 4208.58 4026.20 3897.43 3925.34 3982.14 3840.14 3754.73 3485.48 3245.46 3184.11 3245.62
Imprisonment Rate 201.16 209.65 220.21 226.21 239.47 254.02 270.14 283.55 293.82 301.50 304.80 309.58
2002 2003 2004 2005 2006 2007 2008 2009 2010 2011 2012
TSL States Violent Crime Rate 473.78 461.61 455.82 458.57 483.47 479.16 463.91 438.80 408.25 394.09 390.45
Property Crime Rate 3832.17 3791.01 3710.06 3635.33 3521.64 3444.21 3367.40 3174.57 3066.00 3045.27 2996.49
Imprisonment Rate 431.00 435.00 437.00 437.00 446.00 450.00 449.00 445.00 442.00 435.00 425.00 Non_TSL States Violent Crime Rate 315.31 309.39 307.89 314.32 325.01 319.59 318.02 306.74 301.76 292.33 293.63
Property Crime Rate 3259.24 3166.43 3108.42 3035.79 2932.64 2839.29 2756.43 2674.08 2608.79 2623.85 2596.83
Imprisonment Rate 316.00 319.62 324.99 338.32 341.76 346.51 342.45 337.86 334.68 335.64 337.85

APPENDIX C
This table shows the average length of a prison term for TSL and Non-TSL states in 1990 and in 2009.
TSL States Violent Crimes: Average Time
Served Property Crime: Average Time
Served State 1990 2009
State 1990 2009
ARKANSAS 3.6 5.1
ARKANSAS 1.7 2.5 CALIFORNIA 2.8 4.6
CALIFORNIA 1.9 2.2
COLORADO 3.1 4.6
COLORADO 2.2 2.6 FLORIDA 2.1 5
FLORIDA 0.9 2.7
GEORGIA 4 5.6
GEORGIA 1.5 2.5 ILLINOIS 3.8 3.8
ILLINOIS 1.9 1.4
LOUISIANA 5.4 5.3
LOUISIANA 2.2 2.1 NEVADA 5.8 4.4
NEVADA 2.6 1.9
NEW JERSEY 3.5 4.7
NEW JERSEY 2.1 1.9 N. CAROLINA 3 4.6
N. CAROLINA 1.4 1.7
N. DAKOTA 2.1 3
N. DAKOTA 1.1 1.6 PENNSYLVANIA 4.1 5.9
PENNSYLVANIA 2.5 2.9
S. CAROLINA 3.3 4
S. CAROLINA 1.6 1.9 TENNESSEE 2.6 3.7
TENNESSEE 2.4 1.3
UTAH 4.2 5.5
UTAH 2.1 2.3 VIRGINIA 3.6 6
VIRGINIA 1.6 2.7
WASHINGTON 2.6 4.2
WASHINGTON 1.7 1.9 WISCONSIN 3.5 4.8
WISCONSIN 2.3 3.2
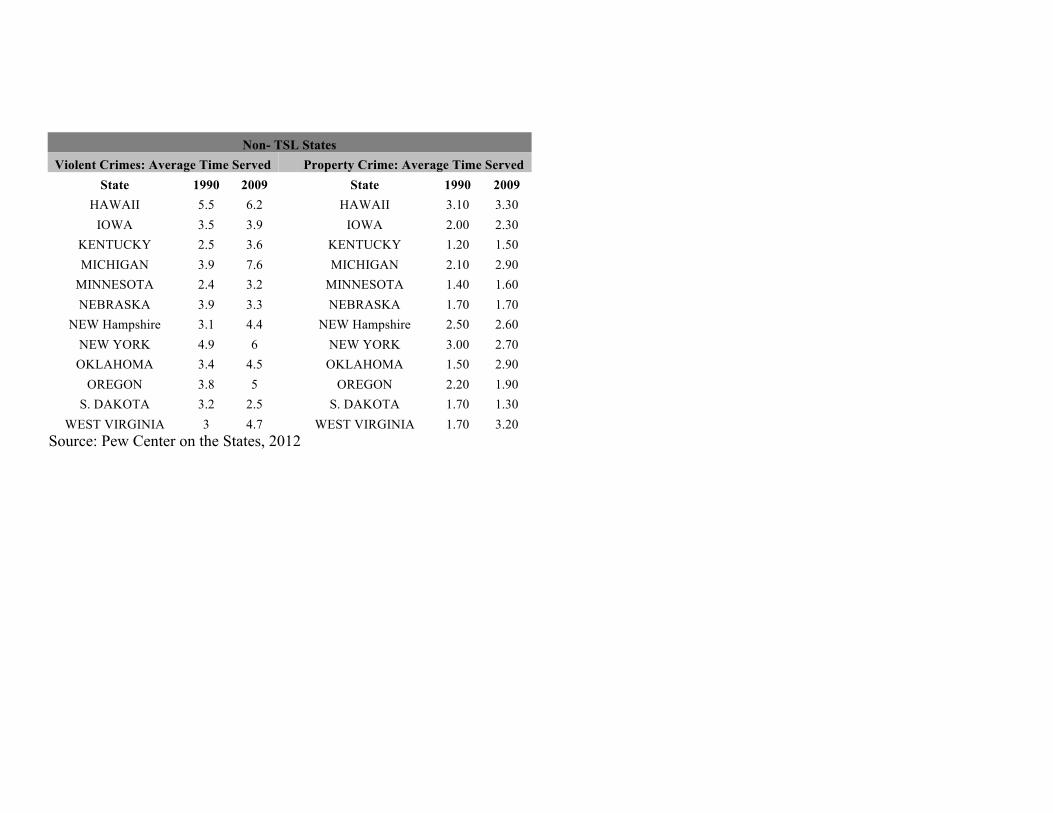
Non- TSL States Violent Crimes: Average Time Served Property Crime: Average Time Served
State 1990 2009
State 1990 2009 HAWAII 5.5 6.2
HAWAII 3.10 3.30
IOWA 3.5 3.9
IOWA 2.00 2.30 KENTUCKY 2.5 3.6
KENTUCKY 1.20 1.50
MICHIGAN 3.9 7.6
MICHIGAN 2.10 2.90 MINNESOTA 2.4 3.2
MINNESOTA 1.40 1.60
NEBRASKA 3.9 3.3
NEBRASKA 1.70 1.70 NEW Hampshire 3.1 4.4
NEW Hampshire 2.50 2.60
NEW YORK 4.9 6
NEW YORK 3.00 2.70 OKLAHOMA 3.4 4.5
OKLAHOMA 1.50 2.90
OREGON 3.8 5
OREGON 2.20 1.90 S. DAKOTA 3.2 2.5
S. DAKOTA 1.70 1.30
WEST VIRGINIA 3 4.7
WEST VIRGINIA 1.70 3.20 Source: Pew Center on the States, 2012


