CAPRI 3 rd CAP-STRAT Workshop, 24./25.03.2003, Bologna CAPRI Common Agricultural Policy Regional...
12
CAPRI CAPRI 3 rd CAP-STRAT Workshop, 24./25.03.2003, Bologna Content •What are marginal abatement cost curves (MACC) ? •Global Warming Gases in CAPRI •Why GW and why CAPRI ? •Methodology •First results
-
Upload
christian-bridges -
Category
Documents
-
view
218 -
download
1
Transcript of CAPRI 3 rd CAP-STRAT Workshop, 24./25.03.2003, Bologna CAPRI Common Agricultural Policy Regional...

CAPRI CAPRI
3rd CAP-STRAT Workshop, 24./25.03.2003, Bologna
Content
• What are marginal abatement cost curves (MACC) ?
• Global Warming Gases in CAPRI
• Why GW and why CAPRI ?
• Methodology
• First results

CAPRI CAPRI
3rd CAP-STRAT Workshop, 24./25.03.2003, Bologna
Abatement cost curves
• Abatement = reduction of negative externality
• Abatement cost curves (ACC)= relation between emission reduction level and total costs
• Marginal abatement cost curves (MACC)= relation between emission reduction level and costs for the last abated unit
• MACC allow (a) to set up an optimal abatement strategy(b) to calculate regional cost differences
under a certain environmental policy (e.g. Kyoto Protocol, nitrate directive, ...)

CAPRI CAPRI
3rd CAP-STRAT Workshop, 24./25.03.2003, Bologna
Economics of abatement
Emissions Abatement
MAC MACC1
e0eh el
Two abatement technologies
Abatement costs
MACC2

CAPRI CAPRI
3rd CAP-STRAT Workshop, 24./25.03.2003, Bologna
Global Warming Gases in APRI
• Distinction between direct and indirect emissions
• Direct emission stem directly from agricultural activities(Methane from animals and rice, emissions during fertilizer application or storage, background emission from soils)
• Indirect emission stem from other sectorsand are linked to input use in agriculture(fertilizer and energy production)
• Both are linked to activities levels (hectares/heads) in the supply model via emission factors
• Aggregated to Global Warming Potential via the definition of CO2 impact equivalents

CAPRI CAPRI
3rd CAP-STRAT Workshop, 24./25.03.2003, Bologna
• Content of nutrients in harvested material (kg/ton)
• Atmospheric deposition at Nuts 0 level (kg/ha)
• Available nutrient per crop from atmospheric deposition: available nutrient component for the crop coming from the atmosphere.
• Biological fixation: ”self-made fertiliser”
• Mineralisation: nitrate from soils available for the crop (kg/ha)
• Global warming potential of different gases
• Gas output per ton of mineral fertiliser produced (indirectly applied)
• CH4 Output of animals kg per animal and year
• NPK balances
(fertiliser application)
• Optimal activity Levels
Emissions
(passive indicator)
Global Warming Gases in APRI

CAPRI CAPRI
3rd CAP-STRAT Workshop, 24./25.03.2003, Bologna
Measuring emissions at farm level
YEAR 2002 Emissions (Kg Gas/ ha oder head)*
Aktivity in theregion / Farm type
Technologie
CO2 NO2 CH4
Activity level
ha/head
GWPUnits**
Biological + + X1 +- Wheat production
Conventional + + X2 +
High yield + + X3 -- Dairy cows
Low yield + + X4 +
- Afforestation> 20y Medium density (-) X5(-)
- Grass ___ - + X6+ -
- Pastures ___ (-) X7(-)
Total Xi GWPi
* not measured at farm level but as fixed coefficient** GWP = Global Warming Potential as CO2 Equivalents
CAPRI CAPRI
3rd CAP-STRAT Workshop, 24./25.03.2003, Bologna
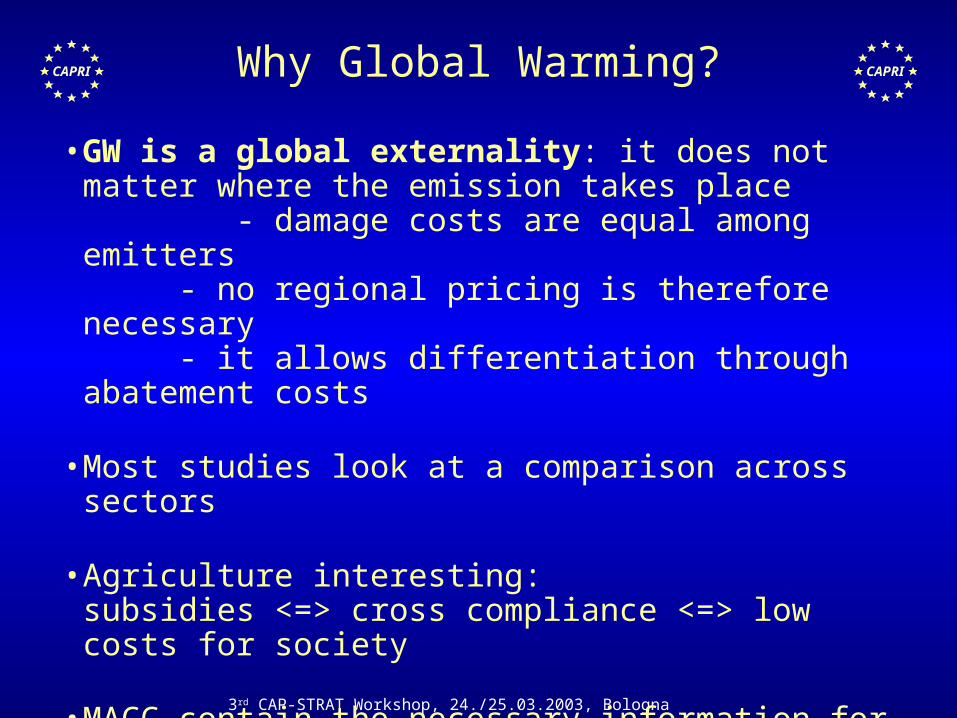
Why Global Warming?
• GW is a global externality: it does not matter where the emission takes place - damage costs are equal among emitters
- no regional pricing is therefore necessary- it allows differentiation through abatement costs
• Most studies look at a comparison across sectors
• Agriculture interesting:subsidies <=> cross compliance <=> low costs for society
• MACC contain the necessary information for an effective use of agri-environmental instruments=> new orientation of the CAP (multi-functionality)

CAPRI CAPRI
3rd CAP-STRAT Workshop, 24./25.03.2003, Bologna
Why CAPRI?
• CAPRI offers:
- a complete analysis of the agricultural sector=> analyse different strategies inside agriculture
- direct modeling of GWP reductions(ex-post indicator)
- a microeconomic orientation(optimisation problem, shadow values)
- modelling of permit markets(hot issue in the actual international negotiations)

CAPRI CAPRI
3rd CAP-STRAT Workshop, 24./25.03.2003, Bologna
Methodology
AB_COST = MAX_Inc(s.t. g>0, GWP unrestricted)
- MAX_Inc(s.t. g>0, GWP <Kyoto)
where: g restrictions in models
(land, set aside,quotas ...)
GWP output of GWP from agriculture
MAX_Inc maximal agricultural income
Kyoto reduction objective

CAPRI CAPRI
3rd CAP-STRAT Workshop, 24./25.03.2003, Bologna
First Results
Marginal Abatement Cost Curves (EU countries)
0.0
50.0
100.0
150.0
200.0
250.0
300.0
350.0
400.0
1% 3% 5% 7% 9% 11% 13% 15% 17% 19%Final reduction level (1998 emissions base line)
EU
RO
S /
ton
CO 2
e
Greece
Germany
Bel+Lux
Spain
Denmark
France
Ireland
Italy
Holland
Austria
Portugal
Sweden
Finland
U.K.

CAPRI CAPRI
3rd CAP-STRAT Workshop, 24./25.03.2003, Bologna
First results
Analysis of individual Gases (EU level)
3953
275
-4.9-2.9
-1.3 -2.2
-14.8
-9.5-7.4
-4.5
-23.2
-13.7
-19.9
-30.4
Base Year(1998)
5% 8% 10% 15%
Gas
em
issi
on
s o
n t
he
bas
e ye
ar (
MM
t G
WP
)
GWP Reduction steps
% r
edu
ctio
n o
f in
div
idu
al
gas
es
Carbon Dioxide
Methane
Nitrous Oxide
Methane (%)
Nitrous Oxide (%)
Carbon Dioxide /%)

CAPRI CAPRI
3rd CAP-STRAT Workshop, 24./25.03.2003, Bologna
First results
Initial Emissions (1998)
0.00
10.00
20.00
30.00
40.00
50.00
60.00
70.00
80.00
90.00G
R
ES
GE
BE
+LU DK
FR IR IT
ND AT
PT
SW F
I
UK
European Countries
MM
t G
WP
N2O (CAPRI 98) CH4(CAPRI 98) N2O (IPCC 94) CH4(IPCC 94)