Canaccord Mar 4 09
29
Canaccord Adams is the global capital markets group of Canaccord Capital Inc. (CCI : TSX|AIM) The recommendations and opinions expressed in this Investment Research accurately reflect the Investment Analyst’s personal, independent and objective views about any and all the Designated Investments and Relevant Issuers discussed herein. For important information, please see the Important Disclosures section in the appendix of this document or visit or visit http://www.canaccordadams.com/research/Disclosure.htm . 4 March 2009 Wendell Zerb [email protected] 1.604.643.7485 Eric Zaunscherb [email protected] 1.604.699.0829 Nicholas Campbell [email protected] 1.604.643.7027 Adam Melnyk (Research Associate) [email protected] 1.604.643.1655 Iris Varga (Research Assistant) [email protected] 1.604.643.7412 In this issue: Market/Commodities Snapshot 2 Foreword 3 Other News 4 Exploration Updates Brilliant Mining Corp. 6 Diamonds North Resources Ltd. 7 Exeter Resource Corp. 8 Mega Uranium Ltd. 10 UEX Corporation 11 Uracan Resources Ltd. 13 Site Visit Notes Extract Resources Ltd. 14 Drill Bitz 20 Uranium In Situ 21 Gold In Situ 23 Research Universe 24 Ink Spots 25 Index 27 Disclosures 28 SURVIVOR • Stock exchange notices to companies defaulting on list requirements, have been on the rise. Precious metal equities have largely avoided the issue; however, many others are not so fortunate. We’ve outlined a cross section of companies trying to survive, but which are currently facing delisting. We’ve also added a list of junior exploration companies that have hit new 52-week lows. • The Prospectors and Developers convention in Toronto is on this week. For those of us attending, it will likely be the typical four days of survival: battling crowds, hospitality suites, promoters, and negative metals price forecasters… • Exploration updates: Brilliant Mining Corp. (BMC : TSX-V : C$0.10 | Not rated) Diamonds North Resources Ltd. (DDN : TSX-V : C$0.12 | Not rated) Exeter Resource Corp. (XRC : TSX-V : C$2.70 | Speculative Buy) Mega Uranium Ltd. MGA : TSX : C$0.71 | Not rated) UEX Corporation (UEX : TSX : C$0.76 | Not rated) Uracan Resources Ltd (URC : TSX-V : C$0.22 | Not rated) • Site visit notes: Extract Resources Ltd. (XRC : TSX : C$1.75 | Not rated) Figure 1: Gold price versus average value US$/oz in situ 20 30 40 50 60 70 80 90 100 110 120 19-Jul-07 2-Aug-07 16-Aug-07 30-Aug-07 13-Sep-07 27-Sep-07 11-Oct-07 25-Oct-07 8-Nov-07 22-Nov-07 6-Dec-07 20-Dec-07 3-Jan-08 17-Jan-08 31-Jan-08 14-Feb-08 28-Feb-08 13-Mar-08 27-Mar-08 10-Apr-08 24-Apr-08 8-May-08 22-May-08 5-Jun-08 19-Jun-08 3-Jul-08 17-Jul-08 31-Jul-08 14-Aug-08 28-Aug-08 11-Sep-08 25-Sep-08 9-Oct-08 23-Oct-08 6-Nov-08 20-Nov-08 4-Dec-08 18-Dec-08 9-Jan-09 23-Jan-09 5-Feb-09 20-Feb-09 Average Value US$/oz in situ 400 500 600 700 800 900 1000 Gold Price (US$) Average Value US$/oz in situ Gold Price C$:US$ 0.78 Ag:Au ratio 72:1 Source: Capital IQ, Thomson ONE, Canaccord Adams Current value: US$40.06/oz ↓
-
Upload
christopher-r-anderson -
Category
Business
-
view
1.000 -
download
0
Transcript of Canaccord Mar 4 09

Canaccord Adams is the global capital markets group of Canaccord Capital Inc. (CCI : TSX|AIM) The recommendations and opinions expressed in this Investment Research accurately reflect the Investment Analyst’s personal, independent and objective views about any and all the Designated Investments and Relevant Issuers discussed herein. For important information, please see the Important Disclosures section in the appendix of this document or visit or visit http://www.canaccordadams.com/research/Disclosure.htm.
4 March 2009 Wendell Zerb [email protected] 1.604.643.7485 Eric Zaunscherb [email protected] 1.604.699.0829 Nicholas Campbell [email protected] 1.604.643.7027 Adam Melnyk (Research Associate) [email protected] 1.604.643.1655 Iris Varga (Research Assistant) [email protected] 1.604.643.7412 In this issue: Market/Commodities Snapshot 2 Foreword 3 Other News 4 Exploration Updates Brilliant Mining Corp. 6 Diamonds North Resources Ltd. 7 Exeter Resource Corp. 8 Mega Uranium Ltd. 10 UEX Corporation 11 Uracan Resources Ltd. 13
Site Visit Notes Extract Resources Ltd. 14
Drill Bitz 20 Uranium In Situ 21 Gold In Situ 23 Research Universe 24 Ink Spots 25 Index 27 Disclosures 28
SURVIVOR • Stock exchange notices to companies defaulting on list requirements, have
been on the rise. Precious metal equities have largely avoided the issue;
however, many others are not so fortunate. We’ve outlined a cross section of
companies trying to survive, but which are currently facing delisting. We’ve
also added a list of junior exploration companies that have hit new 52-week
lows.
• The Prospectors and Developers convention in Toronto is on this week. For
those of us attending, it will likely be the typical four days of survival:
battling crowds, hospitality suites, promoters, and negative metals price
forecasters…
• Exploration updates:
Brilliant Mining Corp. (BMC : TSX-V : C$0.10 | Not rated)
Diamonds North Resources Ltd. (DDN : TSX-V : C$0.12 | Not rated)
Exeter Resource Corp. (XRC : TSX-V : C$2.70 | Speculative Buy)
Mega Uranium Ltd. MGA : TSX : C$0.71 | Not rated)
UEX Corporation (UEX : TSX : C$0.76 | Not rated)
Uracan Resources Ltd (URC : TSX-V : C$0.22 | Not rated)
• Site visit notes:
Extract Resources Ltd. (XRC : TSX : C$1.75 | Not rated)
Figure 1: Gold price versus average value US$/oz in situ
20
30
40
50
60
70
80
90
100
110
120
19-Ju
l-07
2-Aug
-0716
-Aug-0
730
-Aug-0
713
-Sep-0
727
-Sep-0
711
-Oct-
0725
-Oct-
078-N
ov-07
22-N
ov-07
6-Dec
-0720
-Dec
-073-J
an-08
17-Ja
n-08
31-Ja
n-08
14-Fe
b-08
28-Fe
b-08
13-M
ar-08
27-M
ar-08
10-Ap
r-08
24-Ap
r-08
8-May
-0822
-May
-085-J
un-08
19-Ju
n-08
3-Jul-
0817
-Jul-0
831
-Jul-0
814
-Aug-0
828
-Aug-0
811
-Sep-0
825
-Sep-0
89-O
ct-08
23-O
ct-08
6-Nov
-0820
-Nov
-084-D
ec-08
18-D
ec-08
9-Jan
-0923
-Jan-0
95-F
eb-09
20-Fe
b-09
Aver
age
Valu
e US
$/oz
in si
tu
400
500
600
700
800
900
1000
Gold
Pric
e (U
S$)
Average Value US$/oz in situ Gold Price
C$:US$ 0.78 Ag:Au ratio 72:1 Source: Capital IQ, Thomson ONE, Canaccord Adams
Current value: US$40.06/oz ↓
Junior Mining Weekly | 2 4 March 2009
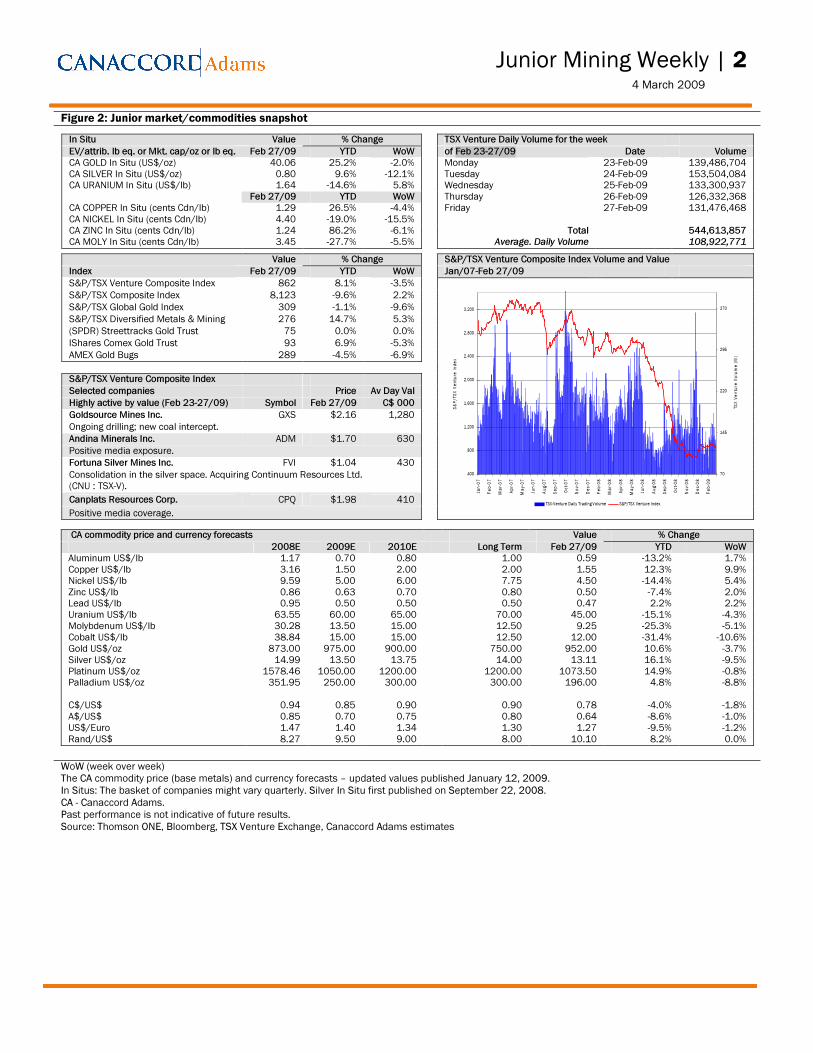
Figure 2: Junior market/commodities snapshot
In Situ Value % Change TSX Venture Daily Volume for the week EV/attrib. lb eq. or Mkt. cap/oz or lb eq. Feb 27/09 YTD WoW of Feb 23-27/09 Date Volume CA GOLD In Situ (US$/oz) 40.06 25.2% -2.0% Monday 23-Feb-09 139,486,704 CA SILVER In Situ (US$/oz) 0.80 9.6% -12.1% Tuesday 24-Feb-09 153,504,084 CA URANIUM In Situ (US$/lb) 1.64 -14.6% 5.8% Wednesday 25-Feb-09 133,300,937 Feb 27/09 YTD WoW Thursday 26-Feb-09 126,332,368 CA COPPER In Situ (cents Cdn/lb) 1.29 26.5% -4.4% Friday 27-Feb-09 131,476,468 CA NICKEL In Situ (cents Cdn/lb) 4.40 -19.0% -15.5% CA ZINC In Situ (cents Cdn/lb) 1.24 86.2% -6.1% Total 544,613,857 CA MOLY In Situ (cents Cdn/lb) 3.45 -27.7% -5.5% Average. Daily Volume 108,922,771
Value % Change S&P/TSX Venture Composite Index Volume and Value Index Feb 27/09 YTD WoW Jan/07-Feb 27/09 S&P/TSX Venture Composite Index 862 8.1% -3.5% S&P/TSX Composite Index 8,123 -9.6% 2.2% S&P/TSX Global Gold Index 309 -1.1% -9.6% S&P/TSX Diversified Metals & Mining 276 14.7% 5.3% (SPDR) Streettracks Gold Trust 75 0.0% 0.0% IShares Comex Gold Trust 93 6.9% -5.3% AMEX Gold Bugs 289 -4.5% -6.9% S&P/TSX Venture Composite Index Selected companies Price Av Day Val Highly active by value (Feb 23-27/09) Symbol Feb 27/09 C$ 000 Goldsource Mines Inc. GXS $2.16 1,280 Ongoing drilling; new coal intercept. Andina Minerals Inc. ADM $1.70 630 Positive media exposure. Fortuna Silver Mines Inc. FVI $1.04 430 Consolidation in the silver space. Acquiring Continuum Resources Ltd. (CNU : TSX-V). Canplats Resources Corp. CPQ $1.98 410 Positive media coverage.
400
800
1,200
1,600
2,000
2,400
2,800
3,200
Jan-0
7
Feb-0
7
Mar-0
7
Apr-0
7
May
-07
Jun-0
7
Aug-0
7
Sep-0
7
Oct-0
7
Nov-0
7
Dec-0
7
Feb-0
8
Mar-0
8
Apr-0
8
May
-08
Jun-0
8
Aug-0
8
Sep-0
8
Oct-0
8
Nov-0
8
Dec-0
8
Feb-0
9
S&P/
TSX
Vent
ure I
ndex
70
145
220
295
370
TSX V
entur
e Volu
me (M
)
TSX-Venture Daily Trading Volume S&P/TSX Venture Index
CA commodity price and currency forecasts Value % Change 2008E 2009E 2010E Long Term Feb 27/09 YTD WoW Aluminum US$/lb 1.17 0.70 0.80 1.00 0.59 -13.2% 1.7% Copper US$/lb 3.16 1.50 2.00 2.00 1.55 12.3% 9.9% Nickel US$/lb 9.59 5.00 6.00 7.75 4.50 -14.4% 5.4% Zinc US$/lb 0.86 0.63 0.70 0.80 0.50 -7.4% 2.0% Lead US$/lb 0.95 0.50 0.50 0.50 0.47 2.2% 2.2% Uranium US$/lb 63.55 60.00 65.00 70.00 45.00 -15.1% -4.3% Molybdenum US$/lb 30.28 13.50 15.00 12.50 9.25 -25.3% -5.1% Cobalt US$/lb 38.84 15.00 15.00 12.50 12.00 -31.4% -10.6% Gold US$/oz 873.00 975.00 900.00 750.00 952.00 10.6% -3.7% Silver US$/oz 14.99 13.50 13.75 14.00 13.11 16.1% -9.5% Platinum US$/oz 1578.46 1050.00 1200.00 1200.00 1073.50 14.9% -0.8% Palladium US$/oz 351.95 250.00 300.00 300.00 196.00 4.8% -8.8% C$/US$ 0.94 0.85 0.90 0.90 0.78 -4.0% -1.8% A$/US$ 0.85 0.70 0.75 0.80 0.64 -8.6% -1.0% US$/Euro 1.47 1.40 1.34 1.30 1.27 -9.5% -1.2% Rand/US$ 8.27 9.50 9.00 8.00 10.10 8.2% 0.0%
WoW (week over week) The CA commodity price (base metals) and currency forecasts – updated values published January 12, 2009. In Situs: The basket of companies might vary quarterly. Silver In Situ first published on September 22, 2008. CA - Canaccord Adams. Past performance is not indicative of future results. Source: Thomson ONE, Bloomberg, TSX Venture Exchange, Canaccord Adams estimates

Junior Mining Weekly | 3 4 March 2009
SURVIVOR According to the Globe and Mail (February 25, 2009), the New York Stock Exchange is
considering relaxing a rule that requires shares to trade above a dollar. Currently, a
NYSE-listed company’s shares cannot remain below US$1.00 for over 30 consecutive
days. If that happens, the company gets six months to prove to the NYSE it can boost its
stock price. Already, on January 23, 2009, the exchange temporarily decreased its
required market capitalization threshold to US$15 million from US$25 million. The
minimum market cap was raised to US$25 million from US$15 million in 2004. Roughly
65 companies, or 3% of the NYSE’s 1,950 listed companies, are currently listed on the
NYSE website as “non-compliant with NYSE quantitative continued listing standards.”
Included on this list are mining companies Lundin Mining (LMC : NYSE) and Coeur
d’Alene Mines (CDE : NYSE). In Figures 3 and 4 we list the mining and exploration
companies on the TSX and TSX Venture exchanges that have been similarly delisted or
suspended.
Figure 3: Delistings on S&P/TSX and S&P/TSX Venture Exchange between December 1, 2008 and January 28, 2009 Company Name Symbol Delist Date
1 Delta Exploration Inc. DEV 4-Feb-09 2 Golden Oasis Exploration Corp GOT 2-Feb-09 3 Aranka Gold Inc. ARK 29-Jan-09 4 Pinewood Resources Ltd. PNW 13-Jan-09 5 Winchester Minerals And Gold Exploration Ltd WMG 13-Jan-09 6 Patricia Mining Corp. PAT 17-Dec-08 7 Oromin Explorations Ltd. OLE 16-Dec-08 8 Fusion Resources Limited FNS 19-Feb-09 9 GLR Resources Inc. GRS 7-Jan-09 10 Gateway Gold Corp. GTQ 23-Dec-08 11 Campbell Resources Inc. CCH 19-Dec-08
Source: www.tsx.com, Canaccord Adams
Figure 4: Suspensions on S&P/TSX and S&P/TSX Venture Exchange between December 1, 2008 and January 28, 2009
Company Name Symbol 1 Pine Valley Mining Corporation PVM 2 Tahera Diamond Corporation TAH 3 Big Bar Resources Corporation BBK 4 Emerald Isle Resources Inc. EIR 5 Great Gold Mines N.L. GGM 6 Gulfside Minerals Ltd. GMG 7 Kansai Mining Corporation KAN 8 Majestic Gold Corp. MJS 9 Neo Alliance Minerals Inc. NAM 10 Pacific Imperial Mines Inc. PPM 11 Superior Canadian Resources Inc. CAD 12 Vega Gold Ltd. VGG 13 Vostok Minerals Inc. VOS 14 West Hawk Development Corp. WHD
Source: www.tsx.com, Canaccord Adams
Junior Mining Weekly | 4 4 March 2009
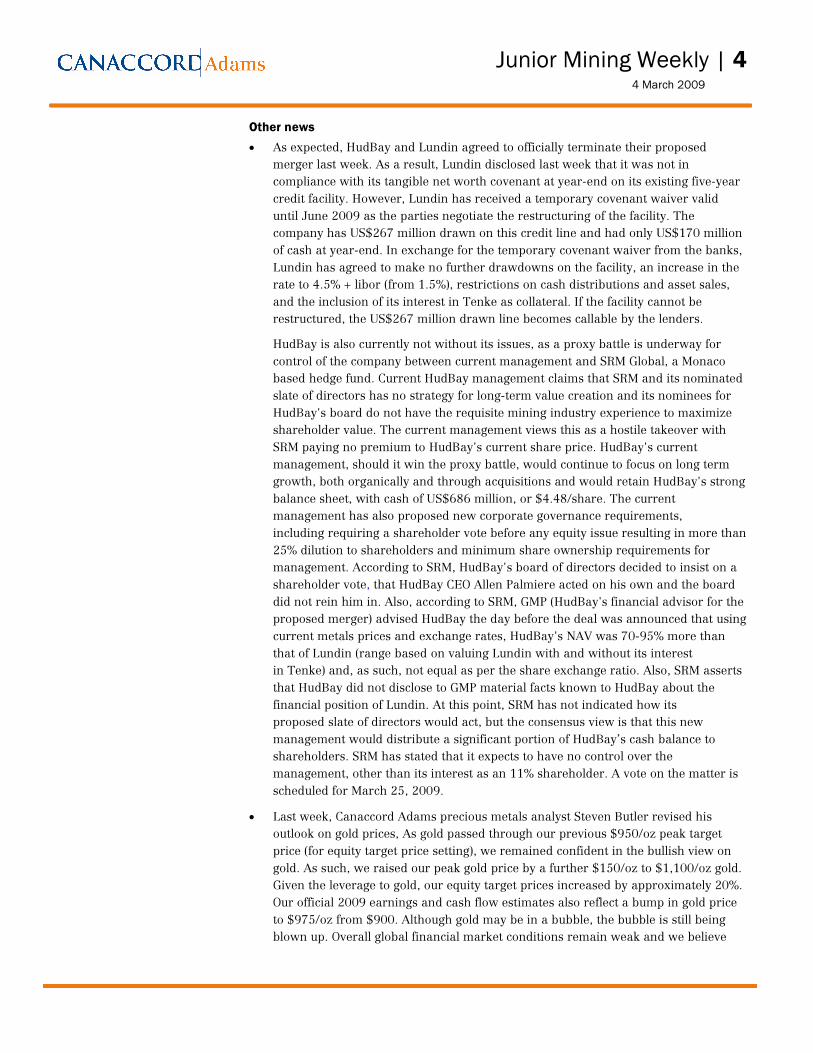
Other news • As expected, HudBay and Lundin agreed to officially terminate their proposed
merger last week. As a result, Lundin disclosed last week that it was not in
compliance with its tangible net worth covenant at year-end on its existing five-year
credit facility. However, Lundin has received a temporary covenant waiver valid
until June 2009 as the parties negotiate the restructuring of the facility. The
company has US$267 million drawn on this credit line and had only US$170 million
of cash at year-end. In exchange for the temporary covenant waiver from the banks,
Lundin has agreed to make no further drawdowns on the facility, an increase in the
rate to 4.5% + libor (from 1.5%), restrictions on cash distributions and asset sales,
and the inclusion of its interest in Tenke as collateral. If the facility cannot be
restructured, the US$267 million drawn line becomes callable by the lenders.
HudBay is also currently not without its issues, as a proxy battle is underway for
control of the company between current management and SRM Global, a Monaco
based hedge fund. Current HudBay management claims that SRM and its nominated
slate of directors has no strategy for long-term value creation and its nominees for
HudBay's board do not have the requisite mining industry experience to maximize
shareholder value. The current management views this as a hostile takeover with
SRM paying no premium to HudBay's current share price. HudBay's current
management, should it win the proxy battle, would continue to focus on long term
growth, both organically and through acquisitions and would retain HudBay's strong
balance sheet, with cash of US$686 million, or $4.48/share. The current
management has also proposed new corporate governance requirements,
including requiring a shareholder vote before any equity issue resulting in more than
25% dilution to shareholders and minimum share ownership requirements for
management. According to SRM, HudBay's board of directors decided to insist on a
shareholder vote, that HudBay CEO Allen Palmiere acted on his own and the board
did not rein him in. Also, according to SRM, GMP (HudBay's financial advisor for the
proposed merger) advised HudBay the day before the deal was announced that using
current metals prices and exchange rates, HudBay's NAV was 70-95% more than
that of Lundin (range based on valuing Lundin with and without its interest
in Tenke) and, as such, not equal as per the share exchange ratio. Also, SRM asserts
that HudBay did not disclose to GMP material facts known to HudBay about the
financial position of Lundin. At this point, SRM has not indicated how its
proposed slate of directors would act, but the consensus view is that this new
management would distribute a significant portion of HudBay’s cash balance to
shareholders. SRM has stated that it expects to have no control over the
management, other than its interest as an 11% shareholder. A vote on the matter is
scheduled for March 25, 2009.
• Last week, Canaccord Adams precious metals analyst Steven Butler revised his
outlook on gold prices, As gold passed through our previous $950/oz peak target
price (for equity target price setting), we remained confident in the bullish view on
gold. As such, we raised our peak gold price by a further $150/oz to $1,100/oz gold.
Given the leverage to gold, our equity target prices increased by approximately 20%.
Our official 2009 earnings and cash flow estimates also reflect a bump in gold price
to $975/oz from $900. Although gold may be in a bubble, the bubble is still being
blown up. Overall global financial market conditions remain weak and we believe

Junior Mining Weekly | 5 4 March 2009
the safe haven flight to gold can continue. Credit risk, while lower than most recent
highs, is as high as the first peak last March which coincided with the collapse of
Bear Stearns; but, gold is still lower than the US$1,003/oz peak set one year ago.
While inflation has not yet registered in near-term expectations, we ultimately
believe that inflation and general devaluation of paper currencies will be the result of
the concerted monetary and fiscal policies to reflate the global economy. Investment
demand as demonstrated by the abrupt rise in SPDR gold trust holdings. Already
year-to-date, this trust has added over 228 tonnes of gold for an annualized increase
of over 1,700 tonnes in this trust alone. The record-setting level of investment
demand is more than offsetting the slackening levels of fabrication demand, lower
de-hedging demand and potentially higher scrap supply at these high prices.
• The International Convention, Trade Show & Investors Exchange – PDAC – is
ongoing in Toronto at the Metro Toronto Convention Centre, between March 1-4,
2009. In 2008, there were just over 20,000 convention registrants as well as 587
companies exhibiting.
• At the Prospectors and Developers Association of Canada Conference, held in
Toronto this week, Dr. Jose Serrano Delgado, Ecuador's Sub-Secretary of
Mines, announced that the suspension on mining activities in Ecuador that has been
in place since April, 2008 has been lifted. According to Dr. Delgado, concession
holders will soon receive letters formally allowing the resumption of work from the
Ministry of Mines and Petroleum. Companies with projects in Ecuador include
Kinross (K : TSX), IAMGold (IMG : TSX), Corriente Resources (CTQ : TSX), Dynasty
Metals and Mining (DMM : TSX), International Minerals (IMZ : TSX), and
Cornerstone Capital Resources (CGP : TSX-V).
Figure 5: PDAC 2009
Source: www.pdac.ca

Junior Mining Weekly | 6 4 March 2009
EXPLORATION UPDATE BRILLIANT MINING CORP. (BMC : TSX-V : C$0.10 | NOT RATED) Figure 6: BMC : TSX-V Figure 7: BMC : TSX-V
Shares o/s (M): 73.0
Shares fd (M): 79.9 Working Cap. (M): $0.1 Market Cap. (M): C$7.3 Co. Website: www.brilliantmining.com
Past 12-months – purchased: $96,683 Past 12-months – sold: 300,000 Since Dec. 24, 2008 - acquisitions or dispositions: NIL
Source: Company reports, StockCharts.com Source: INK Research
Brilliant Mining is a Vancouver-based company focused on the exploration for and production of nickel. The company owns
a 25% interest in the producing Lanfranchi nickel mine in Western Australia and wholly owns the Michikamau Ni-Cu-Co-
PGE exploration property in central Labrador. The company melds strong Canadian management in the form of Chairman
John Robins, President Mike Sieb, and CEO John Williamson with exceptional Australian engineering in the form of hands-
on directors Leigh Junk and Ian Junk. The company recently announced plans to sell its interest in the Lanfranchi mine:
• Brilliant has entered into an agreement to sell its indirect interest in the producing Lanfranchi nickel mine in Western
Australia to majority owner Panoramic Resources (PAN : ASX : A$0.81 | Not rated). In consideration, Brilliant would
retain C$6 million in working capital, receive 12 million shares in Panoramic and receive 3 million share purchase
warrants exercisable in Panoramic common shares at A$1.50 to December 31, 2012. Brilliant shareholders will
receive their proportional share of Panoramic securities, thus maintaining exposure to the Lanfranchi mine subject to a
six-month hold period. Brilliant management was motivated to strike this deal with Panoramic in order to avoid
dilution in this difficult equity market stemming from operational funding obligations.
• Brilliant recently reported record nickel production for the three months ended December 31, 2008. The mine had
produced 115,064 tonnes of ore at 2.45% nickel for 6.2 million pounds of nickel in concentrate. These figures
represented year-over-year increases of 84% and 74% in ore mined and metal in concentrate, respectively. Unit
payable cash costs, net of copper credits, amounted to US$3.65 per pound in the quarter. The Lanfranchi mine hosts
measured and indicated resources of 3.7 million tonnes grading 2.57% nickel plus 1.6 million tonnes inferred grading
1.84% nickel for a global resource of 276.3 million pounds of nickel.
• It is unfortunate the conditions have backed Brilliant into this particular corner. The project offers excellent exploration
potential in down-plunge extensions of the producing channels. In addition, the Northern Tramways Dome area boasts
significant evidence in support of the discovery of an overturned portion of the critical ultramafic/basalt target contact
on the northern margin of the area. Two high-priority nickel channels in the projected overturned position of the
Winner-Schmitz and Helmut-Deacon channels had been identified.
An analyst has not visited the properties held by Brilliant Mining Corp.
Investment risks The Lanfranchi Mine is located in Western Australia in an area of extensive historical production, thus sovereign-related
risks are minimal. The primary risks associated with investment in Brilliant Mining Corp. are those of metal prices and
exchange rates. The commercialization risks associated with new mineral exploration and development are high, thus,
investment in the shares of Brilliant Mining Corp. is for risk accounts only.

Junior Mining Weekly | 7 4 March 2009
DIAMONDS NORTH RESOURCES LTD. (DDN : TSX-V : C$0.12 | NOT RATED) Figure 8: DDN : TSX-V Figure 9: DDN : TSX-V
Shares o/s (M): 75.2 Shares fd (M): 86.3 Working Cap. (M): $5.0 Market Cap. (M): $9.0 Co. Website: www.diamondsnorthresources.com
Past 12-months – purchased: $153,629 Past 12-months – sold: $84,950 Since Jan. 20, 2009 - acquisitions: 3,000 shares @ $0.28 Since Jan. 20, 2009 - dispositions: NIL
Source: Company reports, StockCharts.com Source: INK Research
Diamonds North Resources is a mineral exploration company targeting diamonds in Canada’s far north. The company is led
by Mark Kolebaba (President and CEO), a former exploration head for the BHP and Dia Met joint venture at Ekati. Its principal
asset is its 100%-owned Amaruk diamond project (Tuktu target) in the Pelly Bay region of Nunavut. The main area of the
Amaruk project spans more than 80 kilometres east to west and is within approximately 30 kilometres of tidewater.
• Last week the company released disappointing mini-bulk sample results from its Amaruk property in northern Canada.
An estimated 21.63 tonnes of kimberlite was collected from the Tuktu-1, 2 and 3 kimberlite and an additional
estimated 14.49 tonnes of kimberlite was collected from Qavvik-4, 5 and 6 kimberlites last summer. Results of Dense
Media Separation (DMS), and final diamond-picking suggest these kimberlite bodies are not likely to host a material
population of macro stones, considerably reducing the economic potential of these particular pipes. The largest stones
recovered from the mini-bulk samples that remained on the 1.18 mm sieve weighed in at 0.04 carats. The company
has estimated the grades of the Tuktu and Qavvik kimberlite samples are inferred to be less than 0.1 ct per tonne. No
further work is planned on these kimberlite bodies.
• The company has identified over 500 airborne magnetic anomalies defined by abundant, high-quality indicator
minerals and kimberlite float at the Amaruk property. Sampling indicates a significant population of high-
chromium/low-calcium pyrope garnets (G-10s). In our opinion, the chemistry of these garnets is closely comparable to
some of the best garnet chemistry associated with the Ekati and Diavik diamond mines in NWT. In fact, several of the
sub-calcic garnets display as high as 13 wt% Cr2O3 and <2.5 wt% CaO. This chemistry is a strong indication that any
kimberlites that sourced these garnets have tapped the diamond stability field and have a high potential to contain a
significant population of diamonds. The company has indicated that the area hosts favourable chromite chemistry and
there is additional work outstanding on the chemistry of the population of eclogitic garnets. According to Diamonds
North, hundreds of targets on the property remain untested and it will continue to work towards outlining high
potential diamond bearing kimberlites in the area.
An analyst has not visited the properties held by Diamonds North Resources Inc.
Investment risks The commercialization risks associated with mineral exploration and development are high, thus, investment in the shares
of Diamonds North Resources Inc. is for risk accounts only.

Junior Mining Weekly | 8 4 March 2009
EXETER RESOURCE CORPORATION (XRC : TSX-V : C$2.70 | SPECULATIVE BUY) Figure 10: XRC : TSX-V Figure 11: XRC : TSX-V
Shares o/s (M): 62.3 Shares fd (M): 71.7 Working Cap. (M): $41.0 Market Cap. (M): $168.2 Co. Website: www.exeterresource.com
Past 12-months – purchased: $70,875 Past 12-months – sold: $32,870 Since Sep. 30, 2008 - acquisitions: NIL Since Sep. 30, 2008 - dispositions: NIL
Source: Company reports, StockCharts.com Source: INK Research
Exeter Resource is a Vancouver-based gold-silver exploration company under the management of Yale Simpson, Chairman,
and Bryce Roxburgh, President and CEO. Exeter is advancing the Caspiche copper-gold porphyry project (earning 100%) in
northern Chile and the Cerro Moro high-grade gold-silver vein project (95%) in Santa Cruz province in southern Argentina.
• Last week, Exeter released more results from more exploration drilling at Caspiche, including assay results from the
last 284 metres of drill hole #32, which previously (Feb. 2, 2009) returned 930 metres grading 0.89 g/t Au and 0.31%
Cu including a 488-metre section that returned 1.30 g/t Au and 0.44% Cu. This drill hole was designed to test the SW
extension of the mineralized system at Caspiche. The complete intercept in hole #32 is 1,214 metres of 0.90 g/t Au
and 0.33% Cu, including an interval of 716 metres grading 1.22 g/t Au and 0.42% Cu. Also hole #32, a 200-metre
south-east step out hole (from hole 32), returned 130 metres of 0.47 g/t Au in the oxide zone and 786 metres of 0.33
g/t Au and 0.13% Cu in sulphide. The company has more drilling planned to test the continuation of the system to the
southwest, following what appears to be the trend of high grade mineralization. Currently, assays are pending from
the depth extensions to drill holes #16 and #23. The company indicates that in general recent drilling shows potassic
alteration increasing to depth, potentially suggesting that the strongest part of the system is still open at depth.
• An initial NI 43-101 compliant resource estimate for Caspiche is expected to be released in March or April of this year,
based on drill holes to December 31, 2008. An update to this resource estimate is expected in September, based on
2009 drilling results. Based on recent drilling results and a recently closed C$29 million private placement, Exeter
now plans to expand its 2009 drilling program from 9,300 metres to 12,000 metres, with drills turning until May.
Exeter also plans to test the Caspiche III target at the property, a former Newcrest epithermal target.
• On a comparative basis, Caspiche’s Au-Cu grade, geology and infrastructure are all similar to Barrick/Kinross’s Cerro
Casale deposit. In October 2007, Barrick acquired a 51% interest in Cerro Casale for US$805 million. Based on our
conceptual preliminary estimates, we believe Exeter is on track to outline an NI 43-101 resource at Caspiche (down to
400 metres vertical) of six to seven million ounces gold equivalent and in excess of five million ounces of AuEq at
vertical depths below 400 metres. We rate Exeter a SPECULATIVE BUY; our 12-month target price is C$4.05.
An analyst has visited the properties held by Exeter Resource Corp. Partial payment or reimbursement was received
from the issuer for the related travel costs.

Junior Mining Weekly | 9 4 March 2009
Valuation Given the early stage of exploration and development of XRC’s projects (no defined NI 43-101 resources), we have applied
our in-situ valuation metrics to Caspiche and Cerro Moro. We apply a value of US$25/oz AuEq to estimated oxide and
primary sulphide resources above 400 m vertical, and US$15/oz AuEq to estimated sulphide resources below 400 m vertical.
Based on continuing positive results, we are reducing our applied execution risk discounts in our valuation for Caspiche. We
are maintaining our SPECULATIVE BUY rating on XRC, while raising our 12-month target price to C$4.05 (was C$3.10).
Investment risks The commercialization risks associated with mineral exploration and development are high, thus, investment in the shares
of Exeter Resource Corp. is for risk accounts only.
Figure 12: Caspiche drill plan
Source: Exeter Resource Corp.

Junior Mining Weekly | 10 4 March 2009
MEGA URANIUM LTD. (MGA : TSX : C$0.71 | NOT RATED) Figure 13: MGA : TSX Figure 14: MGA : TSX
Shares o/s (M): 187.0 Shares fd (M): 214.9 Working Cap. (M): C$38.9 Market Cap. (M): C$166.4 Co. Website: www.megauranium.com
Past 12-months – purchased: $2,854,131 Past 12-months – sold: $6,639,139 Since Dec. 31, 2008 – acquisitions or dispositions: NIL
Source: Company reports, StockCharts.com Source: INK Research
Mega Uranium Ltd. is a uranium exploration and development company under the stewardship of Sheldon Inwentash,
Chairman and CEO, based in Toronto, and Stewart Taylor, President, based in Brisbane, Australia. Mega has a diverse
global portfolio of projects in sites including Australia, Canada, Mongolia, Argentina, and Cameroon. Mega Uranium’s most
advanced projects with defined resources are in Australia. Mega’s largest uranium deposit is the Lake Maitland deposit in
Western Australia with 23.7 million pounds U3O8 in Inferred Resource. The company has agreed to sell a 35% interest in
the Lake Maitland project as follows:
• Last week Mega agreed to sell a 35% interest in the Lake Maitland uranium project in Western Australia to a
consortium of Japanese utilities and ITOCHU Corporation, the world’s second largest uranium trading house. The
Japanese utility group is comprised of the Kansai, Kyushu, and Shikoku electric power companies. The utilities will
access uranium for their own use while ITOCHU will be able to participate in incremental uranium offtake. The 35%
interest may be earned through staged payments amounting to US$49 million, or US$5.91/lb, beginning with the
funding for a feasibility study. The memorandum of understanding is expected to lead to definitive farm-in and joint
venture agreements, subject to completion of due diligence and the required regulatory and board approvals.
• In October 2008, Mega announced the results of a scoping study for the Lake Maitland deposit. Based on annual
throughput of 1.67 million tonnes, annual production is estimated at 1.65 million pounds U3O8 per year. The recovery
rate is expected to average 90% over a 10-year mine life using alkaline leach. Total capital cost is estimated at US$85.1
million with an average operating cost estimated at US$16.60/lb U3O8. The study was completed using the current
long-term price of US$75.00/lb U3O8, giving the project a NPV (10%) of US$181.4 million and IRR of 43.4%. The study
was completed using an A$ exchange rate of US$0.80. The Lake Maitland deposit is amenable to low-cost, open-pit
mining as the orebody occurs as a flat lying calcrete layer at a depth of approximately 2.0 metres below the surface.
The average thickness varies between one and three metres. Lake Maitland is in the Eastern Goldfields of Western
Australia near operating mines, with good access to infrastructure, including roads, airstrips, and a gas pipeline.
An analyst has not visited the Lake Maitland property held by Mega Uranium Ltd.
Investment risks The commercialization risks associated with mineral exploration and development are high, thus, investment in the shares
of Mega Uranium Ltd. are for risk accounts only.

Junior Mining Weekly | 11 4 March 2009
UEX CORPORATION (UEX : TSX : C$0.76 | NOT RATED) Figure 15: UEX : TSX Figure 16: UEX : TSX
Shares o/s (M): 183.7 Shares fd (M): 202.0 Working Cap. (M): $26.5 Market Cap. (M): $140.0 Co. Website: www.uex-corporation.com
Past 12-months – purchased: $321,809 Past 12-months – sold: NIL Since Oct. 9, 2008 - acquisitions or dispositions:: NIL
Source: Company reports, StockCharts.com Source: INK Research
UEX is a Vancouver-based exploration and development company advancing an extensive portfolio of uranium projects in
the Athabasca Basin, Saskatchewan. The Athabasca Basin supplied an estimated 23% of global mine supply in 2007. This
past week, the company provided updates as follows:
• Exploration has commenced on the 49%-owned (51% AREVA Resources Canada Inc.) Shea Creek uranium project,
western Athabasca Basin, Saskatchewan. The project hosts the Kianna, Anne and Colette deposits. The partners will
spend, funded on a pro rata basis, C$8.25 million on exploration and C$2 million for development. Drilling has begun
with three rigs seeking to infill on Kianna and Anne at 20-metre centres, expand the two deposits and confirm a
potential connection between the two deposits at depth. Environmental baseline and engineering studies have begun in
support of future development. A 950-metre shaft is planned for access for underground exploration and testing of
ground conditions.
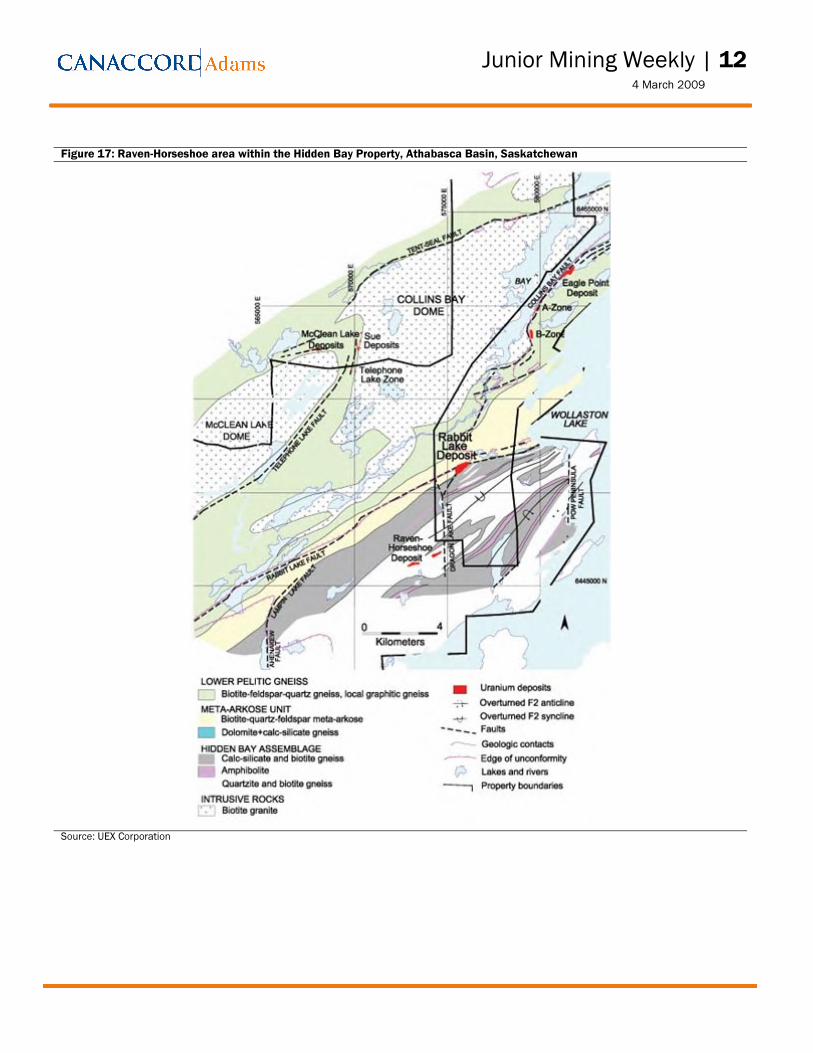
• To date, 53 holes amounting to 16,500 metres have been drilled on the wholly owned Hidden Bay property (Figure 17).
One drill rig is testing the definition drilling of the Horseshoe Northeast zone while two rigs are testing southwestern
extensions of the Raven deposit. Additional drilling will test eastern extensions of the Raven deposit, the area between
the Raven and Horseshoe deposits and regional coincident alteration and geophysical anomalies. In January UEX
reported a resource estimate for the Raven deposit of 3.97 million tonnes indicated grading 0.105% U3O8 containing
9.15 million pounds of U3O8, and 0.49 million tonnes inferred grading 0.104% U3O8 containing 1.13 million pounds of
U3O8 at a cut-off grade of 0.05%. Last fall, UEX reported a resource estimate for the Horseshoe deposit amounting to
18.69 million pounds indicated at a grade of 0.24% U3O8 and 0.31 million 1.43 million pounds inferred at a grade of
0.21% U3O8. Management have increased their target for the Hidden Bay project to 40 million pounds U3O8 and are
evaluating processing options for eventual development including toll milling with one of the two active facilities in the
region, namely the Rabbit Lake mill (less than five kilometres to the northeast) and the McClean Lake facilities (12
kilometres to the northwest), or potentially a stand-alone facility.
An analyst has not visited the properties held by UEX Corporation.
Investment risks The commercialization risks associated with mineral exploration and development are high; thus, investment in the shares
of UEX Corporation is for risk accounts only.
Junior Mining Weekly | 12 4 March 2009
Figure 17: Raven-Horseshoe area within the Hidden Bay Property, Athabasca Basin, Saskatchewan
Source: UEX Corporation
Junior Mining Weekly | 13 4 March 2009
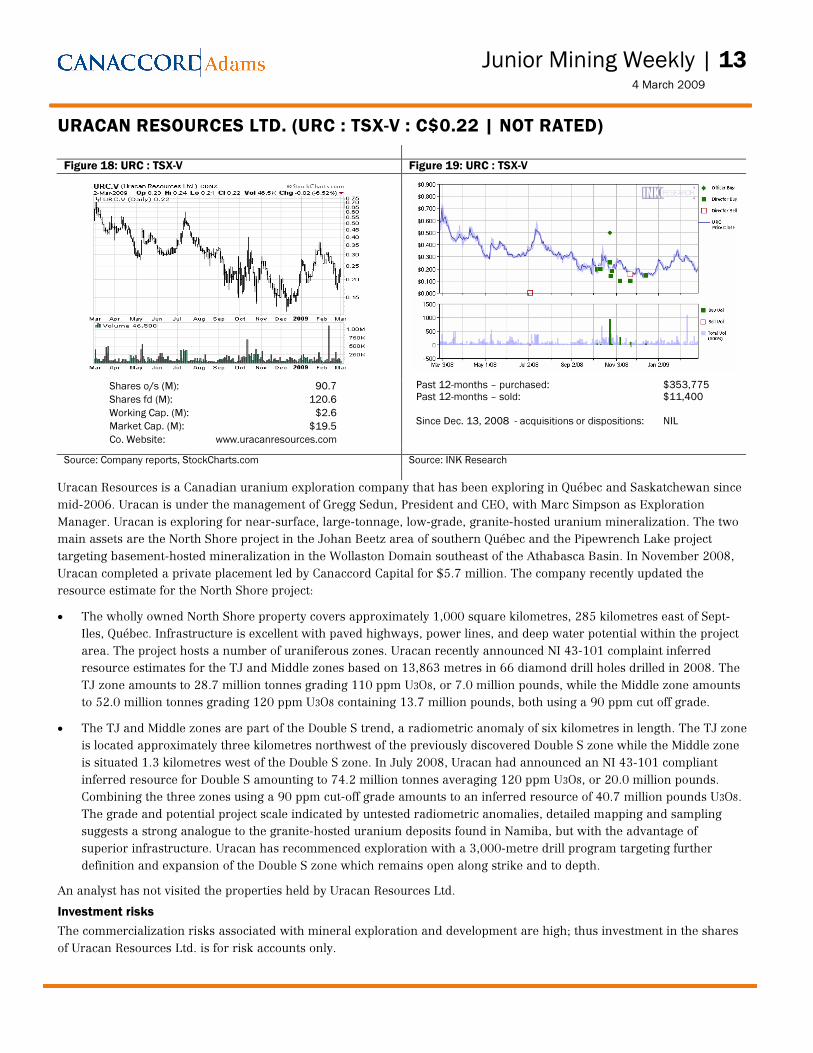
URACAN RESOURCES LTD. (URC : TSX-V : C$0.22 | NOT RATED) Figure 18: URC : TSX-V Figure 19: URC : TSX-V
Shares o/s (M): 90.7 Shares fd (M): 120.6 Working Cap. (M): $2.6 Market Cap. (M): $19.5 Co. Website: www.uracanresources.com
Past 12-months – purchased: $353,775 Past 12-months – sold: $11,400 Since Dec. 13, 2008 - acquisitions or dispositions: NIL
Source: Company reports, StockCharts.com Source: INK Research
Uracan Resources is a Canadian uranium exploration company that has been exploring in Québec and Saskatchewan since
mid-2006. Uracan is under the management of Gregg Sedun, President and CEO, with Marc Simpson as Exploration
Manager. Uracan is exploring for near-surface, large-tonnage, low-grade, granite-hosted uranium mineralization. The two
main assets are the North Shore project in the Johan Beetz area of southern Québec and the Pipewrench Lake project
targeting basement-hosted mineralization in the Wollaston Domain southeast of the Athabasca Basin. In November 2008,
Uracan completed a private placement led by Canaccord Capital for $5.7 million. The company recently updated the
resource estimate for the North Shore project:
• The wholly owned North Shore property covers approximately 1,000 square kilometres, 285 kilometres east of Sept-
Iles, Québec. Infrastructure is excellent with paved highways, power lines, and deep water potential within the project
area. The project hosts a number of uraniferous zones. Uracan recently announced NI 43-101 complaint inferred
resource estimates for the TJ and Middle zones based on 13,863 metres in 66 diamond drill holes drilled in 2008. The
TJ zone amounts to 28.7 million tonnes grading 110 ppm U3O8, or 7.0 million pounds, while the Middle zone amounts
to 52.0 million tonnes grading 120 ppm U3O8 containing 13.7 million pounds, both using a 90 ppm cut off grade.
• The TJ and Middle zones are part of the Double S trend, a radiometric anomaly of six kilometres in length. The TJ zone
is located approximately three kilometres northwest of the previously discovered Double S zone while the Middle zone
is situated 1.3 kilometres west of the Double S zone. In July 2008, Uracan had announced an NI 43-101 compliant
inferred resource for Double S amounting to 74.2 million tonnes averaging 120 ppm U3O8, or 20.0 million pounds.
Combining the three zones using a 90 ppm cut-off grade amounts to an inferred resource of 40.7 million pounds U3O8.
The grade and potential project scale indicated by untested radiometric anomalies, detailed mapping and sampling
suggests a strong analogue to the granite-hosted uranium deposits found in Namiba, but with the advantage of
superior infrastructure. Uracan has recommenced exploration with a 3,000-metre drill program targeting further
definition and expansion of the Double S zone which remains open along strike and to depth.
An analyst has not visited the properties held by Uracan Resources Ltd.
Investment risks The commercialization risks associated with mineral exploration and development are high; thus investment in the shares
of Uracan Resources Ltd. is for risk accounts only.
Junior Mining Weekly | 14 4 March 2009
SITE VISIT NOTES
EXTRACT RESOURCES LIMITED (EXT : TSX : C$1.75 | EXT : ASX : A$2.45 | NOT RATED) Namibia, February 16, 2009 Extract Resources Limited (Extract) is a Perth-based uranium exploration company
primarily focused on advancing its wholly owned Husab uranium project in Namibia.
The company is in the more-than-capable hands of Managing Director Peter McIntyre
but the sharks have been circling: Kalahari Minerals (KAH : LSE : £0.76 | Not rated)
holds a 40.6% equity position in Extract and has been challenging Extract’s Board of
Directors. Rio Tinto (RIO : LSE : £17.16 | BUY), 69%-owner of the adjacent world-class
Rössing uranium mine, has taken a 14.4% interest in Extract, as well as a 15.8% stake in
Kalahari. We recently had the opportunity to visit Extract’s Husab project in Namibia.
In Africa, uranium explorers have focused to a large extent on the Damara Orogenic Belt in
west central Namibia. Approximately 900 million years ago, the continent in this area was
pulling apart (rifting) along a roughly east-northeast trend. The rift became filled by up to
17,000 metres of volcanic flows, fluvial (river borne) sediments and, ultimately, marine
sediments. Tectonic movements reversed approximately 600 million years ago such that
the package of sedimentary and volcanic rocks was subjected to tremendous pressure
resulting in metamorphism, folding, and faulting. The peak of metamorphism (heat and
pressure) is dated at 535 million years ago. The intrusion of granitic bodies occurred
during and after this phase of compression and much of the region’s primary uranium
mineralization is associated with the emplacement of these bodies. The combination of
compression and granitic intrusion created the northeast trending domes one sees today.
The granitic layers within these domes are prime targets for uranium mineralization. The
target granites are more specifically leucogranites (i.e., white granites), some of which are
referred to in the field as alaskites.
Uranium mineralization was discovered in the vicinity of Rössing Mountain in the 1900s.
Mineralization at Rössing is hosted in alaskite layers which have intruded into surrounding
gneiss and schist units of the Khan and Rössing formations. The Rössing mine is the
archetype of Rössing-style granite-hosted mineralization now sought in Africa. In 1966 Rio
Tinto began exploration there and identified the large, low-grade deposit. The Rössing
mine, which became operational in 1976, is indirectly owned by Rio Tinto (69%), the
Government of Iran (15%), the Industrial Development Corporation of South Africa (10%),
the Namibian Government (3%), and a private party (3%). The main SJ pit is currently
2,800 metres long by up to 800 metres wide and 330 metres deep. In 2008, the mine
produced 6.1 million pounds U3O8 versus 4.6 million pounds in 2007 as higher grades
were encountered. An expansion is in progress to take the mine to 12.1 million pounds
U3O8 per annum capacity by 2012, potentially including heap leaching of lower-grade ore.
Extract’s core asset is the Husab uranium project in Namibia, located approximately 50
kilometres east of Swakopmund, Namibia and immediately south of the Rössing mine
(Figure 20). The project was acquired in May 2005 on a 51/49 basis by Extract and
Kalahari, respectively. Extract subsequently acquired Kalahari’s interest in the Husab
project in return for 66.7 million Extract shares in March 2007. Husab consists of two
contiguous Exclusive Prospecting Licenses (EPL 3138 and 3439) covering an area of 637

Junior Mining Weekly | 15 4 March 2009
square kilometres. EPLs can cover an area of up to 1,000 square kilometres, are
commodity-specific, are valid for an initial term of three years with two renewals of two
years each, and allow the holder to engage in prospecting and mineral sample removal.
Figure 20: Husab project location map, Namibia
Source: Extract Resources Limited
Junior Mining Weekly | 16 4 March 2009
Access to Husab is excellent via paved and well-maintained unpaved roads directly to the
property. The communities of Walvis Bay and Swakopmund provide the plethora of goods
and services needed in exploration, as well as international sea and air connections. The
national power grid is situated nearby, although power availability is a challenge
NamPower is actively addressing. Water is not locally available and will have to be piped in
from a desalination plant currently under construction on the coast north of Swakopmund.
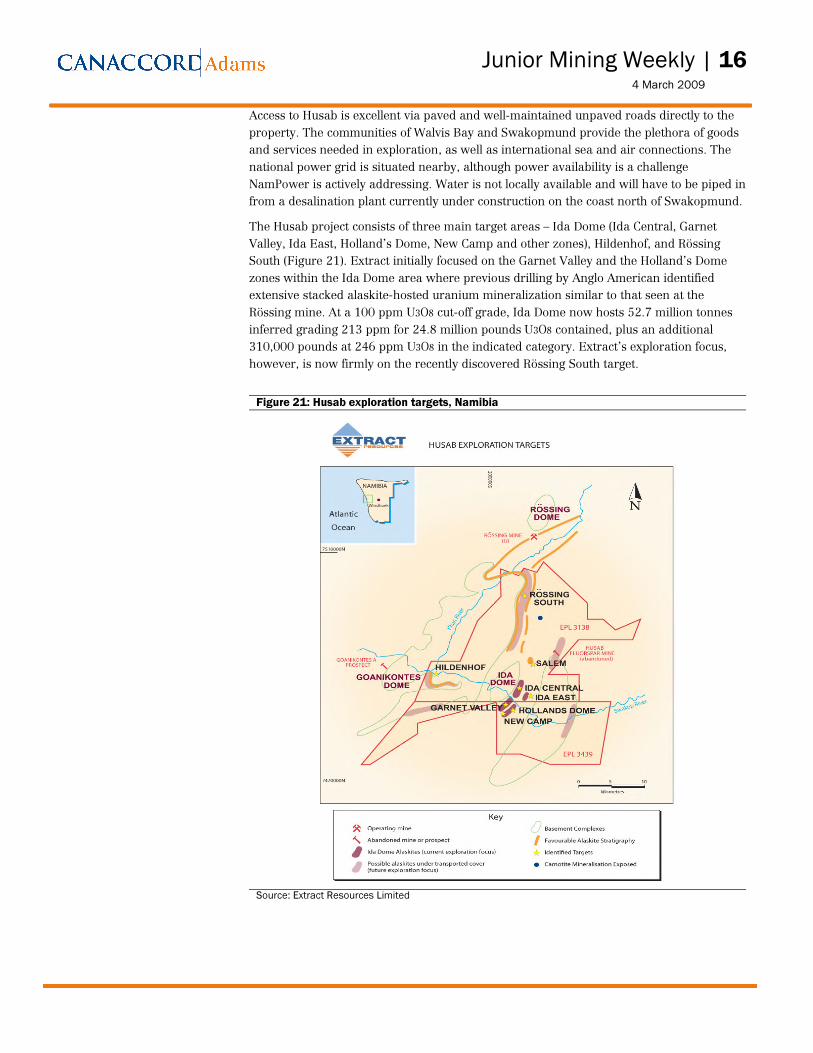
The Husab project consists of three main target areas – Ida Dome (Ida Central, Garnet
Valley, Ida East, Holland’s Dome, New Camp and other zones), Hildenhof, and Rössing
South (Figure 21). Extract initially focused on the Garnet Valley and the Holland’s Dome
zones within the Ida Dome area where previous drilling by Anglo American identified
extensive stacked alaskite-hosted uranium mineralization similar to that seen at the
Rössing mine. At a 100 ppm U3O8 cut-off grade, Ida Dome now hosts 52.7 million tonnes
inferred grading 213 ppm for 24.8 million pounds U3O8 contained, plus an additional
310,000 pounds at 246 ppm U3O8 in the indicated category. Extract’s exploration focus,
however, is now firmly on the recently discovered Rössing South target.
Figure 21: Husab exploration targets, Namibia
Source: Extract Resources Limited
Junior Mining Weekly | 17 4 March 2009
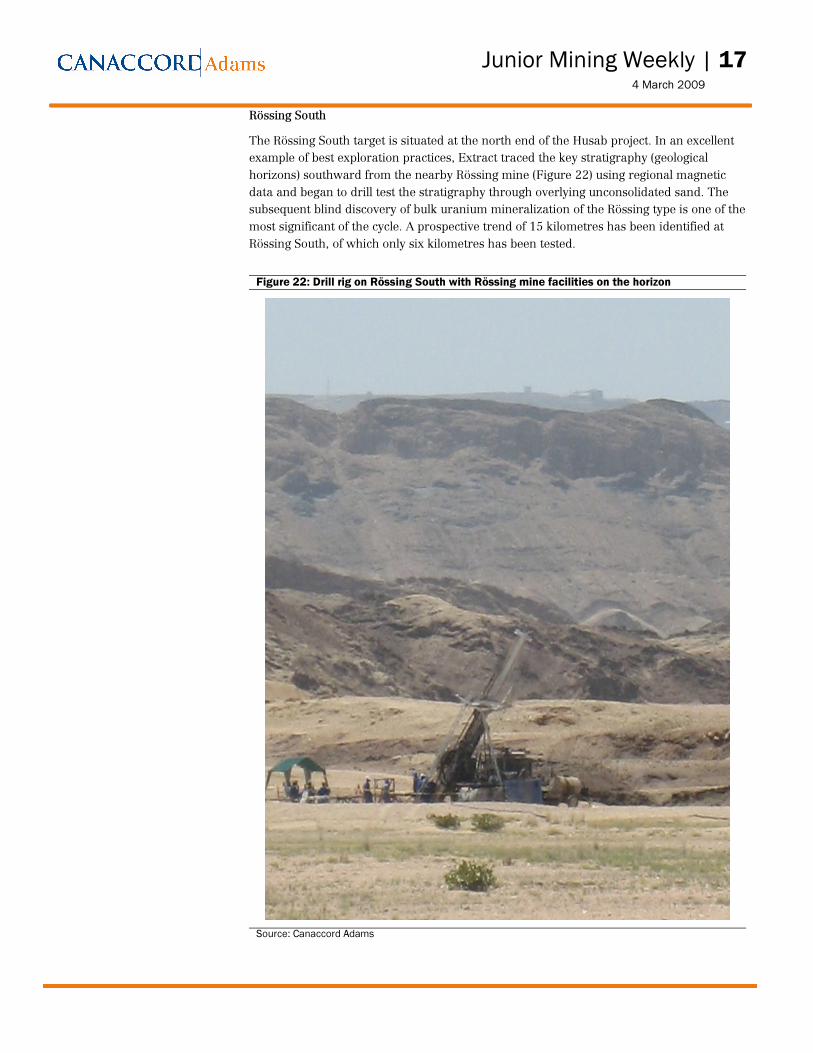
Rössing South
The Rössing South target is situated at the north end of the Husab project. In an excellent
example of best exploration practices, Extract traced the key stratigraphy (geological
horizons) southward from the nearby Rössing mine (Figure 22) using regional magnetic
data and began to drill test the stratigraphy through overlying unconsolidated sand. The
subsequent blind discovery of bulk uranium mineralization of the Rössing type is one of the
most significant of the cycle. A prospective trend of 15 kilometres has been identified at
Rössing South, of which only six kilometres has been tested.
Figure 22: Drill rig on Rössing South with Rössing mine facilities on the horizon
Source: Canaccord Adams
Junior Mining Weekly | 18 4 March 2009
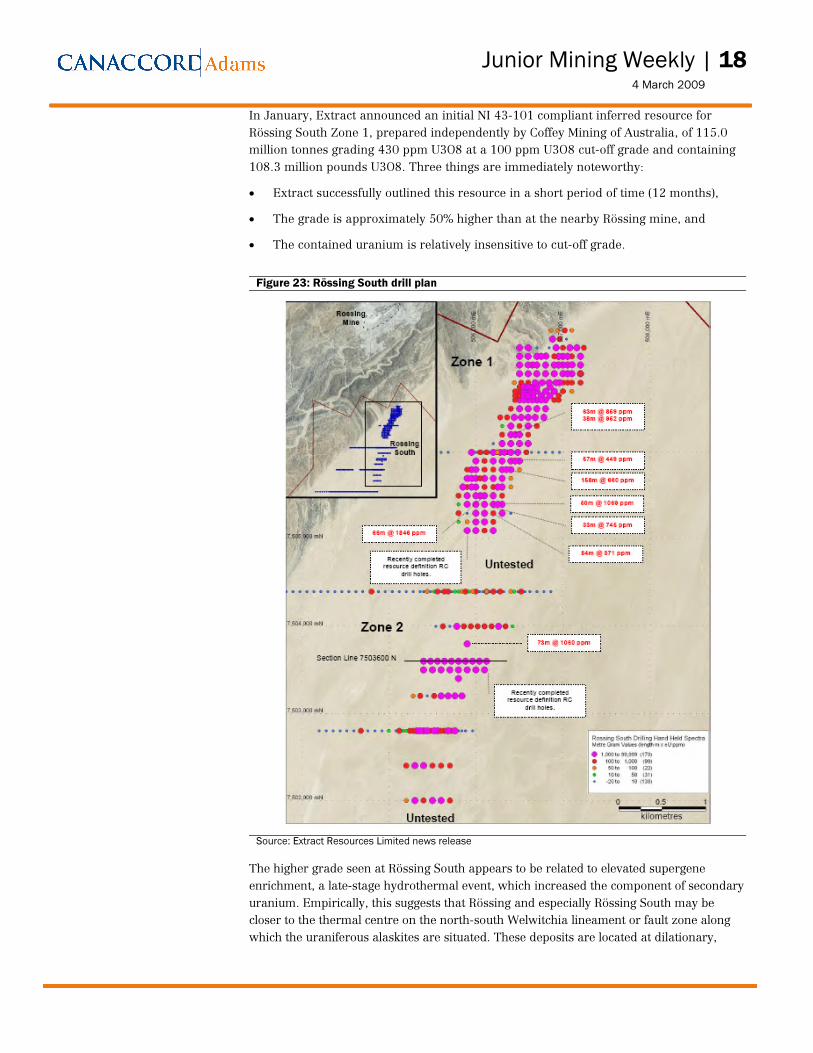
In January, Extract announced an initial NI 43-101 compliant inferred resource for
Rössing South Zone 1, prepared independently by Coffey Mining of Australia, of 115.0
million tonnes grading 430 ppm U3O8 at a 100 ppm U3O8 cut-off grade and containing
108.3 million pounds U3O8. Three things are immediately noteworthy:
• Extract successfully outlined this resource in a short period of time (12 months),
• The grade is approximately 50% higher than at the nearby Rössing mine, and
• The contained uranium is relatively insensitive to cut-off grade.
Figure 23: Rössing South drill plan
Source: Extract Resources Limited news release
The higher grade seen at Rössing South appears to be related to elevated supergene
enrichment, a late-stage hydrothermal event, which increased the component of secondary
uranium. Empirically, this suggests that Rössing and especially Rössing South may be
closer to the thermal centre on the north-south Welwitchia lineament or fault zone along
which the uraniferous alaskites are situated. These deposits are located at dilationary,
Junior Mining Weekly | 19 4 March 2009
high-stress zones along this lineament. Supergene enrichment at Rössing South is evident
from top to bottom in section and the high proportion of supergene enrichment may
explain the resource’s relative insensitivity to cut-off grade.
The Rössing South trend does not outcrop to the north as the sand cover thins and the
surface falls off into the river valley. Mineralization consequently is closed off as
stratigraphy sweeps to the west; mineralization also appears to finger out approaching this
closure. To the south, however, mineralization remains wide open. There are currently
three reverse circulation and two diamond drill rigs operating. Drill spacing is being
tightened on Zone 1 to upgrade from the inferred to the indicated category. The strike
length of Zone 1 is currently 2.4 kilometres, but we see no reason why the gap between
zones 1 and 2 should not be closed with additional drilling. The strike length of Zone 2 is
now 2.0 kilometres but the zone remains open along strike, as well as to depth. Drilling on
Zone 2 is progressing on a 100 by 100 metre grid. The zone is much more flat-lying than
Zone 1 and may represent the top of an antiform. Extract is targeting August 2009 for an
initial resource for Zone 2, but their published target of 69 to 106 million pounds at 260 to
300 ppm may be overly conservative given the previous experience with Zone 1.
The Rössing South trend appears to extend a further nine kilometres south of Zone 2. We
visited an excellent new exploration target at Salem (Figure 21), approximately six to eight
kilometres south of Rössing South Zone 2. The site is unusual in that alaskites appear to be
intruding Salem granite as opposed to Khan or Rössing metamorphic rocks. A radiometric
anomaly, confirmed on the ground as being uraniferous alaskite, covers approximately 100
metres by 300 metres. This may, however, be the “tip of the iceberg” requiring further
drilling. We are also intrigued by the jog in stratigraphy north of Salem, which then may
line up with Rössing South.
Looking forward, feasibility studies are expected to begin this month looking at both
conventional agitated leach and heap leach options for an operation at Rössing South. The
configuration for Zone 1 is good, but Zone 2 is even better appearing almost flat-lying
implying a low strip ratio. At present we see fewer calc-silicate (marble) horizons present
at Rössing South, which suggests lower acid consumption. Although betafite (a refractory
uranium mineral) has not been directly observed, up to 5% betafite is common at Rössing;
more metallurgical testing is required and samples from current metallurgical holes are
being sent to the Australian Nuclear Science and Technology Organisation for extraction,
communition and mineralogy studies.
On the corporate front, the board room shenanigans are detracting from what is truly a
world-class discovery. Clearly, with a project of this scale the pace of exploration can
safely be accelerated. In fact, an accelerated exploration program is the best defence
against a potential predator (the neighbour to the north, for example), especially if one is
confident in the exploration model and the ability to build resources. Extract had A$20.5
million in its treasury at the end of December, but additional funds would surely be
available from the market to accommodate an accelerated program.
An analyst has visited the properties held by Extract Resources Limited. Partial payment
or reimbursement was received from the issuer for the related travel costs.
Investment risks The commercialization risks associated with mineral exploration and development are
high; thus, investment in the shares of Extract Resources Limited is for risk accounts only.
Junior Mining Weekly | 20 4 March 2009
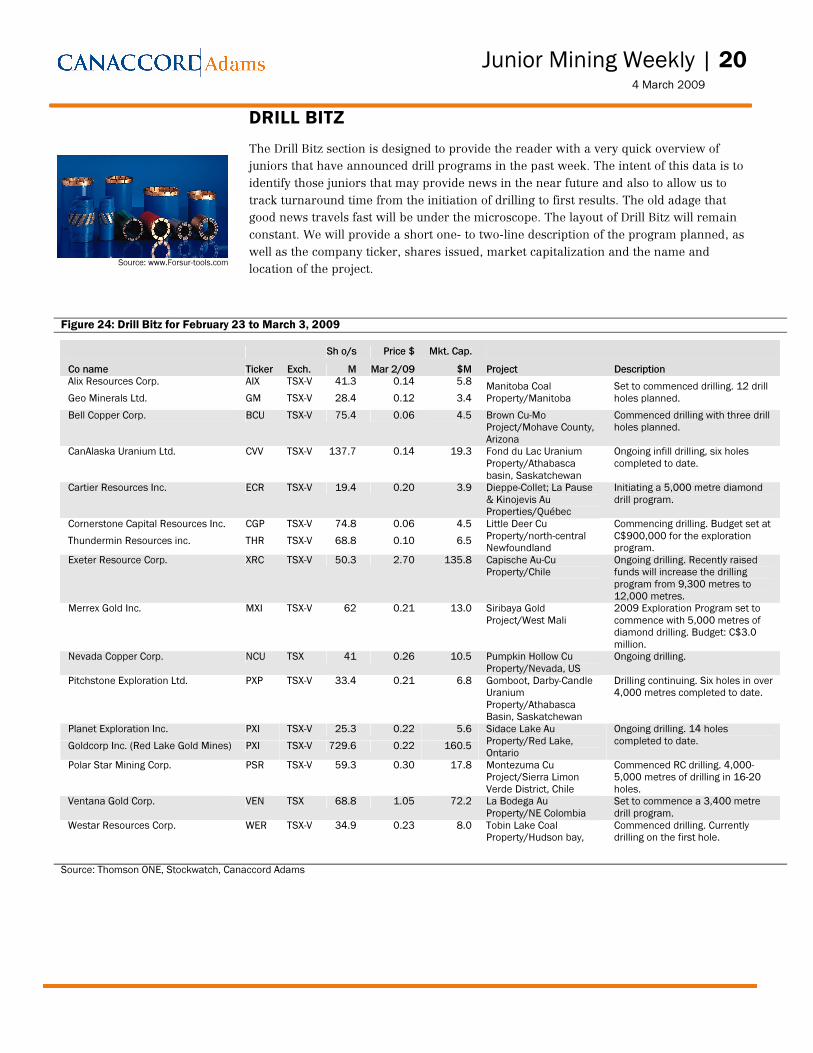
DRILL BITZ The Drill Bitz section is designed to provide the reader with a very quick overview of
juniors that have announced drill programs in the past week. The intent of this data is to
identify those juniors that may provide news in the near future and also to allow us to
track turnaround time from the initiation of drilling to first results. The old adage that
good news travels fast will be under the microscope. The layout of Drill Bitz will remain
constant. We will provide a short one- to two-line description of the program planned, as
well as the company ticker, shares issued, market capitalization and the name and
location of the project.
Figure 24: Drill Bitz for February 23 to March 3, 2009
Sh o/s Price $ Mkt. Cap. Co name Ticker Exch. M Mar 2/09 $M Project Description Alix Resources Corp. AIX TSX-V 41.3 0.14 5.8 Geo Minerals Ltd. GM TSX-V 28.4 0.12 3.4
Manitoba Coal Property/Manitoba
Set to commenced drilling. 12 drill holes planned.
Bell Copper Corp. BCU TSX-V 75.4 0.06 4.5 Brown Cu-Mo Project/Mohave County, Arizona
Commenced drilling with three drill holes planned.
CanAlaska Uranium Ltd. CVV TSX-V 137.7 0.14 19.3 Fond du Lac Uranium Property/Athabasca basin, Saskatchewan
Ongoing infill drilling, six holes completed to date.
Cartier Resources Inc. ECR TSX-V 19.4 0.20 3.9 Dieppe-Collet; La Pause & Kinojevis Au Properties/Québec
Initiating a 5,000 metre diamond drill program.
Cornerstone Capital Resources Inc. CGP TSX-V 74.8 0.06 4.5 Thundermin Resources inc. THR TSX-V 68.8 0.10 6.5
Little Deer Cu Property/north-central Newfoundland
Commencing drilling. Budget set at C$900,000 for the exploration program.
Exeter Resource Corp. XRC TSX-V 50.3 2.70 135.8 Capische Au-Cu Property/Chile
Ongoing drilling. Recently raised funds will increase the drilling program from 9,300 metres to 12,000 metres.
Merrex Gold Inc. MXI TSX-V 62 0.21 13.0 Siribaya Gold Project/West Mali
2009 Exploration Program set to commence with 5,000 metres of diamond drilling. Budget: C$3.0 million.
Nevada Copper Corp. NCU TSX 41 0.26 10.5 Pumpkin Hollow Cu Property/Nevada, US
Ongoing drilling. Pitchstone Exploration Ltd. PXP TSX-V 33.4 0.21 6.8 Gomboot, Darby-Candle
Uranium Property/Athabasca Basin, Saskatchewan
Drilling continuing. Six holes in over 4,000 metres completed to date.
Planet Exploration Inc. PXI TSX-V 25.3 0.22 5.6 Goldcorp Inc. (Red Lake Gold Mines) PXI TSX-V 729.6 0.22 160.5
Sidace Lake Au Property/Red Lake, Ontario
Ongoing drilling. 14 holes completed to date.
Polar Star Mining Corp. PSR TSX-V 59.3 0.30 17.8 Montezuma Cu Project/Sierra Limon Verde District, Chile
Commenced RC drilling. 4,000-5,000 metres of drilling in 16-20 holes.
Ventana Gold Corp. VEN TSX 68.8 1.05 72.2 La Bodega Au Property/NE Colombia
Set to commence a 3,400 metre drill program.
Westar Resources Corp. WER TSX-V 34.9 0.23 8.0 Tobin Lake Coal Property/Hudson bay,
Commenced drilling. Currently drilling on the first hole.
Source: Thomson ONE, Stockwatch, Canaccord Adams
Source: www.Forsur-tools.com
Junior Mining Weekly | 21 4 March 2009
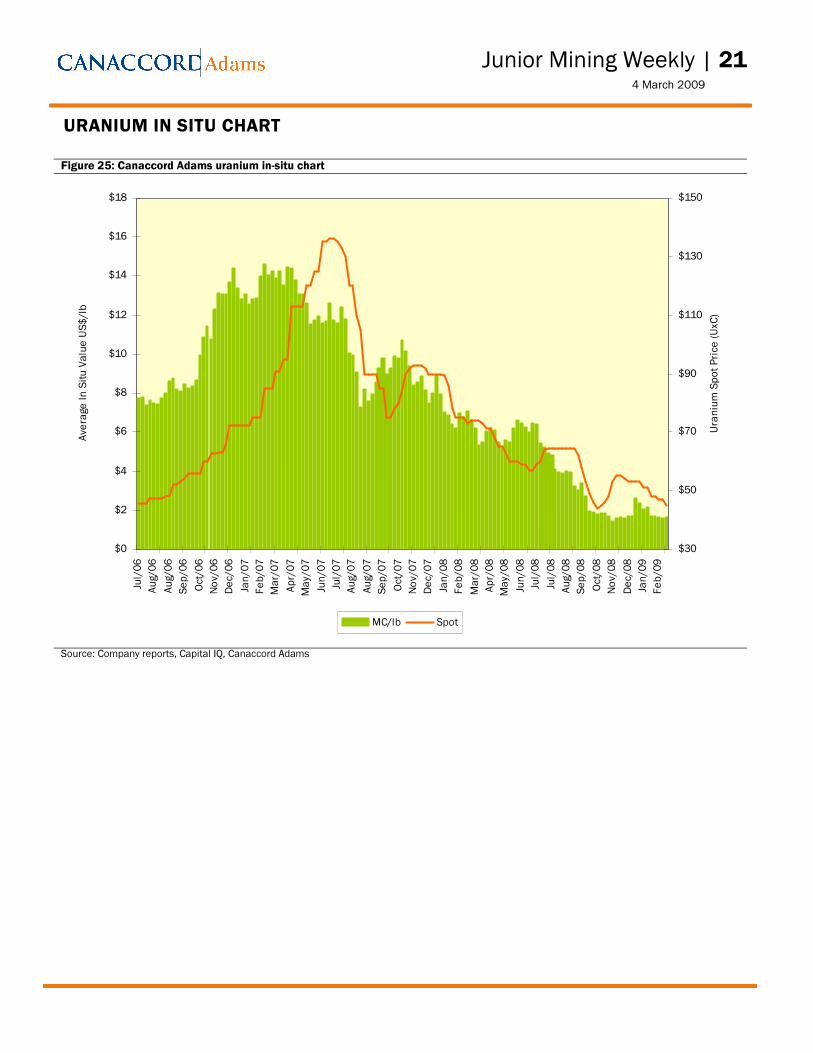
URANIUM IN SITU CHART Figure 25: Canaccord Adams uranium in-situ chart
$0
$2
$4
$6
$8
$10
$12
$14
$16
$18
Jul/06
Aug/0
6Au
g/06
Sep/06
Oct/0
6No
v/06
Dec/0
6Jan
/07
Feb/07
Mar/0
7Ap
r/07
May/0
7Jun
/07
Jul/07
Aug/0
7Au
g/07
Sep/07
Oct/0
7No
v/07
Dec/0
7Jan
/08
Feb/08
Mar/0
8Ap
r/08
May/0
8Jun
/08
Jul/08
Jul/08
Aug/0
8Se
p/08
Oct/0
8No
v/08
Dec/0
8Jan
/09
Feb/09
Avera
ge In
Situ
Value
US$/lb
$30
$50
$70
$90
$110
$130
$150
Uran
ium Sp
ot Pri
ce (U
xC)
MC/lb Spot
Source: Company reports, Capital IQ, Canaccord Adams

Junior Mining Weekly | 22 4 March 2009
URANIUM IN SITU SPREADSHEET Figure 26: Canaccord Adams uranium in-situ valuation spreadsheet
Price Shares (Basic) MC (2) WC (3) EV (4) Project
Global Resource Implied (6) Market
Company Ticker (1) (M) (C$M) (C$M) (C$M) Location(s) (5) (Mlb) M+I Global M+I Global (Mlb) ° �(�)Aurora Energy TSX:AXU $2.52 73.3 $184.7 $105.1 $79.6 Labrador 133.7 $2.20 $1.38 $0.95 $0.60 67.7 -49%Azimut TSXV:AZM $0.47 16.8 $7.9 $2.3 $7.0 Quebec 0.0 5.9 n/aBannerman ASX:BMN $0.64 156.8 $100.3 $8.1 $98.8 Namibia 101.3 $1.41 $0.99 $1.38 $0.98 84.1 -17%Continental Precious TSX:CZQ $0.45 47.7 $21.5 $25.8 -$4.3 Sweden 442.8 $3.74 $0.05 -$0.75 -$0.01 -3.7 -101%Crosshair Exploration TSXV:CXX $0.14 94.9 $13.3 $5.1 $8.2 Labrador 10.6 $3.11 $1.25 $1.92 $0.77 7.0 -34%Cue TSXV:CUE $0.10 38.8 $3.9 -$1.3 $5.2 Paraguay 7.3 $0.76 $0.53 $1.02 $0.71 4.4 -39%Deep Yellow ASX:DYL $0.13 1,121.2 $145.8 $57.7 $88.1 Namibia 38.8 $3.76 $2.27 75.0 93%Energy Fuels TSX:EFR $0.22 52.6 $11.6 $9.0 $2.7 Utah, Colorado, Queensland 11.4 $1.34 $1.02 $0.31 $0.24 2.3 -80%Extract ASX:EXT $2.32 217.0 $503.3 $31.5 $471.9 Namibia 133.4 $1,623.70 $3.77 $1,522.22 $3.54 401.5 201%Forsys TSX:FSY $6.46 77.4 $499.9 $36.3 $463.6 Namibia 81.7 $8.20 $6.12 $7.60 $5.67 394.5 383%Hathor TSXV:HAT $3.00 82.1 $246.2 $28.5 $217.7 Saskatchewan 0.0 185.2 n/aKhan TSX:KRI $0.32 54.1 $17.3 $24.1 -$6.8 Mongolia 32.1 $0.54 $0.54 -$0.21 -$0.21 -5.8 -118%Laramide TSX:LAM $1.45 62.6 $90.7 $9.4 $81.3 New Mexico, Queensland 57.9 $3.97 $1.57 $3.56 $1.40 69.2 19%Mantra ASX:MRU $1.30 80.3 $104.4 $32.3 $72.1 Tanzania 35.9 $2.91 $2.01 61.3 71%Mega TSX:MGA $1.03 187.0 $192.6 $38.9 $153.7 Queensland, Western Australia 34.4 $24.38 $5.60 $19.46 $4.47 130.8 280%Pele Mountain TSXV:GEM $0.10 91.2 $9.1 $3.8 $5.3 Ontario 42.5 $1.43 $0.21 $0.83 $0.12 4.5 -89%Pitchstone TSXV:PXP $0.20 33.4 $6.7 $7.2 -$0.5 Nunavut 4.1 $1.63 -$0.12 -0.4 -110%Powertech TSX:PWE $0.36 55.4 $20.0 $2.3 $21.5 Colorado, South Dakota 17.3 $1.15 $1.24 18.3 5%Strateco TSX:RSC $1.03 119.3 $122.8 $16.9 $106.0 Quebec 16.8 $32.94 $7.31 $28.41 $6.31 90.2 437%Strathmore TSXV:STM $0.26 72.5 $18.8 $8.4 $10.4 New Mexico, South Dakota 47.9 $0.60 $0.39 $0.33 $0.22 8.9 -81%Terra TSXV:TAS $0.56 3.4 $1.9 $8.4 -$6.5 Saskatchewan, Quebec 0.0 -5.6 n/aTournigan TSXV:TVC $0.19 122.7 $23.3 $12.6 $10.7 Slovakia 32.6 $1.59 $0.72 $0.73 $0.33 9.1 -72%Triex TSXV:TXM $0.21 20.0 $4.2 $9.0 -$4.8 Nunavut 4.1 $1.02 -$1.17 -4.1 -199%U3O8 TSXV:UWE $0.29 23.1 $6.7 $13.4 -$6.7 Guyana 7.2 $1.15 $0.93 -$1.15 -$0.93 -5.7 -179%UEX TSX:UEX $0.82 183.7 $150.6 $26.5 $124.1 Saskatchewan 32.0 $5.12 $4.71 $4.22 $3.88 105.6 230%Uracan TSXV:URC $0.23 90.7 $20.9 $2.6 $18.3 Quebec 20.0 $1.04 $0.91 15.5 -22%Uranerz Energy TSX:URZ $0.74 55.5 $41.0 $24.5 $16.6 Wyoming 10.5 $5.61 $3.90 $2.27 $1.57 14.1 34%Uranium Energy UEC $0.47 46.4 $21.8 $11.3 $10.5 Texas 8.3 $3.98 $2.63 $1.92 $1.27 8.9 8%Uranium Power TSXV:UPC $0.14 98.2 $13.8 $9.3 $4.4 Wyoming 7.8 $1.76 $0.57 3.8 -52%Uranium Resources URRE $0.50 55.9 $27.9 $13.5 $14.9 New Mexico, Texas 99.8 $0.28 $0.15 12.7 -87%Ur-Energy TSX:URE $0.68 93.2 $63.4 $65.0 -$1.6 Wyoming 24.9 $2.88 $2.55 -$0.07 -$0.06 -1.4 -105%Western Prospector TSXV:WNP $0.30 54.3 $16.3 $13.2 $3.1 Mongolia 20.1 $0.91 $0.81 $0.17 $0.15 2.6 -87%
Mean (C$) $82.36 $2.09 $75.96 $1.27Mean (US$) $64.85 $1.64 $59.81 $1.00Mean (C$, less outliers) $5.54 $1.97 $3.90 $1.18Mean (US$, less outliers) $CADUSD $1.27 $4.36 $1.55 $3.07 $0.93
MC/lb EV/lb
1. Priced in local currency 2. Market Capitalization 3. Working Capital 4. Enterprise Value = MC + LT Debt - WC 5. Global resource includes 43-101 compliant Measured, Indicated and Inferred resources 6. Implied resource is a conceptual resource indicated by the company’s EV at the mean peer EV/lb multiple 7. The percentage difference between the implied resource and the global resource Source: Capital IQ, company news releases, Canaccord Adams

Junior Mining Weekly | 23 4 March 2009
GOLD IN-SITU SPREADSHEET Figure 27: Canaccord Adams gold in-situ valuation spreadsheet
Sh o/s Price C$ Mkt. Cap Sum Oz Sum Oz Sum Oz Mkt Cap/oz Mkt Cap/oz EV/oz EV/oz Company Sym Exch M 3/2/2009 $M Au /co Ag /co AuEq /co AuEq C$ AuEq US$ AuEq C$ AuEq US$ ALEXIS MINERALS CORP AMC TSX 127.7 0.52 66.4 0.65 0.00 0.65 101.86 79.23 89.75 69.80 AMERICAN BONANZA GOLD CORP BZA TSX 115.7 0.07 8.1 1.04 0.00 1.04 7.80 6.07 0.76 0.59 ANATOLIA MINERALS DEV LTD ANO TSX 114.6 2.39 273.8 6.03 16.20 6.26 43.76 34.04 36.94 28.73 ANDINA MINERALS INC ADM TSX-V 79.4 1.58 125.4 9.90 0.00 9.90 12.66 9.85 10.61 8.25 AQUILINE RES AQI TSX 67.6 2.72 183.9 1.33 612.82 9.83 18.72 14.56 17.72 13.78 ATNA RESOURCES LTD ATN TSX 83.3 0.66 55.0 1.71 0.00 1.71 32.20 25.05 19.27 14.99 AXMIN INC AXM TSX-V 272.3 0.11 28.6 3.62 0.00 3.62 7.89 6.13 6.45 5.01 CANARC RESOURCE CORP CCM TSX 72.7 0.08 5.5 1.27 0.00 1.27 4.31 3.35 3.95 3.07 COMAPLEX MINERALS CORP CMF TSX 52.7 3.25 171.3 2.85 0.00 2.85 60.09 46.74 51.32 39.92 CBR GOLD CORPORATION CBR TSX-V 145.9 0.23 33.6 0.96 3.69 1.01 33.34 25.93 28.95 22.52 DETOUR GOLD CORP DGC TSX 63.8 10.34 660.1 13.10 0.00 13.10 50.41 39.21 46.02 35.79 ETRUSCAN RESOURCES INC EET TSX 158.7 0.46 73.0 3.52 0.00 3.52 20.73 16.13 28.70 22.32 GABRIEL RESOURCES LTD GBU TSX 255.5 2.90 740.8 13.44 58.26 14.25 51.98 40.43 48.45 37.68 GOLDEN QUEEN MNG GQM TSX 85.6 0.41 35.1 2.68 48.88 3.36 10.47 8.14 9.24 7.19 GOLD RESERVE INC GRZ TSX 56.9 0.76 43.2 13.99 0.00 13.99 3.09 2.40 0.01 0.01 GREAT BASIN GOLD LTD GBG TSX 219.2 1.63 357.2 15.11 8.77 15.24 23.45 18.24 23.15 18.01 GREYSTAR RES LTD GSL TSX 52.6 2.43 127.9 14.84 81.35 15.96 8.01 6.23 5.26 4.09 GUYANA GOLDFIELDS INC GUY TSX 58.9 2.80 165.0 5.45 0.00 5.45 30.27 23.54 26.43 20.56 HALO RESOURCES LTD HLO TSX-V 90.9 0.05 4.1 0.44 2.67 0.48 8.59 6.68 8.25 6.42 INTREPID MINES LIMITED IAU TSX 427.9 0.24 102.7 2.53 97.91 3.89 26.38 20.52 24.04 18.69 JAGUAR MINING INC JAG TSX 76.1 6.99 531.8 4.73 0.00 4.73 112.42 87.44 104.48 81.27 KIRKLAND LAKE GOLD INC KGI TSX 58.5 5.34 312.6 3.16 0.00 3.16 98.91 76.93 89.03 69.25 KLONDEX MINES LTD KDX TSX 25.1 0.69 17.3 1.05 0.00 1.05 16.54 12.86 16.15 12.57 KIMBER RESOURCES INC KBR TSX 62.1 0.64 39.7 1.04 48.82 1.72 23.14 18.00 18.88 14.68 LAKE SHORE GOLD CORP LSG TSX 214.1 1.28 274.0 1.78 0.00 1.78 153.55 119.43 66.37 51.63 METALLIC VENTURES GOLD INC MVG TSX 52.0 0.63 32.8 5.63 17.14 5.87 5.58 4.34 2.96 2.31 MINEFINDERS CORP LTD MFL TSX 59.0 7.60 448.5 3.75 175.33 6.18 72.54 56.42 84.01 65.34 MINERA ANDES INC MAI TSX 229.6 0.65 149.3 0.32 20.17 0.60 248.33 193.15 230.35 179.17 MUNDORO CAPITAL INC MUN TSX 38.5 0.45 17.1 7.23 0.00 7.23 2.37 1.84 0.04 0.03 NEVSUN RESOURCES LTD NSU TSX 128.2 1.37 175.6 4.23 37.11 4.75 36.98 28.76 26.30 20.45 NOVAGOLD RES NG TSX 179.0 3.56 637.3 27.48 116.42 29.10 21.90 17.04 23.20 18.04 OSISKO MINING CORPORATION OSK TSX 254.2 4.49 1141.3 10.46 0.00 10.46 109.06 84.83 60.73 47.24 PACIFIC RIM MINING CORP PMU TSX 116.9 0.23 26.9 1.54 11.33 1.70 15.83 12.31 13.50 10.50 PREMIER GOLD MINES LTD PG TSX 78.1 2.30 179.5 0.43 0.00 0.43 421.66 327.96 374.09 290.97 RAINY RIVER RESOURCES LTD RR TSX-V 56.4 1.77 99.7 3.62 7.98 3.74 26.70 20.77 19.62 15.26 SEABRIDGE GOLD INC SEA TSX 37.4 21.48 802.3 48.82 0.00 48.82 16.43 12.78 15.56 12.10 TYHEE DEVELOPMENT CORP TDC TSX-V 171.3 0.18 30.0 2.12 0.00 2.12 14.16 11.01 12.00 9.34 VISTA GOLD CORP VGZ TSX 34.5 2.48 85.5 17.19 0.00 17.19 4.98 3.87 4.72 3.67 Arithmetic Average 51.50 40.06 43.35 33.72 Weighted Average 29.72 23.12 25.49 19.83
US$/C$ : 0.78 Au:Ag = 72:1 Source: Company reports, Capital IQ, Canaccord Adams
Junior Mining Weekly | 24 4 March 2009
RESEARCH UNIVERSE
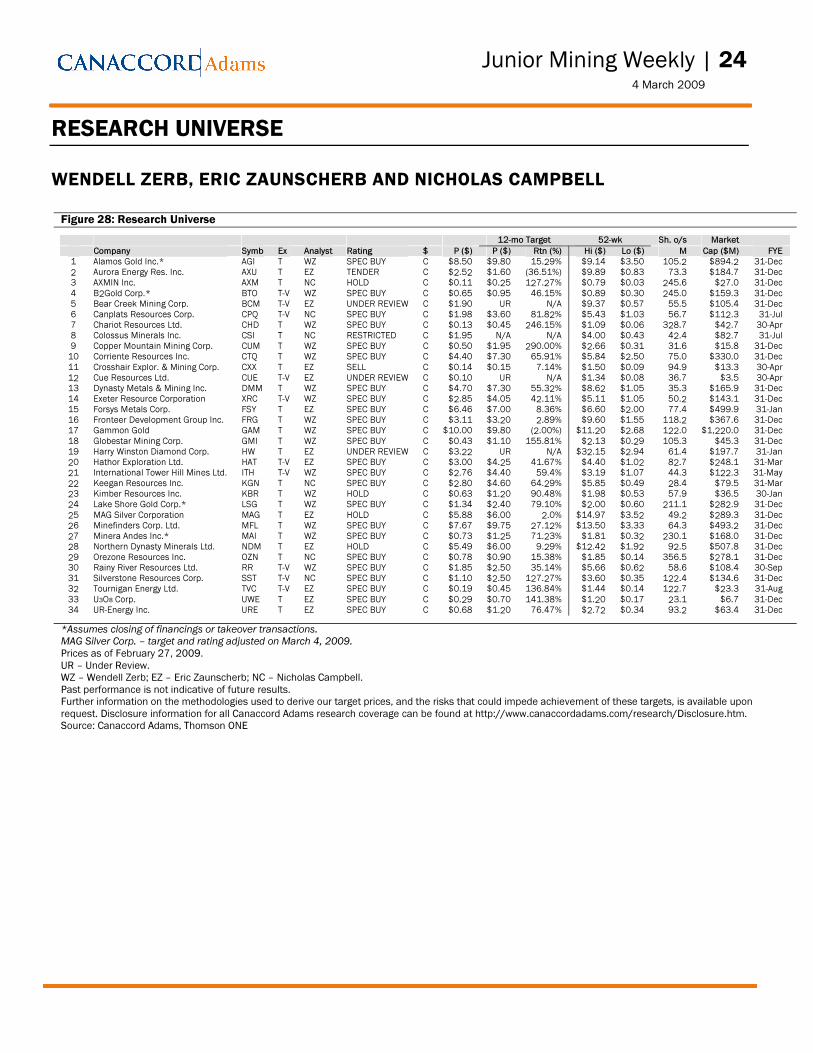
WENDELL ZERB, ERIC ZAUNSCHERB AND NICHOLAS CAMPBELL Figure 28: Research Universe
12-mo Target 52-wk Sh. o/s Market Company Symb Ex Analyst Rating $ P ($) P ($) Rtn (%) Hi ($) Lo ($) M Cap ($M) FYE 1 Alamos Gold Inc.* AGI T WZ SPEC BUY C $8.50 $9.80 15.29% $9.14 $3.50 105.2 $894.2 31-Dec 2 Aurora Energy Res. Inc. AXU T EZ TENDER C $2.52 $1.60 (36.51%) $9.89 $0.83 73.3 $184.7 31-Dec 3 AXMIN Inc. AXM T NC HOLD C $0.11 $0.25 127.27% $0.79 $0.03 245.6 $27.0 31-Dec 4 B2Gold Corp.* BTO T-V WZ SPEC BUY C $0.65 $0.95 46.15% $0.89 $0.30 245.0 $159.3 31-Dec 5 Bear Creek Mining Corp. BCM T-V EZ UNDER REVIEW C $1.90 UR N/A $9.37 $0.57 55.5 $105.4 31-Dec 6 Canplats Resources Corp. CPQ T-V NC SPEC BUY C $1.98 $3.60 81.82% $5.43 $1.03 56.7 $112.3 31-Jul 7 Chariot Resources Ltd. CHD T WZ SPEC BUY C $0.13 $0.45 246.15% $1.09 $0.06 328.7 $42.7 30-Apr 8 Colossus Minerals Inc. CSI T NC RESTRICTED C $1.95 N/A N/A $4.00 $0.43 42.4 $82.7 31-Jul 9 Copper Mountain Mining Corp. CUM T WZ SPEC BUY C $0.50 $1.95 290.00% $2.66 $0.31 31.6 $15.8 31-Dec 10 Corriente Resources Inc. CTQ T WZ SPEC BUY C $4.40 $7.30 65.91% $5.84 $2.50 75.0 $330.0 31-Dec 11 Crosshair Explor. & Mining Corp. CXX T EZ SELL C $0.14 $0.15 7.14% $1.50 $0.09 94.9 $13.3 30-Apr 12 Cue Resources Ltd. CUE T-V EZ UNDER REVIEW C $0.10 UR N/A $1.34 $0.08 36.7 $3.5 30-Apr 13 Dynasty Metals & Mining Inc. DMM T WZ SPEC BUY C $4.70 $7.30 55.32% $8.62 $1.05 35.3 $165.9 31-Dec 14 Exeter Resource Corporation XRC T-V WZ SPEC BUY C $2.85 $4.05 42.11% $5.11 $1.05 50.2 $143.1 31-Dec 15 Forsys Metals Corp. FSY T EZ SPEC BUY C $6.46 $7.00 8.36% $6.60 $2.00 77.4 $499.9 31-Jan 16 Fronteer Development Group Inc. FRG T WZ SPEC BUY C $3.11 $3.20 2.89% $9.60 $1.55 118.2 $367.6 31-Dec 17 Gammon Gold GAM T WZ SPEC BUY C $10.00 $9.80 (2.00%) $11.20 $2.68 122.0 $1,220.0 31-Dec 18 Globestar Mining Corp. GMI T WZ SPEC BUY C $0.43 $1.10 155.81% $2.13 $0.29 105.3 $45.3 31-Dec 19 Harry Winston Diamond Corp. HW T EZ UNDER REVIEW C $3.22 UR N/A $32.15 $2.94 61.4 $197.7 31-Jan 20 Hathor Exploration Ltd. HAT T-V EZ SPEC BUY C $3.00 $4.25 41.67% $4.40 $1.02 82.7 $248.1 31-Mar 21 International Tower Hill Mines Ltd. ITH T-V WZ SPEC BUY C $2.76 $4.40 59.4% $3.19 $1.07 44.3 $122.3 31-May 22 Keegan Resources Inc. KGN T NC SPEC BUY C $2.80 $4.60 64.29% $5.85 $0.49 28.4 $79.5 31-Mar 23 Kimber Resources Inc. KBR T WZ HOLD C $0.63 $1.20 90.48% $1.98 $0.53 57.9 $36.5 30-Jan 24 Lake Shore Gold Corp.* LSG T WZ SPEC BUY C $1.34 $2.40 79.10% $2.00 $0.60 211.1 $282.9 31-Dec 25 MAG Silver Corporation MAG T EZ HOLD C $5.88 $6.00 2.0% $14.97 $3.52 49.2 $289.3 31-Dec 26 Minefinders Corp. Ltd. MFL T WZ SPEC BUY C $7.67 $9.75 27.12% $13.50 $3.33 64.3 $493.2 31-Dec 27 Minera Andes Inc.* MAI T WZ SPEC BUY C $0.73 $1.25 71.23% $1.81 $0.32 230.1 $168.0 31-Dec 28 Northern Dynasty Minerals Ltd. NDM T EZ HOLD C $5.49 $6.00 9.29% $12.42 $1.92 92.5 $507.8 31-Dec 29 Orezone Resources Inc. OZN T NC SPEC BUY C $0.78 $0.90 15.38% $1.85 $0.14 356.5 $278.1 31-Dec 30 Rainy River Resources Ltd. RR T-V WZ SPEC BUY C $1.85 $2.50 35.14% $5.66 $0.62 58.6 $108.4 30-Sep 31 Silverstone Resources Corp. SST T-V NC SPEC BUY C $1.10 $2.50 127.27% $3.60 $0.35 122.4 $134.6 31-Dec 32 Tournigan Energy Ltd. TVC T-V EZ SPEC BUY C $0.19 $0.45 136.84% $1.44 $0.14 122.7 $23.3 31-Aug 33 U3O8 Corp. UWE T EZ SPEC BUY C $0.29 $0.70 141.38% $1.20 $0.17 23.1 $6.7 31-Dec 34 UR-Energy Inc. URE T EZ SPEC BUY C $0.68 $1.20 76.47% $2.72 $0.34 93.2 $63.4 31-Dec
*Assumes closing of financings or takeover transactions. MAG Silver Corp. – target and rating adjusted on March 4, 2009. Prices as of February 27, 2009. UR – Under Review. WZ – Wendell Zerb; EZ – Eric Zaunscherb; NC – Nicholas Campbell. Past performance is not indicative of future results. Further information on the methodologies used to derive our target prices, and the risks that could impede achievement of these targets, is available upon request. Disclosure information for all Canaccord Adams research coverage can be found at http://www.canaccordadams.com/research/Disclosure.htm. Source: Canaccord Adams, Thomson ONE
Junior Mining Weekly | 25 4 March 2009
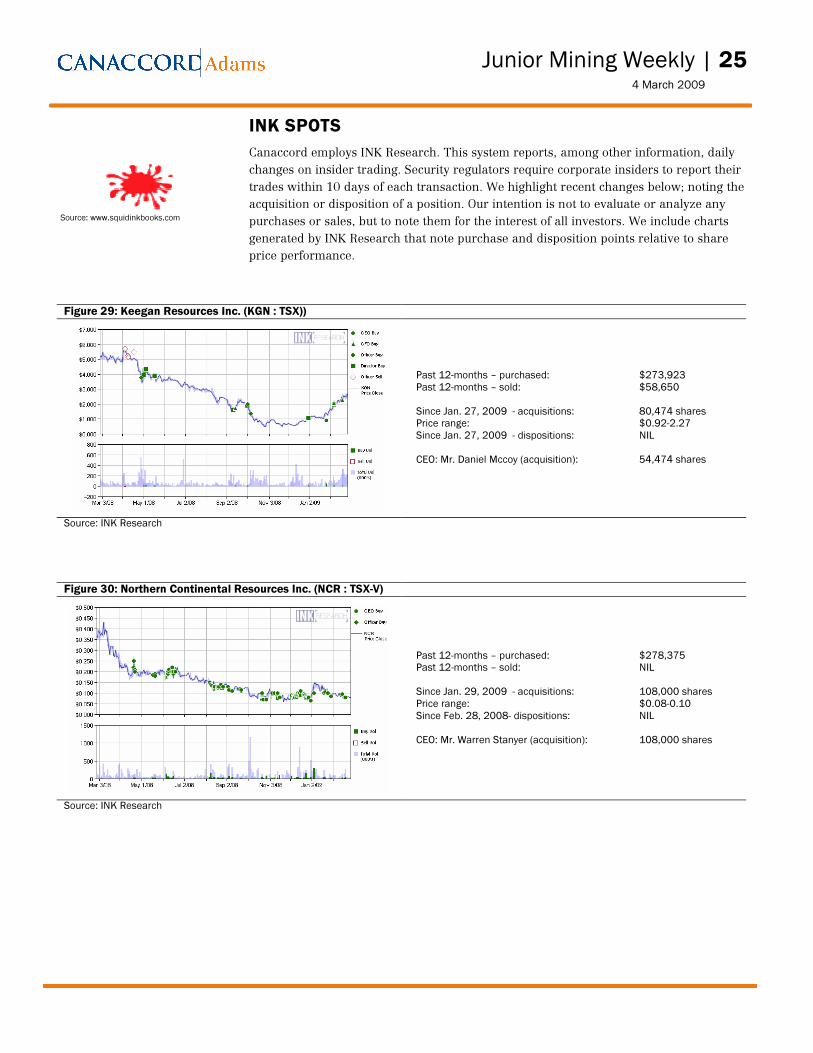
INK SPOTS Canaccord employs INK Research. This system reports, among other information, daily
changes on insider trading. Security regulators require corporate insiders to report their
trades within 10 days of each transaction. We highlight recent changes below; noting the
acquisition or disposition of a position. Our intention is not to evaluate or analyze any
purchases or sales, but to note them for the interest of all investors. We include charts
generated by INK Research that note purchase and disposition points relative to share
price performance.
Figure 29: Keegan Resources Inc. (KGN : TSX))
Past 12-months – purchased: $273,923 Past 12-months – sold: $58,650 Since Jan. 27, 2009 - acquisitions: 80,474 shares Price range: $0.92-2.27 Since Jan. 27, 2009 - dispositions: NIL CEO: Mr. Daniel Mccoy (acquisition): 54,474 shares
Source: INK Research
Figure 30: Northern Continental Resources Inc. (NCR : TSX-V)
Past 12-months – purchased: $278,375 Past 12-months – sold: NIL Since Jan. 29, 2009 - acquisitions: 108,000 shares Price range: $0.08-0.10 Since Feb. 28, 2008- dispositions: NIL CEO: Mr. Warren Stanyer (acquisition): 108,000 shares
Source: INK Research
Source: www.squidinkbooks.com
Junior Mining Weekly | 26 4 March 2009
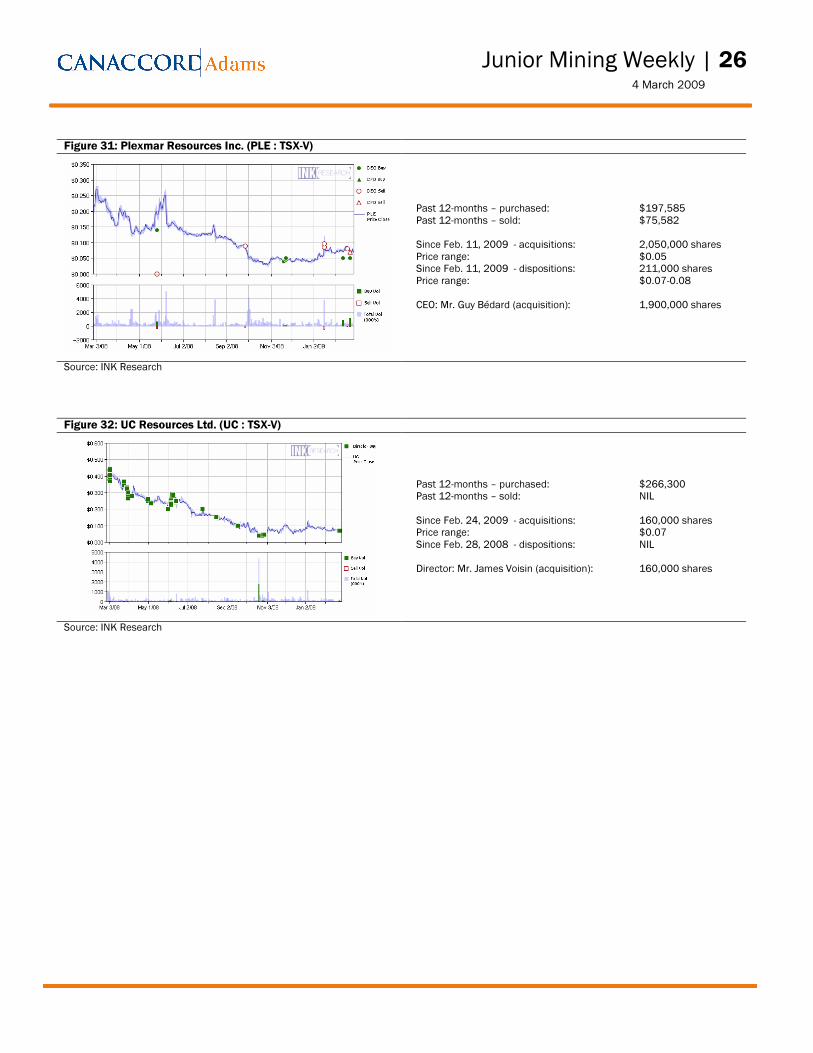
Figure 31: Plexmar Resources Inc. (PLE : TSX-V)
Past 12-months – purchased: $197,585 Past 12-months – sold: $75,582 Since Feb. 11, 2009 - acquisitions: 2,050,000 shares Price range: $0.05 Since Feb. 11, 2009 - dispositions: 211,000 shares Price range: $0.07-0.08 CEO: Mr. Guy Bédard (acquisition): 1,900,000 shares
Source: INK Research
Figure 32: UC Resources Ltd. (UC : TSX-V)
Past 12-months – purchased: $266,300 Past 12-months – sold: NIL Since Feb. 24, 2009 - acquisitions: 160,000 shares Price range: $0.07 Since Feb. 28, 2008 - dispositions: NIL Director: Mr. James Voisin (acquisition): 160,000 shares
Source: INK Research

Junior Mining Weekly | 27 4 March 2009
JUNIOR MINING WEEKLY INDEX PREVIOUS 12 MONTHS
Figure 33: Junior Mining Weekly Index
Company/Commodity Sym Ex Date Company/Commodity Sym Ex Date Company/Commodity Sym Ex Date Adriana Resources Inc. ADI TSX-V 26-Aug-08 Evolving Gold Corp. EVG TSX-V 15-Sep-08 Noront Resources Ltd. NOT TSX-V 26-Mar-08 Alamos Gold Inc. AGI TSX 15-Sep-08 Exeter Resource Corp. EXR TSX-V 3-Feb-09 North American Gem Inc. NAG TSX-V 30-Jun-08 Alexco Resource Corp. AXR TSX 22-Sep-08 20-Jan-09 Northern Dynasty Minerals Ltd. NDM TSX 27-Oct-08 Alexis Minerals Corp. AMC TSX 22-Oct-08 2-Dec-08 Northern Freegold Res. Ltd. NFR TSX-V 20-Jan-09 Amarillo Gold Corp. AGC TSX-V 22-Jul-08 27-Oct-08 Northern Shield Res. NRN TSX-V 24-Jun-08 Amera Resources Corp. AMS TSX-V 29-Jul-08 6-Aug-08 Orezone Resources Inc. OZN TSX 11-Nov-08 Anatolia Minerals Dev. Ltd. ANO TSX 13-Jan-09 30-Jun-08 11-Mar-08 11-Nov-08 6-May-08 Orko Silver Corp. OK TSX-V 23-Feb-09 Andina Minerals Inc. ADM TSX-V 11-Nov-08 1-Apr-08 8-Jul-08 Aquiline Resources Inc. AQI TSX 14-Oct-08 Extract Resources Ltd. EXT TSX 3-Feb-09 Oromin Explorations Ltd. OLE TSX 20-Jan-09 12-Aug-08 18-Dec-08 Pacific Rim Mining Corp. PMU TSX 12-May-08 Arctic Star Diamond Corp. ADD TSX-V 10-Jun-08 26-Nov-08 Panoro Minerals Ltd. PML TSX-V 19-Aug-08 Atna Resources Ltd. ATN TSX 8-Apr-08 19-Nov-08 PC Gold Inc. PKL TSX 17-Feb-09 ATW Gold Corp. ATW TSX-V 27-Jan-09 7-Oct-08 4-Nov-08 AuEx Ventures, Inc. XAU TSX 27-Jan-09 Fancamp Exploration Ltd. FNC TSX-V 15-Sep-08 Pele Mountain Resources Inc. GEM TSX-V 13-Jan-09 Augusta Resource Corp. AZC TSX 20-Jan-09 Farallon Resources Ltd. FAN TSX 1-Apr-08 Peregrine Diamonds Ltd. PGD TSX 18-Dec-08 Aurcana Corporation AUN TSX-V 6-Aug-08 21-May-08 3-Sep-08 B2Gold Corp. BTO TSX 20-Jan-09 First Point Minerals Corp. FPX TSX-V 26-Nov-08 Quest Uranium Corp. QUC TSX-V 30-Sep-08 27-Oct-08 First Uranium Corp. FIU TSX 30-Sep-08 Rainy River Resources Ltd. RR TSX-V 27-Oct-08 8-Sep-08 Fortress Minerals Corp. FST TSX-V 18-Dec-08 15-Sep-08 12-Aug-08 Fronteer Dev. Group Inc. FRG TSX 27-Oct-08 Remstar Resources Ltd. REM TSX-V 30-Jun-08 3-Jun-08 Full Metal Minerals Ltd. FMM TSX-V 19-Aug-08 Rockwell Diamonds Inc. RDI TSX 14-Oct-08 11-Mar-08 Global Copper Corp. GLQ TSX 18-Mar-08 15-Sep-08 Bannerman Resources Ltd. BAN TSX 19-Nov-08 Globestar Mining Corp. GMI TSX 20-Jan-09 Romarco Minerals Inc. R TSX-V 11-Feb-09 30-Sep-08 Gold In Situ in all editions 3-Feb-09 Banro Corp. BAA TSX 18-Dec-08 Gold In Situ Update 14-Oct-08 Rubicon Minerals Corp. RMX TSX 18-Dec-08 26-Nov-08 19-Aug-08 3-Sep-08 22-Sep-08 29-Apr-08 15-Jul-08 Bard Ventures Ltd. CBS TSX-V 15-Jul-08 Gold Star Resources Corp. GXX TSX-V 30-Jun-08 26-May-08 3-Jun-08 Golden Arrow Resources Corp. GRG TSX-V 18-Dec-08 23-Apr-08 Bear Creek Mining Corp. BCM TSX-V 11-Nov-08 Golden Predator Mines Inc. GP TSX 6-Aug-08 Rye Patch Gold Corp. RPM TSX-V 2-Dec-08 Bitterroot Resources Inc. BTT TSX-V 30-Jun-08 Golden Share Mining Corp. GSH TSX-V 2-Dec-08 San Gold Corp. SGR TSX-V 23-Feb-09 Blackstone Ventures Inc. BLV TSX-V 29-Jul-08 Goldsource Mines Inc. GXS TSX-V 30-Jun-08 Saturn Minerals Inc. SMI TSX-V 30-Jun-08 Bravo Venture Group Inc. BVG TSX-V 7-Oct-08 6-May-08 Seabridge Gold Inc. SEA TSX 9-Dec-08 Brett Resources Inc. BBR TSX-V 22-Oct-08 Grayd Resource Corp. GYD TSX-V 11-Nov-08 Serengeti Resources Inc. SIR TSX-V 18-Dec-08 22-Jul-08 8-Jul-08 1-Apr-08 Brilliant Mining Corp. BMC TSX-V 18-Dec-08 Great Panther Res. Ltd. GPR TSX 17-Jun-08 Sherwood Copper Corp. SWC TSX-V 15-Sep-08 22-Oct-08 Greencastle Resources Ltd. VGN TSX-V 30-Jun-08 Shore Gold Inc. SGF TSX 13-Jan-09 Canadian Gold Hunter Corp. CGH TSX 29-Apr-08 Guyana Goldfields Inc. GUY TSX 18-Dec-08 28-Oct-08 Canadian Royalties Inc. CZZ TSX 22-Oct-08 19-Aug-08 Silver In Situ 22-Oct-08 7-Oct-08 Hathor Exploration Ltd. HAT TSX 11-Nov-08 22-Sep-08 Canplats Resources Corp. CPQ TSX-V 11-Nov-08 27-Oct-08 Silver Standard Res. Inc. SSO TSX 9-Dec-08 15-Apr-08 7-Oct-08 Silverstone Resources Corp. SST TSX-V 27-Oct-08 11-Mar-08 30-Sep-08 Sinchao Metals Corp. SMZ TSX-V 4-Nov-08 Capstone Mining Corp. CS TSX 23-Feb-09 3-Sep-08 Skygold Ventures Ltd. SKV TSX-V 1-Apr-08 15-Sep-08 29-Jul-08 Stornoway Diamond Corp. SWY TSX 4-Nov-08 26-May-08 15-Jul-08 14-Oct-08 Cardero Resource Corp. CDU TSX 22-Oct-08 26-May-08 8-Sep-08 CGA Mining Ltd. CGA TSX 11-Nov-08 11-Mar-08 Swift Resources Inc. SWR TSX-V 30-Jun-08 Cogitore Resources Inc. WOO TSX-V 9-Dec-08 Helio Resource Corp. HRC TSX-V 18-Dec-08 Tenajon Resources Corp. TJS TSX-V 21-May-08 Colossus Minerals Inc. CSI TSX 2-Dec-08 Imperial Metals Corp. III TSX 30-Sep-08 Terrane Metals Corp. TRX TSX-V 22-Sep-08 11-Nov-08 International Royalty Corp. IRC TSX 18-Dec-08 Thundermin Resources Inc. THR TSX 2-Dec-08 27-Oct-08 Intl. Tower Hill Mines Ltd. ITH TSX-V 3-Feb-09 Tournigan Energy Ltd. TVC TSX-V 11-Nov-08 7-Oct-08 18-Dec-08 30-Sep-08 26-Aug-08 4-Nov-08 1-Apr-08 29-Jul-08 12-Aug-08 TTM Resources Inc. TTQ TSX-V 8-Sep-08 17-Jun-08 8-Jul-08 22-Jul-08 Columbia Goldfields Ltd. GOL TSX 12-May-08 Keegan Resources Inc. KGN TSX 23-Feb-09 10-Jun-08 Commander Resources Ltd. CMD TSX-V 9-Dec-08 18-Dec-08 UEX Corp. UEX TSX 13-Jan-09 29-Jul-08 Kimber Resources Corp. KBR TSX 15-Apr-08 7-Oct-08 Committee Bay Res. Ltd. CBR TSX-V 18-Mar-08 Kirkland Lake Gold Inc. KGI TSX 27-Jan-09 Underworld Resources Inc. UW TSX-V 18-Dec-08 Condor Resources Inc. CN TSX-V 23-Feb-09 Kivalliq Energy Corp. KIV TSX-V 18-Dec-08 Uracan Resources Ltd. URC TSX-V 18-Dec-08 18-Dec-08 15-Jul-08 2-Dec-08 19-Aug-08 Kodiak Exploration Ltd. KXL TSX-V 3-Sep-08 15-Jul-08 29-Jul-08 Lake Shore Gold Corp. LSG TSX 28-Oct-08 Uranium Energy Corp. UEC AMEX 26-May-08 Copper In Situ 22-Oct-08 27-Oct-08 Uranium In Situ in all editions Copper In Situ Update 15-Jul-08 Laramide Resources Ltd. LAM TSX 19-Aug-08 Uranium Participation Corp. U TSX 23-Apr-08 Copper In Situ Update 8-Apr-08 6-Aug-08 Uranium Update 4-Nov-08 Copper Mesa Mining Corp. CUX TSX 22-Sep-08 Lumina Copper Corp. LCC TSX-V 18-Dec-08 12-Aug-08 Copper Mountain Mng. Corp. CUM TSX-V 18-Mar-08 Luna Gold Corp. LGC TSX-V 20-Jan-09 15-Jul-08 Cornerstone Capital Res. Inc. CPG TSX-V 2-Dec-08 24-Jun-08 23-Apr-08 Corriente Resources Inc. CTQ TSX 11-Nov-08 MAG Silver Corp. MAG TSX 11-Nov-08 Ur-Energy Inc. URE TSX 11-Nov-08 Creston Moly Corp. CMS TSX-V 4-Nov-08 27-Oct-08 27-Oct-08 Detour Gold Corp. DGC TSX 11-Nov-08 22-Sep-08 30-Sep-08 Diamondex Resources Ltd. DSP TSX-V 24-Jun-08 24-Jun-08 15-Sep-08 Diamonds North Res. Ltd. DDN TSX-V 18-Dec-08 Marathon PGM Corp. MAR TSX 14-Oct-08 VMS Ventures Inc. VMS TSX-V 11-Nov-08 3-Jun-08 Mega Uranium Ltd. MGA TSX 28-Oct-08 7-Oct-08 18-Mar-08 Merrex Gold Inc. MXI TSX-V 17-Feb-09 8-Sep-08 Donner Metals Ltd. DON TSX-V 27-Jan-09 26-Aug-08 29-Apr-08 3-Jun-08 1-Apr-08 West Timmins Mining Inc. WTM TSX 18-Dec-08 Dorato Resources Inc. DRI TSX-V 17-Feb-09 Metalex Ventures Ltd. MTX TSX-V 10-Jun-08 Westar Resources Corp. WER TSX-V 30-Jun-08 Duran Ventures Inc. DRV TSX-V 9-Dec-08 Minco Silver Corp. MSV TSX 6-May-08 WSR Gold Inc. WSR TSX-V 10-Jun-08 Endeavour Silver Corp. EDR TSX 30-Sep-08 Minera Andes Inc. MAI TSX 27-Oct-08 Xemplar Energy Corp. XE TSX-V 13-Jan-09 12-Aug-08 15-Sep-08 19-Nov-08 24-Jun-08 Molybdenum In Situ Update 19-Nov-08 30-Jun-08 17-Jun-08 19-Aug-08 Zazu Metals Corp. ZAZ TSX 26-Aug-08 Energy Fuels Inc. EFR TSX 26-May-08 6-May-08 Zinc In Situ Update 11-Feb-09 Esperanza Silver Corporation EPZ TSX-V 7-Oct-08 Nickel In Situ Update 26-Nov-08 28-Oct-08 Etruscan Resources Inc. EET TSX 3-Sep-08 26-Aug-08 6-Aug-08 8-Jul-08 21-May-08 29-Jul-08 26-Mar-08 Noront Resources Ltd. NOT TSX-V 8-Jul-08 29-Apr-08
Source: Canaccord Adams

Junior Mining Weekly | 28 4 March 2009
APPENDIX: IMPORTANT DISCLOSURES Analyst Certification: Each authoring analyst of Canaccord Adams whose name appears on the front page of this investment
research hereby certifies that (i) the recommendations and opinions expressed in this investment research accurately reflect the authoring analyst’s personal, independent and objective views about any and all of the designated investments or relevant issuers discussed herein that are within such authoring analyst’s coverage universe and (ii) no part of the authoring analyst’s compensation was, is, or will be, directly or indirectly, related to the specific recommendations or views expressed by the authoring analyst in the investment research.
Distribution of Ratings: Global Stock Ratings (as of 2 March 2009)
Coverage Universe IB Clients
Rating # % %
Buy 320 57% 29%
Speculative Buy 70 13% 50%
Hold 139 25% 25%
Sell 26 5% 27%
555 100%
Canaccord Adams Ratings System:
BUY: The stock is expected to generate risk-adjusted returns of over 10% during the next 12 months. HOLD: The stock is expected to generate risk-adjusted returns of 0-10% during the next 12 months. SELL: The stock is expected to generate negative risk-adjusted returns during the next 12 months. NOT RATED: Canaccord Adams does not provide research coverage of the relevant issuer. “Risk-adjusted return” refers to the expected return in relation to the amount of risk associated with the designated investment or the relevant issuer.
Risk Qualifier: SPECULATIVE: Stocks bear significantly higher risk that typically cannot be valued by normal fundamental criteria. Investments in the stock may result in material loss.
Canaccord Adams is the business name used by certain subsidiaries of Canaccord Capital Inc., including Canaccord Adams Inc., Canaccord Adams Limited, and Canaccord Adams, a division of Canaccord Capital Corporation. Clients of Canaccord Adams, in the past 12 months, may have been clients of Canaccord Capital Corporation, Canaccord Capital (Europe) Limited, Canaccord Capital Corporation USA Inc., and/or Adams Harkness Financial Group Ltd.
The authoring analysts who are responsible for the preparation of this investment research are employed by Canaccord Adams, a securities broker-dealer with principal offices located in Vancouver, Calgary, Toronto, Montreal (all Canada), Boston, New York, San Francisco (all US) and London (UK).
In the event that this is compendium investment research (covering six or more relevant issuers), Canaccord Adams and its affiliated companies may choose to provide specific disclosures of the subject companies by reference, as well as its policies and procedures regarding the dissemination of investment research. To access this material or for more information, please send a request to Canaccord Adams Research, Attn: Disclosures, P.O. Box 10337 Pacific Centre, 2200-609 Granville Street, Vancouver, BC, Canada V7Y 1H2 or [email protected].
The authoring analysts who are responsible for the preparation of this investment research have received (or will receive) compensation based upon (among other factors) the Corporate Finance/Investment Banking revenues and general profits of Canaccord Adams. However, such authoring analysts have not received, and will not receive, compensation that is directly based upon or linked to one or more specific Corporate Finance/Investment Banking activities, or to recommendations contained in the investment research.
Canaccord Adams and its affiliated companies may have a Corporate Finance/Investment Banking or other relationship with the company that is the subject of this investment research and may trade in any of the designated investments mentioned herein either for their own account or the accounts of their customers, in good faith or in the normal course of market making. Accordingly, Canaccord Adams or their affiliated companies, principals or employees (other than the authoring analyst(s) who prepared this investment research) may at any time have a long or short position in any such designated investments, Related designated investments or in options, futures or other derivative instruments based thereon.
Some regulators require that a firm must establish, implement and make available a policy for managing conflicts of interest arising as a result of publication or distribution of investment research. This investment research has been prepared in accordance with Canaccord Adams’ policy on managing conflicts of interest, and information barriers or firewalls have been used where appropriate. Canaccord Adams’ policy is available upon request.
The information contained in this investment research has been compiled by Canaccord Adams from sources believed to be reliable, but (with the exception of the information about Canaccord Adams) no representation or warranty, express or implied, is made by Canaccord Adams, its affiliated companies or any other person as to its fairness, accuracy, completeness or correctness. Canaccord Adams has not independently verified the facts, assumptions, and estimates contained herein. All estimates, opinions and other information

Junior Mining Weekly | 29 4 March 2009
contained in this investment research constitute Canaccord Adams’ judgement as of the date of this investment research, are subject to change without notice and are provided in good faith but without legal responsibility or liability.
Canaccord Adams salespeople, traders, and other professionals may provide oral or written market commentary or trading strategies to our clients and our proprietary trading desk that reflect opinions that are contrary to the opinions expressed in this investment research. Canaccord Adams’ affiliates, proprietary trading desk, and investing businesses may make investment decisions that are inconsistent with the recommendations or views expressed in this investment research.
This investment research is provided for information purposes only and does not constitute an offer or solicitation to buy or sell any designated investments discussed herein in any jurisdiction where such offer or solicitation would be prohibited. As a result, the designated investments discussed in this investment research may not be eligible for sale in some jurisdictions. This investment research is not, and under no circumstances should be construed as, a solicitation to act as a securities broker or dealer in any jurisdiction by any person or company that is not legally permitted to carry on the business of a securities broker or dealer in that jurisdiction. This material is prepared for general circulation to clients and does not have regard to the investment objectives, financial situation or particular needs of any particular person. Investors should obtain advice based on their own individual circumstances before making an investment decision. To the fullest extent permitted by law, none of Canaccord Adams, its affiliated companies or any other person accepts any liability whatsoever for any direct or consequential loss arising from or relating to any use of the information contained in this investment research.
For Canadian Residents: This investment research has been approved by Canaccord Adams, a division of Canaccord Capital
Corporation, which accepts responsibility for this investment research and its dissemination in Canada. Canadian clients wishing to effect transactions in any Designated Investment discussed should do so through a qualified salesperson of Canaccord Adams, a division of Canaccord Capital Corporation in their particular jurisdiction.
For United Kingdom Residents:
This investment research complies with the Financial Services Authority’s Handbook chapter on Conduct of Business and is approved by Canaccord Adams Limited, which is authorized and regulated by the Financial Services Authority, in connection with its distribution in the United Kingdom. This material is not for distribution in the United Kingdom to retail clients, as defined under the rules of the Financial Services Authority. Canaccord Adams Limited accepts responsibility for this investment research and its dissemination in the United Kingdom. The information contained in this investment research is only intended for distribution in the UK to persons who qualify as professional clients or eligible counterparties, as defined under the rules of the Financial Services Authority.
For European Residents: If this investment research is intended for disclosure in any jurisdiction other than the United Kingdom, the US or Canada, then the relevant rules and regulatory requirements of that jurisdiction will apply.
For United States Residents:
Canaccord Adams Inc., a US registered broker-dealer, accepts responsibility for this Investment Research and its dissemination in the United States. This Investment Research is intended for distribution in the United States only to certain US institutional investors. US clients wishing to effect transactions in any Designated Investment discussed should do so through a qualified salesperson of Canaccord Adams Inc.
Additional information is available on request.
Copyright © Canaccord Adams, a division of Canaccord Capital Corporation 2009. – Member IIROC/CIPF Copyright © Canaccord Adams Limited 2009. – Member LSE, authorized and regulated by the Financial Services Authority. Copyright © Canaccord Adams Inc. 2009. – Member FINRA/SIPC All rights reserved. All material presented in this document, unless specifically indicated otherwise, is under copyright to Canaccord Adams, a division of Canaccord Capital Corporation, Canaccord Adams Limited, and Canaccord Adams Inc. None of the material, nor its content, nor any copy of it, may be altered in any way, or transmitted to or distributed to any other party, without the prior express written permission of the entities listed above.