Can institutions resolve ethnic conflict - Center For ......
22
Can institutions resolve ethnic conflict? 1 Abstract: High quality institutions, such as rule of law, bureaucratic quality, freedom from government expropriation, and freedom from government repudiation of contracts, mitigate the adverse economic consequences of ethnic fractionalization identified by Easterly and Levine 1997 and others. In countries with sufficiently good institutions, ethnic diversity does not lower growth or worsen economic policies. High quality institutions also lessen war casualties on national territory and lessen the probability of genocide for a given amount of ethnic fractionalization. William Easterly World Bank February 2000 1 Some of the results in this paper are based on earlier unpublished work with Ross Levine. Views expressed here are not necessarily those of the World Bank or its member governments.
Transcript of Can institutions resolve ethnic conflict - Center For ......
Can institutions resolve ethnic conflict?1
Abstract: High quality institutions, such as rule of law, bureaucratic quality, freedomfrom government expropriation, and freedom from government repudiation of contracts,
mitigate the adverse economic consequences of ethnic fractionalization identified byEasterly and Levine 1997 and others. In countries with sufficiently good institutions,
ethnic diversity does not lower growth or worsen economic policies. High qualityinstitutions also lessen war casualties on national territory and lessen the probability of
genocide for a given amount of ethnic fractionalization.
William Easterly
World Bank
February 2000
1 Some of the results in this paper are based on earlier unpublished work with Ross Levine. Viewsexpressed here are not necessarily those of the World Bank or its member governments.

2
In 88 BC, King Mithriadates VI of Pontus invaded Roman territory in Asia
Minor. He encouraged Asian debtors to kill their Roman creditors. Happy to reduce their
credit card bills, the Asians massacred 80,000 Romans.1
Ethnic conflict is a tragic constant of human history. Ethnic conflict is still very
much in the news today, from the Balkans to Central Africa to Indonesia to Nigeria.
Recently, the economics literature has studied the effects of ethnic conflict on economic
development.
Easterly and Levine [1997] document an adverse effect of ethnolinguistic
fractionalization on income, growth, and economic policies. They offer this as an
explanation for Africa’s poor growth performance. Alesina, Baqir, and Easterly 1999a
find that more ethnically diverse cities and counties in the US spend less on public goods.
Goldin and Katz 1999 find lower public support for higher education in states with more
religious - ethnic heterogeneity. Goldin and Katz 1997 likewise find lower high school
graduation rates in states that had higher religious-ethnic diversity. Miguel 1999 likewise
finds lower primary school funding in more ethnically diverse districts in Kenya. Mauro
1995 and La Porta, Lopez de Silanes, Shleifer and Vishny 1998 find that ethnic diversity
predicts poor quality of government services. Mauro 1995 and Annett 1999 finds that
linguistic or religious diversity leads to greater political instability, which Annett finds in
turn leads to higher government consumption. Alesina, Baqir, and Easterly 1999b find a
link from ethnic diversity to bloated government payrolls in US cities. Rodrik 1999
noted that ethnically polarized nations react more adversely to external terms of trade
shocks. Svensson 1998 finds that more foreign aid proceeds are diverted into corruption
in more ethnically diverse places. Knack and Keefer 1997 find that ethnic homogeneity
3
raises “social capital” or “trust,” which in turn is associated with faster growth and higher
output per worker. Alesina and La Ferrara 1999 find that higher ethnic heterogeneity
makes participation in social clubs less likely in the US, which is consistent with the idea
that there is not much association across groups. Adelman and Morris 1967 also noted
that “cultural and ethnic heterogeneity tend to hamper the early stages of nation-building
and growth.”2
Easterly and Levine [1997] argue that the adverse effect stems from the political
economy “wars of attrition” that take place between ethnic groups (not to mention real
wars fought along ethnic lines). To change the metaphor, multiple ethnic groups are
subject to “the tragedy of the commons” as each ethnic group over-extracts from a
common resource like commodity export rents. Finally, ethnic groups may have
difficulty agreeing on the type of public goods, leading to less total spending on public
goods -- as documented for US cities and counties by Alesina, Baqir, and Easterly 1999a.
In this paper I ask whether institutional development can mitigate the adverse effects of
destructive ethnic group competition.
Institutions that give legal protection to minorities, guarantee freedom from
expropriation, grant freedom from repudiation of contracts, and facilitate cooperation for
public services would plausibly make a given amount of ethnic fractionalization less
damaging for development. We can think of an interaction effect between quality of
institutions and ethnic diversity that would work something like this:
(Ethnic conflict) = f(Ethnic diversity, Institutional quality)
where f1>0, f2<0, and ∂2(Ethnic conflict)/(∂Ethnic diversity∂Institutional quality)<0.3

4
Poor institutions in Africa may reinforce the ethnolinguistic fractionalization
explanation for Africa’s poor performance. Many studies of Africa cite the hostile
institutional environment as a factor explaining Africa’s poor growth performance (see
World Bank [1994]). These studies argue that the ability to resolve conflicts peacefully
and quickly, to conduct business where the rules of the game are clear, and to have
confidence in the bureaucracy may all influence investment and allocation decisions.
Mauro [1995] and Knack and Keefer [1995] argue that corruption and other institutional
factors are correlated with economic growth using data from country risk services for
international investors.
I. Growth regression with Institutions
Good institutions may mitigate ethnic conflict. I find that the ethnic effect in the
original Easterly and Levine 1997 results disappear if institutions are of sufficiently high
quality. I average Knack and Keefer’s [1995] measures from the International Country
Risk Guide of (a)freedom from government repudiation of contracts, (b) freedom from
expropriation, (c) rule of law, and (d) bureaucratic quality into an overall index of
institutional quality. Data are available for many of the years in the 1980s. I average
these across years 1980-1989 in computing the overall institutional quality index. Then,
as in Barro [1997], I use the 1980s value for the 1970s and 1960s under the assumption
that institutional quality changes slowly. This index, INSTITUTIONS, has a maximum
possible value of 10 and potential minimum of 0. For example, Luxembourg has a
institutional index value of 10, while Liberia and the Sudan have values of 2.9 and 2.7
respectively.

5
INSTITUTIONS is highly correlated (.87) with the general institutional ranking
of the Business Environment Risk Guide (BERI) for 1980-1989 reported by Knack and
Keefer 1995.4 BERI data covers the 1970s and 1980s, so I can check my assumption of
persistence over time. I find a correlation of .95 between the BERI averages for 1970-
1979 and 1980-1989.
INSTITUTIONS is also highly correlated with corruption. INSTITUTIONS has a
correlation of .8 with Mauro’s [1995] 1980-1983 index of corruption, which in turn has a
correlation of .88 with Knack and Keefer’s [1995] 1980-1989 index of corruption.
In Table I, I add the interaction term, INSTITUTIONS*ETHNIC to the most
complete growth regression of Easterly and Levine 1997. The data still demonstrate that
ethnic diversity is negatively associated with long-run growth. However, Table I’s
results imply that sound institutional arrangements mitigate the negative effects of ethnic
diversity.5 Indeed, the results indicate that ethnic diversity has a zero marginal effect on
economic growth at maximum institutional development (INSTITUTIONS equal to 10).
This result may be related to that of Collier 1999 that democracy eliminates the
adverse effect of ethnolinguistic fractionalization on growth. I test whether democracy is
more relevant than institutions by adding a variable ETHNIC*POLRIGHTS, where
POLRIGHTS is the Gastil index of political rights from 1 to 7, where 1 is the most
democratic. This variable is insignificant, with the wrong sign and a t-statistic of only
.33. These results suggest that it is institutions rather than democracy that contain ethnic
conflict, although we should probably take these results with a grain of salt since the two
variables are so highly correlated that the result could depend on a few outliers.
II. Institutions, Ethnic Diversity, and Policy Choices
6
Next, I explore the effect of institutions on mitigating the adverse effects of ethnic
diversity on policy. While ethnic diversity is given exogenously, countries may be able
to adopt institutional arrangements -- clear property rights, freedom from expropriation,
effective “rules of the game,” and an efficient bureaucracy -- that mitigate the negative
repercussions of diverse interest groups. Clear rules of the game may substantially reduce
or eliminate costly rent-seeking behavior associated with ethnic diversity.
I examine whether sound institutions mitigate the negative effects of ethnic
fragmentation on policy choices by including the term INSTITUTIONS*ETHNIC in the
regressions for policy indicators from Easterly and Levine 1997. Thus, I regress
measures of educational attainment, political stability, financial depth, the black market
exchange rate premium, the fiscal surplus, and the number of telephones per worker on
ETHNIC and the interaction term INSTITUTIONS*ETHNIC. For educational
attainment, financial depth, the black market exchange rate premium, and the number of
telephones per worker, I find in OLS regressions that (1) ethnic diversity causes a
deterioration in the dependent variable (consistent with the results of Easterly and Levine
1997) and (2) institutions significantly mitigate the negative effects of ethnic diversity
(Table II). In fact, the results indicate that in countries with very highly developed
institutions, ethnic diversity does not significantly hurt policy choices. Institutional
arrangements can overcome the negative implications of ethnic diversity. The coefficient
magnitudes imply that the derivative of policies with respect to ETHNIC actually
changes sign at very high values of institutions.
Although this suggests a reform strategy that focuses on improving a country’s
institutions, altering institutional arrangements is fundamentally more difficult than
7
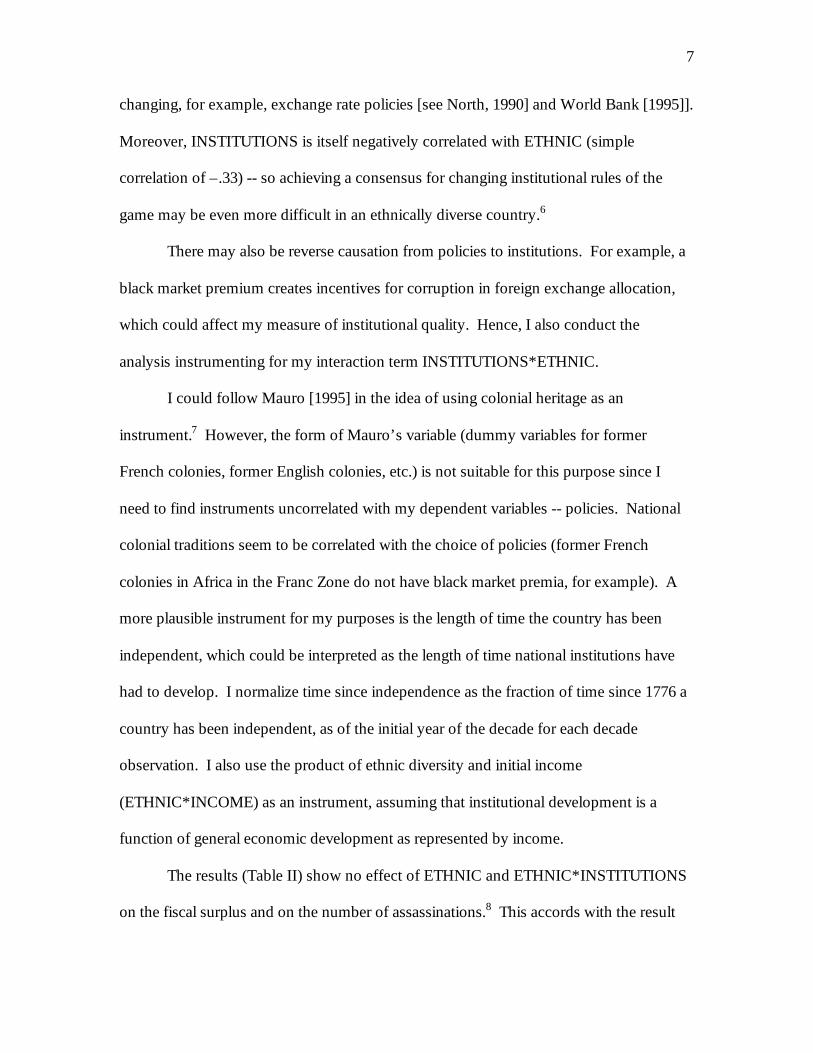
changing, for example, exchange rate policies [see North, 1990] and World Bank [1995]].
Moreover, INSTITUTIONS is itself negatively correlated with ETHNIC (simple
correlation of –.33) -- so achieving a consensus for changing institutional rules of the
game may be even more difficult in an ethnically diverse country.6
There may also be reverse causation from policies to institutions. For example, a
black market premium creates incentives for corruption in foreign exchange allocation,
which could affect my measure of institutional quality. Hence, I also conduct the
analysis instrumenting for my interaction term INSTITUTIONS*ETHNIC.
I could follow Mauro [1995] in the idea of using colonial heritage as an
instrument.7 However, the form of Mauro’s variable (dummy variables for former
French colonies, former English colonies, etc.) is not suitable for this purpose since I
need to find instruments uncorrelated with my dependent variables -- policies. National
colonial traditions seem to be correlated with the choice of policies (former French
colonies in Africa in the Franc Zone do not have black market premia, for example). A
more plausible instrument for my purposes is the length of time the country has been
independent, which could be interpreted as the length of time national institutions have
had to develop. I normalize time since independence as the fraction of time since 1776 a
country has been independent, as of the initial year of the decade for each decade
observation. I also use the product of ethnic diversity and initial income
(ETHNIC*INCOME) as an instrument, assuming that institutional development is a
function of general economic development as represented by income.
The results (Table II) show no effect of ETHNIC and ETHNIC*INSTITUTIONS
on the fiscal surplus and on the number of assassinations.8 This accords with the result

8
by Easterly and Levine 1997 that ethnic diversity does not affect the fiscal surplus or the
number of assassinations, so there is no effect for INSTITUTIONS to mitigate.
Like Easterly and Levine 1997, however, I find that ethnic diversity causes lower
schooling, less financial depth, a bigger black market exchange rate premium, and less
infrastructure. For these effects, I find that sound institutions eliminate the negative
effects of ethnic diversity on economic policies. Furthermore, when I do include the less
than ideal instruments of colonial dummies for England, France, Spain, Portugal, etc., as
in Mauro [1995], the results remain unchanged. I also tried instruments to account for
natural endowments, such as Sachs and Warner’s [1995,1999] natural resource
abundance measures, population size, and land area. The results were still unchanged.
I did a Hausman test of the over-identifying restrictions to see if
ETHNIC*INCOME and “years since independence” are indeed excludable from these
policy regressions.9 I fail to reject the over-identifying restrictions; that is, I find no
evidence that these instruments belong in the regression for policies directly. This is
helpful since it tells us that institutions is not simply proxying for, say, income. Of
course, the use of instrumental variables technique addresses causality only if the
instruments are truly exogenous, an assumption which seems more well grounded for the
years-since-independence variable than the income variable. When I use only the years
since independence variable, or this variable combined with an interaction term (years-
since-independence times ETHNIC), the pattern of signs and significance is unchanged
(although coefficient magnitudes do shift).
III. War, institutions, and ethnic diversity

9
Although not the main theme of their paper, Easterly and Levine 1997 note that
ethnic fractionalization is correlated with war casualties on national territory (data from
Sivard 1993). It is obvious from experience ranging from Afghanistan to Sudan that
ethnic conflict sometimes takes on this most violent of forms. Hence, it is interesting to
see if good institutions that mitigate economic consequences of diversity can modify
violent ethnic conflict as well.
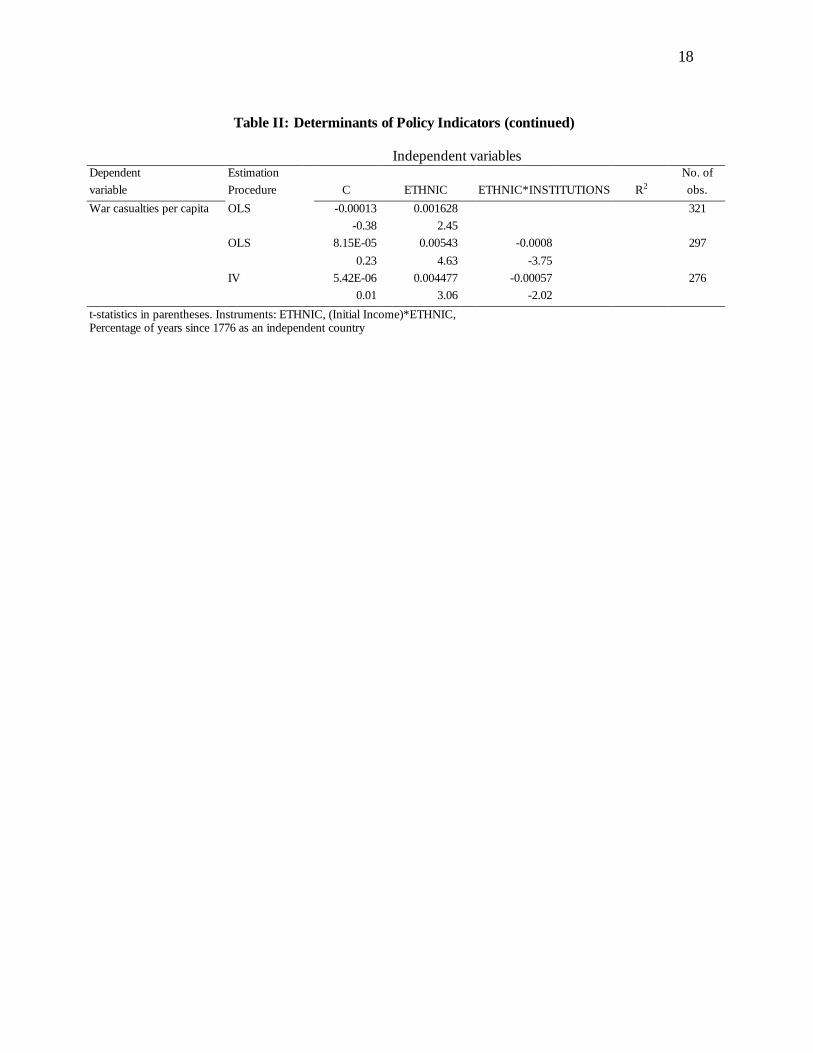
The last lines of Table II confirm that ethnic fractionalization increases the
likelihood of war casualties. However, once again good institutions are effective in
mitigating this threat. Indeed at maximum quality institutions (INSTITUTIONS=10), the
effect of ethnic fractionalization on war is cancelled out all together. This accords well
with casual observation – ethnic differences may lead to civil war in Kosovo, Rwanda,
and Sudan, but they do not in Belgium, Canada, or Switzerland.
Collier and Hoeffler 1998 find that the relationship between duration of civil war
and ethnic diversity is quadratic, with peak civil war duration at ETHNIC=43. I tested a
quadratic term for ETHNIC in my civil war regression, but found both ETHNIC and
ETHNIC^2 to be insignificant in this case. The interaction term between ETHNIC and
INSTITUTIONS continued to be significantly negative. The differing results from
Collier and Hoeffler 1998 may be explained by my use of a different measure of intensity
of civil war (casualties per capita rather than duration) and the inclusion of the
institutional interaction effect.
IV. Genocide, institutions, and ethnic diversity
Another violent manifestation of ethnic conflict is genocide, defined as state-
sponsored killings whose victims are identified at least in part by their ethnic

10
classification. According to Harff and Gurr 1996 “Geno/politicide is the promotion,
execution, and/or implied consent of sustained policies by governing elites or their agents
– or in the case of civil war either of the contending authorities – that result in the deaths
of a substantial portion of a communal and/or politicized communal group.”
The tragic history of genocide is a long one. A non-exclusive list of victims of
ethnic massacres over the last millenium includes: the Danes in Anglo-Saxon England in
1002, the Jews in Europe during the First Crusade 1096-99, the French in Sicily in 1282,
the French in Bruges in 1302, the Flemings in England in 1381, the Jews in Iberia in
1391, converted Jews in Portugal in 1507, the Huguenots in France in 1572, Protestants
in Magdeburg in 1631, Jews and Poles in the Ukraine in 1648-54, indigenous populations
in the US, Australia, and Tasmania in the 18th and 19th centuries, Jews in Russia in the
19th century, the French in Haiti in 1804, Arab Christians in Lebanon in 1841, Turkish
Armenians in 1895-96 and 1915-1916, Nestorian, Jacobite, and Maronite Christians in
the Turkish empire in 1915-16, Greeks in Smyrna in 1922, Haitians in the Dominican
Republic in 1936, the Jewish Holocaust in German-occupied territory 1933-1945,
Serbians in Croatia in 1941, and Muslims and Hindus in British India in 1946-47. 10
Easterly and Levine 1997 noted that their measure of ethnolinguistic
fragmentation was significant and positive in a probit equation for the occurrence of
genocide. The measure they use (and I use here) is taken from Harff and Gurr 1996. Here
I use this data to construct a dummy variable that takes on the value 1 if a genocide
(defined to include either “communal victims” or “mixed communal and political
victims” in Harff and Gurr’s terminology) occurred at any time from 1960 to 1990.
There are 16 countries that had a genocide over this period according to Harff and Gurr’s
classification. The 16 countries are Angola, Burundi, Burma-Myanmar, Ethiopia,

11
Equatorial Guinea, Guatemala, Kampuchea-Cambodia, Nigeria, Pakistan, Paraguay,
Rwanda, Sudan, Somalia, Uganda, and Zaire-Congo. Table III lists the dates and ethnic
victims of the genocidal killings for these 16 countries.
Here I investigate whether the presence of high quality institutions lowers the
probability of genocide for a given amount of ethnolinguistic fragmentation. Table IV
shows the results. Regression [1] shows the basic result: ethnic fragmentation has a
significant and positive effect on the probability of genocide, while the interaction term
between ethnic fragmentation and INSTITUTIONS has a negative effect. Higher quality
institutions make a given degree of ethnic diversity less likely to result in genocide.
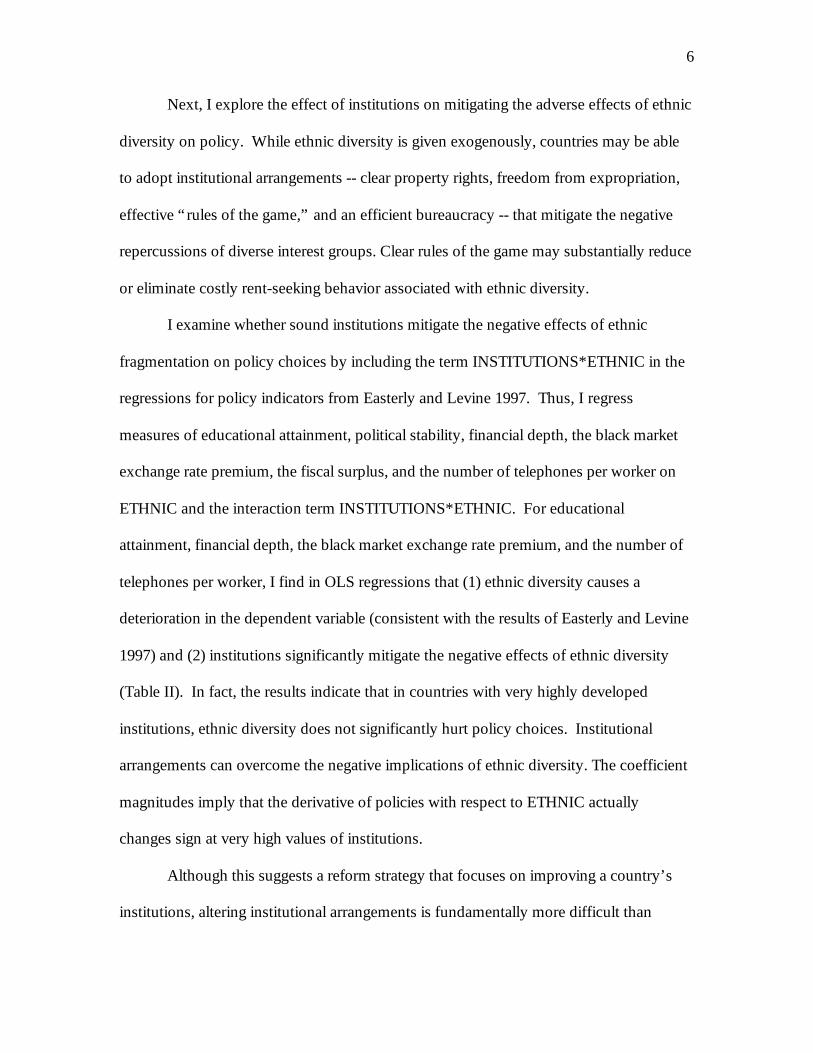
Figure 2 illustrates this result. Countries in the lowest third of institutional quality have
an increasing probability of genocide as ethnic fragmentation increases. The probability
is all the way up to .5 in countries that are in the highest third of ethnic fragmentation and
the lowest third of institutional quality. This group includes genocides in Angola,
Guatemala, Indonesia, Nigeria, Pakistan, Sudan, Uganda, and Zaire.
Conversely, countries in the upper two-thirds of institutional quality do not show
an increasing probability of genocide as ethnic fragmentation increases. Most striking of
all, countries in the upper third of institutional quality have NO genocides, regardless of
their level of ethnic diversity. Examples of countries with high ethnic fragmentation but
also high quality institutions include Canada, Malaysia, and Thailand.
The succeeding columns of Table III test the results for robustness to alternative
explanatory variables. Could institutional quality be simply proxying for per capita
income? In regressions [2] and [3] I include income as a right-hand-side variable on its
own and as an interaction effect with ethnic fragmentation. Income is significant on its
own, but the effect of the interaction term between ethnic fragmentation and institutions
remains significant. In regression [4], I test whether institutional quality is simply
proxying for democracy, using the well-known Gastil index for suppression of
democratic rights. The interaction with democracy is insignificant, while the institutional

12
quality interaction effect remains significant. If we take institutional quality as a measure
of economic and legal freedoms, these seems to be more important than political
freedoms in mitigating the effect of ethnic diversity on the likelihood of genocide.
The price that this nation must pay for the continued oppression and exploitation of theNegro or any other minority group is the price of its own destruction.
--Martin Luther King Jr.11
V. Conclusions
Previous studies (Knack and Keefer 1995, Mauro 1995) have found strong
institutional effects of corruption and lack of rule of law on economic growth. Easterly
and Levine 1997 found direct and indirect effects of ethnic diversity on economic growth.
I find that institutional factors interact with ethnic diversity, as they affect whether ethnic
conflict is destructive or is contained by the rules of the game. Ethnic diversity has a
more adverse effect on economic policy and growth when institutions are poor. To put it
another way, poor institutions have an even more adverse effect on growth and policy
when ethnic diversity is high. Conversely, in countries with sufficiently good institutions,
ethnic diversity does not lower growth or worsen economic policies. Good institutions
also lower the risk of wars and genocides that might otherwise result from ethnic
fractionalization. Ethnically diverse nations that wish to endure in peace and prosperity
must build good institutions.
This is a promising area for future research. It may be that the INSTITUTIONS
variable is a proxy for more general legal safeguards for ethnic minorities. Economists
should do more case studies of successful and unsuccessful examples of ethnic groups
co-existing within nations. The study of oppression of one ethnic group by another is a
rich area for further investigation – what conditions facilitate or prevent oppression? How
much does the answer depend on initial inequality between ethnic groups? How much
does the answer depend on the definition of ethnicity? The study of ethnically-based war
and genocide is also a fruitful area for further research. What can we learn from the
abundant historical data about the possible economic or social determinants of ethnic war

13
and genocide? What more can governments do to finally bring the sad history of ethnic
conflicts to an end?

14
REFERENCES
Adelman, Irma and Cynthia Taft Morris, Society, politics, and economic development: aquantitative approach, Johns Hopkins Press, Baltimore, 1967.
Alesina, Alberto, Reza Baqir, and William Easterly, 1999a, “Public Goods and EthnicDivisions”, Quarterly Journal of Economics, November.
Alesina, Alberto, Reza Baqir, and William Easterly, 1999b “Redistributive governmentemployment,” Journal of Urban Economics, forthcoming.
Alesina, Alberto and Eliana La Ferrara, “Participation in heterogeneous communities,” NBERWorking Paper 7155, June 1999.
Annett, Anthony. “Ethnic and religious division, political instability, and governmentconsumption,” IMF mimeo, March 1999.
Barro, Robert, Determinants of Economic Growth: A Cross-Country Empirical Study,(Cambridge MA: MIT Press), 1997.
Bell-Fialkoff, Andrew, Ethnic Cleansing, St. Martin’s Press: New York, 1996
Collier, Paul. “Ethnicity, Politics, and Economic Performance,” World Bank mimeo,1999.
Collier, Paul and Anke Hoeffler, “On economic causes of civil war,” Oxford EconomicPapers 50 (1998), 563-573.
Easterly, William. “The Middle Class Consensus and Economic Development.” Mimeo,World Bank, 1999.
Easterly, William and Ross Levine, "Africa’s Growth Tragedy: Policies and EthnicDivisions,” November 1997, Quarterly Journal of Economics. CXII (4), 1203-1250.
Goldin, Claudia and Lawrence Katz, “The shaping of higher education: the formativeyears in the United States, 1890 to 1940”, Journal of Economic Perspectives,Winter 1999, Volume 13, No 1, 37-62.
Goldin, Claudia and Lawrence Katz, “Why the United States led in education: lessonsfrom secondary school expansion, 1910 to 1940,” NBER Working Paper 6144,August 1997.
Greene, William H. Econometric Analysis. Second Edition 1993.

15
Harff, Barbara, and Ted Robert Gurr, “Victims of the State: Genocides, Politicides andGroup Repression from 1945 to 1995,” in, Contemporary genocides : causes,cases, consequences, PIOOM Foundation: Leiden, Netherlands, 1996.
Knack, Stephen, and Philip Keefer, “Institutions and Economic Performance: Cross-Country Tests Using Alternative Institutional Measures,” Economics and Politics,VII (1995), 207-227.
Knack, Stephen, and Philip Keefer, “Does Social Capital Have an Economic Payoff? ACross-country Investigation,” Quarterly Journal of Economics, Vol. CXII, Issue4, November 1997, 1251-1288.
La Porta, Rafael, Florencio Lopez-de-Silanes, Andrei Shleifer, and Robert Vishny, “Thequality of government,” NATIONAL BUREAU OF ECONOMIC RESEARCHWORKING PAPER SERIES 6727, September 1998
Mauro, Paolo, “Corruption and Growth,” Quarterly Journal of Economics, CX (1995),681-712.
Miguel, Ted. “Ethnic diversity and school funding in Kenya.” Mimeo, HarvardUniversity, November 1999
North, Douglas, Institutions, Institutional Change, and Economic Performance.” (NewYork, NY: Cambridge University Press, 1990).
Rodrik, Dani. “Where Did All the Growth Go? External Shocks, Social Conflict, andGrowth Collapses,” Journal of Economic Growth, Volume 4, Issue 4, December1999 pp. 385-412
Sachs, Jeffrey D.. and Andrew M. Warner, “The Big Push, Natural Resource Booms andGrowth”, Journal of Development Economics; v59 n1 June 1999, pp. 43-76.
Sachs, Jeffrey D. and Andrew M. Warner, “Natural resource abundance and economicgrowth.” NBER Working Paper No. 5398 December 1995
Sivard, Ruth L., World Military and Social Expenditures: 1993. 15th ed. (Washington,DC: World Priorities, 1993).
Svensson, Jakob. “Foreign aid and rent-seeking,” World Bank, Development EconomicsResearch Group, Policy research working paper 1880. [1998]
World Bank, Bureaucrats in Business: The Economics and Politics of GovernmentOwnership. (New York, NY: Oxford University Press, 1995).
World Bank, Adjustment in Africa: Reforms, Results, and the Road Ahead. (New York,NY: Oxford Univ. Press, 1994).

16
Table I: Redoing Easterly and Levine1997 Growth Regressions: Pooled
Decades (1960s, 1970s, 1980s)
Dependent Variable: Real Per Capita GDPGrowth
VariableDummy variable for Sub- -0.015 Saharan Africa (-2.15)
Dummy variable for L. -0.017America and the Carribean (-4.24)
Log of initial Income 0.100(3.92)
Square of log of initial income -0.008(-4.62)
Log of Schooling 0.009(1.62)
Assassinations -13.763(-1.53)
Financial Depth 0.011(1.69)
Black Market Premium -0.018(-3.27)
Fiscal Surplus/GDP 0.179(4.30)
Log of Telephones per worker 0.004(1.76)
INSTITUTIONS 0.001 (1 worst, 10 best) (0.64)
ETHNIC*INSTITUTIONS 0.005(1.98)
ETHNIC -0.039(-2.16)
No. of observations 171
Heteroskedasticity-consistent t-statistics inparentheses. Decade dummies not shownSee Easterly and Levine 1997 for data sources

17
Table II: Determinants of Policy Indicators
Independent variablesDependent Estimation No. ofvariable Procedure C ETHNIC ETHNIC*INSTITUTIONS R2 obs.Log of Schooling OLS 1.77 -0.873 0.18 265
(33.31) (-8.06)OLS 1.686 -1.992 0.260 0.37 249
(33.85) (-12.12) (9.70)IV 1.613 -2.994 0.483 242
(31.00) (-12.45) (10.41)Assassinations OLS 3.54E-05 -7.9E-06 0.00 314
(3.41) (-0.45)OLS 4.49E-05 0.0001 -2.5E-05 0.04 285
(3.69) (2.38) (-3.16)IV 3.52E-05 -5.21E-05 9.99E-06 280
(2.95) (-1.63) (1.14)Financial depth OLS 0.471 -0.290
(15.28) (-5.83) 0.10 300OLS 0.465 -0.756 0.099 0.23 272
(14.35) (-11.10) (7.45)IV 0.45 -1.008 0.155 270
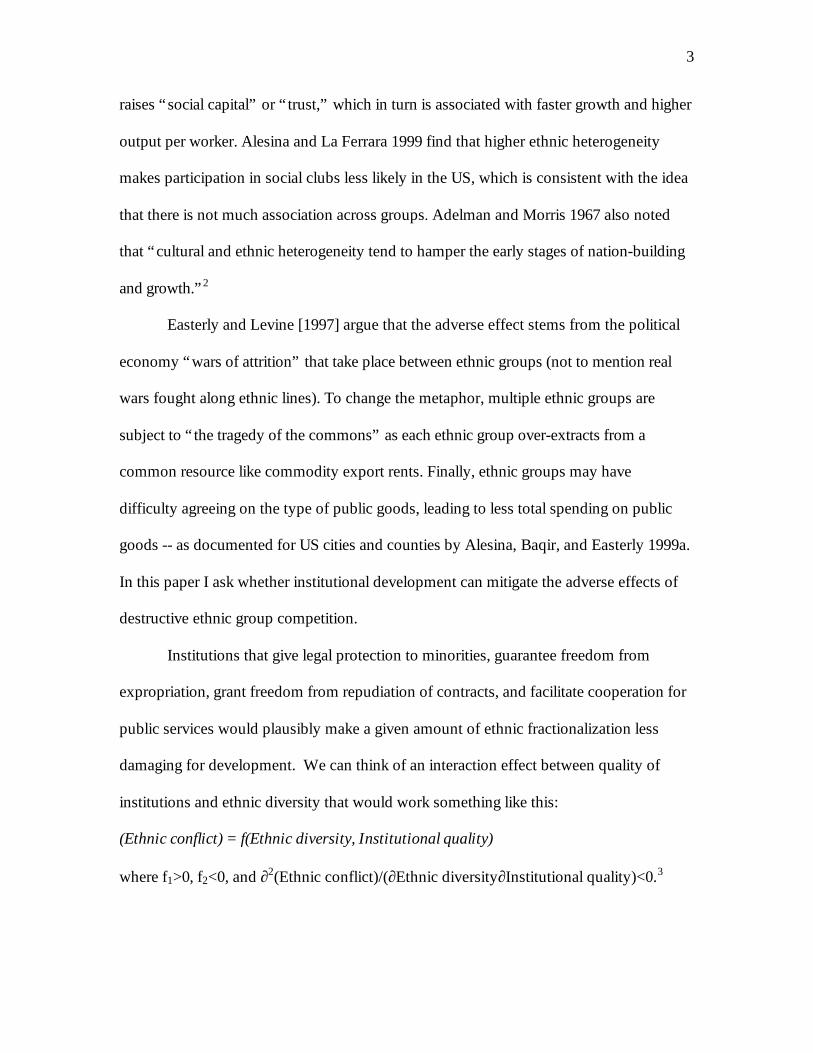
(13.37) (-10.28) (7.01)Black market premium OLS 0.110 0.240 0.04 316
(4.39) (3.93)OLS 0.139 0.877 -0.132 0.18 288
(5.35) (7.48) (-7.54)IV 0.152 0.896 -0.15 277
(5.76) (5.55) (-4.93)Fiscal surplus/GDP OLS -0.034 -0.014 0.01 227
(-7.38) (-1.44)OLS -0.037 -0.045 0.007 0.03 214
(-7.57) (-2.27) (2.17)IV -0.035 -0.023 0.002 214
(-7.20) (-1.17) (0.52)Log of telephones per OLS 4.863 -3.283 0.25 293
worker (28.23) (-10.54)OLS 4.813 -7.722 0.930 0.53 274
(33.24) (-18.28) (12.44)IV 4.55 -11.668 1.80 267
(30.48) (-13.23) (10.62)
18
Table II: Determinants of Policy Indicators (continued)
Independent variablesDependent Estimation No. ofvariable Procedure C ETHNIC ETHNIC*INSTITUTIONS R2 obs.War casualties per capita OLS -0.00013 0.001628 321
-0.38 2.45OLS 8.15E-05 0.00543 -0.0008 297
0.23 4.63 -3.75IV 5.42E-06 0.004477 -0.00057 276
0.01 3.06 -2.02
t-statistics in parentheses. Instruments: ETHNIC, (Initial Income)*ETHNIC,Percentage of years since 1776 as an independent country

19
Table III: Lists of genocidal killings, 1960-90 (from Harff and Gurr1996)country Dates2 Communal Victims3
ANGOLA 1961-62 Kongo tribeBURUNDI 1965-73,
1988Hutu leaders (65-73)Hutu civilians (88)
MYANMAR 1978 MuslimsETHIOPIA 1984-89 TigreansEQUATORIALGUINEA
1969-1979
Bubi tribe
GUATEMALA 1966-84 IndiansINDONESIA 1965-66,
1975-endof sample
Ethnic Chinese (65-66),East Timorese (75-end)
CAMBODIA 1975-79 Muslim ChamsNIGERIA 1966 Ibos living in the NorthPAKISTAN 1971,
1973-77Bengali nationalists (71), Baluchi (73-77)
PARAGUAY 1962-72 Ache IndiansRWANDA 1963-64,
1994Tutsi ruling class (63-64)Tutsis, moderate Hutus (94)
SUDAN 1956-72,1983-endof sample
Non-Muslim African Southerners (56-72)Dinka, Shilluk, Nuba (83-end)
SOMALIA 1988-89 Issak clan (Northerners)UGANDA 1971-79,
1979-86Karamojong, Acholi, Lango (71-79),Karamojong, Nilotic, Bagandans (79-86)
ZAIRE 1964-65 Europeans
2 When episodes began, ended, or repeated out of the sample dates, I show those dates also.3 Includes Harff and Gurr categories “communal victims” and “mixed communal and political victims”

20
Table IV: Probit equation for genocide (dummy=1 if genocide occurred during1960-90)Regression [1] [2] [3] [4]C -1.72 6.23 -1.52 -1.69z-statistic -4.41 1.58 -3.60 -3.99Ethnolinguistic fractionalization (ELF),1960
5.40 4.69 14.42 4.06
z-statistic 3.87 2.85 2.50 1.81ELF*Institutions (80s) -0.99 -1.14 -1.13 -0.97z-statistic -2.87 -2.60 -2.61 -2.61Income, 1960 -1.07z-statistic -2.00ELF*Income (1960) -1.35z-statistic -1.70ELF*Suppression of democracy (70-90) 0.21z-statistic 0.69Observations 99 94 94 93

21
Endnotes
1 Bell-Fialkoff 1996, p. 10-11
2 p. 41, Adelman and Morris 1967.
lowmedium
high
low
medium
high
0
0.1
0.2
0.3
0.4
0.5
0.6
Black market premium
Institutional quality
Ethnic diversity
Figure 1: Black market premium, ethnic diversity, and institutions
LOWMEDIUM
HIGH
LOW
MEDIUM
HIGH
0
0.05
0.1
0.15
0.2
0.25
0.3
0.35
0.4
0.45
0.5
Probability of genocide, 60-90
Institutional quality
Ethnolinguistic fragmentation
Figure 2: Probability of genocide, institutional quality, and ethnolinguistic fragmentation

22
3 This is similar to the formula proposed by Rodrik 1999 for response to shocks.
4. The BERI index is made up of measures of (1)Bureaucratic Delay, (2) Contract Enforceability,
(3)Nationalization Risk, and (4) Infrastructure Quality.
5 Collier has a related result, that democracy eliminates the adverse effect of ethnic fragmentation on
growth.
6 Mauro 1995 earlier noted an association between ethnolinguistic fractionalization and corruption.
7. A similar idea is Barro’s [1997] use of (Spanish) colonial heritage as an instrument for inflation.
8. I also failed to find any effect on the other 8 measures of political instability mentioned in Easterly and
Levine, with the exception of constitutional changes, which matches their results.
9. See the description in Greene, p. 617. I form residuals from the two stage least regression, then regress
them on all of the exogenous variables (ETHNIC, INCOME*ETHNIC, YRSINDEP). The test statistic is
equal to N times the R2 of the second regression, where N is the number of observations. The test statistic
is distributed χ2 with one degree of freedom (two excluded exogenous variables minus one endogenous
variable).
10 Bell-Fialkoff 1996, p. 10-11
11 From http://www.stanford.edu/group/King/speeches/Speech_at_the_great_march_on_detroit.html