Camtek Dec13 Presentation
21
Roy Por at, CEO | Moshe Eisenberg, CFO INVESTORS PRESENT A TION December 2013
Transcript of Camtek Dec13 Presentation
8/13/2019 Camtek Dec13 Presentation
http://slidepdf.com/reader/full/camtek-dec13-presentation 1/22
Roy Porat, CEO | Moshe Eisenberg, CFO
INVESTORS PRESENTATION December 2013
8/13/2019 Camtek Dec13 Presentation
http://slidepdf.com/reader/full/camtek-dec13-presentation 2/22
Safe Harbor
The information presented today contains forward-looking statements that relate to anticipated future operating results and performance.
These statements are only predictions based on management’s current expectations and assumptions, including with respect to market
size, Total Available Market (or “TAM”) and revenue targets, and necessarily involve risks and uncertainties. Moreover, our stated revenuetargets are inspirational and should not be taken as projections of actual future results. We do not assume any obligation to update the
information provided. Actual events or results may differ materially from those projected, including as a result of changing industry and
market trends, reduced demand for our products, the timely development of our new products and their adoption by the market, increased
competition in the industry, price reductions and other subsequent developments and business conditions, as well as due to ri sks and other
important information identified in the documents filed with the Securities and Exchange Commission, including the Company’s Annual
Reports on Form 20-F and Reports on Form 6-K.
The presentation includes non-GAAP financial measures which are not intended to be considered in isolation or as a substitute for the
financial information prepared and presented in accordance with GAAP. Management uses both GAAP and non-GAAP measures whenevaluating the business internally and therefore believes it is important to make these non-GAAP measures available to the financial
community. Reconciliations of non-GAAP measures to the most relevant GAAP amounts are set forth in the Appendices to this
presentation.
This presentation includes the company’s estimations on Market size and TAM, (“Total Available Market,” or “TAM”) these estimations can
vary and may be differ materially from the reality and are based on internal estimations. TAM or market size is the company’s estimation
on the total yearly market size.
2
8/13/2019 Camtek Dec13 Presentation
http://slidepdf.com/reader/full/camtek-dec13-presentation 3/22
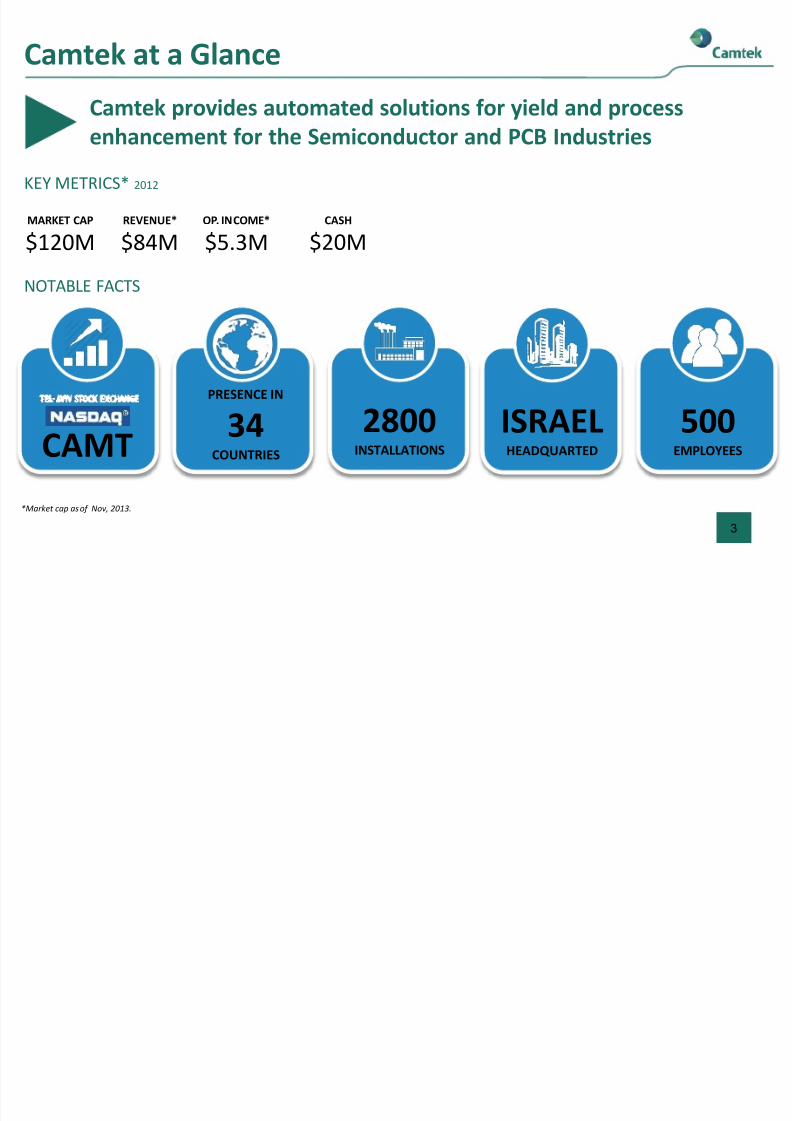
Camtek at a Glance
*Market cap as of Nov, 2013.
NOTABLE FACTS
MARKET CAP
$120MREVENUE*
$84MOP. INCOME*
$5.3M
KEY METRICS* 2012
CAMT
PRESENCE IN
34COUNTRIES
500EMPLOYEES
ISRAELHEADQUARTED
2800INSTALLATIONS
CASH
$20M
3
Camtek provides automated solutions for yield and process
enhancement for the Semiconductor and PCB Industries
8/13/2019 Camtek Dec13 Presentation
http://slidepdf.com/reader/full/camtek-dec13-presentation 4/22
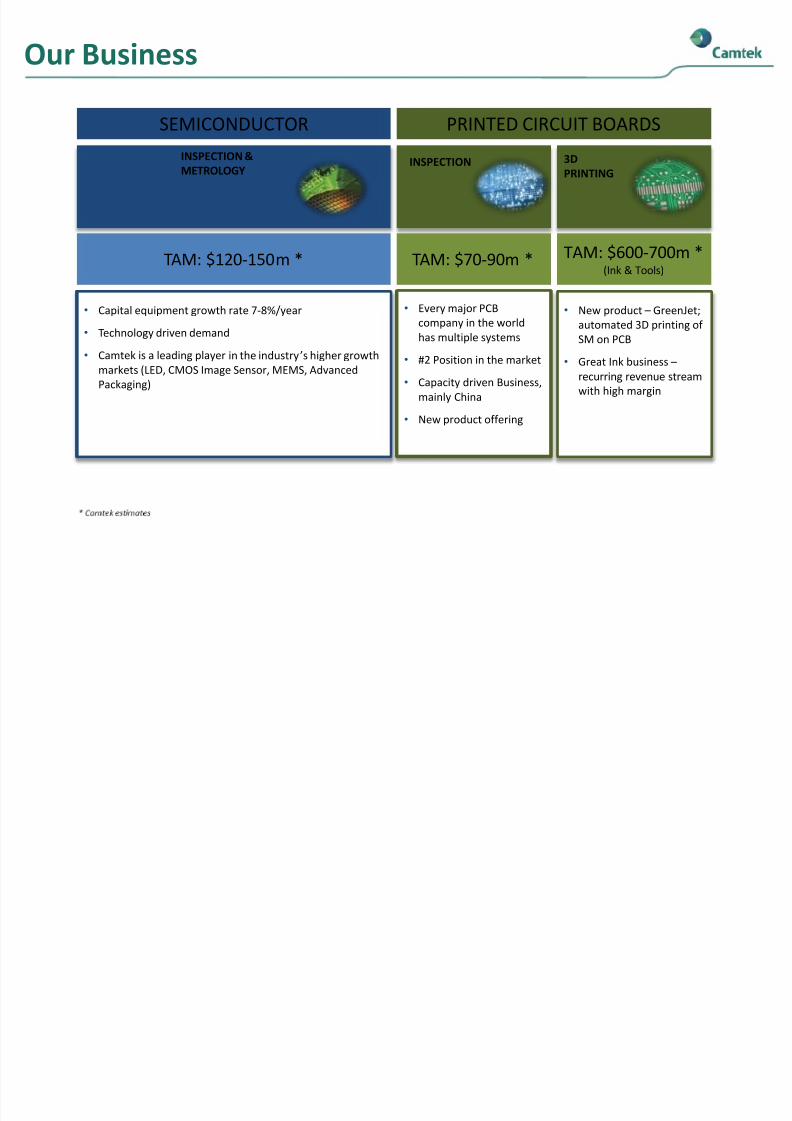
Our Business
• New product – GreenJet;
automated 3D printing of
SM on PCB
• Great Ink business –
recurring revenue stream
with high margin
3D
PRINTING
INSPECTION &
METROLOGY
• Capital equipment growth rate 7-8%/year
• Technology driven demand
• Camtek is a leading player in the industry’s higher growth
markets (LED, CMOS Image Sensor, MEMS, Advanced
Packaging)
INSPECTION
• Every major PCB
company in the world
has multiple systems
• #2 Position in the market
• Capacity driven Business,
mainly China
• New product offering
PRINTED CIRCUIT BOARDS SEMICONDUCTOR
TAM: $120-150m * TAM: $70-90m * TAM: $600-700m *(Ink & Tools)
8/13/2019 Camtek Dec13 Presentation
http://slidepdf.com/reader/full/camtek-dec13-presentation 5/225
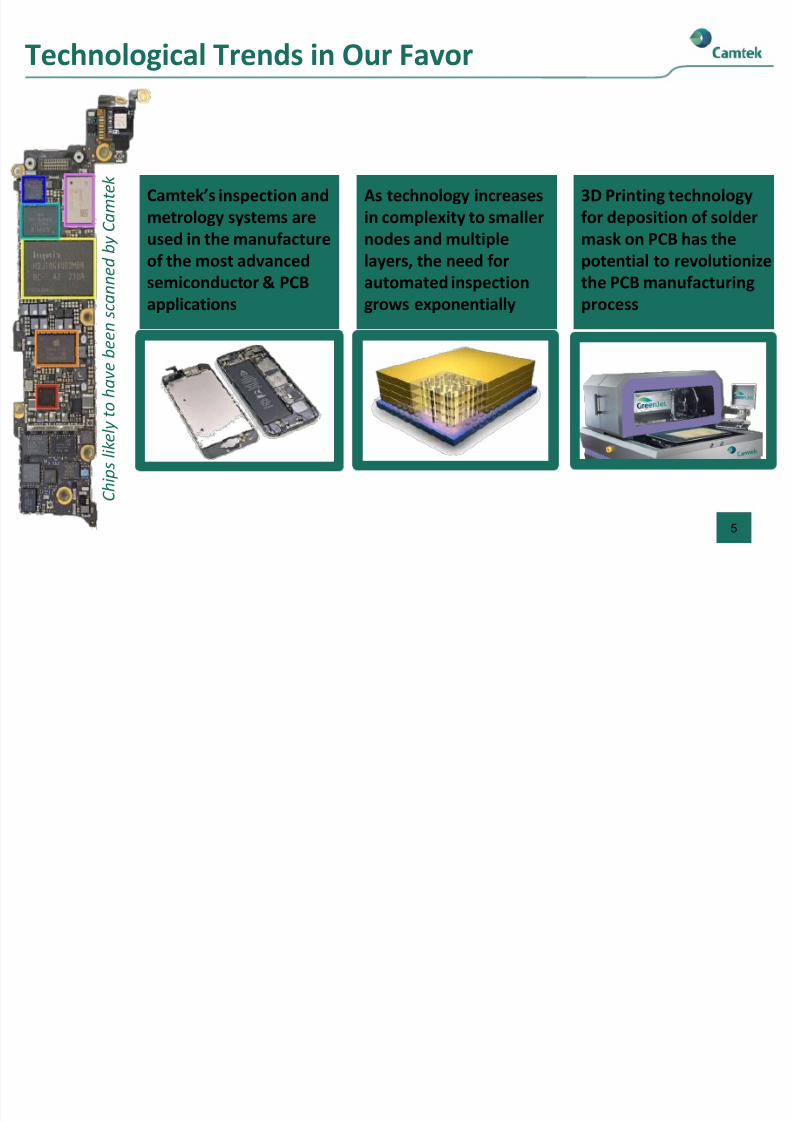
Technological Trends in Our Favor
Camtek’s inspection and
metrology systems are
used in the manufacture
of the most advanced
semiconductor & PCBapplications
C h i p s l i k e l y t
o h a v e b e e n s c a n n e d b y C a m t e k
As technology increases
in complexity to smaller
nodes and multiple
layers, the need for
automated inspectiongrows exponentially
3D Printing technology
for deposition of solder
mask on PCB has the
potential to revolutionize
the PCB manufacturingprocess
8/13/2019 Camtek Dec13 Presentation
http://slidepdf.com/reader/full/camtek-dec13-presentation 6/22
Legacy Inspection Product Lines
6
8/13/2019 Camtek Dec13 Presentation
http://slidepdf.com/reader/full/camtek-dec13-presentation 7/22
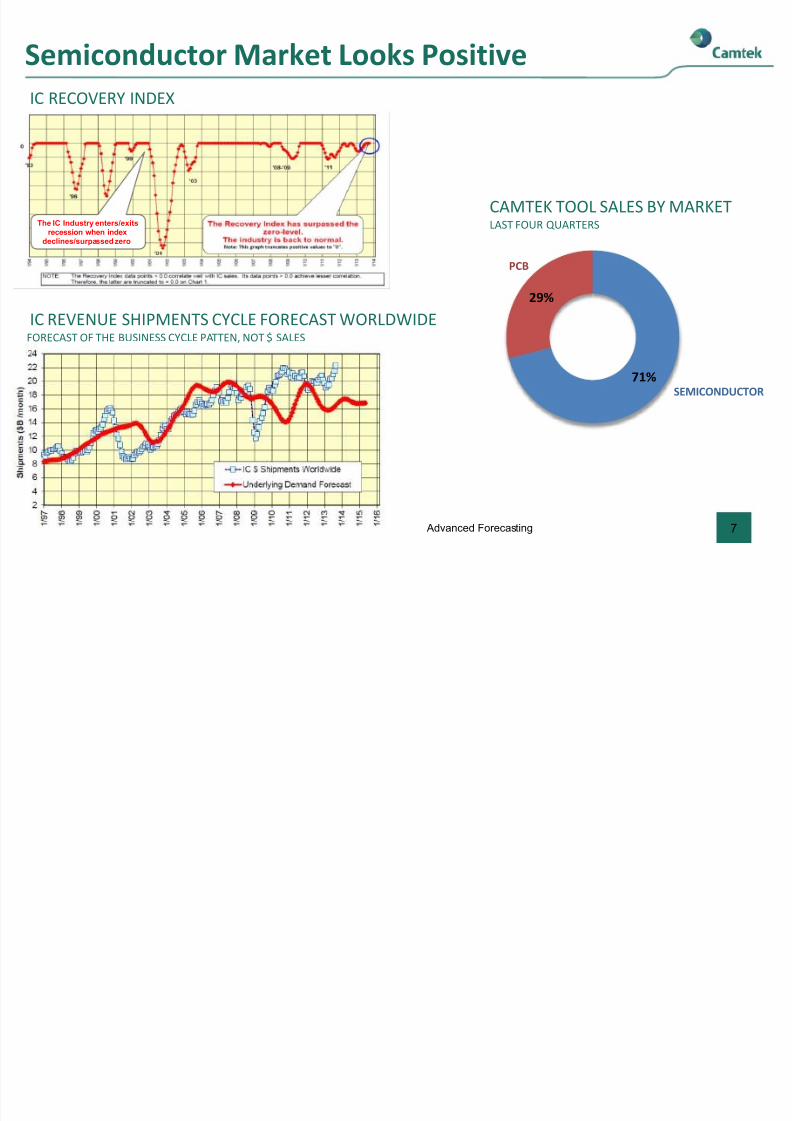
Semiconductor Market Looks Positive
7
IC RECOVERY INDEX
IC REVENUE SHIPMENTS CYCLE FORECAST WORLDWIDEFORECAST OF THE BUSINESS CYCLE PATTEN, NOT $ SALES
71%
29%
CAMTEK TOOL SALES BY MARKETLAST FOUR QUARTERSThe IC Industry enters/exits
recession when indexdeclines/surpassed zero
SEMICONDUCTOR
PCB
Advanced Forecasting
8/13/2019 Camtek Dec13 Presentation
http://slidepdf.com/reader/full/camtek-dec13-presentation 8/22
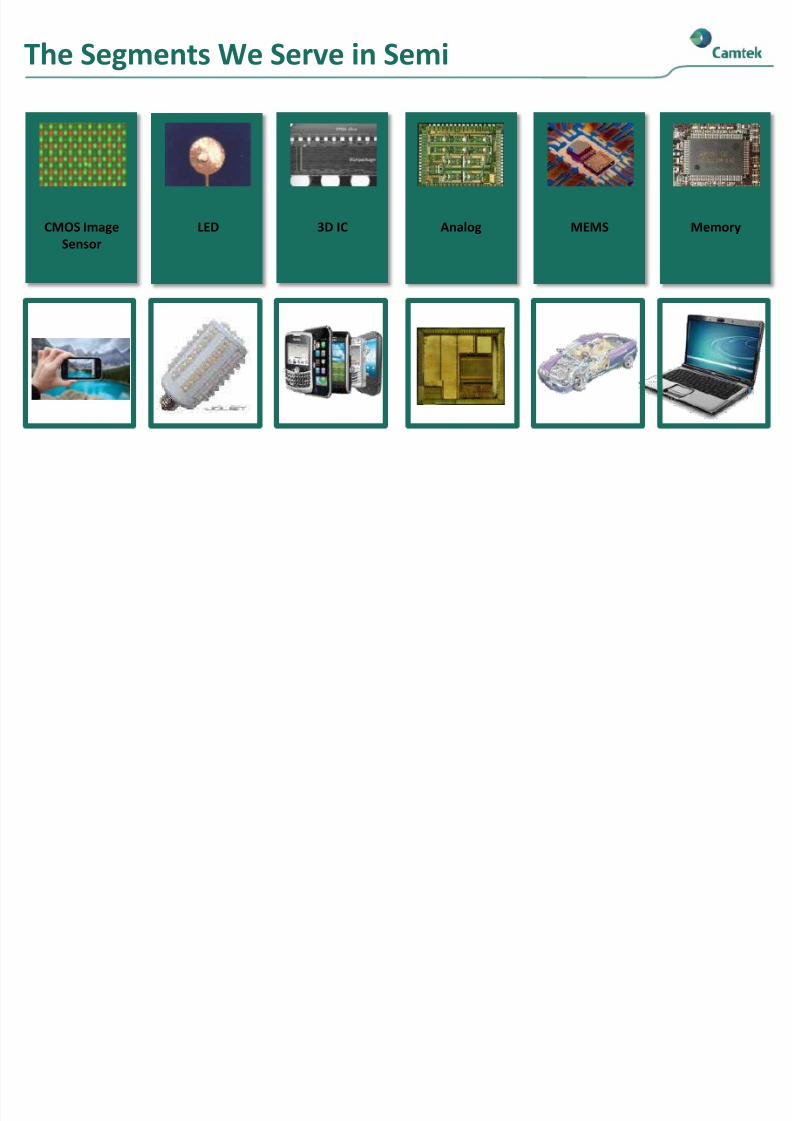
The Segments We Serve in Semi
CMOS Image
Sensor
LED 3D IC Analog MEMS Memory
8/13/2019 Camtek Dec13 Presentation
http://slidepdf.com/reader/full/camtek-dec13-presentation 9/22
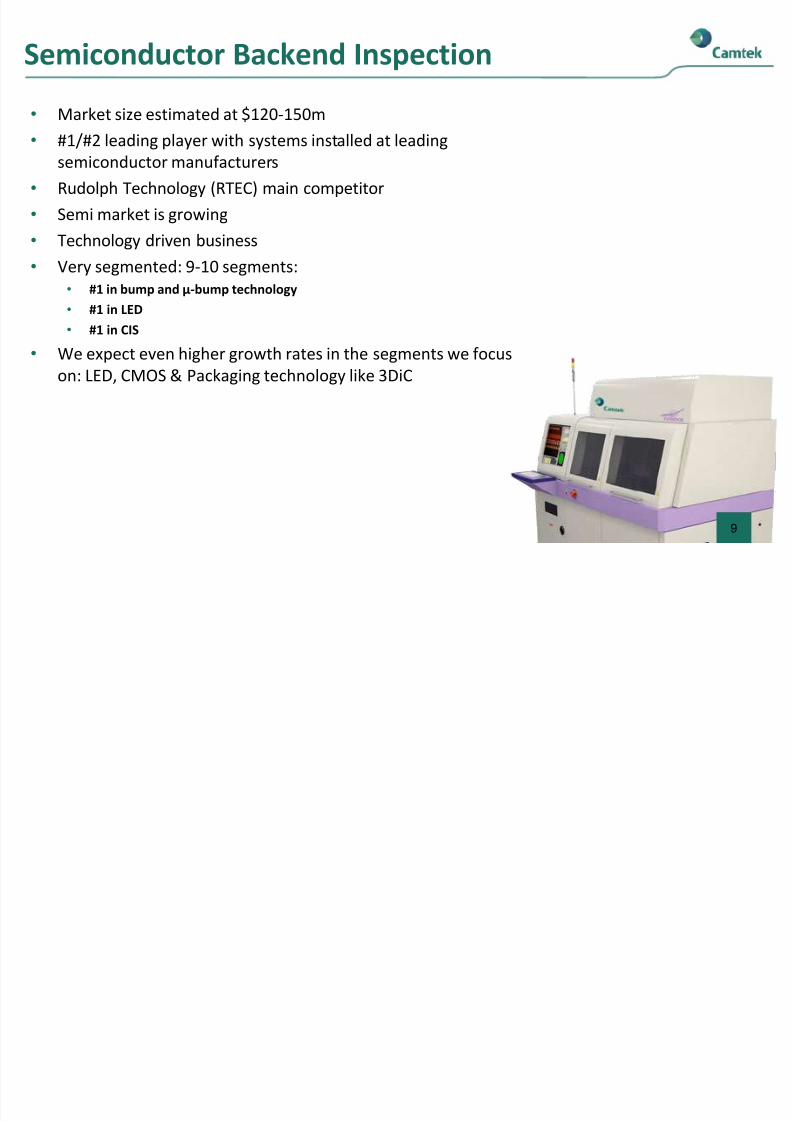
Semiconductor Backend Inspection
• Market size estimated at $120-150m
• #1/#2 leading player with systems installed at leadingsemiconductor manufacturers
• Rudolph Technology (RTEC) main competitor
• Semi market is growing
• Technology driven business
• Very segmented: 9-10 segments:
• #1 in bump and µ-bump technology
• #1 in LED
• #1 in CIS
• We expect even higher growth rates in the segments we focus
on: LED, CMOS & Packaging technology like 3DiC
9
8/13/2019 Camtek Dec13 Presentation
http://slidepdf.com/reader/full/camtek-dec13-presentation 10/22
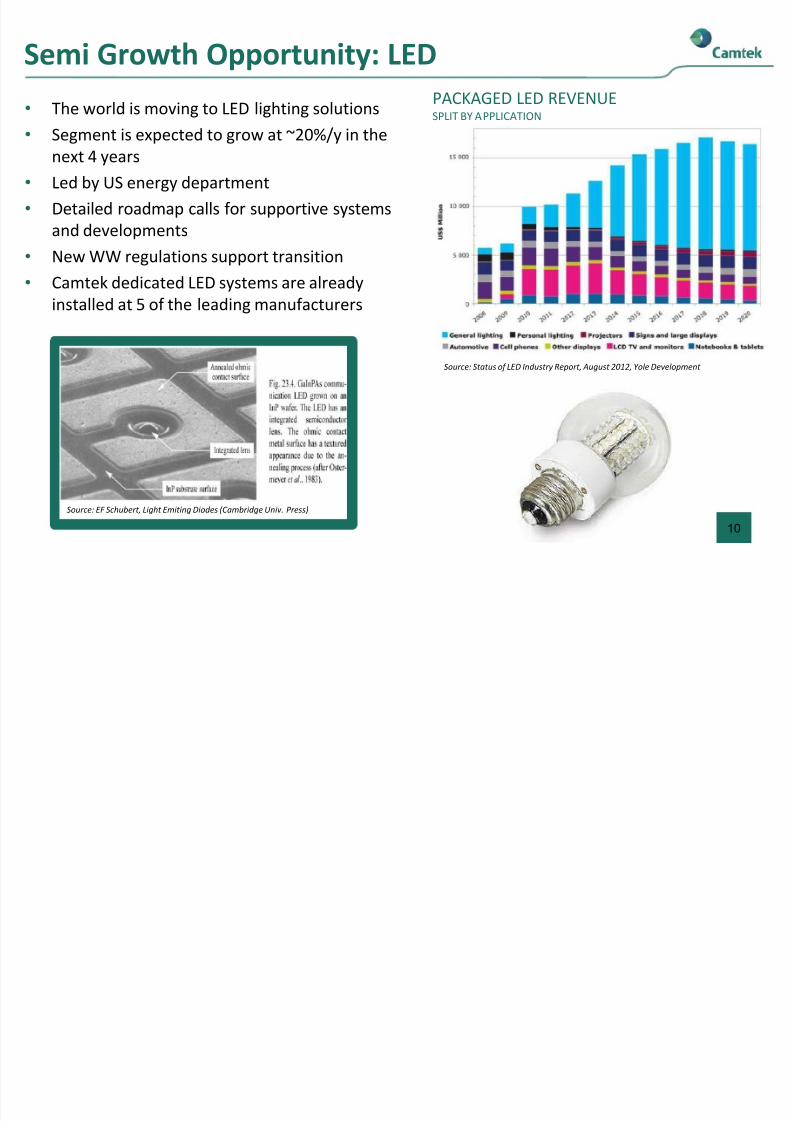
Semi Growth Opportunity: LED
• The world is moving to LED lighting solutions
•Segment is expected to grow at ~20%/y in thenext 4 years
• Led by US energy department
• Detailed roadmap calls for supportive systems
and developments
• New WW regulations support transition
• Camtek dedicated LED systems are alreadyinstalled at 5 of the leading manufacturers
PACKAGED LED REVENUESPLIT BY APPLICATION
Source: Status of LED Industry Report, August 2012, Yole Development
10
Source: EF Schubert, Light Emiting Diodes (Cambridge Univ. Press)
8/13/2019 Camtek Dec13 Presentation
http://slidepdf.com/reader/full/camtek-dec13-presentation 11/22
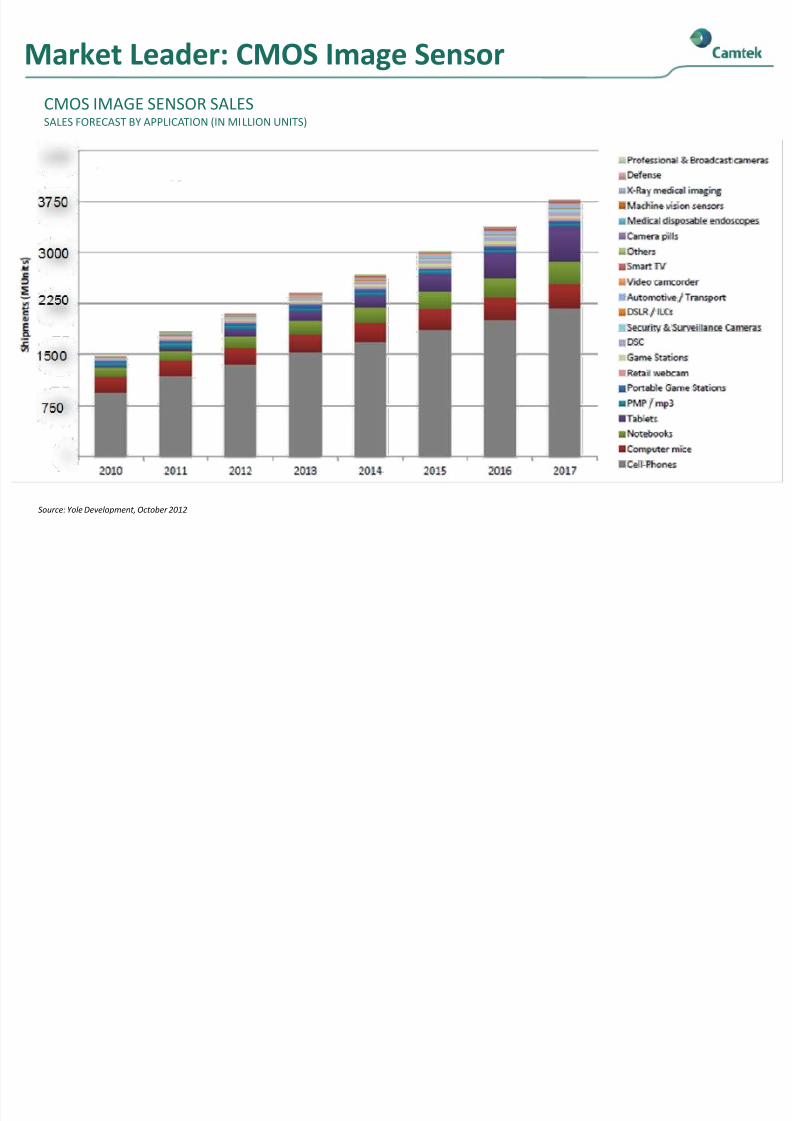
Market Leader: CMOS Image Sensor
CMOS IMAGE SENSOR SALESSALES FORECAST BY APPLICATION (IN MILLION UNITS)
Source: Yole Development, October 2012
8/13/2019 Camtek Dec13 Presentation
http://slidepdf.com/reader/full/camtek-dec13-presentation 12/22
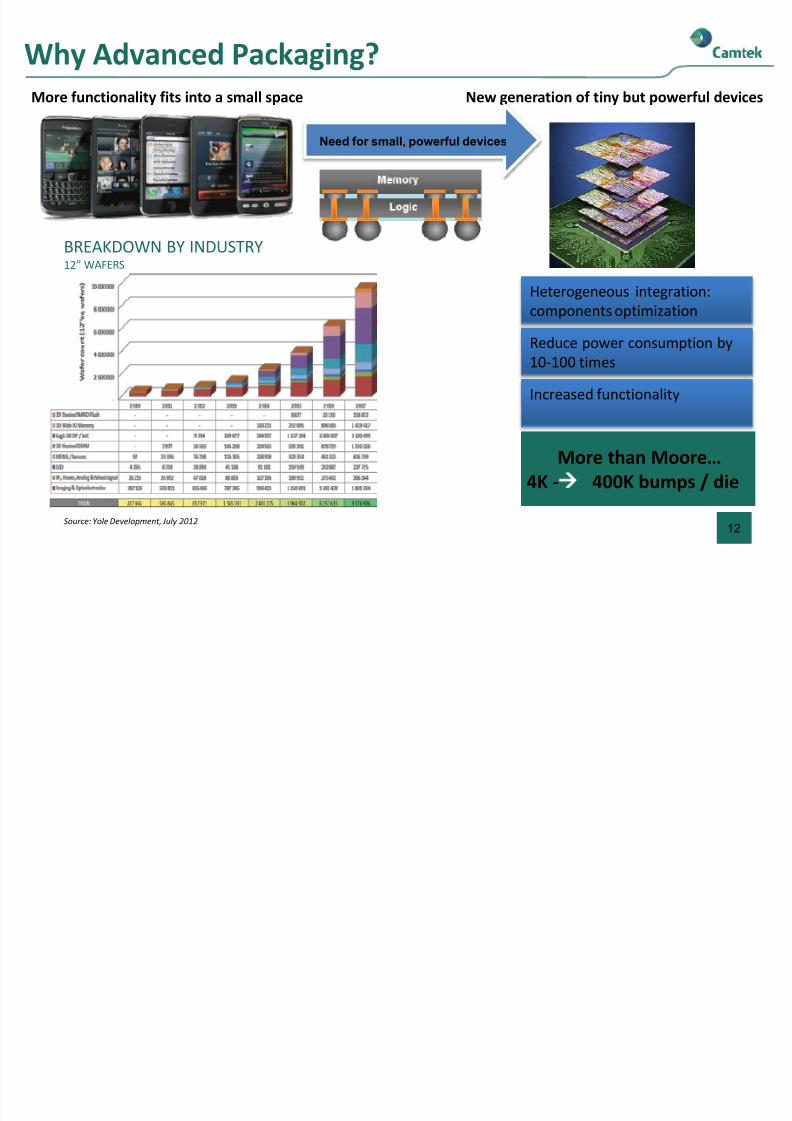
More functionality fits into a small space New generation of tiny but powerful devices
Why Advanced Packaging?
12
Need for small, powerful devices
Heterogeneous integration:
components optimization
Reduce power consumption by
10-100 times
Increased functionality
BREAKDOWN BY INDUSTRY12” WAFERS
Source: Yole Development, July 2012
More than Moore…
4K - 400K bumps / die
8/13/2019 Camtek Dec13 Presentation
http://slidepdf.com/reader/full/camtek-dec13-presentation 13/22
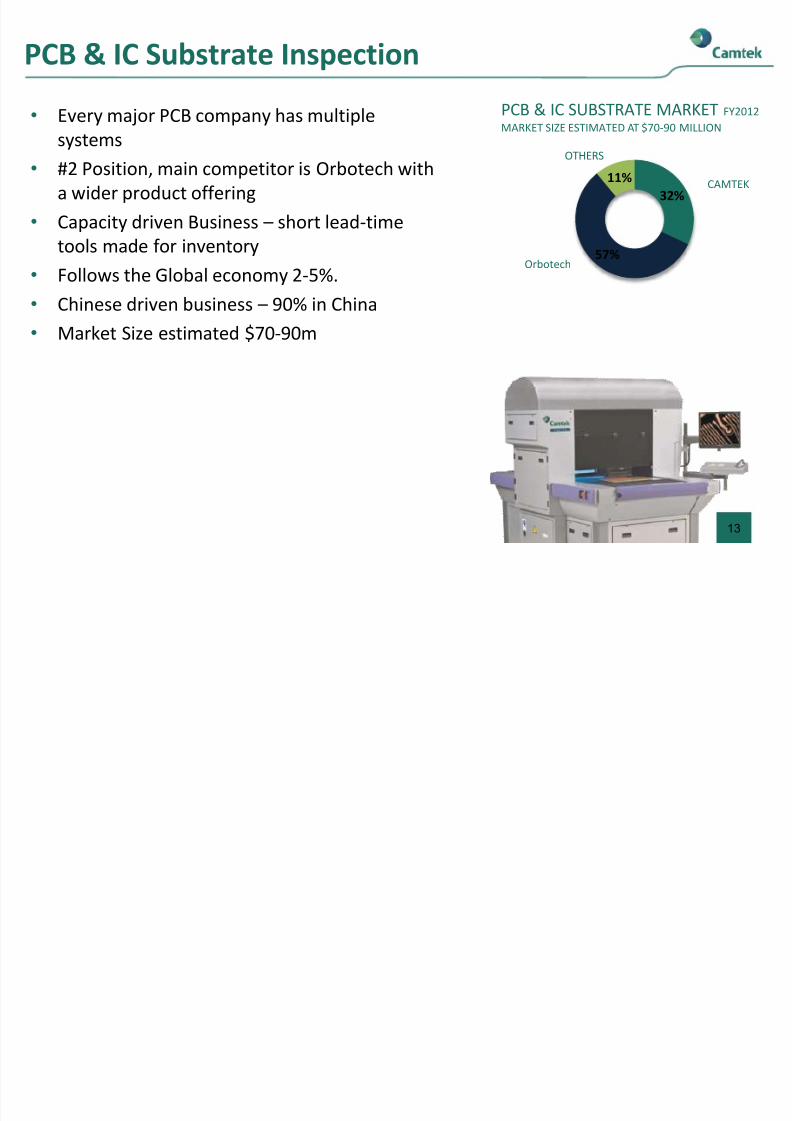
PCB & IC Substrate Inspection
• Every major PCB company has multiple
systems• #2 Position, main competitor is Orbotech with
a wider product offering
• Capacity driven Business – short lead-time
tools made for inventory
• Follows the Global economy 2-5%.• Chinese driven business – 90% in China
• Market Size estimated $70-90m
32%
57%
11%
OTHERS
CAMTEK
Orbotech
PCB & IC SUBSTRATE MARKET FY2012
MARKET SIZE ESTIMATED AT $70-90 MILLION
13
8/13/2019 Camtek Dec13 Presentation
http://slidepdf.com/reader/full/camtek-dec13-presentation 14/22
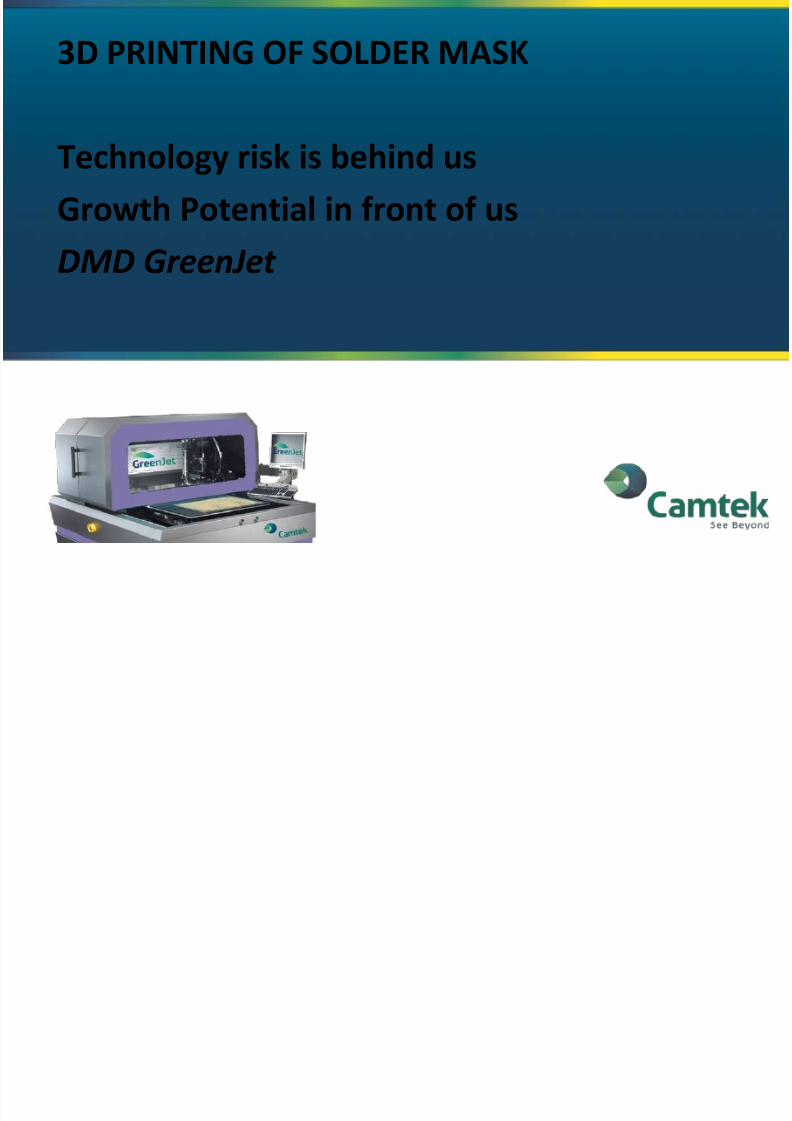
3D PRINTING OF SOLDER MASK
Technology risk is behind us
Growth Potential in front of us
DMD GreenJet
8/13/2019 Camtek Dec13 Presentation
http://slidepdf.com/reader/full/camtek-dec13-presentation 15/22
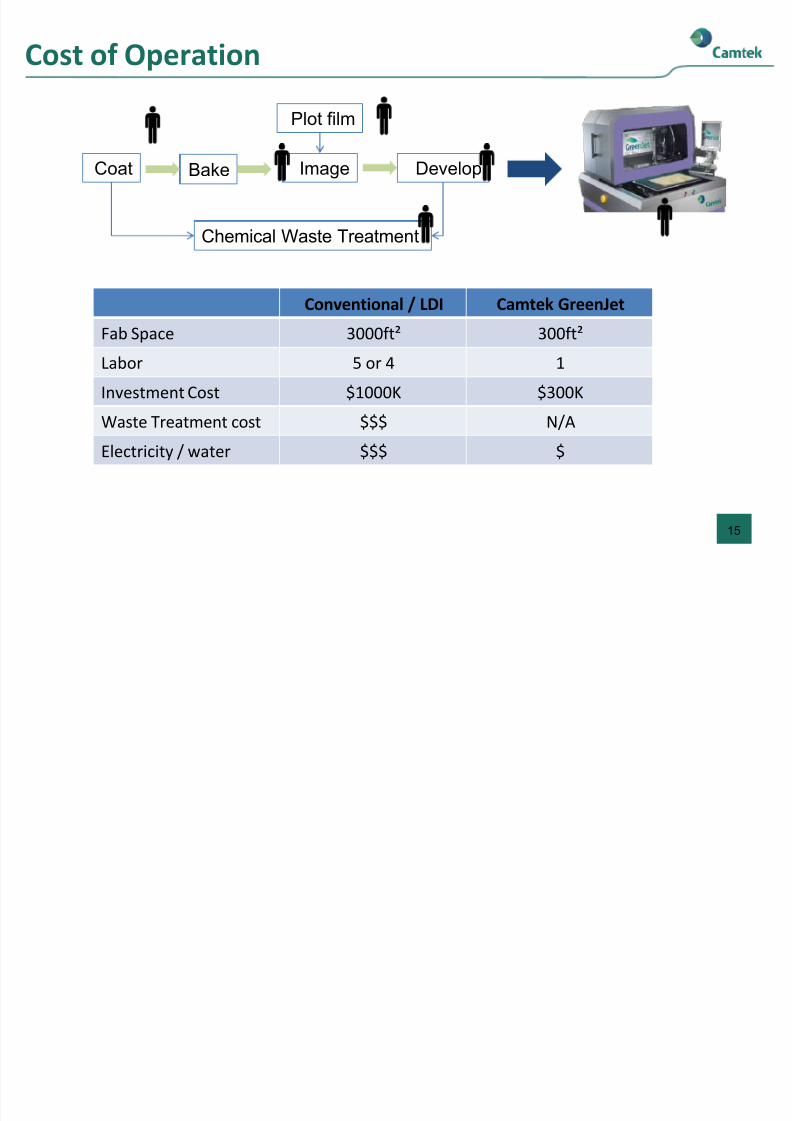
Cost of Operation
15
Coat Image DevelopBake
Plot film
Chemical Waste Treatment
Camtek GreenJetConventional / LDI
300ft² 3000ft² Fab Space
1 5 or 4 Labor
$300K $1000K Investment Cost
N/A $$$ Waste Treatment cost
$ $$$ Electricity / water
8/13/2019 Camtek Dec13 Presentation
http://slidepdf.com/reader/full/camtek-dec13-presentation 16/22
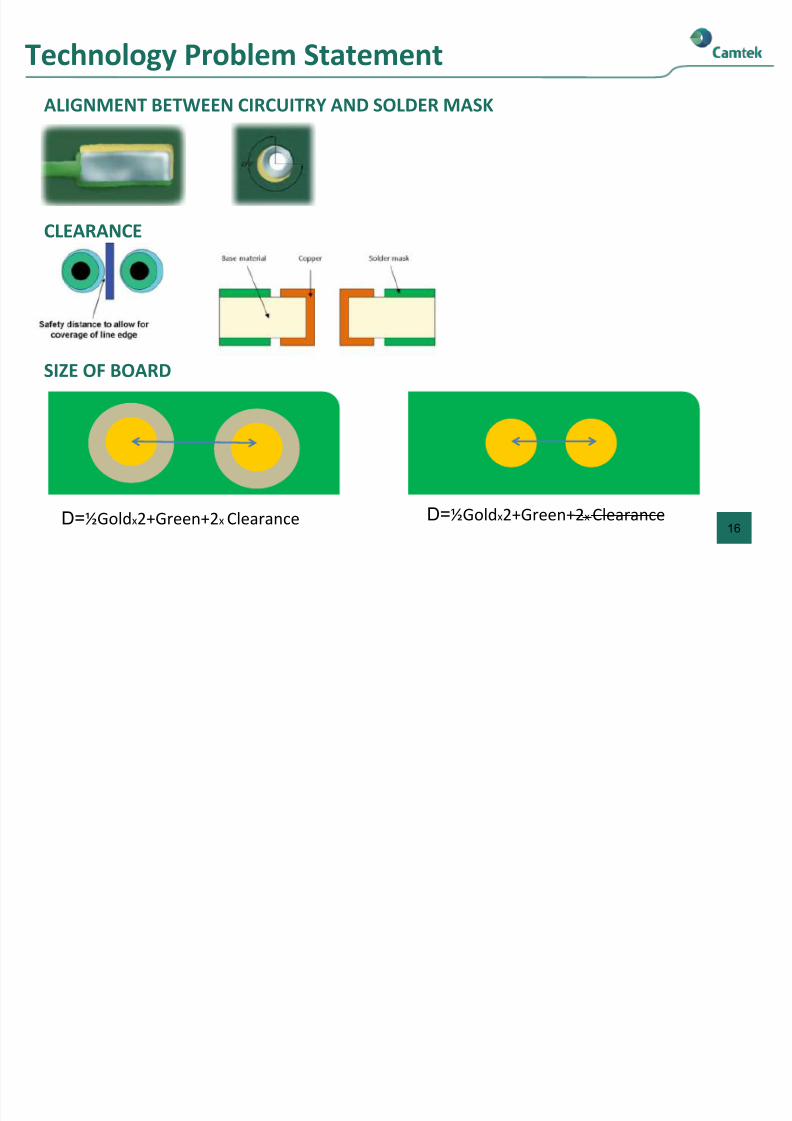
Technology Problem Statement
16 D=½Goldx2+Green+2x Clearance D=½Goldx2+Green+2x Clearance
ALIGNMENT BETWEEN CIRCUITRY AND SOLDER MASK
CLEARANCE
SIZE OF BOARD
8/13/2019 Camtek Dec13 Presentation
http://slidepdf.com/reader/full/camtek-dec13-presentation 17/22
3D Solder Mask Functional Printing
Total Available Market *
• Ink $500-600M
• Systems $100-150M ( current spending on Analog Technology)
Where are we
• Following delays, we overcame development and system related issues
• Stable working window of ink, heads and the application
• Current tasks are engineering in mature.
First beta testing will start in 6-7 weeks
• We control the technology
• We have Global qualification
• Started initial samples for customers.
Operational preparation for product launch
17
* Camtek estimates
8/13/2019 Camtek Dec13 Presentation
http://slidepdf.com/reader/full/camtek-dec13-presentation 18/22
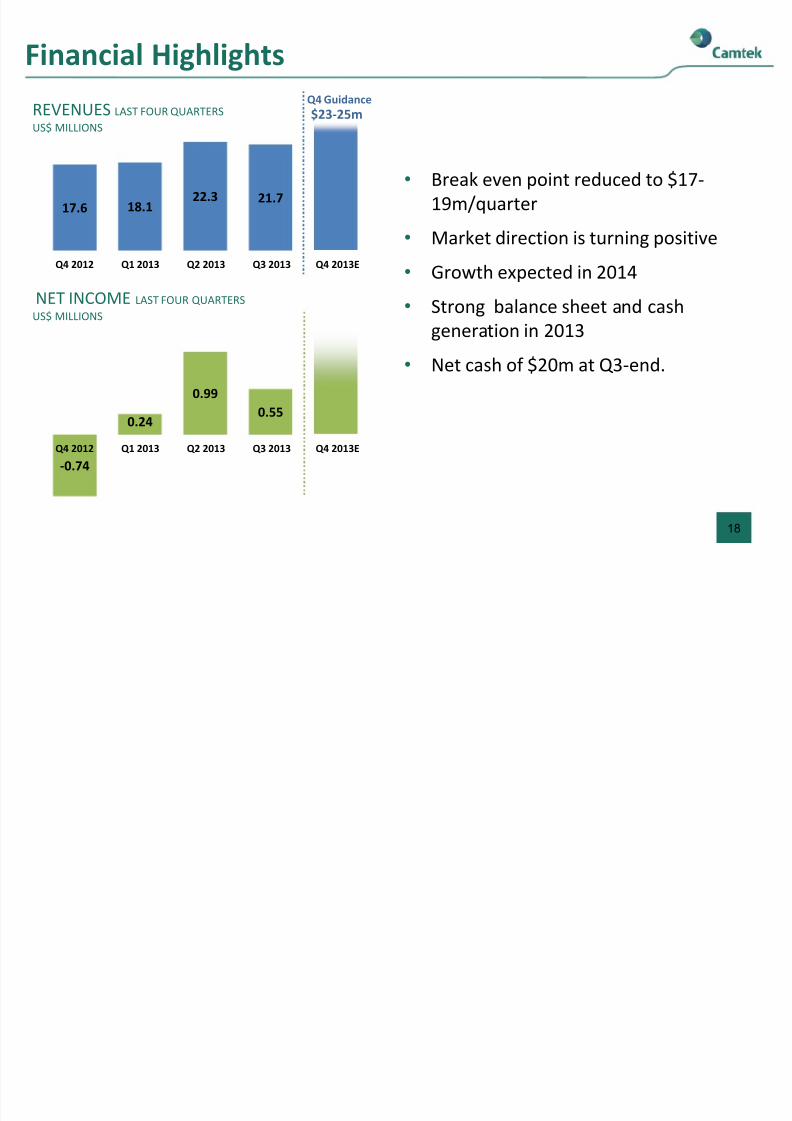
17.6 18.122.3 21.7
Q4 2012 Q1 2013 Q2 2013 Q3 2013 Q4 2013E
Financial Highlights
18
REVENUES LAST FOUR QUARTERS
US$ MILLIONS
Q4 Guidance
$23-25m
NET INCOME LAST FOUR QUARTERS
US$ MILLIONS
• Break even point reduced to $17-
19m/quarter
• Market direction is turning positive
•Growth expected in 2014
• Strong balance sheet and cash
generation in 2013
• Net cash of $20m at Q3-end.
-0.74
0.24
0.99
0.55
Q4 2012 Q1 2013 Q2 2013 Q3 2013 Q4 2013E
8/13/2019 Camtek Dec13 Presentation
http://slidepdf.com/reader/full/camtek-dec13-presentation 19/22
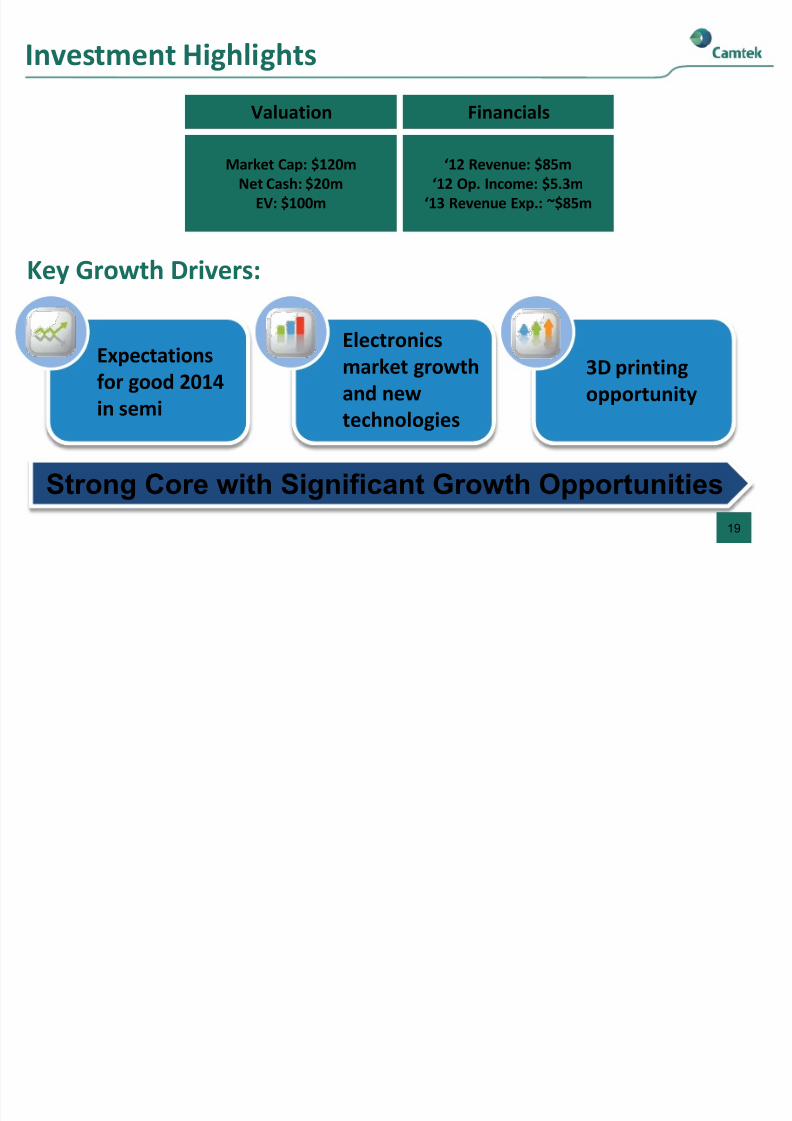
Strong Core with Significant Growth Opportunities
19
Investment Highlights
Expectations
for good 2014
in semi
Electronics
market growth
and new
technologies
3D printing
opportunity
Key Growth Drivers:
Market Cap: $120m
Net Cash: $20m
EV: $100m
Valuation Financials
‘12 Revenue: $85m
‘12 Op. Income: $5.3m
‘13 Revenue Exp.: ~$85m
8/13/2019 Camtek Dec13 Presentation
http://slidepdf.com/reader/full/camtek-dec13-presentation 20/22
Thank You
8/13/2019 Camtek Dec13 Presentation
http://slidepdf.com/reader/full/camtek-dec13-presentation 21/22
Appendix A: GAAP Results

8/13/2019 Camtek Dec13 Presentation
http://slidepdf.com/reader/full/camtek-dec13-presentation 22/22
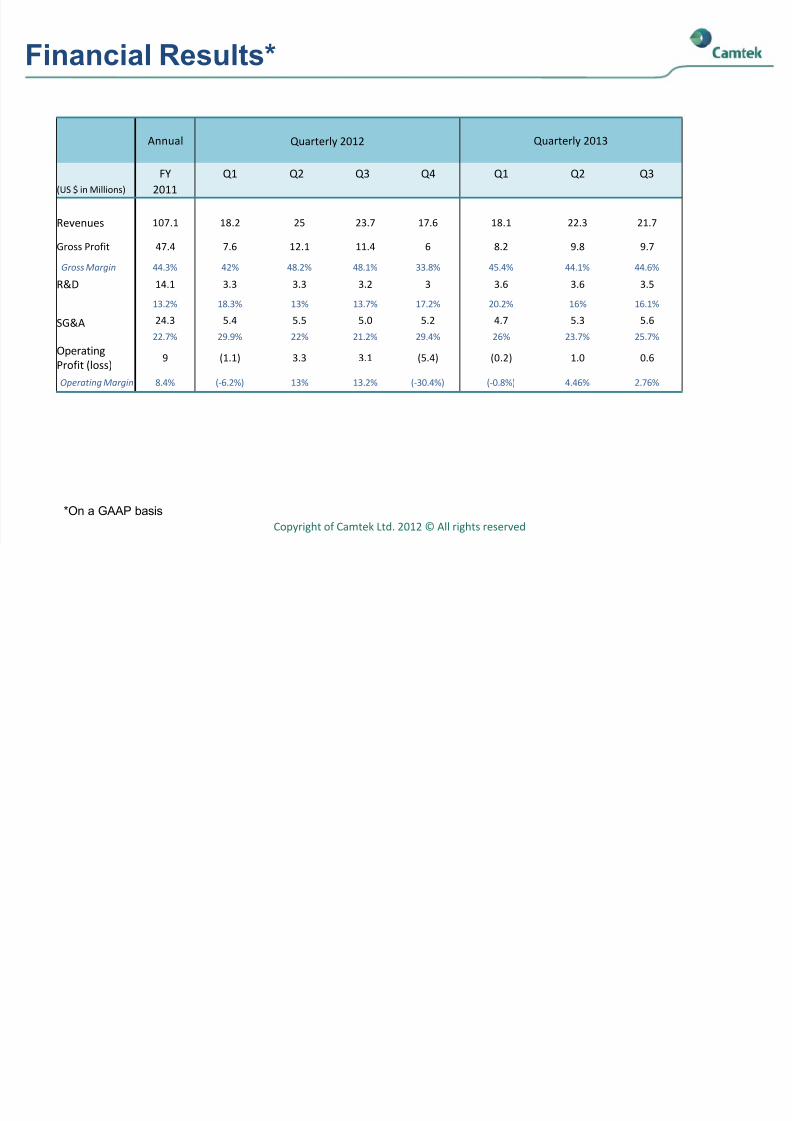
Financial Results*
Copyright of Camtek Ltd. 2012 © All rights reserved
*On a GAAP basis
Annual Quarterly 2012 Quarterly 2013
FY Q1 Q2 Q3 Q4 Q1 Q2 Q3
(US $ in Millions) 2011
Revenues 107.1 18.2 25 23.7 17.6 18.1 22.3 21.7
Gross Profit 47.4 7.6 12.1 11.4 6 8.2 9.8 9.7
Gross Margin 44.3% 42% 48.2% 48.1% 33.8% 45.4% 44.1% 44.6%
R&D 14.1 3.3 3.3 3.2 3 3.6 3.6 3.5
13.2% 18.3% 13% 13.7% 17.2% 20.2% 16% 16.1%
SG&A 24.3 5.4 5.5 5.0 5.2 4.7 5.3 5.6
22.7% 29.9% 22% 21.2% 29.4% 26% 23.7% 25.7%
Operating
Profit (loss)9 (1.1) 3.3 3.1 (5.4) (0.2) 1.0 0.6
Operating Margin 8.4% (-6.2%) 13% 13.2% (-30.4%) (-0.8%) 4.46% 2.76%