CALIOP near-real-time backscatter products compared to ...
13
Atmos. Chem. Phys., 15, 12179–12191, 2015 www.atmos-chem-phys.net/15/12179/2015/ doi:10.5194/acp-15-12179-2015 © Author(s) 2015. CC Attribution 3.0 License. CALIOP near-real-time backscatter products compared to EARLINET data T. Grigas 1 , M. Hervo 1,a , G. Gimmestad 2 , H. Forrister 2,b , P. Schneider 3 , J. Preißler 1 , L. Tarrason 3 , and C. O’Dowd 1 1 School of Physics and Centre for Climate and Air Pollution Studies, Ryan Institute, National University of Ireland Galway, Galway, Ireland 2 Electro-Optical Systems Laboratory, Georgia Tech Research Institute, Georgia Institute of Technology, 225 North Avenue, Atlanta, Georgia 30332, USA 3 NILU – Norwegian Institute for Air Research, P.O. Box 100, 2027 Kjeller, Norway a now at: Federal Office of Meteorology and Climatology, MeteoSwiss, Payerne 1530, Switzerland b now at: School of Earth and Atmospheric Sciences, Georgia Institute of Technology, 225, North Avenue, Atlanta, Georgia 30332, USA Correspondence to: T. Grigas ([email protected]) Received: 17 December 2014 – Published in Atmos. Chem. Phys. Discuss.: 4 March 2015 Revised: 15 October 2015 – Accepted: 20 October 2015 – Published: 3 November 2015 Abstract. The expedited near-real-time Level 1.5 Cloud- Aerosol Lidar with Orthogonal Polarization (CALIOP) ver- sion 3 products were evaluated against data from the ground- based European Aerosol Research Lidar Network (EAR- LINET). The statistical framework and results of the three- year evaluation of 48 CALIOP overpasses with ground tracks within a 100 km distance from operating EARLINET sta- tions are presented and include analysis for the following CALIOP classifications of aerosol type: dust, polluted dust, clean marine, clean continental, polluted continental, mixed and/or smoke/biomass burning. For the complete data set comprising both the planetary boundary layer (PBL) and the free troposphere (FT) data, the correlation coefficient (R) was 0.86. When the analysis was conducted separately for the PBL and FT, the correlation coefficients were R = 0.6 and R = 0.85, respectively. From analysis of selected spe- cific cases, it was initially thought that the presence of FT layers, with high attenuated backscatter, led to poor agree- ment of the PBL backscatter profiles between the CALIOP and EARLINET and prompted a further analysis to filter out such cases; however, removal of these layers did not improve the agreement as R reduced marginally from R = 0.86 to R = 0.84 for the combined PBL and FT analysis, increased marginally from R = 0.6 up to R = 0.65 for the PBL on its own, and decreased marginally from R = 0.85 to R = 0.79 for the FT analysis on its own. This suggests considerable variability, across the data set, in the spatial distribution of the aerosol over spatial scales of 100 km or less around some EARLINET stations rather than influence from elevated FT layers. For specific aerosol types, the correlation coefficient between CALIOP backscatter profiles and the EARLINET data ranged from R = 0.37 for polluted continental aerosol in the PBL to R = 0.57 for dust in the FT. 1 Introduction Aerosols have an impact on the global radiative budget di- rectly via scattering and absorbing incoming and reflected solar radiation, and indirectly via the modification of cloud microphysical properties that lead to changes in cloud ra- diative properties along with cloud lifetimes (Haywood et al., 2003; Yu et al., 2006). Lidar is a very useful technique for characterising the vertical dispersion of aerosol plumes through examination of the backscatter signal and aerosol properties such as shape, from the depolarisation channel, that can elucidate particle composition, in particular, for Sa- haran dust or volcanic ash plumes (Groß et al., 2010; Pa- payannis et al., 2002). Several research programmes in Eu- rope have performed routine long-term observations of the optical properties of different aerosol types (Giannakaki et al., 2009; Mattis et al., 2004, 2008); however, such stud- Published by Copernicus Publications on behalf of the European Geosciences Union.
Transcript of CALIOP near-real-time backscatter products compared to ...

Atmos. Chem. Phys., 15, 12179–12191, 2015
www.atmos-chem-phys.net/15/12179/2015/
doi:10.5194/acp-15-12179-2015
© Author(s) 2015. CC Attribution 3.0 License.
CALIOP near-real-time backscatter products compared to
EARLINET data
T. Grigas1, M. Hervo1,a, G. Gimmestad2, H. Forrister2,b, P. Schneider3, J. Preißler1, L. Tarrason3, and C. O’Dowd1
1School of Physics and Centre for Climate and Air Pollution Studies, Ryan Institute, National University of Ireland Galway,
Galway, Ireland2Electro-Optical Systems Laboratory, Georgia Tech Research Institute, Georgia Institute of Technology, 225 North Avenue,
Atlanta, Georgia 30332, USA3NILU – Norwegian Institute for Air Research, P.O. Box 100, 2027 Kjeller, Norwayanow at: Federal Office of Meteorology and Climatology, MeteoSwiss, Payerne 1530, Switzerlandbnow at: School of Earth and Atmospheric Sciences, Georgia Institute of Technology, 225, North Avenue, Atlanta,
Georgia 30332, USA
Correspondence to: T. Grigas ([email protected])
Received: 17 December 2014 – Published in Atmos. Chem. Phys. Discuss.: 4 March 2015
Revised: 15 October 2015 – Accepted: 20 October 2015 – Published: 3 November 2015
Abstract. The expedited near-real-time Level 1.5 Cloud-
Aerosol Lidar with Orthogonal Polarization (CALIOP) ver-
sion 3 products were evaluated against data from the ground-
based European Aerosol Research Lidar Network (EAR-
LINET). The statistical framework and results of the three-
year evaluation of 48 CALIOP overpasses with ground tracks
within a 100 km distance from operating EARLINET sta-
tions are presented and include analysis for the following
CALIOP classifications of aerosol type: dust, polluted dust,
clean marine, clean continental, polluted continental, mixed
and/or smoke/biomass burning. For the complete data set
comprising both the planetary boundary layer (PBL) and the
free troposphere (FT) data, the correlation coefficient (R)
was 0.86. When the analysis was conducted separately for
the PBL and FT, the correlation coefficients were R = 0.6
and R = 0.85, respectively. From analysis of selected spe-
cific cases, it was initially thought that the presence of FT
layers, with high attenuated backscatter, led to poor agree-
ment of the PBL backscatter profiles between the CALIOP
and EARLINET and prompted a further analysis to filter out
such cases; however, removal of these layers did not improve
the agreement as R reduced marginally from R = 0.86 to
R = 0.84 for the combined PBL and FT analysis, increased
marginally from R = 0.6 up to R = 0.65 for the PBL on its
own, and decreased marginally from R = 0.85 to R = 0.79
for the FT analysis on its own. This suggests considerable
variability, across the data set, in the spatial distribution of
the aerosol over spatial scales of 100 km or less around some
EARLINET stations rather than influence from elevated FT
layers. For specific aerosol types, the correlation coefficient
between CALIOP backscatter profiles and the EARLINET
data ranged from R = 0.37 for polluted continental aerosol
in the PBL to R = 0.57 for dust in the FT.
1 Introduction
Aerosols have an impact on the global radiative budget di-
rectly via scattering and absorbing incoming and reflected
solar radiation, and indirectly via the modification of cloud
microphysical properties that lead to changes in cloud ra-
diative properties along with cloud lifetimes (Haywood et
al., 2003; Yu et al., 2006). Lidar is a very useful technique
for characterising the vertical dispersion of aerosol plumes
through examination of the backscatter signal and aerosol
properties such as shape, from the depolarisation channel,
that can elucidate particle composition, in particular, for Sa-
haran dust or volcanic ash plumes (Groß et al., 2010; Pa-
payannis et al., 2002). Several research programmes in Eu-
rope have performed routine long-term observations of the
optical properties of different aerosol types (Giannakaki et
al., 2009; Mattis et al., 2004, 2008); however, such stud-
Published by Copernicus Publications on behalf of the European Geosciences Union.
12180 T. Grigas et al.: CALIOP near-real-time backscatter products compared to EARLINET data
ies were typically limited to single geographical locations.
In order to study aerosol transport on a larger spatial scale,
lidar networks are deployed (Bösenberg et al., 2003; Pap-
palardo et al., 2014), in conjunction with space-borne plat-
forms. In 2000, the European Aerosol Research Lidar Net-
work (EARLINET) was established to provide a compre-
hensive statistically representative data set of the aerosol
vertical distribution. At present, 27 European stations con-
tribute to this network by performing the measurements a
few times per week according to the schedule (Pappalardo
et al., 2014). There are other lidar networks, and one of
them is the NASA Micro-Pulse Lidar Network (MPLNET).
Twenty-one permanent stations of this network are deployed
worldwide from the Arctic to the Antarctic regions, which
continuously measure aerosol and cloud vertical structure
day and night (Lolli et al., 2014). Furthermore, there is the
Global Atmosphere Watch (GAW) Aerosol Lidar Observa-
tion Network (GALION), which is based on the cooperation
between existing lidar networks: the Latin America Lidar
Network (ALINE), the Asian Dust and Aerosol Lidar Obser-
vation Network (AD-Net), the Commonwealth of Indepen-
dent States (CIS) Lidar Network (CIS-LINET), the Canadian
Operational Research Aerosol lidar Network (CORALNet),
EARLINET, the Network for the Detection of Atmospheric
Composition Change (NDACC), the Regional East Atmo-
spheric Lidar Mesonet (REALM/CREST), and MPLNET.
Global coverage may be achieved by using satellite-based li-
dar systems; striving towards such an aim, the National Aero-
nautics and Space Administration (NASA), in collaboration
with the French space agency Centre National d’Etudes Spa-
tiales (CNES), developed a satellite-based lidar system called
CALIOP (Cloud-Aerosol Lidar with Orthogonal Polariza-
tion), which is on board the CALIPSO satellite platform
(Omar et al., 2009; Vaughan et al., 2011). CALIOP per-
forms measurements simultaneously at wavelengths of 532
and 1064 nm. The CALIPSO satellite was launched into orbit
in April 2006 and is part of the A-Train constellation of sci-
entific satellites dedicated to observations of the atmosphere
(Stephens et al., 2002). It follows a sun-synchronous polar
orbit of 705 km altitude and has a 16-day repeat cycle.
The EARLINET community has performed several com-
parisons with CALIOP data since its launch in April 2006
(Mattis et al., 2007; Pappalardo et al., 2010) using CALIOP
overpasses with ground tracks within 100 km from EAR-
LINET stations. Several studies inter-comparing CALIOP
Level 1 and Level 2 data with the ground-based measure-
ments have been performed in recent years (Mamouri et al.,
2009; Molero and Pujadas, 2008; Pappalardo et al., 2009,
2010). Pappalardo et al. (2010) found good agreement be-
tween the 532 nm CALIOP Level 1 attenuated backscatter
and EARLINET measurements with a relative mean dif-
ference of 4.6 % and a relative standard deviation (SD) of
50 %. The attenuated backscatter was used only from those
EARLINET stations that provided independent extinction
measurements. That allowed (a) calculating the lidar ratio
and (b) converting EARLINET backscatter into attenuated
backscatter as seen from space at 532 nm without any as-
sumptions. The correlation coefficient as a function of the
CALIOP ground track offset distances was assessed as well.
The correlation coefficient R = 0.9 was found for distances
smaller than 100 km, while it decreased rapidly with larger
distances. The mean bias between the CALIOP Level 1 and
EARLINET Athens station’s measurements as assessed by
Mamouri et al. (2009) for daytime measurements was 22 %,
and for night-time measurements it was 8 %. In this study,
the measurements were averaged approximately for 2 hours
and were centred on the CALIOP overpass time. Mona et
al. (2009) found a mean difference of (−2± 12) % between
data from the EARLINET station in Potenza and CALIOP
Level 1 measurements within the 3–8 km altitude range,
while the mean difference of the measurements within the
planetary boundary layer (PBL) was equal to (−24± 20) %.
The influence of the presence of cirrus clouds on the mea-
surements was assessed in a study by Mamouri et al. (2009).
The mean biases without cirrus clouds were −26± 22 % for
5 km horizontal resolution and−14± 15 % for 20 km; the bi-
ases were higher in cirrus cases, with−104± 129 % for 5 km
horizontal resolution and −85± 93 % for 20 km.
Assimilation of the CALIOP Level 1 data product into at-
mospheric models has been carried out successfully in the
past using an ensemble Kalman filter (Sekiyama et al., 2010).
However, processed CALIOP Level 1 and Level 2 data prod-
ucts are generally only available several days after acquisi-
tion at the earliest, thus severely limiting their use for oper-
ational data assimilation. An expedited CALIOP Level 1.5
near-real-time (NRT) product, usually provided between 6
and 30 h after downlink, has been made available by NASA
for purposes of operational forecasting since November 2010
(Vaughan et al., 2011). Level 1.5 is derived by cloud-clearing
Level 1 attenuated backscatter profiles using the Level 2 ver-
tical feature masks, and then spatially averaging the cloud-
cleared profiles. Level 1.5 expedited products use a simpli-
fied calibration scheme compared to Level 1 and Level 2.
Also, it is derived by using the Global Modelling and Assim-
ilation Office (GMAO) molecular model number densities,
which can be out of date (sometimes by as much as 2 days).
As a result, the scientific quality of the expedited data com-
pared to the standard CALIOP products can be degraded. In
Level 1.5 data set, the free troposphere (FT) is limited by
20 km.
The European Centre for Medium-Range Weather Fore-
casts (ECMWF) is currently evaluating the potential use of
an expedited CALIOP Level 1.5 data product (the total at-
tenuated backscatter profile) for assimilation into their global
forecasting model IFS-MOZART (Integrated Forecast Sys-
tem coupled to the Model for Ozone And Related chemical
Tracers; A. Benedetti, ECMWF, personal communication,
2014) under the Monitoring Atmospheric Composition and
Climate (MACC) project. A similar idea of using ground-
based lidar measurements in the model assimilation was im-
Atmos. Chem. Phys., 15, 12179–12191, 2015 www.atmos-chem-phys.net/15/12179/2015/

T. Grigas et al.: CALIOP near-real-time backscatter products compared to EARLINET data 12181
plemented in a study by Wang et al. (2013). They found that
the root mean square error (RMSE) of PM10 concentrations
declined by 54 % when the lidar measurements were used in
the assimilation. This indicates the importance of evaluating
the CALIOP Level 1.5 data by inter-comparing them with
ground-based measurements. The inter-comparison of the
532 nm wavelength attenuated backscatter profiles between
CALIOP and EARLINET reported here was performed for
coincident daytime and night-time measurements.
2 Data and methodology
The CALIOP instrument directly measures the vertical pro-
file of the total (molecular plus aerosol) attenuated backscat-
ter as seen from above the atmosphere, with a spatial reso-
lution of 30 m vertically and 333 m horizontally (Winker et
al., 2009). These Level 0 raw data are averaged both horizon-
tally and vertically before they are downlinked to the NASA
Langley Research Centre (LaRC), where the scientific data
products of the various levels are produced (Level 1, Level
1.5, Level 2 and Level 3). The vertical resolution for this
Level 0 varies from 30 m (−0.5 to 8.2 km) up to 300 m (30.1
to 40 km), while the horizontal resolution varies from 333 m
(−0.5 to 8.2 km) up to 5 km (30.1 to 40 km) (Powell et al.,
2010).
CALIOP has an automatic aerosol classification algorithm
that uses altitude, location, surface type, volume depolari-
sation ratio δv and integrated attenuated backscatter γ ′ at
532 nm to determine the aerosol type (Burton et al., 2013;
Omar et al., 2009). The algorithm detects six main aerosol
types: clean marine, polluted dust, dust, polluted continental,
clean continental and smoke/burning biomass. Such aerosol
type detection is implemented in the Level 2 aerosol sub-
typing algorithm. The Level 1.5 product does report feature
types having the designation “clear air” and “mixed aerosol”.
The first type is used to describe range bins absent of detected
features, while the second type is used if the 20 km horizontal
averages contain more than one of the six CALIOP aerosol
types. The Level 2 vertical feature mask provides informa-
tion on cloud and aerosol layers as well as the type of aerosol
in each identified layer.
The Level 1.5 product is derived by spatially averaging
60 individual Level 1 lidar profiles and merging them with
the Level 2 vertical feature mask product. It has a spatial
resolution of 20 km horizontally and 60 m vertically, and it
is restricted to the altitude range −0.5 to 20 km (Powell
et al., 2010). The main Level 1.5 parameters used in this
work are latitude, longitude, profile UTC time, mean total
attenuated backscatter profile at 532 nm, SD of the total at-
tenuated backscatter for 532 nm, total attenuated backscat-
ter uncertainty for 532 nm (CALIPSO Quality Statements,
2011, p. 02), L2 feature type, and lidar ratio, along with the
Rayleigh extinction and backscatter cross sections for the
molecular atmosphere at 532 nm.
The CALIOP uncertainties of the attenuated backscatter
(CALIPSO Quality Statements, 2011) are calculated using
the equation
σµ =1
N
√√√√ N∑i=1
σ 2i , (1)
where σi is the attenuated backscatter uncertainty at the range
bin µ and N is the number of Level 1 profile range bins.
EARLINET was chosen as the reference network for this
inter-comparison. At present, this network is one of the most
sophisticated lidar networks in the world. The ground-based
lidar measurements used in this study were acquired from
the EARLINET portal (www.EARLINET.org) for the pe-
riod from November 2010 to December 2012 as well as
for several days in April and May 2010 during the Eyjaf-
jallajökull volcano eruption. The aerosol backscatter coeffi-
cient profiles with uncertainties were provided in each of the
EARLINET files. The EARLINET profiles were averaged
over the time interval which varied between 30 min and 2 h.
CALIOP-EARLINET inter-comparisons were only consid-
ered for coincident overpasses, defined as having a CALIOP
ground track within a 100 km distance from the EARLINET
station. The backscatter coefficients provided by EARLINET
were converted into total attenuated backscatter values using
the method described below.
The CALIOP instrument directly measures profiles of the
total attenuated backscatter as seen from space, and NASA
provides them in the Level 1.5 data set. These profiles were
chosen for the inter-comparison in order to assess CALIOP
measurements. The EARLINET stations produce aerosol
backscatter coefficients, and so the two different backscat-
ter coefficients cannot be inter-compared directly. For this
reason, a method similar to that of Mona et al. (2009) was
adopted for converting the EARLINET particulate backscat-
ter coefficients into total attenuated backscatter values as ob-
served from space, thus allowing for a valid inter-comparison
of CALIOP and EARLINET measurements. The follow-
ing equations were used to calculate EARLINET attenuated
backscatter. The total attenuated backscatter βatt(z) at alti-
tude z is given by
βatt(z)= T2(z)βtot(z), (2)
where T 2(z) is the two-way transmittance from the lidar in
space down to the altitude z, and βtot is the total backscatter
coefficient, defined as
βtot(z)= βpar(z)+βmol(z), (3)
where βpar is the particulate (aerosol) backscatter coefficient
and βmol is the molecular backscatter coefficient.
In order to calculate the total backscatter coefficient βtot,
the EARLINET particulate backscatter coefficient is used as
βpar in Eq. (3) and the molecular backscatter coefficient βmol
www.atmos-chem-phys.net/15/12179/2015/ Atmos. Chem. Phys., 15, 12179–12191, 2015
12182 T. Grigas et al.: CALIOP near-real-time backscatter products compared to EARLINET data
is calculated from the atmospheric temperature and pressure
profiles (Sissenwine et al., 1962). The molecular backscatter
and extinction cross sections for air appropriate for CALIOP
are given in NASA documentation by Powell et al. (2010)
as 5.167×10⁻³¹ m2 and 5.930×10⁻³² m2 sr−1, respectively.
Using the methods of Bucholtz et al. (1995), the molec-
ular number density Ns in standard air (defined at refer-
ence atmospheric pressure Ps = 1013.25 mbar and temper-
ature Ts = 15 ◦C) is 2.54743× 1025 mol m−3, so (assuming
that the atmospheric equation of state is accurately repre-
sented by the ideal gas law) the molecular backscattering co-
efficient at any altitude h is given by
βmol(h)= σbackNs
P(h)Ts
PsT (h), (4)
where σback is the backscatter cross section given above, and
P(h) and T (h) are the pressure and the temperature of stan-
dard atmosphere, respectively. The two-way transmittance
for a downward-looking lidar is calculated using the follow-
ing equation:
T 2(z)= exp
−2
z∫top
α(z′)dz′
, (5)
where top is the highest altitude of the profile (nominally
20 km) and α(z) is the total extinction coefficient, which is
the sum of the particle extinction coefficient αpar and the
molecular extinction coefficient αmol.
The particle extinction coefficient αpar is calculated ac-
cording to
αpar = Saβpar, (6)
where βpar is the EARLINET particle backscatter coefficient
and Sa is the particulate extinction-to-backscatter ratio (com-
monly known as the lidar ratio). The lidar ratios Sa have been
extracted from the data set of the aerosol types identified in
the CALIOP Level 1.5. The reason why these values have
not been taken directly from the EARLINET data set is that
only a limited number of lidar ratios Sa were available for
the coincident measurements. In fact, this number is signif-
icantly reduced by the fact that a lidar needs to be equipped
with a Raman channel for the independent extinction profile
measurements, and these measurements are normally avail-
able only during night-time because of low signal-to-noise
ratio (SNR) during daytime.
After calculating the terms αmol and αpar, the transmittance
was derived using Eq. (5) and the EARLINET total attenu-
ated backscatter profile was calculated using Eq. (2).
The methodology described in this section uses the
CALIOP-derived information (lidar ratio Sa) for converting
the EARLINET particle backscatter coefficient into total at-
tenuated backscatter, so the EARLINET-derived products are
not independent from CALIPSO ones.
In order to reduce the noise in the CALIOP signal (es-
pecially during daytime), the five profiles of the CALIOP
total attenuated backscatter closest to the EARLINET sta-
tion were averaged and then compared to the total attenuated
backscatter of the EARLINET station. All of our CALIOP
data points therefore correspond to spatial averages 100 km
in length along the ground tracks, centred at the points of
closest approach to the EARLINET stations.
To enable direct comparisons, the altitude scales of the
EARLINET lidar profiles were adjusted to be the same as
those of CALIOP (above mean sea level) at 60 m vertical
spacing. In this way we obtained pairs of values at each alti-
tude, referred to here as “data points”, for each overpass.
In this work, the total attenuated backscatter for CALIOP
(βatt.CAL) and EARLINET (βatt.EARL) is compared. In order
to quantify the agreement between CALIOP and EARLINET
measurements, the correlation coefficient, the mean bias, and
the factor of exceedance are used (Kristiansen et al., 2012).
Their defining equations are provided below.
The correlation coefficient R is defined in the usual way
as
R =
N∑i=1
(βatt.CALi −βatt.CAL
)(βatt.EARi −βatt.EAR
)√√√√ N∑i=1
(βatt.CALi −βatt.CAL
)2√ N∑i=1
(βatt.EARi −βatt.EAR
)2 . (7)
R shows the strength of a linear relationship between the
CALIOP and EARLINET values. It ranges from −1 to +1,
where a value of −1 means a total negative correlation, +1
is a total positive correlation, and a value of 0 indicates no
correlation.
The mean bias (MB) is defined as
MB=1
N
N∑i=1
(βatt.CALi −βatt.EARi
)MB=
1
N
N∑i=1
(βatt.CALi −βatt.EARi
)MB=
1
N
N∑i=1
(βatt.CALi −βatt.EARi
), (8)
where N is the number of the data points in the height range
where both CALIOP and EARLINET attenuated backscatter
data are available.
The factor of exceedance (FoE) is defined as
FoE=
[N (βatt.CAL > βatt.EARL)
N− 0.5
], (9)
where N(βatt.CAL > βatt.EAR) is the number of data points
in which CALIOP backscatter coefficient measurements are
higher than the coincident EARLINET observations. The
FoE value can vary between −0.5 (all CALIOP values are
underestimated) and +0.5 (all CALIOP values are overesti-
mated).
Atmos. Chem. Phys., 15, 12179–12191, 2015 www.atmos-chem-phys.net/15/12179/2015/
T. Grigas et al.: CALIOP near-real-time backscatter products compared to EARLINET data 12183
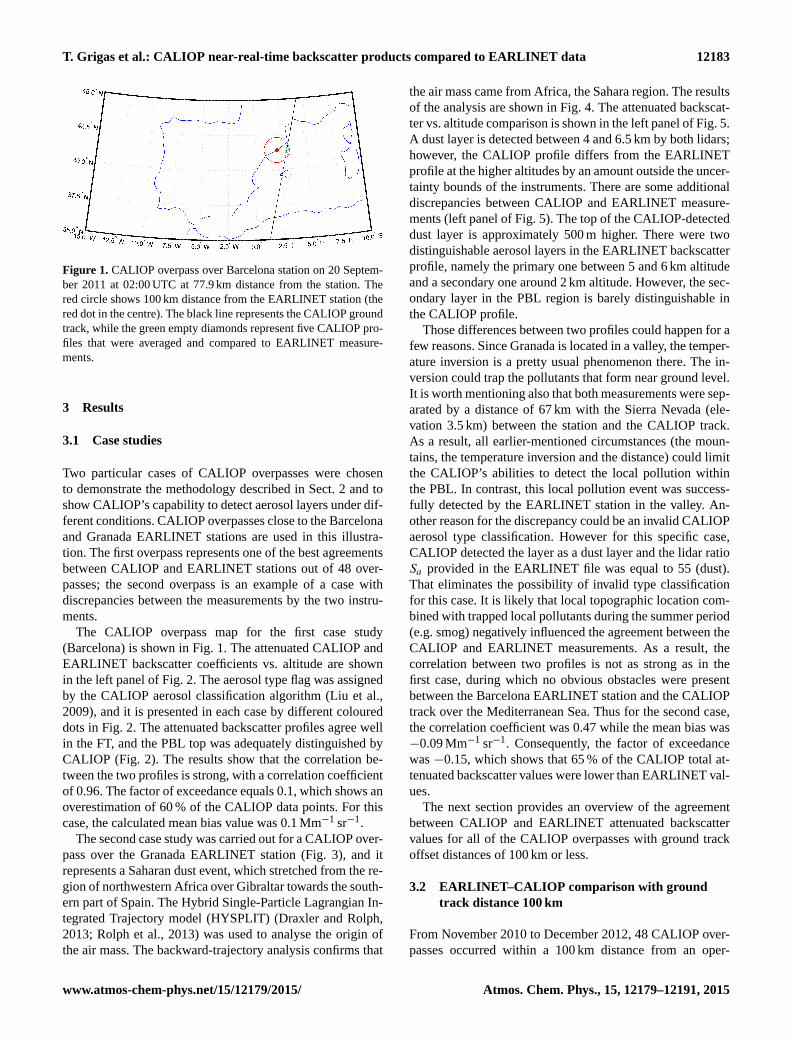
Figure 1. CALIOP overpass over Barcelona station on 20 Septem-
ber 2011 at 02:00 UTC at 77.9 km distance from the station. The
red circle shows 100 km distance from the EARLINET station (the
red dot in the centre). The black line represents the CALIOP ground
track, while the green empty diamonds represent five CALIOP pro-
files that were averaged and compared to EARLINET measure-
ments.
3 Results
3.1 Case studies
Two particular cases of CALIOP overpasses were chosen
to demonstrate the methodology described in Sect. 2 and to
show CALIOP’s capability to detect aerosol layers under dif-
ferent conditions. CALIOP overpasses close to the Barcelona
and Granada EARLINET stations are used in this illustra-
tion. The first overpass represents one of the best agreements
between CALIOP and EARLINET stations out of 48 over-
passes; the second overpass is an example of a case with
discrepancies between the measurements by the two instru-
ments.
The CALIOP overpass map for the first case study
(Barcelona) is shown in Fig. 1. The attenuated CALIOP and
EARLINET backscatter coefficients vs. altitude are shown
in the left panel of Fig. 2. The aerosol type flag was assigned
by the CALIOP aerosol classification algorithm (Liu et al.,
2009), and it is presented in each case by different coloured
dots in Fig. 2. The attenuated backscatter profiles agree well
in the FT, and the PBL top was adequately distinguished by
CALIOP (Fig. 2). The results show that the correlation be-
tween the two profiles is strong, with a correlation coefficient
of 0.96. The factor of exceedance equals 0.1, which shows an
overestimation of 60 % of the CALIOP data points. For this
case, the calculated mean bias value was 0.1 Mm−1 sr−1.
The second case study was carried out for a CALIOP over-
pass over the Granada EARLINET station (Fig. 3), and it
represents a Saharan dust event, which stretched from the re-
gion of northwestern Africa over Gibraltar towards the south-
ern part of Spain. The Hybrid Single-Particle Lagrangian In-
tegrated Trajectory model (HYSPLIT) (Draxler and Rolph,
2013; Rolph et al., 2013) was used to analyse the origin of
the air mass. The backward-trajectory analysis confirms that
the air mass came from Africa, the Sahara region. The results
of the analysis are shown in Fig. 4. The attenuated backscat-
ter vs. altitude comparison is shown in the left panel of Fig. 5.
A dust layer is detected between 4 and 6.5 km by both lidars;
however, the CALIOP profile differs from the EARLINET
profile at the higher altitudes by an amount outside the uncer-
tainty bounds of the instruments. There are some additional
discrepancies between CALIOP and EARLINET measure-
ments (left panel of Fig. 5). The top of the CALIOP-detected
dust layer is approximately 500 m higher. There were two
distinguishable aerosol layers in the EARLINET backscatter
profile, namely the primary one between 5 and 6 km altitude
and a secondary one around 2 km altitude. However, the sec-
ondary layer in the PBL region is barely distinguishable in
the CALIOP profile.
Those differences between two profiles could happen for a
few reasons. Since Granada is located in a valley, the temper-
ature inversion is a pretty usual phenomenon there. The in-
version could trap the pollutants that form near ground level.
It is worth mentioning also that both measurements were sep-
arated by a distance of 67 km with the Sierra Nevada (ele-
vation 3.5 km) between the station and the CALIOP track.
As a result, all earlier-mentioned circumstances (the moun-
tains, the temperature inversion and the distance) could limit
the CALIOP’s abilities to detect the local pollution within
the PBL. In contrast, this local pollution event was success-
fully detected by the EARLINET station in the valley. An-
other reason for the discrepancy could be an invalid CALIOP
aerosol type classification. However for this specific case,
CALIOP detected the layer as a dust layer and the lidar ratio
Sa provided in the EARLINET file was equal to 55 (dust).
That eliminates the possibility of invalid type classification
for this case. It is likely that local topographic location com-
bined with trapped local pollutants during the summer period
(e.g. smog) negatively influenced the agreement between the
CALIOP and EARLINET measurements. As a result, the
correlation between two profiles is not as strong as in the
first case, during which no obvious obstacles were present
between the Barcelona EARLINET station and the CALIOP
track over the Mediterranean Sea. Thus for the second case,
the correlation coefficient was 0.47 while the mean bias was
−0.09 Mm−1 sr−1. Consequently, the factor of exceedance
was −0.15, which shows that 65 % of the CALIOP total at-
tenuated backscatter values were lower than EARLINET val-
ues.
The next section provides an overview of the agreement
between CALIOP and EARLINET attenuated backscatter
values for all of the CALIOP overpasses with ground track
offset distances of 100 km or less.
3.2 EARLINET–CALIOP comparison with ground
track distance 100 km
From November 2010 to December 2012, 48 CALIOP over-
passes occurred within a 100 km distance from an oper-
www.atmos-chem-phys.net/15/12179/2015/ Atmos. Chem. Phys., 15, 12179–12191, 2015

12184 T. Grigas et al.: CALIOP near-real-time backscatter products compared to EARLINET data
Figure 2. Left panel: attenuated backscatter versus altitude for a CALIOP overpass at Barcelona station on 20 September 2011 at 02:00 UTC
at 77.9 km distance from the station (the red line shows the EARLINET attenuated backscatter profile, the red dashed lines show EARLINET
uncertainties, the dots represent CALIOP data, and the black dashed lines show the CALIOP uncertainties); right panel: corresponding
scatter plot of CALIOP attenuated backscatter (different colours represent different detected aerosol type; see legend) against EARLINET
attenuated backscatter with a 1 : 1 reference line (black).
Figure 3. CALIOP overpass over Granada station on 7 July 2011 at
02:20 UTC at 67 km distance from the station. The red circle shows
100 km distance from EARLINET station (the red dot in the centre).
The black line represents the CALIOP ground track, while the green
empty diamonds represent five CALIOP profiles that were averaged
and compared to EARLINET measurements.
ating EARLINET station, with aerosol layers classified as
dust, polluted dust, clean marine, clean continental, polluted
continental, mixed and/or smoke/biomass burning. These 48
overpasses resulted in 7405 data points that were deemed
valid for evaluation against EARLINET. The scatter plot of
CALIOP and EARLINET attenuated backscatter values for
all of these data points is shown in Fig. 6.
The CALIOP and EARLINET data correlate well (R =
0.86), with a mean bias equal to 0.03 Mm−1 sr−1, while
the factor of exceedance value is 0.17. The latter statisti-
cal parameter indicates that 67 % of the CALIOP attenu-
ated backscatter values were higher than the correspond-
ing EARLINET measurements. However, there were several
points that deviated from the 1 : 1 line. In order to investi-
gate the cause of these outliers, the data were colour-coded
by the overpass distance (Fig. 6) and the vertical height of
the aerosol layer (Fig. 7), which revealed that the majority
of the outliers were observed when the distance between
the EARLINET station and CALIPSO overpass exceeded
30 km. Moreover, the correlation seemed to be dependent on
the height of the aerosol layer, where the larger discrepan-
cies are observed for low altitudes. This is also in agreement
with Mona et al. (2009) and Pappalardo et al. (2010). Fur-
thermore, the correlation seemed to be dependent also on the
presence of multiple layers in the FT and the PBL at the same
time (as in the second case study). Therefore, further analysis
was performed for the PBL and the FT separately.
3.2.1 PBL and FT with ground track distance 100 km
The PBL height was assumed to always be 2.5 km for this
analysis (Mattis et al., 2004; Pappalardo et al., 2004). The
scatter plots for the separated PBL and FT data sets are
shown in Figs. 8 and 9 and characterized by R, MB and FoE
parameters (Table 2).
The correlation is significantly stronger for the FT (R =
0.85) compared to the PBL (R = 0.60). The factor of ex-
ceedance for the FT equals 0.22, which indicates that 72 %
of the CALIOP total attenuated backscatter values were
higher than the EARLINET values, with a mean bias of
0.06 Mm−1 sr−1. Correspondingly, the FoE for the PBL was
Atmos. Chem. Phys., 15, 12179–12191, 2015 www.atmos-chem-phys.net/15/12179/2015/
T. Grigas et al.: CALIOP near-real-time backscatter products compared to EARLINET data 12185
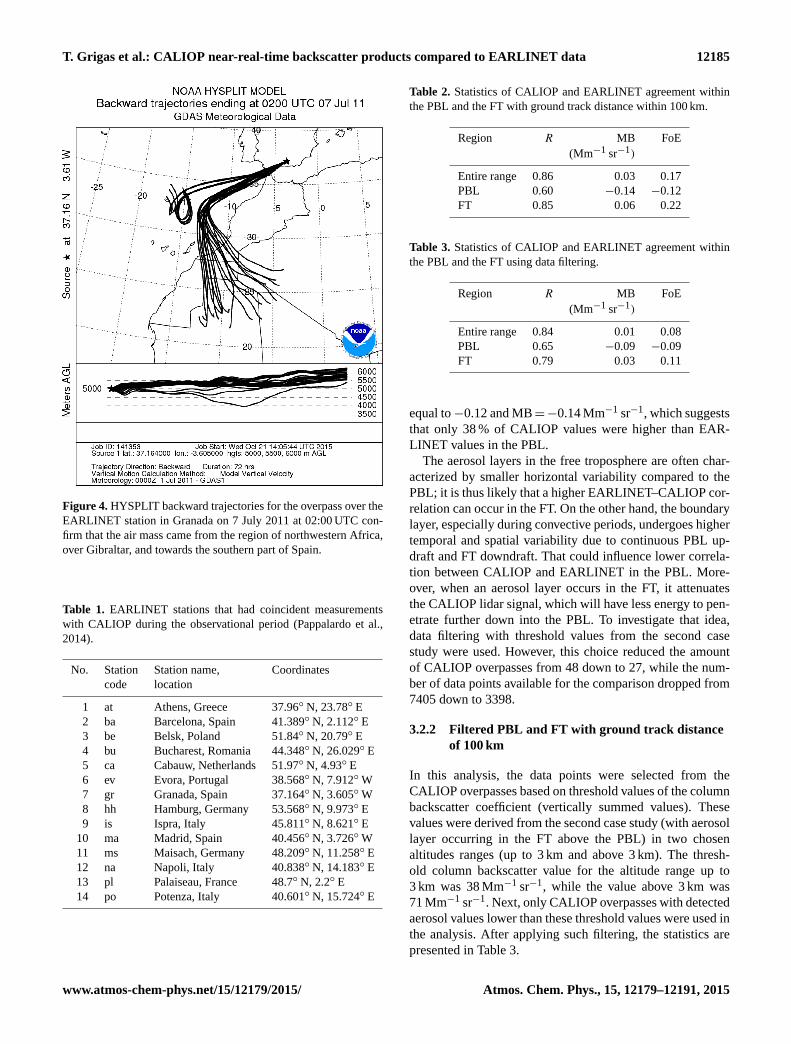
Figure 4. HYSPLIT backward trajectories for the overpass over the
EARLINET station in Granada on 7 July 2011 at 02:00 UTC con-
firm that the air mass came from the region of northwestern Africa,
over Gibraltar, and towards the southern part of Spain.
Table 1. EARLINET stations that had coincident measurements
with CALIOP during the observational period (Pappalardo et al.,
2014).
No. Station Station name, Coordinates
code location
1 at Athens, Greece 37.96◦ N, 23.78◦ E
2 ba Barcelona, Spain 41.389◦ N, 2.112◦ E
3 be Belsk, Poland 51.84◦ N, 20.79◦ E
4 bu Bucharest, Romania 44.348◦ N, 26.029◦ E
5 ca Cabauw, Netherlands 51.97◦ N, 4.93◦ E
6 ev Evora, Portugal 38.568◦ N, 7.912◦W
7 gr Granada, Spain 37.164◦ N, 3.605◦W
8 hh Hamburg, Germany 53.568◦ N, 9.973◦ E
9 is Ispra, Italy 45.811◦ N, 8.621◦ E
10 ma Madrid, Spain 40.456◦ N, 3.726◦W
11 ms Maisach, Germany 48.209◦ N, 11.258◦ E
12 na Napoli, Italy 40.838◦ N, 14.183◦ E
13 pl Palaiseau, France 48.7◦ N, 2.2◦ E
14 po Potenza, Italy 40.601◦ N, 15.724◦ E
Table 2. Statistics of CALIOP and EARLINET agreement within
the PBL and the FT with ground track distance within 100 km.
Region R MB FoE
(Mm−1 sr−1)
Entire range 0.86 0.03 0.17
PBL 0.60 −0.14 −0.12
FT 0.85 0.06 0.22
Table 3. Statistics of CALIOP and EARLINET agreement within
the PBL and the FT using data filtering.
Region R MB FoE
(Mm−1 sr−1)
Entire range 0.84 0.01 0.08
PBL 0.65 −0.09 −0.09
FT 0.79 0.03 0.11
equal to−0.12 and MB=−0.14 Mm−1 sr−1, which suggests
that only 38 % of CALIOP values were higher than EAR-
LINET values in the PBL.
The aerosol layers in the free troposphere are often char-
acterized by smaller horizontal variability compared to the
PBL; it is thus likely that a higher EARLINET–CALIOP cor-
relation can occur in the FT. On the other hand, the boundary
layer, especially during convective periods, undergoes higher
temporal and spatial variability due to continuous PBL up-
draft and FT downdraft. That could influence lower correla-
tion between CALIOP and EARLINET in the PBL. More-
over, when an aerosol layer occurs in the FT, it attenuates
the CALIOP lidar signal, which will have less energy to pen-
etrate further down into the PBL. To investigate that idea,
data filtering with threshold values from the second case
study were used. However, this choice reduced the amount
of CALIOP overpasses from 48 down to 27, while the num-
ber of data points available for the comparison dropped from
7405 down to 3398.
3.2.2 Filtered PBL and FT with ground track distance
of 100 km
In this analysis, the data points were selected from the
CALIOP overpasses based on threshold values of the column
backscatter coefficient (vertically summed values). These
values were derived from the second case study (with aerosol
layer occurring in the FT above the PBL) in two chosen
altitudes ranges (up to 3 km and above 3 km). The thresh-
old column backscatter value for the altitude range up to
3 km was 38 Mm−1 sr−1, while the value above 3 km was
71 Mm−1 sr−1. Next, only CALIOP overpasses with detected
aerosol values lower than these threshold values were used in
the analysis. After applying such filtering, the statistics are
presented in Table 3.
www.atmos-chem-phys.net/15/12179/2015/ Atmos. Chem. Phys., 15, 12179–12191, 2015

12186 T. Grigas et al.: CALIOP near-real-time backscatter products compared to EARLINET data
Figure 5. Left panel: Attenuated backscatter versus altitude for a CALIOP overpass over Granada station on 7 July 2011 at 02:20 UTC at
67 km distance from the station (the red line shows the EARLINET attenuated backscatter profile, the red dashed lines show EARLINET
uncertainties, the dots represent CALIOP data, and the dashed lines show the CALIOP uncertainty); right panel: corresponding scatter
plot of CALIOP attenuated backscatter (different colours represent different detected aerosol; see legend) against EARLINET attenuated
backscatter, with a 1 : 1 reference line (black).
Figure 6. CALIOP vs EARLINET total attenuated backscatter
for CALIOP overpasses over EARLINET stations within 100 km
ground track offset distance. The colour scale shows the ground
track distance from the EARLINET station.
The scatter plots of the attenuated backscatter for CALIOP
and EARLINET after applying this data filtering are pre-
sented in Figs. 10 and 11. The correlation between the
two sets of attenuated backscatter measurements became
marginally stronger in the PBL (R = 0.65), while the same
parameter for the FT decreased from R = 0.85 to R =
0.79. Correspondingly, the other statistical parameters im-
proved for the PBL (MB=−0.09 and FoE=−0.09), but
they decreased by a factor of 2 for the FT (MB= 0.03 and
Figure 7. CALIOP vs. EARLINET total attenuated backscatter for
CALIOP overpasses over EARLINET station points within 100 km
ground track distance, with colour coding showing the aerosol layer
altitude.
FoE= 0.11). This suggests considerable variability, across
the data set, in the spatial distribution of the aerosol over
spatial scales of 100 km or less around some EARLINET sta-
tions rather than influence from elevated FT layers.
The clean marine type of aerosol was detected by CALIOP
exclusively in the PBL (Fig. 12b), which is consistent with
the marine surface source. However, a negative correlation
coefficient was found for this aerosol type. One data point
looks like an outlier. If this data point is removed, the statis-
Atmos. Chem. Phys., 15, 12179–12191, 2015 www.atmos-chem-phys.net/15/12179/2015/
T. Grigas et al.: CALIOP near-real-time backscatter products compared to EARLINET data 12187
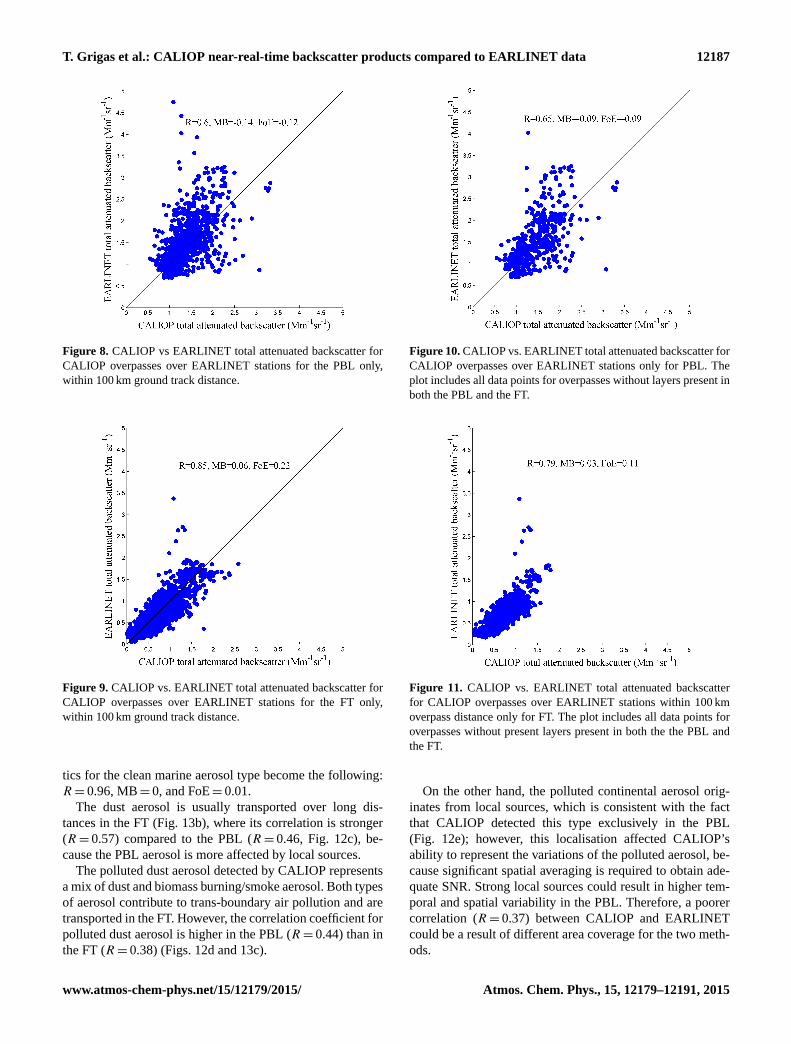
Figure 8. CALIOP vs EARLINET total attenuated backscatter for
CALIOP overpasses over EARLINET stations for the PBL only,
within 100 km ground track distance.
Figure 9. CALIOP vs. EARLINET total attenuated backscatter for
CALIOP overpasses over EARLINET stations for the FT only,
within 100 km ground track distance.
tics for the clean marine aerosol type become the following:
R= 0.96, MB= 0, and FoE= 0.01.
The dust aerosol is usually transported over long dis-
tances in the FT (Fig. 13b), where its correlation is stronger
(R= 0.57) compared to the PBL (R= 0.46, Fig. 12c), be-
cause the PBL aerosol is more affected by local sources.
The polluted dust aerosol detected by CALIOP represents
a mix of dust and biomass burning/smoke aerosol. Both types
of aerosol contribute to trans-boundary air pollution and are
transported in the FT. However, the correlation coefficient for
polluted dust aerosol is higher in the PBL (R= 0.44) than in
the FT (R= 0.38) (Figs. 12d and 13c).
Figure 10. CALIOP vs. EARLINET total attenuated backscatter for
CALIOP overpasses over EARLINET stations only for PBL. The
plot includes all data points for overpasses without layers present in
both the PBL and the FT.
Figure 11. CALIOP vs. EARLINET total attenuated backscatter
for CALIOP overpasses over EARLINET stations within 100 km
overpass distance only for FT. The plot includes all data points for
overpasses without present layers present in both the the PBL and
the FT.
On the other hand, the polluted continental aerosol orig-
inates from local sources, which is consistent with the fact
that CALIOP detected this type exclusively in the PBL
(Fig. 12e); however, this localisation affected CALIOP’s
ability to represent the variations of the polluted aerosol, be-
cause significant spatial averaging is required to obtain ade-
quate SNR. Strong local sources could result in higher tem-
poral and spatial variability in the PBL. Therefore, a poorer
correlation (R= 0.37) between CALIOP and EARLINET
could be a result of different area coverage for the two meth-
ods.
www.atmos-chem-phys.net/15/12179/2015/ Atmos. Chem. Phys., 15, 12179–12191, 2015

12188 T. Grigas et al.: CALIOP near-real-time backscatter products compared to EARLINET data
Figure 12. Five Level 1.5 feature types for CALIOP overpasses over EARLINET stations for the PBL. The plot includes filtered data points
for overpasses without layers present in both the PBL and the FT.
Figure 13. Four Level 1.5 feature types for CALIOP overpasses over EARLINET stations for the FT. The plot includes filtered data points
for overpasses without layers present in both the PBL and the FT.
The mixed aerosol (Fig. 13d) was detected only in FT
cases, with the lowestR= 0.35 value across all aerosol types.
The reason for this is that it is a mix of other aerosol types,
which causes a low value of the correlation coefficient.
The technique of data filtering allowed improving the
agreement between different aerosol types, but at the same
time the improvements were not very significant.
Atmos. Chem. Phys., 15, 12179–12191, 2015 www.atmos-chem-phys.net/15/12179/2015/

T. Grigas et al.: CALIOP near-real-time backscatter products compared to EARLINET data 12189
4 Conclusions
Over 3 years, 48 CALIOP overpasses occurred within a
100 km ground track offset distance from an operating EAR-
LINET station, resulting in 7405 data points for the analy-
sis presented here. The inter-comparison of the total attenu-
ated backscatter profiles from near-real-time CALIOP Level
1.5 data and converted EARLINET data showed fairly good
agreement, with the correlation around 0.86, a mean bias of
0.03 Mm−1 sr−1 and a factor of exceedance of 0.17. On aver-
age, the CALIOP attenuated backscatter values were slightly
higher (by 3 %) than the EARLINET values.
While it was suspected that the presence of high-
concentration layers in the FT affected the agreement be-
tween CALIOP and EARLINET, after filtering out these
cases with notable FT aerosol layers, no real improvement in
the correlation coefficient was observed. This suggest that the
lack of a high correlation between the data sets is more likely
due to variability in the distribution of aerosols across the
100 km area selected around the EALRINET stations. Before
applying the filtering, the CALIOP attenuated backscatter
values were lower by 20 % in the PBL compared to the EAR-
LINET measurements; however, they were higher by 8 % in
the FT. After applying the filtering, the correlation coefficient
improved (from R= 0.60 up to R= 0.65) within the PBL,
and the mean bias decreased from MB=−0.14 Mm−1 sr−1
down to MB=−0.09 Mm−1 sr−1. The factor of exceedance
decreased as well, from FoE=−0.12 to FoE=−0.09. Fi-
nally, the majority of the outliers in the regression plot
of CALIOP and EARLINET attenuated backscatter were
shown to be caused by the presence of layers in both the PBL
and the FT.
The aerosol types detected by CALIOP were consistent
with the source of the aerosol and the transport mechanism.
Aerosols from local sources were mainly detected in the
boundary layer, while long-range transport pollution was ob-
served in the FT. The correlation for different aerosol types
was stronger within the FT; it was in the range of 0.35 to
0.80, with mean bias values of −0.24 to 0.27 Mm−1 sr−1,
and the factor of exceedance between −0.05 and 0.11. The
correlation for the PBL was slightly weaker (R= 0.37–
0.61); the mean bias values were in the range of −0.19
to 0.19 Mm−1 sr−1, with the factor of exceedance −0.16 to
0.02.
Acknowledgements. The authors gratefully acknowledge the
European Union for funding this work under the 7th Framework
Programme as the MACC-II subproject, and the Irish Research
Council “New Foundations” programme. The authors acknowledge
the CALIPSO scientific team for granting access to the CALIOP
Level 1.5 data and EARLINET for providing aerosol lidar profiles,
which were available from the EARLINET webpage. The authors
also acknowledge the NOAA Air Resources Laboratory (ARL) for
the provision of the HYSPLIT transport and dispersion model used
in this study.
Edited by: R. Engelen
References
Bösenberg, J., Matthias, V., Amodeo, A., Amoiridis, V., Ansmann,
A., Baldasano, J. M., Balin, I., Balis, D., Böckmann, C., Boselli,
A., Carlsson, G., Chaikovsky, A., Chourdakis, G., Comerón,
A., De Tomasi, F., Eixmann, R., Freudenthaler, V., Giehl, H.,
Grigorov, I., Hågård, A., Iarlori, M., Kirsche, A., Kolarov, G.,
Komguem, L., Kreipl, S., Kumpf, W., Larchevêque, G., Linné,
H., Matthey, R., Mattis, I., Mekler, A., Mironova, I., Mitev,
V., Mona, L., Müller, D., Music, S., Nickovic, S., Pandolfi,
M., Papayannis, A., Pappalardo, G., Pelon, J., Pérez, C., Per-
rone, R. M., Persson, R., Resendes, D. P., Rizi, V., Rocaden-
bosch, F., Rodrigues, J. A., Sauvage, L., Schneidenbach, L.,
Schumacher, R., Shcherbakov, V., Simeonov, V., Sobolewski, P.,
Spinelli, N., Stachlewska, I., Stoyanov, D., Trickl, T., Tsaknakis,
G., Vaughan, G., Wandinger, U., Wang, X., Wiegner, M., Za-
vrtanik, M., and Zerefos, C.: EARLINET: a European Aerosol
Research Lidar Network to Establish an Aerosol Climatology,
Max-Planck-Institut Report No. 348, Hamburg, Germany, 2003.
Bucholtz, A.: Rayleigh-scattering calculations for the ter-
restrial atmosphere, Appl. Optics, 34, 2765–2773,
doi:10.1364/AO.34.002765, 1995.
Burton, S. P., Ferrare, R. A., Vaughan, M. A., Omar, A. H.,
Rogers, R. R., Hostetler, C. A., and Hair, J. W.: Aerosol
classification from airborne HSRL and comparisons with the
CALIPSO vertical feature mask, Atmos. Meas. Tech., 6, 1397–
1412, doi:10.5194/amt-6-1397-2013, 2013.
CALIPSO Quality Statements: CALIPSO Quality Statements Li-
dar Level 1.5 Data Product Version Release: 3.02, avail-
able at: https://eosweb.larc.nasa.gov/sites/default/files/project/
calipso/quality_summaries/CAL_lidar_L1-5_v3-02.pdf (last ac-
cess: 15 December 2014), 2011.
Draxler, R. R. and Rolph, G. D.: HYSPLIT (HYbrid Single-Particle
Lagrangian Integrated Trajectory) Model access via NOAA
ARL READY Website, available at: http://www.arl.noaa.gov/
HYSPLIT.php (last access: 15 December 2014), 2013.
Giannakaki, E., Balis, D. S., Amiridis, V., and Zerefos, C.: Optical
properties of different aerosol types: seven years of combined
Raman-elastic backscatter lidar measurements in Thessaloniki,
Greece, Atmos. Meas. Tech., 3, 569–578, doi:10.5194/amt-3-
569-2010, 2010.
Groß, S., Gasteiger, J., Freudenthaler, V., Schnell, F. and Wiegner,
M.: Characterization of the Eyjafjallajökull ash-plume by means
of lidar measurements over the Munich EARLINET-site, Proc.
SPIE, 7832, 78320M–78320M–8, 2010.
Haywood, J., Francis, P., Dubovik, O., Glew, M. and Holben, B.:
Comparison of aerosol size distributions, radiative properties,
and optical depths determined by aircraft observations and Sun
photometers during SAFARI 2000, J. Geophys. Res.-Atmos.,
108, 8471, doi:10.1029/2002JD002250, 2003.
Kristiansen, N. I., Stohl, A., Prata, A. J., Bukowiecki, N., Dacre, H.,
Eckhardt, S., Henne, S., Hort, M. C., Johnson, B. T., Marenco,
F., Neininger, B., Reitebuch, O., Seibert, P., Thomson, D. J.,
Webster, H. N. and Weinzierl, B.: Performance assessment of
a volcanic ash transport model mini-ensemble used for inverse
www.atmos-chem-phys.net/15/12179/2015/ Atmos. Chem. Phys., 15, 12179–12191, 2015

12190 T. Grigas et al.: CALIOP near-real-time backscatter products compared to EARLINET data
modeling of the 2010 Eyjafjallajökull eruption: Eyjafjallajökull
ash transport modeling, J. Geophys. Res.-Atmos., 117, D00U11,
doi:10.1029/2011JD016844, 2012.
Liu, Z., Vaughan, M., Winker, D., Kittaka, C., Getzewich,
B., Kuehn, R., Omar, A., Powell, K., Trepte, C., and
Hostetler, C.: The CALIPSO lidar cloud and aerosol dis-
crimination: version 2 algorithm and initial assessment
of performance, J. Atmos. Ocean. Tech., 26, 1198–1213,
doi:10.1175/2009JTECHA1229.1, 2009.
Lolli, S., Welton, E., Benedetti, A., Jones, L., Suttie, M., and Wang,
S.: MPLNET lidar data assimilation in the ECMWF MACC-II
Aerosol system: evaluation of model performances at NCU li-
dar station, in: Proceedings of SPIE – Lidar Technologies, Tech-
niques, and Measurements for Atmospheric Remote Sensing X,
Vol. 9246, doi:10.1117/12.2068201, 2014.
Mamouri, R. E., Amiridis, V., Papayannis, A., Giannakaki, E.,
Tsaknakis, G., and Balis, D. S.: Validation of CALIPSO space-
borne-derived attenuated backscatter coefficient profiles using a
ground-based lidar in Athens, Greece, Atmos. Meas. Tech., 2,
513–522, doi:10.5194/amt-2-513-2009, 2009.
Mattis, I., Ansmann, A., Müller, D., Wandinger, U., and Althausen,
D.: Multiyear aerosol observations with dual-wavelength Raman
lidar in the framework of EARLINET, J. Geophys. Res.-Atmos.,
109, D13203, doi:10.1029/2004JD004600, 2004.
Mattis, I., Mona, L., Müller, D., Pappalardo, G., Arboledas, L. A.,
Da’Mico, G., Amodeo, A., Apituley, A., Baldasano, J. M., Böck-
mann, C., Bösenberg, J., Chaikovsky, A., Comeron, A., Gian-
nakaki, E., Grigorov, I., Rascado, J. L. G., Gustafsson, O., Iar-
lori, M., Linné, H., Mitev, V., Francisco Molero Menéndez, D.
N., Nicolae, D., Papayannis, A., García-Pando, C. P., Perrone,
M. R., Pietruczuk, A., Putaud, J.-P., Ravetta, F., Rodríguez, A.,
Seifert, P., Sicard, M., Simeonov, V., Sobolewski, P., Spinelli, N.,
Stebel, K., Stohl, A., Tesche, M., Trickl, T., Wang, X., and Wieg-
ner, M.: EARLINET correlative measurements for CALIPSO, in:
Proceedings of SPIE – The International Society for Optical En-
gineering, Vol. 6750, doi:10.1117/12.738090, 2007.
Mattis, I., Müller, D., Ansmann, A., Wandinger, U., Preißler, J.,
Seifert, P., and Tesche, M.: Ten years of multiwavelength Raman
lidar observations of free-tropospheric aerosol layers over cen-
tral Europe: geometrical properties and annual cycle, J. Geophys.
Res.-Atmos., 113, D20202, doi:10.1029/2007JD009636, 2008.
Molero, F. and Pujadas, M.: Comparison of correlative mea-
surements of CALIPSO lidar and the #21 EARLINET sta-
tion (CIEMAT-Madrid), in: Proceedings of SPIE – The
International Society for Optical Engineering, Vol. 7111,
doi:10.1117/12.799745, 2008.
Mona, L., Pappalardo, G., Amodeo, A., D’Amico, G., Madonna,
F., Boselli, A., Giunta, A., Russo, F., and Cuomo, V.: One year
of CNR-IMAA multi-wavelength Raman lidar measurements in
coincidence with CALIPSO overpasses: Level 1 products com-
parison, Atmos. Chem. Phys., 9, 7213–7228, doi:10.5194/acp-9-
7213-2009, 2009.
Omar, A. H., Winker, D. M., Vaughan, M. A., Hu, Y., Trepte,
C. R., Ferrare, R. A., Lee, K.-P., Hostetler, C. A., Kit-
taka, C., Rogers, R. R., Kuehn, R. E., and Liu, Z.: The
CALIPSO automated aerosol classification and lidar ratio se-
lection algorithm, J. Atmos. Ocean. Tech., 26, 1994–2014,
doi:10.1175/2009JTECHA1231.1, 2009.
Papayannis, A., Chourdakis, G., Tsaknakis, G., and Serafetinides,
A.: One-year observations of the vertical structure of Saharan
dust over Athens, Greece monitored by NTUA’s lidar system in
the frame of EARLINET, in: Proceedings of SPIE – The Inter-
national Society for Optical Engineering, Vol. 4539, 146–157,
doi:10.1117/12.454434, 2002.
Pappalardo, G., Amodeo, A., Mona, L., Pandolfi, M., Pergola, N.,
and Cuomo, V.: Raman lidar observations of aerosol emitted dur-
ing the 2002 Etna eruption, Geophys. Res. Lett., 31, L05120,
doi:10.1029/2003GL019073, 2004.
Pappalardo, G., Mona, L., Wandinger, U., Mattis, I., Amodeo, A.,
Ansmann, A., Apituley, A., Alados-Arboledas, L., Balis, D.,
Chaikovsky, A., Comeron, A., D’Amico, G., Freudenthaler, V.,
Giunta, A., Grigorov, I., Hiebsch, A., Linnè, H., Madonna, F.,
Papayannis, A., Perrone, M. R., Pietruczuk, A., Pujadas, M.,
Rizi, V., Spinelli, N., and Wiegner, M.: Analysis of the EAR-
LINET correlative measurements for CALIPSO, Proc. SPIE,
7479, 74790B–74790B, doi:10.1117/12.830323, 2009.
Pappalardo, G., Wandinger, U., Mona, L., Hiebsch, A., Mattis,
I., Amodeo, A., Ansmann, A., Seifert, P., Linné, H., Apituley,
A., Alados Arboledas, L., Balis, D., Chaikovsky, A., D’Amico,
G., De Tomasi, F., Freudenthaler, V., Giannakaki, E., Giunta,
A., Grigorov, I., Iarlori, M., Madonna, F., Mamouri, R.-E.,
Nasti, L., Papayannis, A., Pietruczuk, A., Pujadas, M., Rizi, V.,
Rocadenbosch, F., Russo, F., Schnell, F., Spinelli, N., Wang,
X., and Wiegner, M.: EARLINET correlative measurements
for CALIPSO: first intercomparison results, J. Geophys. Res.-
Atmos., 115, D00H19, doi:10.1029/2009JD012147, 2010.
Pappalardo, G., Amodeo, A., Apituley, A., Comeron, A., Freuden-
thaler, V., Linné, H., Ansmann, A., Bösenberg, J., D’Amico,
G., Mattis, I., Mona, L., Wandinger, U., Amiridis, V., Alados-
Arboledas, L., Nicolae, D., and Wiegner, M.: EARLINET: to-
wards an advanced sustainable European aerosol lidar network,
Atmos. Meas. Tech., 7, 2389–2409, doi:10.5194/amt-7-2389-
2014, 2014.
Powell, K., Mark, V., Winker, D., Lee, K. P., Pitts, M., Trepte,
C., Detweiler, P., Hunt, W., Lambeth, J., Lucker, P., Murray,
T., Hagolle, O., Lifermann, A., Faivre, M., Garnier, A., and
Pelon, J.: Cloud – Aerosol LIDAR Infrared Pathfinder Satel-
lite Observations (CALIPSO), Data Management System, Data
Products Catalog, Document No: PC-SCI-503, Release 3.2, Au-
gust 2010, NASA Langley Research Center, Hampton, Virginia,
USA, 2010.
Rolph, G. D.: Real-time Environmental Applications and Display
System (READY) available at: http://www.ready.noaa.gov (last
access: 15 December 2014), 2013.
Sekiyama, T. T., Tanaka, T. Y., Shimizu, A., and Miyoshi, T.: Data
assimilation of CALIPSO aerosol observations, Atmos. Chem.
Phys., 10, 39–49, doi:10.5194/acp-10-39-2010, 2010.
Sissenwine, N., Dubin, M., and Wexler, H.: The U.S. Stan-
dard Atmosphere, J. Geophys. Res., 67, 3627–3630,
doi:10.1029/JZ067i009p03627, 1962.
Stephens, G. L., Vane, D. G., Boain, R. J., Mace, G. G., Sassen,
K., Wang, Z., Illingworth, A. J., O’Connor, E. J., Rossow, W.
B., Durden, S. L., Miller, S. D., Austin, R. T., Benedetti, A., and
Mitrescu, C.: The cloudsat mission and the A-Train: a new di-
mension of space-based observations of clouds and precipitation,
B. Am. Meteorol. Soc., 83, 1771–1790 + 1742, 2002.
Atmos. Chem. Phys., 15, 12179–12191, 2015 www.atmos-chem-phys.net/15/12179/2015/
T. Grigas et al.: CALIOP near-real-time backscatter products compared to EARLINET data 12191
Vaughan, M., Trepte, C., Winker, D., Avery, M., Campbell,
J., Hoff, R., Young, S., Getzewich, B., Tackett, J., and
Kar, J.: Adapting CALIPSO Climate Measurements for Near
Real Time Analyses and Forecasting, in: Proceedings of the
34th International Symposium on Remote Sensing of En-
vironment, 10–15 April 2011, Sydney, Australia, available
at: http://www-calipso.larc.nasa.gov/resources/pdfs/VaughanM_
211104015final00251.pdf (last access: 24 July 2015), 2011.
Wang, Y., Sartelet, K. N., Bocquet, M., and Chazette, P.: Assim-
ilation of ground versus lidar observations for PM10 forecast-
ing, Atmos. Chem. Phys., 13, 269–283, doi:10.5194/acp-13-269-
2013, 2013.
Winker, D. M., Vaughan, M. A., Omar, A., Hu, Y., Pow-
ell, K. A., Liu, Z., Hunt, W. H., and Young, S. A.:
Overview of the CALIPSO mission and CALIOP data pro-
cessing algorithms, J. Atmos. Ocean. Tech., 26, 2310–2323,
doi:10.1175/2009JTECHA1281.1, 2009.
Yu, H., Kaufman, Y. J., Chin, M., Feingold, G., Remer, L. A., An-
derson, T. L., Balkanski, Y., Bellouin, N., Boucher, O., Christo-
pher, S., DeCola, P., Kahn, R., Koch, D., Loeb, N., Reddy,
M. S., Schulz, M., Takemura, T., and Zhou, M.: A review
of measurement-based assessments of the aerosol direct ra-
diative effect and forcing, Atmos. Chem. Phys., 6, 613–666,
doi:10.5194/acp-6-613-2006, 2006.
www.atmos-chem-phys.net/15/12179/2015/ Atmos. Chem. Phys., 15, 12179–12191, 2015