California Infrastructure and Economic Development Bank
524
New Issue - Book-Entry Only Ratings: Moody’s: “A1” S&P: “A+” Fitch: “AA” See “RATINGS” herein In the opinion of Orrick, Herrington & Sutcliffe LLP, Bond Counsel to the California Infrastructure and Economic Development Bank, based upon an analysis of existing laws, regulations, rulings and court decisions, and assuming, among other matters, the accuracy of certain representations and compliance with certain covenants, interest on the Bonds is excluded from gross income for federal income tax purposes under Section 103 of the Internal Revenue Code of 1986 (the “Code’’) and is exempt from State of California personal income taxes. In the further opinion of Bond Counsel, interest on the Bonds is not a specific preference item for purposes of the federal alternative minimum tax. Bond Counsel expresses no opinion regarding any other tax consequences related to the ownership or disposition of, or the amount, accrual or receipt of interest on, the Bonds. See “TAX MATTERS” herein. $272,605,000 CALIFORNIA INFRASTRUCTURE AND ECONOMIC DEVELOPMENT BANK LEASE REVENUE BONDS (CALIFORNIA STATE TEACHERS’ RETIREMENT SYSTEM HEADQUARTERS EXPANSION), SERIES 2019 (GREEN BONDS - CLIMATE BOND CERTIFIED) Dated: Date of Delivery Due: August 1, as shown on the inside cover California Infrastructure and Economic Development Bank (the “Infrastructure Bank”) is expected to offer $272,605,000 aggregate principal amount of its Lease Revenue Bonds (California State Teachers’ Retirement System Headquarters Expansion), Series 2019 (Green Bonds - Climate Bond Certified) (the “Bonds”). The proceeds of the sale of the Bonds will be used to provide funds to (i) construct, furnish and equip an expansion to the existing headquarters of the California State Teachers’ Retirement System (“CalSTRS”) (the “Project”) in the City of West Sacramento, California; (ii) pay capitalized interest with respect to the Bonds through February 1, 2023; and (iii) pay costs of issuance of the Bonds. See “THE PROJECT” and “ESTIMATED SOURCES AND USES OF FUNDS” herein. The Bonds are being issued under and pursuant to the Constitution and laws of the State of California (the “State”), particularly the Bergeson-Peace Infrastructure and Economic Development Bank Act (California Government Code Section 63000 and following) (as now in effect and as it may from time to time hereafter be amended or supplemented, the “Act”), and a Trust Agreement, dated as of December 1, 2019 (the “Trust Agreement”), between the Infrastructure Bank and The Bank of New York Mellon Trust Company, N.A., as trustee (the “Trustee”). The Bonds are limited obligations of the Infrastructure Bank, payable solely from Revenues as defined in the Trust Agreement, which consist primarily of base rental payments (“Base Rental Payments”) payable by CalSTRS to the Infrastructure Bank pursuant to a Facility Lease, dated as of December 1, 2019 (the “Facility Lease”), and available amounts in certain funds and accounts established under the Trust Agreement, as more particularly described herein. The Base Rental Payments to be made by CalSTRS to the Infrastructure Bank pursuant to the Facility Lease will be in amounts calculated to be sufficient to pay the principal of and interest on the Bonds when due. Base Rental Payments are payable by CalSTRS from any amounts legally available therefor, including but not limited to available amounts in the State Teachers’ Retirement Plan, as more particularly described herein. The obligation of CalSTRS to make Base Rental Payments does not commence until the date construction of the Project is substantially complete as specified in the Facility Lease, which is currently expected to occur no later than July 6, 2022, and thereafter is subject to abatement of Base Rental Payments in the event of material damage to or destruction of the Project or a taking of the Project in whole or in part under eminent domain. See “SECURITY AND SOURCES OF PAYMENT FOR THE BONDS” herein. This cover page contains information for quick reference only. Investors must read this entire Official Statement to obtain information essential to the making of an informed investment decision. See “INVESTMENT CONSIDERATIONS” herein for a description of certain factors that should be considered by investors in deciding whether to purchase the Bonds. THE BONDS SHALL NOT CONSTITUTE A DEBT OR LIABILITY OF THE STATE OR ANY POLITICAL SUBDIVISION THEREOF (OTHER THAN THE LIMITED OBLIGATION OF THE INFRASTRUCTURE BANK PAYABLE SOLELY FROM REVENUES AND THE OTHER AMOUNTS PLEDGED THEREFOR UNDER THE TRUST AGREEMENT), OR A PLEDGE OF THE FAITH AND CREDIT OF THE STATE OR ANY POLITICAL SUBDIVISION THEREOF, BUT SHALL BE PAYABLE SOLELY FROM THE FUNDS PROVIDED THEREFOR IN THE TRUST AGREEMENT. NEITHER THE FAITH AND CREDIT NOR THE TAXING POWER OF THE STATE IS PLEDGED TO THE PAYMENT OF THE PRINCIPAL OF, OR INTEREST ON THE BONDS; AND NO OWNER OR BENEFICIAL OWNER OF ANY BOND SHALL HAVE ANY RIGHT TO DEMAND PAYMENT OF THE PRINCIPAL OF, OR INTEREST ON, THE BONDS BY THE INFRASTRUCTURE BANK, THE STATE OR ANY POLITICAL SUBDIVISION THEREOF, OUT OF ANY FUNDS TO BE RAISED BY TAXATION OR APPROPRIATION. THE ISSUANCE OF THE BONDS SHALL NOT DIRECTLY OR INDIRECTLY OR CONTINGENTLY OBLIGATE THE STATE OR ANY POLITICAL SUBDIVISION THEREOF TO LEVY OR TO PLEDGE ANY FORM OF TAXATION THEREFOR OR TO MAKE ANY APPROPRIATION FOR THEIR PAYMENT. The Bonds will be subject to optional, extraordinary, and mandatory sinking fund redemption prior to their stated maturities, as described herein. The Bonds will be issued as fully registered bonds without coupons in denominations of $5,000 and any multiple thereof. The Bonds will bear interest from the Date of Delivery, payable semiannually on each February 1 and August 1, commencing February 1, 2020 (each, an “Interest Payment Date”). The Bonds will be initially registered in the name of Cede & Co., as registered owner and nominee for The Depository Trust Company, New York, New York (“DTC”). DTC will act as securities depository for the Bonds. So long as Cede & Co. is the registered owner of the Bonds, references herein to the Owners of the Bonds shall mean Cede & Co. and will not mean the beneficial owner of the Bonds. So long as Cede & Co. is the registered owner of the Bonds, the payment of principal of and interest on the Bonds will be made to Cede & Co., which will in turn be responsible for making such payments to its participants for subsequent disbursement to the beneficial owners. See “THE BONDS” herein. The Bonds are offered when, as, and if received by the Underwriters, subject to the approval as to legality by Orrick, Herrington & Sutcliffe LLP, Bond Counsel to the Infrastructure Bank. Certain legal matters will be passed upon for the Infrastructure Bank by its Senior Staff Counsel; for CalSTRS by its Office of General Counsel and Stradling Yocca, Carlson & Rauth, a Professional Corporation, Disclosure Counsel to CalSTRS, and for the Underwriters by Hawkins Delafield & Wood LLP, counsel to the Underwriters. It is expected that the Bonds will be available for delivery to DTC in New York, New York on or about December 19, 2019. RBC Capital Markets Great Pacific Securities 280 Securities LLC Academy Securities, Inc. Alamo Capital Caldwell Sutter Capital Inc. FHN Financial Capital Markets Jefferies Morgan Stanley & Co. LLC Stifel, Nicolaus & Company, Incorporated UBS Financial Services Inc. Dated: December 5, 2019
Transcript of California Infrastructure and Economic Development Bank

New Issue - Book-Entry Only Ratings: Moody’s: “A1”S&P: “A+”
Fitch: “AA” See “RATINGS” herein
In the opinion of Orrick, Herrington & Sutcliffe LLP, Bond Counsel to the California Infrastructure and Economic Development Bank, based upon an analysis of existing laws, regulations, rulings and court decisions, and assuming, among other matters, the accuracy of certain representations and compliance with certain covenants, interest on the Bonds is excluded from gross income for federal income tax purposes under Section 103 of the Internal Revenue Code of 1986 (the “Code’’) and is exempt from State of California personal income taxes. In the further opinion of Bond Counsel, interest on the Bonds is not a specific preference item for purposes of the federal alternative minimum tax. Bond Counsel expresses no opinion regarding any other tax consequences related to the ownership or disposition of, or the amount, accrual or receipt of interest on, the Bonds. See “TAX MATTERS” herein.
$272,605,000CALIFORNIA INFRASTRUCTURE AND ECONOMIC DEVELOPMENT BANK
LEASE REVENUE BONDS(CALIFORNIA STATE TEACHERS’ RETIREMENT SYSTEM HEADQUARTERS EXPANSION),
SERIES 2019 (GREEN BONDS - CLIMATE BOND CERTIFIED)
Dated: Date of Delivery Due: August 1, as shown on the inside cover
California Infrastructure and Economic Development Bank (the “Infrastructure Bank”) is expected to offer $272,605,000 aggregate principal amount of its Lease Revenue Bonds (California State Teachers’ Retirement System Headquarters Expansion), Series 2019 (Green Bonds - Climate Bond Certified) (the “Bonds”). The proceeds of the sale of the Bonds will be used to provide funds to (i) construct, furnish and equip an expansion to the existing headquarters of the California State Teachers’ Retirement System (“CalSTRS”) (the “Project”) in the City of West Sacramento, California; (ii) pay capitalized interest with respect to the Bonds through February 1, 2023; and (iii) pay costs of issuance of the Bonds. See “THE PROJECT” and “ESTIMATED SOURCES AND USES OF FUNDS” herein.
The Bonds are being issued under and pursuant to the Constitution and laws of the State of California (the “State”), particularly the Bergeson-Peace Infrastructure and Economic Development Bank Act (California Government Code Section 63000 and following) (as now in effect and as it may from time to time hereafter be amended or supplemented, the “Act”), and a Trust Agreement, dated as of December 1, 2019 (the “Trust Agreement”), between the Infrastructure Bank and The Bank of New York Mellon Trust Company, N.A., as trustee (the “Trustee”). The Bonds are limited obligations of the Infrastructure Bank, payable solely from Revenues as defined in the Trust Agreement, which consist primarily of base rental payments (“Base Rental Payments”) payable by CalSTRS to the Infrastructure Bank pursuant to a Facility Lease, dated as of December 1, 2019 (the “Facility Lease”), and available amounts in certain funds and accounts established under the Trust Agreement, as more particularly described herein. The Base Rental Payments to be made by CalSTRS to the Infrastructure Bank pursuant to the Facility Lease will be in amounts calculated to be sufficient to pay the principal of and interest on the Bonds when due.
Base Rental Payments are payable by CalSTRS from any amounts legally available therefor, including but not limited to available amounts in the State Teachers’ Retirement Plan, as more particularly described herein. The obligation of CalSTRS to make Base Rental Payments does not commence until the date construction of the Project is substantially complete as specified in the Facility Lease, which is currently expected to occur no later than July 6, 2022, and thereafter is subject to abatement of Base Rental Payments in the event of material damage to or destruction of the Project or a taking of the Project in whole or in part under eminent domain. See “SECURITY AND SOURCES OF PAYMENT FOR THE BONDS” herein.
This cover page contains information for quick reference only. Investors must read this entire Official Statement to obtain information essential to the making of an informed investment decision.
See “INVESTMENT CONSIDERATIONS” herein for a description of certain factors that should be considered by investors in deciding whether to purchase the Bonds.
THE BONDS SHALL NOT CONSTITUTE A DEBT OR LIABILITY OF THE STATE OR ANY POLITICAL SUBDIVISION THEREOF (OTHER THAN THE LIMITED OBLIGATION OF THE INFRASTRUCTURE BANK PAYABLE SOLELY FROM REVENUES AND THE OTHER AMOUNTS PLEDGED THEREFOR UNDER THE TRUST AGREEMENT), OR A PLEDGE OF THE FAITH AND CREDIT OF THE STATE OR ANY POLITICAL SUBDIVISION THEREOF, BUT SHALL BE PAYABLE SOLELY FROM THE FUNDS PROVIDED THEREFOR IN THE TRUST AGREEMENT. NEITHER THE FAITH AND CREDIT NOR THE TAXING POWER OF THE STATE IS PLEDGED TO THE PAYMENT OF THE PRINCIPAL OF, OR INTEREST ON THE BONDS; AND NO OWNER OR BENEFICIAL OWNER OF ANY BOND SHALL HAVE ANY RIGHT TO DEMAND PAYMENT OF THE PRINCIPAL OF, OR INTEREST ON, THE BONDS BY THE INFRASTRUCTURE BANK, THE STATE OR ANY POLITICAL SUBDIVISION THEREOF, OUT OF ANY FUNDS TO BE RAISED BY TAXATION OR APPROPRIATION. THE ISSUANCE OF THE BONDS SHALL NOT DIRECTLY OR INDIRECTLY OR CONTINGENTLY OBLIGATE THE STATE OR ANY POLITICAL SUBDIVISION THEREOF TO LEVY OR TO PLEDGE ANY FORM OF TAXATION THEREFOR OR TO MAKE ANY APPROPRIATION FOR THEIR PAYMENT.
The Bonds will be subject to optional, extraordinary, and mandatory sinking fund redemption prior to their stated maturities, as described herein.
The Bonds will be issued as fully registered bonds without coupons in denominations of $5,000 and any multiple thereof. The Bonds will bear interest from the Date of Delivery, payable semiannually on each February 1 and August 1, commencing February 1, 2020 (each, an “Interest Payment Date”). The Bonds will be initially registered in the name of Cede & Co., as registered owner and nominee for The Depository Trust Company, New York, New York (“DTC”). DTC will act as securities depository for the Bonds. So long as Cede & Co. is the registered owner of the Bonds, references herein to the Owners of the Bonds shall mean Cede & Co. and will not mean the beneficial owner of the Bonds. So long as Cede & Co. is the registered owner of the Bonds, the payment of principal of and interest on the Bonds will be made to Cede & Co., which will in turn be responsible for making such payments to its participants for subsequent disbursement to the beneficial owners. See “THE BONDS” herein.
The Bonds are offered when, as, and if received by the Underwriters, subject to the approval as to legality by Orrick, Herrington & Sutcliffe LLP, Bond Counsel to the Infrastructure Bank. Certain legal matters will be passed upon for the Infrastructure Bank by its Senior Staff Counsel; for CalSTRS by its Office of General Counsel and Stradling Yocca, Carlson & Rauth, a Professional Corporation, Disclosure Counsel to CalSTRS, and for the Underwriters by Hawkins Delafield & Wood LLP, counsel to the Underwriters. It is expected that the Bonds will be available for delivery to DTC in New York, New York on or about December 19, 2019.
RBCCapitalMarkets GreatPacificSecurities 280 Securities LLC Academy Securities, Inc. Alamo Capital Caldwell Sutter Capital Inc. FHN Financial Capital Markets Jefferies Morgan Stanley & Co. LLC Stifel, Nicolaus & Company, Incorporated UBS Financial Services Inc.Dated: December 5, 2019

MATURITY AND PRICING SCHEDULE
$272,605,000 CALIFORNIA INFRASTRUCTURE AND ECONOMIC DEVELOPMENT BANK
LEASE REVENUE BONDS (CALIFORNIA STATE TEACHERS’ RETIREMENT SYSTEM HEADQUARTERS EXPANSION),
SERIES 2019 (GREEN BONDS - CLIMATE BOND CERTIFIED)
Maturity (August 1)
Principal Amount
Interest Rate Yield Price CUSIP†
2023 $5,125,000 4.000% 1.020% 110.553 13034RAA1 2024 5,330,000 4.000 1.070 113.162 13034RAB9 2025 5,545,000 4.000 1.170 115.339 13034RAC7 2026 5,765,000 5.000 1.250 123.741 13034RAD5 2027 6,055,000 5.000 1.340 126.416 13034RAE3 2028 6,355,000 5.000 1.430 128.843 13034RAF0 2029 6,675,000 5.000 1.540 130.815 13034RAG8 2030 7,010,000 5.000 1.620 129.985C 13034RAH6 2031 7,360,000 5.000 1.690 129.263C 13034RAJ2 2032 7,725,000 5.000 1.750 128.648C 13034RAK9 2033 8,115,000 5.000 1.800 128.139C 13034RAL7 2034 8,520,000 5.000 1.840 127.733C 13034RAM5 2035 8,945,000 5.000 1.890 127.228C 13034RAN3 2036 9,395,000 5.000 1.930 126.825C 13034RAP8 2037 9,860,000 5.000 1.970 126.424C 13034RAQ6 2038 10,355,000 5.000 2.000 126.124C 13034RAR4 2039 10,875,000 5.000 2.030 125.825C 13034RAS2
$63,080,000 5.000% Term Bonds due August 1, 2044; Yield 2.160% - Price: 124.539C; CUSIP† : 13034RAT0 $80,515,000 5.000% Term Bonds due August 1, 2049; Yield 2.210% - Price: 124.049C; CUSIP† : 13034RAU7
C Priced to August 1, 2029 call date at par.
† Copyright 2019, American Bankers Association. CUSIP® is a registered trademark of the American Bankers Association. The CUSIP data herein is provided by CUSIP Global Services (“CGS”), which is managed on behalf of the American Bankers Association by S&P Global Market Intelligence. The CUSIP numbers are not intended to create a database and do not serve in any way as a substitute for the CGS database. CUSIP numbers have been assigned by an independent company not affiliated with CalSTRS or the Infrastructure Bank and are provided solely for convenience and reference. The CUSIP numbers for a specific maturity are subject to change after the issuance of the Bonds. CalSTRS and the Infrastructure Bank do not take any responsibility for the accuracy of such numbers.

NOTICE TO INVESTORS
IN CONNECTION WITH THE OFFERING OF THE BONDS, THE UNDERWRITERS MAY OVERALLOT OR EFFECT TRANSACTIONS WHICH STABILIZE OR MAINTAIN THE MARKET PRICE OF THE BONDS OFFERED HEREBY AT LEVELS ABOVE THOSE WHICH MIGHT OTHERWISE PREVAIL IN THE OPEN MARKET. SUCH STABILIZING, IF COMMENCED, MAY BE DISCONTINUED AT ANY TIME. THE UNDERWRITERS MAY OFFER AND SELL THE BONDS TO CERTAIN DEALERS, INSTITUTIONAL INVESTORS AND OTHERS AT PRICES LOWER THAN THE PUBLIC OFFERING PRICES STATED ON THE INSIDE FRONT COVER PAGE HEREOF, AND SAID PUBLIC OFFERING PRICES MAY BE CHANGED FROM TIME TO TIME BY THE UNDERWRITERS.
No representation is made that past experience, as it might be shown by financial and other information, will necessarily continue or be repeated in the future. See “FORWARD-LOOKING STATEMENTS” herein.
No dealer, broker, salesperson, or any other person has been authorized to give any information or to make any representations other than those contained in this Official Statement in connection with the offering made hereby, and, if given or made, such information or representations must not be relied upon as having been authorized by the Infrastructure Bank, CalSTRS or the Underwriters. Neither the delivery of this Official Statement nor any sale hereunder will under any circumstances create any implication that there has been no change in the affairs of the Infrastructure Bank or CalSTRS since the date hereof. This Official Statement does not constitute an offer or solicitation in any jurisdiction in which such offer or solicitation is not authorized, or in which the person making such offer or solicitation is not qualified to do so, or to any person to whom it is unlawful to make such offer or solicitation.
THE BONDS HAVE NOT BEEN REGISTERED WITH THE SECURITIES AND EXCHANGE COMMISSION (THE “SEC”) UNDER THE SECURITIES ACT OF 1933, AS AMENDED, IN RELIANCE UPON AN EXEMPTION CONTAINED IN SUCH ACT. THE TRUST AGREEMENT HAS NOT BEEN QUALIFIED UNDER THE TRUST AGREEMENT ACT OF 1939, AS AMENDED, IN RELIANCE UPON AN EXEMPTION CONTAINED IN SUCH ACT.
THE BONDS HAVE NOT BEEN APPROVED OR DISAPPROVED BY THE SEC OR WITH ANY SECURITIES COMMISSION OR ANY REGULATORY AUTHORITY OF ANY STATE, NOR HAS THE SEC OR ANY STATE SECURITIES COMMISSION OR REGULATORY AUTHORITY PASSED UPON OR ENDORSED THE MERITS OF THIS OFFERING OR THE ACCURACY OR THE ADEQUACY OF THIS OFFICIAL STATEMENT. ANY REPRESENTATION TO THE CONTRARY IS A CRIMINAL OFFENSE.
The information set forth herein under the captions “THE INFRASTRUCTURE BANK” and “ABSENCE OF MATERIAL LITIGATION - The Infrastructure Bank” has been furnished by the Infrastructure Bank, and the information set forth herein under the caption “THE BONDS - Book-Entry Only System for the Bonds” hereto has been furnished by DTC. Such information is believed to be reliable but is not guaranteed as to accuracy or completeness and is not to be construed as a representation by the Infrastructure Bank or CalSTRS. All other information set forth herein has been obtained from CalSTRS and other sources that are believed to be reliable, but such information is not guaranteed as to accuracy or completeness and is not to be construed as a representation by CalSTRS. The information and expressions of opinion herein are subject to change without notice, and neither the delivery of this Official Statement nor any sale of the Bonds made hereunder shall create under any circumstances any indication that there has been no change in the affairs of the Infrastructure Bank, CalSTRS or DTC since the date hereof.
The Underwriters have provided the following sentence for inclusion in this Official Statement. The Underwriters have reviewed the information in this Official Statement in accordance with and as part of their respective responsibilities to investors under the federal securities laws as applied to the facts and circumstances of this transaction, but the Underwriters do not guarantee the accuracy or completeness of such information.
Statements in this Official Statement are made as of the date hereof unless stated otherwise and neither the delivery of this Official Statement at any time, nor any sales thereunder, shall under any circumstances create an implication that the information contained herein is correct as of any time subsequent to the date hereof.
The references to internet websites in this Official Statement are shown for reference and convenience only; unless explicitly stated to the contrary, the information contained within the websites and any links contained within those websites is not incorporated herein by reference and does not constitute part of this Official Statement.
In making an investment decision, investors must rely on their own examination of CalSTRS and the terms of the offering, including the merits and risks involved. Prospective investors should not construe the contents of this Official Statement as legal, tax or investment advice.

TABLE OF CONTENTS
Page
INTRODUCTORY STATEMENT ...................................................................................................................... 1 Plan of Finance .................................................................................................................................. 1 CalSTRS ............................................................................................................................................ 1 The Infrastructure Bank ..................................................................................................................... 1 Security for the Bonds ....................................................................................................................... 2
ESTIMATED SOURCES AND USES OF FUNDS ............................................................................................ 3 THE PROJECT ..................................................................................................................................................... 3
General ............................................................................................................................................... 3 Project Cost Summary ....................................................................................................................... 4 Environmental Benefits of the Project ............................................................................................... 4 Construction Arrangements ............................................................................................................... 4
DESIGNATION OF THE BONDS AS GREEN BONDS - CLIMATE BOND CERTIFIED ............................. 6 THE BONDS ........................................................................................................................................................ 7
General Description ........................................................................................................................... 7 Payment of the Bonds ........................................................................................................................ 7 Book-Entry Only System for the Bonds ............................................................................................ 7 Redemption ........................................................................................................................................ 8 Partial Redemption ............................................................................................................................. 9 Notice of Redemption ........................................................................................................................ 9 Effect of Redemption ......................................................................................................................... 9
DEBT SERVICE SCHEDULE ........................................................................................................................... 10 SECURITY AND SOURCES OF PAYMENT FOR THE BONDS .................................................................. 10
Limited Obligations ......................................................................................................................... 10 General ............................................................................................................................................. 11 Base Rental Payments ...................................................................................................................... 11 Reserve Fund ................................................................................................................................... 12 Abatement ........................................................................................................................................ 12 Insurance and Condemnation Awards ............................................................................................. 13 Insurance .......................................................................................................................................... 13 Additional Bonds ............................................................................................................................. 14 Limitations on the Issuance of Obligations Payable from Revenues ............................................... 15 Substitution of Leased Property ....................................................................................................... 15 Release of Personal Property ........................................................................................................... 16
THE INFRASTRUCTURE BANK .................................................................................................................... 16 THE CALIFORNIA STATE TEACHERS’ RETIREMENT SYSTEM ............................................................ 17
General ............................................................................................................................................. 17

The State Teachers’ Retirement Plan ............................................................................................... 18 Continuous Appropriation of Base Rental Payments ...................................................................... 19 Contributions .................................................................................................................................... 19 Actuarial Valuation .......................................................................................................................... 20 Other Obligations of CalSTRS Payable from the STRP .................................................................. 21 Certain Condensed Financial Information ....................................................................................... 22
INVESTMENT CONSIDERATIONS ............................................................................................................... 24 Limited Security ............................................................................................................................... 24 Construction Risks ........................................................................................................................... 24 Abatement ........................................................................................................................................ 26 Earthquake, Flood or Other Disasters .............................................................................................. 26 CalSTRS’ Investment Risks ............................................................................................................ 26 Operational Risks ............................................................................................................................. 27 Cybersecurity ................................................................................................................................... 28 Tax-Exempt Status of the Bonds ..................................................................................................... 28
ABSENCE OF MATERIAL LITIGATION ....................................................................................................... 29 The Infrastructure Bank ................................................................................................................... 29 CalSTRS .......................................................................................................................................... 29
TAX MATTERS................................................................................................................................................. 29 MUNICIPAL ADVISOR ................................................................................................................................... 31 UNDERWRITING ............................................................................................................................................. 31 FORWARD-LOOKING STATEMENTS .......................................................................................................... 31 RATINGS ........................................................................................................................................................... 32 LEGAL MATTERS ............................................................................................................................................ 32 FINANCIAL STATEMENTS ............................................................................................................................ 32 CONTINUING DISCLOSURE .......................................................................................................................... 33 MISCELLANEOUS ........................................................................................................................................... 34 APPENDIX A – CALSTRS COMPREHENSIVE ANNUAL FINANCIAL REPORT FOR THE
FISCAL YEAR ENDED JUNE 30, 2018 ............................................................................ A-1 APPENDIX B – INDEPENDENT AUDITOR’S REPORT, BASIC FINANCIAL STATEMENTS,
REQUIRED SUPPLEMENTARY INFORMATION AND OTHER SUPPLEMENTARY INFORMATION FOR THE FISCAL YEAR ENDED JUNE 30, 2019 ............................................................................................................................... B-1
APPENDIX C – 2019 REPORT TO LEGISLATURE ON THE PROGRESS OF THE CALSTRS FUNDING PLAN ................................................................................................................ C-1
APPENDIX D – CALSTRS 2019 REVIEW OF FUNDING LEVELS AND RISKS REPORT....................... D-1 APPENDIX E – DEFINED BENEFIT PROGRAM OF THE CALIFORNIA STATE TEACHERS’
RETIREMENT SYSTEM JUNE 30, 2018 ACTUARIAL VALUATION ......................... E-1 APPENDIX F – SUMMARY OF CERTAIN PROVISIONS OF THE PRINCIPAL LEGAL
DOCUMENTS ....................................................................................................................... F-1 APPENDIX G – PROPOSED FORM OF BOND COUNSEL OPINION ....................................................... G-1 APPENDIX H – FORM OF CONTINUING DISCLOSURE CERTIFICATE ............................................... H-1 APPENDIX I – BOOK-ENTRY ONLY SYSTEM FOR THE BONDS ........................................................... I-1 APPENDIX J – LETTERS SUBMITTED BY UNDERWRITERS .................................................................. J-1

CALIFORNIA INFRASTRUCTURE AND ECONOMIC DEVELOPMENT BANK
BOARD OF DIRECTORS
Lenny Mendonca, Chair Director of the California Governor's Office of Business and Economic Development
Fiona Ma, Member State of California Treasurer
David S. Kim, Member Secretary of the California State Transportation Agency
Keely Martin Bosler, Member Director of the California Department of Finance
Marc Steinorth, Member California Governor's Appointee
CALIFORNIA STATE TEACHERS’ RETIREMENT SYSTEM
TEACHERS’ RETIREMENT BOARD
Sharon Hendricks, Board Chair Harry M. Keiley, Board Vice Chair Elected Member Elected Member Keely Martin Bosler, Ex-Officio Member Dana Dillon, Elected Member Director of the California Department of Finance
Joy Higa, Public Representative Fiona Ma, Ex-Officio Member California Governor’s Appointee State of California Treasurer William Prezant, Public Representative Tony Thurmond, Ex-Officio Member California Governor’s Appointee State of California Superintendent of Public Instruction Nora E. Vargas, School Board Representative Karen Yamamoto, Retiree Representative California Governor’s Appointee California Governor’s Appointee
Betty Yee, Ex-Officio Member State of California Controller
PROFESSIONAL SERVICES
MUNICIPAL ADVISOR Montague DeRose and Associates, LLC
TRUSTEE The Bank of New York Mellon Trust Company, N.A.
BOND COUNSEL Orrick, Herrington & Sutcliffe LLP
DISCLOSURE COUNSEL Stradling Yocca Carlson & Rauth,
A Professional Corporation

1
OFFICIAL STATEMENT
$272,605,000 CALIFORNIA INFRASTRUCTURE
AND ECONOMIC DEVELOPMENT BANK LEASE REVENUE BONDS
(CALIFORNIA STATE TEACHERS’ RETIREMENT SYSTEM HEADQUARTERS EXPANSION), SERIES 2019 (GREEN BONDS - CLIMATE BOND CERTIFIED)
INTRODUCTORY STATEMENT
This Official Statement, including the cover page and the appendices hereto, furnishes certain information in connection with the sale by the California Infrastructure and Economic Development Bank (the “Infrastructure Bank”) of $272,605,000 aggregate principal amount of lease revenue bonds to be designated “California Infrastructure and Economic Development Bank Lease Revenue Bonds (California State Teachers’ Retirement System Headquarters Expansion), Series 2019 (Green Bonds - Climate Bond Certified)” (the “Bonds”). The Bonds will be issued by the Infrastructure Bank under and pursuant to the Constitution and laws of the State of California (the “State”), particularly the Bergeson-Peace Infrastructure and Economic Development Bank Act (California Government Code Section 63000 and following) (the “Act”), and a Trust Agreement, dated as of December 1, 2019 (the “Trust Agreement”), between the Infrastructure Bank and The Bank of New York Mellon Trust Company, N.A., as trustee (the “Trustee”).
Plan of Finance
The proceeds of the sale of the Bonds will be used to provide funds to (i) construct, furnish and equip an expansion to the existing headquarters of the California State Teachers’ Retirement System (“CalSTRS”) (the “Project”) in the City of West Sacramento, California; (ii) pay capitalized interest with respect to the Bonds through February 1, 2023; and (iii) pay costs of issuance of the Bonds. See “ESTIMATED SOURCES AND USES OF FUNDS” herein.
The Project is a ten level, approximately 510,000 square foot structure, consisting of a five level, approximately 260,000 square foot office structure atop a five level, approximately 250,000 square foot parking structure. The office structure includes approximately 36,000 square feet of active ground floor for uses such as a childcare center, café, and general purpose rooms for use by employees and the public, as well as the building lobby. The Project will be located on an approximately 1.1 acre parcel. The Project is adjacent to, and will be connected with, CalSTRS’ existing headquarters building. See “THE PROJECT” herein.
CalSTRS
CalSTRS, a component unit of the State, provides pension benefits (including disability and survivor benefits) to full-time and part-time public school educators in the State from pre-kindergarten through community college and certain other employees of the public school system. CalSTRS administers a hybrid retirement system, which includes the State Teachers’ Retirement Plan, which, as of June 30, 2019, had total net assets of approximately $238.9 billion. As of June 30, 2019, CalSTRS is the largest educator-only pension fund in the world and the second largest public pension fund in the United States. See “THE CALIFORNIA STATE TEACHERS’ RETIREMENT SYSTEM” herein.
The Infrastructure Bank
The Infrastructure Bank is an entity within the Governor’s Office of Business and Economic Development in the State, organized and existing pursuant to the Act. The Infrastructure Bank is authorized and empowered pursuant to the Act to issue the Bonds, to provide the proceeds thereof to CalSTRS, to secure the Bonds by a pledge of the amounts payable by CalSTRS under the Facility Lease, dated as of December 1,

2
2019 (the “Facility Lease”), between CalSTRS and the Infrastructure Bank, and any available amounts held in the Revenue Fund established pursuant to the Trust Agreement, and to enter into the Facility Lease and the Trust Agreement. See “THE INFRASTRUCTURE BANK” herein.
Security for the Bonds
The Bonds are payable from Revenues as set forth in the Trust Agreement, consisting primarily of base rental payments (the “Base Rental Payments”) payable by CalSTRS pursuant to the Facility Lease. Pursuant to the Trust Agreement, the Infrastructure Bank has also pledged amounts available in the Revenue Fund established pursuant to the Trust Agreement, including the Capitalized Interest Account.
Concurrently with the issuance of the Bonds, CalSTRS will lease the site on which the Project is to be located (the “Site”) to the Infrastructure Bank pursuant to a Site Lease, dated as of December 1, 2019 (the “Site Lease”). The Infrastructure Bank will then lease the Site and the Project (collectively, the “Demised Premises”) back to CalSTRS pursuant to the Facility Lease. The Base Rental Payments to be made by CalSTRS pursuant to the Facility Lease are payable in an amount equal to scheduled interest and principal payments with respect to the Bonds. Base Rental Payments are payable by CalSTRS to the Infrastructure Bank for the use and possession by CalSTRS of the Project from any funds legally available therefor, including but not limited to available amounts in the State Teachers’ Retirement Plan. The obligation of CalSTRS to make Base Rental Payments does not commence until the date construction of the Project is substantially complete, which is currently expected to occur no later than July 6, 2022, and thereafter is subject to abatement of such Base Rental Payments in the event of material damage to or destruction of the Project or a taking of the Project in whole or in part under eminent domain. Prior to the date that the Project is substantially complete, Revenues will consist solely of amounts available in the Capitalized Interest Account.
The Infrastructure Bank, pursuant to the Trust Agreement, will transfer, assign and set over to the Trustee all of the Revenues and any and all rights and privileges (other than the Infrastructure Bank’s right to receive Additional Payments, the Infrastructure Bank’s rights to indemnification under the Facility Lease and the Site Lease, and the Infrastructure Bank’s right to reports and information under the Facility Lease) it has under the Facility Lease, including, without limitation, the right to receive directly all of the Revenues and the right to enforce any rights and remedies of the Infrastructure Bank under the Site Lease and the Facility Lease. See “SECURITY AND SOURCES OF PAYMENT FOR THE BONDS” herein.
The Trust Agreement also provides for the issuance of Additional Bonds secured by the Revenues, subject to the satisfaction of the conditions set forth in the Trust Agreement. See “SECURITY AND SOURCES OF PAYMENT FOR THE BONDS – Additional Bonds” herein.
THE BONDS SHALL NOT CONSTITUTE A DEBT OR LIABILITY OF THE STATE OR ANY POLITICAL SUBDIVISION THEREOF (OTHER THAN THE LIMITED OBLIGATION OF THE INFRASTRUCTURE BANK PAYABLE SOLELY FROM REVENUES AND THE OTHER AMOUNTS PLEDGED THEREFOR UNDER THE TRUST AGREEMENT), OR A PLEDGE OF THE FAITH AND CREDIT OF THE STATE OR ANY POLITICAL SUBDIVISION THEREOF, BUT SHALL BE PAYABLE SOLELY FROM THE FUNDS PROVIDED THEREFOR IN THE TRUST AGREEMENT. NEITHER THE FAITH AND CREDIT NOR THE TAXING POWER OF THE STATE IS PLEDGED TO THE PAYMENT OF THE PRINCIPAL OF, OR INTEREST ON, THE BONDS; AND NO OWNER OR BENEFICIAL OWNER OF ANY BOND SHALL HAVE ANY RIGHT TO DEMAND PAYMENT OF THE PRINCIPAL OF, OR INTEREST ON, THE BONDS BY THE INFRASTRUCTURE BANK, THE STATE OR ANY POLITICAL SUBDIVISION THEREOF, OUT OF ANY FUNDS TO BE RAISED BY TAXATION OR APPROPRIATION. THE ISSUANCE OF THE BONDS SHALL NOT DIRECTLY OR INDIRECTLY OR CONTINGENTLY OBLIGATE THE STATE OR ANY POLITICAL SUBDIVISION THEREOF TO LEVY OR TO PLEDGE ANY FORM OF TAXATION THEREFOR OR TO MAKE ANY APPROPRIATION FOR THEIR PAYMENT.

3
NOTWITHSTANDING ANYTHING CONTAINED IN THIS OFFICIAL STATEMENT, THE INFRASTRUCTURE BANK SHALL NOT BE REQUIRED TO ADVANCE ANY MONEYS DERIVED FROM ANY SOURCE OF INCOME OTHER THAN THE REVENUES AND ADDITIONAL PAYMENTS, FOR ANY OF THE PURPOSES DESCRIBED IN THIS OFFICIAL STATEMENT, INCLUDING THE PAYMENT OF THE PRINCIPAL OF OR INTEREST ON THE BONDS. THE BONDS ARE NOT GENERAL OBLIGATIONS OF THE INFRASTRUCTURE BANK, AND ARE PAYABLE FROM AND SECURED ONLY BY THE REVENUES AND THE OTHER ASSETS PLEDGED FOR SUCH PAYMENT UNDER THE TRUST AGREEMENT.
ESTIMATED SOURCES AND USES OF FUNDS
The following table sets forth the estimated sources and uses of funds in connection with the issuance of the Bonds.
Sources Principal Amount $272,605,000.00 Original Issue Premium 67,983,071.75
Total Sources $340,588,071.75 Uses Deposit to Acquisition and Construction Fund(1) $297,245,561.04 Deposit to Capitalized Interest Account 40,811,980.19 Costs of Issuance(2) 2,530,530.52
Total Uses $340,588,071.75 (1) The Acquisition and Construction Fund will be held by CalSTRS, and is not pledged to payment of the Bonds.
See “SECURITY AND SOURCES OF PAYMENT FOR THE BONDS.” (2) Includes underwriters’ discount, legal costs and expenses and other costs of issuance.
THE PROJECT
General
The Project is a ten level, approximately 510,000 square foot structure, consisting of a five level, approximately 260,000 square foot office structure atop a five level, approximately 250,000 square foot parking structure. The office structure includes approximately 36,000 square feet of active ground floor for uses such as a childcare center, café, and general purpose rooms for use by employees and the public, as well as the building lobby. The parking structure portion of the Project is an extension of an existing garage and will provide approximately 450 additional parking spaces. At full utilization, approximately 1,200 CalSTRS employees are expected to work in the structure. The Project will be physically connected to CalSTRS’ existing headquarters on the ground floor and by a pedestrian bridge on an upper floor.
CalSTRS’ existing headquarters was completed in 2009. Construction costs were paid from then-current available funds of CalSTRS. The existing headquarters was completed within the construction budget and the construction schedule.

4
Project Cost Summary
The table below is a summary of the costs of the Project:
Project Cost Summary
Hard Costs(1) $240,897,497 Hard Cost Contingency 7,141,879 Total GMP(2) $248,039,376 Soft Costs (3) 44,104,938 Owner Contingency(4) 7,855,686 Overall Project Cost $300,000,000
______________________ (1) Includes site work, construction of core and shell, tenant improvements and general conditions
and liability insurance. (2) Guaranteed Maximum Price. See “Construction Arrangements” below. (3) Includes architect and engineering fees, pre-development consultant fees, development
management fees, test, inspection and permit fees, IT/AV, Furniture, Fixture and Equipment costs and moving expenses.
(4) Contingency funds to be maintained by CalSTRS.
Environmental Benefits of the Project
The Project has been designed to meet a number of different environmental standards, including Leadership in Energy and Environmental Design (“LEED”) standards issued by the U.S. Green Building Council, WELL Building Standard version 2 (“WELL”) issued by the International WELL Building Institute and Living Building Challenge Petal Certification (“LBC”) issued by the International Living Future Institute. CalSTRS anticipates the new building will achieve LEED Platinum, WELL Gold and LBC Materials, Beauty and Place Petals, respectively. Although CalSTRS currently intends to apply for these certifications once the Project is completed, it is not obligated to do so.
The Project will also include onsite renewable energy to assist CalSTRS in achieving a zero net energy facility which will provide more efficient mechanical, electrical and plumbing systems while minimizing maintenance costs for the building. See “DESIGNATION OF THE BONDS AS GREEN BONDS – CLIMATE BOND CERTIFIED” herein.
Construction Arrangements
CalSTRS has entered into an agreement (the “Construction Contract”) with DPR Construction (the “Construction Contractor”) for the construction of the Project. The Construction Contractor has significant experience in the construction of large scale projects, including office buildings, hospitals and other medical facilities, hotels and manufacturing facilities.
Guaranteed Completion Date. Pursuant to the Construction Contract, the Construction Contractor is obligated to cause the Project to be developed, constructed and installed in accordance with plans and specifications provided by CalSTRS and set forth in the Construction Contract. The Construction Contractor is required to complete the Project no later than July 6, 2022 (the “Guaranteed Completion Date”), which date is subject to extension for a variety of circumstances described in the Construction Contract, as described below under “- Adjustment to the Guaranteed Completion Date and Guaranteed Maximum Price.” The Construction Contractor is responsible for the payment of liquidated damages in the event of the unexcused failure of the Construction Contractor to complete the Project by the Guaranteed Completion Date in an amount equal to $2,500 for each day of the unexcused delay, up to an amount equal to 25 percent of the total
5
fee payable to the Construction Contractor. (Such liquidated damage payments are not pledged to payment of debt service with respect to the Bonds.)
Pursuant to the Facility Lease, the obligation of CalSTRS to pay Base Rental Payments does not commence until the Project is substantially complete. A portion of the proceeds of the Bonds will be used to fund capitalized interest with respect to the Bonds through and including the February 1, 2023 Base Rental Payment.
Guaranteed Maximum Price. The Construction Contract provides for a guaranteed maximum price (the “Guaranteed Maximum Price”) of $248,039,376. The Guaranteed Maximum Price was finalized in November 2019 after completion of 90 percent of the plans and specification for the Project, and includes a $7,141,879 construction contingency. The Guaranteed Maximum Price is subject to increase for a variety of circumstances specified in the Construction Contract as described below.
Adjustment to the Guaranteed Completion Date and Guaranteed Maximum Price. The Construction Contract provides that the Construction Contractor is entitled to extensions of the Guaranteed Completion Date and increases to the Guaranteed Maximum Price for a variety of reasons, including but not limited to the following: CalSTRS change orders; labor disputes; strikes; unusual delays in deliveries; fire; unavoidable casualties; national emergency; inclement weather days in excess of an allowance therefor in the Construction Contract; acts or omissions of CalSTRS or its agents, including the architect retained by CalSTRS to provide the plans and specifications for the Project; and acts or inactions of governmental authorities for which the Construction Contractor is not responsible.
A portion of the proceeds of the Bonds in an amount sufficient to pay interest with respect to the Bonds through February 1, 2023 will be deposited in the Capitalized Interest Account on the date of issuance of the Bonds. In the event that the Project is not substantially complete by that date for any reason (including but not limited to circumstances which will result in an extension of the Guaranteed Completion Date), CalSTRS will not be obligated to make Base Rental Payments, and no funds will be available for payment of debt service with respect to the Bonds. See “INVESTMENT CONSIDERATIONS – Construction Risks” herein.
Performance Bond; Insurance. Pursuant to the Construction Contract, prior to commencement of construction, the Construction Contractor is required to obtain a performance bond in an amount equal to the Guaranteed Maximum Price. The Construction Contract also requires the Construction Contractor to obtain and maintain a variety of insurance coverage, including $25 million commercial general liability ($5 million each occurrence); $25 million excess liability; and $5 million commercial automobile insurance.
Under the Construction Contract, CalSTRS is required to maintain property insurance with respect to the Project either by including the Project on CalSTRS’ existing policies or by obtaining a “builder’s risk” policy that covers building materials and equipment that become part of the Project. The insurance is required to cover the full insurable value of the Project. See “INVESTMENT CONSIDERATIONS – Construction Risks.”
Permits. All permits necessary for the commencement of construction of the Project have been obtained. The Construction Contractor and CalSTRS will be required to obtain a number of additional permits from time to time throughout the course of construction of the Project. However, CalSTRS is not aware of any reason to expect that such additional permits will not be issued in a timely basis.
Construction Monitoring. CalSTRS has retained the services of Ridge Capital, Inc. (the “Construction Monitor”) to provide oversight services for Project design, local and State jurisdictional approvals, and the construction process. The construction monitoring activities include a regular onsite presence of the Construction Monitor to verify work progress and quality, to resolve issues which may arise, and to monitor the construction budget. In addition, CalSTRS has established an internal Project governance plan to guide the

6
decision-making process for the Project which includes oversight for Project participation, authority levels and reporting.
DESIGNATION OF THE BONDS AS GREEN BONDS - CLIMATE BOND CERTIFIED
CalSTRS’ vision includes advancing sustainability practices that promote long-term value creation and stewardship of our natural resources. CalSTRS’ guiding beliefs also support sustainability programs that build environmental, social and governance principles into the core business and investment practices. With CalSTRS’ vision and guiding beliefs in mind, the Project is designed to support green building practices, including green technologies, sustainable construction, energy conservation and whole-building integrated energy efficiency measures as well as employee wellness goals.
The information set forth below concerning (i) the Climate Bonds Initiative (“CBI”) and the process for obtaining certification from CBI, and (ii) Kestrel Verifiers in its role as a verifier with respect to the certification of the Bonds as Climate Bond Certified, all as more fully described below, has been extracted from materials provided by CBI and Kestrel Verifiers, respectively, for such purposes, and none of such information is guaranteed as to accuracy or completeness or is to be construed as a representation by CalSTRS, the Infrastructure Bank or the Underwriters. Additional information relating to CBI and the certification process can be found at www.climatebonds.net. The CBI website is included for reference only and the information contained therein is not incorporated by reference in this Official Statement.
In connection with the Bonds and the Project, CalSTRS applied to CBI for designation of the Bonds as “Climate Bond Certified.” CBI is an independent not-for-profit organization that works solely on mobilizing the bond market for climate change solutions. CBI established a certification program that provides standards for eligible projects to be considered a Green Bond. In CBI’s view, the standards use credible, science-based, widely supported guidelines about what should and should not be considered a qualifying investment to assist investors in making informed decisions about the environmental credentials of a bond. In order to receive the CBI certification, CalSTRS engaged Kestrel Verifiers, a third-party CBI-approved verifier, to provide verification to CalSTRS and CBI that the Bonds meet the CBI standards. Kestrel Verifiers reviewed and provided verification to CBI, and CBI certified the Bonds on October 21, 2019. The certification will require annual reporting by CalSTRS to CBI to ensure ongoing eligibility for the certification.
CalSTRS is a member of the CBI Standards Board, which establishes standards used for certification. However, CalSTRS is not a member of and does not sit on the CBI Certification Board and does not assist in CBI’s decision-making process for who should receive certifications.
The terms “Climate Bond Certified” and “Green Bonds” are not defined in the Trust Agreement, the Facility Lease, or other legal documents executed by CalSTRS or the Infrastructure Bank in connection with the issuance of the Bonds. The terms “Climate Bond Certified” and “Green Bonds” are solely for identification purposes and is not intended to provide or imply that the owners of the Bonds are entitled to any security other than that described under the heading “SECURITY AND SOURCES OF PAYMENT FOR THE BONDS.” CalSTRS makes no representation that every component of the Project being financed with the Bonds meets the requirements for “Climate Bond Certified” or “Green Bond” classification. Although CalSTRS currently intends to comply with CBI’s certification requirements, it is not obligated to do so and assumes no obligation to ensure compliance with any legal or other principles of Climate Bond Certified Green Bonds as such principles may evolve over time.
CBI has provided the following paragraphs for inclusion in this Official Statement.
The certification of the Bonds as Climate Bonds by CBI is based solely on the Climate Bond Standard and does not, and is not intended to, make any representation or give any assurance with respect to any other matter relating to the Bonds or the Project, including but not limited to this Official Statement, the transaction documents, CalSTRS or the management of CalSTRS.

7
The certification of the Bonds as Climate Bonds by the Climate Bonds Initiative was addressed solely to the CalSTRS Board and is not a recommendation to any person to purchase, hold or sell the Bonds and such certification does not address the market price or suitability of the Bonds for a particular investor. The certification also does not address the merits of the decision by CalSTRS or any third party to participate in any nominated project and does not express and should not be deemed to be an expression of an opinion as to CalSTRS or any aspect of the Project (including but not limited to the financial viability of the Project) other than with respect to conformance with CBI’s standards for Certified Climate Bonds.
In issuing or monitoring, as applicable, the certification, CBI and Kestrel Verifiers have assumed and relied upon and will assume and rely upon the accuracy and completeness in all material respects of the information supplied or otherwise made available to CBI. CBI does not assume or accept any responsibility to any person (including purchasers of the Bonds) for independently verifying (and it has not verified) such information or to undertake (and it has not undertaken) any independent evaluation of any nominated project or the Borrower. In addition, CBI does not assume any obligation to conduct (and it has not conducted) any physical inspection of the Project. The certification may only be used with the Bonds and may not be used for any other purpose without CBI’s prior written consent.
The certification does not and is not in any way intended to address the likelihood of timely payment of interest when due on the Bonds and/or the payment of principal at maturity or any other date.
The certification may be withdrawn at any time in CBI’s sole and absolute discretion and there can be no assurance that such certification will not be withdrawn.
THE BONDS
General Description
The Bonds will be dated the Date of Delivery and will mature on the dates shown on the inside cover page of this Official Statement, subject to optional, extraordinary and mandatory sinking fund redemption provisions. The Bonds will bear interest at the rates shown on the inside cover page of this Official Statement, payable initially on February 1, 2020, and semi-annually thereafter on each February 1 and August 1 (collectively, the “Interest Payment Dates” and each, an “Interest Payment Date”). The Bonds shall bear interest from their date of issuance.
Interest on the Bonds will be computed on the basis of a 360-day year consisting of twelve (12) 30-day months. The Bonds will be issued as fully registered bonds without coupons in denominations of five thousand dollars ($5,000) and any multiple thereof.
Payment of the Bonds
While DTC or its nominee is owner of the Bonds, all payments of principal of and interest on the Bonds will be paid to DTC or its nominee by wire transfer. See “Book-Entry Only System for the Bonds” below.
Book-Entry Only System for the Bonds
DTC will act as securities depository for the Bonds. The ownership of one fully registered Bond for each maturity set forth on the cover page hereof, in the aggregate principal amount of the Bonds maturing on that date, will be registered in the name of Cede & Co., as nominee of DTC. Sec APPENDIX I -“BOOK-ENTRY ONLY SYSTEM FOR THE BONDS” herein for a description of DTC and the Book-Entry Only System.

8
Redemption
Extraordinary Redemption. The Bonds are subject to redemption on any date prior to their respective stated maturities, as a whole, or in part by lot within each stated maturity in integral multiples of five thousand dollars ($5,000), from prepayments made by CalSTRS from insurance and eminent domain proceeds, and from proceeds of title insurance, at a prepayment price equal to the sum of the principal amount thereof, without premium, plus accrued interest thereon to the redemption date. Whenever less than all of the outstanding Bonds are to be redeemed on any one date, the Trustee shall select the Bonds to be redeemed in part from the outstanding Bonds from such maturities selected by the Infrastructure Bank, provided that the aggregate annual debt service on Bonds which shall be payable after such redemption date shall be as nearly proportional as practicable to the aggregate annual debt service on Bonds Outstanding prior to such redemption date.
Mandatory Sinking Fund Redemption. The Bonds maturing on August 1, 2044, upon notice as hereinafter provided, shall also be subject to mandatory sinking fund redemption prior to maturity, in part on August 1 of each year on and after August 1, 2040 by lot, from and in the amount of the Mandatory Sinking Account Payments set forth below at a redemption price equal to the sum of the principal amount thereof plus accrued interest thereon to the redemption date, without premium.
Payment Date
(August 1) Amount 2040 $11,415,000 2041 11,990,000 2042 12,585,000 2043 13,215,000 2044 (maturity) 13,875,000
The Bonds maturing on August 1, 2049, upon notice as hereinafter provided, shall also be subject to mandatory sinking fund redemption prior to maturity, in part on August 1 of each year on and after August 1, 2045 by lot, from and in the amount of the Mandatory Sinking Account Payments set forth below at a redemption price equal to the sum of the principal amount thereof plus accrued interest thereon to the redemption date, without premium.
Payment Date
(August 1) Amount 2045 $14,570,000 2046 15,300,000 2047 16,065,000 2048 16,870,000 2049 (maturity) 17,710,000
Optional Redemption. The Bonds maturing on or after August 1, 2030 are also subject to redemption prior to their respective stated maturities from any moneys deposited by the Infrastructure Bank or CalSTRS, as a whole or in part on any date (in such maturities as are designated in writing by the Infrastructure Bank to the Trustee) on or after August 1, 2029, at the redemption price of 100% of the principal amount thereof, together with accrued interest to the date fixed for redemption.

9
Partial Redemption
If less than all Outstanding Bonds maturing by their terms on any one date are to be redeemed at any one time, the Trustee shall select the Bonds of such maturity date to be redeemed in any manner that it deems appropriate and fair and shall promptly notify the Infrastructure Bank in writing of the numbers of the Bonds so selected for redemption. For purposes of such selection, Bonds shall be deemed to be composed of $5,000 multiples of principal, and any such multiple may be separately redeemed.
Notice of Redemption
Notice of redemption shall be mailed by first-class mail by the Trustee, not less than twenty (20) nor more than sixty (60) days prior to the redemption date to (i) the respective Holders of the Bonds designated for redemption at their addresses appearing on the registration books of the Trustee, (ii) the Municipal Securities Rulemaking Board, (iii) the Securities Depositories and (iv) one or more Information Services. Notice of redemption to the Securities Depositories and the Information Services shall be given by registered mail, electronic mail or overnight delivery or facsimile transmission. Each notice of redemption shall state the date of such notice, the redemption price, the name and appropriate address of the Trustee, the CUSIP number (if any) of the maturity or maturities, and, if less than all of any such maturity is to be redeemed, the distinctive certificate numbers of the Bonds of such maturity to be redeemed and, in the case of Bonds to be redeemed in part only, the respective portions of the principal amount to be redeemed. Each such notice shall also state that on said date there will become due and payable on each of said Bonds the redemption price thereof and in the case of a Bond to be redeemed in part only, the specified portion of the principal amount to be redeemed, together with interest accrued thereon to the redemption date, and that from and after such redemption date interest thereon shall cease to accrue, and shall require that such Bonds be then surrendered at the address of the Trustee specified in the redemption notice. Failure to receive such notice shall not invalidate any of the proceedings taken in connection with such redemption.
The Trustee’s notice of redemption with respect to an optional redemption of Bonds shall provide that such redemption is conditional upon receipt by the Trustee of sufficient moneys to redeem the Bonds or portion thereof, including moneys to pay any redemption premium (a “Conditional Redemption”). The Trustee shall rescind any Conditional Redemption if sufficient moneys have not been deposited with the Trustee on or before the redemption date. The Trustee shall give notice of rescission to the Owners of any Bonds designated for redemption by the same means and in the same manner described in the preceding paragraph. The optional redemption shall be canceled once the Trustee has given notice of rescission. Any portion of the Bonds subject to Conditional Redemption where such redemption has been rescinded shall remain Outstanding, and neither the rescission nor the failure of funds being made available in part or in whole on or before the redemption date shall constitute an Event of Default as defined in the Trust Agreement.
Effect of Redemption
If notice of redemption has been duly given as aforesaid and money for the payment of the redemption price of, together with interest accrued to the date fixed for redemption, the Bonds called for redemption is held by the Trustee, then on the redemption date designated in such notice Bonds so called for redemption shall become due and payable, and from and after the date so designated interest on such Bonds shall cease to accrue, and the Holders of such Bonds shall have no rights in respect thereof except to receive payment of the redemption price thereof.

10
DEBT SERVICE SCHEDULE
The following table shows the debt service schedule with respect to the Bonds.
Period Ending August 1 Principal Interest
Total Debt Service
2020 $8,306,654.17 $8,306,654.17 2021 13,470,250.00 13,470,250.00 2022 13,470,250.00 13,470,250.00 2023 $5,125,000 13,470,250.00 18,595,250.00 2024 5,330,000 13,265,250.00 18,595,250.00 2025 5,545,000 13,052,050.00 18,597,050.00 2026 5,765,000 12,830,250.00 18,595,250.00 2027 6,055,000 12,542,000.00 18,597,000.00 2028 6,355,000 12,239,250.00 18,594,250.00 2029 6,675,000 11,921,500.00 18,596,500.00 2030 7,010,000 11,587,750.00 18,597,750.00 2031 7,360,000 11,237,250.00 18,597,250.00 2032 7,725,000 10,869,250.00 18,594,250.00 2033 8,115,000 10,483,000.00 18,598,000.00 2034 8,520,000 10,077,250.00 18,597,250.00 2035 8,945,000 9,651,250.00 18,596,250.00 2036 9,395,000 9,204,000.00 18,599,000.00 2037 9,860,000 8,734,250.00 18,594,250.00 2038 10,355,000 8,241,250.00 18,596,250.00 2039 10,875,000 7,723,500.00 18,598,500.00 2040 11,415,000 7,179,750.00 18,594,750.00 2041 11,990,000 6,609,000.00 18,599,000.00 2042 12,585,000 6,009,500.00 18,594,500.00 2043 13,215,000 5,380,250.00 18,595,250.00 2044 13,875,000 4,719,500.00 18,594,500.00 2045 14,570,000 4,025,750.00 18,595,750.00 2046 15,300,000 3,297,250.00 18,597,250.00 2047 16,065,000 2,532,250.00 18,597,250.00 2048 16,870,000 1,729,000.00 18,599,000.00 2049 17,710,000 885,500.00 18,595,500.00 Total $272,605,000 $264,744,204.17 $537,349,204.17
SECURITY AND SOURCES OF PAYMENT FOR THE BONDS
Limited Obligations
THE BONDS SHALL NOT CONSTITUTE A DEBT OR LIABILITY OF THE STATE OR CALSTRS OR ANY POLITICAL SUBDIVISION THEREOF (OTHER THAN THE LIMITED OBLIGATION OF THE INFRASTRUCTURE BANK PAYABLE SOLELY FROM REVENUES AND THE OTHER AMOUNTS PLEDGED THEREFOR UNDER THE TRUST AGREEMENT), OR A PLEDGE OF THE FAITH AND CREDIT OF THE STATE OR ANY POLITICAL SUBDIVISION THEREOF, BUT SHALL BE PAYABLE SOLELY FROM THE FUNDS PROVIDED THEREFOR IN THE TRUST AGREEMENT. NEITHER THE FAITH AND CREDIT NOR THE TAXING POWER OF THE STATE IS PLEDGED TO THE PAYMENT OF THE PRINCIPAL OF, OR INTEREST ON, THE BONDS; AND NO OWNER OR BENEFICIAL OWNER OF ANY BOND SHALL HAVE ANY RIGHT TO DEMAND PAYMENT OF THE PRINCIPAL OF, OR INTEREST ON, THE BONDS BY THE INFRASTRUCTURE BANK, THE STATE OR ANY POLITICAL SUBDIVISION THEREOF,

11
OUT OF ANY FUNDS TO BE RAISED BY TAXATION OR APPROPRIATION. THE ISSUANCE OF THE BONDS SHALL NOT DIRECTLY OR INDIRECTLY OR CONTINGENTLY OBLIGATE THE STATE OR ANY POLITICAL SUBDIVISION THEREOF TO LEVY OR TO PLEDGE ANY FORM OF TAXATION THEREFOR OR TO MAKE ANY APPROPRIATION FOR THEIR PAYMENT.
NOTWITHSTANDING ANYTHING CONTAINED IN THIS OFFICIAL STATEMENT, THE INFRASTRUCTURE BANK SHALL NOT BE REQUIRED TO ADVANCE ANY MONEYS DERIVED FROM ANY SOURCE OF INCOME OTHER THAN THE REVENUES AND ADDITIONAL PAYMENTS (AS DEFINED HEREIN), FOR ANY OF THE PURPOSES DESCRIBED IN THIS OFFICIAL STATEMENT, INCLUDING THE PAYMENT OF THE PRINCIPAL OF OR INTEREST ON THE BONDS. THE BONDS ARE NOT GENERAL OBLIGATIONS OF THE INFRASTRUCTURE BANK, AND ARE PAYABLE FROM AND SECURED ONLY BY THE REVENUES AND THE OTHER ASSETS PLEDGED FOR SUCH PAYMENT UNDER THE TRUST AGREEMENT.
General
The Bonds are special limited obligations of the Infrastructure Bank payable solely from and secured solely by the Revenues pledged therefor in the Trust Agreement, together with amounts on deposit from time to time in the Revenue Fund held by the Trustee. “Revenues” means all Base Rental Payments received by the Trustee pursuant to the Facility Lease (but not Additional Payments (as defined herein)) and all interest or other income from any investment of any money in the Revenue Fund.
Under the Trust Agreement, the Infrastructure Bank irrevocably pledges all Revenues and any other amounts held by the Trustee in the Revenue Fund under the Trust Agreement to the payment of the interest and premium, if any, on and principal of the Bonds. The Revenues shall not be used for any other purpose while any of the respective Bonds remain Outstanding; provided, however, such revenues may be used for such purposes as are permitted under the Trust Agreement. The pledge of Revenues constitutes a pledge of and charge and lien upon the Revenues and all other moneys on deposit in the Revenue Fund established under the Trust Agreement for the payment of the interest on and principal of the Bonds in accordance with the terms of such Bonds and the Trust Agreement. The Infrastructure Bank also assigns to the Trustee all of the Infrastructure Bank’s rights and remedies under the Facility Lease.
Base Rental Payments
The Facility Lease requires CalSTRS to deposit with the Trustee, as assignee of the Infrastructure Bank, three Business Days prior to each February 1 and August 1, commencing on February 1, 2020 (each, a “Base Rental Payment Date” and, collectively, the “Base Rental Payment Dates”) (subject to the Certificate of Completion being delivered with respect to the Project) an amount equal to the Base Rental Payments coming due and payable on each such Base Rental Payment Date. As described herein, a portion of the proceeds of the Bonds in an amount equal to the Base Rental Payments payable through February 1, 2023 will be deposited in the Capitalized Interest Account in connection with the issuance of the Bonds.
The Base Rental Payments are payable in amounts set forth in a schedule to the Facility Lease. The scheduled Base Rental Payments are sufficient to pay the principal of and interest on the Bonds as such payments become due. The Base Rental Payments payable in any period constitute payment for the use and possession of the Project during such period.
Under the terms of the Facility Lease and applicable provisions of State law, CalSTRS is not obligated to commence making Base Rental Payments until the Project is substantially complete. If the Project is not substantially complete by February 1, 2023 (the period through which capitalized interest is being funded from the proceeds of the Bonds), CalSTRS will not be obligated to make Base Rental Payments during the period of delay, and that circumstance would have a material adverse effect on the payment of debt service with respect

12
to the Bonds. The obligation of CalSTRS to make Base Rental Payments is payable from any funds lawfully available therefor. The obligation of CalSTRS to make Base Rental Payments under the Facility Lease does not constitute an obligation of CalSTRS for which CalSTRS is obligated to levy or pledge any form of taxation or for which CalSTRS has levied or pledged any form of taxation. Neither the full faith and credit nor the taxing power of CalSTRS, the State or any of its political subdivisions is pledged to make Base Rental Payments under the Facility Lease. The Base Rental Payments are calculated to be sufficient to pay, when due, the principal of and interest on the Bonds.
Pursuant to the Facility Lease, CalSTRS represents that the Project is essential for CalSTRS to undertake its obligation (set forth in the State Constitution) to administer the System in a manner that will assure prompt delivery of benefits and related services to CalSTRS members and their beneficiaries. CalSTRS also represents that the Base Rental Payments and Additional Payments due under the Facility Lease are continuously appropriated under existing law without regard to fiscal years from the Teachers’ Retirement Fund, and that the authority to approve budgeted expenditure of resources for the Base Rental Payments will not be subject to either the CalSTRS or State’s annual budget process or require approval pursuant to the State Budget. Notwithstanding the foregoing, the Facility Lease provides that CalSTRS shall take such action, if any, as may be necessary to include all such Base Rental Payments and Additional Payments due in its annual budgets, and to make necessary annual appropriations for all such Base Rental Payments and Additional Payments. The Facility Lease provides that the covenants on the part of CalSTRS contained in the Facility Lease shall be deemed to be and shall be construed to be duties imposed by law and it shall be the duty of each and every public official of CalSTRS to take such action and do such things as are required by law in the performance of the official duty of such officials to enable CalSTRS to carry out and perform the covenants and agreements in the Facility Lease agreed to be carried out and performed by CalSTRS. See “THE CALIFORNIA STATE TEACHERS’ RETIREMENT SYSTEM – Continuous Appropriation of Base Rental Payments.”
State law requires, and the Facility Lease provides, that Base Rental Payments shall be abated in whole or in part during any period in which there is substantial interference with the possession or use of the Project by CalSTRS due to damage, destruction, title defect or taking in eminent domain proceedings. Under these circumstances, failure to make any Base Rental Payment will not be an Event of Default under the Facility Lease. See “-Abatement” below.
Base Rental Payments made by CalSTRS to the Trustee, as assignee of the Infrastructure Bank, are payable from any lawfully available funds of CalSTRS, including available amounts in the State Teachers’ Retirement Plan. The Facility Lease and the Trust Agreement require that Base Rental Payments be deposited in the Revenue Fund maintained by the Trustee, which fund is held for the benefit of the owners of the Bonds.
The Facility Lease also requires CalSTRS to pay certain additional amounts (“Additional Payments”) required by the Infrastructure Bank for the payment of all costs and expenses incurred by the Infrastructure Bank in connection with the execution, performance or enforcement of the Facility Lease, the Trust Agreement, the Site Lease and the issuance of the Bonds, as well as certain other costs.
Reserve Fund
No reserve fund is being established with respect to the Bonds.
Abatement
The Facility Lease provides for the abatement of Base Rental Payments and Additional Payments proportionately during any period in which by reason of any damage or destruction (other than by condemnation, as described below) there is substantial interference with the use and occupancy of the Project by CalSTRS, in the proportion in which the initial cost of that portion of the Project rendered unusable bears to the initial cost of the whole of the Project. Such abatement shall continue for the period commencing with such

13
damage or destruction and ending when such use and occupancy are restored. In the event of any such damage or destruction, the Facility Lease shall continue in full force and effect and CalSTRS waives any right to terminate the Facility Lease by virtue of any such damage or destruction.
If the whole of the Demised Premises or so much thereof as to render the remainder unusable for the purposes for which it was used by CalSTRS shall be taken under the power or threat of eminent domain, the term of the Facility Lease shall cease as of the day that possession shall be so taken. If less than the whole of the Demised Premises is taken under the power or threat of eminent domain and the remainder is usable for the purposes for which it was used by CalSTRS at the time of such taking, then the Facility Lease shall continue in full force and effect as to such remainder, and the parties to the Facility Lease waive the benefits of any law to the contrary, and in such event there shall be a partial abatement of the Base Rental Payments due under the Facility Lease in an amount equivalent to the amount by which the annual payments of principal of and interest on the Bonds then Outstanding will be reduced by the application of the award in eminent domain to the redemption of Outstanding Bonds. See “THE BONDS – Redemption – Extraordinary Redemption” above. So long as any of the Bonds shall be Outstanding, any award made in eminent domain proceedings for taking the Demised Premises and the Project or any portion thereof shall be paid to the Trustee and applied to the prepayment of the Base Rental Payments as a prepayment of Base Rental Payments. Any such award made after all of the Base Rental Payments and Additional Payments have been fully paid, or provision therefor made, shall be paid to CalSTRS.
Insurance and Condemnation Awards
In the event that the Project or portion thereof is damaged or taken in eminent domain proceedings such that CalSTRS does not have the full beneficial use and possession of the Project or portion thereof, the debt service on the Bonds will be payable from the proceeds of the Insurance and Condemnation Fund established under the Trust Agreement (in the case of damage resulting from an insured hazard) and from amounts on deposit from the Revenue Fund, until such time as the Project or portion thereof is repaired or replaced. If the Project or portion thereof cannot be repaired or replaced during the period of time during which rental interruption insurance is available and the Revenue Fund moneys are insufficient, the Base Rental Payments with respect to the Project or portion thereof will be abated and CalSTRS will have no legal obligation to pay the abated amount. See “THE BONDS – Redemption – Extraordinary Redemption.”
No assurance can be given that the net proceeds of any insurance or condemnation award will be sufficient under all circumstances to repair or replace any damaged or taken portion of the Project or the Project as a whole or to prepay all Base Rental Payments with respect to the Project. CalSTRS makes no representation as to the sufficiency of any insurance awards or the adequacy of any self-insurance to pay, when and as due, amounts payable under the Facility Lease or the Bonds.
Insurance
Casualty and Liability. Pursuant to the Facility Lease CalSTRS is required to maintain insurance against loss or damage to any structures constituting any part of the Project by fire and lightning, with extended coverage insurance, vandalism and malicious mischief insurance and sprinkler system leakage insurance. Said extended coverage insurance shall, as nearly as practicable, cover loss or damage by explosion, windstorm, riot, aircraft, vehicle damage, smoke and such other hazards as are normally covered by such insurance. Such insurance shall be in an amount equal to the replacement cost (without deduction for depreciation) of all structures constituting any part of the Project, excluding the cost of excavations, of grading and filling, and of the land except that such insurance may be subject to deductible clauses for any one loss of not to exceed two hundred fifty thousand dollars ($250,000), or, in the alternative, shall be in an amount and in a form sufficient, in the event of total or partial loss, to enable all Bonds then Outstanding to be redeemed. Such insurance may be part of a joint-purchase insurance program. Although CalSTRS currently intends to maintain earthquake insurance once the Project is completed, CalSTRS is not obligated to obtain earthquake insurance on the Project, and there can be no assurances that it will do so. The Facility Lease does not require

14
CalSTRS to maintain earthquake or flood insurance. See “INVESTMENT CONSIDERATIONS – Abatement” and “Earthquake, Flood or Other Disasters” section herein.
CalSTRS shall promptly apply for Federal disaster aid or State disaster aid if the Project is damaged or destroyed as a result of an earthquake occurring at any time. To the extent necessary, the Infrastructure Bank shall, subject to its review or approval, execute any such application. Any proceeds received as a result of such disaster aid shall be used to repair, reconstruct, restore or replace the damaged or destroyed portions of the Project, or, at the option of CalSTRS and the Infrastructure Bank, to redeem Outstanding Bonds if such use of such disaster aid is permitted.
As an alternative to providing the casualty insurance described above, CalSTRS may utilize self-insurance subject to the requirements of the Facility Lease.
Pursuant to the Facility Lease, CalSTRS is also required to maintain liability insurance in specified amounts (which requirement may be satisfied through the use of self-insurance, subject to satisfaction of the requirements of the Facility Lease).
See APPENDIX F – “SUMMARY OF CERTAIN PROVISIONS OF THE PRINCIPAL LEGAL DOCUMENTS – Facility Lease” herein.
Rental Interruption. The Facility Lease requires CalSTRS, upon substantial completion of the Project, to maintain rental interruption or use and occupancy insurance to cover loss, total or partial, of the rental income from or the use of the Project as the result of any of the hazards covered by the fire and extended coverage insurance required by the Facility Lease, in an amount sufficient to pay the maximum annual Base Rental Payments for any two year period. Any proceeds of such insurance shall be used by the Trustee to reimburse CalSTRS for any rental payments theretofore paid by CalSTRS under the Facility Lease attributable to such structure for a period of time during which the payment of rental payments under the Facility Lease is abated, and any proceeds of such insurance not so used shall be applied as payment of Base Rental Payments (to the extent required for the payment of Base Rental) and Additional Payments (to the extent required for the payment of Additional Payments).
Additional Bonds
The Infrastructure Bank may at any time issue Additional Bonds pursuant to a Supplemental Trust Agreement, payable from the Revenues as provided in the Trust Agreement and secured by a pledge of and charge and lien upon the Revenues as provided in the Trust Agreement equal to the pledge, charge and lien securing the Bonds and any other additional bonds theretofore issued under the Trust Agreement, and subject to the following specific conditions, which are hereby made conditions precedent to the issuance of any such Additional Bonds:
(a) The Infrastructure Bank shall be in compliance with all agreements and covenants contained in the Trust Agreement, and no Event of Default shall have occurred and be continuing.
(b) The Supplemental Trust Agreement shall require that the proceeds of the sale of such Additional Bonds shall be applied to the completion of the Project or other improvements to the Project, or for the refunding or repayment of any Bonds then Outstanding, including the payment of costs and expenses of and incident to the authorization and sale of such Additional Bonds. The Supplemental Trust Agreement may also provide that a portion of such proceeds shall be applied to the payment of the interest due or to become due on said Additional Bonds during the estimated period of any construction and for a period of not to exceed twelve (12) months thereafter.

15
(c) The Supplemental Trust Agreement shall provide, if necessary, for additional funds and accounts for the Additional Bonds. The Supplemental Trust Agreement may, but need not, establish a reserve account to secure payment of the principal of and interest on such Series of Additional Bonds.
(d) The aggregate principal amount of Bonds issued and at any time Outstanding under the Trust Agreement shall not exceed any limit imposed by law, by the Trust Agreement or by any Supplemental Trust Agreement.
(e) The Facility Lease shall have been amended, if necessary, so that the Base Rental Payments payable by CalSTRS under the Trust Agreement in each Fiscal Year shall at least equal Debt Service, including Debt Service on the Additional Bonds, in each Fiscal Year.
Before such Additional Bonds shall be issued, CalSTRS and the Infrastructure Bank shall file or cause to be filed the following documents with the Trustee:
(a) An Opinion of Counsel to the effect that (1) the Supplemental Trust Agreement and Additional Bonds are valid obligations of the Infrastructure Bank; and (2) the amendment to the Facility Lease is a valid obligation of the Infrastructure Bank and CalSTRS (provided that the opinion regarding CalSTRS may be rendered by the CalSTRS Office of General Counsel).
(b) A Certificate of CalSTRS that the requirements described above have been met.
(c) A Certificate of CalSTRS stating that the insurance required by the Facility Lease is in effect.
Upon the delivery to the Trustee of the foregoing instruments and upon the Trustee’s receipt of Certificates of CalSTRS and of the Infrastructure Bank stating that all applicable provisions of the Trust Agreement have been complied with (so as to permit the execution and delivery of the Additional Bonds in accordance with the Supplemental Trust Agreement then delivered to the Trustee), the Trustee shall execute and deliver said Additional Bonds, in the aggregate principal amount specified in such Supplemental Trust Agreement, to, or upon the Written Request of, the Infrastructure Bank.
Limitations on the Issuance of Obligations Payable from Revenues
Under the Trust Agreement, the Infrastructure Bank agrees that it will not, so long as any of the Bonds are Outstanding, issue any obligations or securities, however denominated, payable in whole or in part from Revenues except Additional Bonds of any Series authorized pursuant to the Trust Agreement.
Substitution of Leased Property
CalSTRS and the Infrastructure Bank may substitute real property as part of the Demised Premises for purposes of the Site Lease and the Facility Lease, but only after CalSTRS shall have met certain conditions established in the Facility Lease, which include the following:
(a) Executed copies of the Site Lease and the Facility Lease or amendments thereto containing the amended description of the Project and the Demised Premises, including the legal description of the Demised Premises as modified if necessary.
(b) A Certificate of CalSTRS, evidencing that the annual fair rental value (which may be based on, but not limited to, the construction or acquisition cost or replacement cost of such facility to CalSTRS) of the Project and the Demised Premises which will constitute the Project and the Demised Premises after such substitution or release will be at least equal to 100% of the maximum amount of Base Rental Payments becoming due in the then current year ending August 1 and in any subsequent year ending August 1.

16
(c) With respect to a substitution of property, leasehold owner's policy or policies or a commitment for such policy or policies or an amendment or endorsement to an existing policy or policies resulting in title insurance with respect to the Demised Premises after such substitution in an amount at least equal to the outstanding principal amount of the Bonds; each such insurance instrument, when issued, shall name the Trustee as the insured, and shall insure the facility leasehold estate of the Infrastructure Bank in such substituted property subject only to such exceptions as do not substantially interfere with CalSTRS’ right to use and occupy such substituted property and as will not result in an abatement of Base Rental Payments payable by CalSTRS under the Facility Lease.
(d) A Certificate of CalSTRS stating that the substitution or withdrawal, as applicable, does not adversely affect CalSTRS’ beneficial use and occupancy of the property.
(e) An Opinion of Counsel (as such term is defined in the Trust Agreement) stating that such amendment or modification (i) is authorized or permitted under the Facility Lease; (ii) will, upon the execution and delivery thereof, be valid and binding upon the Infrastructure Bank and CalSTRS and (iii) will not adversely affect the exclusion of interest on the Bonds from gross income for federal income tax purposes.
Release of Personal Property
CalSTRS, in its discretion, may sell or exchange any furniture, fixtures and equipment financed with proceeds of the Bonds (the “Personal Property”) which may at any time constitute a part of the Project, and to release the Personal Property from the Facility Lease, if (a) in the opinion of CalSTRS the property so sold or exchanged is no longer required or useful in connection with the operation of the Project and (b) the consideration to be received from the property is of a value substantially equal to the value of the property to be released. If the value of any such property shall, in the opinion of CalSTRS, exceed the amount of $1,000,000, the Infrastructure Bank shall have been furnished (i) a certificate certifying the value thereof and further certifying that such property is no longer required or useful in connection with the operation of the Project, and (ii) an Opinion of Counsel to the effect that such sale, exchange, and/or release (1) does not conflict with any provision of, and is permissible under, the Facility Lease, the Site Lease, the Trust Agreement, and the Tax Certificate; and (2) will not affect the tax-exempt status of interest on the Bonds. In the event of any such sale, the full amount of the money or consideration received for the Personal Property so sold and released shall be paid to or upon the order of CalSTRS. Any money so paid may, so long as CalSTRS is not in default under any of the provisions of this Lease, be used by CalSTRS to purchase personal property, which property shall become a part of the Project leases under the Facility Lease.
THE INFRASTRUCTURE BANK
The Infrastructure Bank is an entity within the State Governor’s Office of Business and Economic Development, organized and existing pursuant to the Act. The Infrastructure Bank is authorized and empowered pursuant to the Act to issue the Bonds, to loan the proceeds thereof to CalSTRS, to secure the Bonds by a pledge of the amounts payable by CalSTRS under the Facility Lease and any available amounts held in the funds or accounts established pursuant to the Trust Agreement (other than the Rebate Fund), and to enter into the Facility Lease and the Trust Agreement.
The Infrastructure Bank is governed by a board of directors (the “Infrastructure Bank Board”) consisting of the Director of the Governor’s Office of Business and Economic Development, who serves as chairperson, the Director of the State’s Department of Finance, the State Treasurer, the Secretary of the State’s Transportation Agency (or their respective designees), and a Governor’s appointee. The business and affairs of the Infrastructure Bank are managed and conducted by its Executive Director. The Infrastructure Bank has no taxing power.
The Bonds are limited obligations of the Infrastructure Bank and are payable solely from, and secured by a pledge of and lien on, the Revenues, consisting primarily of the Base Rental Payments made by CalSTRS

17
under the Facility Lease and moneys in certain funds pledged therefor (other than the Rebate Fund), as and to the extent set forth in the Trust Agreement.
Information about the Infrastructure Bank included in this Official Statement under the headings “THE INFRASTRUCTURE BANK” and “ABSENCE OF MATERIAL LITIGATION-The Infrastructure Bank” has been obtained from the Infrastructure Bank. The Infrastructure Bank makes no representations or warranties whatsoever with respect to any statements or information contained herein except for information contained under the headings “INTRODUCTORY STATEMENT – The Infrastructure Bank,” “THE INFRASTRUCTURE BANK” and “ABSENCE OF MATERIAL LITIGATION-The Infrastructure Bank.”
THE CALIFORNIA STATE TEACHERS’ RETIREMENT SYSTEM
General
CalSTRS was established pursuant to State law in 1913 to provide pension benefits, including disability and survivor benefits, to California full-time and part-time public-school teachers from pre-kindergarten through community college and certain other employees of the public-school system. CalSTRS, which is currently the largest educator-only pension fund in the world, and the second largest pension fund in the United States, administers a hybrid retirement system that includes a defined benefit plan, the State Teachers’ Retirement Plan (the “STRP”), which is the primary source of Base Rental Payments. As of June 30, 2019, the STRP held net assets of approximately $238.9 billion. CalSTRS also includes two defined contribution plans; a postemployment benefit plan (the “Medicare Premium Payment Program”); and a fund used to account for ancillary activities associated with various deferred compensation plans and programs (“Teachers’ Deferred Compensation Fund”). The Teachers’ Retirement Law (California Education Code section 22000 et seq.) as enacted and amended by the State Legislature (the “Legislature”) and State Governor, established these plans and CalSTRS as the administrator. The terms of the plans may be amended through legislation.
Pursuant to Section 17 of the State Constitution, the Teachers’ Retirement Board (the “CalSTRS Board”) has the sole and exclusive fiduciary responsibility over the assets of CalSTRS. In addition, pursuant to the State Constitution and laws, the CalSTRS Board has exclusive control over the administration of the retirement system plans and the investment of funds, makes rules, sets policies and has the authority to hear and determine all facts pertaining to application for benefits under the retirement system. The business and affairs of CalSTRS are managed and conducted by its Chief Executive Officer.
The CalSTRS Board is composed of 12 members:
• Five members appointed by the State Governor and confirmed by the Senate: one school board representative, one retired CalSTRS member and three public representatives;
• Four ex-officio members: the State Superintendent of Public Instruction, the State Treasurer, the State Controller and the State Director of Finance; and
• Three member-elected positions representing current educators.
CalSTRS’ mission is: Securing the financial future and sustaining the trust of California’s educators. CalSTRS management is responsible for, and committed to, implementing the policies and direction set by the CalSTRS Board including CalSTRS Mission, Vision, Guiding Beliefs, Core Values, Investment Beliefs and Strategic Goals.
CalSTRS investment philosophy is: Long-Term Patient Capital – buying long-term net cash flows and capital gain potential at a reasonable price. The CalSTRS Investment Policy and Management Plan (“IPMP”) summarizes the fundamental objectives and considerations used in the investment, administration, and

18
management of the investment portfolio. The IPMP is designed to set boundaries that will ensure prudence and care in the management of the investment assets, while allowing enough flexibility in the governance process to capture investment opportunities. The IPMP specifically addresses the investment and performance objectives, performance benchmarks, investment risk, asset allocation, investment structure, and reporting. In addition, the CalSTRS Board approved “Investment Beliefs,” that were developed to provide a foundational framework for all CalSTRS’ investment decision-makers to invest in a manner that reflects CalSTRS’ unique view of the global investment markets and its vision for participating in these markets to accomplish its fiduciary goal. In this respect, the IPMP and Investment Beliefs help guide CalSTRS’ policy leaders and other decision makers to develop appropriate policies, procedures and investment plans for CalSTRS’ assets. The overall fund earned a 6.8 percent (net of fees) investment return for the fiscal year ended June 30, 2019, which is less than the actuarially assumed rate of return of 7.0 percent (net) used for funding purposes. See “Actuarial Valuation” and “INVESTMENT CONSIDERATIONS – CalSTRS Investment Risks” herein.
CalSTRS developed an Enterprise Risk Management (“ERM”) program that CalSTRS leadership uses to identify, assess and prepare for any risks that may interfere with CalSTRS operations and objectives. The goal is not to necessarily eliminate all risks, but instead to understand the risks CalSTRS faces and develop mitigation strategies to reduce risks. The ERM program is the overarching governance structure, approach and methodology by which CalSTRS anticipates, identifies, evaluates, prioritizes and treats potential risks to and opportunities for the organization and its strategic and business objectives. The program’s approach ensures that material risks to CalSTRS are effectively identified and managed. See “Operational Risks” herein.
As of June 30, 2019, CalSTRS employed close to 1,200 staff statewide. CalSTRS’ headquarters is located at 100 Waterfront Place, West Sacramento, California 95605.
The State Teachers’ Retirement Plan
The STRP is a multiple employer, cost-sharing, defined benefit plan comprised of four programs: the Defined Benefit Program (the “DB Program”), the Defined Benefit Supplement Program (the “DBS Program”), the Cash Balance Benefit Program (the “CBB Program”) and the Replacement Benefits Program (the “RB Program”). Within the DB Program there is also a Supplemental Benefits Maintenance Account (the “SBMA”) which provides purchasing power protection for retired members. The STRP holds assets for the exclusive purpose of providing benefits to members and their beneficiaries of these programs. CalSTRS is also authorized under State law to use plan assets to defray reasonable expenses of administering the STRP.
The DB Program is the most significant program within the STRP. As of June 30, 2019, membership consisted of 964,572 members (State public school teachers and certain other employees of the public school system), retirees and beneficiaries and there were 1,778 contributing employers (school districts, community college districts, county offices of education, charter schools and regional occupational programs). Membership in the DB Program is mandatory for all employees meeting certain statutory requirements and optional for all other employees performing creditable service activities. The DB Program provides retirement benefits based on members’ final compensation, age and years of service credit. In addition, the program provides benefits to members upon disability and to their survivors or beneficiaries upon the death of eligible members.
The DB Program pays benefit payments to retirees regardless of the sufficiency of assets in the pension plan. Accordingly, annual actuarial valuations are prepared to analyze the sufficiency of future contributions from members, employers and the State to meet current and future obligations. The valuations guide appropriate changes and decisions necessary to sustain the long-term viability of the fund. See “Actuarial Valuation” below.

19
Continuous Appropriation of Base Rental Payments
The Base Rental Payments and other amounts payable by CalSTRS under the Facility Lease constitute reasonable expenses of administering CalSTRS, and under existing law are continuously appropriated, without regard to fiscal years, from the Teachers’ Retirement Fund. The authority to approve the budgeted expenditure of resources for the Base Rental Payments will not be subject to either CalSTRS’ or the State’s annual budget process or require approval via the State Budget.
Contributions
As a provider of pension and other postemployment benefits, CalSTRS receives contributions from members, employers and the State. These contributions are invested, and the investment income earned funds the current and future benefits owed to members and their beneficiaries.
The parameters for member, employer and State contribution rates are set in statute as detailed in the Teachers’ Retirement Law contained in the State Education Code. The CalSTRS Funding Plan established in July 2014 (the “CalSTRS Funding Plan”) through the enactment of Chapter 47, Statutes of 2014 – Assembly Bill 1469 (“AB1469”), details the parameters for member, employer and State contributions for the DB Program.
In Fiscal Year 2018-19, contributions made directly by the State were approximately 36% of total contributions. In addition, State revenues are a significant source of funding for employers. In addition to providing for statutorily required contributions, the State 2019-20 Budget Act provides for significant discretionary payments to CalSTRS to reduce the unfunded actuarial accrued liability.
Prior to the enactment of AB1469, contribution rates for members and employers were set in statute and could only be changed through the legislative process. The CalSTRS Board had a very limited ability to change the State contribution rate. These restrictions prevented the CalSTRS Board from adjusting contribution rates to the levels necessary to properly fund the benefits when economic conditions necessitated it. Over time this contributed to the development of a funding gap, also referred to as the unfunded liability, whereby program assets are insufficient to fund the benefits owed to current and future retirees.
The CalSTRS Funding Plan was enacted to address this funding gap through a predictable schedule of contribution rate increases shared among members, employers and the State to fully fund the CalSTRS DB Program by 2046. It balanced the need for greater contributions with the need to adjust and prepare employer and State budgets for the financial impact of increased contributions.
The CalSTRS Funding Plan also provides the CalSTRS Board with limited authority to further increase or decrease both the employer and State contribution rates to ensure the plan remains on track and is able to react, as necessary, to unexpected changes in CalSTRS’ economic and demographic situation. In May 2019, the CalSTRS Board exercised its authority for the third year in a row to increase the State’s contribution rate by the maximum 0.5 percent of payroll. It is currently expected that the CalSTRS Board will need to increase the State contribution rate by 0.5 percent in each of the three fiscal years following the fiscal year ended June 30, 2020 to ensure the State’s share of the unfunded actuarial liability is eliminated by June 30, 2046. The employer contribution rate is still being phased-in as per the schedule set in the CalSTRS Funding Plan. The CalSTRS Board will have the authority to set the employer rate for the first time effective with the fiscal year beginning July 1, 2021. Because the authority of the CalSTRS Board to increase rates is limited, there can be no assurances that the CalSTRS Board will be able to set contribution rates to the levels necessary to fully fund the CalSTRS DB Program by 2046. See “Actuarial Valuation” below.
As a result of the implementation of the CalSTRS Funding Plan, the probability of reaching full funding has greatly improved while the risk of a low-funded status or insolvency has been considerably

20
reduced. Notwithstanding this, investment volatility, actuarial assumption changes, member longevity and decreases in membership levels pose potential risks to the ability to achieve full funding.
In addition, the CalSTRS Funding Plan contains a provision requiring CalSTRS to provide a report to the Legislature every five years on the fiscal health of the DB Program and the progress of the CalSTRS Funding Plan. The first report to the Legislature was submitted in June 2019. See APPENDIX C – “2019 REPORT TO LEGISLATURE ON THE PROGRESS OF THE CALSTRS FUNDING PLAN.”
Further, each November CalSTRS prepares a report to assist the CalSTRS Board, stakeholders, policymakers and the public in assessing the soundness and sustainability of the DB Program and to promote a better understanding of how well the CalSTRS Funding Plan is expected to achieve its goal in light of uncertainties related to investment risk, longevity risk and risk of declines in membership. See APPENDIX D – “CALSTRS 2019 REVIEW OF FUNDING LEVELS AND RISKS REPORT” herein.
Actuarial Valuation
CalSTRS engages an independent consulting actuary, Milliman, to annually prepare actuarial valuations for each of its programs, including the actuarial valuation for the DB Program (the “Actuarial Valuation”). The purpose of the Actuarial Valuation is to guide decisions regarding the long-term viability of the DB program. Actuarial computations presented in the Actuarial Valuation are performed for purposes of assessing the funding levels of CalSTRS, calculating contribution rates under CalSTRS valuation policy and the relevant provision of the Education Code, and analyzing the sufficiency of future contributions to meet the current and future obligations of the DB Program.
The Actuarial Valuation includes a calculation of the rates that would be necessary to accumulate, on an actuarial basis, a sufficient amount for the payment of benefits to members in accordance with the retirement plan (the “Actuarially Determined Contribution”). Although the CalSTRS Funding Plan provides limited authority to the CalSTRS Board to adjust contribution rates to achieve full funding of the DB Program by 2046, it does not provide the CalSTRS Board with unlimited authority to set these rates. As a result, contributions collected from members, employers and the State may fall short of the Actuarially Determined Contribution needed to fund the retirement plan on an actuarial basis. In May 2019, the CalSTRS Board reviewed the results of the June 30, 2018 Actuarial Valuation and exercised its authority to increase the State contribution rate effective July 1, 2019. The employer contribution rate is still being phased-in as per the schedule set in the CalSTRS Funding Plan. The CalSTRS Board will have the authority to set the employer rate for the first time effective with the fiscal year beginning July 1, 2021. CalSTRS is not expected to be able to collect the Actuarially Determined Contribution until the fiscal year beginning July 1, 2022.
The Actuarial Valuation is performed based on a number of actuarial assumptions, which includes assumed investment earnings, member life expectancy, inflation and member earnings growth. The CalSTRS Board adopts the economic and demographic assumptions used in the preparation of the Actuarial Valuation. Economic assumptions are related to the general economy and its impact on CalSTRS, and include expected investment earnings, among other factors. Demographic assumptions predict the future experience of the membership with respect to eligibility and benefits and are directly related to the specific experience of CalSTRS members. CalSTRS, through its consulting actuary, performs an experience study generally every four years to determine appropriate demographic and economic assumptions. The most recent experience study (which related to the period from July 1, 2010 through June 30, 2015) was adopted by the CalSTRS Board on February 1, 2017. The next experience study is expected to be completed in January 2020.
The Actuarial Valuation also measures the unfunded actuarial accrued liability (“UAAL”) of the DB program which represents the difference between the actuarial values of assets owned by the plan and the actuarial values of the total benefits due to be paid. The most recent actuarial valuation for the DB Program, indicates that the UAAL as of June 30, 2018 is approximately $107.2 billion. The funding ratio, which represents the current actuarial level of assets as a percentage of the actuarial cost of the benefits accrued, was

21
64.0 percent as of June 30, 2018. See APPENDIX E – “DEFINED BENEFIT PROGRAM OF THE CALIFORNIA STATE TEACHERS’ RETIREMENT SYSTEM JUNE 30, 2018 ACTUARIAL VALUATION” for information relating to the current and historic UAAL.
The UAAL is distinct from the Net Pension Liability (the “NPL”) included in CalSTRS basic financial statements, which is an accounting measure based on the requirement of Governmental Accounting Standards Board (“GASB”) Statement No. 67, Financial Reporting for Pension Plans-an amendment of GASB Statement No, 25, as amended. The NPL is determined based on an actuarial valuation for financial reporting only and focuses on the obligation an employer incurs on behalf of employees through the employment-exchange process. The primary purpose of the valuation for financial reporting is to provide a consistent, standardized methodology that allows comparability of financial data and increased transparency of the pension liability across plans. The NPL as of June 30, 2019 was approximately $90.3 billion. It should be noted that this figure represents the NPL of the entire STRP as CalSTRS does not provide an NPL calculation of the DB Program separately. See APPENDIX A – “CALSTRS COMPREHENSIVE ANNUAL FINANCIAL REPORT FOR THE FISCAL YEAR ENDED JUNE 30, 2018” AND APPENDIX B – INDEPENDENT AUDITOR’S REPORT, BASIC FINANCIAL STATEMENTS, REQUIRED SUPPLEMENTARY INFORMATION AND OTHER SUPPLEMENTARY INFORMATION FOR THE FISCAL YEAR ENDED JUNE 30, 2019” herein.
Milliman, the independent consulting actuary for CalSTRS, has not been engaged to perform and has not performed, since the date of its report included herein, any work or updates on the Actuarial Valuation addressed in that report. Milliman also has not performed any work related to this Official Statement.
The Actuarial Valuation is only an estimate of CalSTRS’ financial condition as of a single date. It can neither predict CalSTRS’ future condition nor guarantee future financial soundness. See APPENDIX E – “DEFINED BENEFIT PROGRAM OF THE CALIFORNIA STATE TEACHERS’ RETIREMENT SYSTEM JUNE 30, 2018 ACTUARIAL VALUATION” herein.
Other Obligations of CalSTRS Payable from the STRP
The CalSTRS investment portfolio is diversified across a broad range of investment types. In the course of its investment activities, CalSTRS has entered into several transactions creating certain types of commitments and obligations. The following are examples of the more significant commitments and obligations:
• CalSTRS has a master credit facility portfolio that consists of several unsecured credit facilities and one secured loan, the proceeds of which are used to manage capital flows of investment strategies.
• CalSTRS enters into securities lending transactions in which it loans its securities to various entities. In exchange, CalSTRS receives cash collateral that it subsequently reinvests to earn incremental income. In some instances, CalSTRS will receive non-cash collateral.
• CalSTRS has a number of unfunded commitments that could be called upon in connection with its purchase of partnership interests under various alternative investments.
For additional information, see “APPENDIX - A CALSTRS COMPREHENSIVE ANNUAL FINANCIAL REPORT FOR THE FISCAL YEAR ENDED JUNE 30, 2018” and “APPENDIX - B INDEPENDENT AUDITOR’S REPORT, BASIC FINANCIAL STATEMENTS, REQUIRED SUPPLEMENTARY INFORMATION AND OTHER SUPPLEMENTARY INFORMATION FOR THE FISCAL YEAR ENDED JUNE 30, 2019.”

22
Certain Condensed Financial Information
The following table provides a summary of the Statement of Fiduciary Net Position and the Statement of Changes in Fiduciary Net Position of the STRP for the last five fiscal years ended June 30, 2015 through June 30, 2019, respectively. The information for 2015 through 2018 is derived from the CalSTRS Comprehensive Annual Financial Report for each respective period and the information for 2019 is derived from the 2019 Basic Financial Statements. See APPENDIX A – “CALSTRS COMPREHENSIVE ANNUAL FINANCIAL REPORT FOR THE FISCAL YEAR ENDED JUNE 30, 2018” and APPENDIX B – INDEPENDENT AUDITOR’S REPORT, BASIC FINANCIAL STATEMENTS, REQUIRED SUPPLEMENTARY INFORMATION AND OTHER SUPPLEMENTARY INFORMATION FOR THE FISCAL YEAR ENDED JUNE 30, 2019” herein.
CALSTRS CONDENSED STATEMENT OF FIDUCIARY NET POSITION State Teachers’ Retirement Plan
As of June 30 (Unaudited) (Dollars in Thousands)
ASSETS AND DEFERRED OUTFLOWS OF RESOURCES
2019 2018 2017 2016 2015
Investment Assets(1) $ 261,270,852 $ 247,370,532 $ 229,079,341 $ 207,541,517 $ 210,698,551 Cash 321,051 153,256 459,456 164,597 359,992 Investment Receivables 4,763,939 3,076,620 2,349,266 1,280,564 3,376,504 Member, Employer, State and Other Receivables
5,830,354 3,468,656 3,523,160 2,693,178 1,961,486
Capital and Other Assets 317,418 276,245 259,011 231,216 226,167 Total Assets $ 272,503,614 $ 254,345,309 $ 235,670,234 $ 211,911,072 $ 216,622,700 Deferred Outflows of Resources 68,561 117,457 70,934 22,756 16,398 TOTAL ASSETS AND DEFERRED OUTFLOWS OF RESOURCES $ 272,572,175 $ 254,462,766 $ 235,741,168 $ 211,933,828 $ 216,639,098 LIABILITIES AND DEFERRED INFLOWS OF RESOURCES
Investment Liabilities $ 123,852 $ 140,070 $ 260,133 $ 169,246 $ 107,373 Investment Purchased Payables 5,194,433 3,346,989 3,270,703 1,403,511 3,725,966 Loan Payable 2,787,387 2,731,737 2,824,259 2,129,694 1,447,405 Benefits in Process of Payment 1,513,766 263,254 234,379 1,188,518 1,178,524 Net Pension and OPEB Liabilities 816,327 835,204 323,058 256,069 213,427 Securities Lending Obligation 22,786,907 21,917,706 18,184,444 17,530,264 18,043,187 Other 369,832 303,893 353,766 127,494 73,800 Total Liabilities $ 33,592,504 $ 29,538,853 $ 25,450,742 $ 22,804,796 $ 24,789,682 Deferred Inflows of Resources 117,783 55,278 526 15,545 27,080 TOTAL LIABILITIES AND DEFERRED INFLOWS OF RESOURCES $ 33,710,287 $ 29,594,131 $ 25,451,268 $ 22,820,341 $ 24,816,762 NET POSITION RESTRICTED FOR PENSIONS $ 238,861,888 $ 224,868,635 $ 210,289,900 $ 189,113,487 $ 191,822,336
______________________ (1) Includes securities lending collateral of $22.8 billion, $21.9 billion, $18.2 billion, $17.5 billion and $18.0 billion for 2019, 2018,
2017, 2016 and 2015, respectively. Source: CalSTRS

23
CALSTRS CONDENSED STATEMENT OF CHANGES IN FIDUCIARY NET POSITION State Teachers’ Retirement Plan
As of June 30 (Unaudited) (Dollars in Thousands)
ADDITIONS 2019 2018 2017 2016 2015 Member Contributions $ 3,647,999 $ 3,496,245 $ 3,440,883 $ 2,957,473 $ 2,509,712 Employer Contributions 5,644,472 4,866,661 4,173,235 3,391,144 2,677,815 State of California Contributions 5,334,860 2,796,673 2,478,230 1,939,902 1,425,796 Net Investment Income 14,897,833 18,673,537 25,165,180 2,337,364 7,575,999 Other 127,603 105,144 72,005 41,519 39,580 TOTAL ADDITIONS $ 29,652,767 $ 29,938,260 $ 35,329,533 $ 10,667,402 $ 14,228,902
DEDUCTIONS Benefit Payments $ 15,196,087 $ 14,432,810 $ 13,787,035 $ 13,064,557 $ 12,476,902 Refunds of Member Contributions 99,893 103,886 115,509 84,001 87,694 Administrative Expenses 253,953 216,083 182,367 180,056 145,239 Borrowing Costs(1) 105,306 94,249 57,958 32,406 - Other 4,275 1,678 10,251 15,231 8,840 TOTAL DEDUCTIONS $ 15,659,514 $ 14,848,706 $ 14,153,120 $ 13,376,251 $ 12,718,675 Increase (Decrease) In Net Position $ 13,993,253 $ 15,089,554 $ 21,176,413 $ (2,708,849) $ 1,510,227 BEGINNING NET POSITION RESTRICTED FOR PENSIONS $224,868,635 $210,289,900 $189,113,487 $191,822,336 $ 190,474,016 Adjustment for Application of GASB Standards(2) - (510,819) - - (161,907) Beginning of the Year -as Adjusted 224,868,635 209,779,081 189,113,487 191,822,336 190,312,109 ENDING NET POSITION RESTRICTED FOR PENSIONS $238,861,888 $224,868,635 $210,289,900 $189,113,487 $ 191,822,336
______________________ (1) Borrowing Costs of $26.6 million for fiscal year 2014-15 were included in Net Investment Income on the Statement of Changes in
Fiduciary Net Position. (2) Adjustment to beginning net position due to the implementation of GASB 75 in fiscal year 2017-18 and due to the implementation of
GASB 67 in fiscal year 2014-15. Source: CalSTRS

24
INVESTMENT CONSIDERATIONS
An investment in the Bonds involves risk. In making investment decisions, investors must rely on their own investigations and evaluation of the merits of a particular investment; however, each investment has particular factors an investor should review and evaluate. The following is a summary, which does not purport to be comprehensive or definitive, of some of the factors an investor may want to consider before purchasing the Bonds. The following is intended only as a summary of certain risk factors attendant to an investment in the Bonds. Inclusion of certain factors below is not intended to signify that there are not other investment considerations or risks attendant to the Bonds that are as material to an investment decision with respect to the Bonds that are otherwise described or referred to elsewhere herein.
Limited Security
THE BONDS SHALL NOT CONSTITUTE A DEBT OR LIABILITY OF THE STATE OR ANY POLITICAL SUBDIVISION THEREOF OTHER THAN THE LIMITED OBLIGATION OF THE INFRASTRUCTURE BANK (SOLELY FROM REVENUES AND THE OTHER AMOUNTS PLEDGED THEREFOR UNDER THE TRUST AGREEMENT), OR A PLEDGE OF THE FAITH AND CREDIT OF THE STATE OR ANY POLITICAL SUBDIVISION THEREOF, BUT SHALL BE PAYABLE SOLELY FROM THE FUNDS PROVIDED THEREOF IN THE TRUST AGREEMENT. NEITHER THE FAITH AND CREDIT NOR THE TAXING POWER OF THE STATE IS PLEDGED TO THE PAYMENT OF THE PRINCIPAL OF, OR INTEREST ON, THE BONDS; AND NO OWNER OR BENEFICIAL OWNER OF ANY BOND SHALL HAVE ANY RIGHT TO DEMAND PAYMENT OF THE PRINCIPAL OF, OR INTEREST ON, THE BONDS BY THE INFRASTRUCTURE BANK, THE STATE OR ANY POLITICAL SUBDIVISION THEREOF, OUT OF ANY FUNDS TO BE RAISED BY TAXATION OR APPROPRIATION. THE ISSUANCE OF THE BONDS SHALL NOT DIRECTLY OR INDIRECTLY OR CONTINGENTLY OBLIGATE THE STATE OR ANY POLITICAL SUBDIVISION THEREOF TO LEVY OR TO PLEDGE ANY FORM OF TAXATION THEREFOR, OR TO MAKE ANY APPROPRIATION FOR THEIR PAYMENT.
NOTWITHSTANDING ANYTHING CONTAINED IN THIS OFFICIAL STATEMENT, THE INFRASTRUCTURE BANK SHALL NOT BE REQUIRED TO ADVANCE ANY MONEYS DERIVED FROM ANY SOURCE OF INCOME OTHER THAN THE REVENUES AND ADDITIONAL PAYMENTS, FOR ANY OF THE PURPOSES DESCRIBED IN THIS OFFICIAL STATEMENT, INCLUDING THE PAYMENT OF THE PRINCIPAL OF OR INTEREST ON THE BONDS. THE BONDS ARE NOT GENERAL OBLIGATIONS OF THE INFRASTRUCTURE BANK, AND ARE PAYABLE FROM AND SECURED ONLY BY THE REVENUES AND THE OTHER ASSETS PLEDGED FOR SUCH PAYMENT UNDER THE TRUST AGREEMENT.
Construction Risks
As described herein, CalSTRS’ obligation to make Base Rental Payments does not commence until the Project is substantially complete and available for CalSTRS’ beneficial use and occupancy. If the Project is not substantially complete by February 1, 2023 (the period through which capitalized interest is being funded from the proceeds of the Bonds), CalSTRS will not be obligated to make Base Rental Payments during the period of delay, and that circumstance would have a material adverse effect on the payment of debt service with respect to the Bonds. This section describes certain risks specifically relating to construction of the Project, but does not constitute an exhaustive list of all construction-related risks.
General Construction Risks. Completion of the Project involves many risks common to large construction projects such as shortages of materials and labor, work stoppages, labor disputes, litigation, environmental law compliance, errors and omissions by architects, engineers, and contractors, substantial increases in material costs for steel, lumber, and other key commodities, weather interferences, terrorism, construction accidents, contractor or subcontractor defaults, defective workmanship, unforeseen engineering,

25
geotechnical or environmental problems, land-use permitting problems, and unanticipated cost increases, any of which could give rise to substantial delays or cost overruns. No assurance can be given that the factors mentioned above will not cause substantial delays and cost overruns.
Any and all aspects of construction, including but not limited to labor and materials, could be subject to material increases in cost. Although CalSTRS believes that its estimates of costs of the Project and the adequacy of the contingencies are reasonable, and has entered into the Construction Contract which provides for the Guaranteed Maximum Price, it is possible that CalSTRS’ and the Construction Contractor’s judgments and assumptions are materially mistaken and that the actual costs of the Project will vary materially from the estimates thereof.
Nonperformance by the Construction Contractor. The Construction Contract limits the Construction Contractor’s ability to make claims for increases in the price specified in the Construction Agreement or for extensions of the completion deadlines specified therein. The Construction Contract also imposes liquidated damages for failure to meet certain completion deadlines. If the Construction Contractor finds it uneconomic to perform the obligations under the Construction Contract, or otherwise becomes unwilling or unable to perform, there is a risk that the Construction Contractor may abandon the Project and breach its obligations under the Construction Contract. Although the Construction Contract includes provisions to secure contractor performance, including performance-bond and payment bond requirements and retention of contractor payments, there can be no assurance that these provisions will ensure the Construction Contractor’s full performance of its obligations under the Construction Contract. The Construction Contractor’s nonperformance may lead to substantial cost increases and delays in completion of the Project.
Failure of Providers of Performance and Payment Bonds. Although the Construction Contract requires that performance and payment bonds be obtained from insurers meeting specific financial requirements, a potential purchaser of the Bonds can have no assurance that any surety or property insurer will be willing to meet, or be capable of meeting, its responsibilities in connection with the Project. Nor can there be any assurance that the issuer of any performance bond, payment bond, or property-insurance policy will honor or be able to honor a claim in a timely manner.
There can be no assurance that the performance and payment bonds provided by the Construction Contractor will be sufficient to satisfy the Construction Contractor’s performance and payment obligations under the Construction Contract. Not all events are covered under the performance and payment bonds. The issuer of performance and payment bonds is not guaranteeing performance and payment under all circumstances, and the issuer of the bonds may assert any defenses it or the Construction Contractor may have for performance and payment. Moreover, if a default occurs under the Construction Contract, there is a possibility of litigation between CalSTRS, the Construction Contractor and/or the providers of the performance bonds or payment bonds, which could further delay the construction and opening of the Project. In addition, there can be no assurance that CalSTRS could recover any amounts under any performance bonds or payment bonds. Proceeds of payment or performance bonds are not available for payment of the Bonds.
Governmental Permits and Approvals. The Project requires numerous discretionary State and local governmental permits or approvals. See “THE PROJECT — Construction Arrangements.” CalSTRS is not aware of any engineering or technical circumstances that would prevent the Construction Contractor from obtaining, in the ordinary course and in a timely manner, the remaining permits and approvals required for completion of the Project and related infrastructure. Those permits and approvals that have been obtained contain conditions, and those that have not yet been obtained are expected to contain conditions when they are issued. In addition, the State and local statutory and regulatory requirements (including requirements to obtain additional permits or approvals) applicable to the Project and related infrastructure are subject to change. No assurance can be given that the Construction Contractor will be able to comply with the changes or that the changes will not materially increase the cost of the Project and related infrastructure or cause delays. Completion of the Project could be delayed or prevented by, and additional costs could result from, delays in obtaining any approval or permit or any failure to obtain and maintain in full force and effect any approval or

26
permit, or delays in or any failure to satisfy any conditions or other applicable requirements. In addition, increased construction activity and wildfire threats could result in delays from permitting agencies in obtaining permits in a timely manner.
Abatement
The Facility Lease provides for the abatement of Base Rental Payments proportionately during any period in which by reason of any damage or destruction (other than by condemnation) there is substantial interference with the use and occupancy of the Project by CalSTRS. If the Project or portions thereof, if damaged or destroyed by an insured casualty, could not be replaced during the period of time the proceeds of CalSTRS’ rental interruption insurance will be available in lieu of Base Rental Payments, or if casualty insurance proceeds or condemnation proceeds are insufficient to provide for complete repair or replacement of the component of the Project or prepayment of the Bonds, there could be insufficient funds to make payments to Owners in full. Reduction in Base Rental Payments due to abatement as provided in the Facility Lease does not constitute a default thereunder.
Earthquake, Flood or Other Disasters
The occurrence of an earthquake, flood or other disaster which results in the temporary or permanent closure of the Project could result in an abatement of Base Rental Payments and materially adversely affect payment of debt service with respect to the Bonds.
The Project is located in Flood Zone X according to the flood insurance map published by the Federal Emergency Management Agency. Zone X is the flood insurance rate zone that corresponds to areas outside the 1-percent annual chance floodplain (i.e., areas protected from the 1-percent annual chance flood by levees). Flood insurance is not required to be maintained in Zone X by State or federal law, or by the Facility Lease.
CalSTRS currently intends to maintain earthquake insurance once the Project is completed. However, CalSTRS is not obligated to obtain earthquake insurance on the Project, and there can be no assurances that it will do so.
Depending on severity, an earthquake, flood or other disaster could result in abatement of Base Rental Payments under the Project Lease.
See “INVESTMENT CONSIDERATIONS - Abatement” herein.
CalSTRS’ Investment Risks
CalSTRS’ investment portfolio is subject to investment risks that could result in a permanent reduction in or loss of invested capital in the STRP, which in turn could result in a significant reduction of amounts available in the STRP for payment of Base Rental Payments. Investment risks could include, but are not limited to:
• Financial market volatility could lead to a permanent loss of CalSTRS assets if required to sell assets at an inopportune time;
• A recession resulting in both a decline in active membership and a period of lower investment returns would put significant strain on CalSTRS’ ability to achieve full funding.
• CalSTRS DB Program continues to mature, which increases the system’s sensitivity to investment volatility, especially for the State contribution rate;
• Geopolitical risks;

27
• Significant, unpredicted changes in interest rate levels;
• Fluctuations in currency exchange rates;
• Impairment or failure of entities in whose debt securities CalSTRS invests;
• Impairment or failure of financial institution counterparties;
• Valuation methods used for private investments are inherently subjective and the values recorded may not be realized in a sale or an exchange of securities with an independent third party;
• Use of financial leverage on certain investments;
• Events specific to significant individual assets;
• Low future growth rates or not earning returns commensurate with the risk accepted;
• Investment in asset classes with limited liquidity;
• Derivative transactions may adversely affect liquidity or derivative strategies may be ineffective;
• Review and pursuit of additional strategic transaction opportunities may be unsuccessful, or such opportunities may change the asset mix and risk profile;
• Unsuccessful development projects;
• Increased competition may impair ability to achieve target asset mix or cause investment income to decline;
• Performance in joint ventures, co-ownerships and partnerships may adversely affect investment liquidity and strategy execution; and,
• The models used by CalSTRS in connection with its investment activities may prove to be inaccurate or improperly developed or changes to those models could impact asset valuations or capital deployment strategies.
Operational Risks
Risks are inherently present in the work CalSTRS does. While CalSTRS has developed internal controls in order to mitigate identified risks, risks still exist. The CalSTRS ERM program has identified risk categories listed below. There can be no assurances the occurrence of one or more of these risks, or other risks which have not currently been identified, will not materially adversely affect amounts available to CalSTRS (including amounts in the STRP) for the payment of Base Rental Payments.
• Pension Fund-Investments: Fund performance objectives may not be achieved as set in the Investment Policy and Management Plan;
• Pension Funding-Actuarial: Actuarial methodologies and assumptions may vary from experience;

28
• Pension Funding-Membership: Increasing member longevity and decreases in membership levels pose potential risks to the ability to achieve full funding;
• Pension Funding-Contribution Rates: Contribution rates may be insufficient to amortize the unfunded actuarial liability;
• Pension Administration: Delivery of benefits and services may be untimely and/or inaccurate due to failure of or inadequate: processes, technology systems, staff actions or data;
• Financial Reporting: Incomplete or inaccurate financial information; weaknesses in internal control may jeopardize receipt of an unqualified/unmodified audit opinion or result in significant non-compliance with standards;
• Pension Reform: The funded status of the STRP and members’ retirement security may be negatively impacted by legislative changes or interpretation of existing law;
• Information Security: CalSTRS may suffer loss of information security or incur compliance violations as a result of unauthorized or unintentional breaches;
• Operational: CalSTRS may be unable to achieve business objectives due to lack of compliance with internal controls, lack of accessibility to technology systems, and/or loss of critical staff knowledge;
• Reputational: Confidence in CalSTRS as a respected fiduciary of public funds may be lost; and
• Transformational Change: CalSTRS may be unable to accomplish major transformational change initiatives.
Cybersecurity
CalSTRS relies on computers and technology to conduct its operations. CalSTRS faces cyber threats from time to time including, but not limited to, hacking, viruses, malware and other forms of technology attacks. To date, there have been no significant, cyber-attacks on CalSTRS computers and technologies.
While CalSTRS is routinely maintaining its technology systems and continuously implementing new information security controls, no assurances can be given that CalSTRS’ security and operational control measures will be successful in guarding against all cyber threats and attacks. The results of any attack on CalSTRS’ computer and technology could negatively impact the CalSTRS’ operations, and the costs related to such attacks could be substantial.
Tax-Exempt Status of the Bonds
The Code imposes a number of requirements that must be satisfied for interest on state and local obligations, such as the Bonds, to be excludable from gross income for federal income tax purposes. These requirements include limitations on the use of Bond proceeds, limitations on the investment earnings of Bond proceeds prior to expenditure, a requirement that certain investment earnings on Bond proceeds be paid periodically to the United States and a requirement that issuers file an information return with the Internal Revenue Service (the “IRS”). The Infrastructure Bank and CalSTRS have covenanted in certain documents referred to herein that they will comply with such requirements. Failure by CalSTRS to comply with the requirements stated in the Code and related regulations, rulings and policies may result in the treatment of interest on the Bonds as taxable, retroactive to the date of original issuance of the Bonds.

29
The IRS Tax Exempt and Government Entities Division has a subdivision specifically devoted to tax-exempt bond compliance and that has been active in auditing tax-exempt bond transactions such as the Bonds. CalSTRS has not sought to obtain a private letter ruling from the IRS with respect to the Bonds, and the opinion of Bond Counsel is not binding on the IRS. See “TAX MATTERS” herein.
ABSENCE OF MATERIAL LITIGATION
The Infrastructure Bank
There is not now pending (as to which the Infrastructure Bank has received service of process) or, to the actual knowledge of the Infrastructure Bank, threatened, any litigation against the Infrastructure Bank restraining or enjoining the issuance or delivery of the Bonds or contesting the validity of the Bonds or the proceedings or authority under which the Bonds are to be issued. None of the creation, organization nor existence of the Infrastructure Bank nor the title of any of the present members or other officers of the Infrastructure Bank to their respective offices is being contested. There is no litigation against the Infrastructure Bank pending (as to which the Infrastructure Bank has received service of process) or, to the actual knowledge of the Infrastructure Bank, threatened, which contests the right of the Infrastructure Bank to enter into the Trust Agreement, the Site Lease, the Facility Lease or the Bond Purchase Agreement or to secure the Bonds in the manner provided by the Act and as provided in the Trust Agreement and in the resolution of the Infrastructure Bank approving the issuance of the Bonds.
CalSTRS
CalSTRS is involved in litigation relating to various matters. In the opinion of management, after consultation with legal counsel, there is no litigation now pending or threatened against CalSTRS, of which CalSTRS has knowledge, that in any manner questions the right of CalSTRS to enter into or perform its obligations under the Trust Agreement, the Facility Lease, the Site Lease, the Continuing Disclosure Certificate or that individually or in the aggregate would adversely affect the operations of CalSTRS, financially or otherwise.
TAX MATTERS
In the opinion of Orrick, Herrington & Sutcliffe LLP, Bond Counsel to the Infrastructure Bank, (“Bond Counsel”), based upon an analysis of existing laws, regulations, rulings and court decisions, and assuming, among other matters, the accuracy of certain representations and compliance with certain covenants, interest on the Bonds is excluded from gross income for federal income tax purposes under Section 103 of the Internal Revenue Code of 1986 (the “Code”) and is exempt from State of California personal income taxes. In the further opinion of Bond Counsel, interest on the Bonds is not a specific preference item for purposes of the federal alternative minimum tax. A complete copy of the proposed form of opinion of Bond Counsel is set forth in APPENDIX G - “PROPOSED FORM OF BOND COUNSEL OPINION” herein.
To the extent the issue price of any maturity of the Bonds is less than the amount to be paid at maturity of such Bonds (excluding amounts stated to be interest and payable at least annually over the term of such Bonds), the difference constitutes “original issue discount,” the accrual of which, to the extent properly allocable to each beneficial owner thereof; is treated as interest on the Bonds which is excluded from gross income for federal income tax purposes and State of California personal income taxes. For this purpose, the issue price of a particular maturity of the Bonds is the first price at which a substantial amount of such maturity of the Bonds is sold to the public (excluding bond houses, brokers, or similar persons or organizations acting in the capacity of underwriters, placement agents or wholesalers). The original issue discount with respect to any maturity of the Bonds accrues daily over the term to maturity of such Bonds on the basis of a constant interest rate compounded semiannually (with straight-line interpolations between compounding dates). The accruing original issue discount is added to the adjusted basis of such Bonds to determine taxable gain or loss upon disposition (including sale, redemption, or payment on maturity) of such Bonds. Beneficial owners of the
30
Bonds should consult their own tax advisors with respect to the tax consequences of ownership of Bonds with original issue discount, including the treatment of beneficial owners who do not purchase such Bonds in the original offering to the public at the first price at which a substantial amount of such Bonds is sold to the public.
Bonds purchased, whether at original issuance or otherwise, for an amount higher than their principal amount payable at maturity (or, in some cases, at their earlier call date) (“Premium Bonds”) will be treated as having amortizable bond premium. No deduction is allowable for the amortizable bond premium in the case of bonds, like the Premium Bonds, the interest on which is excluded from gross income for federal income tax purposes. However, the amount of tax-exempt interest received, and a beneficial owner’s basis in a Premium Bond, will be reduced by the amount of amortizable bond premium properly allocable to such beneficial owner. Beneficial owners of Premium Bonds should consult their own tax advisors with respect to the proper treatment of amortizable bond premium in their particular circumstances.
The Code imposes various restrictions, conditions and requirements relating to the exclusion from gross income for federal income tax purposes of interest on obligations such as the Bonds. The Infrastructure Bank and CalSTRS have made certain representations and have covenanted to comply with certain restrictions, conditions and requirements designed to ensure that interest on the Bonds will not be included in federal gross income. Inaccuracy of these representations or failure to comply with these covenants may result in interest on the Bonds being included in gross income for federal income tax purposes, possibly from the date of issuance of the Bonds. The opinion of Bond Counsel assumes the accuracy of these representations and compliance with these covenants. Bond Counsel has not undertaken to determine (or to inform any person) whether any actions taken (or not taken), or events occurring (or not occurring), or any other matters coming to Bond Counsel’s attention after the date of issuance of the Bonds may adversely affect the value of, or the tax status of interest on, the Bonds. Accordingly, the opinion of Bond Counsel is not intended to, and may not, be relied upon in connection with any such actions, events or matters.
Although Bond Counsel is of the opinion that interest on the Bonds is excluded from gross income for federal income tax purposes and is exempt from State of California personal income taxes, the ownership or disposition of, or the accrual or receipt of amounts treated as interest on, the Bonds may otherwise affect a beneficial owner’s federal, state or local tax liability. The nature and extent of these other tax consequences depends upon the particular tax status of the beneficial owner or the beneficial owner’s other items of income or deduction. Bond Counsel expresses no opinion regarding any such other tax consequences.
Current and future legislative proposals, if enacted into law, or clarification of the Code or court decisions may cause interest on the Bonds to be subject, directly or indirectly, in whole or in part, to federal income taxation or to be subject to or exempted from state income taxation, or otherwise prevent beneficial owners from realizing the full current benefit of the tax status of such interest. The introduction or enactment of any such legislative proposals or clarification of the Code or court decisions may also affect, perhaps significantly, the market price for, or marketability of, the Bonds. Prospective purchasers of the Bonds should consult their own tax advisors regarding the potential impact of any pending or proposed federal or state tax legislation, regulations or litigation, as to which Bond Counsel expresses no opinion.
The opinion of Bond Counsel is based on current legal authority, covers certain matters not directly addressed by such authorities, and represents Bond Counsel’s judgment as to the proper treatment of the Bonds for federal income tax purposes. It is not binding on the IRS or the courts. Furthermore, Bond Counsel cannot give and has not given any opinion or assurance about the future activities of The Infrastructure Bank or CalSTRS, or about the effect of future changes in the Code, the applicable regulations, the interpretation thereof or the enforcement thereof by the IRS. The Infrastructure Bank and CalSTRS have covenanted, however, to comply with the requirements of the Code.
The IRS has an ongoing program of auditing tax-exempt obligations to determine whether, in the view of the IRS, interest on such tax-exempt obligations is includable in the gross income of the owners thereof for

31
federal income tax purposes. Bond Counsel is not obligated to defend the Infrastructure Bank, CalSTRS or the beneficial owners regarding the tax-exempt status of the Bonds in the event of an audit examination by the IRS. Under current procedures, parties other than The Infrastructure Bank and CalSTRS and their respective appointed counsel, including the beneficial owners, would have little, if any, right to participate in the audit examination process. Moreover, because achieving judicial review in connection with an audit examination of tax-exempt bonds is difficult, obtaining an independent review of IRS positions with which the Infrastructure Bank or CalSTRS legitimately disagrees, may not be practicable. Any action of the IRS, including but not limited to selection of the Bonds for audit, or the course or result of such audit, or an audit of bonds presenting similar tax issues may affect the market price for, or the marketability of, the Bonds, and may cause the Infrastructure Bank, CalSTRS or the beneficial owners to incur significant expense.
MUNICIPAL ADVISOR
Montague DeRose and Associates, LLC is employed as Municipal Advisor to CalSTRS in connection with the issuance of the Bonds. The Municipal Advisor’s compensation for services rendered with respect to the sale of the Bonds is not contingent upon the issuance and delivery of the Bonds. Montague DeRose and Associates, LLC, in its capacity as Municipal Advisor, does not assume any responsibility for the information, covenants, and representations contained in any of the legal documents with respect to the federal income tax status of the Bonds or the possible impact of any present, pending, or future actions taken by any legislative or judicial bodies.
The Municipal Advisor to CalSTRS has provided the following sentence for inclusion in this Official Statement: The Municipal Advisor has reviewed the information in this Official Statement in accordance with, and as part of, its responsibilities to CalSTRS and, as applicable, to investors under the federal securities laws as applied to the facts and circumstances of this transaction, but the Municipal Advisor does not guarantee the accuracy or completeness of such information.
UNDERWRITING
The Infrastructure Bank is offering the Bonds through RBC Capital Markets LLC (the “Representative”), as representative of the underwriters listed on the cover of this Official Statement (the “Underwriters”), pursuant to a bond purchase agreement (the “Bond Purchase Agreement”) among the Infrastructure Bank, CalSTRS, the State Treasurer and the Representative, relating to the Bonds. The Underwriters have agreed to purchase the Bonds at a purchase price of $339,793,007.33 (representing the principal amount of the Bonds of $272,605,000.00, less an underwriters’ discount of $795,064.42, plus an original issue premium of $67,983,071.75). The public offering prices of the Bonds may be changed from time to time by the Underwriters. The Bond Purchase Agreement provides that the Underwriters will purchase all the Bonds if any are purchased and that the obligations to make such purchases are subject to certain terms and conditions set forth in the Bond Purchase Agreement including, among other things, the approval of certain legal matters by their counsel.
Several of the Underwriters have provided letters to the State Treasurer setting forth certain information pertaining to the Underwriters, including, for certain Underwriters, information relating to their third-party distribution practices, for inclusion in this Official Statement, which letters are set forth in APPENDIX J - “LETTERS SUBMITTED BY UNDERWRITERS.” Neither the Infrastructure Bank nor CalSTRS guarantee the accuracy or completeness of the information contained in such letters and the information therein is not to be construed as a representation of the Infrastructure Bank, CalSTRS or any Underwriter other than the Underwriter providing such representation.
FORWARD-LOOKING STATEMENTS
Certain statements included or incorporated by reference in this Official Statement constitute “forward-looking statements.” Such statements are generally identifiable by the terminology used such as

32
“anticipates,” “believe,” “could,” “plan,” “expect,” “estimate,” “budget,” “intend,” “projected” or other similar words.
THE ACHIEVEMENT OF CERTAIN RESULTS OR OTHER EXPECTATIONS CONTAINED IN SUCH FORWARD-LOOKING STATEMENTS INVOLVE KNOWN AND UNKNOWN RISKS, UNCERTAINTIES AND OTHER FACTORS WHICH MAY CAUSE ACTUAL RESULTS, PERFORMANCE OR ACHIEVEMENTS DESCRIBED TO BE MATERIALLY DIFFERENT FROM ANY FUTURE RESULTS, PERFORMANCE OR ACHIEVEMENTS EXPRESSED OR IMPLIED BY SUCH FORWARD-LOOKING STATEMENTS. CALSTRS DOES NOT PLAN TO ISSUE ANY UPDATES OR REVISIONS TO SUCH FORWARD-LOOKING STATEMENTS IF OR WHEN ITS EXPECTATIONS, OR EVENTS, CONDITIONS OR CIRCUMSTANCES ON WHICH SUCH FORWARD-LOOKING STATEMENTS ARE BASED OCCUR.
RATINGS
Moody’s Investors Service (“Moody’s”), S&P Global Ratings, a division of Standard & Poor’s Financial Services LLC (“S&P”), and Fitch Ratings Inc. (“Fitch”) have assigned ratings of “A1,” “A+” and “AA,” respectively, to the Bonds. Such ratings reflect only the views of such organizations and an explanation of the significance of each such rating may be obtained from the respective rating agency. There is no assurance that such ratings will continue for any given period of time or such ratings will not be revised downward or withdrawn entirely by such organizations, if, in their judgment, circumstances so warrant. Any such downward revision or withdrawal of such ratings may have an adverse effect on the market price or marketability of the Bonds.
LEGAL MATTERS
Legal matters incidental to the authorization and issuance of the Bonds are subject to the approving opinion of Orrick, Herrington & Sutcliffe LLP, Bond Counsel to the Infrastructure Bank, the form of which is included as APPENDIX G - “PROPOSED FORM OF BOND COUNSEL OPINION” attached hereto. Bond Counsel undertakes no responsibility for the accuracy, completeness or fairness of this Official Statement. The legal fees to be paid to Bond Counsel at the time the Bonds are delivered, for services rendered in connection with the issuance of the Bonds, are contingent upon the sale and delivery of the Bonds.
Certain legal matters will be passed upon for the Infrastructure Bank by its Senior Staff Counsel; for CalSTRS by its Office of General Counsel and Stradling Yocca Carlson & Rauth, a Professional Corporation, Disclosure Counsel to CalSTRS; and for the Underwriters by Hawkins Delafield & Wood LLP, counsel to the Underwriters.
FINANCIAL STATEMENTS
CalSTRS’ Comprehensive Annual Financial Report (“CAFR”) includes the audited financial statements of CalSTRS for the fiscal year ended June 30, 2018, which is included in APPENDIX A – “CALSTRS COMPREHENSIVE ANNUAL FINANCIAL REPORT FOR THE FISCAL YEAR ENDED JUNE 30, 2018” to this Official Statement. The CAFR for the fiscal year ended June 30, 2019 will not be available until January 2020. However, the basic financial statements that will be included in the 2019 CAFR have been audited and are included in APPENDIX B – INDEPENDENT AUDITOR’S REPORT, BASIC FINANCIAL STATEMENTS, REQUIRED SUPPLEMENTARY INFORMATION AND OTHER SUPPLEMENTARY INFORMATION FOR THE FISCAL YEAR ENDED JUNE 30, 2019” herein.
The basic financial statements have been examined by Crowe LLP, independent certified public accountants, to the extent and for the periods indicated in its report. Crowe LLP, the independent auditor for CalSTRS, has not been engaged to perform and has not performed, since the date of its report included herein,

33
any procedures on the financial statements addressed in that report. Crowe LLP also has not performed any procedures relating to this Official Statement.
All references to “net assets” in this Official Statement are to net assets available for benefits, as presented as “Net Position” in the CAFR and in the basic financial statements. Certain financial measures are not based on Generally Accepted Accounting Principles (“GAAP’) but are presented as key metrics to enable readers to better understand CalSTRS performance, including investment results by asset group. Such non-GAAP financial measures do not have any standardized meaning and may not be comparable with similar measures used by other companies or pension plans. These should not be viewed as an alternative to measures of financial performance determined in accordance with GAAP.
CONTINUING DISCLOSURE
No financial or operating data concerning the Infrastructure Bank is being included or incorporated by reference in this Official Statement, and the Infrastructure Bank has not agreed to provide any such financial or operating data either currently or on an on-going basis. CalSTRS has covenanted for the benefit of the registered owners and Beneficial Holders of the Bonds to provide certain financial information and operating data relating to the Bonds (the “Annual Report”) not later than the first business day of February each year, commencing with the report for the fiscal year ended June 30, 2019, and to provide notices of the occurrence of certain enumerated significant events. The Annual Report and the notices of significant events will be filed with the Municipal Securities Rulemaking Board through the Electronic Municipal Market Access (EMMA) System. The specific nature of the information to be contained in the Annual Report and in the notice of significant events is summarized in APPENDIX H - “FORM OF CONTINUING DISCLOSURE CERTIFICATE” herein. These covenants have been made in order to assist the Underwriters of the Bonds in complying with Securities and Exchange Commission Rule l5c2-l2(b)(5) (the “Rule”). CalSTRS has not previously entered into a continuing disclosure undertaking.

34
MISCELLANEOUS
Any statements made in this Official Statement involving estimates or matters of opinion, whether or not so expressly stated, are set forth as such and not as representations of fact, and no representation is made that any of the estimates or matters of opinion will be realized. Neither this Official Statement nor any statement that may have been made orally or in writing is to be construed as a contract with the Owners or the beneficial owners of the Bonds.
The Infrastructure Bank makes no representations or warranties whatsoever with respect to any information contained herein except for information contained in the section entitled “THE INFRASTRUCTURE BANK” and “ABSENCE OF MATERIAL LITIGATION - The Infrastructure Bank.”
California State Teachers’ Retirement System
By:____________/s/Julie Underwood________________________ Chief Financial Officer

APPENDIX A
CALSTRS COMPREHENSIVE ANNUAL FINANCIAL REPORT FOR THE FISCAL YEAR ENDED JUNE 30, 2018

[THIS PAGE INTENTIONALLY LEFT BLANK]


A Component Unit of the State of California Comprehensive Annual Financial Report for the Fiscal Year Ended June 30, 2018
Prepared by CalSTRS Staf f
CALIFORNIA STATE TEACHERS’ RETIREMENT SYSTEM

Securing the financial future and sustaining the trust of California’s educators
STRATEGIC GOALS FinancialEnsure a financially sound retirement system.
Member/EmployerEnhance services to members and employers.
Business TransformationDrive operational excellence.
Workforce TransformationGrow an engaged, highly skilled and diverse workforce.
MISSION

This page intentionally left blank.

CONTENTSIntroductory
9 Letter of Transmittal
16 Award: Government Finance Officers Association (GFOA) Certificate
17 Award: Public Pension Coordinating Council (PPCC)
18 Teachers’ Retirement Board
19 Executive Staff
20 Year in Review
Financial
27 Independent Auditor’s Report
30 Management’s Discussion and Analysis (Unaudited)
Basic Financial Statements56 Statement of Fiduciary Net Position
57 Statement of Changes in Fiduciary Net Position
58 Notes to the Basic Financial Statements
Required Supplementary Information (Unaudited)94 Schedule of Changes in Net Pension Liability of Employers and Nonemployer Contributing Entity
95 Schedule of Net Pension Liability of Employers and Nonemployer Contributing Entity
96 Schedule of Pension Contributions from Employers and Nonemployer Contributing Entity
97 Schedule of Money-Weighted Investment Returns for State Teachers’ Retirement Plan and Medicare Premium Payment Program
98 Schedule of Changes in Net OPEB Liability of Employers
99 Schedule of Net OPEB Liability of Employers
Other Supplementary Information
101 Schedule of Administrative Expenses
102 Schedule of Investment Expenses
106 Schedule of Consultant and Professional Services Expenses
Investments
111 Investment Consultants’ Reports
114 Table 1 Market Value of Investments
115 Table 2 10 Years of Time-Weighted Annual Returns
115 Table 3 Time-Weighted Returns
116 Table 4 Time-Weighted Returns Net of Fees by Portfolio Types
117 Table 5 Largest Public Equity Holdings
118 Table 6 Largest Fixed Income Holdings
121 Table 7 Investment Summary for the Current and Previous Fiscal Year
121 Table 8 Investment Expenses
122 Table 9 Broker Commissions
Actuarial
Defined Benefit (DB) Program and Schedules127 Actuary’s Certification Letter—DB Program
130 Actuarial Methods
131 Actuarial Assumptions
131 Changes Since Prior Valuation
131 Valuation Results
132 Independent Actuarial Review
132 Summary of Defined Benefit Program Provisions
136 Table 1 Postretirement Mortality for Sample Ages
136 Table 2 Probabilities of Retirement for Sample Ages
136 Table 3 Probabilities of Withdrawal from Active Service Before Age and Service Retirement for Sample Duration in Years
136 Table 4 Probabilities of Refund by Sample Duration in Years of Members and Sample Entry Ages
137 Table 5 Assumption for Pay Increases Due to Promotions and Longevity for Sample Ages in Years
137 Table 6 Economic Assumptions
137 Table 7 Mortality Assumptions
138 Table 8 Disability Rates for Sample Ages

CONTENTS
Cash Balance Benefit (CBB) Program and Schedules
152 Actuary’s Certification Letter—CBB Program
154 Actuarial Methods
154 Actuarial Assumptions
155 Changes Since Prior Valuation
155 Valuation Results
155 Independent Actuarial Review
155 Summary of Cash Balance Benefit Program Provisions
158 Table 1 Postretirement Mortality for Sample Ages
158 Table 2 Probabilities of Retirement for Sample Ages
158 Table 3 Probabilities of Withdrawal from Active Service Before Age and Service Retirement for Sample Duration in Years
159 Table 4 Assumption for Pay Increases Due to Promotions and Longevity for Sample Ages in Years
159 Table 5 Economic Assumptions
159 Table 6 Mortality Assumptions
160 Table 7 Disability Rates for Sample Ages
160 Table 8 Schedule of Active Participant Valuation Data
161 Table 9 Schedule of Retired Participants and Beneficiaries Added to and Removed from Annuity Rolls
161 Table 10 Solvency Test
162 Table 11 Analysis of Financial Experience
162 Table 12 Schedule of Funding Progress
Medicare Premium Payment (MPP) Program and Schedules
163 Actuary’s Certification Letter—MPP Program
165 Actuarial Methods
165 Actuarial Assumptions
166 Changes Since Prior Valuation
166 Valuation Results
166 Independent Actuarial Review
166 Summary of Medicare Premium Payment Program Plan Provisions
Actuarial (continued)
138 Table 9 Supplemental Assumptions
139 Table 10 Schedule of Active Member Valuation Data
139 Table 11 Schedule of Retired Members and Beneficiaries Added to and Removed from Rolls
140 Table 12 Solvency Test
140 Table 13 Analysis of Financial Experience
141 Table 14 Schedule of Funding Progress
Defined Benefit Supplement (DBS) Program and Schedules
142 Actuary’s Certification Letter—DBS Program
144 Actuarial Methods
144 Actuarial Assumptions
145 Changes Since Prior Valuation
145 Valuation Results
145 Independent Actuarial Review
145 Summary of Defined Benefit Supplement Program Provisions
147 Table 1 Postretirement Mortality for Sample Ages
147 Table 2 Probabilities of Retirement for Sample Ages
147 Table 3 Probabilities of Withdrawal from Active Service Before Age and Service Retirement for Sample Duration in Years
148 Table 4 Assumption for Pay Increases Due to Promotions and Longevity for Sample Ages in Years
148 Table 5 Economic Assumptions
148 Table 6 Mortality Assumptions
149 Table 7 Disability Rates for Sample Ages
149 Table 8 Schedule of Active Member Valuation Data
150 Table 9 Schedule of Retired Members and Beneficiaries Added to and Removed from Annuity Rolls
150 Table 10 Solvency Test
151 Table 11 Analysis of Financial Experience
151 Table 12 Schedule of Funding Progress

Actuarial (continued)
167 Benefits Paid
168 Table 1 Postretirement Mortality for Sample Ages
168 Table 2 Probabilities of Retirement for Sample Ages
168 Table 3 Probabilities of Withdrawal from Active Service Before Age and Service Retirement for Sample Ages in Years
169 Table 4 Probability of Refund
169 Table 5 Economic Assumptions
169 Table 6 Mortality Assumptions
169 Table 7 Service Retirement for Sample Ages
169 Table 8 Disability Rates for Sample Ages
170 Table 9 Schedule of Medicare Part A Enrollment Rates
170 Table 10 Schedule of Retired Members Added to and Removed from Medicare Part A Premium Rolls
171 Table 11 Solvency Test
171 Table 12 Analysis of Financial Experience
172 Table 13 Schedule of Funding Progress
Statistical
175 Statistical Overview
State Teachers’ Retirement Plan Schedules
177 Table 1 Changes in Fiduciary Net Position for the State Teachers’ Retirement Plan
178 Table 2 Benefit and Refund Deductions from Fiduciary Net Position by Type
Defined Benefit Program Schedules
179 Table 1 Active Member Characteristics
179 Table 2 Members Retired for Service During Fiscal Year 2017–18, Classified by Unmodified Allowance
180 Table 3 Members Retired for Service During Fiscal Year 2017–18, Classified by Age and Joint & Survivor Option Elected
181 Table 4 Characteristics of Members Going on Disability During Target Fiscal Year
181 Table 5 Total Number of Benefit Recipients by Type of Benefit
182 Table 6 Members Retired for Service Characteristics by Year of Retirement
185 Table 7 Members Retired for Service Characteristics
186 Table 8 Retired Members by Type of Benefit and Option Elected
187 Table 9 Principal Participating Defined Benefit and Defined Benefit Supplement Employers for Current Year and Nine Years Ago
188 Table 10 Average Allowance Purchasing Power for Fiscal Year 2017–18
190 Table 11 Restoration of Allowance Purchasing Power Through Supplemental Benefit Payments
Defined Benefit Supplement Program Schedules
191 Table 1 Members Retired for Service During Fiscal Year 2017–18, Classified by Age and Option Elected
192 Table 2 Characteristics of All Members Retired for Service and Receiving an Annuity
192 Table 3 Characteristics of All Members Retired for Disability and Receiving an Annuity
193 Table 4 Retired Members by Type of Benefit and Option Elected
Cash Balance Benefit Program Schedules
194 Table 1 Participants Retired for Service During the 2017–18 Fiscal Year Classified by Age and Type of Annuity Elected
195 Table 2 Characteristics of All Members Retired for Service and Receiving an Annuity
195 Table 3 All Participants Receiving an Annuity by Type of Benefit and Type of Annuity Elected
196 Table 4 Principal Participating Employers for the Cash Balance Benefit Program, Current Year and Nine Years Ago
Programs Administered or Overseen by the Retirement System (Pension2)
197 Table 1A Changes in Fiduciary Net Position for the Pension2 IRC 403(b) Plan
197 Table 1B Changes in Fiduciary Net Position for the Pension2 IRC 457(b) Plan
198 Table 2 Largest Participating Employers for CalSTRS Pension2, Current Year and Nine Years Ago
CONTENTS

Statistical (continued)
Medicare Premium Payment Program
199 Table 1 Changes in Fiduciary Net Position for the Medicare Premium Payment Program
199 Table 2 Benefit and Refund Deductions from Changes in Fiduciary Net Position by Type
200 Table 3 Retired Members Enrolled in Medicare Premium Payment Program During Fiscal Year 2017–18 Classified by Age at Retirement
200 Table 4 Characteristics of All Retired Members Enrolled in Medicare Premium Payment Program
Teachers’ Deferred Compensation Fund
201 Table 1 Changes in Fiduciary Net Position for the Teachers’ Deferred Compensation Fund
CONTENTS

9INTRODUCTORY
The Comprehensive Annual Financial Report issued by the California State Teachers’ Retirement System (CalSTRS) details the system’s performance for the fiscal year beginning July 1, 2017, and ending June 30, 2018.
Year after year, CalSTRS continues to underscore and emphasize the need to look over a long-term, 30-year horizon and well beyond the immediate impacts of any short-term results. We take our responsibility as trusted fiduciaries seriously by taking deliberate actions and making informed, accountable decisions to ensure a fully sustainable organization. It is this unwavering commitment to stewardship that enables us to be here for our members long after they dedicate their careers to educating California’s youth, as we steadfastly deliver on the promise of a secure retirement future.
CalSTRS was established more than a century ago in 1913 as the pension plan for California’s public school educators. The organization began by representing 120 retired members and 15,000 active members. Over the past 105 years, we have grown to represent nearly 950,000 dedicated educators and their beneficiaries by helping them reach their secure retirement future. As of June 30, 2018, CalSTRS employed close to 1,200 staff statewide at our headquarters in West Sacramento, as well as at our Member Service Centers in Northern and Southern California.
As a global institutional investor with $223.8 billion in portfolio assets as of June 30, 2018, CalSTRS has a fiduciary duty to be principled and effective within our operations in order to meet the financial commitments to our membership for the next century and beyond. By modeling best practices in retirement planning education for our members, adhering to innovative corporate governance principles, and exercising our role as an active shareowner through engagement with portfolio companies, CalSTRS consistently advocates for the importance of corporate sustainability and long-term value creation.
CalSTRS Commitment to Global Stewardship at WorkCalSTRS demonstrates our commitment to securing our members’ retirement futures and organizational sustainability by modeling best practices in corporate governance, employing risk-mitigation policies, developing workforce succession plans and dedicating resources to increase our members’ financial awareness and retirement security. Across the spectrum of our activities, we consistently advocate for the importance of long-term value creation. In fact, long-term value creation continues to be the essence of our commitment to the cohesive theme of “Global Stewardship at Work,” which is reinforced across the family of CalSTRS annual reports.
As a global, institutional investor, CalSTRS has a fiduciary duty to be principled and effective within our operations to meet financial commitments for the next century and beyond. We believe that establishing a corporate environment with sustainable values is a blueprint for better governance and increased profitability. This Comprehensive Annual Financial Report, covering the 2017–18 fiscal year, illustrates the power of global stewardship and how we continue to manage resources and our fund with great diligence and care, in fulfilling our commitment to being a fully sustainable organization.
California State Teachers’Retirement System
100 Waterfront PlaceWest Sacramento, CA 95605
December 3, 2018
INTRODUCTORY
Letter of Transmittal

10 CALSTRS COMPREHENSIVE ANNUAL FINANCIAL REPORT 2018
Helping Members Build for the Future: The Importance of Retirement PlanningCalSTRS’ relationship with our members begins when they first enter their teaching careers and extends through their retirement years. On average, our members dedicate more than 25 years to educating California’s youth and retire at just under 63 years of age, with an income replacement ratio of approximately 50 to 60 percent of their working salary. And, according to data outlined in our most recent actuarial experience study, our members are living longer in retirement.
Reflecting on the longevity of our members’ careers and their increased lifespans, CalSTRS dedicates resources to emphasize awareness, outreach and education to provide members with retirement planning tools throughout their careers. We offer a financial awareness workshop series that emphasizes the importance of supplemental savings plans in addition to the defined benefit pension. Members are educated on the impactful difference they can make by saving early in their careers when they can benefit most from the power of time and compounding. Additionally, CalSTRS provides members with tools to determine their financial goals throughout their career stages so they are better prepared for the future that lies ahead of them in retirement.
CalSTRS also provides members with a variety of financial education tools, including the robust 403bCompare.com website, the only comprehensive resource in the U.S. providing fee-cost comparisons by product type for 403(b) supplemental savings plans. By providing these financial awareness and retirement planning tools, we aim to empower our members as they embark on a well-thought-out plan and identify steps they can take to meet their future income needs.
Investment Returns and Balancing RiskStewardship at CalSTRS includes implementing responsible investing strategies. As a long-term, 30-year horizon investor, we take steps to mindfully balance risk with opportunity in order to preserve the integrity and strength of the fund. Managing a multi-billion dollar portfolio requires thoughtful diligence to monitor investment performance, analyze projections, and take necessary actions to ensure a stable, risk-adjusted return profile. And though CalSTRS is largely a passive equity investor, we take an active shareowner role by regularly engaging with our portfolio companies to ensure responsible corporate governance practices, board diversity, and ultimately, performance accountability to their shareholders.
The overall fund earned a 9.0 percent (net of fees) investment return for the fiscal year ended June 30, 2018, which exceeded the actuarially assumed rate of return of 7.0 percent (net) used for funding purposes. The fiscal year saw strong double digit returns in both the public and private equity markets with the S&P 500 returning over 14 percent. CalSTRS was positioned well to take advantage of market growth while maintaining a diversified portfolio to provide risk protection through the full allocation to the Risk Mitigating Strategies asset class. Given the focus on long-term funding to protect the funds’ value, these strategies are important to avoid losses experienced during market downturns such as the historic 2008 global financial crisis.
INTRODUCTORY

11INTRODUCTORY
Ongoing Progress on Defined Benefit Plan FundingAs trusted fiduciaries, CalSTRS staff and third-party experts continually monitor the financial health of the fund by providing an actuarial valuation and funding levels risk report to the Teachers’ Retirement Board every year.
The funding plan, set in motion in July 2014 via Chapter 47, Statutes of 2014 (Assembly Bill 1469—Bonta), established a predictable schedule of contribution rate increases shared between members, employers and the state over a 32-year span to bring CalSTRS toward full funding by 2046. The funding plan is a model of shared responsibility, and it works together with investment portfolio performance to advance CalSTRS along the path of long-term sustainability.
While CalSTRS continues to deal with a gap between its current assets and the obligations facing the system, known as the unfunded actuarial obligation (or unfunded liability), the system continues to make progress toward reducing the funding shortfall. A snapshot of the Defined Benefit Program’s assets and liabilities as reported in the June 30, 2017, actuarial valuation (released in May 2018) reflected an increase of $10.6 billion in the unfunded liability, currently at $107.3 billion. This increase was anticipated and occurred primarily due to the adoption of a lower investment return assumption and the increase in member life expectancies. These changes also caused a decrease in the system’s funding ratio—the ratio of the smoothed actuarial value of assets to pension obligations—from 63.7 percent to 62.6 percent. Actuarial experts and consultants expect an upward trajectory during the coming years as progress is made on the gradual path to reach full funding by the year 2046.
Also, it is important to note that these actuarial valuation numbers are computed differently than the Net Pension Liability (NPL) amounts as defined by Governmental Accounting Standards Board pronouncements, which are reported in the Financial Statements (Note 3–Net Pension Liability of Employers and Nonemployer Contributing Entity) section of this report.
Transforming Sustainability Through EngagementAs an active shareowner, CalSTRS continues to focus on expanding our direct engagement efforts with stakeholders and business partners in order to effect positive change within our portfolio companies. Moreover, CalSTRS regularly engages our non-investment related business partners in surveys to assess levels of sustainable commitment within their organizations. The results continue to be impressively positive, indicating that the shift to embrace sustainable business practices is more than just a trend.
In general, the market showed improved governance, accountability and transparency. Certain companies, however, remain outliers by retaining large executive pay packages, lack of board diversity or archaic governance practices. As a long-term, active shareowner, CalSTRS’ duty is to protect assets through the pursuit of good governance and operational accountability, and we are steadfastly pursuing this charge well into the future.
INTRODUCTORY

12 CALSTRS COMPREHENSIVE ANNUAL FINANCIAL REPORT 2018
Creating Long-Term ValueAs with any mature financial services organization, CalSTRS maintains our focus on sustainability for the future by balancing the challenges of managing assets and liabilities, investment gains and losses, and operational growth—all in an effort to ultimately create long-term value. And just as it is mission-critical for CalSTRS to provide a defined benefit retirement for vested members who dedicated their careers to educating California’s youth, we also proactively take steps to provide members with financial tools and resources so they understand the importance of early retirement planning to meet their own personal financial needs well into the future.
For a complete understanding of CalSTRS’ performance and sustainability milestones, this Comprehensive Annual Financial Report (CAFR) should be reviewed in conjunction with our annual sustainability report based on Global Reporting Initiative standards. This report can be found online at CalSTRS.com/sustainability-reports.
Member ProfileEstablished 105 years ago, CalSTRS, with $223.8 billion in portfolio assets as of June 30, 2018, is the largest educator-only pension fund in the world. We administer retirement, disability and survivor benefits for California’s public school educators and their beneficiaries, from prekindergarten through community college. The Teachers’ Retirement Law, part of the California Education Code, established the programs with CalSTRS as the administrator. The law sets required member, employer and state contribution rates and provides the Teachers’ Retirement Board with limited authority to adjust the employer and state rates. CalSTRS members include employees of approximately 1,740 school districts, community college districts, county offices of education and regional occupational programs during the fiscal year. Our membership spans from the new teacher just starting out to the retired educator enjoying the fruits of decades of teaching in the classroom.
The median CalSTRS pension replaced just under 55 percent of final salary for the members who retired last year. Financial advisors recommend income replacement rates as high as 80 to 90 percent to maintain a similar lifestyle in retirement. Public educators do not receive Social Security benefits for their CalSTRS service. Moreover, due to the federal Government Pension Offset and Windfall Elimination Provision, retirees who are eligible for Social Security from other work or their spouse often have their Social Security benefits reduced when receiving a CalSTRS benefit. Most retired educators also do not have employer-funded health insurance after age 65.
We continue to reach members in their communities—from Crescent City to San Diego—with online services, benefits planning services and workshops that explain retirement options and stress the need for early savings. With web-based information and more than 40 publications, we strive to be our members’ trusted guide to retirement.
Financial StatementsThe financial statements and notes along with the Management Discussion and Analysis in this report present and analyze the changes in CalSTRS’ fiduciary net position for the fiscal year ended June 30, 2018. The markets are dynamic and fluid; any judgment of the financial statements should also consider current market conditions.
INTRODUCTORY

13INTRODUCTORY
Management Responsibility for Financial Reporting and Internal ControlsThe financial statements were prepared in accordance with accounting principles generally accepted in the United States. Management is responsible for the integrity and fairness of the information presented in the financial statements, including data that, out of necessity, is based on estimates and judgments. Management is also responsible for establishing and maintaining an effective internal control structure. A system of internal controls provides reasonable, but not absolute, assurance that assets are properly safeguarded and that financial statements are reliable. The concept of reasonable assurance recognizes that first, the cost of a control should not exceed the benefits likely to be derived; and second, the valuation of the cost and benefits requires estimates and judgments by management. We believe that the internal controls currently in place support this purpose, and that the financial statements, accompanying schedules and statistical tables are fairly presented in all material respects.
Investments OverviewThe CalSTRS Investment Portfolio is broadly diversified, holding investments ranging from publicly traded short-term bonds to privately held partnerships. The scale and breadth of investments make the management and oversight of these assets highly complex. In light of these factors, CalSTRS has been effective in using our resources in a cost-efficient manner to ensure benefits continue to flow to CalSTRS participants. Over the last year, the CalSTRS portfolio generated a 9.0 percent net one-year return calculated on a time-weighted performance basis.
See the Investments section for more detailed information on the performance of the CalSTRS Investment Portfolio.
Actuarial ReportsA summary of demographic and economic assumptions adopted from experience studies that CalSTRS conducts every four or five years is highlighted in this section. These assumptions are applied to an actuarial valuation that is generally performed on an annual basis. The actuarial valuation provides a picture of the overall funding health of our programs, including the Defined Benefit, Defined Benefit Supplement, Cash Balance Benefit and Medicare Premium Payment programs.
Statistical ReportsThis section includes tables that reflect financial trends of the State Teachers’ Retirement Plan and demographic characteristics of the Defined Benefit, Defined Benefit Supplement, Cash Balance Benefit, CalSTRS Pension2, and Medicare Premium Payment programs. Also captured in the tables, when applicable, is information comparing the last nine years to the previous fiscal year. This look back reveals overall trends in our programs and membership demographics that help us accurately forecast our future ability to meet our members’ retirement needs.
INTRODUCTORY

14 CALSTRS COMPREHENSIVE ANNUAL FINANCIAL REPORT 2018
GFOA AwardThe Government Finance Officers Association (GFOA) of the U.S. and Canada awarded a Certificate of Achievement for Excellence in Financial Reporting to CalSTRS for our CAFR for the year ended June 30, 2017. This is the 23rd consecutive year CalSTRS has received this prestigious award. To be awarded the certificate, a government unit must publish an easily readable and efficiently organized comprehensive annual financial report. Our report must satisfy both generally accepted accounting principles and applicable legal requirements.
A Certificate of Achievement is valid for a period of one year only. We believe that our current CAFR continues to meet the Certificate of Achievement Program’s requirements, and we are submitting it to the GFOA to determine its eligibility for another certificate.
PPCC Standards Award Program The Public Pension Coordinating Council (PPCC) presented CalSTRS with its Public Pension Standards Award for Funding and Administration for the fiscal year ended June 30, 2018, for meeting professional standards for funding and administration as set forth in the Public Pension Standards. The Public Pension Coordinating Council is a coalition of three national associations that represent public retirement systems and administrators. The associations that form the PPCC are the National Association of State Retirement Administrators, National Council on Teacher Retirement and National Conference on Public Employee Retirement Systems. Together, these associations represent more than 500 of the largest pension plans in the U.S. A Public Pension Standards Award is valid for a period of one year.
AcknowledgementsThe 2018 Comprehensive Annual Financial Report demonstrates our commitment to ensure the financial security of California’s educators. The accuracy of the financial data reflects CalSTRS’ executive leadership and is a duty performed with prudence in perpetuity. The notion that the ideas of the future are influenced by the day-to-day interactions that teachers have with students today drives the high quality of service we provide. I would like to thank the many staff, advisors and stakeholder organizations dedicated to serving and securing the financial future of our members. CalSTRS is a unique pension system and it is of utmost importance we continue to sustain the trust and financial integrity of our members in their retirement.
Respectfully submitted,
Jack Ehnes Chief Executive Officer CalSTRS
INTRODUCTORY

15INTRODUCTORY
This page intentionally left blank.

16 CALSTRS COMPREHENSIVE ANNUAL FINANCIAL REPORT 2018
AWARD: GOVERNMENT FINANCE OFFICERS ASSOCIATION (GFOA) CERTIFICATE

17INTRODUCTORY
AWARD: PUBLIC PENSION COORDINATING COUNCIL (PPCC)
Public Pension Coordinating Council
Public Pension Standards Award For Funding and Administration
2018
Presented to
California State Teachers' Retirement System In recognition of meeting professional standards for
plan funding and administration as set forth in the Public Pension Standards.
Presented by the Public Pension Coordinating Council, a confederation of
National Association of State Retirement Administrators (NASRA) National Conference on Public Employee Retirement Systems (NCPERS)
National Council on Teacher Retirement (NCTR)
Alan H. Winkle Program Administrator
P CP C

18 CALSTRS COMPREHENSIVE ANNUAL FINANCIAL REPORT 2018
BETTY YEE State Controller Ex-Officio Member
TOM TORLAKSON State Superintendent of Public Instruction Ex-Officio Member
JOY HIGA Public Representative Term: January 19, 2018 – December 31, 2021
PAUL ROSENSTIEL Public Representative Term: January 1, 2015 – December 31, 2018
SHARON HENDRICKS Board Vice Chair Community College Instructor Term: January 1, 2016 – December 31, 2019
JOHN CHIANG State Treasurer Ex-Officio Member
KEELY BOSLER Director of Finance Ex-Officio Member
TEACHERS’ RETIREMENT BOARD*
HARRY M. KEILEY K–12 Classroom Teacher Term: January 1, 2016 – December 31, 2019
KAREN YAMAMOTO Retiree Representative Term: April 17, 2017 – December 31, 2019
NORA E. VARGAS School Board Representative Term: January 1, 2016 – December 31, 2019
DANA DILLON Board Chair K–12 Classroom Teacher Term: January 1, 2016 – December 31, 2019
* Board members are listed as of the date this report is issued.
VACANT Public Representative

19INTRODUCTORY
JACK EHNES Chief Executive Officer
CHRISTOPHER AILMAN Chief Investment Officer
ASHISH JAIN Chief Technology Officer
ANDREW ROTH Benefits and Services Executive Officer
CASSANDRA LICHNOCK Chief Operating Officer
JULIE UNDERWOOD Chief Financial Officer
Executive
Investments
Technology Services
Financial Services
Benefits and ServicesAdministrative Services
BRIAN J. BARTOW General Counsel
General Counsel
GRANT BOYKEN Public Affairs Executive Officer
LISA BLATNICK Chief of Administrative Services
Public Affairs
EXECUTIVE STAFF*
* Executive staff are listed as of the date this report is issued.

20 CALSTRS COMPREHENSIVE ANNUAL FINANCIAL REPORT 2018
MembershipMembership in the CalSTRS Defined Benefit Program includes California public school employees, prekindergarten through community college, who teach or who are involved in selecting and preparing instructional materials, provide vocational or guidance counseling or are supervising people engaged in those activities. Membership is in effect as long as contributions remain on deposit with CalSTRS.
Members are employed in approximately 1,740 public school districts, community college districts, county offices of education, regional occupational centers and programs, and select state agencies. The CalSTRS Defined Benefit Program includes retirement, disability and survivor benefits. Beneficiaries of a retired member who elected an option receive a continuing lifetime benefit upon the member’s death.
Active Members449,595
Inactive Members198,058
Retired Members264,780
Survivor Benefit Recipients26,990
Disability Benefit Recipients10,089
YEAR IN REVIEW
*Due to the timing of when membership numbers were pulled, there will be a difference between the numbers reported in this section and the Financial Section.
MEMBERS BY THE NUMBERS
Total Membership 949,512*

21INTRODUCTORY
Benefits to Members and Benefit Recipients Service Retirement
CalSTRS is committed to providing exceptional service to its retired members. Our staff establishes and maintains timely and accurate benefits.
12,778 Members who retired in fiscal year 2017–18
4.3 percent Increase from fiscal year 2016–17
Disability Benefits
93 percent Applications processed within 150 days
734 Applications received in 2017–18
434 Applications approved in 2017–18
10.0 percent Increase in number of disability applications received from fiscal year 2016–17
Survivor Benefits
96 percent Payments processed within 30 days of receiving all necessary information
9,553 Notifications of death received in 2017–18
5.9 percent Increase in number of notifications from fiscal year 2016–17
Communicating With Our Members and BeneficiariesCustomer Service
Members may contact a CalSTRS Contact Center agent by phone, secured online message or written correspondence.
293,415 Member inquiries answered
71 percent Member calls answered within 30 seconds
87 seconds Average wait time to talk with a Contact Center agent
73 percent Members who received a response to their secure online message within one business day
CalSTRS places great emphasis on customer satisfaction and regularly surveys members to ensure they receive accurate, timely and thorough answers to their questions.
76 percent of members were “highly satisfied” with their Contact Center experience.
Member Communications
CalSTRS communicates with its active and retired members through a variety of channels.
Newsletters
CalSTRS reaches out to members and beneficiaries through the CalSTRS Connections: Reaching Your Retirement, CalSTRS Connections: Your Money Matters and Retired
Educator newsletters.
CalSTRS Connections: Reaching Your Retirement is sent in the spring and fall to active and inactive members age 50 and older. It provides information about retirement planning and decisions, workshops and benefits counseling, legislative news and more.
CalSTRS Connections: Your Money Matters is sent in the spring and fall to active and inactive members age 49 and younger. It provides updates on CalSTRS programs and services, articles on retirement benefits, supplemental savings options, financial planning, legislative news and more.
Retired Educator is sent to retired members and beneficiaries in the summer and winter. It provides information on benefits and services, legislation, investments and board updates.
Retirement Progress Report
Every year Defined Benefit members and Cash Balance Benefit participants receive a personalized Retirement
Progress Report that contains retirement planning information and detailed account information as of June 30 for the fiscal year. For Defined Benefit members age 45 and older, the report includes retirement benefit estimates. The reports are available online in September in the member’s myCalSTRS account and are mailed in October if requested. Retired members and other benefit recipients do not receive this report.
YEAR IN REVIEW

22 CALSTRS COMPREHENSIVE ANNUAL FINANCIAL REPORT 2018
Member Informational Publications
CalSTRS offers a number of publications to members at various stages in their careers.
The CalSTRS Member Handbook is a comprehensive resource on CalSTRS programs and benefits, including eligibility requirements and worksheets. The handbook is updated annually.
Your Retirement Guide provides information members need to plan, research and make retirement decisions regarding their defined benefit pension and Defined Benefit Supplement funds. It includes step-by-step instructions for applying for service retirement and what to expect after submitting the retirement application.
CalSTRS Member Kits contain targeted retirement information and are sent annually to three groups of CalSTRS members when they reach a career milestone. The three career milestones—newly vested, mid-career and near retirement—are based on the member’s age and years of service credit.
In addition, CalSTRS produces publications that cover specific topics, including:
• Cash Balance Benefit Program
• Community Property Guide
• Concurrent Retirement
• Introduction to Disability Benefits
• Join CalSTRS? Join CalPERS?
• myCalSTRS
• Pension2 ebook
• Purchase Additional Service Credit
• Refund: Consider the Consequences
• Social Security, CalSTRS and You
• Tax Considerations for Rollovers
• Understanding the Formula
• Uniformed Services Employment and Reemployment
Rights Act
• Your Disability Benefits Guide
• Welcome to CalSTRS
• Working After Retirement
CalSTRS Online
CalSTRS has four websites for members: CalSTRS.com, myCalSTRS, Pension2.com and 403bCompare.com.
CalSTRS.com is the main site for information about membership and benefits, investments, board meetings, our newsroom and business partner opportunities, and also includes links to information for employers, including the Secure Employer Website. Features include online calculators to estimate retirement benefits and the cost to purchase service credit or redeposit funds; CalSTRS publications and forms; recent CalSTRS news including, an investment overview; and self-scheduling for workshops and benefits planning sessions.
myCalSTRS, our secure self-service site for members, provides convenient access to members’ personal accounts. After registering for myCalSTRS, members can view their account balances, complete and submit forms online, keep their contact information current, view their Retirement
Progress Reports, manage their beneficiary selections, and exchange secure messages with CalSTRS representatives.
Pension2.com is the website for Pension2, the CalSTRS defined contribution plan that offers 403(b) and 457(b) plans. It features online enrollment, financial planning tools
and webinars.
At 403bCompare.com members can easily compare investment fees, performance and services of their employer’s 403(b) plans to find the best one for their savings goals. Members can learn about the advantages of a 403(b) account, find their employer’s list of approved vendors, compare up to three 403(b)s side by side and get information on how to enroll and start contributions. 403bCompare was created by CalSTRS under state legislation.
Members can also stay connected to CalSTRS through social media on Facebook, Twitter, Instagram, LinkedIn, YouTube and Pinterest.
YEAR IN REVIEW

23INTRODUCTORY
Benefits Planning Services
CalSTRS has six member service centers: West Sacramento (headquarters), Glendale, Santa Clara, Irvine, Riverside and San Diego.
Member service centers offer educational and benefits planning services, including individual and group benefits planning sessions and financial savings workshops. Existing member service centers serve the greater Sacramento, Los Angeles, Bay Area, Orange County, the Inland Empire and San Diego regions. Offices are open Monday through Friday, 8 a.m. to 5 p.m. and some Saturdays by appointment.
At each center, members have an opportunity to attend educational workshops, meet with CalSTRS benefits specialists by appointment or seek assistance with general information questions on a walk-in basis. Member service center staff also review and receive forms, transmit them to headquarters for processing, and provide CalSTRS forms and publications.
In addition to the member service centers, CalSTRS has one leased office space staffed by CalSTRS staff and seven benefits planning offices located in county offices of education across the state. These offices typically provide workshops, group and individual benefits planning sessions and walk-in assistance, in addition to reviewing and receiving completed forms.
This year, 29,805 members attended group or individual benefits planning sessions or workshops, while 13,464 members took advantage of the opportunity to walk in and receive immediate assistance. An additional 5,039 members received services at outreach events, including job fairs and on-campus presentations.
Since the launch of our Business Plan for fiscal year 2017–18, we have increased our efforts in regards to member-employer engagement. This has led to more outreach working directly with stakeholders which includes school districts, various unions and other teacher organizations. Through this outreach, we have more than doubled the teachers we have met with through outreach activities.
Another convenient service for members is the estimate-only service, which during fiscal year 2017–18, provided 1,833 members with updated retirement benefit estimates. CalSTRS continues to focus on providing services that increase accessibility for members, reflect individual member needs and increase member self-education.
Services to Employers, Member and Client OrganizationsCalSTRS staff supports the employer reporting process through education, collaboration and continuous improvement. CalSTRS has enhanced the delivery of information by making it available electronically and on demand for the employer. The Secure Employer Website, SEW, a secure solution for employers to submit their monthly reporting data, includes checks and balances to ensure the data is timely and accurate. In addition, CalSTRS is committed to ensuring our employers have all the information and training necessary to provide the most accurate data reporting.
CalSTRS is committed to preventing pension abuse by automating the review of compensation credited to retirement benefits. The CalSTRS Compensation Review Unit has increased reviews of potential abuse cases through the Pension Abuse Reporting Hotline and online reporting form.
Professional ServicesCalSTRS contracts for the services of various independent consultants essential to the effective and professional operation of the system. Milliman, Inc. provides actuarial services and Crowe LLP is the independent auditor. Lists of investment professionals for investment services and other consultants are provided on Schedules VIII and IX respectively in the Financial Section of this report. Table 9 in the Investments Section also lists entities to whom CalSTRS paid broker commissions during the fiscal year.
YEAR IN REVIEW

24 CALSTRS COMPREHENSIVE ANNUAL FINANCIAL REPORT 2018
This page intentionally left blank.

25FINANCIAL
27 Independent Auditor’s Report
30 Management’s Discussion and Analysis (Unaudited)
Basic Financial Statements
56 Statement of Fiduciary Net Position
57 Statement of Changes in Fiduciary Net Position
58 Notes to the Basic Financial Statements
Required Supplementary Information (Unaudited)
94 Schedule of Changes in Net Pension Liability of Employers and Nonemployer Contributing Entity
95 Schedule of Net Pension Liability of Employers and Nonemployer Contributing Entity
96 Schedule of Pension Contributions from Employers and Nonemployer Contributing Entity
97 Schedule of Money-Weighted Investment Returns for State Teachers’ Retirement Plan and Medicare Premium Payment Program
98 Schedule of Changes in Net OPEB Liability of Employers
99 Schedule of Net OPEB Liability of Employers
Other Supplementary Information
101 Schedule of Administrative Expenses
102 Schedule of Investment Expenses
106 Schedule of Consultant and Professional Services Expenses
CalSTRS is the largest educator-only pension fund in the world, with $225.8 billion in net position as of June 30, 2018.
FINANCIAL

26 CALSTRS COMPREHENSIVE ANNUAL FINANCIAL REPORT 2018
This page intentionally left blank.

27FINANCIAL
�������������������������� ������������ �
��
��������������������������������������� !����"������#������$����� ��"$���"��������������� !����"�������% ���&� �����������'� ��"$���"� ��������� ������� � ������������ ����&����(���)�"���������������%"�*�$"����"��� ������� ��$� ��"$���"��������������� !����"�������% ���+,�% ��-����, ������-.'������������)�"���$������������$� ��"$���"�'�� ��$�����$�������%����������/)���01'�2134'����� ���� ������������ � ��� ���� $"����"��� ������� '���"����������"(��%�����" �� �����% ��! ��� "��$"����"��� ������� �� ��" ����"�������������$�������� 5��Management’s Responsibility for the Financial Statements ���*����� " � �� ��� "���� $��� ���� ��������"��� ���� $�"�� ��� �����"��� �$� ��� �� $"����"��� ������� � "��������������"�������)��"�*���"��"��� �*�������%����������"��������"��������� ��$����"��6���" �"���)�� ������� "*�'� "��������"��'� ���� �"��������� �$� "�������� �������� ����(���� ��� ���� ��������"��� ���� $�"����� �����"����$�$"����"��� ������� ����������$����$�������"���" �������'����������)�����$��)����������5���Auditor’s Responsibility �)���� ��� "�"�"�%�" �����7��� ������"�"��������� ��$"����"��� ������� ��� �������)���)�"�5�&������)������)���)�"��"��������������"����)�"�"�*� ������� �*�������%����������"��������"��������� ��$����"����������� ������� � ����"������ ��� $"����"��� �)�"� � �����"���� "�� Government Auditing Standards'� " )��� �%� ���� �������������������$�������"��������� 5����� �� ������� ���8)"�����������������������$��������)�"���������"����� �������� )���������)��������������$"����"��� ������� �����$����$�������"���" �������5�������)�"��"�(��(� ����$��"�*�������)�� ��������"���)�"���("���������)��������)�� ������" ��� )�� �"������$"����"��� ������� 5�����������)�� � �����������������������)�"���! �9)�*���'�"���)�"�*������ � �����$������" : ��$�����"���" ���������$�����$"����"��� ������� '����������)�����$��)����������5�����:"�*���� ���" :�� � ��� '������)�"������� "��� "��������������������(������������% ��! ���������"�������$�"����� �����"����$� ���� $"����"��� ������� � "�������� ����� "*���)�"�� ������)�� � ����������������"���� "�� �����"��) ����� '� �)�� ���� $��� ���� �)��� �� �$� �7��� "�*� ��� ��"�"��� ��� ���� �$$���"(��� � �$� ���� �% ��! �"�������� �������5� ������"�*�%'� ��� �7��� � ��� )��� ��"�"��5� ��� �)�"�� �� �� "���)�� � �(��)��"�*� �����������"����� ��$�����)��"�*����"�"� �) �������������� �������� ��$� "*�"$"���������)��"�*�� �"��� ������%����*����'�� ������� ��(��)��"�*������(��������� �����"����$�����$"����"��� ������� 5���&�����"�(������������)�"���("�����������(������"����" � )$$"�"���������������"����������("������� " �$����)���)�"����"�"��5��
INDEPENDENT AUDITOR’S REPORT

28 CALSTRS COMPREHENSIVE ANNUAL FINANCIAL REPORT 2018
INDEPENDENT AUDITOR’S REPORT
�Opinion ����)����"�"��'�����$"����"��� ������� ���$������������(����� ����$�"��%'�"����������"����� ���� '�����$"�)�"��%������� "�"����$� ��"$���"��������������� !����"�������% ���� ��$�/)���01'�2134'����� ��������*� � "��$"�)�"��%������� "�"���$�������%���������������"��������������"�������)��"�*���"��"��� �*�������%����������"��������"��������� ��$����"��5��Emphasis of Matters �Net Pension Liability of Employers and Nonemployer Contributing Entity � ��� ��"����"�������0'��� ����������� ������������)��"���(��)��"���� ��$�/)���01'�213='������% ��! �"��������������)��"� ������"��������'����/)���01'�2134'�����(��)���$������������������ !����"�����������+����.� ��������� "��� �"��"�"�%��7������� ���������$"�)�"��%������� "�"����%�>�?35?��"��"��5� ��������)��"���(��)��"���" � �� "�"(���������)�����%"�*����)��"���� )��"�� '�"���)�"�*�"�(� �����������$����)����$�=53@'���� )�����"���"�$���"����$�25=;@'���*��*�������$�05;@������) ��������"�%������ ��� ������ �������� ����������7���"���������% " 5���)����"�"���" �������"$"����"����� ����������" ������5��Fair Value of Investments
� ��� ��"����"������ �;�����A'�����$"����"��� ������� �"���)���"�(� ���� �(��)�����������7"����%�>A;5?��"��"���� ��$�/)���01'�2134'�$�����"���$�"��(��)���� ������� �"������%�*�������������� �����"�(� �������(" �� '�������("��������������(����%������% ��! ����*����'�"�������� ������$�����"�%�� �����"��������:���(��)� 5��#���) ���$�����"��������)������"��%��$�(��)��"��'������ �"�����$�(��)� ��%��"$$���$�������(��)� � ����� ��)��� ��(�� ����� ) ��� ���� �� ����%� ��:��� �7" ���� $��� ���� "�(� ����� ��)�"�"� '� ���� �����"$$������ ���)����������"��5���)����"�"���" �������"$"����"����� ����������" ������5��Other Matters �Required Supplementary Information ����)��"�*� ��"��"��� � *�������%� ��������� "�� ���� ��"���� ����� � �$� ���"��� ��8)"��� ����� ���*����! ��" �) "��� ���� ����% " � ��� ��*� � 01� C� ;B� ���� ���� �����)��� �$� ���*� � "�� ���� ��� "��� <"��"�"�%� �$�����%�� � ���� �������%��� ����"�)�"�*� ���"�%'� �����)��� �$� ���� ��� "��� <"��"�"�%� �$� ����%�� � �����������%��� ����"�)�"�*����"�%'������)����$���� "��� ����"�)�"�� � $�������%�� ������������%��� ����"�)�"�*����"�%'������)����$����%C&�"*�������(� ��������)�� �$���������������� !����"�����������������"��������")���%�������*��'������)����$� ���*� �"���������#�<"��"�"�%��$�����%�� �����������)����$��������#�<"��"�"�%��$�����%�� ������*� �?B� C�??������� ������ ��� )�������� ������ "��$"����"��� ������� 5��)���"�$����"��'������)*��������������$������� "��$"����"��� ������� '�" ���8)"�����%���(�������������)��"�*��������� �#������������ "��� �"������������ ���"���������$�$"����"���������"�*�$�������"�*������� "��$"����"��� ������� �"������������"����������"����'������"�'�����" ���"���������7�5�&����(�� ����"��� �����"�� �""���� ������)�� � ��� ���� ��8)"���� )���������%� "�$����"��� "�� ����������� �"����)�"�"�*� ������� � *�������%� ��������� "�� ���� ��"���� ����� � �$� ���"��'� ��"��� ��� " ���� �$� "�8)"�"� � �$����*��������)����������� ��$�������"�*�����"�$����"������������"�*�����"�$����"���$������ " ����%��"������*����! ��� ��� � � ����)�� "�8)"�"� '� ������ "�� $"����"��� ������� '�����������:������*���������"�����)�"�*��)���)�"���$������� "��$"����"��� ������� 5�&����������7��� ������"�"���������("�����%�� )�������������"�$����"�������) �������""����������)�� �����������("���) ��"��� )$$"�"�����("����������7��� ������"�"���������("�����%�� )�����5���

29FINANCIAL
INDEPENDENT AUDITOR’S REPORT
�Supplementary Information
�)���)�"���� �����)�����$��������)��� ���$�$��"�*������"�"����������$"����"��� ������� �������������"(��%�����" �� �����% ��! ��� "�� $"����"��� ������� 5����� ������)����%� ���"��'������)����$���"�" ����"(���7��� � '� �����)��� �$� ��(� ����� �7��� � '� �����)��� �$� �� )������ ���� ���$� "����� ���("�� ��7��� � '� ��(� ���� � ���"��'����)��"��� ���"��'���������" �"���� ���"���������� ������ $����)��� � ��$����"�"���������% " �����������������8)"����������$������� "��$"����"��� ������� 5�����������)����$���"�" ����"(���7��� � '������)����$���(� ������7��� � ����������)����$� �� )�������������$� "��������("�� ��7��� � ����� ���� �� ��� "�"�"�%��$����*�����������������"(��� $���������������"�����%��������)�����%"�*�����)��"�*����������������� �) �������������������� "��$"����"��� ������� 5��)���"�$����"����� ������ )�9��������������)�"�"�*�������)�� �����"���"�������)�"���$������� "��$"����"��� ������� ����������"�����"�"�����������)�� '�"���)�"�*������"�*�����������"�"�*� )���"�$����"����"�����%��������)�����%"�*�����)��"�*����������������� �) �������������������� "��$"����"��� ������� ���� ��������� "�� $"����"��� ������� � ��� ��(� '� ���� ������ ���"�"����� ������)�� � "�� ����������� �"��� �)�"�"�*� ������� �*�������%����������"��������"��������� ��$����"��5�����)����"�"��'����������)����$���"�" ����"(���7��� � '� �����)��� �$� ��(� ����� �7��� � � ���� �����)��� �$� �� )������ ���� ���$� "����� ���("�� ��7��� � �����$�"��%� �����'�"����������"����� ���� '�"�������"������������ "��$"����"��� ������� �� ��������5������� ������)����%� ���"��'� ��(� ���� � ���"��'� ���)��"��� ���"��'� ���� ����" �"���� ���"��� ��(�� ���� ����� )�9��������������)�"�"�*�������)�� �����"���"�������)�"���$������� "��$"����"��� ������� �����������"�*�%'������������7��� ������"�"���������("�����%�� )������������5���������������� �������������Government Auditing Standards ����������������"���Government Auditing Standards'������(���� ��" )����)�����������������������;'�2134���� �)�� ��� "�����"��� �$� ��"$���"�� ������ ������� !� ���"������ �% ��! � "�������� �������� �(��� $"����"���������"�*���������)���� � ��$�"� �����"������"��������"�����(" "�� ��$���� '���*)���"�� '��������� '���������������� 5������)��� ���$�������������" ������ ��"������� ������$��)���� �"�*��$�"�����������������(���$"����"���������"�*���������"��������������� )�� ��$�������� �"�*'���������������("��������"�"������"�����������������(���$"����"���������"�*�����������"����5�������������" ����"���*����������$�����)�"�����$�����"��������������"��� Government Auditing Standards� "�� ��� "���"�*� ��"$���"�� ������ ������� !� ���"������ �% ��! �"�����������������(���$"����"���������"�*���������"����5����� � � � � � � � � � � � � � ��� �����<<������������'� ��"$���"����������;'�2134��

30 CALSTRS COMPREHENSIVE ANNUAL FINANCIAL REPORT 2018
MANAGEMENT’S DISCUSSION AND ANALYSIS (UNAUDITED)
INTRODUCTIONManagement’s Discussion and Analysis of the California State Teachers’ Retirement System’s (CalSTRS, “system”, “our” or “we”) fi nancial performance is intended to fairly and transparently provide an overview of activities for the fi scal year ended June 30, 2017. The discussion and analysis focuses on the year’s business events and resulting changes. This discussion is more meaningful when read in conjunction with CalSTRS fi nancial statements and accompanying notes.
In addition to historical information, the discussion and analysis includes some forward-looking statements that involve uncertainties and risks. CalSTRS’ actual results, performance and achievements expressed or implied in these statements are subject to changes in interest rates, securities markets, general economic conditions, legislation, regulations and other factors.
MISSIONSince CalSTRS was founded in 1913, we have grown from no assets and 15,000 members to an investment portfolio valued at $208.7 billion1 serving 933,301 members and benefi ciaries as of June 30, 2017. In 1913, the annual benefi t was $500; today, the average annual member-only benefi t is approximately $48,000. Over the past 104 years, CalSTRS mission has remained the same: to secure the fi nancial future and sustain the trust of California’s educators now and for generations to come.
YEAR IN REVIEWSignifi cant events and changes impacting CalSTRS during fi scal year 2016–17 are described in the paragraphs that follow.
Actuarial Experience StudyCalSTRS engaged our consulting actuary, Milliman, to perform an actuarial experience study for the period starting July 1, 2010, and ending June 30, 2015, to ensure the demographic and economic assumptions adopted by the Teachers’ Retirement Board (the “board”) are reasonable and refl ect the actual experience of the system.
The study evaluated various economic and demographic factors affecting the valuation of CalSTRS’ long-term pension liabilities and refl ected the need to make changes
to various assumptions based on actual experience. The most signifi cant changes were to the long-term investment return rate, mortality tables, infl ation and wage growth assumptions for CalSTRS members.
After a thorough review of the results during the February 2017 meeting, the board decided to lower the investment return assumption over a two-year period. The expected return net of all expenses decreased from 7.50 to 7.25 percent for the June 30, 2016, funding actuarial valuations and will decrease from 7.25 to 7.00 percent for the June 30, 2017, funding actuarial valuations. For fi nancial reporting purposes, the board adopted an expected long-term rate of investment return of 7.10 percent, gross of administrative expenses effective June 30, 2017. In addition, the board adopted a revised generational mortality methodology based on the latest trend data, which expects early career members to live two to three years longer than those who retire today. The infl ation assumption was lowered from 3.00 to 2.75 percent, and correspondingly, the wage-growth assumption was lowered from 3.75 to 3.50 percent. A copy of the full report is available on www.calstrs.com.
Benefi t Adequacy Study CalSTRS conducted a study in 2017 that compared CalSTRS-only monthly retirement income received by members who retired before 1999 to their estimated monthly minimum living expenses. The study, called the Benefi t Adequacy Study, surveyed 28,000 members and found that the CalSTRS benefi t structure provides a greater level of adequacy for the long-term educator as compared to those who spent fewer years as an educator. (The study did not include information on income sources other than CalSTRS benefi ts.) Most retirees who received benefi ts greater than the estimated minimum living expenses had more than 20 years of service credit. Of the 28,000 members surveyed, 36 percent received benefi ts lower than the estimated minimum living expenses, most likely as a result of leaving their career as an educator early. Detailed information regarding the study can be found in the board meeting agendas on www.calstrs.com.
Divesting From CoalDuring fi scal year 2016–17, the board voted to divest from all non-U.S. thermal coal holdings in the CalSTRS portfolio. Consistent with the CalSTRS Divestment Policy, CalSTRS staff conducted a thorough review of the operations of two
1 This refl ects the value of the investment portfolio as of June 30, 2017. It is presented using common industry practices for investment portfolio management and is not prepared in accordance with U.S. Generally Accepted Accounting Principles.
MANAGEMENT’S DISCUSSION AND ANALYSIS (UNAUDITED)
INTRODUCTION
Management’s Discussion and Analysis of the California State Teachers’ Retirement System’s (CalSTRS, system, our or we) financial performance is intended to fairly and transparently provide an overview of activities for the fiscal year ended June 30, 2018. The discussion and analysis focuses on the year’s business events and resulting changes. This discussion is more meaningful when read in conjunction with CalSTRS’ basic financial statements and accompanying notes.
In addition to historical information, the discussion and analysis includes some forward-looking statements that involve uncertainties and risks. CalSTRS’ actual results, performance and achievements expressed or implied in these statements are subject to changes in interest rates, securities markets, general economic conditions, legislation, regulations and other factors.
MISSION
Since CalSTRS was founded in 1913, we have grown from no assets and 15,000 members to an investment portfolio valued at $223.8 billion1 serving 949,370 members and beneficiaries as of June 30, 2018. In 1913, the annual benefit was $500; today, the average annual member-only benefit is approximately $48,000. Over the past 105 years, CalSTRS’ mission has remained the same: to secure the financial future and sustain the trust of California’s educators.
YEAR IN REVIEW
Significant events and changes impacting CalSTRS during fiscal year 2017--18 are described in the paragraphs that follow.
Funding Levels and Risks
In November 2017, the second annual report of CalSTRS Review of Funding Levels and Risks was presented to the Teachers’ Retirement Board (the board). Based on the June 30, 2016, actuarial valuation report, this report discusses a variety of risks associated with funding the system, and notes potential minor adjustments that could be made to strengthen the CalSTRS funding plan. The report emphasizes that the funding plan, which was implemented
through Chapter 47, Statutes of 2014 (AB 1469), has improved the long-term sustainability of the system. This plan provides for contribution rate increases that are shared and predictable and puts the CalSTRS Defined Benefit Program on a solid path toward full funding by 2046. Investment volatility, longevity and membership levels can still pose potential risks to CalSTRS being fully funded by 2046. In order to address these risks, CalSTRS has created an asset/liability management team to bring together the actuarial, investment and financial areas of CalSTRS to better assess funding risk.
AB 1469 contained a provision requiring CalSTRS to report to the State of California Legislature every five years regarding the progress of the funding plan. The first report to the Legislature is required on or before July 1, 2019. In preparation for this progress report and in light of the possible risks highlighted in this report, CalSTRS has begun analyzing potential minor adjustments that could be made to further strengthen the funding plan. A copy of the Review of
Funding Levels and Risks report is available at CalSTRS.com.
Internal Asset Management
In fiscal year 2010–11, the Investment Committee of the board (the Investment Committee) began exploring the benefits of an investment strategy using internal or external asset management. Through these efforts they found that internally managed assets reduce investment expenses, increase transparency, enhance liquidity and improve control of investment decisions of the underlying assets. Accordingly, CalSTRS has since sought opportunities to increase our internally managed assets. The CalSTRS Strategic Plan for fiscal years 2016–19 aims to increase internally managed investments to 50 percent. The board is currently reviewing a collaborative business model, which would result in more direct investment and further reduce external management costs. Although the implementation of a direct investing program would require a larger internal staff, the costs associated with hiring additional staff would be significantly offset by the increased cost savings associated with not paying fees to external managers.
CalSTRS has steadily increased internal asset management staff with single-year requests approved through the administrative and legislative budgetary process. While this process has functioned satisfactorily in the past, the increased complexity and competitive nature of the
1 This reflects the value of the investment portfolio as of June 30, 2018. It is pre-sented using common industry practices for investment portfolio management and is not prepared in accordance with U.S. Generally Accepted Accounting Principles.

31FINANCIAL
MANAGEMENT’S DISCUSSION AND ANALYSIS (UNAUDITED)
of CalSTRS’ global thermal coal holdings, the non-U.S. thermal coal market and related research materials outlining the impacts of their coal use. Based on their assessment and ongoing shareholder efforts, staff concluded that all engagement options to effect change had been thoroughly exhausted. The board concluded that these holdings were not consistent with the CalSTRS Investment Policy for Mitigating Environmental, Social and Governance Risks (ESG) and were de minimis to the fund. In total, CalSTRS has divested $9.8 million from thermal coal companies worldwide.
The board’s action aligns with CalSTRS’ long-term global perspective and our fi duciary duty, including consideration of environmental risks – both current and those projected over the next 10 to 25 years or more. Thermal coal burning is a signifi cant producer of greenhouse gases contributing to climate change. CalSTRS annual Green Initiative Task Force Report summarizes our efforts to promote environmental risk management and investment awareness throughout the global fi nancial markets.
Opposing Financial CHOICE Act of 2017CalSTRS closely monitors legislation considered by the U.S. Congress that may affect our members or CalSTRS’ ability to be a proactive investor in the market. Recently, a bill proposing to roll back signifi cant Dodd-Frank investor protections was introduced to the U.S. House of Representatives. The Financial CHOICE Act of 2017 would effectively reduce our ability to infl uence companies in which we invest by increasing thresholds surrounding the shareholder proposal process. In addition, the CHOICE Act would allow for riskier behavior by public companies and restrict the Securities and Exchange Commission’s ability to protect investors.
The board adopted an oppose position on this measure. CalSTRS has written to a ranking member of the House Committee on Financial Services as well as all 55 California members of Congress relaying our position on this legislation. CalSTRS is committed to voicing the concerns of our members and protecting important shareholder rights for our investment portfolio.
Investment Cost ReportThe 2015 calendar year investment cost report presented to the board at the November 2016 meeting provided a comprehensive view of investment costs across asset
classes and investment strategies. This year, CalSTRS contracted with Pavilion Alternatives Group, LLC, as a project consultant to assist in tracking indirect costs and carried interest for the fi rst time. Indirect costs include general partner management fees and revenues as well as limited partner expenses attributable to the investment of CalSTRS capital.
The annual investment costs presented in the report were 51.8 basis points (bps) of the total net asset value of the portfolio. In 2014, these costs were 30.8 bps. The increase can be attributed, for example, to methodology changes as well as $320 million in netted partnership expenses and other fees not delineated in the 2014 cost report.
The 2015 calendar year report also presented a comparison of CalSTRS investment costs to 15 of our global peers with $72 to $485 billion in assets under management. These comparisons were compiled by third party cost measurement service providers using various methodologies. The results showed that CalSTRS’ investment strategies saved approximately $135 million in investment costs. CalSTRS will continue to develop standardized cost reporting practices to enhance the completeness and transparency of our investment management reporting. A copy of the report is available on www.calstrs.com.
New Board MemberIn April 2017, Governor Brown appointed Karen Yamamoto to the Teachers’ Retirement Board. Ms. Yamamoto served as a second grade teacher for the Washington Unifi ed School District from 1992 to 2007. As a member of the board, she serves on the Appeals Committee, Benefi ts and Services Committee, Board Governance Committee and the Investment Committee.
MANAGEMENT’S DISCUSSION AND ANALYSIS (UNAUDITED)
investment markets require CalSTRS to be more flexible to respond to market opportunities and risks. As a result, in November 2017, the board approved a multiyear proposal to increase its internal asset management resources by up to 55 permanent positions at an estimated cost of $14.9 million. It also included three additional permanent positions related to administrative and legal support resulting from increased investment operations at a cost of $0.5 million. These resources will enable CalSTRS to optimally manage the increased contributions to the system since the passage of AB 1469 and will reduce management fees and our reliance on third-party investment managers.
Investment Beliefs
In October 2015, the Investment Committee initiated a project to develop an investment beliefs statement, which included input from various stakeholders. Seven investment beliefs were considered and approved by the Investment Committee as of April 2017. The eighth and final investment belief, “Alignment of financial interests between
CalSTRS and its advisors is critical,” was adopted in February 2018 and brought a conclusion to the project. This investment belief addresses the significance of contractual alignment and transparency of CalSTRS’ financial interests with our external investment advisors and managers. The set of eight beliefs ensures the investment portfolio is based on a common set of core views and further clarifies the basis for making individual investment decisions. The complete list of approved investment beliefs can be found at CalSTRS.com.
Selection of Real Estate Consultant
RCLCO Fund Advisors, LLC (RCLCO) began serving as the Investment Committee’s new real estate consultant in March 2018. RCLCO works with both the board’s Investment Committee and CalSTRS Investments staff to provide expertise and advice related to the overall investment strategy, policies and practices of the real estate program. In addition, RCLCO also plays a key role in monitoring and evaluating the program’s performance and keeps the Investment Committee apprised of trends and conditions in the real estate industry.
Retirement Readiness Assessment Report
The Retirement Readiness Assessment report summarizes results of the biennial retirement readiness assessment, which is a survey of active and retired members that assesses their overall financial standing. The 2017 assessment survey was sent via email to a stratified random sample of active and retired members between May 2017 and June 2017. Nearly 3,000 active members and over 2,000 retired members responded. The survey results revealed that efforts to encourage active members to plan for retirement through CalSTRS’ online resources have been successful. Eighty-two percent of active members have begun planning for retirement, and the use of CalSTRS websites such as myCalSTRS, CalSTRS.com and Pension2.com has increased from prior years. The report added another year of valuable data to the study of the financial standing of CalSTRS members. CalSTRS will continue to encourage members to save for retirement in vehicles like Pension2 and increase their awareness of the Social Security offsets, which are potential reductions to members’ Social Security benefits. The complete report is
available at CalSTRS.com.
Teachers’ Retirement Board Update
Thomas Unterman stepped down in February 2018 from the board, on which he served since being appointed by Governor Edmund G. Brown Jr. (Governor Brown) in 2013. Mr. Unterman has been an adjunct faculty member at the UCLA School of Law since 2011 and also serves as a member of the ProPublica Board of Directors and the Museum of Contemporary Art, Los Angeles Board of Trustees.
Joy Higa has been reappointed by Governor Brown to a second term as a public representative to the board. Ms. Higa is the vice president of regulatory affairs for UnitedHealthcare’s West and Central regions, where she manages relationships and policy activities. As a member of the board, she serves as the vice chair of the Investment, Benefits & Services and Audits & Risk Management standing committees.

32 CALSTRS COMPREHENSIVE ANNUAL FINANCIAL REPORT 2018
MANAGEMENT’S DISCUSSION AND ANALYSIS (UNAUDITED)
Fiduciary Net Position (Dollars in Thousands)
Assets and Deferred Outflows of Resources 2018 2017 Percent Change
Investment Assets1 $247,370,532 $229,079,341 8.0%
Cash 153,256 459,456 (66.6%)
Investment Receivables 3,076,620 2,349,266 31.0%
Member, Employer, State and Other Receivables 3,468,656 3,523,160 (1.5%)
Capital and Other Assets 276,245 259,011 6.7%
Total Assets 254,345,309 235,670,234 7.9%
Deferred Outflows of Resources 117,457 70,934 65.6%
Total Assets and Deferred Outflows of Resources 254,462,766 235,741,168 7.9%
Liabilities and Deferred Inflows of Resources
Investment Liabilities 140,070 260,133 (46.2%)
Investments Purchased Payable 3,346,989 3,270,703 2.3%
Loans Payable 2,731,737 2,824,259 (3.3%)
Benefits in Process of Payment 263,254 234,379 12.3%
Net Pension and OPEB Liabilities 835,204 323,058 158.5%
Securities Lending Obligation 21,917,706 18,184,444 20.5%
Other 303,893 353,766 (14.1%)
Total Liabilities 29,538,853 25,450,742 16.1%
Deferred Inflows of Resources 55,278 526 10,409.1%
Total Liabilities and Deferred Inflows of Resources 29,594,131 25,451,268 16.3%
Net Position Restricted for Pensions $224,868,635 $210,289,900 6.9%
1Includes securities lending collateral of $21.9 billion and $18.2 billion for 2018 and 2017, respectively.
State Teachers’ Retirement Plan
The STRP is a multiple-employer, cost-sharing defined benefit plan composed of four programs: Defined Benefit (DB) Program, Defined Benefit Supplement (DBS) Program, Cash Balance Benefit (CBB) Program and Replacement Benefits Program. The STRP holds assets for the exclusive purpose of providing benefits to members of these programs and their beneficiaries.
FINANCIAL HIGHLIGHTSCalSTRS administers a hybrid retirement system consisting of a defined benefit plan (State Teachers’ Retirement Plan (STRP)), two defined contribution plans (CalSTRS Pension2® Program (Pension2)), a postemployment benefit plan (Medicare Premium Payment (MPP) Program), and a fund used to account for ancillary activities associated with various deferred compensation plans and programs (Teachers’ Deferred Compensation Fund (TDCF)). The tables that follow provide comparative information for each plan administered by CalSTRS for fiscal years 2017–18 and 2016–17 and highlight major changes in significant balances and other noteworthy activity during the current year.
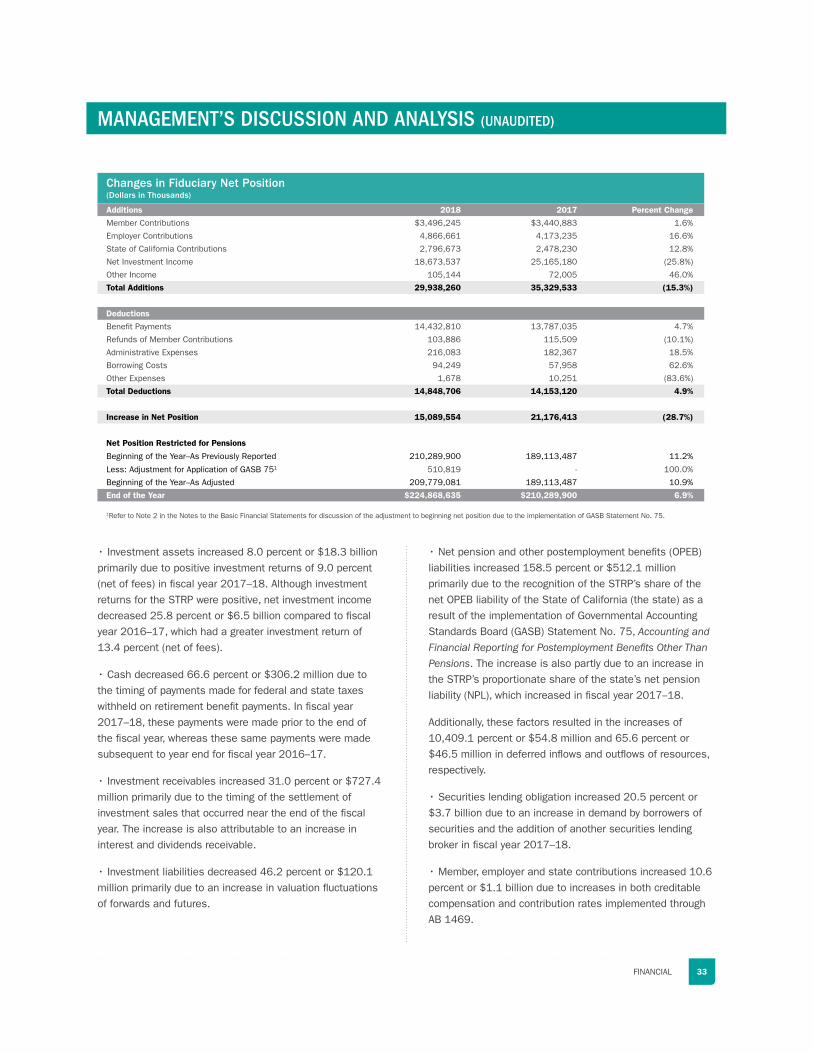
33FINANCIAL
MANAGEMENT’S DISCUSSION AND ANALYSIS (UNAUDITED)
• Investment assets increased 8.0 percent or $18.3 billion primarily due to positive investment returns of 9.0 percent (net of fees) in fiscal year 2017–18. Although investment returns for the STRP were positive, net investment income decreased 25.8 percent or $6.5 billion compared to fiscal year 2016–17, which had a greater investment return of 13.4 percent (net of fees).
• Cash decreased 66.6 percent or $306.2 million due to the timing of payments made for federal and state taxes withheld on retirement benefit payments. In fiscal year 2017–18, these payments were made prior to the end of the fiscal year, whereas these same payments were made subsequent to year end for fiscal year 2016–17.
• Investment receivables increased 31.0 percent or $727.4 million primarily due to the timing of the settlement of investment sales that occurred near the end of the fiscal year. The increase is also attributable to an increase in interest and dividends receivable.
• Investment liabilities decreased 46.2 percent or $120.1 million primarily due to an increase in valuation fluctuations of forwards and futures.
• Net pension and other postemployment benefits (OPEB) liabilities increased 158.5 percent or $512.1 million primarily due to the recognition of the STRP’s share of the net OPEB liability of the State of California (the state) as a result of the implementation of Governmental Accounting Standards Board (GASB) Statement No. 75, Accounting and
Financial Reporting for Postemployment Benefits Other Than
Pensions. The increase is also partly due to an increase in the STRP’s proportionate share of the state’s net pension liability (NPL), which increased in fiscal year 2017–18.
Additionally, these factors resulted in the increases of 10,409.1 percent or $54.8 million and 65.6 percent or $46.5 million in deferred inflows and outflows of resources, respectively.
• Securities lending obligation increased 20.5 percent or $3.7 billion due to an increase in demand by borrowers of securities and the addition of another securities lending broker in fiscal year 2017–18.
• Member, employer and state contributions increased 10.6 percent or $1.1 billion due to increases in both creditable compensation and contribution rates implemented through AB 1469.
Changes in Fiduciary Net Position (Dollars in Thousands)
Additions 2018 2017 Percent Change
Member Contributions $3,496,245 $3,440,883 1.6%
Employer Contributions 4,866,661 4,173,235 16.6%
State of California Contributions 2,796,673 2,478,230 12.8%
Net Investment Income 18,673,537 25,165,180 (25.8%)
Other Income 105,144 72,005 46.0%
Total Additions 29,938,260 35,329,533 (15.3%)
Deductions
Benefit Payments 14,432,810 13,787,035 4.7%
Refunds of Member Contributions 103,886 115,509 (10.1%)
Administrative Expenses 216,083 182,367 18.5%
Borrowing Costs 94,249 57,958 62.6%
Other Expenses 1,678 10,251 (83.6%)
Total Deductions 14,848,706 14,153,120 4.9%
Increase in Net Position 15,089,554 21,176,413 (28.7%)
Net Position Restricted for Pensions
Beginning of the Year–As Previously Reported 210,289,900 189,113,487 11.2%
Less: Adjustment for Application of GASB 751 510,819 - 100.0%
Beginning of the Year–As Adjusted 209,779,081 189,113,487 10.9%
End of the Year $224,868,635 $210,289,900 6.9%
1Refer to Note 2 in the Notes to the Basic Financial Statements for discussion of the adjustment to beginning net position due to the implementation of GASB Statement No. 75.

34 CALSTRS COMPREHENSIVE ANNUAL FINANCIAL REPORT 2018
MANAGEMENT’S DISCUSSION AND ANALYSIS (UNAUDITED)
• The balances in other income and borrowing costs primarily relate to CalSTRS’ Master Credit Facility Portfolio, which is an arrangement whereby CalSTRS obtains credit facilities and, in turn, provides subscription lines of credit to a group of designated joint venture and separate account borrowers in lieu of securing separate subscription lines.
The increase in other income of 46.0 percent or $33.1 million is primarily due to higher interest and fees assessed by CalSTRS to borrowers for underutilization of the subscription lines during fiscal year 2017-18. Conversely, the increase in borrowing costs of 62.6 percent or $36.3 million is due higher interest and fees incurred by CalSTRS for the underutilization of the credit facilities during fiscal year 2017-18.
• Administrative expenses increased 18.5 percent or $33.7 million primarily due to higher OPEB expense resulting from the implementation of GASB Statement No. 75. Additionally, the state’s pension expense increased for fiscal year 2017--18, which resulted in a corresponding increase to the STRP’s proportionate share of pension expense.
• Other expenses decreased 83.6 percent or $8.6 million primarily due to a reduction in bad debt write-offs for fiscal year 2017–18.

35FINANCIAL
MANAGEMENT’S DISCUSSION AND ANALYSIS (UNAUDITED)
Fiduciary Net Position (Dollars in Thousands)
Assets and Deferred Outflows of Resources 2018 2017 Percent Change
Investment Assets $922,439 $791,222 16.6%
Member, Employer and Other Receivables 16,414 15,309 7.2%
Total Assets 938,853 806,531 16.4%
Deferred Outflows of Resources -- -- 0.0%
Total Assets and Deferred Outflows of Resources 938,853 806,531 16.4%
Liabilities and Deferred Inflows of Resources
Other 1,877 949 97.8%
Total Liabilities 1,877 949 97.8%
Deferred Inflows of Resources -- -- 0.0%
Total Liabilities and Deferred Inflows of Resources 1,877 949 97.8%
Net Position Restricted for Pensions $936,976 $805,582 16.3%
Pension2 403(b) Plan
CalSTRS Pension2 403(b) Plan is a voluntary defined contribution program that offers low cost and tax deferred 403(b) and Roth 403(b) plans for additional retirement savings.
Changes in Fiduciary Net Position (Dollars in Thousands)
Additions 2018 2017 Percent Change
Member Contributions $122,113 $121,945 0.1%
Employer Contributions 369 393 (6.1%)
Net Investment Income 65,104 77,730 (16.2%)
Other Income 309 141 119.1%
Total Additions 187,895 200,209 (6.2%)
Deductions
Distributions and Withdrawals 48,481 36,322 33.5%
Refunds of Member Contributions 5,614 4,657 20.5%
Administrative Expenses 2,406 1,975 21.8%
Total Deductions 56,501 42,954 31.5%
Increase in Net Position 131,394 157,255 (16.4%)
Net Position Restricted for Pensions
Beginning of the Year 805,582 648,327 24.3%
End of the Year $936,976 $805,582 16.3%
• Investment assets increased 16.6 percent or $131.2 million primarily due to participant contributions made in fiscal year 2017–18 combined with net positive returns on investments held by plan participants. Although these investments experienced positive returns, net investment income decreased 16.2 percent or $12.6 million due to a greater return on investments held by plan participants in fiscal year 2016–17.
• Distributions and withdrawals increased 33.5 percent or $12.2 million due to an increase in the average distribution and withdrawal by plan participants in fiscal year 2017–18.
• Administrative expenses increased 21.8 percent or $0.4 million primarily due to the increase in the balance of investment assets held by plan participants, which resulted in increased investment management fees assessed by third-party administrators.

36 CALSTRS COMPREHENSIVE ANNUAL FINANCIAL REPORT 2018
MANAGEMENT’S DISCUSSION AND ANALYSIS (UNAUDITED)
Fiduciary Net Position (Dollars in Thousands)
Assets and Deferred Outflows of Resources 2018 2017 Percent Change
Investment Assets $41,725 $33,602 24.2%
Member, Employer and Other Receivables 570 625 (8.8%)
Total Assets 42,295 34,227 23.6%
Deferred Outflows of Resources -- -- 0.0%
Total Assets and Deferred Outflows of Resources 42,295 34,227 23.6%
Liabilities and Deferred Inflows of Resources
Other 1 23 (95.7%)
Total Liabilities 1 23 (95.7%)
Deferred Inflows of Resources -- -- 0.0%
Total Liabilities and Deferred Inflows of Resources 1 23 (95.7%)
Net Position Restricted for Pensions $42,294 $34,204 23.7%
Pension2 457(b) Plan
CalSTRS Pension2 457(b) Plan is a voluntary defined contribution program that offers low cost and tax deferred 457(b) and Roth 457(b) plans for additional retirement savings.
Changes in Fiduciary Net Position (Dollars in Thousands)
Additions 2018 2017 Percent Change
Member Contributions $7,038 $6,516 8.0%
Employer Contributions 85 44 93.2%
Net Investment Income 2,555 3,338 (23.5%)
Other Income 11 8 37.5%
Total Additions 9,689 9,906 (2.2%)
Deductions
Distributions and Withdrawals 1,411 769 83.5%
Refunds of Member Contributions 88 36 144.4%
Administrative Expenses 100 79 26.6%
Total Deductions 1,599 884 80.9%
Increase in Net Position 8,090 9,022 (10.3%)
Net Position Restricted for Pensions
Beginning of the Year 34,204 25,182 35.8%
End of the Year $42,294 $34,204 23.7%

37FINANCIAL
• Investment assets increased 24.2 percent or $8.1 million primarily due to participant contributions made in fiscal year 2017–18 in addition to net positive returns on investments held by plan participants. Although these investments experienced positive returns, net investment income decreased 23.5 percent or $0.8 million due to a greater return on investments held by plan participants in fiscal year 2016–17.
• Member contributions increased 8.0 percent or $0.5 million primarily due to an increase in the number of participants contributing to the plan. There were 854
MANAGEMENT’S DISCUSSION AND ANALYSIS (UNAUDITED)
participants as of June 30, 2018, compared to 713 participants as of June 30, 2017. Although the number of plan participants increased, contributions to the 457(b) program are voluntary and vary for each participant.
• Distributions and withdrawals increased 83.5 percent or $0.6 million due to an increase in the average distribution and withdrawal by plan participants in fiscal year 2017–18.

38 CALSTRS COMPREHENSIVE ANNUAL FINANCIAL REPORT 2018
MANAGEMENT’S DISCUSSION AND ANALYSIS (UNAUDITED)
Medicare Premium Payment Program
CalSTRS administers the MPP Program through the Teachers’ Health Benefit Fund (THBF). The MPP Program pays Medicare Part A premiums and Medicare Parts A and B late enrollment surcharges for retired members of the DB Program who meet certain eligibility criteria.
Fiduciary Net Position (Dollars in Thousands)
Assets and Deferred Outflows of Resources 2018 2017 Percent Change
Investment Assets $605 $606 (0.2%)
Investment Receivables 6 2 200.0%
Total Assets 611 608 0.5%
Deferred Outflows of Resources 191 88 117.0%
Total Assets and Deferred Outflows of Resources 802 696 15.2%
Liabilities and Deferred Inflows of Resources
Net Pension and OPEB Liabilities 1,793 625 186.9%
Other 403 18 2,138.9%
Total Liabilities 2,196 643 241.5%
Deferred Inflows of Resources 148 12 1,133.3%
Total Liabilities and Deferred Inflows of Resources 2,344 655 257.9%
Net Position Restricted for Other Postemployment Benefits ($1,542) $41 (3,861.0%)
Changes in Fiduciary Net Position (Dollars in Thousands)
Additions 2018 2017 Percent Change
Employer Contributions $28,218 $29,117 (3.1%)
Net Investment Income 18 11 63.6%
Total Additions 28,236 29,128 (3.1%)
Deductions
Premiums Paid 28,036 28,929 (3.1%)
Administrative Expenses 578 168 244.0%
Total Deductions 28,614 $29,097 (1.7%)
Increase (Decrease) in Net Position (378) 31 (1,319.4%)
Net Position Restricted for Other Postemployment Benefits
Beginning of the Year–As Previously Reported 41 10 310.0%
Less: Adjustment for Application of GASB 751 1,205 -- 100.0%
Beginning of the Year–As Adjusted (1,164) 10 (11,740.0%)
End of the Year ($1,542) $41 (3,861.0%)
1Refer to Note 2 in the Notes to the Basic Financial Statements for discussion of the adjustment to beginning net position due to the implementation of GASB Statement No. 75.
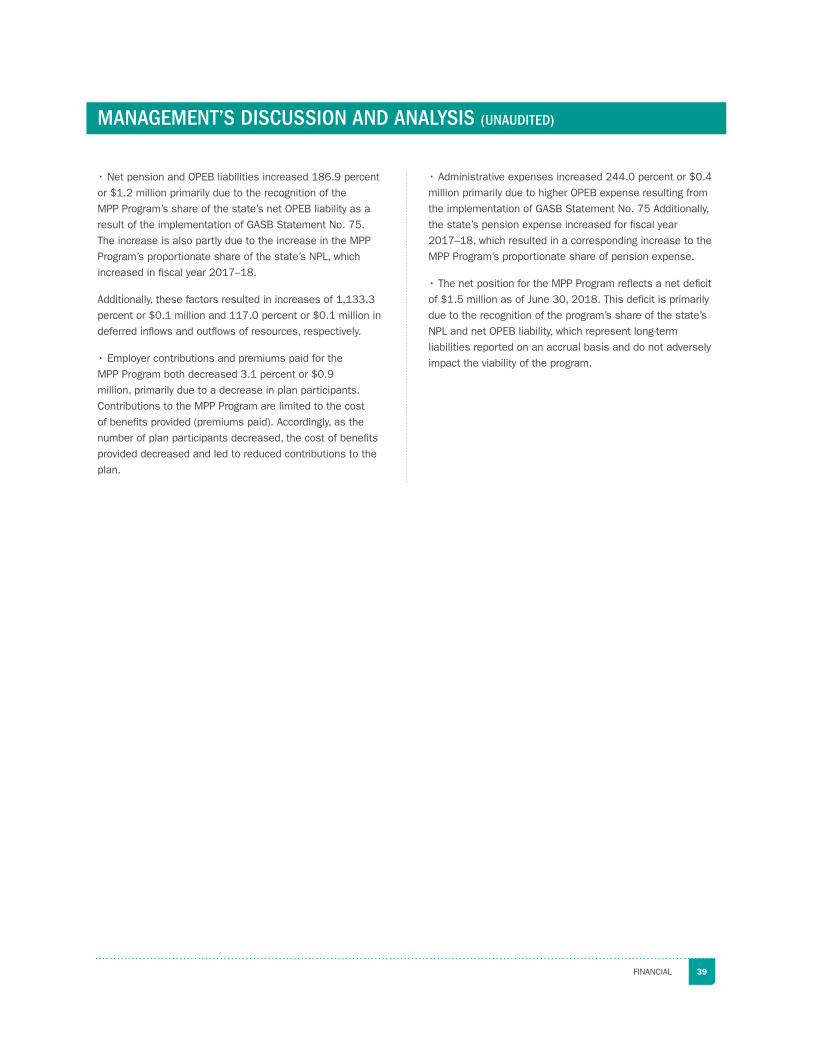
39FINANCIAL
• Net pension and OPEB liabilities increased 186.9 percent or $1.2 million primarily due to the recognition of the MPP Program’s share of the state’s net OPEB liability as a result of the implementation of GASB Statement No. 75. The increase is also partly due to the increase in the MPP Program’s proportionate share of the state’s NPL, which increased in fiscal year 2017–18.
Additionally, these factors resulted in increases of 1,133.3 percent or $0.1 million and 117.0 percent or $0.1 million in deferred inflows and outflows of resources, respectively.
• Employer contributions and premiums paid for the MPP Program both decreased 3.1 percent or $0.9 million, primarily due to a decrease in plan participants. Contributions to the MPP Program are limited to the cost of benefits provided (premiums paid). Accordingly, as the number of plan participants decreased, the cost of benefits provided decreased and led to reduced contributions to the plan.
• Administrative expenses increased 244.0 percent or $0.4 million primarily due to higher OPEB expense resulting from the implementation of GASB Statement No. 75 Additionally, the state’s pension expense increased for fiscal year 2017–18, which resulted in a corresponding increase to the MPP Program’s proportionate share of pension expense.
• The net position for the MPP Program reflects a net deficit of $1.5 million as of June 30, 2018. This deficit is primarily due to the recognition of the program’s share of the state’s NPL and net OPEB liability, which represent long-term liabilities reported on an accrual basis and do not adversely impact the viability of the program.
MANAGEMENT’S DISCUSSION AND ANALYSIS (UNAUDITED)
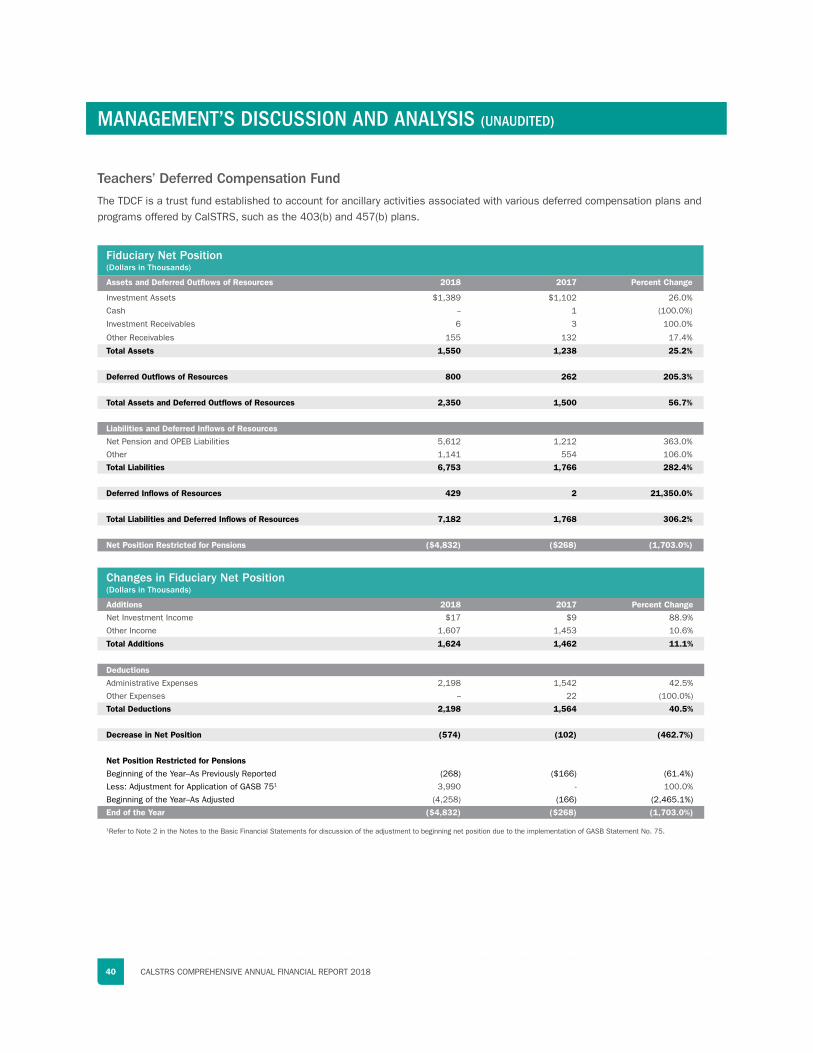
40 CALSTRS COMPREHENSIVE ANNUAL FINANCIAL REPORT 2018
MANAGEMENT’S DISCUSSION AND ANALYSIS (UNAUDITED)
Teachers’ Deferred Compensation Fund
The TDCF is a trust fund established to account for ancillary activities associated with various deferred compensation plans and programs offered by CalSTRS, such as the 403(b) and 457(b) plans.
Fiduciary Net Position (Dollars in Thousands)
Assets and Deferred Outflows of Resources 2018 2017 Percent Change
Investment Assets $1,389 $1,102 26.0%
Cash -- 1 (100.0%)
Investment Receivables 6 3 100.0%
Other Receivables 155 132 17.4%
Total Assets 1,550 1,238 25.2%
Deferred Outflows of Resources 800 262 205.3%
Total Assets and Deferred Outflows of Resources 2,350 1,500 56.7%
Liabilities and Deferred Inflows of Resources
Net Pension and OPEB Liabilities 5,612 1,212 363.0%
Other 1,141 554 106.0%
Total Liabilities 6,753 1,766 282.4%
Deferred Inflows of Resources 429 2 21,350.0%
Total Liabilities and Deferred Inflows of Resources 7,182 1,768 306.2%
Net Position Restricted for Pensions ($4,832) ($268) (1,703.0%)
Changes in Fiduciary Net Position (Dollars in Thousands)
Additions 2018 2017 Percent Change
Net Investment Income $17 $9 88.9%
Other Income 1,607 1,453 10.6%
Total Additions 1,624 1,462 11.1%
Deductions
Administrative Expenses 2,198 1,542 42.5%
Other Expenses -- 22 (100.0%)
Total Deductions 2,198 1,564 40.5%
Decrease in Net Position (574) (102) (462.7%)
Net Position Restricted for Pensions
Beginning of the Year–As Previously Reported (268) ($166) (61.4%)
Less: Adjustment for Application of GASB 751 3,990 - 100.0%
Beginning of the Year–As Adjusted (4,258) (166) (2,465.1%)
End of the Year ($4,832) ($268) (1,703.0%)
1Refer to Note 2 in the Notes to the Basic Financial Statements for discussion of the adjustment to beginning net position due to the implementation of GASB Statement No. 75.

41FINANCIAL
• Investment assets increased 26.0 percent or $0.3 million primarily due to an increase in administrative fees collected for the Pension2 programs.
• Net pension and OPEB liabilities increased 363.0 percent or $4.4 million primarily due to the recognition of the TDCF’s share of the state’s net OPEB liability as a result of the implementation of GASB Statement No. 75. The increase is also partly due to the increase in the TDCF’s proportionate share of the state’s NPL, which increased in fiscal year 2017--18.
Additionally, these factors resulted in increases of 21,350.0 percent or $0.4 million and 205.3 percent or $0.5 million in deferred inflows and outflows of resources, respectively.
• Other liabilities increased 106.0 percent or $0.6 million primarily due to the recording of certain liabilities related to the 403bCompare.com website redesign.
• Administrative expenses increased 42.5 percent or $0.7 million due to higher OPEB expense resulting from the implementation of GASB Statement No. 75. Additionally, the state’s pension expense increased for fiscal year 2017--18, which resulted in a corresponding increase to the TDCF’s proportionate share of pension expense.
• The net position for the TDCF reflects a net deficit of $4.8 million as of June 30, 2018. This deficit is primarily due to the recognition of the program’s share of the state’s NPL and net OPEB liability, which represent long-term liabilities reported on an accrual basis and do not adversely impact the viability of the fund.
MANAGEMENT’S DISCUSSION AND ANALYSIS (UNAUDITED)

42 CALSTRS COMPREHENSIVE ANNUAL FINANCIAL REPORT 2018
MANAGEMENT’S DISCUSSION AND ANALYSIS (UNAUDITED)
OVERVIEW OF FINANCIAL STATEMENTS
Management’s Discussion and Analysis is also an introduction to CalSTRS’ basic financial statements. CalSTRS’ financial statements include the following components:
1. Statement of Fiduciary Net Position
2. Statement of Changes in Fiduciary Net Position
3. Notes to the Basic Financial Statements
4. Required Supplementary Information – Unaudited
5. Other Supplementary Information
Statement of Fiduciary Net Position
The Statement of Fiduciary Net Position presents information on all of CalSTRS’ assets and liabilities, with the difference between the two reported as net position. Over time, the increase or decrease in net position serves as an indicator of CalSTRS’ financial condition and our ability to fund future benefit payments.
Statement of Changes in Fiduciary Net Position
The Statement of Changes in Fiduciary Net Position reflects how CalSTRS’ net position changed during the fiscal year, presenting contributions earned, benefit payments made, investment returns and the costs of plan administration.
Notes to the Basic Financial Statements The Notes to the Basic Financial Statements provide information essential to a full understanding of the basic financial statements. The type of information provided in each note is as follows:
• Note 1 provides a general description of CalSTRS, a concise description of each of the plans, contribution information and funds administered by CalSTRS.
• Note 2 provides a summary of significant accounting policies, including the basis of accounting for CalSTRS, management’s use of estimates, cash and investment accounting policies and other significant accounting policies.
• Note 3 provides a summary of the NPL of employers and the nonemployer contributing entity for the STRP in accordance with GASB Statement No. 67, Financial
Reporting for Pension Plans–an amendment of GASB
Statement No. 27.
• Note 4 provides a summary of the net OPEB liability of employers for the MPP Program in accordance with GASB Statement No. 74, Financial Reporting for
Postemployment Benefit Plans Other Than Pension Plans.
• Note 5 provides information related to deposits and investments, including disclosures required by GASB Statement No. 28, Accounting and Financial
Reporting for Securities Lending Transactions; GASB Statement No. 38, Certain Financial Statement Note
Disclosures; GASB Statement No. 40, Deposit and
Investment Risk Disclosures–an amendment of GASB
Statement No. 3; GASB Statement No. 53, Accounting
and Financial Reporting for Derivative Instruments; GASB Statement No. 67; GASB Statement No. 72, Fair Value Measurement and Application; and GASB Statement No. 74. This note discloses information about CalSTRS’ investments as of June 30, 2018, and risks related to credit (including custodial credit and concentrations of credit risk), interest rate and foreign currency. In an effort to provide increased visibility to investment holdings, Note 5 also includes a Schedule of Investments that discloses the types of investments within each broad investment category.
• Note 6 provides information related to investment disclosures required by GASB Statement No. 72.
• Note 7 generally describes potential contingencies of CalSTRS.
• Note 8 provides a summary of CalSTRS’ significant commitments.
• Note 9 provides a summary of new accounting and financial reporting pronouncements.
Required Supplementary Information
The Required Supplementary Information consists of six schedules. These schedules are intended to assist the reader in understanding the NPL of the STRP and net OPEB liability of the MPP Program. The information available in the Required Supplementary Information section includes:

43FINANCIAL
MANAGEMENT’S DISCUSSION AND ANALYSIS (UNAUDITED)
• Schedule I – Schedule of Changes in Net Pension Liability of Employers and Nonemployer Contributing Entity
• Schedule II – Schedule of Net Pension Liability of Employers and Nonemployer Contributing Entity
• Schedule III – Schedule of Pension Contributions from Employers and Nonemployer Contributing Entity
• Schedule IV – Schedule of Money-Weighted Investment Returns for State Teachers’ Retirement Plan and Medicare Premium Payment Program
• Schedule V – Schedule of Changes in Net OPEB Liability of Employers
• Schedule VI – Schedule of Net OPEB Liability of Employers
Other Supplementary Information
Other Supplementary Information includes details on administrative expenses, investment expenses, and consultant and professional services expenses. The schedules available in the Other Supplementary Information section include:
• Schedule VII – Schedule of Administrative Expenses
• Schedule VIII – Schedule of Investment Expenses
• Schedule IX – Schedule of Consultant and Professional Services Expenses
MAJOR BUSINESS COMPONENTS The sections that follow describe the activities and results of CalSTRS’ major business components (investment management and pension administration) for fiscal year 2017–18.
Investment Management
CalSTRS’ primary goal is to maintain a financially sound retirement system. Our investment philosophy is “long-term patient capital” — investing for long-term net cash flows and capital gain potential at a reasonable price.
CalSTRS’ investment beliefs serve as the foundation for our investment policies and describe the authority, responsibility and fiduciary duty CalSTRS has in executing our investment process. The eight investment beliefs are:
1. Diversification strengthens the fund.
2. The global public investment markets are largely, but not completely, efficient.
3. Managing investment costs yields long-term benefits.
4. Internal management is a critical capability.
5. CalSTRS can potentially capture an illiquidity risk premium.
6. Managing short-term drawdown risk can positively impact CalSTRS’ ability to meet its long-term financial obligations.
7. Responsible corporate governance, including the management of environmental, social and governance (ESG) factors, can benefit long-term investors like CalSTRS.
8. Alignment of financial interests between CalSTRS and its advisors is critical.
CalSTRS uses a time-weighted return methodology to calculate returns for portfolio performance purposes. For the period ended June 30, 2018, CalSTRS earned an approximate 9.0 percent return calculated on a net of fees basis. The resulting performance is above the actuarially assumed 7.0 percent rate of return used for funding purposes. CalSTRS’ returns (net of fees) reflect the following longer-term performance:
• 7.8 percent over 3 years
• 9.2 percent over 5 years
• 6.3 percent over 10 years
• 6.5 percent over 20 years
The money-weighted return net of all investment expenses based on financial statement values reflects an approximate 8.9 percent return for the period ended June 30, 2018. The money-weighted return measures the overall performance of the pension plan factoring in the impact of cash flows. Differences in the money-weighted and time-weighted returns are caused by the inherent variations in the methodology and the inputs of the two calculations.

44 CALSTRS COMPREHENSIVE ANNUAL FINANCIAL REPORT 2018
MANAGEMENT’S DISCUSSION AND ANALYSIS (UNAUDITED)
CalSTRS’ investments earn income in the form of interest and dividends from holding fixed income securities and various types of equity interests in public companies, limited partnerships and co-investments. Other income consists primarily of distributed income from alternative investments (such as rent), term loans and securities litigation. Realized gains (losses) are generally a result of investment sales, write-offs and reorganizations. Unrealized appreciation (depreciation) is generated by period over period valuation fluctuations in all types of investments.
Asset Allocation and Performance
The graph below presents STRP net investments, excluding securities lending collateral and obligations, based on investment classifications within the Statement of Fiduciary Net Position as of June 30, 2018.
Investment Income (Gross of Expenses)
0
1
2
3
4
5
6
7
8
Sources of Investment Income
The graph below displays a detailed view of the sources of investment income for the STRP, excluding securities lending income, based on the Statement of Changes in Fiduciary Net Position as of June 30, 2018.
$ B
illio
ns
2.9
1.3
6.57.1
Dividends Interest Income
Other Income
Realized Gains
(Losses)
UnrealizedAppreciation
(Depreciation)
1.1
Statement of Fiduciary Net Position Investment Distribution1
Debt Securities 19.52%
Alternative Investments 29.25%
Derivative Instruments2 0.04%
Equity Securities 51.19%
1 This chart only presents investments of the STRP as investment assets of the STRP are actively managed by CalSTRS. While CalSTRS offers investment strategies for the Pension2 programs, investment assets of the 403(b) and 457(b) plans are not actively managed by CalSTRS. Additionally, investment assets in the MPP Program and the TDCF are invested in the Surplus Money Investment Fund, which is a pooled investment program administered by the State Treasurer.
2 Derivative instruments are reported on a net basis in the chart above. Please refer to the Schedule of Investments in the Notes to the Basic Financial Statements for more information.
MANAGEMENT’S DISCUSSION AND ANALYSIS (UNAUDITED)
of equity interests in public companies, limited partnerships and co-investments. Other income consists primarily of distributed income from alternative investments (such as rent), term loans and securities litigation. Realized gains (losses) are generally a result of investment sales, write-offs and reorganizations. Unrealized appreciation (depreciation) is generated by period over period
Asset Allocation and Performance
The graph below presents STRP net investments, excluding securities lending collateral and obligations, based on investment
Investment Income (Gross of Expenses)
0
1
2
3
4
5
6
7
8
Sources of Investment Income
The graph below displays a detailed view of the sources of investment income for the STRP, excluding securities lending income, based on the Statement of Changes in Fiduciary Net Position as of June 30, 2018.
$ B
illio
ns
2.9
1.3
6.57.1
Dividends Interest Income
Other Income
Realized Gains
(Losses)
UnrealizedAppreciation
(Depreciation)
1.1
Statement of Fiduciary Net Position Investment Distribution1
Debt Securities 19.52%
Alternative Investments 29.25%
Derivative Instruments2 0.04%
Equity Securities 51.19%
1 This chart only presents investments of the STRP as investment assets of the STRP are actively managed by CalSTRS. While CalSTRS offers investment strategies for the Pension2 programs, investment assets of the 403(b) and 457(b) plans are not actively managed by CalSTRS. Additionally, investment assets in the MPP Program and the TDCF are invested in the Surplus Money Investment Fund, which is a pooled investment program administered by the State Treasurer.
2 Derivative instruments are reported on a net basis in the chart above. Please refer to the Schedule of Investments in the Notes to the Basic Financial Statements for more information.
MANAGEMENT’S DISCUSSION AND ANALYSIS (UNAUDITED)

45FINANCIAL
MANAGEMENT’S DISCUSSION AND ANALYSIS (UNAUDITED)
Equity Securities
The Global Equity asset class represents 53.7 percent of total investments as of June 30, 2018, and is composed of equity securities within the U.S., non-U.S. developed countries and emerging markets. Corporate governance funds are included within the Global Equity asset class but are classified as Alternative Investments on the financial statements, as reflected in the table above. Approximately 55 percent of the Global Equity assets are managed internally by CalSTRS investment staff, while the remaining 45 percent are managed by external investment managers.
As of June 30, 2018, the STRP held $115.3 billion in equity securities across all portfolios, an increase of 1.8 percent compared to the prior year.
Global equities generated positive returns for the fiscal year. Gains in the U.S. markets were largely driven by the federal tax reform legislation passed in December 2017, which reduced corporate and individual tax rates. Positive corporate earnings and global economic growth also contributed to returns, both internationally and domestically. By 2018, many U.S. and international stock indices had reached record highs.
The following table displays the distribution of net investments based on the portfolio allocation as compared to the classification within the Statement of Fiduciary Net Position as of June 30, 2018.
Portfolio Allocation versus Financial Statement Classification
Portfolio Allocation Financial Statement Classification
Asset Class/Strategy Asset Allocation Investments % of Asset Class
Global Equity 53.7%
Equity Securities 95.9%
Alternative Investments 2.7%
Debt Securities 1.1%
Other* 0.3%
Fixed Income 12.3%Debt Securities 102.6%
Other* (2.6%)
Real Estate 12.8%
Alternative Investments 99.8%
Debt Securities 0.1%
Equity Securities 0.1%
Private Equity 8.2% Alternative Investments 100.0%
Liquidity 1.4%Debt Securities 99.8%
Other* 0.2%
Inflation Sensitive 1.9%
Alternative Investments 72.1%
Debt Securities 27.6%
Derivative Instruments 0.3%
Equity Securities 0.1%
Other* (0.1%)
Risk Mitigating Strategies
8.9%
Alternative Investments 53.9%
Debt Securities 45.7%
Other* 0.4%
Innovative Strategies 0.2% Alternative Investments 100.0%
Strategic Overlay 0.6%
Debt Securities 77.9%
Derivative Instruments 8.1%
Equity Securities 0.2%
Other* 13.8%
Total Fund 100.0%
*Other consists of cash, payables and receivables that are reflected as such on the Statement of Fiduciary Net Position and any investment categories less than 0.1 percent.

46 CALSTRS COMPREHENSIVE ANNUAL FINANCIAL REPORT 2018
MANAGEMENT’S DISCUSSION AND ANALYSIS (UNAUDITED)
However, in the third quarter of the fiscal year, equities slid as market volatility surged amid rising inflation expectations, geopolitical uncertainty and global trade tensions. The announcement of U.S. tariffs on imported steel and aluminum, as well as a range of imports from China, also weighed on investor sentiment and caused market disruption. Emerging markets outperformed developed non-U.S. markets for the fiscal year as commodity prices rose and synchronized global growth created a demand for riskier assets.
Debt Securities
The Fixed Income asset class is composed of U.S. and non-U.S. dollar-based investment grade and non-investment grade securities. Approximately 84 percent of the asset class uses an enhanced core strategy. The remaining 16 percent uses broader core plus, high yield and other opportunistic strategies.
Debt securities within Fixed Income and other asset classes increased 7.3 percent from $41.0 billion as of June 30, 2017, to $44.0 billion at June 30, 2018.
Returns were modest for debt securities for the fiscal year. At the start of the year, bond markets generated positive returns from high demand as investors sought out safe-haven investments amid potential North Korean tensions. The gains were later offset as expectations of higher growth and inflation from the tax cuts led bond yields to increase, thus lowering bond prices. The Federal Reserve raised interest rates three times during the fiscal year to their highest level since April 2008 and began reducing its holdings of U.S. Treasury bonds and mortgage-backed securities in efforts to tighten monetary policy.
Alternative Investments
Alternative investments include investments in private equity, real estate, corporate governance, inflation sensitive, innovative and risk mitigating strategies. For the period ended June 30, 2018, alternative investments increased 16.8 percent from $56.4 billion to $65.9 billion. The increase was primarily due to the funding of new investments in privately held equities within Risk Mitigating Strategies (RMS). RMS represented 8.9 percent of total investments as of June 30, 2018 (up from 5.1 percent as of June 30, 2017), and includes strategies that provide protection against equity market downturns. These
strategies may include long duration U.S. Treasuries, Trend following, Global Macro, and Systematic Risk Premia as identified in the Risk Mitigating Strategies Class Policy.
The Private Equity asset class is composed primarily of limited partnerships and co-investments focusing on commitments to domestic and non-U.S. partnerships as identified in the Private Equity Policy. Types of investment strategies include leveraged buyouts, venture capital and debt investments. The Private Equity asset class posted double-digit returns for the fiscal year ended June 30, 2018. For the industry as a whole, the number of private equity funds continued to rise throughout the fiscal year. Capital distributions also exceeded capital called by the funds and unfunded commitments remained at record levels. Substantial fees and costs are associated with investments in the Private Equity asset class. Consequently, emphasis is placed on negotiating and monitoring the costs of each limited partnership investment.
The Real Estate asset class is composed of investments in directly held real estate (such as wholly owned properties and joint venture investments) and non-directly held real estate, which consist primarily of commingled funds and co-investments. To more closely align the interest of CalSTRS and the real estate managers, emphasis is placed on negotiating, monitoring and managing the costs associated with each real estate investment.
Real estate investments increased $2.8 billion or 10.4 percent for the period ended June 30, 2018. Returns for the portfolio were in the double digits as of the fiscal year end primarily due to distributed income and realized and unrealized gains within the asset class.
Overall, the real estate industry remained positive during the fiscal year as economic growth boosted demand for all major commercial property types. Low vacancy rates and increased rents also contributed to rising net operating income and higher valuations. Despite the Federal Reserve’s interest rate hikes throughout the fiscal year, mortgage rates remained relatively low by historical standards, and financing continued to be attractive.
In the private real estate space, performance was positive as the number of funds available grew and fundraising remained healthy. Value added and opportunistic strategies represented the majority of the funds in the market. Capital distributions also exceeded capital called by the funds, resulting in large net cash flows.

47FINANCIAL
MANAGEMENT’S DISCUSSION AND ANALYSIS (UNAUDITED)
The CalSTRS Corporate Governance Program is designed to maximize the long-term value of the CalSTRS Investment Portfolio. Our corporate governance policies are guidelines used to engage companies on topics such as climate change, board governance and diversity. Ultimately, CalSTRS believes the companies we invest in should be accountable to shareholders as investors and providers of capital.
In the 2017 calendar year, CalSTRS voted on 79,229 proposals at 8,042 shareholder meetings held by companies in our Global Equity portfolio. Staff voted on proposals covering a variety of topics, including the election of directors, ratification of company auditors, approval of executive and director compensation plans, and approval of mergers and acquisitions. Recent achievements and future objectives are outlined in the fifth Corporate Governance
Annual Report, which is available at CalSTRS.com.
CalSTRS firmly believes the best way to resolve issues involves active and direct engagement, which may include shareholder resolutions or regulatory and legislative support. In response to recent events, the 2018 Corporate Governance Engagement Plan was updated to prioritize engagement with companies that manufacture and sell firearms that are illegal in California. Should engagement efforts prove unsuccessful, the board may consider divestment or customized indices that would exclude retailers that manufacture and sell these firearms.
Asset/Liability Study
CalSTRS conducts a full asset/liability study once every four years or more frequently if there is a significant change in our assets or liabilities, with the key goal of developing an asset allocation policy that maximizes the likelihood that the investment portfolio’s assets will, over the planning horizon, fund plan benefits. The most recent study was completed in fiscal year 2015–16. As a result, the Investment Committee agreed to adopt RMS as an asset class to provide further diversification of CalSTRS’ overall investment portfolio. RMS is designed to provide protection against equity market downturns in the future and has an allocation target of 9 percent of the total fund assets. To integrate this new asset class, CalSTRS adopted an implementation plan in 2016, which allowed the Investment Committee to review the allocation every six months and make adjustments as needed. The portfolio was fully
funded in February 2018 but not fully implemented. Staff continue to implement strategies approved by the board. RMS represented $20.0 billion or 8.9 percent of the total fund assets as of June 30, 2018.
As previously noted under Funding Levels and Risks, CalSTRS has undertaken steps to create an internal asset/liability management team and an asset/liability management framework. Beginning in 2018, the asset/liability management team will begin work on the next asset allocation study to be completed in 2019.
In addition, CalSTRS transitioned from a U.S. equity bias to global market weights for U.S. and non-U.S. equities.
Detailed information regarding the study and the long-term
policy targets and ranges can be found at CalSTRS.com.
Investment Cost Report
The 2016 calendar year investment cost report presented to the board in November 2017 provided a comprehensive view of investment costs on a cash basis across asset classes and investment strategies. The report includes a total fund and asset class/investment strategy year-over-year comparison. In addition to providing internal and external management costs, CalSTRS also provided a view of public versus private market costs.
The report showed a 1.8 basis points (bps) reduction of cost from 51.8 bps in calendar year 2015 to 50.0 bps in calendar year 2016. Although the absolute dollars increased from $963 million to $973 million, the reduction to 50.0 bps reflects the increased assets under management and CalSTRS’ commitment to reduce costs.
The 2016 calendar year report also presented a comparison of CalSTRS’ investment costs to 14 of our global peers with assets under management that ranged from $88 billion to $524 billion. CalSTRS’ investment strategies saved approximately $211 million in investment costs compared to our peers. These comparisons were compiled by third-party cost measurement service providers using various customized methodologies. CalSTRS will continue to develop standardized cost-reporting practices to enhance our investment management reporting. A copy of the report is available at CalSTRS.com.

48 CALSTRS COMPREHENSIVE ANNUAL FINANCIAL REPORT 2018
MANAGEMENT’S DISCUSSION AND ANALYSIS (UNAUDITED)
Pension Administration
As a provider of pension and other postemployment benefits, CalSTRS must ensure that the contributions we receive and investment income we earn will fund current and future benefits owed to our members and their beneficiaries. Actuarial valuation reports are prepared on an annual basis to help assess the funded status of our programs, and are integral to our administration of benefits. As a result of requirements set forth by GASB standards, CalSTRS prepares separate actuarial valuations for financial reporting purposes and funding purposes.
Pension System Financial Reporting Actuarial Valuation
The actuarial valuation for financial reporting focuses on the obligation an employer incurs on behalf of employees through the employment-exchange process. The primary purpose of the valuation for financial reporting is to provide a consistent, standardized methodology that allows comparability of data and increased transparency of the pension liability across plans. To achieve this, GASB requires a different approach for determining the reported NPL, as compared to Unfunded Actuarial Accrued Liability (UAAL).
There are considerable differences between the UAAL and NPL. Conceptually, the UAAL is the actuary’s measure of the additional amount of assets needed to pay all benefits earned to date by current plan members, while the NPL is an accrual calculation that reflects future benefits earned by plan members through the employment-exchange process in excess of the plan’s fiduciary net position.
With the provision of additional member, employer and state contributions effective July 1, 2014, CalSTRS does not project a depletion of assets. CalSTRS discounted all future obligations for the STRP using the long-term assumed rate of return on plan assets gross of administrative costs (currently 7.1 percent). Based on that assumption, the STRP has an NPL of $91.9 billion as of June 30, 2018.
Pension System Funding Actuarial Valuation
The purpose of the actuarial valuations for funding the programs within the STRP is to guide decisions regarding the long-term viability of the programs. Specifically, the purpose is to analyze the sufficiency of future contributions from members, employers and the state to meet current and future obligations. Historically, CalSTRS investment income has contributed approximately 61.8 percent of
the total inflows to the STRP with employer contributions making up 15.2 percent, member contributions making up 14.7 percent and state contributions making up 8.3 percent. These percentages change over time due to fluctuating net investment income as well as the adjustments to required member, employer and state contribution rates due to AB 1469.
Separate funding actuarial valuations are performed for the DB Program, DBS Program and CBB Program. An actuarial projection is performed for the Supplemental Benefit Maintenance Account (SBMA), which is a special account in the STRP that provides inflation protection to CalSTRS members whose current purchasing power has fallen below 85 percent of the purchasing power of their initial benefit. The assets in the SBMA are credited each year at the rate of investment return assumed for the DB Program. Currently, the investment rate of return and discount rate assumption for funding actuarial valuations is 7.0 percent (6.50 percent for CBB Program). The investment return assumption, according to actuarial principles, should be based on an estimated long-term investment yield for the STRP with consideration given to the nature and mix of current and expected plan investments and is the basis for determining the actuarial value of assets.
The investment return assumptions are developed by CalSTRS investment and actuarial consultants and are adopted by the board. The actuarial assumptions and methods used in the June 30, 2017, actuarial valuation were based on the 2015 Actuarial Experience Analysis adopted by the board in February 2017.
The most recent actuarial valuation indicates that the DB Program had 62.6 percent of the funds needed to pay the actuarial cost of the benefits accrued as of June 30, 2017, which decreased by 1.1 percent from the June 30, 2016, valuation. This decrease is attributable to the adoption of new actuarial assumptions by the board in February 2017, which reduced the investment return assumption and increased expected life spans of CalSTRS members. The investment return assumption was reduced from 7.50 percent in the 2015 valuation, to 7.25 percent in the 2016 valuation, and then to 7.0 percent for the 2017 valuation. Although the system may experience declines in its funded status in the short term, an upswing is projected under the funding plan as contributions increase, with a steady progress toward full funding by 2046.

49FINANCIAL
MANAGEMENT’S DISCUSSION AND ANALYSIS (UNAUDITED)
Additionally, the funding actuarial valuation for the DBS Program indicates that as of June 30, 2017, the DBS Program had a funded ratio of 122.1 percent compared to the June 30, 2016, funded ratio of 111.6 percent. The funding actuarial valuation for the CBB Program indicates that as of June 30, 2017, the program had a funded ratio of 120.0 percent compared to the June 30, 2016, funded ratio of 108.8 percent. The funded ratios for both the DBS and CBB programs were provided prior to the adoption of additional earnings credit by the board in May 2018.
Interest is credited to the nominal DBS and CBB program accounts at the minimum guaranteed annual rate established by the board prior to each plan year, which was 2.64 percent for the fiscal year ended June 30, 2018. The board may credit additional earnings to members’ nominal accounts if actual investment earnings exceed the minimum guaranteed annual rate and meet criteria set out by the board. The board granted additional earnings credit for the DBS and CBB programs totaling $356.9 million and $8.9 million, respectively. Awarding the credits reduced the funded ratios cited above from 122.1 percent to 118.0 percent for the DBS Program and from 120.0 percent to 115.9 percent for the CBB Program. Refer to Note 1 for additional information.
Other Postemployment Benefits (OPEB) Financial
Reporting Actuarial Valuation
The financial reporting actuarial valuation for the MPP Program is performed to determine the net OPEB liability and other required financial disclosures in accordance with GASB Statement No. 74. The MPP Program pays for Medicare Part A premiums and Medicare Parts A and B late enrollment surcharges for eligible members of the DB Program. The total OPEB liability for the MPP Program was determined by using the actuarial valuation as of June 30, 2017. As of June 30, 2018, the net OPEB liability for the MPP Program is $382.8 million.
The MPP Program is funded on a pay-as-you-go basis, with contributions generally being made at the same time in the same amount as benefit payments and expenses coming due. Minimal investment assets are maintained in the fund to manage differences between estimated and actual amounts to be paid and are invested in the Surplus Money Investment Fund, which is a pooled investment program administered by the State Treasurer. For financial reporting purposes, the plan is essentially unfunded as the fiduciary net position of the plan will not be sufficient to make the projected future benefit payments. Therefore, in accordance with GASB Statement No. 74, in instances such as this, the rate used to discount the total OPEB liability represents the yield or index rate for 20-year, tax-exempt general obligation municipal bonds with an average rating of AA/Aa or higher. The discount rate as of June 30, 2018, for the MPP Program OPEB liability is 3.87 percent as measured by The Bond Buyer’s 20-Bond GO Index as of June 30, 2018.
OPEB Funding Actuarial Valuation
The MPP Program is funded on a pay-as-you-go basis from redirected contributions from the DB Program. The MPP Program funding actuarial valuation measures the value of DB Program employer contributions that will be available to fund the MPP Program benefits in future periods. This valuation differs from the actuarial valuation for financial reporting for the MPP Program, which focuses on the obligation an employer incurs on behalf of employees through the employment-exchange process.
The DB Program funding actuarial valuation as of June 30, 2017, found that the MPP Program assets, along with MPP allocated funding from future employer contributions, are sufficient to finance the future MPP Program obligations of $314 million for both Part A premiums and Parts A and B surcharges.

50 CALSTRS COMPREHENSIVE ANNUAL FINANCIAL REPORT 2018
MANAGEMENT’S DISCUSSION AND ANALYSIS (UNAUDITED)
STRP Contributions and Benefit Payments
The chart below shows that prior to the enactment of AB 1469 in June 2014, there had been a growing gap between contributions and benefit payments. During fiscal year 2017–18, the gap narrowed by 11.4 percent.
Contribution rates will continue to increase according to AB 1469, which has improved the long-term sustainability of the DB Program as it continues making progress toward full funding by the year 2046. Despite this, investment volatility, longevity and membership levels pose potential risks to full funding. The experience beyond 2046 may differ.
The following chart is a 10-year comparison of investment income, contributions and benefit payments.
2009 2010 2011 2012 2013 2014 2015 2016 2017 2018
Net Investment Income
Benefit Payments
Contributions
STRP Investment Income, Contributions and Benefit Payments
40
30
20
10
0
(10)
(20)
(30)
(40)
(50)
$ in
Bill
ions
14
12
10
8
6
4
2
0FY 08-09 FY 09-10 FY 10-11 FY 11-12 FY 12-13 FY 13-14 FY 14-15 FY 15-16 FY 16-17 FY 17-18
Member Contributions Employer Contributions State Contributions Benefit Payments
16
$ in
Bill
ions
(Years ended June 30)

51FINANCIAL
MANAGEMENT’S DISCUSSION AND ANALYSIS (UNAUDITED)
OTHER BUSINESS ACTIVITIES
Sustainability
CalSTRS believes establishing a corporate environment with sustainable principles leads to a more productive business culture, better environmental and governance practices and increased long-term viability. As trusted stewards of the system, CalSTRS continues to underscore and emphasize the need to look over a long-term, 30-year horizon — well beyond the immediate impacts of any short-term results. This entails modeling best practices in corporate governance, employing risk-mitigation policies, developing workforce succession plans and dedicating resources to increase our members’ financial awareness and retirement security.
CalSTRS released our fourth annual sustainability report for fiscal year 2016–17, Global Stewardship at Work, which was prepared based on the Global Reporting Initiative G4 Guidelines and outlines notable achievements relating to long-term sustainability and stewardship. The report details our commitment to progressive ESG principles through our efforts concerning responsible business practices, workforce development, retirement security and sustainability-related investment risk management. For instance, CalSTRS assessed the increasing risk of cyberattacks and implemented the Center of Internet Security’s 20 Critical Security Controls to strengthen our cybersecurity posture. We surveyed our vendors with contracts worth over $50,000 regarding their efforts to address ESG risks. The report also highlights CalSTRS’ efforts to advance understanding of diversity among our staff through an all-day interactive workshop titled Diversity and Inclusion: The Power of
Difference. All CalSTRS employees attended this workshop and were given the opportunity to learn how working together creates a more inclusive, supportive organizational culture. A copy of the report is available at CalSTRS.com.
CalSTRS actively engages with organizations committed to bringing transparency to sustainable practices of companies in the U.S. To this end, CalSTRS is a founding board member of the Sustainability Accounting Standards Board (SASB) and believes that companies should report on material ESG issues that affect their financial performance.
SASB is an independent nonprofit organization that sets sustainability accounting standards to help public corporations disclose material, decision-useful information to investors. SASB standards identify sustainability topics
at an industry level that may constitute material information — depending on a company’s specific operating context. While not required to adhere to SASB guidelines, some SASB topics are relevant to CalSTRS and include employee incentives and risk taking, employee inclusion, management of the legal and regulatory environment and integration of ESG risk factors in investment management.
The standards related to incentives and risk taking seek to provide readers with a clear understanding on how employee compensation structures may impact long-term value. CalSTRS enforces a strict incentive compensation policy based on both qualitative and quantitative performance objectives designed to align staff and system interests. The board has discretion to pay no incentives, reduce the amount of an incentive award, or defer all or part of an employee’s incentive award for a plan year. This can be done if qualifying events related to investment performance, ethical violation or reputational risks occur. CalSTRS strives to sustain careers of our employees over the long term and awards high performers who have met the qualitative and quantitative requirements outlined in the policy.
The following table is a summary of incentive awards paid in fiscal year 2017–18 to qualifying employees in comparison to their regular pay:
*Ratio of Incentive Pay to Total Pay1The Executives/Senior Managers category consists of all eligible employees classified as an Executive, Investment Director, Portfolio Manager and Associate Portfolio Manager.
2The All Others category represents all non-management investment staff eligible for incentive pay.
Incentive Pay Ratio for Qualifying CalSTRS Employees
(Dollars in Thousands)
Incentive Pay Total Pay %*
Executives/Senior Managers1 $4,891 $17,784 27.5%
All Others2 201 2,388 8.4
SASB standards state that significant value can be generated through meaningful employee engagement strategies and by ensuring diversity through inclusive training and development practices. CalSTRS continues to expand our efforts to grow an engaged, highly skilled and diverse workforce. Further information regarding CalSTRS’ sustainability practices with respect to workforce development, including the percentage of gender and racial/ethnic group representation for CalSTRS workforce, can be found in the 2016–17 sustainability report, Global
Stewardship at Work, available at CalSTRS.com.

52 CALSTRS COMPREHENSIVE ANNUAL FINANCIAL REPORT 2018
MANAGEMENT’S DISCUSSION AND ANALYSIS (UNAUDITED)
SASB guidelines related to management of the legal and regulatory environment state that those who manage assets have legal obligations and fiduciary duties related to record keeping, operating and marketing, disclosure requirements and prohibitions on fraudulent activities. CalSTRS strives to maintain high ethical standards that support the CalSTRS Core Values and ensure understanding and cooperation among our staff regarding their ethics and compliance responsibilities.
In addition to periodic compliance training and communications, CalSTRS encourages the use of our various compliance programs. CalSTRS offers employees and members many ways to report unethical conduct, including the Pension Abuse Reporting Hotline or submissions through the Citizen’s Complaint Act. When a report is received, the CalSTRS Office of Legal Ethics and Accountability performs an independent and thorough investigation. Additionally, the Compensation Review Unit reviews reports of inappropriate pension-related activities.
In fiscal year 2017–18, there were no significant instances of unethical conduct reported. Cases of potential pension spiking were investigated and resolved or referred to the general counsel’s office. As a result of our efforts, we have not incurred any material fines or settlements related to our communications, financial fraud or other commercial issues in fiscal year 2017–18.
As a long-term investor, ESG factors are of great importance to us. While the specific factors vary by company, industry and geography, we consider relevant ESG matters when evaluating opportunities, making investment decisions, managing our investments and engaging with companies to seek improvements in business practices and disclosure.
In February 2018, CalSTRS issued the 11th Green
Initiative Task Force Annual Report for the year ending June 30, 2017. The Green Initiative Task Force, also known as the Green Team, was established in 2007 to identify, analyze and consider investment opportunities and risk-control strategies addressing climate change. The report provides an update on the CalSTRS Investments Branch’s efforts to manage environmental risks the CalSTRS portfolio faces, the methods used to integrate environmental risk factors into the investment management process and examples of investments that CalSTRS or our
partnerships have made while taking into consideration environmental risk factors. One key initiative highlighted in the report is the implementation of CalSTRS’ Low-Carbon Index Portfolio, which took place in July 2017. The portfolio is invested in an index designed to have significantly lower exposure to carbon emissions than the broad market and a near complete reduction in exposure to fossil fuel reserves. The initial phase represented an investment of $1.3 billion in the U.S. market. Over time, CalSTRS will invest an additional $1.2 billion between non-U.S. developed markets and emerging markets. As of June 30, 2018, the value of the investments in the U.S. market was $1.5 billion. More information can be found in the report available at CalSTRS.com.
In fiscal year 2017–18, CalSTRS concluded a rigorous 15-month process by selecting a pool of eight ESG-focused asset managers. These managers have been chosen to execute specific ESG investment strategies. While no investment funds have been committed to any of the managers, they are now eligible to receive an allocation when opportunities arise.
Diversity in management of investments is interwoven throughout the investment business goals and is consistent with the objective to invest in strategies that enhance returns at a prudent level of risk. When it comes to diversity and inclusion within the investments industry, CalSTRS proactively leverages opportunities to collaboratively engage with companies in the portfolio as well as leaders on a global scale in order to motivate positive momentum. In February 2018, CalSTRS published our annual Diversity
in Management of Investments report for the 2017 calendar year, with details regarding efforts to improve diversity, including internal staff development, portfolio company engagement, outreach and education, and the emerging manager programs. For example, the Corporate Governance Enhanced Diversity Initiative, approved by the Investment Committee in 2016, is part of these efforts. The goal is for CalSTRS staff to have in-depth discussions with companies to understand their diversity programs and overall impact in developing diverse representation within senior executive staff, as well as strengthening the pipeline of diverse candidates to serve on their boards. Additional CalSTRS diversity initiatives are discussed in the report which is available only at CalSTRS.com.
53FINANCIAL
MANAGEMENT’S DISCUSSION AND ANALYSIS (UNAUDITED)
Business Transformation
CalSTRS continues to develop as an organization, and we reflect our goals, risks and initiatives in a three-year strategic plan and annual business plan.
Fiscal Year 2017–18 Business Plan
The fiscal year 2017–18 Business Plan outlined the allocation of resources and identified key objectives scheduled for completion by the close of the fiscal year. These objectives were related to various aspects of the CalSTRS organization including: Financial, Member/Employer, Business Transformation and Workforce Transformation. CalSTRS staff made significant progress on the initiatives outlined in this plan, and results of the prior year board strategic goals were presented in the current year report.
Pension Solution Project
CalSTRS continued efforts on the Pension Solution Project, which involves the replacement of the CalSTRS legacy pension administration system. Due to the complex nature of the project, CalSTRS and CGI Group, Inc. (CGI), the vendor contracted to configure and implement the new system, identified certain challenges and risks that could cause delays in the project. To address these concerns, CalSTRS and CGI conducted a 90-day “fit-gap” exercise to carefully evaluate the gaps between CalSTRS’ business needs and the out-of-the-box functionality present in the new pension administration system. In addition, CalSTRS continued to identify opportunities to reduce risk to the project schedule and scope through the Project Improvement Exercise. These exercises provided a redefined understanding of the level of effort required to design, build and implement the required functionality for the new system and led to a revised project timeline. As a result in February 2018, the board approved a $34 million contract increase for CGI to cover the proposed schedule extension and the costs associated with the refined requirements.
Additionally, the companion Data Prep Project continued to analyze and address data issues in our legacy pension system. This project will help ensure our members can rely on timely, accurate and complete information in the new pension administration system.
Long–Term Space Planning
Due to increasing complexities in investment markets, the financial services sector and public pension plan administration, CalSTRS staff has increased over the past several years, and the organization anticipates staff will continue to grow over the next two decades. The board is thoroughly vetting several options, including the associated costs and logistics of:
• Long–term lease at an existing building.
• Purchase of an existing building.
• Expansion of the headquarters campus to include a second structure.
In spring 2017, CalSTRS partnered with construction management and architectural firms to analyze the potential long-term solution of expanding the headquarters campus. CalSTRS also continued to explore local market opportunities to buy or lease space as long-term alternatives. Updates were provided to the board throughout 2017–18. A financial analysis of all alternatives will be presented to the board, and a decision on how the organization should proceed is expected to be made in November 2018.
Legislative Update
Consistent with CalSTRS’ mission, the board authorizes staff to engage in the legislative process to prevent and remove obstacles that impair the ability of CalSTRS members to achieve financial security. The following is a list of bills CalSTRS is currently monitoring that have not been enacted as of June 30, 2018:
AB 2052 (Bonta) is board-sponsored legislation that, effective upon authorization by the board, requires all employers to submit their contribution payments by an electronic funds transfer method. It also allows an employer that is unable to comply with this requirement to apply to the board for a waiver to pay in an alternate manner.
SB 964 (Allen) requires the board to analyze “climate-related financial risk,” as defined, to the extent that the board identifies such risk as a material risk to the fund. It also requires the board to publicly report on the analysis of the climate-related financial risks of CalSTRS’ public market portfolios every three years. The bill sunsets on January 31, 2035.

54 CALSTRS COMPREHENSIVE ANNUAL FINANCIAL REPORT 2018
MANAGEMENT’S DISCUSSION AND ANALYSIS (UNAUDITED)
H.R. 10 (Hensarling–TX) repeals provisions of the Dodd-Frank Wall Street Reform and Consumer Protection Act and changes shareholder proposal thresholds.
H.R. 985 (Goodlatte–VA) makes significant changes to laws governing class action lawsuits, including prohibiting class certification unless “each class member has suffered the same type and scope of injury.” Among other provisions, it also limits the amount and timing of attorney’s fees and allows defendants to automatically appeal class certifications.
H.R. 6290 (Nunes–CA) requires CalSTRS to report specified information to the U.S. Treasury Secretary each plan year using the U.S. Treasury spot rate yield curve to calculate the information, where applicable, failure to comply with the reporting requirements results in the forfeiture of federal tax benefits to bonds issued by the relevant state or political subdivision until noncompliance is remedied.
REQUESTS FOR INFORMATION
This financial report is designed to provide a general overview of CalSTRS’ finances. For questions concerning the information in this report or for additional information, contact CalSTRS, P.O. Box 15275, Sacramento, CA 95851–0275.
Respectfully submitted,
Julie Underwood
Chief Financial Officer

55FINANCIAL
Basic Financial Statements

56 CALSTRS COMPREHENSIVE ANNUAL FINANCIAL REPORT 2018
As of June 30, 2018 (Dollars in Thousands)
The accompanying notes are an integral part of these statements.
State Teachers’
Retirement Plan
Pension2
403(b) Plan
Pension2
457(b) Plan
Medicare
Premium Payment
Program
Teachers’
Deferred
Compensation
Fund Total
Assets
Investments:
Debt Securities $43,973,511 $388,108 $15,323 $605 $1,389 $44,378,936
Equity Securities 115,337,965 534,331 26,402 -- -- 115,898,698
Alternative Investments 65,894,125 -- -- -- -- 65,894,125
Derivative Instruments 233,040 -- -- -- -- 233,040
Securities Lending Collateral 21,931,891 -- -- -- -- 21,931,891
Total Investment Assets 247,370,532 922,439 $41,725 $605 $1,389 $248,336,690
Cash 153,256 -- -- -- -- 153,256
Receivables:
Investments Sold 2,517,825 -- -- -- -- 2,517,825
Interest and Dividends 558,795 -- -- 6 6 558,807
Member, Employer and State 714,785 12,330 323 -- -- 727,438
Loans Receivable 2,723,533 4,084 247 -- -- 2,727,864
Other 30,338 -- -- -- 155 30,493
Total Receivables 6,545,276 16,414 570 6 161 6,562,427
Other Assets:
Capital Asset, Net of Accumulated Depreciation 276,001 -- -- -- -- 276,001
Other 244 -- -- -- -- 244
Total Other Assets 276,245 -- -- -- -- 276,245
Total Assets 254,345,309 938,853 42,295 611 1,550 255,328,618
Deferred Outflows of Resources 117,457 -- -- 191 800 118,448
Total Assets and Deferred
Outflows of Resources 254,462,766 938,853 42,295 802 2,350 255,447,066
Liabilities
Investments:
Derivative Instruments 140,070 140,070
Total Investment Liabilities 140,070 -- -- -- -- 140,070
Investments Purchased Payable 3,346,989 -- -- -- -- 3,346,989
Loans Payable 2,731,737 -- -- -- -- 2,731,737
Benefits in Process of Payment 263,254 -- -- -- -- 263,254
Net Pension and OPEB Liabilities 835,204 -- -- 1,793 5,612 842,609
Securities Lending Obligation 21,917,706 -- -- -- -- 21,917,706
Other 303,893 1,877 1 403 1,141 307,315
Total Liabilities 29,538,853 1,877 1 2,196 6,753 29,549,680
Deferred Inflows of Resources 55,278 -- -- 148 429 55,855
Total Liabilities and Deferred
Inflows of Resources 29,594,131 1,877 1 2,344 7,182 29,605,535
Net Position Restricted for Pensions/
Other Postemployment Benefits $224,868,635 $936,976 $42,294 ($1,542) ($4,832) $225,841,531
STATEMENT OF FIDUCIARY NET POSITION

57FINANCIAL
State Teachers’
Retirement Plan
Pension2
403(b) Plan
Pension2
457(b) Plan
Medicare
Premium Payment
Program
Teachers’
Deferred
Compensation
Fund Total
Additions
Contributions:
Member $3,496,245 $122,113 $7,038 $-- $-- $3,625,396
Employer 4,866,661 369 85 28,218 -- 4,895,333
State of California 2,796,673 -- -- -- -- 2,796,673
Total Contributions 11,159,579 122,482 7,123 28,218 -- 11,317,402
Investment Income:
Net Appreciation/(Depreciation) in Fair Value of Investments 13,653,813 49,382 1,842 -- (1) 13,705,036
Interest, Dividends and Other 5,349,855 15,722 713 18 18 5,366,326
Securities Lending Income 361,103 -- -- -- -- 361,103
Investment Expenses:
Cost of Lending Securities (312,391) -- -- -- -- (312,391)
Other Investment Expenses (378,843) -- -- -- -- (378,843)
Net Investment Income 18,673,537 65,104 2,555 18 17 18,741,231
Other Income 105,144 309 11 - 1,607 107,071
Total Additions 29,938,260 187,895 9,689 28,236 1,624 30,165,704
Deductions
Retirement, Disability, Death and Survivor Benefits 14,270,878 -- -- -- -- 14,270,878
Premiums Paid -- -- -- 28,036 -- 28,036
Distributions and Withdrawals -- 48,481 1,411 -- -- 49,892
Purchasing Power Benefits 161,932 -- -- -- -- 161,932
Refunds of Member Contributions 103,886 5,614 88 -- -- 109,588
Administrative Expenses 216,083 2,406 100 578 2,198 221,365
Borrowing Costs 94,249 -- -- -- -- 94,249
Other Expenses 1,678 -- -- -- -- 1,678
Total Deductions 14,848,706 56,501 1,599 28,614 2,198 14,937,618
Net Increase (Decrease)
in Net Position 15,089,554 131,394 8,090 (378) (574) 15,228,086
Net Position Restricted for Pensions/Other
Postemployment Benefits
Beginning of the Year–As Previously Reported 210,289,900 805,582 34,204 41 (268) 211,129,459
Adjustment for Application of GASB 751 (510,819) -- -- (1,205) (3,990) (516,014)
Beginning of the Year–As Adjusted 209,779,081 805,582 34,204 (1,164) (4,258) 210,613,445
End of the Year $224,868,635 $936,976 $42,294 ($1,542) ($4,832) $225,841,531
1Refer to Note 2 in the Notes to the Basic Financial Statements for discussion of the adjustment to beginning net position due to the implementation of GASB Statement No. 75.
STATEMENT OF CHANGES IN FIDUCIARY NET POSITIONFor the Fiscal Year Ended June 30, 2018(Dollars in Thousands)
The accompanying notes are an integral part of these statements.

58 CALSTRS COMPREHENSIVE ANNUAL FINANCIAL REPORT 2018
1. DESCRIPTION OF CALSTRS AND CONTRIBUTION INFORMATION
The California State Teachers’ Retirement System (CalSTRS) administers a hybrid retirement system consisting of a defined benefit plan, two defined contribution plans, a postemployment benefit plan and a fund used to account for ancillary activities associated with various deferred compensation plans and programs:
• State Teachers’ Retirement Plan (STRP)
• CalSTRS Pension2® Program (Pension2)
• Medicare Premium Payment (MPP) Program
• Teachers’ Deferred Compensation Fund (TDCF)
CalSTRS provides pension benefits, including disability and survivor benefits, to California full-time and part-time public school teachers from pre-kindergarten through community college and certain other employees of the public school system. The Teachers’ Retirement Law (California Education Code Section 22000 et seq.), as enacted and amended by the California Legislature and Governor, established these plans and CalSTRS as the administrator. The terms of the plans may be amended through legislation.
CalSTRS is a component unit of the State of California (the state). These financial statements include only the accounts of CalSTRS. The state includes CalSTRS’ various plans and funds as fiduciary funds in its financial statements.
The Teachers’ Retirement Board (the board) has exclusive control over the administration of the retirement system plans and the investment of funds, makes rules, sets policies and has the authority to hear and determine all facts pertaining to application for benefits under the retirement system. It is composed of 12 members:
• Five members appointed by the Governor and confirmed by the Senate: one school board representative, one retired CalSTRS member and three public representatives;
• Four ex-officio members: the Superintendent of Public Instruction, the State Treasurer, the State Controller and the Director of Finance; and
• Three member-elected positions representing current educators.
State Teachers’ Retirement Plan
The STRP is a multiple-employer, cost-sharing defined benefit plan composed of four programs: Defined Benefit (DB) Program, Defined Benefit Supplement (DBS) Program, Cash Balance Benefit (CBB) Program and Replacement Benefits (RB) Program. The STRP holds assets for the exclusive purpose of providing benefits to members and beneficiaries of these programs. CalSTRS also uses plan assets to defray reasonable expenses of administering the STRP. Although CalSTRS is the administrator of the STRP, the state is the sponsor and obligor of the trust. In addition, the state is both an employer and nonemployer contributing entity to the STRP.
STRP Defined Benefit Program
As of June 30, 2018, there were 1,740 contributing employers (school districts, community college districts, county offices of education, charter schools and regional occupational programs). Membership is mandatory for all employees meeting certain statutory requirements and optional for all other employees performing creditable service activities. The DB Program provides retirement benefits based on members’ final compensation, age and years of service credit. In addition, the program provides benefits to members upon disability and to their survivors or beneficiaries upon the death of eligible members.
Active Members
Vested 315,082
Nonvested 134,473
Inactive Members
Vested 40,015
Nonvested 158,171
Retirees and Benefit Recipients 301,629
Total Members, Retirees and Beneficiaries 949,370
As of June 30, 2018, membership consisted of:
NOTES TO THE BASIC FINANCIAL STATEMENTS
Retirees and Benefit Recipients

59FINANCIAL
NOTES TO THE BASIC FINANCIAL STATEMENTS
The DB Program has two benefit formulas:
• CalSTRS 2% at 60: Members first hired on or before December 31, 2012, to perform service that could be creditable to CalSTRS.
• CalSTRS 2% at 62: Members first hired on or after January 1, 2013, to perform service that could be creditable to CalSTRS.
There are several differences between the two benefit formulas, which are noted below.
CalSTRS 2% at 60
• CalSTRS 2% at 60 members are eligible for normal retirement at age 60, with a minimum of five years of credited service. The normal retirement benefit is equal to 2.0 percent of final compensation multiplied by the number of years of credited service. Early retirement options are available at age 55 with five years of credited service or as early as age 50 with 30 years of credited service. The age factor for retirements after age 60 increases with each quarter year of age to a maximum of 2.4 percent at age 63 or older. Members who have 30 years or more of credited service receive an additional increase of up to 0.2 percent to the age factor, up to the 2.4 percent maximum.
• CalSTRS calculates retirement benefits based on one-year final compensation for members with 25 or more years of credited service, or for classroom teachers with fewer than 25 years of credited service if the employer entered into, extended, renewed or amended an agreement prior to January 1, 2014, to elect to pay the additional benefit cost for all of its classroom teachers. One-year final compensation means a member’s highest average annual compensation earnable for 12 consecutive months based on the creditable compensation that the member could earn in a school year while employed on a full-time basis. For most members with fewer than 25 years of credited service, final compensation is the highest average annual compensation earnable for any 36 consecutive months based on the creditable compensation that the member could earn in a school year while employed on a full-time basis.
• For fiscal year 2017–18, the limit on compensation that can be counted toward a member’s benefit is $270,000, if hired on or after July 1, 1996. The limit is increased based on cost-of-living increases calculated per Internal Revenue Code (IRC) section 401(a)(17). No contributions are paid by the member, employer or the state on compensation in excess of the limit, and any compensation beyond the limit is excluded from determining final compensation.
• Final compensation is based on salary and certain other types of remuneration. Other types of compensation, such as allowances, cash in lieu of fringe benefits and compensation for unused accumulated leave are not creditable compensation and do not count toward any CalSTRS benefit program. Limited-period compensation and compensation determined to have been paid to enhance a benefit are creditable to the DBS Program.
• Members who accumulated at least 30 years of credited service by December 31, 2010, receive a longevity bonus of $200, $300 or $400 per month for 30, 31 or 32 or more years of credited service, respectively.
CalSTRS 2% at 62
• CalSTRS 2% at 62 members are eligible for normal retirement at age 62, with a minimum of five years of credited service. The normal retirement benefit is equal to 2.0 percent of final compensation multiplied by the number of years of credited service. An early retirement option is available at age 55. The age factor for retirement after age 62 increases with each quarter year of age to 2.4 percent at age 65 or older.
• All CalSTRS 2% at 62 members have their final compensation based on their highest average annual compensation earnable for 36 consecutive months based on the creditable compensation that the member could earn in a school year while employed on a full-time basis.
• The limit on creditable compensation that can be counted toward a member’s benefit is adjusted each fiscal year based on changes in the Consumer Price Index. In fiscal year 2017–18, the limit was $143,082.
• Compensation paid in cash by an employer, pursuant to a publicly available written contractual agreement, for

60 CALSTRS COMPREHENSIVE ANNUAL FINANCIAL REPORT 2018
NOTES TO THE BASIC FINANCIAL STATEMENTS
each pay period in which creditable service is performed is creditable to CalSTRS benefit programs for CalSTRS 2% at 62 members. Other compensation, such as allowances, cash in lieu of fringe benefits, limited-period compensation and compensation determined to have been paid to enhance a benefit, is not creditable to any CalSTRS benefit program.
The following provisions apply to both CalSTRS 2% at 60 and 2% at 62 members:
• After earning five years of credited service, members become vested to receive service retirement benefits.
• After five years of credited service, a member (younger than age 60 if under disability Coverage A or no age limit if under disability Coverage B) is eligible for disability benefits of 50 percent of final compensation plus 10 percent of final compensation for each eligible child, up to a maximum addition of 40 percent. The member must have a disability that can be expected to last continuously for at least 12 months to qualify for a benefit.
• Contributions on compensation for service in excess of one year due to overtime or working additional assignments are credited to the DBS Program at the lowest annual pay rates up to the creditable compensation limit.
• A family benefit is available if an active member dies and has at least one year of credited service.
• Members’ accumulated contributions are refundable with interest upon separation from CalSTRS. The board determines the credited interest rate each fiscal year. For the fiscal year ended June 30, 2018, the rate of interest credited to members’ accounts was 0.90 percent.
• There is a postretirement annual benefit increase of 2 percent per year on a simple (rather than compound) basis. This benefit is vested for members who pay the higher contribution rates enacted in AB 1469 or retired in 2014.
• The member’s benefit is reduced dollar for dollar, regardless of age, for the first 180 calendar days after retirement if the member performs activities in the public schools that could be creditable to CalSTRS, unless the governing body of the school district takes specified
actions with respect to a member who is above normal retirement age.
• There is an annual limitation on earnings from activities that could be creditable to CalSTRS for retired members. The member’s benefit is reduced dollar for dollar by the amount of any earnings in excess of $43,755 in 2017–18.
• Any enhancements to the CalSTRS DB Program made on or after January 1, 2013, apply only to service performed on or after the effective date of the enhancement.
• A CalSTRS member who is convicted of committing a felony in the course of his or her official duties, including specifically a felony involving a child with whom the member had contact as part of the member’s official duties, forfeits a right to any benefits accrued beginning with the commission of the felony.
Purchasing Power Protection
Purchasing power protection is provided to members of the DB Program through annual distributions (in quarterly payments) to retired and disabled members and beneficiaries to restore purchasing power up to 85 percent of the initial monthly benefit. Funding for purchasing power protection is from School Lands Revenue generated from the use of school lands (land granted to California by the federal government to support schools) and in lieu lands (properties purchased with the proceeds from the sale of school lands) and from the Supplemental Benefit Maintenance Account (SBMA).
Public Resources Code section 6217.5 allocates School Lands Revenue to the system for purchasing power protection. In addition, a continuous appropriation from the state’s General Fund is made to the SBMA in an amount equal to 2.5 percent of the total creditable compensation of the fiscal year ending in the immediately preceding calendar year, reduced by $72 million, pursuant to Education Code section 22954. For the year ended June 30, 2018, School Lands Revenue and the amount contributed to the SBMA were $6.2 million and $695.2 million, respectively.
Contributions
The parameters for member, employer and state contribution rates are set by the California Legislature and Governor and detailed in the Teachers’ Retirement Law.

61FINANCIAL
Effective Date 2% at 60 Members 2% at 62 Members
July 1, 2017 10.25% 9.205%
July 1, 2018 10.25% 10.205%*
A summary of statutory contribution rates and other sources of contributions to the DB Program are as follows:
Members—Pursuant to AB 1469, the CalSTRS member contribution rates effective for fiscal year 2017–18 and beyond are summarized in the table below:
Effective Date Pre AB 1469 Rate Increase Total
July 1, 2017 8.25% 6.18% 14.43%
July 1, 2018 8.25% 8.03% 16.28%
July 1, 2019 8.25% 9.88% 18.13%
July 1, 2020 8.25% 10.85% 19.10%
July 1, 2021–June 30, 2046 8.25% * *
July 1, 2046 8.25% Increase from prior rate ends in 2046–47
Employers—Pursuant to AB 1469, CalSTRS employer contribution rate increases effective for fiscal year 2017–18 through fiscal year 2045–46 are summarized in the table below:
State—Also as a result of AB 1469, the additional state appropriation required to fully fund the benefits in effect as of 1990 by 2046 is specified in subdivision (b) of Education Code section 22955.1. The increased contributions end as of fiscal year 2045–46. The CalSTRS state contribution rates effective for fiscal year 2017–18 and beyond are summarized in the table below.
As shown in the subsequent table, the state rate will increase to 5.311 percent on July 1, 2018, to continue paying down the unfunded liabilities associated with the benefits structure that was in place in 1990 prior to certain enhancements in benefits and reductions in contributions.
NOTES TO THE BASIC FINANCIAL STATEMENTS
Effective Date Base Rate
AB 1469 Increase For 1990
Benefit Structure SBMA Funding1 Total
July 1, 2017 2.017% 4.811% 2.50% 9.328%
July 1, 2018 2.017% 5.311%2 2.50% 9.828%
July 1, 2019–June 30, 2046 2.017% 3 2.50% 3
July 1, 2046 and thereafter 2.017% 4 2.50% 4.517%4
1 This rate does not include the $72 million reduction in accordance with Education Code section 22954. Refer to Note 1, Purchasing Power Protection section, for further discussion.
2 In May 2018, the board exercised its limited authority to increase the state contribution rate by 0.5 percent of the payroll effective July 1, 2018.
3 The board has limited authority to adjust state contribution rates annually through June 2046 in order to eliminate the remaining unfunded actuarial obligation associated with the 1990 benefit structure. The board cannot increase the rate by more than 0.50 percent in a fiscal year, and if there is no unfunded actuarial obligation, the contribution rate imposed to pay for the 1990 benefit structure would be reduced to 0 percent.
4 From July 1, 2046, and thereafter, the rates in effect prior to July 1, 2014, are reinstated, if necessary, to address any remaining 1990 unfunded actuarial obligation.
*According to current law, the contribution rate for CalSTRS 2% at 62 members is adjusted if the normal cost increases or decreases by more than 1 percent since the last time the member contribution rate was set. Based on the June 30, 2017, valuation adopted by the board in May 2018, the increase in normal cost was greater than 1 percent. Therefore, contribution rates for CalSTRS 2% at 62 members will increase by 1 percent effective July 1, 2018.
*The board cannot adjust the employer rate by more than 1 percent in a fiscal year, and the increase to the contribution rate above the 8.25 percent base contribution rate cannot exceed 12 percent for a maximum of 20.25 percent.

62 CALSTRS COMPREHENSIVE ANNUAL FINANCIAL REPORT 2018
NOTES TO THE BASIC FINANCIAL STATEMENTS
Benefit Enhancements
A school employer may provide, at the employer’s cost, an additional two years of service credit to increase the amount of the member’s monthly retirement benefit. This may be paid for by the employer in installments not to exceed eight years. If the employer chooses to pay in installments, the employer is charged interest on the unpaid balance at the actuarially assumed rate of return on investments for the DB Program (currently 7.0 percent). As of June 30, 2018, the outstanding balance of receivables for benefit enhancements was $12.3 million.
STRP Defined Benefit Supplement Program
The DBS Program, established pursuant to Chapter 74, Statutes of 2000 (AB 1509), is a cash balance defined benefit pension program that operates within the STRP. All members of the DB Program who make contributions to CalSTRS on creditable compensation earned on or after January 1, 2001, have an account under the DBS Program and are eligible to receive a DBS benefit based on the amount of funds contributed to the DBS account. Membership in the DBS Program is mandatory.
Interest is credited to the nominal DBS Program accounts at the minimum guaranteed annual rate established by the board prior to each plan year, which was 2.64 percent for the fiscal year ended June 30, 2018. The board may credit additional earnings to members’ nominal accounts if actual investment earnings exceed the minimum guaranteed annual rate and meet criteria set out in the board policy. In May 2018, the board elected to award Additional Earnings Credits (AEC) of 4.12 percent of DBS members’ June 30, 2017, nominal account balances. The total value of the AEC awarded was approximately $356.9 million.
Contributions
Beginning July 1, 2002, for creditable service performed by DB members in excess of one year of service credit within one fiscal year, member contributions of 8 percent and employer contributions of 8 percent are credited to the members’ nominal DBS Program account (up to any applicable compensation cap). Also, member contributions of 8 percent and employer contributions of 8 percent for compensation as a result of retirement incentives or limited-term enhancements are credited to DBS Program accounts for CalSTRS 2% at 60 members.
STRP Cash Balance Benefit Program
The CBB Program, established under Chapter 592, Statutes of 1995 (AB 1298), and subsequently merged into the STRP by Chapter 1048, Statutes of 1998 (SB 2085), is a cash balance defined benefit pension program. The CBB Program is designed for employees of California’s public schools who are hired to perform creditable service for less than 50 percent of the full-time equivalent for a position in a school district or county office of education or on a part-time or temporary basis for not more than 67 percent of a full-time position in a community college district. Participation in the CBB Program is optional; a school district, community college district, county office of education or regional occupational program may elect to offer the CBB Program. Under such election, the program will automatically cover each eligible employee, unless the employee elects to participate in the DB Program or an alternative plan provided by the employer within 60 days of hire or the election period determined by the employer. As of June 30, 2018, there were 29 contributing school districts and 39,894 contributing participants.
Interest is credited to nominal CBB Program accounts at the minimum guaranteed annual rate established by the board prior to each plan year, which was 2.64 percent for the fiscal year ended June 30, 2018. The board may credit additional earnings to members’ nominal accounts if actual investment earnings exceed the minimum guaranteed annual rate and meet criteria set out in the board policy. In May 2018, the board elected to award an AEC of 3.62 percent of CBB members’ June 30, 2017, nominal account balances. The total value of the AEC awarded was approximately $8.9 million.
Contributions
A summary of statutory contribution rates for the CBB Program is as follows:
Participants — 4.0 percent of applicable participant earnings
Employers — 4.0 percent of applicable participant earnings
Employers may enter into a collective bargaining agreement to pay different rates if certain minimum conditions are met.

63FINANCIAL
NOTES TO THE BASIC FINANCIAL STATEMENTS
STRP Replacement Benefits Program
The STRP RB Program is an excess benefits arrangement for DB Program members that is administered as a qualified excess benefit arrangement through a separate pension program apart from the other three STRP programs. It is established in accordance with IRC section 415(m). IRC section 415(b) imposes a dollar limit on the annual retirement benefits an individual may receive from a qualified defined benefit pension plan. The limit for individual CalSTRS 2% at 60 members varies based on the age at which they retire. For calendar year 2018, the federal dollar limit applicable to a 65-year-old CalSTRS member is $186,907. CalSTRS 2% at 62 members will not receive any benefits in excess of the IRC section 415(b) limit.
The program is funded as needed. Contributions that would otherwise be credited to the DB Program each month are instead credited to the RB Program to fund monthly program costs. Monthly employer contributions are received and paid to members in amounts equivalent to the benefits not paid as a result of IRC section 415(b), subject to withholding for any applicable income or employment taxes. As of June 30, 2018, there were 353 retirees, beneficiaries and non-member spouses receiving benefits from the RB Program.
CalSTRS Pension2 Program
Pursuant to Chapter 291, Statutes of 1994 (AB 3064), Pension2 was established to include two tax-deferred defined contribution plans under the IRC sections 403(b) and 457(b). Voya Institutional Plan Services (Voya) and the Teachers Insurance and Annuity Association (TIAA) are responsible for administrative services, including custody and record-keeping, while CalSTRS performs the investment management functions of determining, monitoring and maintaining the plans’ investments.
The 403(b) plan and the 457(b) plan had 14,452 and 854 plan participants and 927 and 67 participating employers, respectively, with account balances as of June 30, 2018. Pension2 is available to all full-time California pre-kindergarten through community college district and county office of education employees. Part-time employees’ eligibility is determined by their employers. Enrollment in the 457(b) plan is by employer adoption only. Employee contributions to the plans are voluntary and require no minimum limitations; however, the IRC imposes an annual
maximum amount that can be contributed to the plans. Pension2 is not directly affected by the California Public Employees’ Pension Reform Act of 2013 (PEPRA). However, according to PEPRA, employers may provide a contribution to a defined contribution plan, such as Pension2, for 2% at 62 member compensation in excess of the compensation cap.
The Pension2 investments are composed of a selection of mutual funds with underlying investments that include stocks, bonds, real estate investments and guaranteed annuity contracts, which are participant-directed. The Pension2 benefits are the accumulation of contributions and investment earnings credited to the members’ accounts.
Medicare Premium Payment Program
The MPP Program is a cost-sharing multiple-employer other postemployment benefit (OPEB) plan established pursuant to Chapter 1032, Statutes of 2000 (SB 1435). CalSTRS administers the MPP Program through the Teachers’ Health Benefit Fund (THBF). The MPP Program pays Medicare Part A premiums and Medicare Parts A and B late enrollment surcharges for eligible members of the DB Program who were retired or began receiving a disability allowance prior to July 1, 2012, and were not eligible for premium-free Medicare Part A. The MPP Program is closed to new entrants as members who retire on or after July 1, 2012, are not eligible for coverage under the MPP Program.
As of June 30, 2018, 5,984 retirees participated in the MPP Program. The number of retired members who will participate in the program in the future is unknown because eligibility cannot be predetermined.
The MPP Program is funded on a pay-as-you-go basis from a portion of monthly employer contributions. In accordance with California Education Code section 25930, contributions that would otherwise be credited to the DB Program each month are instead credited to the MPP Program to fund monthly program and administrative costs. Total redirections to the MPP Program are monitored to ensure that total incurred costs do not exceed the amount initially identified as the cost of the program.

64 CALSTRS COMPREHENSIVE ANNUAL FINANCIAL REPORT 2018
NOTES TO THE BASIC FINANCIAL STATEMENTS
Investments
Under the California Constitution, article 16, section 17, the board has the sole and exclusive fiduciary responsibility
over the assets of the retirement system and to administer the system in a manner that will assure prompt delivery of benefits and related services to the members and their beneficiaries. As a public pension fund, CalSTRS is not subject to the Employee Retirement Income Security Act (ERISA), which governs corporate pension plans. However, the CalSTRS investment decision-making criteria are based on the “prudent investor” standard, for which the ERISA standards serve as a basis.
Additionally, the California Constitution, article 16, section 17, and the California Education Code, part 13, chapter 4, section 22250 require the diversification of investments so as to minimize the risk of loss and maximize the rate of return, unless, under the circumstances, it is clearly not prudent to do so. The CalSTRS Investment Policy and Management Plan is established, and may be amended, by a majority vote of the board. It allows for investments consisting of debt and equity securities, alternative investments and derivative instruments. See Note 5 regarding the Schedule of Investments.
In the Statement of Changes in Fiduciary Net Position, CalSTRS presents the net appreciation (depreciation) in the fair value of its investments, which consists of the realized gains and losses on securities sold and the unrealized appreciation (depreciation) on those investments still held in the portfolio.
The value and performance of CalSTRS investments are subject to various risks, including credit risk, interest rate risk, concentration of credit risk, custodial credit risk and foreign currency risk, which are in turn affected by economic and market factors impacting certain industries, sectors or geographies. See Note 5 for disclosures related to these risks.
Most investments are reported at fair value. The diversity of the investment types held by CalSTRS requires a wide range of valuation techniques to determine fair value. See Note 6 for disclosures related to fair value.
Teachers’ Deferred Compensation Fund
The TDCF was established pursuant to Chapter 655, Statutes of 2006 (SB 1466), and is used to account for ancillary activities associated with various deferred compensation plans and programs offered by CalSTRS to enhance the tax-deferred financial options for the members and their beneficiaries.
The TDCF is funded by the fee revenues received by CalSTRS from deferred compensation plans, a vendor registration program and an employer compliance assistance program.
2. SUMMARY OF SIGNIFICANT ACCOUNTING POLICIES
Basis of Accounting
CalSTRS maintains our accounting records using the accrual basis of accounting. We recognize member contributions in the period in which the contributions are required by statute. Furthermore, CalSTRS recognizes employer and state contributions when required by statute and the employer or the state has made a formal commitment to provide the contributions. Also, CalSTRS recognizes benefits when due and payable in accordance with our retirement and benefits programs. Purchases and sales of investments are recorded on the trade date. Interest income is recorded on an accrual basis. Dividends are recorded on the ex-dividend date.
Use of Estimates in the Preparation of Financial Statements
The preparation of CalSTRS’ financial statements in conformity with accounting principles generally accepted in the U.S. requires management to make estimates and assumptions that affect certain amounts and disclosures. The most significant estimates made by management in the accompanying financial statements include the estimates related to contribution revenues, the total pension liability and the fair value of certain alternative investments. Refer to Notes 3 and 6, respectively, for further discussion of these estimates. Actual results could differ from those estimates.
Cash
Cash held by CalSTRS includes foreign currency, deposits with the State Treasury and master custodian and cash held at commercial banks for operational purposes.

65FINANCIAL
NOTES TO THE BASIC FINANCIAL STATEMENTS
Investment Risk Management
CalSTRS enters into currency forwards and option contracts to protect the value of non-U.S. investments against foreign currency fluctuation. CalSTRS could be exposed to risk if the counterparties to the forward and option contracts are unable to meet the terms of their contracts. CalSTRS also enters into futures contracts, swaps and options to hedge risks in the equity and fixed income markets. CalSTRS seeks to minimize risk from counterparties by establishing minimum credit quality standards and the use of master trading agreements, which require a daily exchange of collateral that is marked to market as required to help offset counterparty risk. See Note 5 for disclosures related to these risks.
Capital Assets
Capital assets held by CalSTRS, which consist of land, building, equipment and intangible assets, are recorded at cost and reflected on the Statement of Fiduciary Net Position, net of accumulated depreciation/amortization. The capitalization threshold is $1 million. Depreciation/amortization is charged to operations using the straight-line method on the estimated useful life of the related asset and is included in administrative expenses on the Statement of Changes in Fiduciary Net Position. Estimated useful lives range from a minimum of five years for equipment and amortizable intangible assets, and 40 years for buildings. As of June 30, 2018, accumulated depreciation/amortization was $84.6 million, and depreciation/amortization expense was $8.7 million. CalSTRS reviews our capital assets for impairment whenever events or changes in circumstances indicate that the carrying value of an asset may not be recoverable. As of June 30, 2018, there has been no impairment of capital assets.
Administrative Expenses
The cost of administering the CalSTRS system is financed through contributions and investment earnings. The Schedule of Administrative Expenses provides a listing of administrative expenses by type.
Income Taxes
The STRP and MPP Program are organized as tax-exempt retirement plans under the IRC. Pension2, which includes IRC 403(b) and 457(b) plans, is organized as a tax-deferred supplemental program under the IRC. The TDCF is also
organized as a tax-deferred supplemental program under the IRC. CalSTRS management believes that it has operated these funds and programs within the constraints imposed by federal tax law.
Investment Expenses
Expenses directly associated with investment management, operations and servicing, as well as foreign taxes, have been included as Other Investment Expenses in the Statement of Changes in Fiduciary Net Position. The Schedule of Investment Expenses provides a listing of investment expenses by type. Broker commissions for securities trades and private asset fees are capitalized, with the exception of certain equity and derivative securities for which they are expensed.
Securities Lending Transactions
CalSTRS reports securities lent, reinvested cash collateral and the related liabilities resulting from securities lending transactions on the Statement of Fiduciary Net Position. CalSTRS also reports the income earned and costs of lending securities as investment income and expenses on the Statement of Changes in Fiduciary Net Position.
Reserves
CalSTRS maintains accounts within the net position restricted for pensions and OPEB as reserve accounts for various operating purposes. These include four reserve accounts for the DBS Program, four reserve accounts for the CBB Program, one reserve account for the SBMA and other reserves not legally required for disclosure.
Defined Benefit Supplement Contribution, Accumulated
Interest and Annuitant Reserve
Section 25002 of the Education Code formed the DBS Annuitant Reserve to establish and maintain a segregated account for expenditures on annuities payable under the DBS Program. The DBS Program is a cash balance defined benefit pension program that provides a supplemental benefit in addition to the regular DB Program benefit. During a member’s career, credits and interest accumulate in the DBS Program’s Contribution and Accumulated Interest reserves, respectively. When a member retires, the reserve funds are either paid out as a lump sum or transferred to the DBS Annuitant Reserve if the participant elects to receive their benefit as an annuity.

66 CALSTRS COMPREHENSIVE ANNUAL FINANCIAL REPORT 2018
NOTES TO THE BASIC FINANCIAL STATEMENTS
Defined Benefit Supplement Gain and Loss Reserve
Section 25001 of the Education Code establishes the DBS Gain and (Loss) Reserve, which represents a segregated account that may be used to: 1) credit interest to member DBS accounts at the minimum interest rate for plan years in which the obligation cannot be met from the plan’s investment earnings, 2) make additional earnings credits to DBS accounts upon a decision by the board to allocate excess investment earnings, or 3) provide additions to the DBS Annuitant Reserve for annuities payable under the DBS Program.
Cash Balance Benefit Active Contribution, Accumulated
Interest and Annuitant Reserve
Section 26204 of the Education Code establishes the CBB Annuitant Reserve for the payment of monthly annuities with respect to the CBB Program. The CBB Program is an optional cash balance pension plan for part-time certified educators available to CalSTRS employers as an alternative to the DB Program, Social Security and other retirement plans. During a participant’s career, credits and interest accumulate in the Cash Balance Benefit Active Contribution and Accumulated Interest reserves, respectively, as described in the table below. When a participant retires, the reserve funds are either paid out as a lump sum or transferred to the Cash Balance Benefit Annuitant Reserve if the participant elects to receive their benefit as an annuity.
Cash Balance Benefit Gain and Loss Reserve
Section 26202 of the Education Code establishes the CBB Gain and (Loss) Reserve, which may be used to: 1) credit interest to participants’ accounts at the minimum interest rate during years in which CalSTRS investment earnings with respect to the CBB Program are not sufficient for that purpose, 2) make additional earnings credits to participants’ accounts upon a decision by the board to allocate excess investment earnings, or 3) where necessary, to provide additions to the CBB Annuitant Reserve for monthly annuity payments.
Supplemental Benefit Maintenance Account
Section 22400 of the Education Code establishes the SBMA to separately maintain and manage the annual supplemental payments disbursed in quarterly installments to all benefit recipients whose purchasing power has fallen below 85 percent of the purchasing power of the initial benefit, as long as funds are available. The SBMA is primarily funded by contributions from the state, School Lands monies and the interest earned on the SBMA reserve balance credited at the actuarially assumed interest rate.
Other Reserves Not Legally Required For Disclosure
These reserves represent accumulated changes in operations reflecting contributions earned, benefit payments made, investment returns and the costs of plan administration for the STRP, Pension2, MPP Program and TDCF.
Reserve TypeReserve Balance
(Dollars in Thousands)
Defined Benefit Supplement Contribution Reserve $6,692,579
Defined Benefit Supplement Accumulated Interest Reserve 2,471,994
Defined Benefit Supplement Annuitant Reserve 649,281
Defined Benefit Supplement Gain and (Loss) Reserve 3,359,667
Cash Balance Benefit Active Contribution Reserve 202,325
Cash Balance Benefit Accumulated Interest Reserve 61,894
Cash Balance Benefit Annuitant Reserve 6,923
Cash Balance Benefit Gain and (Loss) Reserve 56,878
Supplemental Benefit Maintenance Account Reserve 15,756,201
Other Reserves Not Legally Required for Disclosure 196,583,789
Total $225,841,531
The reserve balances as of June 30, 2018, are summarized in the table below:

67FINANCIAL
NOTES TO THE BASIC FINANCIAL STATEMENTS
Beginning Net Position Adjustment
The implementation of GASB Statement No. 75, Accounting
and Financial Reporting for Postemployment Benefits Other
Than Pensions, resulted in an adjustment to the beginning net position in fiscal year 2017--18 for the STRP, MPP Program and TDCF of $510.8 million, $1.2 million and $4.0 million, respectively.
CalSTRS determined it is not practical to restate periods prior to fiscal year 2017--18. As such, the adjustments represent the cumulative effect of implementing the requirements of GASB Statement No. 75. The adjustments do not include deferred outflows of resources or deferred inflows of resources. Additionally, these adjustments resulted in a net deficit position for the MPP Program as of June 30, 2018, and increased the net deficit in the TDCF.
3. NET PENSION LIABILITY OF EMPLOYERS AND NONEMPLOYER CONTRIBUTING ENTITY
The components of the net pension liability (NPL) of the STRP for participating employers and the state (nonemployer contributing entity) as of June 30, 2018, are as follows (dollars in millions):
June 30, 2018
Total Pension Liability $316,776
Less: STRP Fiduciary Net Position 224,869
NPL of Employers and the State of California $91,907
STRP Fiduciary Net Position as a Percentage of
the Total Pension Liability 71.0%
Actuarial Methods and Assumptions
The total pension liability for the STRP was determined by applying update procedures to the financial reporting actuarial valuation as of June 30, 2017, and rolling forward the total pension liability to the June 30, 2018. In determining the total pension liability, the financial reporting actuarial valuation used the following actuarial methods and assumptions:
June 30, 2018
Valuation Date June 30, 2017
Experience StudyJuly 1, 2010, through June 30, 2015
Actuarial Cost Method Entry age normal
Investment Rate of Return1 7.1%
Consumer Price Inflation 2.75%
Wage Growth 3.5%
Postretirement Benefit Increases
2% simple for DB (annually) Maintain 85% purchasing power level for DB Not applicable for DBS/CBB
1Net of investment expenses but gross of administrative expenses.
CalSTRS uses a generational mortality assumption, which involves the use of a base mortality table and projection scales to reflect expected annual reductions in mortality rates at each age, resulting in increases in life expectancies each year into the future. The base mortality tables are CalSTRS custom tables derived to best fit the patterns of mortality among our members. The projection scale was set equal to 110 percent of the ultimate improvement factor from the Mortality Improvement Scale (MP-2016) table issued by the Society of Actuaries.
The long-term expected rate of return on pension plan investments was determined using a building-block method in which best-estimate ranges of expected future real rates of return (expected returns, net of pension plan investment expense and inflation) are developed for each major asset class. The best-estimate ranges were developed using capital market assumptions from CalSTRS’ general investment consultant (Pension Consulting Alliance–PCA) as inputs to the process. The actuarial investment rate of return assumption was adopted by the board in February 2017 in conjunction with the most recent experience study. For each future valuation, CalSTRS consulting actuary (Milliman) reviews the return assumption for reasonableness based on the most current capital market assumptions. Best estimates of expected 20-year geometrically linked real rates of return and the assumed asset allocation for each major asset class as of June 30, 2018, are summarized in the following table:

68 CALSTRS COMPREHENSIVE ANNUAL FINANCIAL REPORT 2018
Discount Rate
The discount rate used to measure the total pension liability was 7.1 percent. The projection of cash flows used to determine the discount rate assumed that contributions from plan members and employers are made at statutory contribution rates in accordance with the rate increases as disclosed in Note 1. Projected inflows from investment earnings were calculated using the long-term assumed investment rate of return (7.1 percent) and assuming that contributions, benefit payments and administrative expenses occur midyear. Based on those assumptions, the STRP’s fiduciary net position was projected to be available to make all projected future benefit payments to current plan members. Therefore, the long-term assumed investment rate of return was applied to all periods of projected benefit payments to determine the total pension liability.
120-year average.
Asset Class
Assumed Asset
Allocation
Long-Term
Expected Real
Rate of Return1
Global Equity 47.0% 6.30%
Fixed Income 12.0 0.30
Real Estate 13.0 5.20
Private Equity 13.0 9.30
Risk Mitigating Strategies
9.0 2.90
Inflation Sensitive 4.0 3.80
Cash/Liquidity 2.0 (1.00)
NOTES TO THE BASIC FINANCIAL STATEMENTS
Sensitivity of the NPL to Changes in the Discount Rate
Presented below is the NPL of employers and the state using the current discount rate of 7.1 percent, as well as what the NPL would be if it were calculated using a discount rate that is 1 to 3 percent lower or 1 to 3 percent higher than the current rate:
Discount Rate
NPL of Employers and
Nonemployer Contributing
Entity (Dollars in Millions)
3% Decrease (4.1%) $250,291
2% Decrease (5.1%) 186,631
1% Decrease (6.1%) 134,633
Current Discount Rate (7.1%) 91,907
1% Increase (8.1%) 56,483
2% Increase (9.1%) 26,865
3% Increase (10.1%) 1,983

69FINANCIAL
NOTES TO THE BASIC FINANCIAL STATEMENTS
4. NET OTHER POSTEMPLOYMENT BENEFIT (OPEB) LIABILITY OF EMPLOYERS
The components of the net OPEB liability of the MPP Program for participating employers as of June 30, 2018, are as follows (dollars in thousands):
June 30, 2018
Total OPEB Liability $381,228
Less: MPP Program Fiduciary Net Position (1,542)
Net OPEB Liability of Employers $382,770
MPP Program Fiduciary Net Position as a Percentage of the Total OPEB Liability
(0.40%)
June 30, 2018
Valuation Date June 30, 2017
Experience StudyJuly 1, 2010, through June 30, 2015
Actuarial Cost Method Entry age normal
Investment Rate of Return 3.87%
Medicare Part A Premium Costs Trend Rate1 3.70%
Medicare Part B Premium Costs Trend Rate1 4.10%
1 The assumed increases in the Medicare Part A and Part B Cost Trend Rates vary by year; however, the increases are approximately equivalent to a 3.70 percent and 4.10 percent increase each year for Medicare Part A and Part B, respectively.
Actuarial Methods and Assumptions
The total OPEB liability for the MPP Program as of June 30, 2018, was determined by applying update procedures to the financial reporting actuarial valuation as of June 30, 2017, and rolling forward the total OPEB liability to June 30, 2018, using the assumptions listed below.
In addition, assumptions were made about future participation (enrollment) into the MPP Program because CalSTRS is unable to determine which members not currently participating meet all eligibility criteria for enrollment in the future. Assumed enrollment rates were derived based on past experience and are stratified by age with the probability of enrollment diminishing as the members’ age increases. This estimated enrollment rate was then applied to the population of members who may meet criteria necessary for eligibility and are not currently enrolled in the MPP Program. Based on this, the estimated number of future enrollments used in the financial reporting valuation was 459 or an average of 0.27 percent of the potentially eligible population (171,593).
CalSTRS uses a generational mortality assumption, which involves the use of a base mortality table and projection scales to reflect expected annual reductions in mortality rates at each age, resulting in increases in life expectancies each year into the future. The base mortality tables are CalSTRS custom tables derived to best fit the patterns of mortality among our members. The projection scale was set equal to 110 percent of the ultimate improvement factor from the Mortality Improvement Scale (MP-2016) table issued by the Society of Actuaries.
The MPP Program is funded on a pay-as-you-go basis with contributions generally being made at the same time and in the same amount as benefit payments and expenses coming due. Any funds within the MPP Program as of June 30, 2018, were to manage differences between estimated and actual amounts to be paid and were invested in the Surplus Money Investment Fund, which is a pooled investment program administered by the State Treasurer.
Discount Rate
The discount rate used to measure the total OPEB liability was 3.87 percent. The MPP Program is funded on a pay-as-you-go basis as described in Note 1, and under the pay-as-you-go method, the OPEB plan’s fiduciary net position was not projected to be sufficient to make projected future benefit payments. Therefore, a discount rate of 3.87 percent, which is The Bond Buyer’s 20-Bond GO Index from Bondbuyer.com as of June 30, 2018, was applied to all periods of projected benefit payments to measure the total OPEB liability. The discount rate increased 0.29 percent from 3.58 percent as of June 30, 2017.
Presented below is the net OPEB liability of employers using the current discount rate as well as what the net OPEB liability would be if it were calculated using a discount rate that is 1 percent lower or 1 percent higher than the current rate:
Discount Rate
Net OPEB Liability of Employers (Dollars in Thousands)
1% Decrease (2.87%) $423,362
Current Discount Rate (3.87%) 382,770
1% Increase (4.87%) 346,117

70 CALSTRS COMPREHENSIVE ANNUAL FINANCIAL REPORT 2018
NOTES TO THE BASIC FINANCIAL STATEMENTS
Medicare Costs Trend Rate
The June 30, 2017, valuation uses the 2018 Medicare Part A and Part B premiums as the basis for future premium calculations. Future premiums are assumed to increase with a medical trend rate that varies by year, as shown in the following table:
Trend Assumption
Assumed Annual Increase
Years1 Part A Part B
2018–2026 3.4% 4.0%
2027–2036 4.6% 5.2%
2037–2046 4.1% 4.7%
2047 & Later 3.9% 4.5%
1 Trend rates indicate medical inflation in the specific year and, therefore, affect the premiums for the following years. For example, the projected 2019 premium is the 2018 premium increased by the assumed 2018 trend rate.
The Part A trend is approximately equivalent to assuming a fixed 3.7 percent increase each year. The Part B trend is approximately equivalent to assuming a fixed 4.1 percent increase each year.
Presented below is the net OPEB liability of employers using the current Medicare costs trend rates, as well as what the net OPEB liability would be if it were calculated using Medicare costs trend rates that are 1 percent lower and 1 percent higher than the current rate:
Medicare Costs Trend
Rate
Net OPEB Liability of Employers (Dollars in Thousands)
1% Decrease (2.7% Part A and 3.1% Part B)
$349,047
Current Rates (3.7% Part A and 4.1% Part B)
382,770
1% Increase (4.7% Part A and 5.1% Part B)
419,037
Actuarial valuations of an ongoing plan involve estimates of the value of reported amounts (for example, Medicare premiums) and assumptions about the probability of occurrence of events far into the future (for example, mortality, disabilities and retirees eligible for the program). Actuarially determined amounts are subject to continual review and potential modifications, as actual results are compared with past expectations and new estimates are made about the future.
Projections of benefits for financial reporting purposes are based on the substantive plan and include the types of benefits provided at the time of each valuation and the historical pattern of benefit costs. The projection of benefits for financial reporting purposes does not explicitly incorporate the potential effects of legal or contractual funding limitations.
Actuarial calculations reflect a long-term perspective and take into account the premiums and surcharges paid after termination of employment until the death of the employee. In many cases, actuarial calculations reflect several decades of payments after termination of employment.
5. DEPOSITS AND INVESTMENTS
Money-Weighted Rate of Return
For the period ended June 30, 2018, the money-weighted rate of return on STRP investments, net of pension plan investment expenses, was 8.9 percent. While the MPP Program is funded on a pay-as-you-go basis, any excess funds are held in the Surplus Money Investment Fund. The money-weighted rate of return on MPP Program investments, net of OPEB plan investment expenses, was 1.3 percent. The money-weighted rate of return expresses investment performance, taking into account the impact of cash infusion into and disbursements from the pension plan or OPEB plan.

71FINANCIAL
NOTES TO THE BASIC FINANCIAL STATEMENTS
Schedule of Investments
CalSTRS is authorized to invest and reinvest the monies to meet the objectives of the Investment Policy and Management Plan as established by the board.
The following table represents the detailed investments by type within debt securities, equity securities, alternative investments and derivative instruments presented in the Statement of Fiduciary Net Position.
Schedule of Investments
As of June 30, 2018
(Dollars in Thousands)
Investments
State Teachers’
Retirement Plan
Pension2
403(b) Plan
Pension2
457(b) Plan
Medicare Premium
Payment Program
Teachers’
Deferred
Compensation
Fund Total
Assets:
Debt Securities
Asset-Backed Securities $288,492 $- $- $- $- $288,492 Corporate Bonds 10,031,922 - - - - 10,031,922 Foreign Government Issues 487,812 - - - - 487,812 Mortgage-Backed Securities 7,884,654 - - - - 7,884,654 Municipal Securities 178,463 - - - - 178,463 U.S. Government and Agency Obligations 19,935,049 - - - - 19,935,049 Short-Term Securities 5,167,119 7,014 334 605 1,389 5,176,461 Mutual Funds-Bond Funds - 65,633 2,921 - - 68,554 Guaranteed Annuity Contracts - 315,461 12,068 - - 327,529
Total Debt Securities 43,973,511 388,108 15,323 605 1,389 44,378,936
Equity Securities
Common Stocks 107,892,853 - - - - 107,892,853 Depository Receipts 3,351,794 - - - - 3,351,794 Mutual Funds-Stock Funds 684,730 534,331 26,402 - - 1,245,463 Preferred Stocks 455,262 - - - - 455,262 Real Estate Investment Trusts 2,953,326 - - - - 2,953,326
Total Equity Securities 115,337,965 534,331 26,402 - - 115,898,698
Alternative Investments
Debt-Privately Held 2,087,701 - - - - 2,087,701
Equity-Privately Held 34,287,135 - - - - 34,287,135 Real Estate-Directly Held 19,226,692 - - - - 19,226,692 Real Estate-Non-Directly Held 10,292,597 - - - - 10,292,597
Total Alternative Investments 65,894,125 - - - - 65,894,125
Derivative Instruments
Forwards 101,540 - - - - 101,540 Futures 118,415 - - - - 118,415 Options 7,552 - - - - 7,552 Rights and Warrants 2,258 - - - - 2,258 Swaps 3,275 - - - - 3,275
Total Derivative Instruments 233,040 - - - - 233,040
Securities Lending Collateral 21,931,891 - - - - 21,931,891
Total Investment Assets 247,370,532 922,439 41,725 605 1,389 248,336,690
Liabilities:
Derivative Instruments
Forwards 81,223 - - - - 81,223 Futures 39,000 - - - - 39,000 Options 1,134 - - - - 1,134 Swaps 18,713 - - - - 18,713
Total Derivative Instruments 140,070 - - - - 140,070
Total Investment Liabilities 140,070 - - - - 140,070
Total Net Investments $247,230,462 $922,439 $41,725 $605 $1,389 $248,196,620

72 CALSTRS COMPREHENSIVE ANNUAL FINANCIAL REPORT 2018
NOTES TO THE BASIC FINANCIAL STATEMENTS
Debt Securities
Debt securities consist primarily of long-term investments issued by the U.S. government and U.S. government-sponsored agencies, municipal securities, foreign governments, corporations, securitized offerings backed by residential and commercial mortgages, and inflation-indexed bonds (also known as inflation-linked bonds). Debt securities also consist of short-term securities that by definition typically have maturities of less than one year. Debt securities in Pension2 include securities such as bond mutual funds and guaranteed annuity contracts.
Short-term investments consist of money market funds, certificates of deposits and similar instruments with maturities and/or holding periods generally of less than one year. Deposits in the Pooled Money Investment Account (classified under short-term securities), administered by the State Treasurer, represent various investments with approximately 193 average days to maturity. The State Treasury pools these monies with those of other state agencies for investing in short-term securities. The monies are available for withdrawal at any time. Deposits in Short-Term Investment Fund, administered by State Street Bank & Trust Co (State Street Bank), represent various investments with approximately 30 average days to maturity.
Pension2 offers bond mutual funds and annuity contracts to individual participants. The annuity contracts offered guarantee a specified minimum interest rate, which is subject to change at any time.
Equity Securities
Equity securities consist primarily of domestic and international common stocks, preferred stocks, depository receipts, real estate investment trusts (REITs), exchange-traded funds (ETFs) and stock mutual funds.
Alternative Investments
Alternative investments consist primarily of limited partnership structures invested in privately held debt, including distressed mezzanine debt, or privately held equity, including venture capital, buyouts, co-investments and equity expansion, as well as investments in real estate, infrastructure, agriculture and timberland. They include investments held within the private equity, real estate, global equity, inflation sensitive, risk mitigating and innovative asset classes or investment strategies.
Alternative investments are generally long-term and illiquid in nature. As a result, investors are subject to redemption restrictions, which generally limit distributions and restrict the ability of limited partners to exit a partnership investment prior to its dissolution.
Investments in real estate directly held assets are in separate accounts and joint ventures, which are primarily composed of retail, office, industrial and multi-family properties. Real estate non-directly held investments primarily include commingled limited partnership investments in which CalSTRS does not have a controlling interest.
While corporate governance funds are included in the global equity asset class, they are classified as alternative investments on the financial statements due to their structure. These funds employ specific investment strategies and co-investments, including, but not limited to, publicly traded equity securities of companies on U.S., Asian, Canadian and European exchanges.
Derivative Instruments
CalSTRS holds investments in futures, foreign currency forward contracts, options, swaps, rights and warrants.
CalSTRS invests in futures and foreign currency forward contracts. A futures contract is an exchange-traded contract whereby the purchaser agrees to buy an asset at a stated price on a specific future date. A foreign currency forward contract is a customized, bilateral agreement to exchange a specified currency at a specified future settlement date at a forward price agreed to on the trade date.
CalSTRS invests in exchange-traded options and over-the-counter options. An option is a contract that entitles the holder to purchase or sell a specific amount of contracts or notional amount at a specified price (strike price). The underlying asset, quantity of the underlying or notional amount, expiration date and strike price are standardized for exchange-traded options and are customized for over-the-counter options.
Swaps are derivative instruments in which two parties agree to exchange one stream of cash flows against another stream or a guarantee. These streams are called the legs of the swap, and usually at least one leg has a rate that is variable. The variable leg can depend on a reference rate,

73FINANCIAL
NOTES TO THE BASIC FINANCIAL STATEMENTS
the total return of an asset or an economic statistic. Cash flows are calculated based on a notional amount, which are usually not exchanged between counterparties.
Rights and warrants held by CalSTRS are typically acquired through corporate actions. A right is a privilege granted to shareholders of a corporation to subscribe to shares of a new issue of common stock before it is offered to the public. A warrant gives the holder the right to buy, but not the obligation to buy an underlying security at a given price and quantity during a specified period.
Securities Lending
California statutes and board policies permit CalSTRS to make short-term, collateralized loans of its securities to broker-dealers and other entities in order to earn incremental income. CalSTRS has contracted with our custodian (State Street Bank), third-party securities lending agents and their respective custodians to lend global equity and debt securities. The majority of the security loans can be terminated on demand by either CalSTRS or the borrower. The underlying securities on loan are reported as assets on the Statement of Fiduciary Net Position. Collateral in the form of cash or other securities is required for 102 percent and 105 percent of the fair value of domestic and international securities loaned, respectively. For non-U.S. debt securities loaned, CalSTRS follows market practice, which requires collateral of 102 percent of the fair value of the loaned securities. Since the majority of loans are terminable at will, their duration does not generally match the duration of the investments made with the cash collateral. As of June 30, 2018, the weighted duration difference between the investments and these loans was 16 days.
As of June 30, 2018, the fair value of the securities on loan was $24.8 billion. The securities lending cash collateral obligations were $21.9 billion. The fair value of the re-invested cash collateral was $21.9 billion, the non-cash collateral was $3.5 billion, and the calculated mark (collateral adjustment requested for the next business day) was $8.7 million. The invested collateral and corresponding obligation are reflected in the Statement of Fiduciary Net Position as assets and liabilities, respectively. The re-invested cash collateral securities in this program are typically held to maturity and are expected to mature at par.
In accordance with GASB Statement No. 28, Accounting
and Financial Reporting on Securities Lending Transactions, the non-cash collateral of $3.5 billion is not reported in the Statement of Fiduciary Net Position because CalSTRS is not permitted to pledge or sell these collateral securities received unless the borrower defaults. The contracts with the securities lending agents require them to indemnify CalSTRS if the borrowers fail to return the securities (or if the collateral is not sufficient to replace the securities lent) or if the borrowers fail to pay CalSTRS for income distributions by the securities’ issuers while the securities are on loan.
Real Estate Debt Service
Real estate investments are classified as investments in accordance with GASB Statement No. 72, Fair Value
Measurement and Application. Certain real estate investments are leveraged through partnerships using a combination of equity contributions from CalSTRS and other investors and through the utilization of debt. CalSTRS engages real estate advisors and operating partners who are responsible for managing a portfolio’s day-to-day activities, performance and reporting. As of June 30, 2018, the estimated fair value of real estate investments (net of all outstanding debt) totaled approximately $29.5 billion. The CalSTRS share of outstanding debt is $9.1 billion, excluding obligations of limited partnership interests in commingled funds. The CalSTRS portion of real estate debt service requirements includes both recourse and nonrecourse loans.

74 CALSTRS COMPREHENSIVE ANNUAL FINANCIAL REPORT 2018
NOTES TO THE BASIC FINANCIAL STATEMENTS
Real estate debt currently bears interest at fixed and variable rates ranging from 1.88 to 18.0 percent and 1.10 to 7.75 percent, respectively.
CalSTRS Master Credit Facility Portfolio consists of three separate unsecured credit facilities and one secured loan. The proceeds from the Master Credit Facility Portfolio provide the source of funds for managing capital flows of investment strategies. As of June 30, 2018, the total available lines of credit in the Master Credit Facility Portfolio were $3.9 billion. The total principal amount borrowed was $2.7 billion, and the remaining amount available was approximately $1.2 billion. These credit facilities will mature between December 2018 and April 2021.
The CalSTRS Real Estate Investment Policy states that leverage shall be used to enhance investment returns. Careful consideration is given to the impact of leverage on investment and portfolio risks. Leverage within each segment of the asset class is regularly monitored and reported to the board for compliance. As of June 30, 2018, the loan to value on the Real Estate asset class, excluding obligations of limited partnership interests in commingled funds, was 32.6 percent. CalSTRS does not have any debt obligations under the real estate limited partnership interests held in commingled funds.
Investment Risk Schedules
In accordance with GASB Statement No. 40, Deposit
and Investment Risk Disclosures–an amendment of GASB
Statement No. 3, the following investment risk schedules disclose CalSTRS investments that are subject to certain types of risks, including credit risk, interest rate risk, concentration of credit risk, custodial credit risk and foreign currency risk. The policies addressing each risk, discussed in more detail below, are contained within the Investment Policy and Management Plan reviewed and approved annually by the board.
CalSTRS has no investment (other than those issued or explicitly guaranteed by the U.S. government) in any one organization that represents 5 percent or more of the STRP’s fiduciary net position as of June 30, 2018.
Credit Risk
Credit risk is the risk that an issuer or other counterparty to a debt instrument will not fulfill its obligations. This is measured by the assignment of ratings by nationally recognized statistical rating organizations.
CalSTRS Investment Guidelines require that, at the time of purchase, at least 95 percent of the market value of the corporate securities comprising the credit portion of the core fixed income portfolio be rated investment grade as defined
The chart below details the repayment of real estate debt, excluding obligations of limited partnership interests in commingled funds, as of June 30, 2018:
Real Estate Debt Service Requirements (Dollars in Thousands)
Principal Interest Total
Period Ended June 30, 2019 $2,011,753 $322,072 $2,333,825
2020 2,019,586 239,691 2,259,277
2021 1,990,571 169,090 2,159,661
2022 872,209 102,162 974,371
2023 569,412 69,919 639,331
2024 - 2028 1,458,272 130,172 1,588,444
2029 - 2033 101,671 16,490 118,161
2034 - 2038 62,831 7,925 70,756
2039 - 2043 11,246 2,892 14,138
2044 - Thereafter 7,892 626 8,518
Total $9,105,443 $1,061,039 $10,166,482
This table includes $1.8 billion of loans for CalSTRS interest in real estate investments from the Master Credit Facility Portfolio discussed further below.

75FINANCIAL
Debt Securities
(Dollars in Thousands)
Ratings
Asset-Backed
Securities
Corporate
Bonds
Foreign
Government
Issues
Mortgage-
Backed
Securities
Municipal
Securities
U.S. Government
and Agency
Obligations
Short-Term
Securities
Mutual Funds -
Bond Funds
Guaranteed
Annuity
Contracts Total
Long-term Ratings
AAA $136,819 $280,306 $69,160 $83,146 $25,730 $- $- $15,947 $- $611,108 AA 9,316 809,818 57,688 42,574 95,546 1,287,493 - 18,070 - 2,320,505 A 1,562 2,684,621 83,046 30,746 46,919 - - - - 2,846,894 BBB 5,017 3,868,184 173,957 2,888 10,268 - - - - 4,060,314 BB 1,086 919,403 35,984 4,634 - - - - - 961,107 B 9,188 889,495 12,333 3,956 - - - - - 914,972 CCC - 170,560 - 5,129 - - - - - 175,689 CC 4,934 1,589 - - - - - - - 6,523 D - 231 - 2,227 - - - - - 2,458 NR 120,570 407,715 55,644 6,044,331 - 834 - - 327,529 6,956,623 NA - - - 1,665,023 - 18,646,722 - 34,537 - 20,346,282
Short-term Ratings
A-1 - - - - - - 36,825 - - 36,825 NR - - - - - - 4,446,836 - - 4,446,836 NA - - - - - - 692,800 - - 692,800 Total $288,492 $10,031,922 $487,812 $7,884,654 $178,463 $19,935,049 $5,176,461 $68,554 $327,529 $44,378,936
As of June 30, 2018, the credit ratings of all debt securities and securities lending collateral are as follows:
NOTES TO THE BASIC FINANCIAL STATEMENTS
Securities Lending Collateral (Dollars in Thousands)
Ratings
Asset-Backed
Securities Corporate Bonds
Mortgage-Backed
Securities
Mutual Funds -
Bond Funds
U.S. Government and
Agency Obligations
Short-Term
Securities Total
Long-term Ratings
AAA $1,381,858 $24,998 $28,616 $- $- $- $1,435,472 AA - 1,499,750 - - - - 1,499,750 A - 1,409,105 3,122 - - - 1,412,227 CC 264 - - - - - 264 NA - - - 296,187 14,851 - 311,038 NR 1,056,282 109,939 44,560 - - - 1,210,781
Short-term Ratings
A-1 - - - - - 281,830 281,830 NA - - - - - 14,727 14,727 NR - - - - - 15,765,782 15,765,782 Total $2,438,404 $3,043,792 $76,298 $296,187 $14,851 $16,062,339 $21,931,871
by the Bloomberg Barclays U.S. Aggregate Bond Index. The ratings used to determine the quality of the individual securities in the table below are the ratings provided by S&P Global Inc. Obligations issued or guaranteed by the U.S. federal government or government-sponsored agencies are eligible without limit. Furthermore, the total position of the outstanding debt of any non-agency mortgage-backed, asset-backed and commercial mortgage-backed securities issuer shall be limited to 10 percent of the market value of the portfolio, on the basis of each separate trust (pool of assets), at the time of purchase. Obligations of other issuers are not to exceed 5 percent per issuer, at the time of purchase, of the market value of any individual portfolio. The Investment Guidelines also include an allocation to
opportunistic strategies, which allows for the purchase of bonds rated below investment grade. Limitations on the amount of debt of any one issuer each investment manager may hold are negotiated on a manager-by-manager basis.
CalSTRS may invest in an unrated security if the security is comparable in quality to other rated securities that are eligible for purchase. The notation NR represents those securities that are not rated, and NA represents those securities for which the rating disclosure requirements are not applicable, such as obligations of the U.S. government and obligations explicitly guaranteed by the U.S. government.
Cash total of $20 (in thousands) is not included in the total above but is included in the Securities Lending Collateral line item in the Statement of Fiduciary Net Position.

76 CALSTRS COMPREHENSIVE ANNUAL FINANCIAL REPORT 2018
NOTES TO THE BASIC FINANCIAL STATEMENTS
Long-Term Fixed Income Duration
(Dollars in Thousands)
Investment Type (by portfolio)
Portfolio Net
Asset Value
Effective
Duration
Benchmark
Duration Difference
Core Portfolio
Commercial Mortgage-Backed Securities $485,247 5.22 5.22 0.00
Credit Obligations 6,919,965 6.82 6.92 (0.10)
Mortgage-Backed Securities 6,391,509 4.73 4.66 0.07
U.S. Government and Agency Obligations 8,797,427 5.96 5.90 0.06
Debt Opportunistic
Corporate High Yield 1,378,451 3.59 4.03 (0.44)
Debt Core Plus 2,734,657 5.66 5.63 0.03
Leveraged Loans 701,372 0.60 0.25 0.35
Special Situations 18,835 0.18 5.73 (5.55)
Total $27,427,463
Interest Rate Risk
Interest rate risk is the risk that changes in interest rates will adversely affect the fair value of an investment.
Investments may contain terms that increase the sensitivity of their fair values to increasing and decreasing interest rates. Although CalSTRS has investments that have an
inherent prepayment risk as well as caps, floors and step-up features, these are mitigated through the diversification of asset classes, security selection, maturity and credit quality.
The Investment Guidelines allow the core long-term investment grade portfolios the discretion to deviate the average duration of the portfolio within a range of +/- 20 percent (80 to 120 percent) of the weighted average effective duration of the performance benchmark.
The U.S. Treasury Inflation Protected Securities (TIPS), CalSTRS Home Loan Program, long-duration U.S. Treasury securities and other debt securities in non-Fixed Income portfolios are not included in the table above. The U.S. TIPS had a net asset value of $589.8 million with an effective duration of 7.69 years compared to the benchmark duration of 7.68 years. CalSTRS Home Loan Program had a net asset value of $58.5 million with a weighted average to maturity of 21.00 years. The long-duration U.S. Treasury securities had a net asset value of $9.2 billion
with an effective duration of 17.58 years compared to the benchmark duration of 17.59 years. Other debt securities in non-Fixed Income portfolios had a market value of $915.4 million with a weighted average to maturity of 7.3 years. Cash and accruals totaling ($436.0) million and swaps and other collateral totaling $10.4 million are included in the net asset value within the Fixed Income portfolios but are not included in debt securities on the Statement of Fiduciary Net Position.
As of June 30, 2018, the overall weighted effective duration and benchmark of the long-term Fixed Income portfolios were 5.62 years and 5.73 years, respectively. The following table presents the net asset values, durations and associated benchmarks by investment type held in the long-term Fixed Income portfolios.
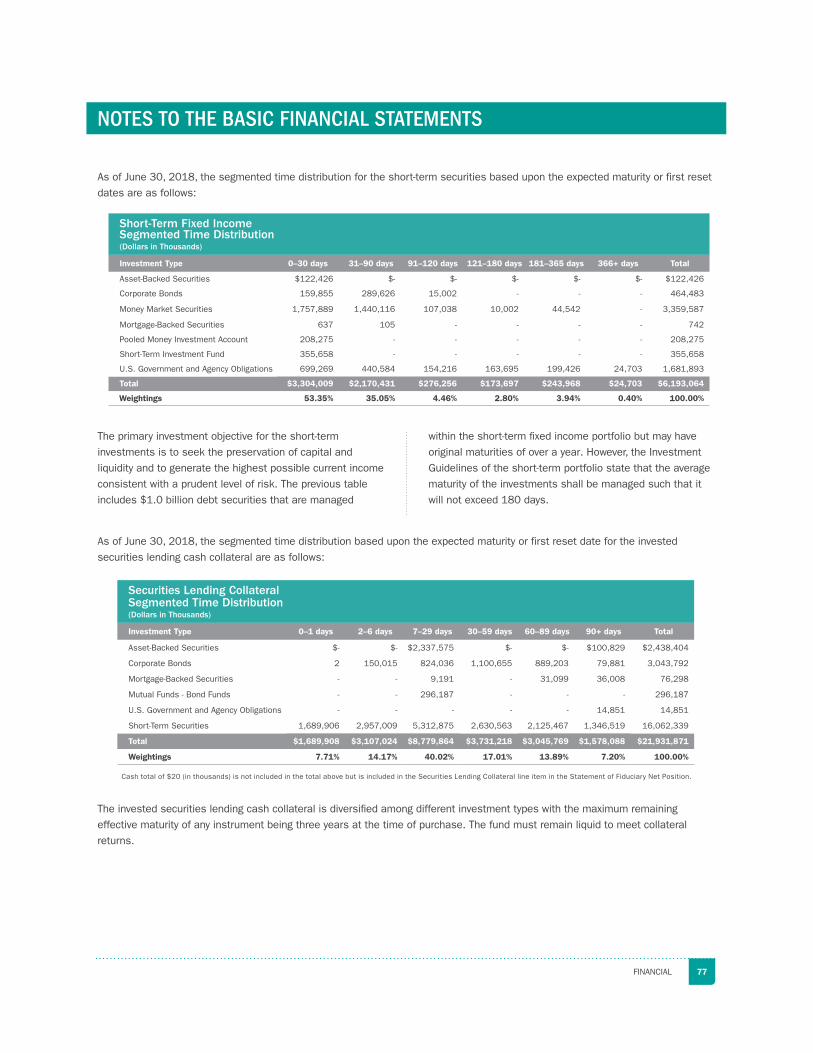
77FINANCIAL
NOTES TO THE BASIC FINANCIAL STATEMENTS
Short-Term Fixed Income Segmented Time Distribution
(Dollars in Thousands)
Investment Type 0–30 days 31–90 days 91–120 days 121–180 days 181–365 days 366+ days Total
Asset-Backed Securities $122,426 $- $- $- $- $- $122,426
Corporate Bonds 159,855 289,626 15,002 - - - 464,483
Money Market Securities 1,757,889 1,440,116 107,038 10,002 44,542 - 3,359,587
Mortgage-Backed Securities 637 105 - - - - 742
Pooled Money Investment Account 208,275 - - - - - 208,275
Short-Term Investment Fund 355,658 - - - - - 355,658
U.S. Government and Agency Obligations 699,269 440,584 154,216 163,695 199,426 24,703 1,681,893
Total $3,304,009 $2,170,431 $276,256 $173,697 $243,968 $24,703 $6,193,064
Weightings 53.35% 35.05% 4.46% 2.80% 3.94% 0.40% 100.00%
As of June 30, 2018, the segmented time distribution for the short-term securities based upon the expected maturity or first reset dates are as follows:
The primary investment objective for the short-term investments is to seek the preservation of capital and liquidity and to generate the highest possible current income consistent with a prudent level of risk. The previous table includes $1.0 billion debt securities that are managed
within the short-term fixed income portfolio but may have original maturities of over a year. However, the Investment Guidelines of the short-term portfolio state that the average maturity of the investments shall be managed such that it will not exceed 180 days.
As of June 30, 2018, the segmented time distribution based upon the expected maturity or first reset date for the invested securities lending cash collateral are as follows:
Securities Lending Collateral Segmented Time Distribution
(Dollars in Thousands)
Investment Type 0–1 days 2–6 days 7–29 days 30–59 days 60–89 days 90+ days Total
Asset-Backed Securities $- $- $2,337,575 $- $- $100,829 $2,438,404
Corporate Bonds 2 150,015 824,036 1,100,655 889,203 79,881 3,043,792
Mortgage-Backed Securities - - 9,191 - 31,099 36,008 76,298
Mutual Funds - Bond Funds - - 296,187 - - - 296,187
U.S. Government and Agency Obligations - - - - - 14,851 14,851
Short-Term Securities 1,689,906 2,957,009 5,312,875 2,630,563 2,125,467 1,346,519 16,062,339
Total $1,689,908 $3,107,024 $8,779,864 $3,731,218 $3,045,769 $1,578,088 $21,931,871
Weightings 7.71% 14.17% 40.02% 17.01% 13.89% 7.20% 100.00%
CCash total of $20 (in thousands) is not included in the total above but is included in the Securities Lending Collateral line item in the Statement of Fiduciary Net Position.
The invested securities lending cash collateral is diversified among different investment types with the maximum remaining effective maturity of any instrument being three years at the time of purchase. The fund must remain liquid to meet collateral returns.

78 CALSTRS COMPREHENSIVE ANNUAL FINANCIAL REPORT 2018
Concentration of Credit Risk
Concentration of credit risk is the risk of loss attributed to the magnitude of CalSTRS’ investment in a single issuer. As of June 30, 2018, CalSTRS has no single issuer that exceeds 5 percent of total investments. Investments issued or explicitly guaranteed by the U.S. government and investments in mutual funds, external investment pools and other pooled investments are excluded. The CalSTRS Investment Policy and Management Plan states that no more than 3 percent of the total fund shall be invested or exposed to any one security or corporation, with the exception of U.S. Treasury or Agency Obligations.
Custodial Credit Risk
Custodial credit risk is the risk that if a depository institution or counterparty fails, CalSTRS would not be able to recover the value of our deposits, investments or collateral securities. As of June 30, 2018, all of CalSTRS non-cash investments are not exposed to custodial credit risk because they are held in CalSTRS name. Demand and time deposits held by the various financial institutions and the state banks are insured up to $250,000 by the Federal Deposit Insurance Corporation (FDIC) or by collateral held by the State Treasurer’s Office or an agency of that office in the state’s name. CalSTRS does not have a general policy relating to custodial credit risk.
NOTES TO THE BASIC FINANCIAL STATEMENTS
Pension2
The primary objectives of Voya Fixed Plus III and TIAA Traditional Annuities are the guarantee of principal and a guaranteed minimum interest rate of 1.0 percent for the life of the contract. The interest rate guarantees under the contracts are subject to the claim-paying abilities of Voya Retirement Insurance and Annuity Company and TIAA.
As of June 30, 2018, the weighted average maturity of investments for the Pension2 403(b) and 457(b) plans on the Statement of Fiduciary Net Position are as follows:
Pension2 Weighted Average Maturity
(Dollars in Thousands)
Investment Maturity Fair Value
CREF Money Market Account 46 days $66
Federated U.S. Treasury Cash Reserves 45 days 7,282
Vanguard Inflation-Protected Securities Fund 8.4 years 34,537
Vanguard Short-Term Bond Index Fund 2.8 years 18,070
Vanguard Total Bond Market Index Fund 8.4 years 15,947
Total $75,902

79FINANCIAL
NOTES TO THE BASIC FINANCIAL STATEMENTS
Foreign Currency Risk (Dollars in Thousands) (In U.S. Dollar Equivalents)
Currency Name Cash Equity Fixed Income Spot Contracts Forward Contracts Total Exposure
Argentine Peso $204 $ - $1,382 $ - $ - $1,586
Australian Dollar 19,429 2,189,322 14,127 (7) 4,255 2,227,126
Brazilian Real 1,523 842,690 (11,461) (3) 1,642 834,391
Canadian Dollar 38,426 3,578,305 - 36 489 3,617,256
Chilean Peso 749 65,626 - - (2,933) 63,442
Colombian Peso 4 8,744 - - (789) 7,959
Czech Koruna 61 7,223 - 2 593 7,879
Danish Krone 2,739 706,233 12,151 (28) 862 721,957
Egyptian Pound 10 - - - - 10
Euro Currency 70,454 14,168,956 121,475 630 6,388 14,367,903
Hong Kong Dollar 16,159 3,825,673 (48,362) (4) (65) 3,793,401
Hungarian Forint 360 77,717 - (3) (903) 77,171
Indian Rupee 7,274 1,031,137 - - (2,245) 1,036,166
Indonesian Rupiah 1,111 231,101 9,712 - (2,098) 239,826
Japanese Yen 125,029 8,889,862 7,675 41 3,091 9,025,698
Kenyan Shilling - 4,608 - - - 4,608
Malaysian Ringgit 3,552 182,136 - (1) (375) 185,312
Mexican Peso 2,748 296,245 28,204 69 6,127 333,393
New Israeli Sheqel 1,777 97,626 9,576 (1) 4,944 113,922
New Taiwan Dollar 5,769 1,409,559 (48,205) - 183 1,367,306
New Zealand Dollar 1,443 100,482 16,288 - 679 118,892
Norwegian Krone 2,043 364,941 15,320 - 325 382,629
Pakistan Rupee 133 34,998 - - - 35,131
Peruvian Nouveau Sol 4 - - - (1) 3
Philippine Peso 331 93,010 - - 95 93,436
Polish Zloty 1,163 104,306 7,465 (6) (1,322) 111,606
Pound Sterling 58,387 7,071,814 55,861 (98) 2,762 7,188,726
Qatari Rial 816 38,290 - - - 39,106
Russian Ruble 19 - 14,210 - (2,261) 11,968
Singapore Dollar 7,438 571,973 - - (923) 578,488
South African Rand 655 722,030 23,197 (12) (11,233) 734,637
South Korean Won 14,081 2,118,542 (111,840) (1) 7,036 2,027,818
Sri Lanka Rupee - 1,955 - - - 1,955
Swedish Krona 2,185 978,674 - 5 383 981,247
Swiss Franc 2,492 2,366,214 202 (2) 1,603 2,370,509
Thailand Baht 5,107 306,971 - - 1,433 313,511
Turkish Lira 1,240 253,318 4,613 3 974 260,148
UAE Dirham 425 71,226 - - - 71,651
Yuan Renminbi 2,037 196,831 4,197 9 1,601 204,675
Total $397,377 $53,008,338 $125,787 $629 $20,317 $53,552,448
Foreign Currency Risk
Foreign currency risk is the risk that changes in exchange rates will adversely affect the fair value of an investment or a deposit. As of June 30, 2018, CalSTRS investments in foreign currencies are as follows:

80 CALSTRS COMPREHENSIVE ANNUAL FINANCIAL REPORT 2018
NOTES TO THE BASIC FINANCIAL STATEMENTS
CalSTRS investments denominated in foreign currencies are reported within derivative instruments and investment receivables or payables on the Statement of Fiduciary Net Position.
Foreign currency is composed of international investment proceeds and income to be repatriated into U.S. dollars and funds available to purchase international securities. Foreign currency is held temporarily in foreign accounts until it is able to be repatriated or expended.
In accordance with the Investment Policy and Management Plan, CalSTRS has established a strategic allocation to non-dollar public and private equity assets (i.e. private equity investments and real estate). Considering this commitment to non-dollar assets and the impact currency fluctuations can have on the total return of dollar-based investors, CalSTRS has recognized the need to implement strategies designed to address the management of currency risk. CalSTRS believes that our Currency Management Program should emphasize the protection of the value of its non-dollar public and private equity assets against a strengthening U.S. dollar first, yet recognizes that opportunities also exist for alpha generation (the ability to derive a return in excess of a market return) within the currency markets.
CalSTRS Fixed Income staff has management and oversight responsibilities for the Currency Management Program. The position range has been designed to allow for some degree of symmetry around the underlying exposure to the foreign-denominated assets within CalSTRS in order to both protect the translation value of the assets against a strengthening U.S. dollar and to enhance returns in a declining U.S. dollar environment.
As of June 30, 2018, the Pension2 403(b) and 457(b) plans do not expose CalSTRS to foreign currency risk.
Derivative Instruments
As of June 30, 2018, the derivative instruments held by CalSTRS are considered investments and not hedges for accounting purposes. The term hedging, as it is used elsewhere in the notes to these financial statements, denotes an economic activity and not an accounting method. The gains and losses arising from this activity are recognized as incurred in the Statement of Changes in Fiduciary Net Position.
All investment derivatives discussed below are included within the Investment Risk Schedules, which precede this section. Investments in derivative instruments are disclosed separately to provide a comprehensive view of this activity and its impact on the overall investment portfolio.

81FINANCIAL
NOTES TO THE BASIC FINANCIAL STATEMENTS
Investment Derivatives
(Dollars in Thousands)
Net Appreciation (Depreciation) in Fair Value of
Investments through June 30, 2018
Derivative Instruments Classification Amount Fair Value Notional Amount1
Commodity Forward Swaps Investment Income / (Loss) ($553) $(377) 402 Units
Credit Default Swaps Investment Income / (Loss) 1,380 (3,683) 331,101
Interest Rate Swaps Investment Income / (Loss) 3,090 (1,387) 328,680
Total Return Swaps Investment Income / (Loss) 33,898 (9,776) (803,587)
Variance Swaps Investment Income / (Loss) (215) (215) 34,763
Foreign Currency Forwards Investment Income / (Loss) (105,184) 20,317 10,273,940
Commodity Futures Investment Income / (Loss) 465 1,643 (11,541)
Futures (Domestic and Foreign) Investment Income / (Loss) (44,513) 77,772 3,016,421
Options Investment Income / (Loss) (61,315) 6,418 1,756,647
Rights Investment Income / (Loss) 2,901 2,248 35,342 Units
Warrants Investment Income / (Loss) 19 10 2,084 Units
Total Derivative Instruments ($170,027) $92,970
1In U.S. dollars unless otherwise indicated.
The table below presents the related net appreciation (depreciation) in fair value, fair value and notional amount of derivative instruments outstanding as of June 30, 2018.
Counterparty Credit Rating1
(Dollars in Thousands)
S&P Rating
Commodity
Forward
Swaps
Credit
Default
Swaps
Interest
Rate
Swaps
Total
Return
Swaps
Variance
Swaps
Foreign
Currency
Forwards
Fixed
Income
Options Total
AA $ -- $ -- $ - $ - $ - $3,030 $ - $3,030
A 50 159 569 160 - 29,885 - 30,823
BBB - 33 8 - - - - 41
Subtotal Investments in Asset
Position
50 192 577 160 - 32,915 - 33,894
Investments in Liability Position (427) (3,875) (1,964) (9,936) (215) (12,598) (7) (29,022)
Total Investments in Asset /
(Liability) Position ($377) ($3,683) ($1,387) ($9,776) ($215) $20,317 ($7) $4,872
1The counterparty credit exposure for similar instruments with the same counterparty is netted for presentation purposes.
Counterparty Credit Risk
The table below depicts the counterparty credit ratings of CalSTRS non-exchange traded investment derivative instruments outstanding and subject to loss as of June 30, 2018.

82 CALSTRS COMPREHENSIVE ANNUAL FINANCIAL REPORT 2018
The ratings used to determine the quality of the individual counterparty are S&P ratings. The aggregate fair value of investment derivative instruments in an asset position subject to counterparty credit risk as of June 30, 2018, was $33.9 million. This represents the maximum loss that would be recognized at the reporting date if all counterparties failed to perform as contracted. However, master agreements exist that call for daily exchange of collateral for the mark-to-market to minimize this risk.
CalSTRS may enter into a master netting arrangement with a counterparty. In the event of default or early termination, the master agreement permits the non-defaulting party the right to close-out all transactions in a single net settlement to one net amount payable by one counterparty to the other. As of June 30, 2018, there were assets of $94.9 million,
including collateral held by CalSTRS, and liabilities of $83.2 million from non-exchange traded derivatives subject to master netting agreements. As of June 30, 2018, CalSTRS did not have any significant exposure to counterparty credit risk with any single party.
Custodial Credit Risk
The custodial credit risk disclosure for exchange traded derivative instruments is made in accordance with the custodial credit risk disclosure requirements of GASB Statement No. 40. As of June 30, 2018, all of CalSTRS investments in derivative instruments are held in CalSTRS name or CalSTRS nominee’s name and are not exposed to custodial credit risk as of June 30, 2018.
NOTES TO THE BASIC FINANCIAL STATEMENTS
Interest Rate Risk
As of June 30, 2018, CalSTRS is exposed to interest rate risk on its derivative instruments described below by maturity period.
Investment Maturities
(Dollars in Thousands)
Investment Maturities (in years)
Investment Type Fair Value Less Than 1 1–5 6–10 More than 10
Credit Default Swaps ($3,683) ($38) ($3,671) $26 $ -
Interest Rate Swaps (1,387) - (2,039) 517 135
Total Return Swaps (9,776) (9,776) - - -
Fixed Income Options (7) (7) - - -
Total ($14,853) ($9,821) ($5,710) $543 $135

83FINANCIAL
Derivative Instruments Highly Sensitive to Interest Rate Changes
(Dollars in Thousands)
Investment Type Reference Rate/Asset Fair Value
Notional
Amount
Interest Rate Swap Receive Fixed 1.498%, Pay Variable 6-month Euro Interbank Offered Rate $- $3,339
Interest Rate Swap Receive Fixed 2.25%, Pay Variable 3-month London Interbank Offered Rate (686) 29,367
Interest Rate Swap Receive Fixed 2.85%, Pay Variable 3-month London Interbank Offered Rate (45) 73,830
Interest Rate Swap Receive Fixed 2.9563%, Pay Variable 3-month London Interbank Offered Rate 8 3,000
Interest Rate Swap Receive Fixed 3.47%, Pay Variable 0-month United Kingdom Retail Price Index 63 3,697
Interest Rate Swap Receive Fixed 7.33%, Pay Variable 1-month Mexico Interbank Equilibrium Interest Rate (585) 30,246
Interest Rate Swap Receive Fixed 7.3505%, Pay Variable 1-month Mexico Interbank Equilibrium Interest Rate (723) 44,121
Interest Rate Swap Receive Variable 3-month London Interbank Offered Rate, Pay Fixed 1.00% 139 115,906
Interest Rate Swap Receive Variable 3-month London Interbank Offered Rate, Pay Fixed 2.25% 343 5,800
Interest Rate Swap Receive Variable 3-month London Interbank Offered Rate, Pay Fixed 2.50% 35 1,000
Interest Rate Swap Receive Variable 3-month London Interbank Offered Rate, Pay Fixed 2.75% 128 2,800
Interest Rate Swap Receive Variable 3-month London Interbank Offered Rate, Pay Fixed 2.95% (24) 12,235
Interest Rate Swap Receive Variable 6-month Euro Interbank Offered Rate, Pay Fixed 1.498% (40) 3,339
Interest Rate Swaps Total ($1,387) $328,680
Total Return Swap Receive BCOMF1T Index, Pay 3-month U.S. Treasury Bill plus 0.14% (161) (52,804)
Total Return Swap Receive BCOMTR Index, Pay 3-month U.S. Treasury Bill plus 0.13% (8) (2,908)
Total Return Swap Receive BCOMTR1 Index, Pay 3-month U.S. Treasury Bill plus 0.14% (92) (35,249)
Total Return Swap Receive BCOMTR2 Index, Pay 3-month U.S. Treasury Bill plus 0.14% (154) (59,394)
Total Return Swap Receive 1-month Johannesburg Interbank Agreed Rate minus 0.60%, Pay MSCI South Africa Net Return Index
(9) 2,711
Total Return Swap Receive 1-month Johannesburg Interbank Agreed Rate minus 0.60%, Pay MSCI South Africa Net Return Index
28 18,788
Total Return Swap Receive 1-month Johannesburg Interbank Agreed Rate minus 0.60%, Pay MSCI South Africa Net Return Index
(41) 1,697
Total Return Swap Receive 1-month London Interbank Offered Rate plus 0.30%, Pay MSCI Thailand Net Return Index 244 2,355
Total Return Swap Receive 1-month London Interbank Offered Rate plus 0.10%, Pay MSCI Isreal Net Return Index (5) 470
Total Return Swap Receive MSCI Brazil Net Return Index, Pay 1-month Brazil Interbank Deposit Rate minus 0.35% 1 (950)
Total Return Swap Receive MSCI China Net Return Index, Pay 1-month Hong Kong Interbank Offered Rate plus 0.50% (4,360) (48,362)
Total Return Swap Receive RBCAECT0 Index, Pay 3-month U.S. Treasury Bill plus 0.10% (162) (99,486)
Total Return Swap Receive 1-month Turkish Lira Reference Interest Rate minus 0.50%, Pay MSCI Turkey Net Return Index
(5) 850
Total Return Swap Receive 1-month Warsaw Interbank Offered Rate minus 0.35%, Pay MSCI Poland Net Return Index 18 366
Total Return Swap Receive 3-month U.S. Treasury Bill plus 0.12%, Pay BCOMTR Index 2 619
Total Return Swaps Total ($4,704) ($271,297)
As of June 30, 2018, the table below shows swaps that are highly sensitive to changes in interest rates. The table below details the reference rate, fair value and notional amount of these derivative instruments:
NOTES TO THE BASIC FINANCIAL STATEMENTS

84 CALSTRS COMPREHENSIVE ANNUAL FINANCIAL REPORT 2018
NOTES TO THE BASIC FINANCIAL STATEMENTS
Foreign Currency Risk
As of June 30, 2018, CalSTRS is exposed to foreign currency risk on its investments in derivative instruments.
Foreign Currency Risk
(Dollars in Thousands) (In U.S. Dollar Equivalents)
Currency Forward Contracts
Currency Name Futures Options Rights Swaps Warrants
Investment
Asset
Investment
Liability
Total
Exposure
Australian Dollar $847 $ - $24 $ - $6 $8,402 ($4,147) $5,132
Brazilian Real - - - 184 - 6,791 (5,149) 1,826
Canadian Dollar 602 - - - - 5,497 (5,008) 1,091
Chilean Peso - - - - - 1,364 (4,297) (2,933)
Colombian Peso - - - - - 270 (1,059) (789)
Czech Koruna - - - - - 1,477 (884) 593
Danish Krone - - - - - 862 - 862
Euro Currency (2,083) 3,734 1,607 (15) 4 14,319 (7,931) 9,635
Hong Kong Dollar (424) - - (4,360) - 29 (94) (4,849)
Hungarian Forint - - - - - 2,077 (2,980) (903)
Indian Rupee - - - - - 131 (2,376) (2,245)
Indonesian Rupiah - - - - - 1,431 (3,529) (2,098)
Japanese Yen (1,547) - - - - 5,591 (2,500) 1,544
Malaysian Ringgit (53) - - - - - (375) (428)
Mexican Peso 328 - - (1,308) - 9,365 (3,238) 5,147
New Israeli Sheqel - - - (2) - 5,414 (470) 4,942
New Taiwan Dollar - - - (18) - 1,756 (1,573) 165
New Zealand Dollar - - - - - 1,523 (844) 679
Norwegian Krone - - - - - 788 (463) 325
Peruvian Nouveau Sol - - - - - 4 (5) (1)
Philippine Peso - - - - - 589 (494) 95
Polish Zloty - - - 405 - 306 (1,628) (917)
Pound Sterling (743) - 611 63 - 6,790 (4,028) 2,693
Russian Ruble - - - - - 153 (2,414) (2,261)
Singapore Dollar (6) - - - - 1,641 (2,564) (929)
South African Rand 21 - - (21) - 3,619 (14,852) (11,233)
South Korean Won (1,361) - - (5,851) - 8,593 (1,557) (176)
Swedish Krona - - - - - 1,448 (1,065) 383
Swiss Franc - - - - - 1,604 (1) 1,603
Thailand Baht 526 - - - - 2,487 (1,054) 1,959
Turkish Lira (99) - - (44) - 3,947 (2,973) 831
Yuan Renminbi - - - - - 3,272 (1,671) 1,601
Total ($3,992) $3,734 $2,242 ($10,967) $10 $101,540 ($81,223) $11,344

85FINANCIAL
NOTES TO THE BASIC FINANCIAL STATEMENTS
Asset Class / Strategy
Previous Target Allocation
as of June 30, 2017
Current Target Allocation
as of June 30, 2018 Policy Range
Actual Allocation as of
June 30, 2018
Global Equity 55.0% 54.0% +/- 6% 53.7%
Fixed Income 15.0% 13.0% +/- 3% 12.3%
Real Estate 12.0% 12.0% +/- 3% 12.8%
Private Equity 8.0% 8.0% +/- 3% 8.2%
Cash / Liquidity 2.0% 2.0% +/- 3% 1.4%
Inflation Sensitive 2.0% 2.0% +/- 3% 1.9%
Risk Mitigating Strategies 6.0% 9.0% +/- 3% 8.9%
Innovative Strategies 0.0% 0.0% +/- 3% 0.2%
Strategic Overlay 0.0% 0.0% 0.6%
Total Asset Allocation 100.0% 100.0% 100.0%
As of June 30, 2018, the net unrealized gain on the foreign currency forward contracts was $20.3 million.
Investment Allocation Policy
In accordance with GASB Statement No. 67 for pension plans and GASB Statement No.74 for OPEB plans, CalSTRS discloses investment policies pertaining to asset allocation and changes to any significant investment policies. The board approves the allocation of investment assets as described in the board policy manual. The key goal of the asset allocation process is to develop an asset allocation policy that maximizes the likelihood that the investment
portfolio’s assets will, over the planning horizon, fund plan benefits. CalSTRS conducts an asset allocation study every three years, or more frequently if there is a significant change in the liabilities or assets. The asset allocation study involves a comprehensive review of the financial condition of the plan, including the actuarial requirements of the plan, such as future benefit payments and expected cash flow of contributions. In conjunction with the long-term strategic target, a range for each asset class is established to provide flexibility designed to reduce rebalancing costs and adapt to changing market conditions. The board approved changes to asset allocation ranges effective January 1, 2018.
The following table displays the previous and current board-approved target allocation, the policy range and the actual allocation for the STRP per the portfolio allocation and management structure as of June 30, 2018.
All excess monies from the MPP Program and TDCF are invested into the Surplus Money Investment Fund, which is a pooled investment program administered by the State Treasurer.

86 CALSTRS COMPREHENSIVE ANNUAL FINANCIAL REPORT 2018
NOTES TO THE BASIC FINANCIAL STATEMENTS
6. FAIR VALUE MEASUREMENTSThe fair value of a financial instrument is the amount that would be received to sell an asset or paid to transfer a liability in an orderly transaction between market participants at the measurement date (the exit price). Fair value is a market-based measurement, not a CalSTRS-specific measurement; hence, valuation assumptions reflect those that market participants would use to price assets and liabilities at the measurement date.
U.S. Generally Accepted Accounting Principles (GAAP) establishes a hierarchy that prioritizes and ranks the inputs to valuation techniques used to measure fair value based on observability. Market price observability may be affected by a number of factors, including the investment type, investment-specific characteristics, state of the marketplace and existence and transparency of transactions between market participants. CalSTRS follows the fair value measurement and disclosure guidance under U.S. GAAP, which establishes a hierarchical disclosure framework. This framework prioritizes and ranks the level of market price observability used in measuring investments at fair value. U.S. GAAP also allows investments to be valued at cost or net asset value (NAV). The Fair Value Leveling Hierarchy table that follows presents CalSTRS investments at their fair value level, but also includes certain investments at cost or NAV.
Investments with readily available active quoted prices or for which fair value can be measured from actively quoted prices in an orderly market generally will have a higher degree of market price observability and a lesser degree of judgment used in measuring fair value. In all cases, an instrument’s level within the hierarchy is based upon the market pricing transparency of the instrument and does not necessarily correspond to CalSTRS’ perceived risk or the liquidity of the instrument.
Assets and liabilities measured at fair value are classified into one of the following categories:
Level 1 – Fair value is determined using unadjusted quoted prices in active markets for identical assets or liabilities accessible on the measurement date.
Level 2 – Fair value is determined using quoted prices in inactive markets or significant observable inputs (including, but not limited to, quoted prices for similar investments, interest rates, foreign exchange rates, volatility and credit spreads), either directly or indirectly. These inputs may be derived principally from, or corroborated by, observable market data through correlation or by other means.
Level 3 – Fair value is determined using unobservable inputs, including situations where there is little market activity, if any, for the asset or liability.
The fair value hierarchy level within which a fair value measurement falls is determined based on the lowest level input that is significant to the fair value measurement. The availability of valuation techniques and observable inputs may vary and is affected by factors such as the type of security, whether the security is established in the marketplace and market liquidity. Inputs used to measure fair value may require significant judgment or estimation, and CalSTRS may use models or other valuation methodologies to estimate fair value. Accordingly, the degree of judgment exercised by CalSTRS in estimating fair value is greatest for assets and liabilities categorized in Level 3.

87FINANCIAL
Fair Value Leveling Hierarchy
(Dollars in Thousands)
Fair Value Measurements Using
Quoted Prices in
Active Markets
for Identical
Assets
Significant Other
Observable
Inputs
Significant
Unobservable
Inputs
June 30, 2018 (Level 1) (Level 2) (Level 3)
Assets:
Investments by Fair Value Level
Debt Securities
Asset-Backed Securities $288,492 $- $272,805 $15,687 Corporate Bonds 10,031,922 - 10,024,652 7,270 Foreign Government Issues 487,812 - 487,181 631 Mortgage-Backed Securities 7,884,654 - 7,825,357 59,297 Municipal Securities 178,463 - 178,463 - U.S. Government and Agency Obligations 19,935,049 - 19,935,049 - Short-Term Securities 3,976,988 363,007 3,613,981 - Mutual Funds-Bond Funds 68,554 68,554 - - Guaranteed Annuity Contracts 327,529 - - 327,529
Total Debt Securities 43,179,463 431,561 42,337,488 410,414
Equity Securities
Common Stocks 107,892,853 107,856,494 29,037 7,322 Depository Receipts 3,351,794 3,344,016 - 7,778 Mutual Funds-Stock Funds 1,245,463 1,245,463 - - Preferred Stocks 455,262 453,480 1,601 181 Real Estate Investment Trusts 2,953,326 2,950,382 2,944 -
Total Equity Securities 115,898,698 115,849,835 33,582 15,281
Alternative Investments
Debt-Privately Held 881 - - 881 Equity-Privately Held 2,791 - - 2,791 Real Estate-Directly Held 19,226,692 - - 19,226,692
Total Alternative Investments 19,230,364 - - 19,230,364
Derivative Instruments
Forwards 101,540 - 101,540 - Futures 118,415 118,415 - - Options 7,552 - 7,552 - Rights and Warrants 2,258 2,254 - 4 Swaps 3,275 - 3,275 -
Total Derivative Instruments 233,040 120,669 112,367 4
Securities Lending Collateral 17,377,383 1,757,392 15,619,991 -
Total Investment Assets Recorded at Fair Value 195,918,948 118,159,457 58,103,428 19,656,063
Investments Measured at Cost
Short-Term Securities 1,199,473 Securities Lending Collateral 4,554,508 Total Investments Measured at Cost 5,753,981
Investments Measured at NAV
Debt-Privately Held 2,086,820 Equity-Privately Held 34,284,344 Real Estate-Non-Directly Held 10,292,597 Total Investments Measured at NAV 46,663,761
Total Investment Assets $248,336,690
Liabilities:
Investments by Fair Value Level
Derivative Instruments
Forwards 81,223 - 81,223 - Futures 39,000 39,000 - - Options 1,134 - 1,134 - Swaps 18,713 - 18,713 - Total Derivative Instruments 140,070 39,000 101,070 -
Total Investment Liabilities Recorded at Fair Value $140,070 $39,000 $101,070 $-
Total Net Investments $248,196,620
NOTES TO THE BASIC FINANCIAL STATEMENTS

88 CALSTRS COMPREHENSIVE ANNUAL FINANCIAL REPORT 2018
Level 1 measurements are generally valued at the official closing price (usually the last trade price) or the last bid price on the security’s primary exchange. Such investments generally include common stocks, REITs, depository receipts and mutual funds.
Level 2 measurements are generally valued using indicative prices from vendors, brokers or ask prices. These indicative measurements often use matrix pricing, the Black-Scholes-Merton model or a lattice model and incorporate observable inputs such as yield, prepayment speeds, credit spreads, volatility curves or currency curves. Such investments generally include debt securities, bonds and over-the-counter derivatives. Other factors such as infrequent trading, inactive market or adjusted quoted prices may also result in Level 2 measurements.
Level 3 measurements are generally valued using significant inputs that are unobservable to the marketplace. This may occur if an investment is illiquid or is internally estimated. For CalSTRS, such investments primarily include directly held real estate. Properties are appraised using discounted cash flows, income capitalization, adjusted comparable sales and replacement cost (if recent) methods. The method chosen is the one most relevant to how an investor would assess a property as a potential buyer.
Debt Securities
Certain debt securities have an active market for identical securities and are valued using the close or last traded price on a specific date. Debt securities that are not as actively traded are valued by pricing vendors using modeling techniques that include market observable inputs as well as unobservable inputs required to develop a fair value. Typical inputs include recent trades, yields, price quotes, cash flows, maturity, credit ratings and other assumptions based upon the specifics of the investment type.
Short-term investments are reported at fair value or at cost or amortized cost. For those investments that are reported at fair value, the investments are valued using similar methodologies as debt securities traded in active markets.
Bond mutual funds offered by Voya and TIAA are open-ended funds that are priced daily at NAV based generally upon the exchange traded official closing price of the securities held by the funds. CalSTRS allocation in the Voya annuity contracts is carried at contract value, which approximates fair value.
NOTES TO THE BASIC FINANCIAL STATEMENTS
Equity Securities
The majority of equity securities held by CalSTRS are actively traded on major stock exchanges. These exchanges make information on trades of securities available daily on a last trade or official close basis. If such information is not available, other pre-established means are used to determine a price. Stock mutual funds, held in the STRP and Pension2, are open-ended funds that are priced daily at NAV by the fund sponsor based generally upon the exchange traded official closing price of the securities held by the fund.
Alternative Investments
Partnership interests are valued using their respective NAV calculated in accordance with the general partner’s fair valuation policy as of the measurement date and are audited annually. The most significant input into the NAVs of such an entity is the fair value of its investment holdings, which are typically valued on a quarterly or semi-annual basis by the general partners. The valuation assumptions are based upon the nature of the investment and the underlying business. The valuation techniques vary by investment type and involve a certain degree of expert judgment.
Corporate governance funds structured as limited partnerships have been valued using the NAV of the entity, with the most significant input into the NAV being the value of its investment holdings. The general partners obtain prices for their holdings in a manner similar to that described above for equity securities.
Investments in real estate directly held assets are subject to independent third-party appraisals performed annually in accordance with the Uniform Standards of Professional Appraisal Practice. On a quarterly basis, fair values are estimated by the third-party advisor or operating partner using general market and property-specific assumptions, which are reviewed by CalSTRS valuation consultant. Leverage may be used to enhance investment returns as set forth in the CalSTRS Real Estate Investment Policy. See Note 5 regarding the disclosure relating to Real Estate leverage.

89FINANCIAL
Real estate investments in non-directly held limited partnership interests in commingled funds are valued by CalSTRS using the NAV of the partnership provided by the general partner. The most significant input into the NAV of such an entity is the fair value of its investment holdings. These holdings are valued using the general partners’ fair valuation policy on a continuous basis, audited annually and periodically appraised by an independent third-party as directed by the governing document for each commingled fund investment. The valuation assumptions use both market and property-specific inputs.
Derivative Instruments
The fair value of exchange-traded derivative instruments such as futures, options, rights and warrants are determined based on the quoted market prices or mean prices. The fair value of derivative instruments that are not exchange-traded, such as swaps, is determined by external pricing services.
Futures contracts are exchange-traded financial instruments that derive their value from underlying securities, indices or reference rates and are marked-to-market at the end of each day. The fair value of futures are accounted for as unrealized appreciation or depreciation until the contract is closed.
The fair value of the foreign currency forward contracts is the unrealized gain or loss calculated based on the difference between the specified exchange rate and the closing forward rate as of June 30, 2018.
NOTES TO THE BASIC FINANCIAL STATEMENTS
Investment in Certain Entities that Calculate Net Asset Value Per Share
CalSTRS measures certain investments that do not have a readily determinable fair value using NAV as a practical expedient. These investments are generally structured as limited partnerships with an investment manager and are created by raising pools of capital from investors that will be invested according to one or more specific investment strategies. Investors commit capital to the fund, and as the investment manager identifies investment opportunities, the committed capital is called to purchase the investments.
NAV is calculated using measurement principles similar to investment companies. CalSTRS updates the NAV for cash contributions, cash distributions and changes in the fair value of the underlying investments using capital account statements and estimates if the NAV is not updated as of the reporting date. CalSTRS does not currently have any plans to sell any of these investments before their stated term.
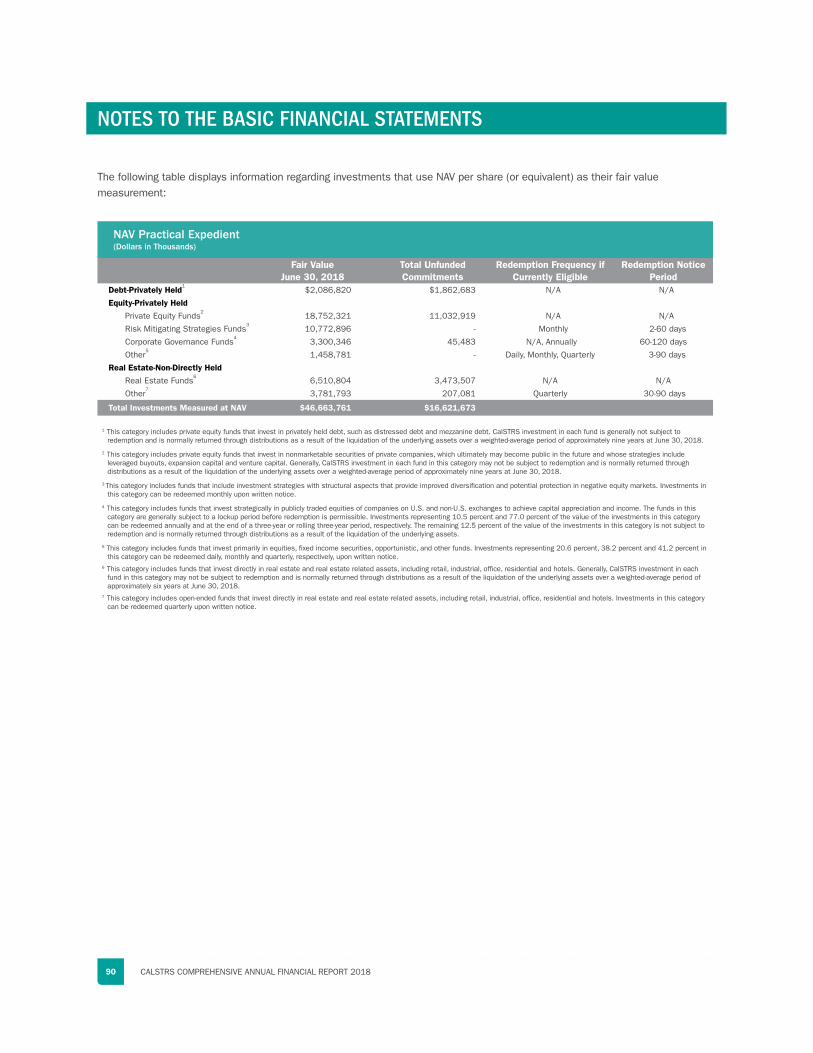
90 CALSTRS COMPREHENSIVE ANNUAL FINANCIAL REPORT 2018
NAV Practical Expedient (Dollars in Thousands)
Fair Value
June 30, 2018
Total Unfunded
Commitments
Redemption Frequency if
Currently Eligible
Redemption Notice
Period
Debt-Privately Held1
$2,086,820 $1,862,683 N/A N/A
Equity-Privately Held
Private Equity Funds2
18,752,321 11,032,919 N/A N/A
Risk Mitigating Strategies Funds3
10,772,896 - Monthly 2-60 days
Corporate Governance Funds4
3,300,346 45,483 N/A, Annually 60-120 days
Other5
1,458,781 - Daily, Monthly, Quarterly 3-90 days
Real Estate-Non-Directly Held
Real Estate Funds6
6,510,804 3,473,507 N/A N/A
Other7
3,781,793 207,081 Quarterly 30-90 days
Total Investments Measured at NAV $46,663,761 $16,621,673
1 This category includes private equity funds that invest in privately held debt, such as distressed debt and mezzanine debt. CalSTRS investment in each fund is generally not subject to redemption and is normally returned through distributions as a result of the liquidation of the underlying assets over a weighted-average period of approximately nine years at June 30, 2018.
2 This category includes private equity funds that invest in nonmarketable securities of private companies, which ultimately may become public in the future and whose strategies include leveraged buyouts, expansion capital and venture capital. Generally, CalSTRS investment in each fund in this category may not be subject to redemption and is normally returned through distributions as a result of the liquidation of the underlying assets over a weighted-average period of approximately nine years at June 30, 2018.
3 This category includes funds that include investment strategies with structural aspects that provide improved diversification and potential protection in negative equity markets. Investments in this category can be redeemed monthly upon written notice.
4 This category includes funds that invest strategically in publicly traded equities of companies on U.S. and non-U.S. exchanges to achieve capital appreciation and income. The funds in this category are generally subject to a lockup period before redemption is permissible. Investments representing 10.5 percent and 77.0 percent of the value of the investments in this category can be redeemed annually and at the end of a three-year or rolling three-year period, respectively. The remaining 12.5 percent of the value of the investments in this category is not subject to redemption and is normally returned through distributions as a result of the liquidation of the underlying assets.
5 This category includes funds that invest primarily in equities, fixed income securities, opportunistic, and other funds. Investments representing 20.6 percent, 38.2 percent and 41.2 percent in this category can be redeemed daily, monthly and quarterly, respectively, upon written notice.
6 This category includes funds that invest directly in real estate and real estate related assets, including retail, industrial, office, residential and hotels. Generally, CalSTRS investment in each fund in this category may not be subject to redemption and is normally returned through distributions as a result of the liquidation of the underlying assets over a weighted-average period of approximately six years at June 30, 2018.
7 This category includes open-ended funds that invest directly in real estate and real estate related assets, including retail, industrial, office, residential and hotels. Investments in this category can be redeemed quarterly upon written notice.
NOTES TO THE BASIC FINANCIAL STATEMENTS
The following table displays information regarding investments that use NAV per share (or equivalent) as their fair value measurement:

91FINANCIAL
Asset Class / Strategy Unfunded Commitments
(Dollars in Thousands)
Global Equity (Corporate Governance) $45,483
Inflation Sensitive 1,610,451
Innovative Strategies 218,412
Private Equity 15,596,505
Real Estate 5,430,588
Total $22,901,439
NOTES TO THE BASIC FINANCIAL STATEMENTS
7. CONTINGENCIES CalSTRS is involved in litigation relating to various matters. In the opinion of management, after consultation with legal counsel, the outcome of these matters is not expected to have a material adverse effect on CalSTRS financial statements.
8. COMMITMENTS In connection with the purchase of partnership interests under various investment portfolios, CalSTRS has remaining unfunded commitments of approximately $22.9 billion at June 30, 2018.
The following table depicts the unfunded commitments by asset strategy:
This amount is a funding measure that assumes the value of these contributions will be available to fund the MPP Program benefits in future periods, as the assets currently in the program are not sufficient to fund the projected future benefits. This differs from the net OPEB liability as of June 30, 2018, of $382.8 million, which was measured in accordance with GASB Statement No. 74 and represents the actuarial present value of projected benefit payments that is attributable to the MPP Program participants.
9. NEW ACCOUNTING PRONOUNCEMENTSManagement performs ongoing evaluations of new accounting pronouncements set forth by GASB, and assesses potential impacts to CalSTRS’ financial reporting. Pronouncements that have an impact to CalSTRS’ financial statements as of June 30, 2018, or may have an impact to CalSTRS financial reporting in future reporting periods follow:
GASB Statement No. 75, Accounting and Financial
Reporting for Postemployment Benefits Other Than Pensions, addresses reporting by governments that provide OPEB to their employees and for governments that finance OPEB for employees of other governments. GASB Statement No. 75 replaces the requirements of GASB Statement No. 45, Accounting and Financial Reporting by Employers
for Postemployment Benefits Other Than Pensions. This statement requires governments to report a liability on the face of the financial statements for OPEB they provide by reporting, according to specified criteria, either a net OPEB liability, their proportionate share of the collective OPEB liability, or the total OPEB liability related to their employees. GASB Statement No. 75 requires governments in all types of OPEB plans to present more extensive note disclosures and required supplementary information about their OPEB liabilities. CalSTRS recognized its proportionate share of the net OPEB liability, deferred outflows of resources, deferred inflows of resources and OPEB expense related to its participation in the California Employers’ Retiree Benefit Trust Fund administered by California Public Employees’ Retirement System, as required by GASB Statement No. 75 in the financial statements for the fiscal year ended June 30, 2018. The impact of GASB Statement No. 75 is not material to the financial statements as a whole.
These unfunded commitments include agreements for acquisitions not yet initiated, which are not included in the NAV Practical Expedient table. In addition, Real Estate has $9.9 billion of discretionary contractual arrangements with joint ventures, which are directly held investments, and co-investment with general partners, not shown in the table above. Discretionary contractual arrangements provide CalSTRS the ability to cancel or redirect our investment commitment.
Medicare Premium Payment Program
Under current board policy, assets are set aside from the future employer contributions to the DB Program to fund the MPP Program. Based on the funding actuarial valuation for the DB Program, as of June 30, 2017, the assets set aside are equal to the actuarial obligation of the MPP Program less the value of any assets already in the program. As of June 30, 2017, the future employer contributions committed to funding the MPP Program totaled $314 million, which equals the projected cost of the program.

92 CALSTRS COMPREHENSIVE ANNUAL FINANCIAL REPORT 2018
NOTES TO THE BASIC FINANCIAL STATEMENTS
Furthermore, CalSTRS will not provide additional note disclosures or supplementary information required by GASB Statement No. 75 because presenting information about CalSTRS OPEB liability as an employer, in addition to the disclosure for the collective OPEB liability of the MPP Program under GASB Statement No. 74, may confuse or mislead the users of CalSTRS financial statements.
GASB Statement No. 84, Fiduciary Activities, establishes criteria for identifying fiduciary activities of all state and local governments and clarifies whether and how business-type activities should report their fiduciary activities. The statement provides that governments should report activities meeting certain criteria in a fiduciary fund in the basic financial statements and present a statement of fiduciary net position and a statement of changes in fiduciary net position. The requirements of this statement are effective for reporting periods beginning after December 15, 2018. Management is evaluating GASB Statement No. 84 and its impact to CalSTRS financial reporting and, if applicable, will implement it in the financial statements for the fiscal year ending June 30, 2020.
GASB Statement No. 85, Omnibus 2017, specifically addresses timing of the measurement of pension or OPEB liabilities and expenditures recognized in financial statements prepared using the current financial resources measurement focus, recognizing on-behalf payments for pensions or OPEB in employer financial statements, presenting payroll-related measures in required supplementary information for purposes of reporting by OPEB plans and employers that provide OPEB, and various other topics. The requirements of this statement are effective for reporting periods beginning after June 15, 2017. CalSTRS’ MPP Program is impacted by the requirements related to the presentation of payroll-related measures, which have been implemented in the Schedule of Net OPEB Liability of Employers in the required supplementary information.
GASB Statement No. 87, Leases, increases the usefulness of governments’ financial statements by requiring recognition of certain lease assets and liabilities that previously were classified as operating leases. The requirements of this statement are effective for reporting periods beginning after December 15, 2019. Management is evaluating GASB Statement No. 87 and its impact to CalSTRS financial reporting and, if applicable, will implement it in the financial statements for the fiscal year ending
June 30, 2021.
GASB Statement No. 88, Certain Disclosures Related to
Debt, including Direct Borrowings and Direct Placements, clarifies which liabilities governments should include in their note disclosures related to debt. GASB Statement No. 88 requires that all debt disclosures present direct borrowings and direct placements of debt separately from other types of debt. The requirements of this statement are effective for reporting periods beginning after June 15, 2018. Management is evaluating GASB Statement No. 88 and its impact to CalSTRS financial reporting and, if applicable, will implement it in the financial statements for the fiscal year ending June 30, 2019.
GASB Statement No. 89, Accounting for Interest Cost
Incurred before the End of a Construction Period, establishes accounting requirements for interest cost incurred before the end of a construction period. Such interest cost includes all interest that previously was accounted for in accordance with the requirements of paragraphs 5 through 22 of GASB Statement No. 62, Codification of
Accounting and Financial Reporting Guidance Contained in
Pre-November 30, 1989 FASB and AICPA Pronouncements. This statement requires that interest cost incurred before the end of a construction period be recognized as an expense in the period in which the cost is incurred for financial statements prepared using the economic resources measurement focus. The requirements of this statement are effective for reporting periods beginning after December 15, 2019. Management is evaluating GASB Statement No. 89 and its impact to CalSTRS financial reporting and, if applicable, will implement it in the financial statements for the fiscal year ending June 30, 2021.
GASB Statement No. 90, Majority Equity Interests—an
amendment of GASB Statements No. 14 and No. 61, clarifies the definition of a majority equity interest, and specifies that a majority equity interest in a legally separate organization should be reported as an investment if a government’s holding of the equity interest meets the definition of an investment. In addition, it provides guidance for reporting a component unit if a government acquires a 100 percent equity interest in that component unit. The requirements of this statement are effective for reporting periods beginning after December 15, 2018. Management is evaluating GASB Statement No. 90 and its impact to CalSTRS’ financial reporting and, if applicable, will implement it in the financial statements for the fiscal year ending June 30, 2020.

93FINANCIAL
Required Supplementary Information (Unaudited)

94 CALSTRS COMPREHENSIVE ANNUAL FINANCIAL REPORT 2018
(Dollars in Millions) Schedule I1
SCHEDULE OF CHANGES IN NET PENSION LIABILITY OF EMPLOYERS AND NONEMPLOYER CONTRIBUTING ENTITY
State Teachers’ Retirement Plan (STRP)Year Ended June 302 2018 2017 2016 2015 2014
Total Pension Liability
Service Cost $7,142 $6,064 $5,874 $5,556 $5,338
Interest 21,496 20,227 19,332 18,556 17,822
Differences Between Expected and Actual Experience (94) 399 (1,209) (1,312) -
Changes of Assumptions - 19,9883 - - -
Benefit Payments, Including Refunds of Member Contributions (14,537) (13,903) (13,149) (12,565) (12,035)
Net Change in Total Pension Liability 14,007 32,775 10,848 10,235 11,125
Beginning Total Pension Liability 302,769 269,994 259,146 248,911 237,786
Ending Total Pension Liability (a) 316,776 302,769 269,994 259,146 248,911
Plan Fiduciary Net Position
Member Contributions 3,496 3,441 2,957 2,510 2,264
Employer Contributions 4,867 4,173 3,391 2,678 2,272
State Contributions 2,797 2,478 1,940 1,426 1,383
Net Investment Income 18,674 25,165 2,305 7,612 30,402
Other Income 106 72 42 4 2
Benefit Payments, Including Refunds of Member Contributions (14,537) (13,903) (13,149) (12,565) (12,035)
Administrative Expense (216) (182) (180) (145) (154)
Borrowing Costs4 (94) (58) - - -
Other Expenses (2) (10) (15) (10) (9)
Net Change in Plan Fiduciary Net Position 15,091 21,176 (2,709) 1,510 24,125
Beginning Plan Fiduciary Net Position–As Previously Reported 210,289 189,113 191,822 190,474 166,349
Adjustment for Application of New GASB Statements5 (511) - - (162) -
Beginning Plan Fiduciary Net Position–As Adjusted 209,778 189,113 191,822 190,312 166,349
Ending Plan Fiduciary Net Position (b) 224,869 210,289 189,113 191,822 190,474
Ending Net Pension Liability of Employers and the State (a) - (b) $91,907 $92,4806 $80,881 $67,324 $58,4377
1 Some numbers in this schedule are rounded for presentation purposes, and may differ slightly from those presented in the Statement of Changes in Fiduciary Net Position.2 This is a 10-year schedule. However, the information in this schedule is not available for periods prior to fiscal year 2013–14. Years will be added to this schedule in future fiscal years until 10
years of information is available.3 The assumptions used in determining the Total Pension Liability of the STRP changed as a result of the actuarial experience study for the period starting July 1, 2010, and ending June 30, 2015.
The assumption changes were to price inflation, wage growth, discount rate and the mortality tables.4 Borrowing costs of $94 million and $58 million, associated with the master credit facility portfolio, which were previously recorded within net investment income, have been reclassified for the
years ended June 30, 2018, and 2017, respectively. 5 Adjustments were made to the STRP’s beginning net position in fiscal year 2017–18 and fiscal year 2014–15 due to the implementation of requirements from GASB Statement No. 75 and GASB
Statement No. 68, respectively. 6 The net pension liability (NPL) for fiscal year 2016–17 does not include the $511 million reduction to the net position as a result of CalSTRS implementation of GASB Statement No. 75.7 The NPL for fiscal year 2013–14 does not include the $162 million reduction to the net position as a result of CalSTRS implementation of GASB Statement No. 68.
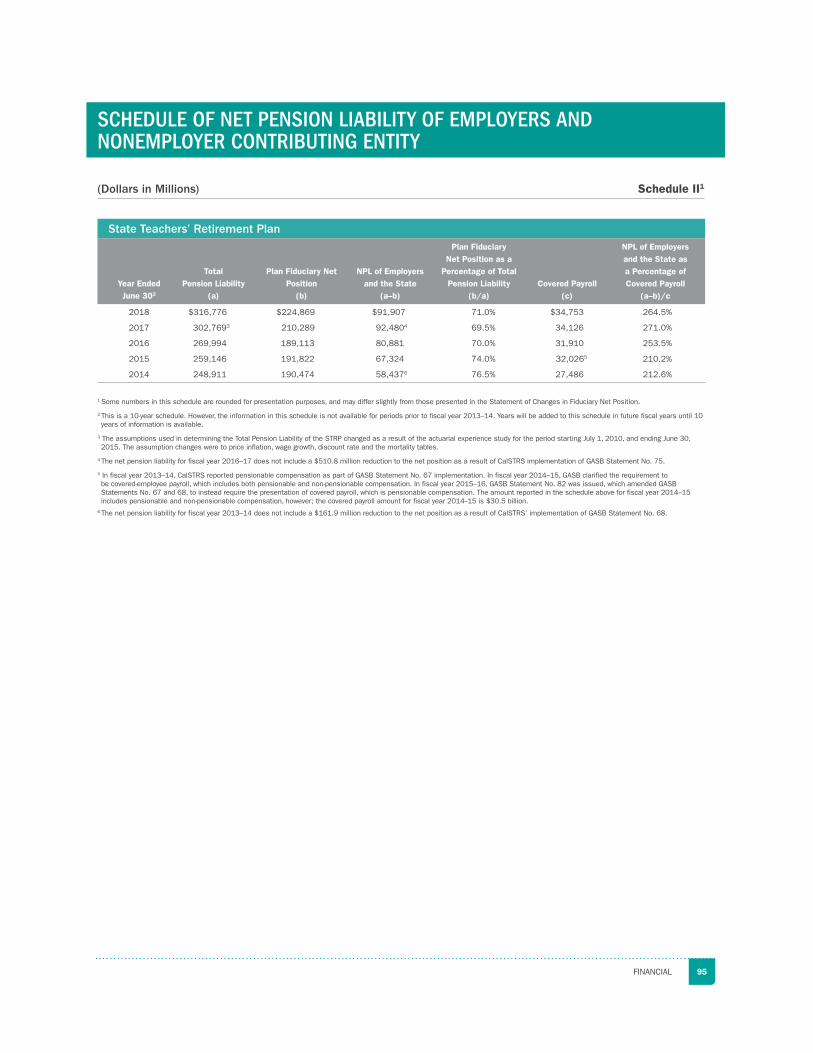
95FINANCIAL
(Dollars in Millions) Schedule II1
SCHEDULE OF NET PENSION LIABILITY OF EMPLOYERS AND NONEMPLOYER CONTRIBUTING ENTITY
State Teachers’ Retirement Plan
Year Ended
June 302
Total
Pension Liability
(a)
Plan Fiduciary Net
Position
(b)
NPL of Employers
and the State
(a–b)
Plan Fiduciary
Net Position as a
Percentage of Total
Pension Liability
(b/a)
Covered Payroll
(c)
NPL of Employers
and the State as
a Percentage of
Covered Payroll
(a–b)/c
2018 $316,776 $224,869 $91,907 71.0% $34,753 264.5%
2017 302,7693 210,289 92,4804 69.5% 34,126 271.0%
2016 269,994 189,113 80,881 70.0% 31,910 253.5%
2015 259,146 191,822 67,324 74.0% 32,0265 210.2%
2014 248,911 190,474 58,4376 76.5% 27,486 212.6%
1 Some numbers in this schedule are rounded for presentation purposes, and may differ slightly from those presented in the Statement of Changes in Fiduciary Net Position.
2 This is a 10-year schedule. However, the information in this schedule is not available for periods prior to fiscal year 2013–14. Years will be added to this schedule in future fiscal years until 10 years of information is available.
3 The assumptions used in determining the Total Pension Liability of the STRP changed as a result of the actuarial experience study for the period starting July 1, 2010, and ending June 30, 2015. The assumption changes were to price inflation, wage growth, discount rate and the mortality tables.
4 The net pension liability for fiscal year 2016–17 does not include a $510.8 million reduction to the net position as a result of CalSTRS implementation of GASB Statement No. 75.
5 In fiscal year 2013–14, CalSTRS reported pensionable compensation as part of GASB Statement No. 67 implementation. In fiscal year 2014–15, GASB clarified the requirement to be covered-employee payroll, which includes both pensionable and non-pensionable compensation. In fiscal year 2015–16, GASB Statement No. 82 was issued, which amended GASB Statements No. 67 and 68, to instead require the presentation of covered payroll, which is pensionable compensation. The amount reported in the schedule above for fiscal year 2014–15 includes pensionable and non-pensionable compensation, however; the covered payroll amount for fiscal year 2014--15 is $30.5 billion.
6 The net pension liability for fiscal year 2013–14 does not include a $161.9 million reduction to the net position as a result of CalSTRS’ implementation of GASB Statement No. 68.

96 CALSTRS COMPREHENSIVE ANNUAL FINANCIAL REPORT 2018
(Dollars in Millions) Schedule III
SCHEDULE OF PENSION CONTRIBUTIONS FROM EMPLOYERS AND NONEMPLOYER CONTRIBUTING ENTITY
The information presented in this schedule for the STRP is required for defined benefit pension plans.
State Teachers’ Retirement Plan
Year Ended
June 301
Actuarially
Determined
Contributions
(a)
Legally Required
Contributions for
Employers and
the State
Employer
Contributions2,3
(b)
State
Contributions4
(c)
Total
Contributions
(b + c)
Contribution
Deficiency
(excess)
a–(b + c)
Covered Payroll
(d)
Contributions as
a Percentage of
Covered Payroll
(b + c)/d
2018 $9,577 $7,664 $4,867 $2,797 $7,664 $1,913 $34,753 22.1%
2017 7,959 6,651 4,173 2,478 6,651 1,308 34,126 19.5%
2016 7,748 5,318 3,378 1,940 5,318 2,430 31,910 16.7%
2015 7,707 4,093 2,667 1,426 4,093 3,614 32,0265 12.8%
2014 7,158 3,641 2,258 1,383 3,641 3,517 27,486 13.2%
1This is a 10-year schedule. However, the information in this schedule is not available for periods prior to fiscal year 2013–14. Years will be added to this schedule in future fiscal years until 10 years of information is available.
2Excludes $10.3 million, $13.3 million, $13.5 million, $12.5 million and $14.5 million for fiscal years 2017--18, 2016–17, 2015–16, 2014–15 and 2013–14, respectively, in contributions to separately finance specific liabilities, such as benefit enhancements, of an individual employer.
3Includes employer contributions under Education Code sections 22711, 22713, 22905, 22950, 22951, 24260 and 26503.4Includes state contributions under Education Code sections 22954 and 22955, as well as Public Resources Code section 6217.5In fiscal year 2013–14, CalSTRS reported pensionable compensation as part of GASB Statement No. 67 implementation. In fiscal year 2014–15, GASB clarified the requirement to be covered-employee payroll, which includes both pensionable and non-pensionable compensation. In fiscal year 2015–16, GASB Statement No. 82 was issued, which amended GASB Statements No. 67 and 68, to instead require the presentation of covered payroll, which is pensionable compensation. The amount reported in the schedule above for fiscal year 2014–15 includes pensionable and non-pensionable compensation, however; the covered payroll amount for fiscal year 2014--15 is $30.5 billion.
State Teachers' Retirement Plan1
Actuarial Cost Method Entry Age Normal
Amortization Method Level Percent of Payroll Basis
Amortization Period Closed/Open2
Remaining Amortization Period 30 years
Asset Valuation Method Adjustment to market value
Actuarial Assumptions:
Investment Rate of Return 7.25%3
Interest on Accounts 3.00%
Wage Growth 3.50%
Consumer Price Inflation 2.75%
Postretirement Benefit Increases 2.00% simple
Methods and Assumptions Used in Calculations of Actuarially Determined Contributions
The actuarially determined contribution (ADC) for the STRP for 2018 presented in this Schedule of Pension Contributions from Employers and Nonemployer Contributing Entity was determined based on the assumptions used in the June 30, 2016, actuarial valuation. The following actuarial methods and assumptions were used to determine the ADC:
1The assumptions shown above are for the ADC of the Defined Benefit (DB) Program. The ADC for the year ending June 30, 2018, is the statutory contribution rate as of the June 30, 2016, actuarial valuation applied to actual DB Program payroll for the fiscal year ended June 30, 2018. For the Defined Benefit Supplement (DBS), Cash Balance Benefit (CBB), and Supplemental Benefit Maintenance Account programs, the ADC reflects the contributions recognized on an accrual basis for the fiscal year ended June 30, 2018.
2 The actuarial gains/losses and the unfunded actuarial obligation are amortized over a closed period for the DB Program, in contrast to the use of an open amortization period for the DBS and CBB programs.
3The actuarially determined contribution for the fiscal year ending June 30, 2018, was calculated based on the economic and demographic assumptions in place for the funding actuarial valuation as of June 30, 2016. This valuation was performed using a 7.25 percent assumed investment rate of return, net of investment and administrative expenses. For financial reporting purposes, the NPL (shown in Note 3 of the basic financial statements) was calculated using actuarial assumptions adopted in 2017, which included an assumed rate of return of 7.10 percent, net of investment expenses but gross of administrative expenses.

97FINANCIAL
State Teachers’ Retirement Plan
Year Ended June 301
Money-Weighted Rate of Return, Net of
Investment Expenses
2018 8.9%
2017 13.4%
2016 1.2%
2015 4.1%
2014 18.6%
1This is a 10-year schedule. However, the information in this schedule is not available for periods prior to fiscal year 2013–14. Years will be added to this schedule in future fiscal years until 10 years of information is available.
Schedule IV
Medicare Premium Payment (MPP) Program1
Year Ended June 302
Money-Weighted Rate of Return, Net of
Investment Expenses
2018 1.3%
2017 0.9%
1The funds within the MPP Program as of June 30, 2018, were to manage differences between estimated and actual amounts to be paid and were invested in the Surplus Money Investment Fund, which is a pooled investment program administered by the State Treasurer.
2This is a 10-year schedule. However, the information in this schedule is not available for periods prior to fiscal year 2016–17. Years will be added to this schedule in future fiscal years until 10 years of information is available.
SCHEDULE OF MONEY-WEIGHTED INVESTMENT RETURNS FOR STATE TEACHERS’ RETIREMENT PLAN AND MEDICARE PREMIUM PAYMENT PROGRAM

98 CALSTRS COMPREHENSIVE ANNUAL FINANCIAL REPORT 2018
(Dollars in Thousands) Schedule V
Medicare Premium Payment ProgramYear Ended June 30¹ 2018 2017
Total OPEB Liability
Interest $14,567 $12,928
Differences Between Expected and Actual Experience (15,759) (41)
Changes of Assumptions (10,293) (31,240)
Premiums Paid (28,036) (28,929)
Net Change in Total OPEB Liability (39,521) (47,282)
Total OPEB Liability–Beginning 420,749 468,031
Total OPEB Liability–Ending (a) 381,228 420,749
Plan Fiduciary Net Position
Employer Contributions 28,218 29,117
Net Investment Income 18 11
Premiums Paid (28,036) (28,929)
Administrative Expense (578) (168)
Net Change in Plan Fiduciary Net Position (378) 31
Beginning Plan Fiduciary Net Position–As Previously Reported 41 10
Adjustment for Application of New GASB Statements2 (1,205) -
Ending Plan Fiduciary Net Position–As Adjusted (b) (1,542) 41
Ending Net OPEB Liability of Employers (a) - (b) $382,770 $420,7083
1This is a 10-year schedule. However, the information in this schedule is not available for periods prior to fiscal year 2016–17. Years will be added to this schedule in future fiscal years until 10 years of information is available.
2 An adjustment was made to the MPP Program’s beginning net position in fiscal year 2017–18 due to the implementation of requirements from GASB Statement No. 75.3 The net OPEB liability for fiscal year 2016–17 does not include the $1.2 million reduction to the net position as a result of CalSTRS implementation of GASB Statement No. 75.
SCHEDULE OF CHANGES IN NET OPEB LIABILITY OF EMPLOYERS

99FINANCIAL
(Dollars in Thousands) Schedule VI
Medicare Premium Payment Program
Year Ended
June 301
Total
OPEB Liability
(a)
Plan Fiduciary Net Position
(b)
Net OPEB Liability
of Employers
(a - b)
Plan Fiduciary Net
Position as a Percentage
of Total OPEB Liability
(b/a)
2018 $381,228 $(1,542) $382,770 (0.40%)
2017 420,749 41 420,708 0.01%
SCHEDULE OF NET OPEB LIABILITY OF EMPLOYERS
1This is a 10-year schedule. However, the information in this schedule is not available for periods prior to fiscal year 2016–17. Years will be added to this schedule in future fiscal years until 10 years of information is available.

100 CALSTRS COMPREHENSIVE ANNUAL FINANCIAL REPORT 2018
Other Supplementary Information

101FINANCIAL
State Teachers’
Retirement Plan
Pension2
403(b)
Plan
Pension2
457(b)
Plan
Medicare
Premium
Payment Program
Teachers’
Deferred
Compensation
Fund Totals
Personnel Services:
Salaries and Wages $68,697 $- $- $287 $473 $69,457
Staff Benefits 15,080 - - 70 87 15,237
Accrued Pension and OPEB Expense
55,506 - - 134 518 56,158
Total Personnel Services 139,283 - - 491 1,078 140,852
Operating Expenses and
Equipment:
General 1,000 - - 76 87 1,163
Depreciation/Amortization 8,681 - - - - 8,681
Printing 737 - - - - 737
Communications 972 - - - - 972
Postage 836 - - - - 836
Insurance 24 - - - - 24
Travel 858 - - - 33 891
Training 1,197 - - - - 1,197
Facilities Operations 8,943 - - - - 8,943
Consultants and Professional Services
29,343 2,406 100 - 948 32,797
Information Technology 10,932 - - - - 10,932
Indirect State Central Services 9,160 - - 11 52 9,223
Equipment 4,079 - - - - 4,079
Other 38 - - - - 38
Total Operating Expenses and
Equipment 76,800 2,406 100 87 1,120 80,513
Total $216,083 $2,406 $100 $578 $2,198 $221,365
(Dollars in Thousands) Schedule VII
SCHEDULE OF ADMINISTRATIVE EXPENSES

102 CALSTRS COMPREHENSIVE ANNUAL FINANCIAL REPORT 2018
Contract Start Date Amount
Investment Management Fees
Aberdeen Asset Management, Inc. 12/15/06 $1,929
Acadian Asset Management, LLC 2/1/18 269
AGF Investments America, Inc. 3/19/07 1,106
Analytic Investors, LLC 9/1/14 221
AQR Capital Management Holdings, LLC 12/1/14 21,122
Arrowstreet Capital, Ltd. 8/1/15 7,942
Baillie Gifford Overseas, Ltd. 1/15/06 8,316
Bivium Capital Partners, LLC 2/15/08 2,476
BlackRock Financial Management, Inc. 5/12/99 6,596
BlackRock Institutional Trust, N.A. 10/27/98 7,169
Chicago Equity Partners 11/1/98 50
Columbia Management Investment Advisers, LLC 10/1/11 1,232
Credit Suisse Asset Management, LLC 9/1/11 1,818
FDO Partners, LLC 1/1/10 1,743
Fidelity Institutional Asset Management Co. 2/1/00 2,721
First Quadrant, LP 11/1/98 748
FIS Group, Inc. 2/27/04 3,090
Gateway Investment Advisers, LLC 12/1/14 235
Generation Investment Management 3/19/07 13,377
Geneva Capital Management, LLC 5/1/16 265
JP Morgan Investment Management, Inc. 1/1/14 7,266
Lazard Asset Management, LLC 5/18/99 13,928
Leading Edge Investment Advisors, LLC 2/15/08 2,797
Lee Overlay Partners, Ltd. 10/15/09 3,121
LM Capital Group, LLC 10/30/06 810
Lyxor Asset Management, Inc. 8/1/16 8,799
Macquarie Investment Management 11/1/98 2,115
Millennium Global Investments, Ltd. 7/1/10 3,625
Mondrian Investment Partners, Ltd. 5/13/99 15,758
Oechsle International Advisors, LLC 5/19/99 1,434
Parametric Portfolio Associates, LLC 12/1/14 322
PIMCO 2/28/17 704
Post Advisory Group, LLC 1/31/02 1,409
Principal Global Investors, LLC 7/15/17 1,693
Progress Investment Management 2/15/08 3,312
Pzena Investment Management, LLC 7/1/15 3,773
Robeco Institutional Asset Management 2/1/18 325
Sasco Capital, Inc. 10/30/98 576
Schroder Investment Management 9/1/14 7,926
Silvercrest Asset Management 7/1/11 1,592
State Street Global Advisors Trust Company 12/1/00 7,093
Sterling Capital Management, LLC 3/11/04 1,415
T. Rowe Price Associates, Inc. 1/15/06 7,991
Templeton Asset Management, Ltd. 5/18/99 3,758
(Dollars in Thousands) Schedule VIII
SCHEDULE OF INVESTMENT EXPENSES

103FINANCIAL
(Dollars in Thousands) Schedule VIII (continued)
SCHEDULE OF INVESTMENT EXPENSES
Contract Start Date Amount
Western Asset Management Co. 10/30/06 $3,469
Total Investment Management Fees 187,436
Advisors and Consultants
Altus Group U.S., Inc. 7/1/15 812
Bard Consulting, LLC 9/20/07 1,031
Bickmore Risk Services and Consulting 12/1/16 88
Callan Associates 9/20/07 153
Cambridge Associates, LLC 5/31/14 2,835
Courtland Partners, Ltd. 9/20/07 223
Crosswater Realty Advisors, LLC 6/1/16 188
David L. Bonuccelli & Associates, Inc. 9/20/07 658
Ernst & Young U.S. LLP 1/1/16 281
Hamilton Lane Advisors, LLC 7/1/16 26
Lyxor Asset Management, Inc. 8/1/16 700
Meketa Investment Group, Inc. 1/1/12 1,479
Pavilion Alternatives Group, LLC 1/1/12 1,588
Pension Consulting Alliance, LLC 6/1/14 1,587
RCLCO Fund Advisors, LLC 1/15/18 79
The Townsend Group, Inc. 3/1/13 335
Valuation Research Corporation 8/1/01 218
Total Advisors and Consultants 12,281
External Services-Legal and Attorney Fees
Berman DeValerio 4/19/11 150
BLA Schwartz, PC 11/1/13 1,159
Covington & Burling, LLP 4/20/11 19
Cox, Castle & Nicholson, LLP 11/30/09 3,710
Jackson Walker, LLP 7/30/15 197
Morgan, Lewis & Bockius, LLP 12/9/10 414
Proskauer, LLP 3/9/11 587
Reed Smith, LLP 7/1/15 193
Steptoe & Johnson, LLP 3/1/17 28
Miscellaneous N/A 15
Total External Services-Legal and Attorney Fees 6,472
Master Custodian
State Street Bank & Trust Co 7/1/01 3,088
Total Master Custodian 3,088
Research and Rating Services
Accounting Research & Analytics, LLC 1/1/18 25
Activist Insight, Ltd. 9/1/17 16
CEM Benchmarking, Inc. 1/1/17 70
Cornerstone Macro, LP 1/1/18 70
CPR & CDR Alpha, LLC 3/1/18 60

104 CALSTRS COMPREHENSIVE ANNUAL FINANCIAL REPORT 2018
(Dollars in Thousands) Schedule VIII (continued)
SCHEDULE OF INVESTMENT EXPENSES
Contract Start Date Amount
Creditsights, Inc. 12/30/17 $26
Equilar, Inc. 7/1/17 45
eVestment Alliance, LLC 8/1/17 31
FactSet Research System, Inc. 7/1/16 715
Global Financial Data, Inc. 5/9/18 27
GNA Services, LLC 1/1/18 25
Hawking, LLC 7/1/17 16
ICE Benchmark Administration 7/1/17 16
Informa Investment Solutions 1/12/18 24
Institutional Shareholder Services 7/1/17 99
KDP Investment Advisors, Inc. 10/1/17 37
London Stock Exchange PLC 1/1/18 38
Management CV, Inc. 1/1/18 15
Mergermarket Limited US 1/28/17 13
Moody's Investors Service 1/1/17 475
MSCI ESG Research, Inc. 1/1/18 126
MSCI, Inc. 1/1/17 548
PEI Media, Ltd. 3/29/18 15
Real Estate Research Corporation 9/20/07 212
Russell Investment Group 7/1/17 298
Standard & Poor's 8/1/16 580
Strategas Securities, LLC 7/1/17 64
Sustainable Investments Institute 7/1/17 31
Sustainalytics U.S., Inc. 1/1/18 10
Technical Analysis Group, LLC 2/3/18 28
Thomson Reuters Markets, LLC 7/1/17 145
Trepp, LLC 7/1/17 60
Zeno Consulting Group, LLC 10/1/17 23
Miscellaneous N/A 5
Total Research and Rating Services 3,988
Risk Management Systems
Barclays Bank PLC 7/1/17 150
BlackRock Financial Management, Inc. 7/1/06 6,258
MSCI, Inc. d/b/a Barra, LLC 4/1/18 139
Total Risk Management Systems 6,547
Trading Systems
Bloomberg, LP 7/1/16 979
Fixed Income Clearing Corp 7/1/16 12
Intex Solutions, Inc. 9/1/17 168
Market Axess Corporation 10/1/17 19
Markit N.America Inc. / Markit Group 10/14/17 40
Omgeo, LLC 7/1/16 25
Miscellaneous N/A 11
Total Trading Systems 1,254

105FINANCIAL
(Dollars in Thousands) Schedule VIII (continued)
SCHEDULE OF INVESTMENT EXPENSES
Contract Start Date Amount
Operating Expenses
Administrative Costs $48,683
Aon Risk Insurance 989
Council of Institutional Investors 30
Total Operating Expenses 49,702
Subtotal 270,768
Other Investment Expenses
Broker Commissions 27,100
Foreign Tax Withheld 67,984
Real Estate 79
Miscellaneous 12,912
Total Other Investment Expenses 108,075
Total $378,843

106 CALSTRS COMPREHENSIVE ANNUAL FINANCIAL REPORT 2018
Individual or Firm Commission/Fee Nature of Services
State Teachers’ Retirement Plan
Milliman, Inc. $230
Segal Consulting 91
321 Actuarial Services
Crowe LLP 2,676
Grant Thornton, LLP 322
KPMG, LLP 352
Macias, Gini & O’Connell, LLP 182
State Personnel Board 60
3,592 Auditing Services
Accuity, Inc. 82
Acuity Technical Solutions 266
Agile Global Solutions, Inc. 166
Avante Solutions, Inc. 71
Background Profiles, Inc. 11
Bank of America Merrill Lynch, N.A. 13
Business Advantage Consulting, Inc. 322
CEB, Inc. 28
CEM Benchmarking, Inc. 65
CGI Technologies and Solutions, Inc. 14,974
Cloud Services Integrators, Inc. 135
Daniel J. Edelman, Inc. 166
Deloitte Consulting, LLP 3,070
Department of General Services 12
Department Of Human Resources 49
Digital Deployment, Inc. 65
Employment Development Department 57
Entisys 360, Inc. 183
Estrada Consulting, Inc. 306
Eventus Solutions Group, LLC 414
Everyone Counts, Inc. 131
ExamWorks, Inc. 63
Forrester Research, Inc. 82
Gartner, Inc. 272
Global Governance Advisors, LLC 69
GoldLink Pacific, Inc. 1,252
Government Operations Agency 215
Grant Thornton, LLP 855
Hogan Lovells US, LLP 240
Infinite Solutions, Inc. 152
InfoCap Networks, LLC 122
Infojini, Inc. 127
Integrated Consulting and Management 15
IntelliSurvey 43
(Dollars in Thousands) Schedule IX
SCHEDULE OF CONSULTANT AND PROFESSIONAL SERVICES EXPENSES

107FINANCIAL
(Dollars in Thousands) Schedule IX (continued)
SCHEDULE OF CONSULTANT AND PROFESSIONAL SERVICES EXPENSES
Individual or Firm Commission/Fee Nature of Services
International Network Consulting $384
Jaykumar Maistry 169
Jayson Carpenter Photography 10
LexisNexis 24
Linea Solutions, Inc. 850
Macias, Gini & O'Connell, LLP 78
Mailing Systems, Inc. 46
MaritzCX Research, LLC 25
Matthew Bender & Company, Inc. 17
Maximus Human Services, Inc. 1,511
McLagan Partners, Inc. 14
Menlo Technologies, Inc. 67
Meridian Wealth Management 26
MG Systems and Software, LLC 380
Montridge Consulting 162
Mosaic Governance Advisors, LLC 153
National Disability Evaluations, Inc. 39
NTT DATA, Inc. 4,608
O.C. Tanner Recognition Company 40
Oak Technical Services, LLC 369
OnCore Consulting, LLC 376
Pension Benefit Information, LLC 139
Performance Technology Partners, LLC 95
Pinnacle Consulting 229
Providence Technology Group 638
R Systems, Inc. 160
Radian Solutions, LLC 51
Ridge Capital, Inc. 1,166
Robert J. Yetman 48
SAP Public Services, Inc. 821
Sierra Metrics, Inc. 140
Signal Perfection, Ltd. 15
Solutions Simplified 57
State Controller's Office 1,815
State Personnel Board 76
SupportFocus, Inc. 327
Technology Management Solutions 71
The Highlands Consulting Group, LLC 121
Thomas V. Ennis Consulting 184
Thomas/Ferrous, Inc. 83
University Enterprises, Inc. 219
Vasquez & Company, LLP 76
Vector Consulting, Inc. 58
Verizon Business Network Services 158
Visionary Integration Professionals 1,600
41,788 Consulting Services
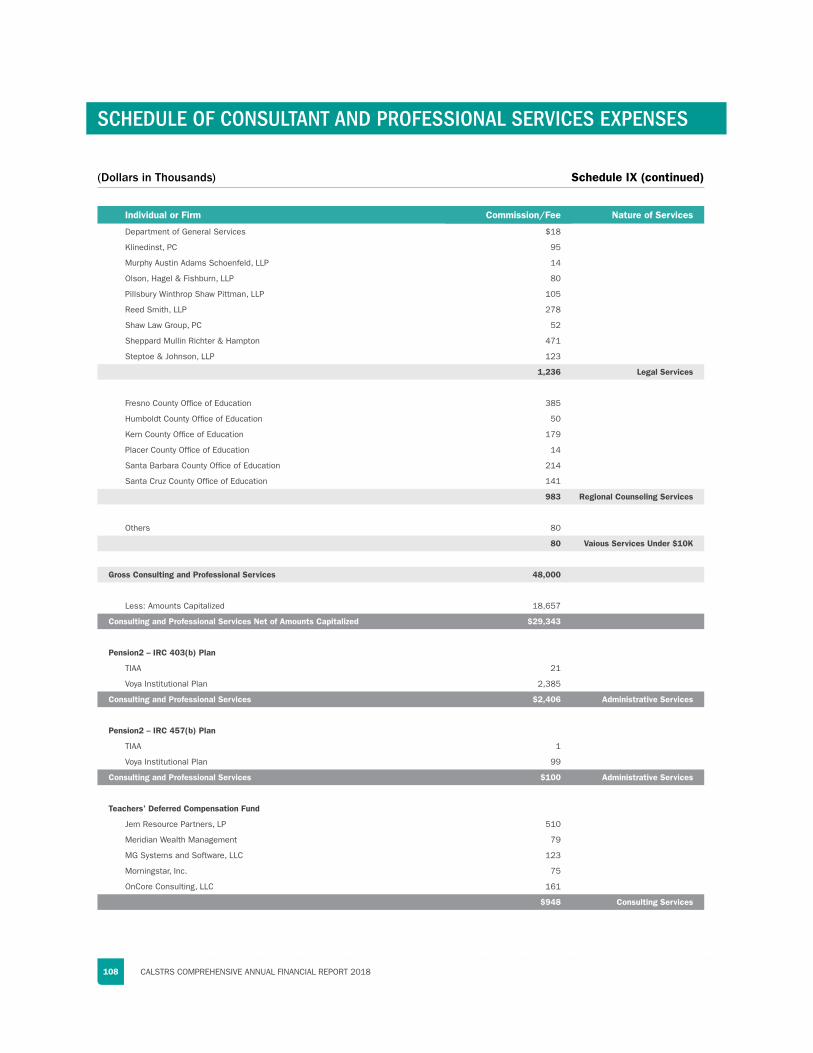
108 CALSTRS COMPREHENSIVE ANNUAL FINANCIAL REPORT 2018
(Dollars in Thousands) Schedule IX (continued)
SCHEDULE OF CONSULTANT AND PROFESSIONAL SERVICES EXPENSES
Individual or Firm Commission/Fee Nature of Services
Department of General Services $18
Klinedinst, PC 95
Murphy Austin Adams Schoenfeld, LLP 14
Olson, Hagel & Fishburn, LLP 80
Pillsbury Winthrop Shaw Pittman, LLP 105
Reed Smith, LLP 278
Shaw Law Group, PC 52
Sheppard Mullin Richter & Hampton 471
Steptoe & Johnson, LLP 123
1,236 Legal Services
Fresno County Office of Education 385
Humboldt County Office of Education 50
Kern County Office of Education 179
Placer County Office of Education 14
Santa Barbara County Office of Education 214
Santa Cruz County Office of Education 141
983 Regional Counseling Services
Others 80
80 Vaious Services Under $10K
Gross Consulting and Professional Services 48,000
Less: Amounts Capitalized 18,657
Consulting and Professional Services Net of Amounts Capitalized $29,343
Pension2 -- IRC 403(b) Plan
TIAA 21
Voya Institutional Plan 2,385
Consulting and Professional Services $2,406 Administrative Services
Pension2 -- IRC 457(b) Plan
TIAA 1
Voya Institutional Plan 99
Consulting and Professional Services $100 Administrative Services
Teachers’ Deferred Compensation Fund
Jem Resource Partners, LP 510
Meridian Wealth Management 79
MG Systems and Software, LLC 123
Morningstar, Inc. 75
OnCore Consulting, LLC 161
$948 Consulting Services

109INVESTMENTS
Investments
111 Investment Consultants’ Reports
114 Table 1 Market Value of Investments
115 Table 2 10 Years of Time-Weighted Annual Returns
115 Table 3 Time-Weighted Returns
116 Table 4 Time-Weighted Returns Net of Fees by Portfolio Types
117 Table 5 Largest Public Equity Holdings
118 Table 6 Largest Fixed Income Holdings
121 Table 7 Investment Summary for the Current and Previous Fiscal Year
121 Table 8 Investment Expenses
122 Table 9 Broker Commissions
The CalSTRS Investment Portfolio generated 9.0 percent absolute return net of manager fees on its investments for the fiscal year ending June 30, 2018.
INVESTMENTS

110 CALSTRS COMPREHENSIVE ANNUAL FINANCIAL REPORT 2018
This page intentionally left blank.

111INVESTMENTS
The CalSTRS Investment Portfolio produced a strong positive absolute return over the latest fiscal year, besting its benchmark return and the median fund return. The portfolio increased by $15.1 billion over the past 12 months, ending with a value of $223.8 billion on June 30, 2018, despite significant net cash outflows during the year. As highlighted below, the CalSTRS portfolio is broadly diversified, holding investments ranging from publicly traded short-term bonds to privately held partnerships. Clearly, the scale and breadth of investments make the management and oversight of these assets highly complex. In light of these factors, CalSTRS has been effective in utilizing its resources in a cost-efficient manner to ensure that benefits continue to flow to CalSTRS participants.
Investment AllocationThe Teachers’ Retirement Board adopts long-term strategic allocation targets to be implemented over several years. The fiscal year-end report reflects strategic allocation guidelines for the 2017-18 fiscal year as adopted by the Board. As of year-end, the portfolio’s actual allocation was slightly different from policy (see table below). As of June 30, 2018, the Real Estate class was slightly overweighted, while Fixed Income and Cash were slightly underweighted. All of these classes were, however, within policy ranges. Moreover, the remaining classes were in-line with policy.
Investment Results (Net of Manager Fees)Over the last year, the CalSTRS portfolio produced an absolute return of 9.0 percent (net of manager fees), ranking in the second quartile among its large public pension fund peers1. During this period, the CalSTRS portfolio results bested the policy benchmark2 return by 40 basis points (top bar chart). Relative outperformance was primarily driven by the Private Markets, Fixed Income, and Inflation Sensitive classes.
During the last three years, the CalSTRS portfolio generated a 7.8 percent average annual return (net of manager fees), ranking in the first quartile among peer funds. Over the last five years, the CalSTRS portfolio produced an average annual return of 9.2 percent, trailing its policy benchmark by 10 basis points per year (bottom bar chart) but ranking in the first quartile among peers. Due in large part to the benchmark not fully reflecting the opportunity set, the Private Equity strategic class was the primary contributor to the relative underperformance versus the benchmark over this period. Overall, these total portfolio results outpaced the CalSTRS actuarial rate of return. Previous fiscal year periods are presented here as well. The CalSTRS Investment Portfolio outperformed its policy benchmark (net of manager fees) in two of the last five fiscal years3.
1 Per State Street Universe of Master Trust Public Funds with assets in excess of $10 billion.
2 The policy benchmark consists of passively managed strategic class portfolios weighted by CalSTRS policy allocations. The difference between actual results and the benchmark are due to two factors: i) deviations from policy, and ii) active decisions on the part of CalSTRS and its investment managers.
3 CalSTRS investment performance is calculated using a daily time-weighted return geometrically linked to calculate a monthly return. Periods longer than one month are geometrically linked to calculate annualized “time-weighted” rates of return.
INVESTMENT CONSULTANTS’ REPORTS
Asset Allocation as of June 30, 2018
CalSTRS Policy CalSTRS Actual*
Cash 2% 1%
Global Equity 54% 54%
Private Equity 8% 8%
Real Estate 12% 13%
Fixed Income 13% 12%
Inflation Sensitive 2% 2%
Risk Mitigating Strategies (RMS)
9% 9%
*Additional assets (<1%) held in the Innovative Strategies and Strategic Overlay classes Note: Allocations may not sum to 100% due to rounding
Last 12 Months Ending June 30 (Net of Mgr Fees)
% R
etur
n
9.0 8.611.7 11.8 11.8 10.1
0.3
-0.20
5
10
15
20
Total GlobalEquity
FixedIncome
PrivateMarkets
CalSTRS Actual Policy Benchmark
Periods Ending June 30 (Net of Mgr Fees)
5 Years 201620172018 2015 20140
5
10
15
20
% R
etur
n
8.5
4.51.8 1.7
InflationSensitive
RMS
9.2 9.3 9.0 8.6
13.4 12.6
1.44.5 4.6
18.3 19.2
2.0

112 CALSTRS COMPREHENSIVE ANNUAL FINANCIAL REPORT 2018
INVESTMENT CONSULTANTS’ REPORTS
M E K E T A I N V E S T M E N T G R O U P
5 7 9 6 A R M A D A D R I V E S U I T E 1 1 0 C A R L S B A D C A 9 2 0 0 8 7 6 0 7 9 5 3 4 5 0 f a x 7 6 0 7 9 5 3 4 4 5 w w w . m e k e t a g r o u p . c o m
BOSTON MA
CHICAGO IL
MIAMI FL
PORTLAND OR
SAN DIEGO CA
LONDON UK
2018 CALSTRS Investment Review
During the fiscal year ending June 30, 2018, the value of CalSTRS’ investments increased from $208.7 billion to $223.8 billion. A positive investment return of 9.0% (net of fees) more than offset the cash outflows to pay for benefits in excess of contributions. We highlight below the portfolio allocation, performance, and investment attribution. The investment portfolio remains well diversified by asset type and geography, in a mix of private and public investments in the United States and abroad.
Asset Allocation
During fiscal year 2017-18, the Teachers’ Retirement staff continued to spend time moving assets systematically toward the new Asset Allocation Policy that was adopted during the previous fiscal year, specifically within the RMS portfolio.
Most asset class allocations were very close to targets at fiscal year-end, with 54% of assets in Global Equity, 12% in Fixed Income, 8% in Private Equity, 13% in Real Estate, 9% in Risk Mitigating Strategies, 1% in Cash, 2% in Inflation Sensitive, and well under 1% in Innovative Strategies.
Investment Performance and 2018 Fiscal Year Market Environment Overview
The fiscal year was largely a story of two environments. In 2017, we saw synchronized global growth, low volatility, tax cuts in the U.S. at year-end, and a weak U.S. dollar. During the last two quarters of 2017 most asset classes were up, particularly riskier ones. Emerging markets lead the way in Q3 (+7.9%1) and Q4 (+7.4%1). U.S. and international equities also posted strong returns over both quarters, while fixed income assets were modestly up.
The trends of 2017 persisted into early 2018, but the environment quickly changed. In 2018, we have seen volatility increase from its very low levels, interest rates and inflation rise, the U.S. dollar rebound, and trade tensions between the U.S. and others heat-up. In this environment, U.S. equities were one of the few asset classes to produce positive returns, while international equities and most fixed income asset classes fell. High yield bonds did post a modest gain (+0.2%2) in the first two quarters of 2018.
The net result of the two environments on the fiscal year returns ending June 2018 was that equities increased, particularly in the U.S, while in fixed income TIPS and high yield bonds posted relatively modest returns and the broad U.S. bond market slightly declined. Emerging market bonds fell.
1 MSCI Emerging Markets Index. 2 Barclays High Yield.
1 MSCI Emerging Markets Index. 2 Barclays High Yield.
2018 CalSTRS Investment Review���������� ����������������������������������������������� �!����� "�� ������� ������"�#���$%�&���������#���$��&������$�'�(� ��������� "������������)$�*�+��������� ,�"��������- ������ ���.�/ ���(�������&���� �����0�� ���������&���� $�1��������&���/���(�������������������(�����"�������������� "������&����$�������� "���(����������"��� �/��������� �����&��� ���(������������(��������"�0����(����������(�&�������� "�� ������2�������� ������&����$
Asset Allocation�������� ������������%3������������ !� ����"��� �-������������ (�����"��"������� � � � �"���������/��������/�' ��'���������4��������/� ����(������������(������ �� ���������� (����������/������ 5��(�������$
5� �� ����� ���������� �/������������ �������� ���� ��������3�����/��67*����� � ����8��&���9:�������*����;�0���<���"����*����4������9:�������*���� ����9 ����)*���� � =�5��������������� ���*������ ���*����<�.�������� ����������/�����������*����<���������������� $
T��� ���������/� ����������� �������/���������"�� $�<�����%��/�� �/� �������>������&������/����/������������0��� ������2$�$�������3�����������/��=�2$�$�������$������������ �/��:����� �������%�"� �� ����� � �/�����(��(������������� =������� $�9"�������"��=� ��������/������?��+@%$)*�,�����?7�+@%$7*�,$�2$�$������������������:���� ��� ��(� ��� ���������� ������&��:����� ��/�����0�������"��� � �/����"��� ����($
������� �������%�(�� � �������������������&�����������"���:���=���������$�<��������/������ ������������������� �����"�� ��������/������ ������� ���� �������.������� �����2$�$����������&����������������� ��� �&�/������2$�$�������� ���3�($�<��� ��������"����2$�$��:���� �/���������������/�� ����� � ���(�������(� ���������� ��/�����������������:���� �����"� ��0�������"��� ����� � �����$�A���������&��� �����(� ���"��� ������+@�$�*�,�������� �/��:����� ��������$
�������� ��������/���������"�� ������� �������������� ������������������/� ����:���� ������� ����(����������������2$���/��������0�������"���<4���������������&��� �(� �������������"��� ������ �������&�����2$�$�&����"��=�� ��������������$�9"�������"��=��&��� �����$�
;������ ����������2$�$��:���� ��� ���(�� �����&���� � ������������ ��@�7$�*$������������2$�$����/� ��= ���(�����"���������� ��= �(�� � �������� "������(����>����� ��= �+@�%$B*,���(�����"�����������(����>�����+@�7$6*,�����"��3��(����>�����+@��$�*,� ��= $����5��<�9';9����(�� ��������������������(���"��=� �����/����� �����������������2$�$��:���� ���(�@B$�*$�9"�������"��=���:���� !� ���������� �������%�/����&��������&������$�*�������������� ������:���������������� ��� ������������������������� ��� �/����������� �� $����5��<�9"�������5��=� �9:��������0��������@�$�*������������� ��������$
Investment Performance and 2018 Fiscal Year Market Environment Overview

113INVESTMENTS
INVESTMENT CONSULTANTS’ REPORTS
1�����0�������"���(� ���������� �����������/��:����� �������%�"�������������� �������� ��������� ���� �������.�����������������/��� ��������$�<����2$�$����;������� � ����������� �������� ���� ������� ������"������������������������$%6*����$��*������������������������� �&������� ��$�������������� � ������&��������.������������2$�$����������������������� ��������$�C���������������������<4��+@�$�*,��������������&��� �+@�$B*,������� ����/������&�����2$�$�&����"��=�����(�� �����&����D������ �'��������<���0��������$7*$���"��������"�������"��=���:���� ������� ������"�������"��=��&��� ������ ������:��������������/������������ ����������� �� $�<��� ��� ���"�������"��������� �����$7*�������������� ������:�����������"�������"��=��&��� �+� ���(�� �����&���45�8D<395�8��&�������� �����E�F�������������,���������3�$�*�������������������������$
1��������� ����� � ����������� ������ ��= �+�G4�8��&���H������ � ����� �<���0,��� ��@�7$�*���""����� �+D���"&������""�����<���0,��������@%$7*������ 9<���+5��<�2$�$� 9<��<���0,��������@�$B*$�C���(���� ���� ������ ����������������#B�I&���������(�� �����������"���������� �����"�������������/ $��� ����"�C49������ ��������/����&����������&���������� ���������(���� $
����������
��(���4$�5��������;' 5��������4�����(��

114 CALSTRS COMPREHENSIVE ANNUAL FINANCIAL REPORT 2018
Investment values and the related returns for the CalSTRS Investment Portfolio (Total Fund) are presented differently within the Investments and Financial sections of the CAFR for various reasons; therefore, the reader needs to understand the methodology presented in each section. In the following pages, news releases and on CalSTRS website, the investment values and related returns are presented using common investment industry practices that reflect the way in which CalSTRS manages its investment portfolio. The presentation based on investment industry practices provides timely information that is easily compared to benchmarks and peer results.
Within the Financial Section, the same information is reported in accordance with U.S. Generally Accepted Accounting Principles. The primary difference between the presentations is the categorization of the investments. Additional differences result from the timing of recognition of performance for certain investments in the portfolio. In accordance with investment industry practices, private asset performance is reported with a quarter lag; for financial reporting purposes, adjustments are made to bring results current. Both sets of numbers are relevant but reflect different methodologies and serve different purposes.
Table 1 Market Value of Investments (Fiscal years ended June 30)
INVESTMENTS
$191,409 $188,651
$118,875
$150,611
$165,820
$189,080
$ M
illio
ns
2009 2010 2011 2012 2013 2014 2015 2016 2017 2018
$129,961
$155,513
$208,700$223,829
Global Equity 53.7%
*Strategic Overlay consists of the Currency Management Program and Derivative Overlay.
Risk Mitigating Strategies 8.9%
Innovative Strategies 0.2%
Inflation Sensitive 1.9%
Private Equity 8.2%
* Strategic Overlay 0.6%
Cash 1.4%
Real Estate 12.8%
Fixed Income 12.3%
Asset Allocation as of June 30, 2018
Total Investment Portfolio of $223.8 billion

115INVESTMENTS
Performance information in this section is reported net of fees and is calculated using a time-weighted return methodology. Also, the investment information on the CalSTRS website is reported consistent with investment industry standards and is comparable to the global financial markets and other pension plans and institutional investors. For more information, see CalSTRS.com.
CalSTRS Investment Portfolio performed above standards due to a very strong second half of the fiscal year and shifts to a more global portfolio. In the 2017–18 fiscal year, CalSTRS generated 8.99 percent return net of fees, well above the 7.00 percent actuarial rate of return for funding purposes, above the policy benchmark of 8.65 percent, and near the top of all public pension plans in the U.S.; however, one year is a very short time period when you have a 30-year investment horizon. As a long-term investor it is much more
meaningful to review the CalSTRS investment performance over longer time periods. At June 30, 2018, the investment portfolio generated 7.81 percent return net of fees over the past three years, 9.15 percent over the last five years and 6.50 over the past 20 years. Compared to other U.S. public pensions plans, CalSTRS investment returns ranked in the top quartile over three and five years ending June 30, 2018.
While this annual report provides a significant amount of information regarding the CalSTRS Investment Portfolio, it only represents one point in time: June 30, 2018. It is difficult to compare this time measurement to the movement and complexity of the investment portfolio in this highly dynamic global financial market. For more current investment information, as well as videos detailing key aspects of the investment portfolio, see CalSTRS.com.
INVESTMENTS
Total Fund (Net of Fees)
Assumed Actuarial Rate*
20152009 2010 2011 2012 2013 2014 2016 2017
25
20
15
10
5
–0
–5
–10
–15
–20
–25
–30
22.83
1.59
13.55 13.44
18.30
1.35
(25.08)
11.95
4.52
% R
etu
rn
8 8 7.75 7.5 7.5 7.5 7.5 7.5 7.25
* Rate used for funding purposes.
8.99
7
2018
Table 2 10 Years of Time-Weighted Annual Returns (Fiscal years ended June 30)
Total Fund (Net of Fees)
Custom Benchmark*
% R
etu
rn
1 Year 3 Years 5 Years 10 Years 20 Years
0
2
4
6
8
10
12
14
8.998.65
7.81 7.67
9.159.26
6.307.15
6.50 6.51 * Policy weighted blend of asset class benchmarks.
Table 3 Time-Weighted Returns (as of June 30, 2018)

116 CALSTRS COMPREHENSIVE ANNUAL FINANCIAL REPORT 2018
Portfolio Type/Associated Index1 1 Yr 3 Yr 5 Yr 10 Yr
Global Equity 11.67 9.24 10.84 7.60
Global Equity Custom Index2 11.83 9.21 10.76 7.57
U.S. Equity 15.42 11.63 13.39 10.12
Russell 3000 Custom Index 15.30 11.60 13.33 10.17
Non-U.S. Equity 8.19 5.93 6.63 3.05
MSCI All Country World Index ex-U.S. Custom Investable Market Index 7.98 5.27 6.12 2.53
Fixed Income 0.26 2.36 2.97 4.47
U.S. Debt Custom Index3 (0.24) 1.91 2.43 3.96
Real Estate 10.50 9.90 10.77 1.50
Real Estate Custom Index4 7.11 9.00 10.42 6.29
Private Equity 13.82 11.12 12.35 8.82
Private Equity Custom Index5 14.66 10.50 12.97 11.28
Inflation Sensitive 8.51 7.24 5.37 —
Inflation Sensitive Custom Index6 4.50 4.50 4.47 —
Risk Mitigating Strategies7 1.78 (2.92) 0.19 —
Risk Mitigating Strategies Custom Index8 1.71 (2.55) (0.94) —
Innovative Strategies9 11.44 5.77 3.64 —
Innovative Strategies Custom Index10 6.51 6.30 4.17 —
Cash/Liquidity11 1.61 1.25 0.93 0.20
Bloomberg Barclays Capital 3-Month Treasury Bill 1.37 0.69 0.44 0.38
CalSTRS’ investment performance is calculated using a daily time-weighted return geometrically linked to calculate a monthly return. Periods longer than one month are geometrically linked to calculate annualized ’time-weighted’ rates of return. Custom public indices are updated quarterly in accordance with CalSTRS restricted securities list. Exclusions include tobacco, illegal California firearms, geopolitical and thermal coal companies. 1 Index benchmarks are as of June 30, 2018 and are subject to be updated based on changes within the portfolio policies. For additional information on benchmarks, please refer to the respective investment policies at CalSTRS.com.2 Custom weighted blend of MSCI All Country World Index ex-U.S. Investable Market and Russell 3000 custom indices.3 95% Bloomberg Barclays U.S. Aggregate + 5% Bloomberg Barclays U.S. High Yield 2% Issuer Capped custom indices. 4 NCREIF ODCE Value Weighted Index net of fees qtr lag. Previously NCREIF Property Index qtr lag through June 2013.5 Weighted blend of the underlying sub-asset components. Previously, Russell 3000 Custom Index qtr lag + 3% from July 2008 through June 2014.6 Weighted blend of Bloomberg Barclays Global Inflation Linked Series L Index, Alerian MLP Daily Index and CPI+4% qtr lag. Previously, a weighted blend of Bloomberg Barclays Global Inflation Linked Series L Index and CPI+4% qtr lag from July 2014 to April 2016. Prior to July 2014, weighted blend of Bloomberg Barclays Global Inflation Linked Series L Index and CPI+5% qtr lag.
7 New asset class approved by the board in November 2015 and established in July 2016. Prior to July 2016, the assets in this program were part of Absolute Return. 8 Weighted blend of Bloomberg Barclays U.S. Treasury 20+year Total Return Index, SG Trend Index, HFRI Macro: Discretionary Thematic Index and the Eurekahedge MF Risk Premia Index.9 Prior to July 2016, this investment strategy was part of Absolute Return. Returns prior to the restructure reflects the historical Absolute Return performance.10 Weighted blend of 60% MSCI EAFE + Canada/ 40% BarCap U.S. blended and Bloomberg Barclays Capital 3-Month Treasury Bill. Previously, a weighted blend of 60% MSCI EAFE + Canada/
40% BarCap U.S. blended, Custom Tactical index and Bloomberg Barclays Capital 3-Month Treasury Bill from July 2016 to December 2016. Returns prior to July 2016 reflects Absolute Return historical performance.
11 Includes the Securities Lending Program loss incurred in FY 2008-2009 and subsequent income earned through December 2013.
Table 4 Time-Weighted Returns Net of Fees by Portfolio Types (as of June 30, 2018)
INVESTMENTS

117INVESTMENTS
INVESTMENTS
Global Equity For the fiscal year ending June 30, 2018, the $120.3 billion Global Equity Portfolio represented 53.7 percent of the Total Fund. Approximately half of the portfolio’s assets are internally managed in passively implemented index strategies, and the remaining assets are managed by external investment managers. As of June 30, 2018, the portfolio had 54 percent of its assets in U.S. equity and 46 percent in non-U.S. equity.
As shown on Table 4, the Global Equity Portfolio generated 11.67 percent one year return net of fees, trailing
its policy benchmark by 16 basis points. The relative underperformance was attributable to the portfolio’s exposure to governance funds whose deep value strategies struggled to keep up in a market environment that primarily rewarded growth-oriented stocks.
Table 5 lists the largest public equity holdings as of June 30, 2018, which represents 9.3 percent of the Global Equity Portfolio.
For more information about the Global Equity Portfolio, please refer to the Investments section at CalSTRS.com.
Table 5 Largest Public Equity Holdings (as of June 30, 2018) (CalSTRS maintains a complete list of portfolio holdings)
Security Name Shares Market Value
APPLE INC 10,134,316 $1,875,963,235
MICROSOFT CORP 16,671,931 1,644,019,116
AMAZON.COM INC 905,740 1,539,576,852
ALPHABET INC 1,289,303 1,447,195,197
FACEBOOK INC A 5,165,665 1,003,792,023
JOHNSON + JOHNSON 6,428,737 780,062,948
EXXON MOBIL CORP 9,256,525 765,792,313
BERKSHIRE HATHAWAY INC CL B 4,063,074 758,372,762
JPMORGAN CHASE + CO 7,057,703 735,412,653
SAMSUNG ELECTRONICS CO LTD 15,024,733 628,895,284
Corporate GovernanceFor the fiscal year ending June 30, 2018, the Corporate Governance Portfolio had approximately $6.0 billion of assets under management, which include the governance and sustainability funds and low carbon index within the Global Equity Portfolio. The governance funds invest in companies with poor governance structures and engage management to improve governance and enhance long-term shareholder value. The sustainability funds integrate environmental, social and governance (ESG) factors into their long-term investment strategy to deliver market outperformance. Lastly, the low carbon index strategies managed internally focus on an index designed to have significantly lower exposures to carbon emissions and to fossil fuel reserves than the broad market. The Corporate Governance Portfolio had a one year return net of fees of 9.62 percent.
CalSTRS believes voting proxies is an important fundamental shareholder right, and staff always exercises our rights in a manner consistent with the interests of our beneficiaries, California public school teachers. We believe we can use our proxy votes to affect necessary changes designed to enhance the company’s long-term value. Over the course of each year, CalSTRS votes approximately 8,000 proxies, with more than half of them being voted during U.S. proxy season, which occurs in the months of April, May and June.
When voting proxies, CalSTRS follows our Corporate Governance Principles, which can be found at CalSTRS.com. These principles, which serve as guidelines for our proxy voting, consider best corporate governance practices on topics such as the board of directors, auditors, executive and director compensation, compensation plans and governance structure.

118 CALSTRS COMPREHENSIVE ANNUAL FINANCIAL REPORT 2018
INVESTMENTS
During fiscal year 2017–18, CalSTRS voted on 83,828 proposals at 8,613 meetings held by companies in our Global Equity Portfolio, which represented 5.0 percent increase from the 79,782 proposals voted in the prior fiscal year. These meetings resulted in CalSTRS voting on proposals covering a variety of topics, including director elections, auditor ratifications, advisory votes on executive compensation, compensation plans, mergers and acquisitions, and shareholder proposals. For additional information on shareholder voting, please refer to the Corporate Governance Annual Report available at CalSTRS.com.
CalSTRS believes the overall market continues to demonstrate improved governance with many large companies reflecting governance best practices. These companies are also engaging shareholders on various issues, including executive compensation, board composition, and ESG concerns during the proxy off-season. However, there are some companies that continue to demonstrate suboptimal governance and, because of this, CalSTRS will continue to use our proxy votes to enhance their long-term shareholder value.
For additional information on the Corporate Governance program, please refer to the Corporate Governance section at CalSTRS.com.
Fixed Income For the fiscal year ending June 30, 2018, the Fixed Income Portfolio had total assets of $27.5 billion representing 12.3 percent of the Total Fund. The Fixed Income Unit operates a hybrid model portfolio that takes advantage of the benefits and efficiencies of both internal and external asset management. Eighty-four percent of the portfolio’s assets are managed by internal staff using enhanced core and high yield strategies with a moderate level of risk. The remaining 16 percent is managed by external managers using broader opportunistic strategies which assume a higher level of risk and therefore a higher level of expected return.
As shown on Table 4, the Fixed Income Portfolio generated 0.26 percent one year return net of fees, outperforming its benchmark by 50 basis points. The three, five and 10 year net returns were positive and have outperformed the benchmark by 45, 54 and 51 basis points, respectively. The portfolios overweight to credit, both investment grade and high yield, accounted for much of the outperformance.
Table 6 lists the largest fixed income holdings as of June 30, 2018, which represents 9.9 percent of the Fixed Income Portfolio.
The Fixed Income Unit manages two additional programs: Securities Lending and Currency Management discussed in the next two sections. For more information about the Fixed Income Portfolio, refer to the Investments section at CalSTRS.com.
Security Name Maturity Date Interest Rate Par Value Market Value
US TREASURY N/B 6/15/20 1.500% $340,000,000 $333,346,197
US TREASURY N/B 5/15/21 2.625 305,000,000 305,057,965
US TREASURY N/B 11/30/24 2.125 300,000,000 288,095,994
US TREASURY N/B 2/28/21 1.125 295,000,000 283,854,900
US TREASURY N/B 2/15/47 3.000 278,250,000 279,229,454
US TREASURY N/B 12/31/23 2.250 270,000,000 262,890,892
US TREASURY N/B 5/15/44 3.375 245,000,000 262,382,752
US TREASURY N/B 5/15/47 3.000 245,520,000 246,261,475
US TREASURY N/B 3/31/24 2.125 246,363,500 237,829,476
US TREASURY N/B 1/31/19 1.125 235,000,000 233,538,295
Table 6 Largest Fixed Income Holdings (as of June 30, 2018) (CalSTRS maintains a complete list of portfolio holdings)

119INVESTMENTS
INVESTMENTS
Securities Lending ProgramThe Securities Lending Program is a low-risk strategy that allows the fund to use its existing asset base and lending expertise to generate additional income. For the fiscal year ended June 30, 2018, the Securities Lending Program earned approximately $98.1 million in additional net income for the fund, which was an increase of just under a million dollars over the previous year. The increase in earnings is attributed to several factors: increased utilization of U.S. treasuries over the past year, increased balances from rising equity markets and a generally improving fixed income intrinsic rate over the year. For additional information on the Securities Lending Program, refer to the Investments section at CalSTRS.com.
Currency Management Program The Currency Management Program is designed to address the global nature of all the fund’s assets and attempts to add value on a fund-wide basis. The currency markets are some of the most liquid and volatile markets CalSTRS operates within. The internally managed core strategy underperformed by 1.6 basis points for the year ending June 30, 2018, while the opportunistic external strategy underperformed by over 59 basis points for the same period. For the internally managed portion, returns were roughly flat as currency valuations were left largely unchanged on the year. For the externally managed program, some of the detracted performance can be attributed to an overall underperformance of carry and commodity currencies, in which the managers were generally long on those currencies. Since inception, the Currency Management Program has outperformed its benchmark by nearly 45 basis points on an annualized basis.
Home Loan Program The CalSTRS Home Loan Program was established by legislation in 1984 and provided home ownership to qualified participants, which attributed to CalSTRS’ investment mortgage asset objectives. New home loan origination activity was suspended by the board on October 1, 2011. Staff continues to manage the existing assets of $58.5 million for the fiscal year ending June 30, 2018, within the Fixed Income Portfolio.
Private EquityThe Private Equity Portfolio ended the June 30, 2018, fiscal year with a market value of $18.3 billion or 8.2 percent of the Total Fund. The portfolio consists primarily of investments in limited partnerships, which accounts for 93.1 percent of the allocation with the remaining assets consisting of co-investments.
As shown in Table 4, the Private Equity Portfolio generated 13.82 percent one-year return net of fees and 11.12 percent three-year return net of fees, underperforming its policy benchmark by 84 basis points and outperforming by 62 basis points, respectively. The portfolio has underperformed its benchmark for the five-year and 10-year periods, primarily due to the reasons described in the following paragraph.
Private Equity is difficult to benchmark; the CalSTRS Private Equity Portfolio benchmark has changed twice over the past decade. Regarding the longer term performance metrics, the benchmark for these periods includes a large component linked to public equity market performance plus a spread. Given the abnormally strong performance of public equity markets in the wake of the global financial crisis of 2008, it is neither surprising nor atypical that the CalSTRS Private Equity Portfolio is underperforming such a benchmark. Regarding the short-term performance metrics, the Private Equity Portfolio has substantially increased its investment pace over the past two years and therefore J-curve affects are influencing performance.
For current information on the CalSTRS Private Equity Portfolio, please refer to the Investments section at CalSTRS.com.
Real EstateThe Real Estate Portfolio ended fiscal year 2017–18 with a market value of $28.7 billion or 12.8 percent of the Total Fund. Over the last several years, staff has emphasized an increase in joint ventures, separate accounts and open ended funds in order to increase internal management control and lower fees. As of June 30, 2018, these strategies combined made up 82.4 percent of the Real Estate Portfolio. In addition, staff has emphasized an increase in investments in core and value-add strategies. The core strategy has reached its policy target of 60 percent.

120 CALSTRS COMPREHENSIVE ANNUAL FINANCIAL REPORT 2018
INVESTMENTS
Real Estate is a long-term asset with performance results influenced by various factors. As shown on Table 4, the Real Estate Portfolio generated 10.50 percent one-year return net of fees outperforming its policy benchmark by 339 basis points. The 10-year underperformance is due to a historical over weight in pre-crisis higher risk strategies. The bulk of those investments have been liquidated. Staff is focused on increasing investments in higher control vehicles with low to moderate leverage and risk. Investments that staff has recommended since the global financial crisis of 2008 have outperformed the benchmark in all time periods.
For current information on the CalSTRS Real Estate Portfolio, please refer to the Investments section at CalSTRS.com.
Inflation SensitiveFor the fiscal year ending June 30, 2018, the $4.2 billion Inflation Sensitive Portfolio represented 1.9 percent of the Total Fund. The Inflation Sensitive Portfolio invests in strategies that include infrastructure, commodities, U.S. treasury inflation protected securities, timberland and agriculture. The long-term allocation target, as set by the board in April 2016, for the Inflation Sensitive Portfolio is 4 percent of the Total Fund.
For the fiscal year ending June 30, 2018, the Inflation Sensitive Portfolio generated an 8.51 percent one–year return net of fees, outperforming its policy benchmark return of 4.50 percent by 401 basis points. The outperformance can be attributed to the continued execution of the infrastructure strategy, which includes investments across a variety of risk characteristics which provide essential services in businesses with high barriers to entry. Also, this strategy has begun to enter a more mature phase and is beginning to achieve greater cash flow potential.
The infrastructure strategy returned a net 12.1 percent, beating its benchmark by 629 basis points. The commodities strategy returned a net 7.8 percent, beating its benchmark by 196 basis points. The U.S. treasury inflation protected securities strategy had a net return of 2.2 percent, besting its benchmark by 38 basis points. The timberland and agriculture strategies had less than one year of performance since inception and are in their development stage. Over the previous three-years, the Inflation Sensitive Portfolio outperformed its benchmark by 274 basis points.
For more information about the Inflation Sensitive Portfolio, refer to the Investments section at CalSTRS.com.
Risk Mitigating StrategiesFor the fiscal year ending June 30, 2018, the Risk Mitigating Strategies (RMS) Portfolio had total assets of $20.0 billion representing 8.9 percent of the Total Fund. The RMS Portfolio was established on July 1, 2016, with a long-term target allocation of 9.0 percent of the Total Fund. Prior to this, the assets in this program were part of the Absolute Return Portfolio. The RMS Portfolio invests in strategies that further diversify CalSTRS’ overall investment portfolio and primarily its significant equity exposure. These strategies include trend following, long-duration U.S. Treasuries, global macro and systematic risk premia. Rather than focusing on achieving a specific return objective, the RMS Portfolio is expected to help the Total Fund achieve its return objective by protecting capital during extended equity downturns or volatile periods.
The RMS portfolio generated a positive 1.78 percent one- year return net of fees for the fiscal year ending June 30, 2018, slightly outperforming its policy benchmark by 7 basis points. The outperformance is due to strong positive relative performance from global macro and a slight positive relative contribution from long-duration U.S. Treasuries. This was almost fully offset by negative relative performance from trend following. The long-term returns for the RMS portfolio are expected to be positive and exhibit low correlation to equity markets.
For more information about the RMS Portfolio, refer to the Investments section at CalSTRS.com.
Innovative StrategiesFor the fiscal year ending June 30, 2018, the $483.1 million Innovative Strategies Portfolio represented 0.2 percent of the Total Fund. The objective of this portfolio is to help mitigate the Total Fund’s dependency on economic growth and low inflation to meet long-term expectations. This is achieved by incubating and graduating new strategies expected to diversify the risk of the Total Fund while providing attractive real returns over a market cycle. The framework will help improve CalSTRS’ investment process and provide tools to mitigate the impact of a severe macroeconomic or market event. As shown on Table 4, for the fiscal year ending June 30, 2018, the Innovative Strategies Portfolio generated 11.44 percent one-year return net of fees outperforming its policy benchmark of 6.51 percent. With the graduation of RMS into its own asset class in July 2016, returns longer than one year reflects the historical Absolute Return Portfolio performance. For more information about the Innovative Strategies Portfolio, refer to the Investments section at CalSTRS.com.

121INVESTMENTS
INVESTMENTS
June 30, 2017
Portfolio Type Book Value Net Asset Value
Global Equity $91,730 $117,746
Fixed Income 30,818 30,725
Private Equity 19,558 16,911
Real Estate 27,056 26,230
Inflation Sensitive 2,615 2,760
Risk Mitigating Strategies 11,697 10,657
Innovative Strategies 317 413
Strategic Overlay 301 200
Cash 3,054 3,058
PORTFOLIO TOTAL $187,146 $208,700
Adjustments:
Securities Lending Collateral 18,191
Accruals 2,387
Cash & Cash Equivalent (459)
STRP PLAN ASSETS-INVESTMENTS $228,819
June 30, 2018
Book Value Net Asset Value % of Net Asset Value Net Value Change
$92,286 $120,282 53.7% $2,536
28,612 27,495 12.3 (3,230)
21,338 18,316 8.2 1,405
28,956 28,733 12.8 2,503
3,876 4,178 1.9 1,418
20,576 19,990 8.9 9,333
348 483 0.2 70
918 1,288 0.6 1,088
3,057 3,064 1.4 6
$199,967 $223,829 100% $15,129
21,932
1,622
(153)
$247,230
Table 7 Investment Summary for the Current and Previous Fiscal Year (Dollars in Millions)
Table 7 represents the investment summary by portfolio type and the comparative totals between current and prior year.
Portfolio Type Net Asset Value Investment Expenses* Basis Points
Global Equity $120,281,611 $197,050 16.4
Fixed Income 27,494,646 20,249 7.4
Private Equity 18,316,311 9,723 5.3
Real Estate 28,733,081 17,075 5.9
Inflation Sensitive 4,177,378 1,998 4.8
Risk Mitigating Strategies 19,989,905 15,687 7.8
Innovative Strategies 483,137 150 3.1
Strategic Overlay 1,288,323 8,888 **
Cash 3,064,376 948 3.1
Total Assets and Expenses $223,828,768 $271,768 12.1
Table 8 Investment Expenses July 1, 2017, through June 30, 2018 (Dollars in Thousands)
Table 8 summarizes the investment expenses by portfolio types for the fiscal year ending June 30, 2018.
* Investment Expenses reflected in this table generally represent direct costs associated with investing. Certain expenses including carried interest and management fees related to private assets are not included; however, these certain expenses may be reflected within the net asset value.
** Strategic Overlay calculates basis points using notional values instead of net asset values.

122 CALSTRS COMPREHENSIVE ANNUAL FINANCIAL REPORT 2018
Broker Name Commission Shares Commission Per Share (Avg)
CITIGROUP $3,597,415 1,055,112,494 $0.003
INSTINET 2,303,786 981,406,843 0.002
MERRILL LYNCH 2,274,990 850,286,825 0.003
J P MORGAN 2,072,872 567,983,423 0.004
GOLDMAN SACHS 2,072,486 668,565,700 0.003
MORGAN STANLEY 1,506,759 601,227,110 0.003
UBS 1,472,749 664,713,538 0.002
CREDIT SUISSE FIRST BOSTON 1,363,586 813,853,402 0.002
BARCLAYS CAPITAL 784,771 108,467,405 0.007
STATE STREET BANK AND TRUST CO 665,773 168,746,797 0.004
ALL OTHER BROKERS 8,984,653 2,351,727,138 0.004
TOTAL COMMISSIONS $27,099,840 8,832,090,675 $0.003
INVESTMENTS
Table 9 Broker Commissions July 1, 2017, through June 30, 2018
Table 9 summarizes the broker commissions for the fiscal year ending June 30, 2018.

123INVESTMENTS
This page intentionally left blank.

124 CALSTRS COMPREHENSIVE ANNUAL FINANCIAL REPORT 2018
Defined Benefit (DB) Program and Schedules
127 Actuary’s Certification Letter—DB Program
130 Actuarial Methods
131 Actuarial Assumptions
131 Changes Since Prior Valuation
131 Valuation Results
132 Independent Actuarial Review
132 Summary of Defined Benefit Program Provisions
136 Table 1 Postretirement Mortality for Sample Ages
136 Table 2 Probabilities of Retirement for Sample Ages
136 Table 3 Probabilities of Withdrawal from Active Service Before Age and Service Retirement for Sample Duration in Years
136 Table 4 Probabilities of Refund by Sample Duration in Years of Members and Sample Entry Ages
137 Table 5 Assumption for Pay Increases Due to Promotions and Longevity for Sample Ages in Years
137 Table 6 Economic Assumptions
137 Table 7 Mortality Assumptions
138 Table 8 Disability Rates for Sample Ages
138 Table 9 Supplemental Assumptions
139 Table 10 Schedule of Active Member Valuation Data
139 Table 11 Schedule of Retired Members and Beneficiaries Added to and Removed from Rolls
140 Table 12 Solvency Test
140 Table 13 Analysis of Financial Experience
141 Table 14 Schedule of Funding Progress
CalSTRS administers retirement, disability and survivor benefits for
California’s 986,414 public school educators (from pre-kindergarten through community college) and their beneficiaries.
ACTUARIAL

125ACTUARIAL
ACTUARIAL
Defined Benefit Supplement (DBS) Program and Schedules
142 Actuary’s Certification Letter —DBS Program
144 Actuarial Methods
144 Actuarial Assumptions
145 Changes Since Prior Valuation
145 Valuation Results
145 Independent Actuarial Review
145 Summary of Defined Benefit Supplement Program Provisions
147 Table 1 Postretirement Mortality for Sample Ages
147 Table 2 Probabilities of Retirement for Sample Ages
147 Table 3 Probabilities of Withdrawal from Active Service Before Age and Service Retirement for Sample Duration in Years
148 Table 4 Assumption for Pay Increases Due to Promotions and Longevity for Sample Ages in Years
148 Table 5 Economic Assumptions
148 Table 6 Mortality Assumptions
149 Table 7 Disability Rates for Sample Ages
149 Table 8 Schedule of Active Member Valuation Data
150 Table 9 Schedule of Retired Members and Beneficiaries Added to and Removed from Annuity Rolls
150 Table 10 Solvency Test
151 Table 11 Analysis of Financial Experience
151 Table 12 Schedule of Funding Progress
Cash Balance Benefit (CBB) Program and Schedules
152 Actuary’s Certification Letter—CBB Program
154 Actuarial Methods
154 Actuarial Assumptions
155 Changes Since Prior Valuation
155 Valuation Results
155 Independent Actuarial Review
155 Summary of Cash Balance Benefit Program Provisions
158 Table 1 Postretirement Mortality for Sample Ages
158 Table 2 Probabilities of Retirement for Sample Ages

126 CALSTRS COMPREHENSIVE ANNUAL FINANCIAL REPORT 2018
Cash Balance Benefit (CBB) Program and Schedules (continued)
158 Table 3 Probabilities of Withdrawal from Active Service Before Age and Service Retirement for Sample Duration in Years
159 Table 4 Assumption for Pay Increases Due to Promotions and Longevity for Sample Ages in Years
159 Table 5 Economic Assumptions
159 Table 6 Mortality Assumptions
160 Table 7 Disability Rates for Sample Ages
160 Table 8 Schedule of Active Participant Valuation Data
161 Table 9 Schedule of Retired Participants and Beneficiaries Added to and Removed from Annuity Rolls
161 Table 10 Solvency Test
162 Table 11 Analysis of Financial Experience
162 Table 12 Schedule of Funding Progress
Medicare Premium Payment (MPP) Program and Schedules
163 Actuary’s Certification Letter—MPP Program
165 Actuarial Methods
165 Actuarial Assumptions
166 Changes Since Prior Valuation
166 Valuation Results
166 Independent Actuarial Review
166 Summary of Medicare Premium Payment Program Plan Provisions
167 Benefits Paid
168 Table 1 Postretirement Mortality for Sample Ages
168 Table 2 Probabilities of Retirement for Sample Ages
168 Table 3 Probabilities of Withdrawal from Active Service Before Age and Service Retirement for Sample Duration in Years
169 Table 4 Probability of Refund
169 Table 5 Economic Assumptions
169 Table 6 Mortality Assumptions
169 Table 7 Service Retirement for Sample Ages
169 Table 8 Disability Rates for Sample Ages
170 Table 9 Schedule of Medicare Part A Enrollment Rates
170 Table 10 Schedule of Retired Members Added to and Removed from Medicare Part A Premium Rolls
171 Table 11 Solvency Test
171 Table 12 Analysis of Financial Experience
172 Table 13 Schedule of Funding Progress
ACTUARIAL

127ACTUARIAL
1301 Fifth Avenue Suite 3800 Seattle, WA 98101-2605 USA
Tel +1 206 624 7940 Fax +1 206 623 3485
milliman.comNovember 12, 2018
Teachers’ Retirement Board California State Teachers’ Retirement System
Re: Valuation of the Defined Benefit Program
Dear Members of the Board: The basic financial goal of the Defined Benefit Program of the California State Teachers' Retirement System (CalSTRS) is to establish contributions which fully fund the obligations and which, as a percent of payroll, remain level for each generation of active members. Annual actuarial valuations measure the progress toward this goal, as well as test the adequacy of the contribution rates.
CalSTRS measures its funding status as the Funded Ratio of the actuarial value of valuation assets over the actuarial accrued liabilities. The funding status based on the past three actuarial valuations is shown below:
Valuation Date Funded Ratio June 30, 2015 69% June 30, 2016 64% June 30, 2017 63%
Based on the June 30, 2017 actuarial valuation, the scheduled income from member, employer, and State contributions is projected to finance the DB Program on an actuarially sound basis. CalSTRS is projected to reach approximately a 100% Funded Ratio in 2046.
The June 30, 2017 valuation results are based on the membership data and the asset information provided by CalSTRS. In our examination of these data, we have found them to be reasonably consistent and comparable with data used for other purposes, although we have not audited the data at the source. Since the valuation results are dependent on the integrity of the data supplied, the results can be expected to differ if the underlying data is incomplete or missing. It should be noted that if any data or other information is found to be materially inaccurate or incomplete, our calculations will need to be revised.
Milliman did not prepare the summaries or schedules shown in the Financial and Actuarial Sections. However, the actuarial information contained in the Financial Section and in this Actuarial Section was derived from our June 30, 2017 actuarial valuation report for funding and our 2018 GASB 67/68 report that communicated the actuarial results for financial reporting for June 30, 2018.
The actuarial computations presented in the valuation report are for purposes of determining the recommended funding amounts for CalSTRS consistent with our understanding of their funding requirements and goals. The liabilities are determined by using the entry age normal funding method. The actuarial assets are determined by using a one-third smoothed recognition method of the difference between the actual market value to the expected actuarial value.
ACTUARY’S CERTIFICATION LETTER—DB PROGRAM

128 CALSTRS COMPREHENSIVE ANNUAL FINANCIAL REPORT 2018
Teachers' Retirement BoardNovember 12, 2018
Page 2
The valuation is based on our understanding of the current benefit provisions of the DB Program and the actuarial assumptions adopted by the Board. The assumptions are reviewed annually for reasonableness, with a detailed experience analysis completed every four or five years. The last detailed experience analysis was completed in February of 2017 when the Board adopted the current assumptions. The assumptions are scheduled to be reviewed in detail again for use in the June 30, 2019 funding valuation and the GASB 67/68 valuation for reporting date June 30, 2020. The assumptions and methods used for financial reporting under GASB 67/68 are the same as the funding valuation assumptions with the following exceptions:
1. The discount rate of 7.10% is gross of administrative expenses; and 2. The market value of assets is used for the Fiduciary Net Position.
For financial reporting purposes, all programs within the State Teachers’ Retirement Plan are reported in aggregate.
We believe the actuarial assumptions and methods are internally consistent, reasonable and meet the parameters of Governmental Accounting Standards Board Statement Numbers 67, 68 and 82 for fulfilling financial reporting requirements and meet the parameters set forth in the relevant Actuarial Standards of Practice (ASOPs). Nevertheless, the emerging costs will vary from those presented in our report to the extent that actual experience differs from that projected by the actuarial assumptions. Future actuarial measurements may differ significantly from the current measurements as presented in the valuation report due to many factors. Due to the limited scope of our assignment, we did not perform an analysis of the potential range of future measurements.
Our valuation report and this letter have been prepared exclusively for CalSTRS for a specific and limited purpose. Milliman does not intend to benefit and assumes no duty or liability to other parties who receive this work. It is a complex, technical analysis that assumes a high level of knowledge concerning CalSTRS operations, and uses CalSTRS data, which Milliman has not audited. No third party recipient of Milliman’s work product should rely upon Milliman’s work product. Such recipients should engage qualified professionals for advice appropriate to their own specific needs.
The consultants who worked on these assignments are pension actuaries. Milliman’s advice is not intended to be a substitute for qualified legal or accounting counsel. The signing actuaries are independent of the plan sponsor. We are not aware of any relationship that would impair the objectivity of our work.
We certify that the June 30, 2017 valuation was performed in accordance with the Actuarial Standards Board (ASB) standards of practice and by qualified actuaries. We are members of the American Academy of Actuaries and have experience in performing valuations for public retirement systems.
Respectfully submitted,
Mark C. Olleman, FSA, EA, MAAA Nick J. Collier, ASA, EA, MAAA Principal and Consulting Actuary Principal and Consulting Actuary
ACTUARY’S CERTIFICATION LETTER—DB PROGRAM

129ACTUARIAL
This page intentionally left blank.

130 CALSTRS COMPREHENSIVE ANNUAL FINANCIAL REPORT 2018
Actuarial MethodsCalSTRS administers the Defined Benefit (DB) Program, a cost-sharing multiple employer program. In order to value and fund the DB Program, CalSTRS has adopted actuarial methods with the objective of funding the program in a manner which minimizes year-to-year variation in cost while ensuring sufficient assets are accumulated over each member’s working career. The following is a summary of the various methods used.
Actuarial Cost Method For funding purposes, the entry age normal cost method was selected for the DB Program, which is the most common cost method among public sector pension plans. The advantage of using this method is that the cost over time tends to remain fairly level as a percentage of overall payroll. This is well-suited to most public systems, which benefit from a stable contribution rate for budgeting and planning purposes. The actuarial cost method was reviewed and re-adopted by the Teachers’ Retirement Board as part of the experience study review.
Asset Smoothing Method The asset smoothing method, as adopted by the board, projects an Expected Value of Assets using the assumed rate of investment return, then one-third of the difference between the Expected Value and the Market Value is recognized in the Actuarial Value of Assets.
Funding Method
The system receives contributions from members, employers and the state. In 2014, the California legislature and the Governor enacted the CalSTRS funding plan, a joint commitment set forth in statute with the goal of achieving full funding of the system by 2046. Actuarial gains and losses and the unfunded actuarial obligation are amortized over a closed period ending June 30, 2046.
Member Contributions: For members covered by the 2% at 60 benefit formula the contribution rate is 10.25 percent of creditable compensation. For members covered by the 2% at 62 benefit formula, the contribution rate is equal to one-half of the Normal Cost rate determined in the valuation rounded to the nearest quarter percent, plus a supplemental amount. The contribution rate for 2% at 62 members only changes when the Normal Cost rate changes by more than 1 percent of pay as compared to the initial Normal Cost rate (or at the time of the last adjustment). For fiscal year ended
June 30, 2018, the member contribution rate was equal to 9.205 percent of creditable compensation.
Employer Contributions: Employers pay a base contribution rate of 8.25 percent of creditable compensation. Additionally, employers contribute a supplemental contribution rate for the purpose of amortizing the employers’ share of the unfunded actuarial obligation by the fixed date of June 30, 2046. Currently the supplemental contributions follow a fixed schedule set in statute. The total employer contribution rate is set to increase to 19.1 percent of creditable compensation by the 2020–21 fiscal year. Effective with the 2021–22 fiscal year, the board will have limited authority to adjust the contribution rate to amortize the remaining unfunded actuarial obligation by the 2046 deadline. For fiscal year ended June 30, 2018, the total employer contribution rate was equal to 14.43 percent of creditable compensation.
State Contributions: The state contributes a base contribution rate of 2.017 percent of creditable compensation. Additionally, the state contributes a supplemental contribution rate for the purpose of amortizing the state’s share of the unfunded actuarial obligation by the fixed date of June 30, 2046. The board currently has limited authority to adjust the state contribution rate to amortize the unfunded actuarial obligation by the 2046 deadline. For fiscal year ended June 30, 2018, the total state contribution rate was equal to 6.828 percent of creditable compensation.
The state contributes on the creditable compensation of the fiscal year ending in the immediately preceding calendar year upon which members’ contributions are based, calculated annually on October 1 and updated on or before the subsequent April 15 and paid in four equal quarterly payments.
The state contributes an additional 2.5 percent of members’ creditable earnings to protect retirees’ purchasing power.
Financial Reporting Method Under GASB 67, financial reporting for the State Teachers’ Retirement Plan includes the Defined Benefit, Defined Benefit Supplement, Cash Balance Benefit, Supplemental Benefit Maintenance Account and Teachers’ Replacement Benefits programs. For financial reporting, the aggregate assets of all programs in the State Teachers’ Retirement Plan on a market basis are used in the determination of the Net Pension Liability.
DEFINED BENEFIT (DB) PROGRAM AND SCHEDULES
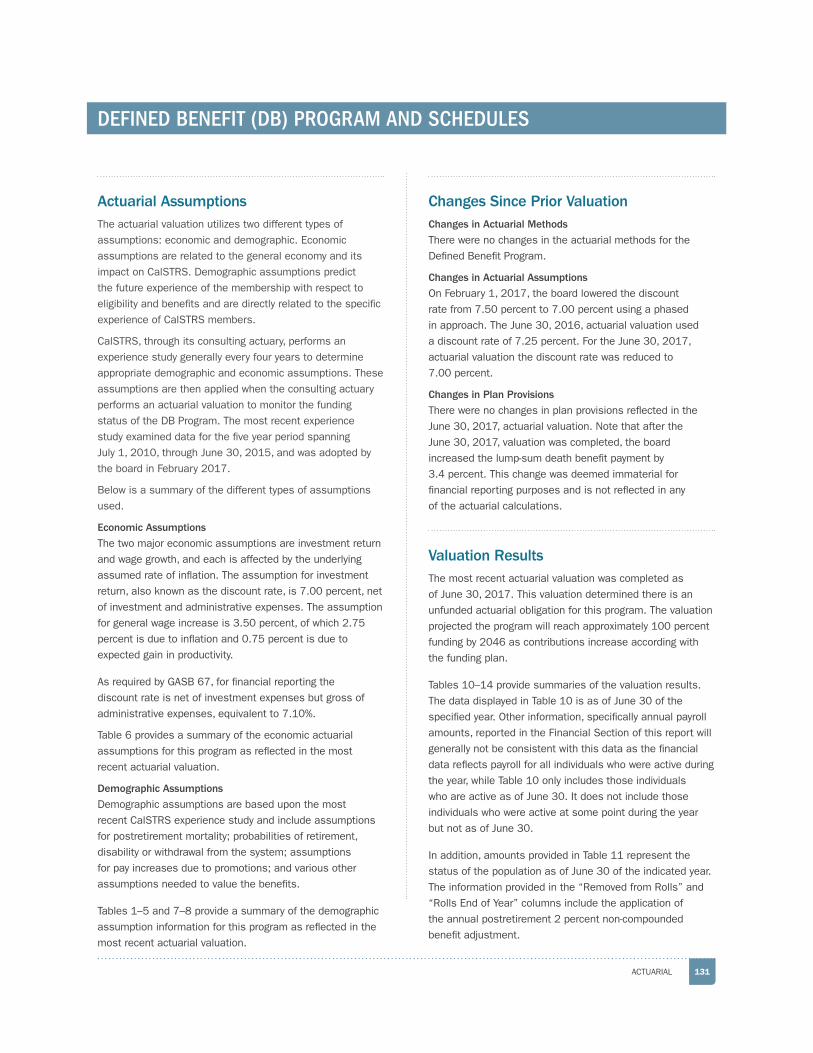
131ACTUARIAL
Actuarial Assumptions The actuarial valuation utilizes two different types of assumptions: economic and demographic. Economic assumptions are related to the general economy and its impact on CalSTRS. Demographic assumptions predict the future experience of the membership with respect to eligibility and benefits and are directly related to the specific experience of CalSTRS members.
CalSTRS, through its consulting actuary, performs an experience study generally every four years to determine appropriate demographic and economic assumptions. These assumptions are then applied when the consulting actuary performs an actuarial valuation to monitor the funding status of the DB Program. The most recent experience study examined data for the five year period spanning July 1, 2010, through June 30, 2015, and was adopted by the board in February 2017.
Below is a summary of the different types of assumptions used.
Economic Assumptions The two major economic assumptions are investment return and wage growth, and each is affected by the underlying assumed rate of inflation. The assumption for investment return, also known as the discount rate, is 7.00 percent, net of investment and administrative expenses. The assumption for general wage increase is 3.50 percent, of which 2.75 percent is due to inflation and 0.75 percent is due to expected gain in productivity.
As required by GASB 67, for financial reporting the discount rate is net of investment expenses but gross of administrative expenses, equivalent to 7.10%.
Table 6 provides a summary of the economic actuarial assumptions for this program as reflected in the most recent actuarial valuation.
Demographic Assumptions Demographic assumptions are based upon the most recent CalSTRS experience study and include assumptions for postretirement mortality; probabilities of retirement, disability or withdrawal from the system; assumptions for pay increases due to promotions; and various other assumptions needed to value the benefits.
Tables 1–5 and 7–8 provide a summary of the demographic assumption information for this program as reflected in the most recent actuarial valuation.
Changes Since Prior Valuation
Changes in Actuarial Methods There were no changes in the actuarial methods for the Defined Benefit Program.
Changes in Actuarial Assumptions On February 1, 2017, the board lowered the discount rate from 7.50 percent to 7.00 percent using a phased in approach. The June 30, 2016, actuarial valuation used a discount rate of 7.25 percent. For the June 30, 2017, actuarial valuation the discount rate was reduced to 7.00 percent.
Changes in Plan Provisions There were no changes in plan provisions reflected in the June 30, 2017, actuarial valuation. Note that after the June 30, 2017, valuation was completed, the board increased the lump-sum death benefit payment by 3.4 percent. This change was deemed immaterial for financial reporting purposes and is not reflected in any of the actuarial calculations.
Valuation ResultsThe most recent actuarial valuation was completed as of June 30, 2017. This valuation determined there is an unfunded actuarial obligation for this program. The valuation projected the program will reach approximately 100 percent funding by 2046 as contributions increase according with the funding plan.
Tables 10–14 provide summaries of the valuation results. The data displayed in Table 10 is as of June 30 of the specified year. Other information, specifically annual payroll amounts, reported in the Financial Section of this report will generally not be consistent with this data as the financial data reflects payroll for all individuals who were active during the year, while Table 10 only includes those individuals who are active as of June 30. It does not include those individuals who were active at some point during the year but not as of June 30.
In addition, amounts provided in Table 11 represent the status of the population as of June 30 of the indicated year. The information provided in the “Removed from Rolls” and “Rolls End of Year” columns include the application of the annual postretirement 2 percent non-compounded benefit adjustment.
DEFINED BENEFIT (DB) PROGRAM AND SCHEDULES

132 CALSTRS COMPREHENSIVE ANNUAL FINANCIAL REPORT 2018
The data provided for each year in Table 11 is a snapshot of the population taken following year-end closing for the indicated period. It is likely adjustments will be made subsequent to this closing. No attempt is made to update the data in Table 11 for these adjustments.
With one exception, actuarial valuations have been performed every year since June 30, 1997, to analyze the sufficiency of the statutory contributions to meet the current and future obligations of the program. By using the actuarial methods and assumptions adopted by the board, the actuarial valuation provides the best estimate of the program’s long-term financing.
Comparing the unfunded actuarial obligation as of two valuation dates does not provide enough information to determine if there were actuarial gains or losses. The correct comparison is between the unfunded actuarial obligation on the valuation date and the expected unfunded actuarial obligation projected from the prior valuation date using the actuarial assumptions in effect for the period of comparison.
Actuarial gains reduce the unfunded actuarial obligation as of the valuation date, and actuarial losses increase the unfunded actuarial obligation. Most actuarial gains and losses are a result of short-term fluctuations in experience or changes in actuarial assumptions. Because of the long-term nature of actuarial assumptions, future patterns of emerging experience may offset these short-term fluctuations.
Independent Actuarial Review
Actuarial services for CalSTRS are provided under contract by a qualified independent actuarial firm, with additional review provided by CalSTRS actuarial staff. The current actuarial firm, Milliman, has been the program’s actuarial firm since January 15, 2000.
In addition to the review performed by CalSTRS actuarial staff, all independent actuarial services are subject to a periodic independent review. The selection of the firm performing the independent review is done generally every five years through the competitive bid process. A review of the 2016 Actuarial Experience Study of the DB Program was performed by the actuarial firm Cheiron. The result of the review was reported to the board on February 1, 2017. Cheiron found the recommendations made by Milliman
in the 2016 Actuarial Experience Study to be reasonable, and the work performed by Milliman on the experience study meets the Actuarial Standards of Practice.
A review of the 2015 Actuarial Valuation of the DB Program was performed by the actuarial firm Segal Consulting. The result of the review was reported to the board on April 6, 2017. Overall Segal found that the results of the June 30, 2015, DB Actuarial Valuation were reasonable and accurate. Segal was able to match the valuation results and the individual sample test lives within an acceptable range and found the economic assumptions and cost method used were appropriate. Segal stated that Milliman adhered to reasonable quality control procedures and the valuation was performed in accordance with the principles and practices of the California Actuarial Advisory Panel, the Public Plan Committee of the Conference of Consulting Actuaries, the Actuarial Standards Board, the American Academy of Actuaries, the Society of Actuaries and the Joint Board for the Enrollment of Actuaries.
Summary of Defined Benefit Program Provisions
The provisions used in the June 30, 2017 valuation of the DB program are summarized below.
Normal Retirement
Eligibility Requirement
CalSTRS 2% at 60 Members: Age 60 with five years of credited service.
CalSTRS 2% at 62 Members: Age 62 with five years of credited service.
Benefit
2 percent of final compensation for each year of credited service.
Benefit Factors
Credited Service—For each year of membership, credited service is granted based on the ratio of creditable compensation earned to compensation earnable. No more than one full year of service credit is allowed during any school year; however, the contributions for any service in excess of one year are deposited to the member and employer contribution accounts within the DBS Program.
DEFINED BENEFIT (DB) PROGRAM AND SCHEDULES

133ACTUARIAL
Contributions received for DBS compensation that are attributable to increases under AB 1469 will be returned to school district employers. School district employers return excess member contributions to their employees, and the returned pre-tax contributions will be considered taxable income in the year they are received by the employee.
Final Compensation—CalSTRS 2% at 60 Members: Highest average annual compensation earnable for 36 consecutive months of credited service. For members with 25 years of service, the calculation is based on the highest average annual compensation earnable for 12 consecutive months.
CalSTRS 2% at 62 Members: Final compensation is based on the highest average annual compensation earnable for 36 consecutive months. Compensation is limited to 120 percent of the Social Security wage base in effect January 1, 2013, adjusted each fiscal year based on the changes in the Consumer Price Index for All Urban Consumers: U.S. City Average.
IRC Section 401(a)(17)—Compensation is limited under IRC section 401(a)(17) and assumed to increase at the rate of inflation.
Sick Leave Service Credit—Credited service is granted for unused sick leave at the time of retirement. Up to 0.2 years of credited service for sick leave may be used for eligibility for one-year final compensation or to attain the career factor or the longevity bonus for eligible members.
Career Factor—If a CalSTRS 2% at 60 member has 30 years of credited service, the age factor is increased by 0.2 percent. However, the maximum age factor is 2.4 percent. The career factor does not apply to CalSTRS 2% at 62 members.
Longevity Bonus—For CalSTRS 2% at 60 members attaining 30 years of service by January 1, 2011, a longevity bonus of $200 per month is added to the Member-Only Benefit. The bonus is increased to $300 per month with 31 years of service and $400 per month with 32 or more years of service. The longevity bonus does not apply to CalSTRS 2% at 62 members.
Postretirement Benefit Adjustment
Benefit Improvement Factor—Two percent simple increase on September 1 following the first anniversary of the effective date of the benefit, applied to all continuing benefits.
IRC Section 415(b)—For CalSTRS 2% at 60 members, benefits are subject to limits imposed under IRC section 415(b). However, no limits are imposed in the valuation of the DB Program in order to address the potential pay-as-you-go funding needs of the Teachers’ Replacement Benefits Program Fund. CalSTRS 2% at 62 members will not receive any benefits in excess of the federal limit.
Early Retirement
Eligibility Requirement—CalSTRS 2% at 60 Members: Age 55 with five years of credited service, or age 50 with 30 years of credited service.
CalSTRS 2% at 62 Members: Age 55 with five years of credited service.
Benefit Reduction—CalSTRS 2% at 60 Members: A 0.5 percent reduction in the normal retirement allowance for each full month or partial month the member is younger than age 60, plus a reduction of 0.25 percent for each full month or partial month the member is younger than age 55.
CalSTRS 2% at 62 Members: A 0.5 percent reduction in the normal retirement allowance for each full month or partial month the member is younger than age 62.
Late Retirement
Benefit—CalSTRS 2% at 60 Members: For members who continue to earn additional service credit after age 60. The 2 percent age factor increases by 0.033 percent for each quarter year of age that the member is over age 60, up to a maximum of 2.4 percent.
CalSTRS 2% at 62 Members: For members who continue to earn additional service credit after age 62, the 2 percent age factor increases by 0.033 percent for each quarter year of age that the member is over age 62, up to a maximum of 2.4 percent.
Deferred Retirement
Benefit—Any time after satisfying the minimum service requirement, a member may cease active service, leave the accumulated contributions on deposit, and later retire upon attaining the minimum age requirement.
DEFINED BENEFIT (DB) PROGRAM AND SCHEDULES

134 CALSTRS COMPREHENSIVE ANNUAL FINANCIAL REPORT 2018
Disability Allowance—Coverage A
Eligibility Requirement—Member has five years of credited California service and has not attained age 60, or if a member has earned one year of creditable service and is disabled due to an unlawful act of bodily harm committed by another person while performing creditable service.
Benefit—Fifty percent of final compensation.
- or -
Five percent of final compensation for each year of service credit if over age 45 with fewer than 10 years of service credit.
Children’s Benefit—Ten percent for each eligible dependent child, up to a maximum of 40 percent of final compensation. The increment for each eligible child continues until the child marries or attains age 22.
Offsets—Benefit, including children’s increment, is reduced by disability benefits payable under Social Security, workers’ compensation and employer-paid income protection plan.
Disability Allowance—Coverage B
Eligibility Requirement—Member has five years of credited California service, or if a member has earned one year of creditable service and is disabled due to an unlawful act of bodily harm committed by another person while performing creditable service.
Benefit—Fifty percent of final compensation, regardless of age and service credit.
Children’s Benefit—Ten percent for each eligible child up to four children, for a maximum of 40 percent of final compensation. The increment for each child continues until the child attains age 21, regardless of student, marital or employment status.
Offsets—The member’s benefit is reduced by disability benefits payable under workers’ compensation.
Death Before Retirement—Coverage A
Eligibility Requirement—One or more years of service credit for active members or members receiving a disability benefit.
Lump-Sum Payment—The one-time death benefit recipient receives a $6,163 lump-sum payment.
Benefit—The surviving spouse or registered domestic partner with eligible children will receive a family benefit of 40 percent of final compensation for as long as there is at least one eligible child. An additional 10 percent of final compensation is payable for each eligible child up to a maximum benefit of 90 percent.
If there is no surviving spouse or registered domestic partner, a benefit of 10 percent of final compensation is payable to eligible children up to a maximum benefit of 50 percent.
When there are no eligible children, the spouse or registered domestic partner may elect to receive one-half of a 50 percent joint and survivor benefit projected to age 60 or take a lump-sum payment of the remaining contributions and interest.
Death Before Retirement—Coverage B
Eligibility—One or more years of service credit for active members.
Lump-Sum Payment—The one-time death benefit recipient receives a $24,652 lump-sum payment.
Benefit—A lump-sum payment of the contributions and interest.
- or -
One-half of a 50 percent joint and survivor benefit, beginning on the member’s 60th birthday or immediately with a reduction based on the member’s age and that of the spouse or registered domestic partner at the time the benefit begins.
If the surviving spouse or registered domestic partner elects a monthly benefit, or there is no surviving spouse, each eligible child would receive 10 percent of the member’s final compensation, with a maximum benefit of 50 percent.
Death After Retirement
Lump-Sum Payment—The one-time death benefit recipient receives a $6,163 lump-sum payment.
Members of retirement age may make a preretirement election of an option to designate a beneficiary.
Annuity Form—If the retired member had elected one of the joint and survivor options, the retirement benefit would be reduced in accordance with the option elected.
DEFINED BENEFIT (DB) PROGRAM AND SCHEDULES

135ACTUARIAL
If no option had been elected, payment of the unpaid contributions and interest, if any, remaining in the member’s account will be made to the beneficiary, if one is named, or to the deceased member’s estate.
Termination From CalSTRS
Refund—Refund of the member’s contributions with interest as credited to the member’s account to date of withdrawal. A refund terminates membership and all rights to future benefits from the program.
Re-entry After Refund—Former members who re-enter the program may redeposit all amounts previously refunded plus regular interest. The member must earn one year of credited service after re-entry before becoming eligible for program benefits.
DEFINED BENEFIT (DB) PROGRAM AND SCHEDULES

136 CALSTRS COMPREHENSIVE ANNUAL FINANCIAL REPORT 2018
All demographic assumptions used in the funding actuarial valuation were adopted by the board when the experience study was adopted on February 1, 2017. Following are the assumptions adopted by the board for this program.
Male Female
Age
50 0.240% 0.133%
55 0.354 0.211
60 0.474 0.280
65 0.674 0.422
70 1.079 0.696
75 1.936 1.280
80 3.553 2.455
85 6.831 4.896
90 13.161 9.948
95 22.456 18.616
2% at 60 Members 2% at 62 Members
Age
1990
Benefits
Under
30 years
30 or
More Years All Years
Male 55 5.8% 2.7% 6.0% 3.0%
60 25.0 6.3 25.0 9.0
65 20.0 14.0 32.5 30.0
70 100.0 12.0 25.0 20.0
75 100.0 100.0 100.0 100.0
Female 55 7.0% 3.5% 8.0% 4.0%
60 22.0 7.0 29.0 9.0
65 18.0 17.0 37.5 30.0
70 100.0 14.0 30.0 20.0
75 100.0 100.0 100.0 100.0
1Probabilities of retirement are adjusted for members with service between 25 and 30 years.
Table 2 Probabilities of Retirement for Sample Ages1
Entry Ages
Duration Under 25 25–29 30–34 35–39 40+
Male
Under 5 100% 100% 100% 100% 100%
5 60 60 60 56 45
10 46 46 38 36 36
15 38 38 31 21 —
20 31 31 15 — —
25 15 15 — — —
Duration Under 25 25–29 30–34 35–39 40+
Female
Under 5 100% 100% 100% 100% 100%
5 60 60 60 52 35
10 34 34 32 32 29
15 27 24 24 24 —
20 19 14 14 — —
25 10 10 — — —
Table 4 Probabilities of Refund by Sample Duration in Years of Members and Sample Entry Ages
Table 1 Postretirement Mortality for Sample Ages
Male
Duration
0 16.0%
1 11.0
2 8.5
3 6.3
4 4.0
5 3.5
10 1.8
15 1.2
20 0.9
25 0.7
Female
Duration
0 15.0%
1 9.0
2 7.0
3 5.5
4 4.0
5 3.0
10 1.8
15 1.2
20 0.9
25 0.7
Table 3 Probabilities of Withdrawal from Active Service Before Age and Service Retirement for Sample Duration in Years
DEFINED BENEFIT (DB) PROGRAM AND SCHEDULES
2017 CalSTRS
Retired Male
2017 CalSTRS
Retired Female

137ACTUARIAL
Entry Ages
Duration Under 25 25–29 30–34 35–39 40–44 45+
1 6.4% 5.8% 5.3% 4.8% 4.5% 3.7%
5 5.2 4.8 4.3 3.9 3.8 2.8
10 3.7 3.4 3.0 2.7 2.5 1.8
20 1.3 1.2 1.2 0.8 0.8 0.6
30 0.9 0.8 0.7 0.5 — —
40 0.8 0.7 — — — —
Table 5 Assumption for Pay Increases Due to Promotions and Longevity for Sample Ages in Years (Exclusive of the assumed general wage increase, which includes inflation)
Consumer Price Inflation 2.75%
Investment Yield (Net of Expenses) 7.00
Wage Inflation 3.50
Interest on Member Accounts 3.00
Table 6 Economic Assumptions
Retired Members¹
Male 2016 CalSTRS Retired Male
Female 2016 CalSTRS Retired Female
Active Members
Male RP-2014 White Collar Employee Male set back 2 years
Female RP-2014 White Collar Employee Female set back 2 years
Beneficiaries1
Male 2016 CalSTRS Retired Male
Female 2016 CalSTRS Retired Female
Disabled1.2
Male RP-2014 Disabled Retiree Male set back 2 years
Female RP-2014 Disabled Retiree Female set back 2 years
1For futue years, the projected improvement is based on 110% of the MP-2016 Ultimate Projection Scale.2Select rates in first three years for both Males and Females.
Table 7 Mortality Assumptions
DEFINED BENEFIT (DB) PROGRAM AND SCHEDULES

138 CALSTRS COMPREHENSIVE ANNUAL FINANCIAL REPORT 2018
Coverage A
Male 25 0.018%
30 0.027
35 0.045
40 0.072
45 0.099
50 0.144
55 0.189
Female 25 0.018%
30 0.027
35 0.054
40 0.081
45 0.099
50 0.198
55 0.252
Coverage B
Male 25 0.010%
30 0.020
35 0.030
40 0.060
45 0.100
50 0.140
55 0.245
60 0.365
65 0.400
70 0.400
Female 25 0.020%
30 0.020
35 0.040
40 0.070
45 0.110
50 0.185
55 0.300
60 0.380
65 0.400
70 0.400
DEFINED BENEFIT (DB) PROGRAM AND SCHEDULES
Table 8 Disability Rates for Sample Ages
PEPRA Coverage All members hired on or after the valuation date are assumed to be subject to the provisions of PEPRA.
Unused Sick Leave Credited Sevice is increased by 1.8%.
Optional FormsActive and Inactive: Based on single life annuity assumed. Retirees and Beneficiaries: Based on optional form in data.
Probability of MarriageMale: 85% Male spouses are assumed to be three years older than female spouses.
Female: 65%
Number of ChildrenMarried members under age 60 are assumed to have the following number of children:
Member’s Gender Assumed Number of Children
Male 0.65
Female 0.50
Assumed Offsets There are no assumed offsets to death and disability benefits under Coverage A or Coverage B.
Table 9 Supplemental Assumptions

139ACTUARIAL
Added to Rolls Removed from Rolls Rolls – End of Year
Date
(as of June 30)
Number Annual
Allowances2
Number Annual
Allowances2
Number Annual
Allowances2
% Increase in
Annual Allowances
Average Annual
Allowances
2009 13,420 $657,984 6,163 $149,998 228,969 $8,340,671 8.2% $36,427
2010 16,201 777,293 6,499 165,404 243,796 9,171,309 10.0 37,619
2011 14,559 671,868 6,938 181,927 253,041 9,802,995 6.9 38,741
2012 14,316 635,935 6,860 187,271 262,039 10,458,555 6.7 39,912
2013 12,377 555,751 7,119 205,779 269,429 11,091,944 6.1 41,168
2014 11,383 507,801 7,299 221,733 275,627 11,624,220 4.8 42,174
2015 11,952 558,655 7,759 247,766 282,100 12,197,828 4.9 43,239
2016 12,014 591,902 7,871 262,170 288,195 12,792,104 4.9 44,387
2017 12,823 649,503 8,381 289,955 294,874 13,439,239 5.1 45,576
2018 13,340 682,533 8,606 300,558 301,859 14,114,787 5.0 46,760
Table 11 Schedule of Retired Members and Beneficiaries Added to and Removed from Rolls1
DEFINED BENEFIT (DB) PROGRAM AND SCHEDULES
Active Members
Valuation Date
(as of June 30)1
Number of Participating
Employers2Number Annual Payroll Annual Average Pay
% Increase In
Average Pay
2008 1,428 461,378 $27,118,230,762 $58,777
2009 1,472 459,009 27,327,386,616 59,536 1.3
2010 1,514 441,544 26,274,889,981 59,507 —
2011 1,587 429,600 25,576,008,636 59,534 —
2012 1,660 421,499 25,388,209,920 60,233 1.2
2013 1,670 416,643 25,479,056,693 61,153 1.5
2014 1,690 420,887 26,469,883,008 62,891 2.8
2015 1,724 429,460 28,013,191,853 65,229 3.7
2016 1,739 438,537 29,826,149,337 68,013 4.3
2017 1,746 445,935 31,136,104,704 69,822 2.7
Table 10 Schedule of Active Member Valuation Data
1 Each year’s data populaion is a snapshot taken following year-end closings; subsequent adjustments made to snapshots of data prior to the current period are not reflected in the table.2 Dollars in thousands.
3.4%
1 Actuarial valuation results as of June 30, 2018, are expected to be available by May 2019.2 Number of employers is based on employers who submit the last contribution line for the active member in each respective fiscal year; however, the number of employers in the Financial Section
is based on contributing employers as of the end of the respective fiscal year.

140 CALSTRS COMPREHENSIVE ANNUAL FINANCIAL REPORT 2018
Actuarial Valuation as of June 301
2017 2016
Actuarial Obligation at June 30 $266,704 $241,753
Normal Cost 6,312 5,463
Benefit Payments (13,314) (12,608)
Expected Interest 19,319 17,869
Expected Actuarial Obligation at June 30 279,021 252,477
Expected Actuarial Value of Assets at June 30 177,767 172,251
Expected Unfunded Actuarial Obligation at June 30 101,254 80,226
Actuarial (Gains) / Losses
Change in Assumptions 8,706 13,227
Investment Return Assumptions (1,709) 2,590
Demographic Assumptions (777) 1,000
Net Change Other Sources (213) (315)
Total Actuarial (Gains) / Losses 6,007 16,502
Unfunded Actuarial Obligation at June 30 $107,261 $96,728
Funded Ratio 63% 64%
Table 13 Analysis of Financial Experience (Gains and losses in unfunded actuarial obligation resulting from differences between assumed and actual experience) (Dollars in Millions)
DEFINED BENEFIT (DB) PROGRAM AND SCHEDULES
Aggregate Accrued Liabilities for Funding of Liabilities
Valuation Date
(as of June 30)1
(1)
Active Member
Contributions
on Deposit
(2)
Future Benefits to
Benefit Recipients
(3)
Service Already Rendered
by Active Members
(Financed by Employer)
Actuarial Value
of Assets
(1) (2) (3)
2008 $26,881 $81,984 $68,869 $155,215 100.0% 100.0% 67.3%
2009 27,477 88,927 69,279 145,142 100.0 100.0 41.5
2010 27,105 99,135 70,075 140,291 100.0 100.0 20.1
2011 27,038 109,984 71,383 143,930 100.0 100.0 9.7
2012 27,245 116,475 71,469 144,232 100.0 100.0 0.7
2013 27,683 121,714 72,884 148,614 100.0 99.4 —
2014 28,290 126,235 76,688 158,495 100.0 100.0 5.2
2015 28,935 131,451 81,367 165,553 100.0 100.0 6.4
2016 30,046 145,108 91,550 169,976 100.0 96.4 —
2017 31,523 154,618 100,809 179,689 100.0 95.8 —
Table 12 Solvency Test (Dollars in Millions)
1 Actuarial valuation results as of June 30, 2018, are expected to be available by May 2019.
1 Actuarial valuation results as of June 30, 2018, are expected to be available by May 2019.

141ACTUARIAL
Table 14 Schedule of Funding Progress (Dollars in Millions)
Actuarial
Valuation Date
as of June 301
Actuarial Value
of Assets
(a)
Actuarial Accrued
Liability
(AAL)
(b)
Unfunded AAL
(Funding Excess)
(UAAL)
(b-a)
Funded Ratio
(a/b)
Covered Payroll
(c)
UAAL as a % of
Covered Payroll
((b-a)/c)
2008 $155,215 $177,734 $22,519 87% $27,118 83%
2009 145,142 185,683 40,541 78 27,327 148
2010 140,291 196,315 56,024 71 26,275 213
2011 143,930 208,405 64,475 69 26,592 242
2012 144,232 215,189 70,957 67 26,404 269
2013 148,614 222,281 73,667 67 26,483 278
2014 158,495 231,213 72,718 69 26,398 275
2015 165,553 241,753 76,200 69 28,640 266
2016 169,976 266,704 96,728 64 30,324 319
2017 179,689 286,950 107,261 63 31,961 336
Note: Information of actuarially determined and actual contributions for the State Teachers’ Retirement Plan is provided in the Financial Section, Schedule III, Contributions of Employer and Nonemployer Contributing Entity table.
DEFINED BENEFIT (DB) PROGRAM AND SCHEDULES
1 Actuarial valuation results as of June 30, 2018, are expected to be available by May 2019.

142 CALSTRS COMPREHENSIVE ANNUAL FINANCIAL REPORT 2018
1301 Fifth Avenue Suite 3800 Seattle, WA 98101-2605 USA
Tel +1 206 624 7940 Fax +1 206 623 3485
milliman.comNovember 12, 2018
Teachers’ Retirement Board California State Teachers’ Retirement System
Re: Valuation of the Defined Benefit Supplement Program
Dear Members of the Board: The basic financial goal of the Defined Benefit Supplement (DBS) Program of the California State Teachers' Retirement System (CalSTRS) is to maintain sufficient resources to fully fund the obligations. Annual actuarial valuations measure the progress toward this goal, as well as test the adequacy of the contribution rates.
CalSTRS measures its funding status as the Funded Ratio of the actuarial value of valuation assets over the actuarial accrued liabilities. The funding status based on the past three actuarial valuations is shown below:
Valuation Date Funded Ratio June 30, 2015 115% June 30, 2016 112% June 30, 2017 118%
The actual return was greater than the assumed return for the fiscal year ended in 2017 which, combined with other factors, caused an increase in the Funded Ratio. As of June 30, 2017, the Market Value of Assets for the DBS Program exceeds the Actuarial Obligation. Additional interest credits were granted based on the Program’s funded level and are reflected in the Funded Ratio shown above. Prior to the additional credits, the Funded Ratio was 122%.
The June 30, 2017 valuation results are based on the membership data and the asset information provided by CalSTRS. In our examination of these data, we have found them to be reasonably consistent and comparable with data used for other purposes, although we have not audited the data at the source. Since the valuation results are dependent on the integrity of the data supplied, the results can be expected to differ if the underlying data is incomplete or missing. It should be noted that if any data or other information is found to be materially inaccurate or incomplete, our calculations will need to be revised.
Milliman did not prepare the summaries or schedules shown in the Financial and Actuarial Sections. However, the actuarial information contained in the Financial Section and in this Actuarial Section was derived from our June 30, 2017 actuarial valuation report for funding and our 2018 GASB 67/68 report that communicated the actuarial results for financial reporting for June 30, 2018.
The actuarial computations presented in the valuation report are for purposes of determining the recommended funding amounts for CalSTRS consistent with our understanding of their funding requirements and goals. The liabilities are determined by using the traditional unit credit funding method. The actuarial assets are equal to fair market value.
ACTUARY’S CERTIFICATION LETTER—DBS PROGRAM

143ACTUARIAL
ACTUARY’S CERTIFICATION LETTER—DBS PROGRAMTeachers' Retirement Board
November 12, 2018 Page 2
The funding valuation is based on our understanding of the current benefit provisions of the DBS Program and the actuarial assumptions adopted by the Board. The assumptions are reviewed annually for reasonableness, with a detailed experience analysis completed every four or five years. The last detailed experience analysis was completed in February of 2017 when the Board adopted the current assumptions. The assumptions are scheduled to be reviewed in detail again for use in the June 30, 2019 funding valuation and the GASB 67/68 valuation for reporting date June 30, 2020. The assumptions and methods used for financial reporting under GASB 67/68 are the same as the funding valuation assumptions with the following exceptions:
1. The discount rate of 7.10% is gross of administrative expenses; and 2. The individual entry age normal cost method is used.
For financial reporting purposes, all programs within the State Teachers’ Retirement Plan are reported in aggregate.
We believe the actuarial assumptions and methods are internally consistent, reasonable and meet the parameters of Governmental Accounting Standards Board Statement Numbers 67, 68 and 82 for fulfilling financial accounting requirements and meet the parameters set forth in the relevant Actuarial Standards of Practice (ASOPs). Nevertheless, the emerging costs will vary from those presented in our report to the extent that actual experience differs from that projected by the actuarial assumptions. Future actuarial measurements may differ significantly from the current measurements as presented in the valuation report due to many factors. Due to the limited scope of our assignment, we did not perform an analysis of the potential range of future measurements.
Our valuation report and this letter have been prepared exclusively for CalSTRS for a specific and limited purpose. Milliman does not intend to benefit and assumes no duty or liability to other parties who receive this work. It is a complex, technical analysis that assumes a high level of knowledge concerning CalSTRS operations, and uses CalSTRS data, which Milliman has not audited. No third party recipient of Milliman’s work product should rely upon Milliman’s work product. Such recipients should engage qualified professionals for advice appropriate to their own specific needs.
The consultants who worked on these assignments are pension actuaries. Milliman’s advice is not intended to be a substitute for qualified legal or accounting counsel. The signing actuaries are independent of the plan sponsor. We are not aware of any relationship that would impair the objectivity of our work.
We certify that the June 30, 2017 valuation was performed in accordance with the Actuarial Standards Board (ASB) standards of practice and by qualified actuaries. We are members of the American Academy of Actuaries and have experience in performing valuations for public retirement systems.
Respectfully submitted,
Mark Olleman, FSA, EA, MAAA Nick Collier, ASA, EA, MAAA Julie Smith, FSA, EA, MAAA Principal and Consulting Actuary Principal and Consulting Actuary Valuation Actuary

144 CALSTRS COMPREHENSIVE ANNUAL FINANCIAL REPORT 2018
Actuarial MethodsThe Defined Benefit Supplement (DBS) Program was established January 1, 2001. In order to value and fund the DBS Program, CalSTRS has adopted the following actuarial methods.
Actuarial Cost Method For funding purposes, the traditional unit credit cost method was selected for the Defined Benefit Supplement Program since the projected benefits of each individual member are allocated by a consistent formula to valuation years. As a result, the actuarial obligation for non-retired members is equal to the accumulated account balances, and the normal cost is equal to the total annual contribution. The DBS Program does not provide cost-of-living adjustments for benefit recipients.
Asset Valuation Method The Defined Benefit Supplement Program uses the fair market value of assets for actuarial valuation purposes. Asset smoothing is not used for this program.
Funding Method Member and employer contributions are credited to the member’s DBS account for service greater than one year during a single school year, and for CalSTRS 2% at 60 members, compensation for limited-term payments and retirement incentives are credited.
There is currently no provision in the Education Code to increase contributions to make up for any future shortfalls, if they were to occur. However, the assumed return on investments exceeds the Minimum Interest Rate. To the extent that the assets earn more than the accounts are credited in the future, this may be sufficient to make up any potential shortfall.
Financial Reporting Method Under GASB 67, financial reporting for the State Teachers’ Retirement Plan includes the Defined Benefit, Defined Benefit Supplement, Cash Balance Benefit, Supplemental Benefit Maintenance Account and Teachers’ Replacement Benefits programs. For financial reporting, the aggregate assets of all programs in the State Teachers’ Retirement Plan on a market basis are used in the determination of the Net Pension Liability.
GASB 67 also specifies that, for financial reporting purposes, the entry age normal cost method should be used
to calculate pension liability.
Actuarial AssumptionsThe actuarial valuation utilizes two different types of assumptions: economic and demographic. Economic assumptions are related to the general economy and its impact on CalSTRS. Demographic assumptions predict the future experience of the membership with respect to eligibility and benefits and are directly related to the specific experience of CalSTRS members. The DB Program and the DBS Program share the same population, so it is reasonable to use most of the same assumptions for both programs.
The assumptions for this program will have minimal impact under the traditional unit credit cost method or only have significance when participants elect to annuitize the account balance. Under the program, a member must have at least $3,500 in their account to elect to annuitize the account balance.
CalSTRS, through its consulting actuary, performs an experience study every four or five years to determine appropriate demographic and economic assumptions. These assumptions are then applied when the consulting actuary performs an actuarial valuation to monitor the funding status of the DBS Program. The most recent experience study examined data for the five year period spanning July 1, 2010, through June 30, 2015, and was adopted by the board in February 2017.
Below is a summary of the different types of assumptions used.
Economic Assumptions The two major economic assumptions are investment return and wage growth, and each is affected by the underlying assumed rate of inflation. The assumption for investment return, also known as the discount rate, is 7.00 percent, net of investment and administrative expenses. The assumption for general wage increase is 3.50 percent, of which 2.75 percent is due to inflation and 0.75 percent is due to expected gain in productivity.
As required by GASB 67, for financial reporting the discount rate is net of investment expenses but gross of administrative expenses, equivalent to 7.10%.
Table 5 provides a summary of the economic actuarial assumptions for this program as reflected in the most recent actuarial valuation.
DEFINED BENEFIT SUPPLEMENT (DBS) PROGRAM AND SCHEDULES

145ACTUARIAL
Demographic Assumptions Demographic assumptions are based upon the most recent CalSTRS experience study and include assumptions for postretirement mortality, probabilities of retirement, disability or withdrawal from the system, assumptions for pay increases due to promotions and various other assumptions needed to value the benefits.
Tables 1–4 and 6–7 provide a summary of the demographic assumption information for this program as reflected in the most recent actuarial valuation.
Changes Since Prior ValuationChanges in Actuarial Methods There were no changes in the actuarial methods for the Defined Benefit Program.
Changes in Actuarial Assumptions On February 1, 2017, the board lowered the discount rate from 7.50 percent to 7.00 percent using a phased in approach. The June 30, 2016, actuarial valuation used a discount rate of 7.25 percent. For the June 30, 2017, actuarial valuation the discount rate was reduced to 7.00 percent.
Changes in Plan Provisions On May 10, 2018, the board adopted a 4.12 percent additional earnings credit for the fiscal year ending June 30, 2017.
Valuation Results The most recent actuarial valuation was completed as of June 30, 2017. This valuation determined there was an actuarial surplus of $2,224,206,000 before the awarding of any additional earnings credit. The valuation was presented to the board on May 10, 2018, at which time the board adopted an additional earnings credit of 4.12 percent for the fiscal year ending June 30, 2017. After awarding the additional earnings credit, the actuarial surplus was reduced to $1,867,280,000.
Tables 8–12 provide summaries of the valuation results.
Independent Actuarial ReviewActuarial services for CalSTRS are provided under contract by a qualified independent actuarial firm, with additional review provided by CalSTRS actuarial staff. The current
actuarial firm, Milliman, has been the program’s actuarial firm since January 15, 2000.
In addition to the review performed by CalSTRS actuarial staff, all independent actuarial services are subject to a periodic independent review. The selection of the firm performing the independent review is done generally every five years through the competitive bid process.
A review of the 2016 Actuarial Experience Study was performed by the actuarial firm Cheiron. The result of the review was reported to the board on February 1, 2017. Cheiron found the recommendations made by Milliman in the 2016 Actuarial Experience Study to be reasonable, and the work performed by Milliman on the experience study meets the Actuarial Standards of Practice.
A review of the 2015 Actuarial Valuation of the DBS Program was also performed by Cheiron. The result of the review was reported to the board on April 6, 2017. Overall, Cheiron was able to replicate the results of the actuarial valuation with no material differences. Cheiron commented that the actuarial valuation was performed by qualified actuaries and in accordance with generally accepted actuarial principles. Cheiron further stated that appropriate methods, checking and reviewing procedures were followed in the preparation of the valuation and that the communication in the valuation report was clear and complete given the underlying plan of the benefits.
Summary of Defined Benefit Supplement Program ProvisionsThe following is a summary of the provisions used in the valuation of this program.
Membership
Eligibility Requirement—All members of the DB Program who perform creditable service and earn creditable compensation after December 31, 2000, have a DBS account.
Member—An eligible employee with creditable service subject to coverage who has contributions credited in the program or is receiving an annuity from the program.
DEFINED BENEFIT SUPPLEMENT (DBS) PROGRAM AND SCHEDULES

146 CALSTRS COMPREHENSIVE ANNUAL FINANCIAL REPORT 2018
Account Balance
Account Balance—Nominal accounts are established for the purpose of determining DBS benefits payable to the member. Accounts are credited with contributions, interest at the minimum interest rate and, if applicable, additional earnings credits.
Contributions—Member and employer contributions are credited to the member’s DBS account for service greater than one year during a single school year, and for CalSTRS 2% at 60 members, compensation for limited-term payments and retirement incentives are credited.
Minimum Interest Rate—Annual rate determined for the plan year by the board in accordance with federal laws and regulations. The minimum interest rate is equal to the average of the yields on 30-year Treasury Notes for the twelve months ending in February preceding the beginning of the plan year, rounded to the next highest basis point. The minimum interest rate is not less than the rate at which interest is credited under the DB Program.
Additional Earnings Credit—Annual rate determined for the plan year by the board based on the actual earnings during the plan year but only to the extent the earnings are sufficient to credit the minimum interest rate and provide any additions to the gain and loss reserve deemed warranted by the board. The board adopted an additional earnings credit of 4.12 percent for the fiscal year ending June 30, 2017.
Normal Retirement
Eligibility Requirement—Receipt of a corresponding benefit under the DB Program.
Benefit—The account balance at the benefit effective date subject to limits imposed under IRC section 415.
Form of Payment—The normal form of payment is a lump-sum distribution. Annuity options are available if the account balance is at least $3,500.
Early Retirement
Eligibility Requirement—Same as Normal Retirement.
Benefit and Form of Payment—Same as Normal Retirement.
Late Retirement
Benefit and Form of Payment—Same as Normal Retirement.
Contributions and earnings may continue to be credited to the account balance.
Deferred Retirement
Benefit—A member must receive a DBS Program benefit when the corresponding benefit is received under the DB Program.
Disability Benefit
Eligibility Requirement—Receipt of a corresponding benefit under the DB Program.
Benefit—The account balance at the date the disability benefit becomes payable.
Form of Payment—Same as Normal Retirement. An annuity benefit is discontinued upon termination of the corresponding DB Program benefit.
Death Before Retirement
Eligibility Requirement—Deceased member has an account balance.
Benefit—The account balance at the date of death payable to the designated beneficiary.
Form of Payment—Similar to Normal Retirement.
Death After Retirement
Eligibility Requirement—The deceased member was receiving an annuity.
Benefit—According to the terms of the annuity elected by the member.
Termination from the Program
Eligibility Requirement—Termination of all CalSTRS-covered employment.
More than five years has elapsed since the most recent termination benefit, if any, has been paid.
Benefit and Form of Payment—Lump-sum distribution of the account balance as of the date of distribution.
DEFINED BENEFIT SUPPLEMENT (DBS) PROGRAM AND SCHEDULES

147ACTUARIAL
All of the assumptions used in the funding actuarial valuation were adopted by the board when the experience study was adopted on February 1, 2017. Following are the assumptions adopted by the board for this program. Tables 2, 3, 4 and 7 are used in the GASB 67 financial reporting valuation and not for the funding valuation.
Male Female
Age 2017 2017
50 0.240% 0.133%
55 0.354 0.211
60 0.474 0.280
65 0.674 0.422
70 1.079 0.696
75 1.936 1.280
80 3.553 2.455
85 6.831 4.896
90 13.161 9.948
95 22.456 18.616
Table 1 Postretirement Mortality for Sample Ages
DEFINED BENEFIT SUPPLEMENT (DBS) PROGRAM AND SCHEDULES
Table 3 Probabilities of Withdrawal from Active Service Before Age and Service Retirement for Sample Duration in Years
2% at 60 Members 2% at 62 Members
Age
1990
Benefits
Under
30 years
30 or
More Years All Years
Male 55 5.8% 2.7% 6.0% 3.0%
60 25.0 6.3 25.0 9.0
65 20.0 14.0 32.5 30.0
70 100.0 12.0 25.0 20.0
75 100.0 100.0 100.0 100.0
Female 55 7.0% 3.5% 8.0% 4.0%
60 22.0 7.0 29.0 9.0
65 18.0 17.0 37.5 30.0
70 100.0 14.0 30.0 20.0
75 100.0 100.0 100.0 100.0
1 Probabilities of retirement are adjusted for members with service between 25 and 30 years.
Table 2 Probabilities of Retirement for Sample Ages1
Male
Duration
0 16.0%
1 11.0
2 8.5
3 6.3
4 4.0
5 3.5
10 1.8
15 1.2
20 0.9
25 0.7
Female
Duration
0 15.0%
1 9.0
2 7.0
3 5.5
4 4.0
5 3.0
10 1.8
15 1.2
20 0.9
25 0.7

148 CALSTRS COMPREHENSIVE ANNUAL FINANCIAL REPORT 2018
Entry Ages
Duration Under 25 25–29 30–34 35–39 40–44 45+
1 6.4% 5.8% 5.3% 4.8% 4.5% 3.7%
5 5.2 4.8 4.3 3.9 3.8 2.8
10 3.7 3.4 3.0 2.7 2.5 1.8
20 1.3 1.2 1.2 0.8 0.8 0.6
30 0.9 0.8 0.7 0.5 — —
40 0.8 0.7 — — — —
Table 4 Assumption for Pay Increases Due to Promotions and Longevity for Sample Ages in Years (Exclusive of the assumed general wage increase, which includes inflation)
Consumer Price Inflation 2.75%
Investment Yield (Net of Expenses) 7.00
Wage Inflation 3.50
Interest on Member Accounts 7.00
Table 5 Economic Assumptions
DEFINED BENEFIT SUPPLEMENT (DBS) PROGRAM AND SCHEDULES
Retired Members¹
Male 2016 CalSTRS Retired Male
Female 2016 CalSTRS Retired Female
Active Members
Male RP-2014 White Collar Employee Male set back 2 years
Female RP-2014 White Collar Employee Female set back 2 years
Beneficiaries1
Male 2016 CalSTRS Retired Male
Female 2016 CalSTRS Retired Female
Disabled1.2
Male RP-2014 Disabled Retiree Male set back 2 years
Female RP-2014 Disabled Retiree Female set back 2 years
1 For futue years, the projected improvement is based on 110% of the MP-2016 Ultimate Projection Scale.2 Select rates in first three years for both Males and Females.
Table 6 Mortality Assumptions
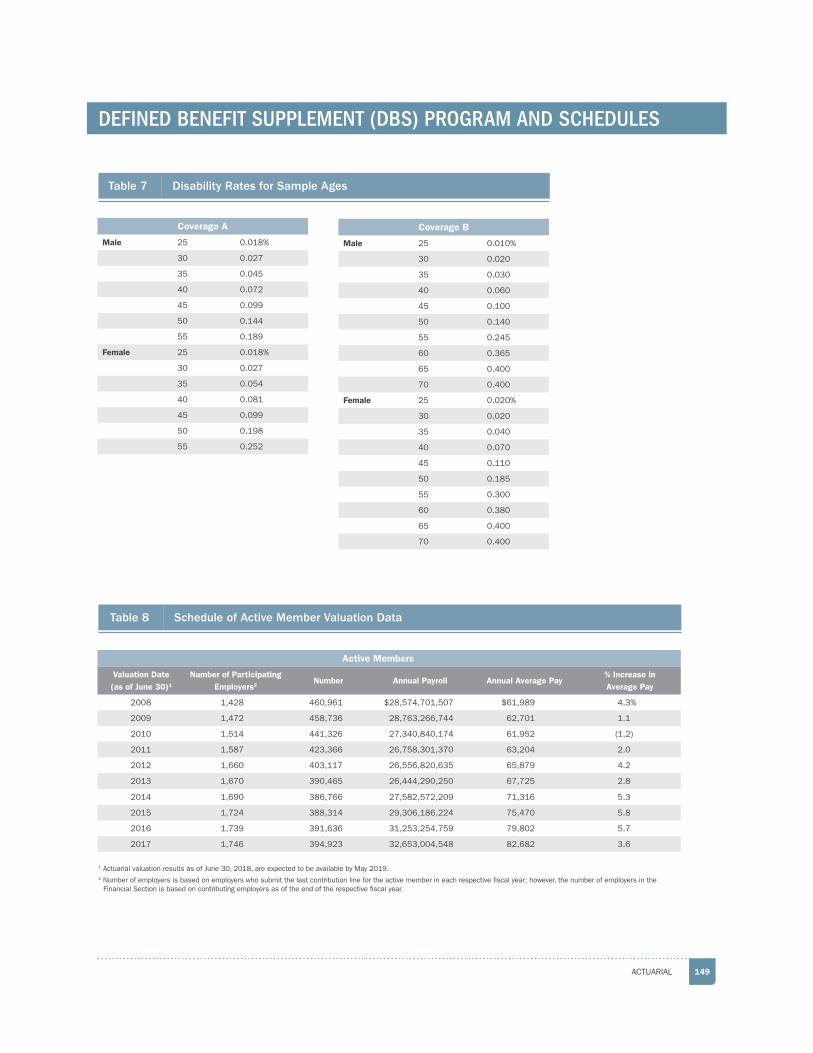
149ACTUARIAL
Coverage A
Male 25 0.018%
30 0.027
35 0.045
40 0.072
45 0.099
50 0.144
55 0.189
Female 25 0.018%
30 0.027
35 0.054
40 0.081
45 0.099
50 0.198
55 0.252
Coverage B
Male 25 0.010%
30 0.020
35 0.030
40 0.060
45 0.100
50 0.140
55 0.245
60 0.365
65 0.400
70 0.400
Female 25 0.020%
30 0.020
35 0.040
40 0.070
45 0.110
50 0.185
55 0.300
60 0.380
65 0.400
70 0.400
Active Members
Valuation Date
(as of June 30)1
Number of Participating
Employers2Number Annual Payroll Annual Average Pay
% Increase in
Average Pay
2008 1,428 460,961 $28,574,701,507 $61,989 4.3%
2009 1,472 458,736 28,763,266,744 62,701 1.1
2010 1,514 441,326 27,340,840,174 61,952 (1.2)
2011 1,587 423,366 26,758,301,370 63,204 2.0
2012 1,660 403,117 26,556,820,635 65,879 4.2
2013 1,670 390,465 26,444,290,250 67,725 2.8
2014 1,690 386,766 27,582,572,209 71,316 5.3
2015 1,724 388,314 29,306,186,224 75,470 5.8
2016 1,739 391,636 31,253,254,759 79,802 5.7
2017 1,746 394,923 32,653,004,548 82,682 3.6
Table 8 Schedule of Active Member Valuation Data
1 Actuarial valuation results as of June 30, 2018, are expected to be available by May 2019.2 Number of employers is based on employers who submit the last contribution line for the active member in each respective fiscal year; however, the number of employers in the
Financial Section is based on contributing employers as of the end of the respective fiscal year.
DEFINED BENEFIT SUPPLEMENT (DBS) PROGRAM AND SCHEDULES
Table 7 Disability Rates for Sample Ages

150 CALSTRS COMPREHENSIVE ANNUAL FINANCIAL REPORT 2018
Added to Rolls Removed from Rolls Rolls - End of Year
Date
(as of June 30)
Number Annual
Allowances
Number Annual
Allowances
Number Annual
Allowances
% Increase in
Annual Allowances
Average Annual
Allowances
2009 6,668 $22,090,439 1,582 $4,948,230 23,010 $55,237,098 48.1% $2,401
2010 8,796 31,707,577 1,816 6,612,662 30,048 80,571,112 45.9 2,681
2011 8,811 31,693,536 343 1,329,718 36,110 103,087,388 27.9 2,855
2012 8,257 32,650,936 2,386 11,666,909 42,055 124,148,784 20.4 2,952
2013 7,425 30,392,875 2,657 13,354,982 47,014 141,044,393 13.6 3,000
2014 6,753 27,678,797 3,115 16,285,428 50,963 153,375,082 8.7 3,010
2015 7,097 31,304,181 3,423 18,040,255 54,901 167,972,370 9.5 3,060
2016 7,324 35,828,397 3,335 17,497,131 59,075 187,434,597 11.6 3,173
2017 7,813 39,827,784 3,444 18,242,423 63,653 209,657,263 11.9 3,294
2018 7,873 40,794,850 3,535 19,256,485 68,194 231,963,834 10.6 3,402
Table 9 Schedule of Retired Members and Beneficiaries Added to and Removed from Annuity Rolls1
Aggregate Accrued Liabilities for Funding of Liabilities
Valuation Date
(as of June 30)1
(1)
Active Member
Contributions
on Deposit
(2)
Future Benefits to
Benefit Recipients
(3)
Service Already
Rendered by Active
Members (Financed
by Employer)
Actuarial Value
of Assets(1) (2) (3)
2008 $5,434,171,000 $193,173,000 $ — $5,636,113,000 100.0% 100.0% — %
2009 6,316,154,000 283,161,000 — 5,145,981,000 81.5 — —
2010 7,012,291,000 444,151,000 — 6,412,180,000 91.4 — —
2011 7,196,652,000 577,115,000 — 8,054,962,000 100.0 100.0 —
2012 7,280,977,000 710,586,000 — 8,042,090,000 100.0 100.0 —
2013 7,641,488,000 850,275,000 — 8,983,919,000 100.0 100.0 —
2014 8,077,762,000 942,945,000 — 10,493,062,000 100.0 100.0 —
2015 8,532,216,000 1,021,092,000 — 10,940,917,000 100.0 100.0 —
2016 8,604,042,000 1,200,485,000 — 10,943,296,000 100.0 100.0 —
2017 9,020,170,000 1,381,932,000 — 12,269,382,000 100.0 100.0 —
1 Actuarial valuation results as of June 30, 2018, are expected to be available by May 2019.
Table 10 Solvency Test
DEFINED BENEFIT SUPPLEMENT (DBS) PROGRAM AND SCHEDULES
1 Each year’s data populaion is a snapshot taken following year-end closings; subsequent adjustments made to snapshots of data prior to the current period are not reflected in the table.

151ACTUARIAL
Table 11 Analysis of Financial Experience (Gains and losses in unfunded actuarial obligation resulting from differences between assumed and actual experience)
Actuarial Valuation as of June 301
2017 2016
Actuarial Obligation at June 30 $9,804,527 $9,553,308
Expected Changes:
Contributions 263,200 251,393
Benefits Paid (404,737) (352,606)
Expected Earnings/Credits 705,697 712,703
Expected Actuarial Obligation at June 30 10,368,687 10,164,798
Expected Actuarial Value of Assets at June 30 11,590,017 11,656,477
Expected Unfunded Actuarial Obligation (Surplus) at June 30 (1,221,330) (1,491,679)
Actuarial (Gains) / Losses
(Gain) on Actuarial Obligation (323,511) (360,271)
(Gain) / Loss on Assets (679,365) 713,181
Total Actuarial (Gains) / Losses (1,002,876) 352,910
Additional Earnings Credit 356,926 —
Unfunded Actuarial Obligation (Surplus) at June 30 ($1,867,280) ($1,138,769)
Funded Ratio 118% 112%
1 Actuarial valuation results as of June 30, 2018, are expected to be available by May 2019.
Table 12 Schedule of Funding Progress (Dollars in Millions)
Actuarial
Valuation Date
as of June 301
Actuarial Value
of Assets
(a)
Actuarial
Accrued Liability
(AAL)
(b)
Unfunded AAL
(Funding Excess)
(UAAL)
(b-a)
Funded Ratio
(a/b)
Covered Payroll2
(c)
UAAL as a % of
Covered Payroll
((b-a)/c)
2008 $5,636 $5,627 ($9) 100% $27,118 — %
2009 5,146 6,599 1,453 78 28,763 5
2010 6,412 7,456 1,044 86 27,340 4
2011 8,055 7,774 (281) 104 27,666 (1)
2012 8,042 7,992 (50) 101 27,407 —
2013 8,984 8,492 (492) 106 27,461 (2)
2014 10,493 9,021 (1,472) 116 27,396 (5)
2015 10,941 9,553 (1,388) 115 29,991 (5)
2016 10,943 9,805 (1,138) 112 31,894 (4)
2017 12,269 10,402 (1,867) 118 33,607 (6)
Note: Information of actuarially determined and actual contributions for the State Teachers’ Retirement Plan is provided in the Financial Section, Schedule III, Contributions of Employer and Nonemployer Contributing Entity table.
1 Actuarial valuation results as of June 30, 2018, are expected to be available by May 2019.2 For the June 30, 2008 valuation, covered payroll excludes limited term incentive pay and extra service credit pay in order to present the payroll based most relevant to the funding of any
unfunded actuarial accrued liabilities of the Defined Benefit Supplement Program.
DEFINED BENEFIT SUPPLEMENT (DBS) PROGRAM AND SCHEDULES
(Dollars in Thousands)

152 CALSTRS COMPREHENSIVE ANNUAL FINANCIAL REPORT 2018
1301 Fifth Avenue Suite 3800 Seattle, WA 98101-2605 USA
Tel +1 206 624 7940 Fax +1 206 623 3485
milliman.comNovember 12, 2018
Teachers’ Retirement Board California State Teachers’ Retirement System
Re: Valuation of the Cash Balance Benefit Program
Dear Members of the Board: The basic financial goal of the Cash Balance Benefit (CBB) Program of the California State Teachers' Retirement System (CalSTRS) is to maintain sufficient resources to fully fund the obligations. Annual actuarial valuations measure the progress toward this goal, as well as test the adequacy of the contribution rates.
CalSTRS measures its funding status as the Funded Ratio of the actuarial value of valuation assets over the actuarial accrued liabilities. The funding status based on the past three actuarial valuations is shown below:
Valuation Date Funded Ratio June 30, 2015 113% June 30, 2016 109% June 30, 2017 116%
The actual return was greater than the assumed return for the fiscal year ended in 2017 which, combined with other factors, caused an increase in the Funded Ratio. As of June 30, 2017, the Market Value of Assets for the CBB Program exceeds the Actuarial Obligation. Additional interest credits were granted based on the Program’s funded level and are reflected in the Funded Ratio shown above. Prior to the additional credits, the Funded Ratio was 120%.
The June 30, 2017 valuation results are based on the membership data and the asset information provided by CalSTRS. In our examination of these data, we have found them to be reasonably consistent and comparable with data used for other purposes, although we have not audited the data at the source. Since the valuation results are dependent on the integrity of the data supplied, the results can be expected to differ if the underlying data is incomplete or missing. It should be noted that if any data or other information is found to be materially inaccurate or incomplete, our calculations will need to be revised.
Milliman did not prepare the summaries or schedules shown in the Financial and Actuarial Sections. However, the actuarial information contained in the Financial Section and in this Actuarial Section was derived from our June 30, 2017 actuarial valuation report for funding and our GASB 67/68 report which communicated the actuarial results for financial reporting for June 30, 2018.
The actuarial computations presented in the valuation report are for purposes of determining the recommended funding amounts for CalSTRS consistent with our understanding of their funding requirements and goals. The liabilities are determined by using the traditional unit credit funding method. The actuarial assets are equal to fair market value.
ACTUARY’S CERTIFICATION LETTER—CBB PROGRAM

153ACTUARIAL
Teachers' Retirement BoardNovember 12, 2018
Page 2
The funding valuation is based on our understanding of the current benefit provisions of the CBB Program and the actuarial assumptions adopted by the Board. The assumptions are reviewed annually for reasonableness, with a detailed experience analysis completed every four or five years. The last detailed experience analysis was completed in February of 2017 when the Board adopted the current assumptions. The assumptions are scheduled to be reviewed in detail again for use in the June 30, 2019 funding valuation and the GASB 67/68 valuation for reporting date June 30, 2020. The assumptions and methods used for financial reporting under GASB 67/68 are the same as the funding valuation assumptions with the following exceptions:
1. The discount rate of 7.10% is gross of administrative expenses; and 2. The individual entry age normal cost method is used.
For financial reporting purposes, all programs within the State Teachers’ Retirement Plan are reported in aggregate.
We believe the actuarial assumptions and methods are internally consistent, reasonable and meet the parameters of Governmental Accounting Standards Board Statement Numbers 67, 68 and 82 for fulfilling financial accounting requirements and meet the parameters set forth in the relevant Actuarial Standards of Practice (ASOPs). Nevertheless, the emerging costs will vary from those presented in our report to the extent that actual experience differs from that projected by the actuarial assumptions. Future actuarial measurements may differ significantly from the current measurements as presented in the valuation report due to many factors. Due to the limited scope of our assignment, we did not perform an analysis of the potential range of future measurements.
Our valuation report and this letter have been prepared exclusively for CalSTRS for a specific and limited purpose. Milliman does not intend to benefit and assumes no duty or liability to other parties who receive this work. It is a complex, technical analysis that assumes a high level of knowledge concerning CalSTRS operations, and uses CalSTRS data, which Milliman has not audited. No third party recipient of Milliman’s work product should rely upon Milliman’s work product. Such recipients should engage qualified professionals for advice appropriate to their own specific needs.
The consultants who worked on these assignments are pension actuaries. Milliman’s advice is not intended to be a substitute for qualified legal or accounting counsel. The signing actuaries are independent of the plan sponsor. We are not aware of any relationship that would impair the objectivity of our work.
We certify that the June 30, 2017 valuation was performed in accordance with the Actuarial Standards Board (ASB) standards of practice and by qualified actuaries. We are members of the American Academy of Actuaries and have experience in performing valuations for public retirement systems.
Respectfully submitted,
Mark Olleman, FSA, EA, MAAA Nick Collier, ASA, EA, MAAA Julie Smith, FSA, EA, MAAA Principal and Consulting Actuary Principal and Consulting Actuary Valuation Actuary
ACTUARY’S CERTIFICATION LETTER—CBB PROGRAM

154 CALSTRS COMPREHENSIVE ANNUAL FINANCIAL REPORT 2018
Actuarial MethodsThe Cash Balance Benefit (CBB) Program was established July 1, 1996. In order to value and fund the CBB Program, CalSTRS has adopted the following actuarial methods.
Actuarial Cost Method For funding purposes, the traditional unit credit cost method was selected for the CBB Program since the projected benefits of each individual member are allocated by a consistent formula to valuation years. As a result, the actuarial obligation is equal to the accumulated account balances, and the normal cost is equal to the total annual contribution. The CBB Program does not provide cost-of-living adjustments for benefit recipients.
Asset Valuation Method The CBB Program uses the fair market value of assets for actuarial valuation purposes. Asset smoothing is not used for this program.
Funding Method Generally, participant contributions are 4 percent of salary, and employer contributions are 4 percent of salary.
Rules for contribution rates may differ for participants covered by a collective bargaining agreement, but the sum of the participant and employer contributions must equal or exceed 8 percent of salary. The employer contribution rate cannot be less than 4 percent of salary and the participant rate cannot be less than the employer rate.
The board may adjust employer contributions for a fixed number of years, but the adjustment shall not exceed 0.25 percent of salaries in any plan year.
There is currently no provision in the Education Code to increase contributions to make up for any future shortfalls, if they were to occur. However, the assumed return on investments exceeds the Minimum Interest Rate. To the extent that the assets earn more than the accounts are credited in the future, this may be sufficient to make up any
potential shortfall.
Financial Reporting Method Under GASB 67, financial reporting for the State Teachers’ Retirement Plan (STRP) includes the Defined Benefit, Defined Benefit Supplement, Cash Balance Benefit, Supplemental Benefit Maintenance Account and Teachers’ Replacement Benefits programs. For financial reporting, the aggregate assets of all programs in the State Teachers’
Retirement Plan on a market basis are used in the determination of the Net Pension Liability.
GASB 67 also specifies that, for financial reporting purposes, the entry age normal cost method should be used to calculate pension liability.
Actuarial AssumptionsThe actuarial valuation utilizes two different types of assumptions: economic and demographic. Economic assumptions are related to the general economy and its impact on CalSTRS. Demographic assumptions predict the future experience of the membership with respect to eligibility and benefits and are directly related to the specific experience of CalSTRS members.
The assumptions for this program will have minimal impact under the traditional unit credit cost method or only have significance when participants elect to annuitize the account balance. Under the program, a participant must have at least $3,500 in their account to elect to annuitize the account balance.
CalSTRS, through its consulting actuary, performs an experience study every four or five years to determine appropriate demographic and economic assumptions. These assumptions are then applied when the consulting actuary performs an actuarial valuation to monitor the funding status of the CBB Program. The most recent experience study examined data for the five year period spanning July 1, 2010, through June 30, 2015, and was adopted by the board in February 2017.
Below is a summary of the different types of assumptions used.
Economic Assumptions The two major economic assumptions are investment return and wage growth, and each is affected by the underlying assumed rate of inflation. The assumption for investment return, also known as the discount rate, is 6.50 percent, net of investment and administrative expenses. The assumption for general wage increase is 3.50 percent, of which 2.75 percent is due to inflation and 0.75 percent is due to expected gain in productivity.
As required by GASB 67, for financial reporting the discount rate is net of investment expenses but gross of administrative expenses, equivalent to 7.10%.
CASH BALANCE BENEFIT (CBB) PROGRAM AND SCHEDULES

155ACTUARIAL
Table 5 provides a summary of the economic actuarial assumptions for this program as reflected in the most recent actuarial valuation.
Demographic Assumptions Demographic assumptions are based upon the most recent CalSTRS experience study and include assumptions for postretirement mortality, probabilities of retirement, disability or withdrawal from the system, assumptions for pay increases due to promotions and various other assumptions needed to value the benefits.
Tables 1–4 and 6–7 provide a summary of the demographic assumption information for this program as reflected in the most recent actuarial valuation.
Changes Since Prior ValuationChanges in Actuarial Methods
There were no changes in the actuarial methods for the Cash Balance Benefit Program.
Changes in Actuarial Assumptions On February 1, 2017, the board lowered the discount rate from 7.00 percent to 6.50 percent using a phased in approach. The June 30, 2016, actuarial valuation used a discount rate of 6.75 percent. For the June 30, 2017, actuarial valuation the discount rate was reduced to 6.50 percent.
Changes in Plan Provisions On May 10, 2018, the board adopted a 3.62 percent additional earnings credit for the fiscal year ending June 30, 2017.
Valuation ResultsThe most recent actuarial valuation was completed as of June 30, 2017. This valuation determined there was an actuarial surplus of $50,324,000 before the awarding of any additional earnings credit. The valuation was presented to the board on May 10, 2018, at which time the board adopted an additional earnings credit of 3.62 percent for the fiscal year ending June 30, 2017. After awarding the additional earnings credit, the actuarial surplus was reduced to $41,465,000.
Tables 8–12 provide summaries of the valuation results.
Independent Actuarial ReviewActuarial services for CalSTRS are provided under contract by a qualified independent actuarial firm, with additional review provided by CalSTRS actuarial staff. The current actuarial firm, Milliman, has been the program’s actuarial firm since January 15, 2000.
In addition to the review performed by CalSTRS actuarial staff, all independent actuarial services are subject to a periodic independent review. The selection of the firm performing the independent review is done generally every five years through the competitive bid process.
A review of the 2016 Actuarial Experience Study and the assumptions specific to the CBB Program was performed by the actuarial firm Cheiron. The result of the review was reported to the board on February 1, 2017. Cheiron found the recommendations made by Milliman in the 2016 Actuarial Experience Study to be reasonable, and the work performed by Milliman on the experience study meets the Actuarial Standards of Practice.
A review of the 2015 Actuarial Valuation of the CBB Program was also performed by Cheiron. The result of the review was reported to the board on April 6, 2017. Overall, Cheiron was able to replicate the results of the actuarial valuation with no material differences. Cheiron commented that the actuarial valuation was performed by qualified actuaries and in accordance with generally accepted actuarial principles. Cheiron further stated that appropriate methods, checking and reviewing procedures were followed in the preparation of the valuation and that the communication in the valuation report was clear and complete given the underlying plan of the benefits.
Summary of Cash Balance Benefit Program ProvisionsThe following is a summary of the provisions used in the valuation of this program.
Membership
Eligibility Requirement—Membership if employed at less than 50 percent of a full-time position for a California school district, community college district or county office of education that has elected to offer the Cash Balance Benefit Program.
CASH BALANCE BENEFIT (CBB) PROGRAM AND SCHEDULES

156 CALSTRS COMPREHENSIVE ANNUAL FINANCIAL REPORT 2018
Extended eligibility to members hired by a community college district to perform creditable service on a part-time or temporary basis (semester to semester) or for not more than 60 percent of the hours per week considered a regular full-time assignment.
Participant—An eligible employee with creditable service subject to coverage who has contributions credited in the program or is receiving an annuity from the program.
Account Balance
Account Balance—Nominal accounts established for the purpose of determining benefits payable to the participant. Accounts are credited with contributions, minimum interest rate and additional earnings credits.
Contributions—Generally, participant contributions are 4 percent of salary, and employer contributions are 4 percent of salary.
Rules for contribution rates may differ for participants covered by a collective bargaining agreement, but the sum of the participant and employer contributions must equal or exceed 8 percent of salary. The employer contribution rate cannot be less than 4 percent of salary and the participant rate cannot be less than the employers rate.
The board may adjust employer contributions for a fixed number of years, but the adjustment shall not exceed 0.25 percent of salaries in any plan year.
Minimum Interest Rate—Annual rate determined for the plan year by the board in accordance with federal laws and regulations. The minimum interest rate is equal to the average of the yields on 30-year Treasury Notes for the 12 months ending in February preceding the beginning of the plan year, rounded to the next highest basis point.
Additional Earnings Credit—Annual rate determined for the plan year by the board based on the actual earnings during the plan year, but only to the extent the earnings are sufficient to credit the minimum interest rate and provide any additions to the gain and loss reserve deemed warranted by the board. The board adopted an additional earnings credit of 3.62 percent for the fiscal year ending June 30, 2017.
Normal Retirement
Eligibility Requirement—Age 60.
Benefit—The account balance at the retirement date subject to limits imposed under IRC section 415. For participants hired on or after January 1, 2013, salary credited to CalSTRS from all employers is capped at $143,082 for 2017–18 fiscal year. The limit is adjusted each fiscal year based on the changes in the Consumer Price Index for all Urban Consumers: U.S. City Average.
Form of Payment—The normal form of payment is a lump-sum distribution. Annuity options are available if the sum of the employer and employee accounts equals or exceeds $3,500.
Early Retirement
Eligibility Requirement—Age 55.
Benefit and Form of Payment—Same as Normal Retirement.
Late Retirement
Benefit and Form of Payment—Same as Normal Retirement. Contributions and interest continue to be credited to the account balances until distributed.
Deferred Retirement
Benefit—A participant may cease active service, leave the accumulated account balance on deposit and later retire upon attaining the minimum age requirement.
Disability Benefit
Eligibility Requirement—Determination by the board that the participant has a total and permanent disability.
Benefit—The account balance at the date of disability. An annuity benefit is discontinued if the participant is re-employed before age 60 and performs service creditable under the program.
Form of Payment—Same as Normal Retirement.
Death Before Retirement
Eligibility Requirement—Deceased participant has an account balance.
Benefit—The account balance at the date of death payable to the designated beneficiary.
CASH BALANCE BENEFIT (CBB) PROGRAM AND SCHEDULES

157ACTUARIAL
CASH BALANCE BENEFIT (CBB) PROGRAM AND SCHEDULES
Form of Payment—Normal distribution is a lump-sum benefit. A participant’s beneficiary may elect to receive the benefit in the form of a period-certain annuity if the sum of the balance of credits to the participant’s employee and employer accounts is $3,500 or more.
Death After Retirement
Eligibility Requirement—The deceased participant was receiving an annuity.
Benefit—According to the terms of the annuity elected by the participant.
Termination from the Program
Eligibility Requirement—More than five years has elapsed since the most recent termination benefit, if any, has been paid.
Benefit and Form of Payment—Lump-sum distribution of the account balance as of the date of distribution. The benefit is payable six months from the termination of creditable service.

158 CALSTRS COMPREHENSIVE ANNUAL FINANCIAL REPORT 2018
All demographic assumptions used in the actuarial valuation were adopted by the board when the experience study was adopted on February 1, 2017. The following are the assumptions adopted by the board for this program. Tables 2, 3, 4 and 7 are used in the GASB 67 financial reporting valuation and not for the the funding valuation.
Male Female
Duration Duration
0 16.0% 0 15.0%
1 11.0 1 9.0
2 8.5 2 7.0
3 6.3 3 5.5
4 4.0 4 4.0
5 3.5 5 3.0
10 1.8 10 1.8
15 1.2 15 1.2
20 0.9 20 0.9
25 0.7 25 0.7
Table 3 Probabilities of Withdrawal from Active Service Before Age and Service Retirement for Sample Duration in Years
Male Female
Age 2017 2017
50 0.240% 0.133%
55 0.354 0.211
60 0.474 0.280
65 0.674 0.422
70 1.079 0.696
75 1.936 1.280
80 3.553 2.455
85 6.831 4.896
90 9.948
95 22.456 18.616
Table 1 Postretirement Mortality for Sample Ages
2% at 60 Members 2% at 62 Members
Age 1990
Benefits
Under 30
Years
30 or More
Years
All Years
Male 55 5.8% 2.7% 6.0% 3.0%
60 25.0 6.3 25.0 9.0
65 20.0 14.0 32.5 30.0
70 100.0 12.0 25.0 20.0
75 100.0 100.0 100.0 100.0
Female 55 7.0% 3.5% 8.0% 4.0%
60 22.0 7.0 29.0 9.0
65 18.0 17.0 37.5 30.0
70 100.0 14.0 30.0 20.0
75 100.0 100.0 100.0 100.0
1 Probabilities of retirement are adjusted for members with service between 25 and 30 years.
Table 2 Probabilities of Retirement for Sample Ages1
CASH BALANCE BENEFIT (CBB) PROGRAM AND SCHEDULES
13.161

159ACTUARIAL
Entry Ages
Duration Under 25 25–29 30–34 35–39 40–44 45+
1 6.4% 5.8% 5.3% 4.8% 4.5% 3.7%
5 5.2 4.8 4.3 3.9 3.8 2.8
10 3.7 3.4 3.0 2.7 2.5 1.8
20 1.3 1.2 1.2 0.8 0.8 0.6
30 0.9 0.8 0.7 0.5 — —
40 0.8 0.7 — — — —
Table 4 Assumption for Pay Increases Due to Promotions and Longevity for Sample Ages in Years (Exclusive of the assumed general wage increase, which includes inflation)
Table 6 Mortality Assumptions
Consumer Price Inflation 2.75%
Investment Yield (Net of Expenses) 6.50
Wage Inflation 3.50
Interest on Member Accounts 6.50
Table 5 Economic Assumptions
1 For future years, the projected improvement is based on 110% of the MP-2016 Ultimate Projection Scale.
2Select rates in first three years for both Males and Females.
CASH BALANCE BENEFIT (CBB) PROGRAM AND SCHEDULES
Retired Members1
Male 2016 CalSTRS Retired Male
Female 2016 CalSTRS Retired Female
Active Members
Male RP-2014 White Collar Employee Male set back 2 years
Female RP-2014 White Collar Employee Female set back 2 years
Beneficiaries1
Male 2016 CalSTRS Retired Male
Female 2016 CalSTRS Retired Female
Disabled1,2
Male RP-2014 Disabled Retiree Male set back 2 years
Female RP-2014 Disabled Retiree Female set back 2 years

160 CALSTRS COMPREHENSIVE ANNUAL FINANCIAL REPORT 2018
Coverage A
Male 25 0.018%
30 0.027
35 0.045
40 0.072
45 0.099
50 0.144
55 0.189
Female 25 0.018%
30 0.027
35 0.054
40 0.081
45 0.099
50 0.198
55 0.252
Coverage B
Male 25 0.010%
30 0.020
35 0.030
40 0.060
45 0.100
50 0.140
55 0.245
60 0.365
65 0.400
70 0.400
Female 25 0.020%
30 0.020
35 0.040
40 0.070
45 0.110
50 0.185
55 0.300
60 0.380
65 0.400
70 0.400
Table 7 Disability Rates for Sample Ages
Active Members
Valuation Date
(as of June 30)1
Number of Participating
Employers2Number Annual Payroll Annual Average Pay
% Increase In
Average Pay
2008 33 11,627 $181,104,000 $15,576 14.0%
2009 33 11,332 182,871,332 16,138 3.6
2010 33 10,378 163,248,119 15,730 (2.5)
2011 33 9,923 158,501,388 15,973 1.5
2012 33 9,273 151,284,621 16,315 2.1
2013 31 9,129 151,281,260 16,572 1.6
2014 32 9,955 175,058,251 17,585 6.1
2015 33 10,416 193,075,185 18,536 5.4
2016 30 10,676 211,259,529 19,788 6.8
2017 30 10,480 220,767,125 21,066 6.5
Table 8 Schedule of Active Participant Valuation Data
CASH BALANCE BENEFIT (CBB) PROGRAM AND SCHEDULES
1 Actuarial valuation results as of June 30, 2018, are expected to be available by May 2019.2 Number of employers is based on employers who submit the last contribution line for the active member in each respective fiscal year; however, the number of employers in the Financial Section
is based on contributing employers as of the end of the respective fiscal year.

161ACTUARIAL
Added to Rolls Removed from Rolls Rolls–End of Year
Date
(as of June 30)
Number Annual
Allowances
Number Annual
Allowances
Number Annual
Allowances
% Increase in
Annual Allowances
Average Annual
Allowances
2009 12 $29,184 2 $4,104 33 $81,935 44.3% $2,483
20102 18 55,193 5 23,079 46 114,047 39.2 2,479
2011 24 66,664 2 6,899 68 173,813 52.4 2,556
2012 42 139,297 5 18,110 105 294,000 69.1 2,800
2013 30 132,912 8 26,578 127 401,112 36.4 3,158
2014 42 212,087 10 43,746 159 568,682 41.8 3,577
2015 52 164,451 11 74,583 200 658,550 15.8 3,293
20163 62 261,067 10 43,035 252 841,230 27.7 3,338
2017 80 430,331 22 87,768 310 1,223,947 45.5 3,948
2018 85 475,148 25 159,001 370 1,539,585 25.8 4,161
1 Each year’s data populaion is a snapshot taken following year-end closings; subsequent adjustments made to snapshots of data prior to the current period are not reflected in the table.2 Revised add count for 2010 as a result of subsequent years’ end counts changed in 2015.3 Revised add count for 2016 in 2017.
Table 9 Schedule of Retired Participants and Beneficiaries Added to and Removed from Annuity Rolls1
Aggregate Accrued Liabilities for Funding of Liabilities
Valuation Date
(as of June 30)1
(1)
Active Member
Contributions
on Deposit
(2)
Future Benefit
to Benefit
Recipients
(3)
Service Already
Rendered by Active
Members (Financed by
Employer)
Actuarial Value
of Assets(1) (2) (3)
2008 $97,802,000 $229,000 $ — $98,892,000 100.0% — %
2009 114,338,000 354,000 — 91,793,000 80.2 — —
2010 129,065,000 509,000 — 114,418,000 88.7 — —
2011 143,695,000 767,000 — 151,248,000 100.0 100.0 —
2012 156,600,000 1,386,000 — 158,020,000 100.0 100.0 —
2013 174,171,000 1,952,000 — 188,551,000 100.0 100.0 —
2014 194,792,000 3,061,000 — 231,671,000 100.0 100.0 —
2015 215,851,000 3,843,000 — 248,699,000 100.0 100.0 —
2016 230,864,000 4,974,000 — 256,675,000 100.0 100.0 —
2017 253,572,000 7,411,000 — 302,448,000 100.0 100.0 —
Table 10 Solvency Test
CASH BALANCE BENEFIT (CBB) PROGRAM AND SCHEDULES
100.0%
1 Actuarial valuation results as of June 30, 2018, are expected to be available by May 2019.

162 CALSTRS COMPREHENSIVE ANNUAL FINANCIAL REPORT 2018
Actuarial Valuation as of June 301
2017 2016
Actuarial Obligation at June 30 $235,838 $219,694
Expected Changes:
Contributions 18,066 16,021
Benefits Paid (12,502) (7,045)
Expected Earnings/Credits 16,107 15,693
Expected Actuarial Obligation at June 30 257,509 244,363
Expected Actuarial Value of Assets at June 30 279,752 275,398
Expected Unfunded Actuarial Obligaion (Surplus) at June 30 (22,243) (31,035)
Actuarial (Gains) / Losses
(Gain) on Actuarial Obligation (5,385) (8,525)
(Gain) / Loss on Assets (22,696) 18,723
Total Actuarial (Gains) / Losses (28,081) 10,198
Additional Earnings Credit 8,859 —
Unfunded Actuarial Obligation (Surplus) at June 30 ($41,465) ($20,837)
Funded Ratio 116% 109%
Table 12 Schedule of Funding Progress (Dollars in Millions)
Actuarial
Valuation Date
as of June 301
Actuarial Value of
Assets
(a)
Actuarial Accrued
Liability
(AAL)
(b)
Unfunded AAL
(Funding Excess)
(UAAL)
(b-a)
Funded Ratio
(a/b)
Covered Payroll
(c)
UAAL as a % of
Covered Payroll
((b-a)/c)
2008 $99 $98 ($1) 101% $181 (1%)
2009 92 115 23 80 182 13
2010 114 130 16 88 163 10
2011 151 144 (7) 105 158 (4)
2012 158 158 — 100 151 —
2013 189 176 (13) 107 151 (9)
2014 232 198 (34) 117 174 (20)
2015 249 220 (29) 113 192 (15)
2016 257 236 (21) 109 209 (10)
2017 302 261 (41) 116 218 (19)
Note: Information of actuarially determined and actual contributions for the State Teachers’ Retirement Plan is provided in the Financial Section, Schedule III, Schedule of Pension Contributions from Employers and Nonemployer Contributing Entity.
CASH BALANCE BENEFIT (CBB) PROGRAM AND SCHEDULES
Table 11 Analysis of Financial Experience (Gains and losses in unfunded actuarial obligation resulting from differences between assumed and actual experience)(Dollars in Thousands)
1 Actuarial valuation results as of June 30, 2018, are expected to be available by May 2019.
1 Actuarial valuation results as of June 30, 2018, are expected to be available by May 2019.

163ACTUARIAL
�
��������������������������������������������������������
���� �������������������� ����������������
�������� ����
�
������������������
�������� ������������!����������������������������� �������������"�������
��!""#$%&"�("��)*+,-./"0*+",1�"2�3-45+�"6+�7-87"6597�.,"6+*/+57""
#�������������������!����$���������������������%����������������������������"�����������%�������������������������������������������������"���������������������������������������������������������"��������������%������ ����������������������������������������"�"���������"�� ��"����������������������������������������%������� ���������%��� ��������������������������� ���������������������� �
��������%�����������������"���������������"����"���%�������� ��������������������������������������#!���%���������������������������� �¡������!�����������������&������%������"����� ����������������������¢���������������������������"������������������������#!���%�����������������������������"���������%������������'��� ��������������������������������������������������(��!������������% ������%���������������������������������%���������%���������"��������������������(��!����������� �¡� �������������������������������������������������������������������������������������#!���%��������������������%������������������������������������%�������������������������������������������������������������� ��
���������������������������������������������������������������������������������������������������������"������� �£��������������������������������� ���������������������������������"��������������������������� ����������������������������������������%�� ����������������������������������������� ������������������������������������������������������%���"��������������������������������������������������������������������������"��%�����������������������������% �£����������������������������"���������������������������������������������������"�������������������������������������������� ���������������������� ��
������������������������������������������������������� ����������������������������������������� �¡� ������������������������������������������������������������������������������������������������� ������������������������������������������������������������ ��
������������������������������������������%����������������������������������������������%���������������������������������� ����� �������������� ����������������"�����!�������������������"������������% ��
��������������������������������������������������������������"���������������������������������������������������(���������������������%�����������!����������������� �����������������%��������������������%���¤������������������������������������������������������������������������������������������������� �£����������������������� �������������������������������� ��������������������������������������������������������������������������������� �����������������������%��%������� �������"������������������������������������������������������������������������������������������������������"�������������������������� ���������������������������������"����������%���������"���������������������������������������������������
ACTUARY’S CERTIFICATION LETTER—MPP PROGRAM

164 CALSTRS COMPREHENSIVE ANNUAL FINANCIAL REPORT 2018
ACTUARY’S CERTIFICATION LETTER—MPP PROGRAM
����������������������!������
�������������������%����
���������������������������"�������� �#�����������������������������������%������� �������������������������"������������������������%������������������������ ��
������������������������������������������������������������������"���������������������������������������������� �������������������������������������������������������"������������"������������������ ���������������� ��& �£������������������������������"���������������������%�����������&�� ���%�����������%������������������������������������������ ����������������������������� ��������������"���������������������� �� ��&�������������������"�������������� �� ��&�������� ��������������������������%�%��¤�������������������������������������������������������� ���������������� �
���������������� ��� ��&����������������%���������������������������� ��������� ������������������������������������������������¤�����������%���������������%�������� �������%���%���������������������������������������������� ������������� ���������"������������������� ��������������������������"�������� ��& �
£���������������������������������������������������������"�(��!������������%��������� �!���������������������������������������������������������������������%�����������������������������������������%���������������������������������������)��������������������������� �£�������������������������������������������������������������������������"������������������������#!���%����������������������������������"���������%������������ �
���������"���������������������������������� ��������������������������� ����������������������������!��������!�����������������������������"�¤������������������ ��������������������������������������"����������������������������������������������%�����������������������������������"����� �
�����������"�������������
���&���������������*��������� ���&��������������*�������� #�����������������*�����������������������������%�������"�� ���������������������%�������"� ���������������������%�������"�
�

165ACTUARIAL
Actuarial MethodsThe Medicare Premium Payment (MPP) Program is a cost-sharing multiple-employer other postemployment benefit plan established on January 1, 2001, pursuant to Chapter 1032, Statutes of 2000 (SB1435). CalSTRS administers the MPP Program, through the Teachers’ Health Benefit Fund (THBF). In order to value and fund the MPP Program, CalSTRS has adopted the following actuarial methods.
Actuarial Cost Method
The MPP Program is funded on a pay-as-you-go basis. This method of funding the MPP Program was selected because the MPP Program was established out of the actuarial surplus of the DB Program.
Asset Valuation Method
The program assets are valued as the allocated value of DB Program Assets. This figure is equal to the actuarial obligation of the MPP Program benefits. Asset smoothing is not used for this program.
Funding Method
The MPP Program is funded on a pay-as-you go basis from a portion of monthly employer contributions. In accordance with California Education Code Section 25930 and board policy, contributions that would otherwise be credited to the Defined Benefit (DB) Program each month are instead credited to the MPP Program to fund monthly program and administrative costs. The funding method does not require an amortization method for any unfunded actuarial obligation or surplus. Actuarial gains and losses are funded as they occur through the pay-as-you go method described above. There are no retiree contributions, per capita claims costs or pay increase assumptions.
Financial Reporting Method
For financial reporting purposes, the actuarial cost method used is the Individual Entry Age Normal method as specified by GASB 74. The asset valuation method is fair market value of assets.
Actuarial AssumptionsThe actuarial valuation utilizes two different types of assumptions: economic and demographic. Economic assumptions are related to the general economy and its impact on CalSTRS. Demographic assumptions predict
the future experience of the membership with respect to eligibility and benefits and are directly related to the specific experience of CalSTRS members.
CalSTRS, through its consulting actuary, performs an experience study every four or five years to determine appropriate demographic and economic assumptions. An experience study specific to the MPP Program is performed every two years to determine healthcare-related assumptions. These assumptions are then applied when the consulting actuary performs an actuarial valuation to monitor the funding status of the MPP Program. The most recent experience study for demographic, economic and healthcare-related assumptions examined data for the five-year period spanning July 1, 2010, through June 30, 2015, and was adopted by the board in February 2017.
Below is a summary of the different types of assumptions used.
Economic Assumptions
The economic assumptions used for valuation purposes are the investment return, medical inflation, and rate of inflation. The assumption for investment return, also known as the discount rate, is 7.00 percent, net of investment and administrative expenses. The assumption for premium cost trend rates vary by year; however, the increases are approximately equivalent to a 3.7 percent and 4.1 percent increase each year for Medicare Part A and Part B, respectively. The assumption for price inflation is 2.75 percent.
For financial reporting the discount rate is 3.87 percent, net of investment expenses but gross of administrative expenses. The discount rates are based on the rate for 20-year, tax exempt general obligation municipal bonds with an average rating of AA/Aa or higher as specified in GASB. The Teachers’ Retirement Board has adopted The Bond Buyer’s 20-Bond GO Index for these purposes.
Table 5 provides a summary of the economic actuarial assumptions for this program as reflected in the most recent actuarial valuation.
Demographic Assumptions
The MPP Program is closed to new entrants. Members who retire on or after July 1, 2012, are not eligible for coverage under the MPP Program. As such, assumptions related to active members are not applicable to this program.
MEDICARE PREMIUM PAYMENT (MPP) PROGRAM AND SCHEDULES

166 CALSTRS COMPREHENSIVE ANNUAL FINANCIAL REPORT 2018
The primary demographic assumptions are postretirement mortality rates and program enrollment rates.
Tables 1, 6 and 9 provide a summary of the demographic assumption information for this program as reflected in the most recent actuarial valuation.
Changes Since Prior Valuation
Changes in Actuarial Methods
There were no changes in the actuarial methods for the Medicare Premium Payment Program.
Changes in Actuarial Assumptions
On February 1, 2017, the board lowered the discount rate from 7.50 percent to 7.00 percent using a phased in approach. The June 30, 2016, actuarial valuation used a discount rate of 7.25 percent. For the June 30, 2017, actuarial valuation the discount rate was reduced to 7.00 percent.
The discount rate used for 2018 financial reporting was 3.87 percent, an increase of 0.29 percent from 3.58 percent used for 2017 financial reporting.
Changes in Plan Provisions
There were no changes in the plan provisions for the MPP Program.
Valuation ResultsThe most recent actuarial valuation of the MPP Program was completed as of June 30, 2017. The valuation indicated that the current program assets, along with MPP-allocated funding from future employer contributions that would otherwise have been credited to the DB Program, were sufficient to finance the future MPP Program obligations of $302.2 million for both Part A premiums and Part B penalties. Note that in prior years the MPP Program funding valuation was performed every two years. In order to meet the timing requirements of GASB 74/75 the valuation is now performed annually.
Tables 10–13 provide summaries of the valuation results.
MEDICARE PREMIUM PAYMENT (MPP) PROGRAM AND SCHEDULES
Independent Actuarial ReviewActuarial services for CalSTRS are provided under contract by a qualified independent actuarial firm, with additional review provided by CalSTRS actuarial staff. The current actuarial firm, Milliman, has been the program’s actuarial firm since January 15, 2000.
In addition to the review performed by CalSTRS actuarial staff, all independent actuarial services are subject to a periodic independent review. The selection of the firm performing the independent review is done generally every five years through the competitive bid process.
A review of the assumptions specific to the MPP Program was performed by the actuarial firm Cheiron. The result of the review was reported to the board on February 1, 2017. Cheiron found the recommendations made by Milliman for the assumptions specific to the MPP Program to be reasonable, and the work performed by Milliman meets the Actuarial Standards of Practice.
A review of the 2014 Actuarial Valuation of the MPP Program was also performed by Cheiron. The result of the review was reported to the board on April 6, 2017. Overall, Cheiron was able to replicate the results of the actuarial valuation with no material differences. Cheiron commented that the actuarial valuation was performed by qualified actuaries and in accordance with generally accepted actuarial principles. Cheiron further stated that appropriate methods, checking and reviewing procedures were followed in the preparation of the valuation and that the communication in the valuation report was clear and complete given the underlying plan of the benefits.
Summary of Medicare Premium Payment Program Plan Provisions
The following is a summary of the provisions used in the valuation of this program.

167ACTUARIAL
MEDICARE PREMIUM PAYMENT (MPP) PROGRAM AND SCHEDULES
Membership
Eligibility Requirement – Part A DB Member – satisfies either:1. Retired or disabled prior to January 1, 2001; age 65 or above; enrolled in Medicare Part A and Part B; and not eligible for Part A without premium payment
or
2. Meet all above requirements, except retired or disabled before July 1, 2012; district completed a Medicare Division election prior to retirement; and active member voted yes if they were less than 58 years of age at the time of the election
Spouse Eligibility – Spouses of members are not eligible to participate in the program.
The MPP Program is closed to new entrants as members who retire on or after July 1, 2012, are not eligible for coverage under the MPP Program.
Eligibility Requirement – Part B Late Penalty Surcharges Only those currently enrolled are eligible.
Benefits PaidPremium payments are made directly to the Centers for Medicare and Medicaid Services (CMS) on a monthly basis. Medicare Part A premium rates for fiscal year 2017–18 are as follows:
Part A and B late enrollment penalties are generally 10 percent of the respective monthly premium rates; however, the fees charged to individual participants may be higher based on certain income thresholds.
Based on the published premium rates during fiscal year 2017–18, Part A late enrollment surcharges were 41.30 and 42.20 for period of July 1, 2017, to December 31, 2017, and January 1, 2018, to June 30, 2018, respectively. Part B late enrollment surcharges were 13.40 for the period of July 1, 2017, to June 30, 2018.
1 Individuals with 30–39 quarters of Medicare covered employment pay a reduced monthly premium rate, which was $227 and $232 for the period of July 1, 2017, to December 31, 2017, and January 1, 2018, to June 30, 2018, respectively.
Medicare Part A Premium Rate¹
July 1, 2017 to December 31, 2017 $413
January 1, 2018 to June 30, 2018 422

168 CALSTRS COMPREHENSIVE ANNUAL FINANCIAL REPORT 2018
Demographic assumptions used in the actuarial valuation were adopted by the board when the experience study was adopted on February 1, 2017. Assumptions specific to the MPP Program were also adopted on that date. Following are assumptions adopted by the board for this program.
Retired Members Disabled Members (After Year 3)1
Age Male Female Male Female
50 0.240% 0.133% 1.848% 1.043%
55 0.354 0.211 2.149 1.305
60 0.474 0.280 2.437 1.541
65 0.674 0.422 2.836 1.841
70 1.079 0.696 3.517 2.390
75 1.936 1.280 4.637 3.400
80 3.553 2.455 6.420 5.036
85 6.831 4.896 9.326 7.483
90 13.161 9.948 14.127 11.045
95 22.456 18.616 21.090 16.322
Table 1 Postretirement Mortality for Sample Ages
MEDICARE PREMIUM PAYMENT (MPP) PROGRAM AND SCHEDULES
NOT APPLICABLE NOT APPLICABLE
Table 2 Probabilities of Retirement for Sample Ages
Table 3 Probabilities of Withdrawal from Active Service Before Age and Service Retirement for Sample Duration in Years
Select rates for disability:
First year of disablement 4.0% 3.0%
Second year of disablement 3.5 2.5
Third year of disablement 3.0 2.0
1 Projected improvement based on 110% of the MP-2016 Ultimate Projection Scale.Projection scale does not apply to select minimum rates.

169ACTUARIAL
Investment Yield (Net of Expenses)
7.00%
Medical Inflation (Varies by Year—average percentage below)
Part A Premiums 3.70%
Part B Premiums 4.10%
Price Inflation 2.75%
Table 5 Economic Assumptions
NOT APPLICABLE
Table 4 Probability of Refund
MEDICARE PREMIUM PAYMENT (MPP) PROGRAM AND SCHEDULES
NOT APPLICABLE
Table 7 Service Retirement for Sample Ages
NOT APPLICABLE
Table 8 Disability Rates for Sample Ages
Table 6 Mortality Assumptions
1 For future years, the projected improvement is based on 110% of the MP-2016 Ultimate Projection Scale.
2 Select rates in first three years for both Males and Females
Retired Members
Male 2016 CalSTRS Retired Male
Female 2016 CalSTRS Retired Female
Active Members (Not applicable)
Male RP-2014 White Collar Employee Male set back 2 years
Female RP-2014 White Collar Employee Female set back 2 years
Beneficiaries1 (Not applicable)
Male 2016 CalSTRS Retired Male
Female 2016 CalSTRS Retired Female
Disabled1,2
Male RP-2014 Disabled Retiree Male set back 2 years
Female RP-2014 Disabled Retiree Female set back 2 years

170 CALSTRS COMPREHENSIVE ANNUAL FINANCIAL REPORT 2018
Added to Rolls Removed From Rolls Rolls-End of Year
Date
(as of June 30)
Number Annual
Allowances2
Number Annual
Allowances2
Number Annual
Allowances2
% Increase in
Annual Allowances
Average Annual
Allowances
2009 399 $1,489 208 $604 6,431 $35,8143 14.3% $5,569
2010 347 1,215 220 660 6,475 34,015 (5.0) 5,253
2011 537 2,202 231 695 6,709 34,677 1.9 5,169
2012 359 1,177 218 634 6,742 33,708 (2.8) 5,000
20134 305 1,009 212 641 6,770 33,663 (0.1) 4,972
2014 235 751 259 703 6,684 32,047 (4.8) 4,795
2015 178 443 254 772 6,474 29,729 (7.2) 4,592
2016 166 404 264 768 6,324 28,345 (4.7) 4,482
2017 102 211 273 766 6,124 27,632 (2.5) 4,512
2018 119 451 281 751 5,917 26,947 (2.5) 4,554
1 Each year’s data populaion is a snapshot taken following year-end closings; subsequent adjustments made to snapshots of data prior to the current period are not reflected in the table.2 Dollars in thousands.3 This does not include the $8.04 million credit adjustments and deletions. If the credit adjustments and deletions were included, the Total Annual Allowance would be $28.3 million; the
percentage decrease in annual allowance would be 9.6% and the average annual allowance would be $4,402.4 Numbers revised in 2014.
Assumption Best Estimate
Male Female
% of Under 65 Retirees Enrolling (Retired On or After 2001)
2.50% 2.50%
% of Under 65 Retirees Enrolling (Retired Before 2001)
3.50 3.50
% of Over 65 Retirees Enrolling (For Those Not Currently Enrolled) at Age:
65 0.60 0.60
66 0.06 0.06
67 0.04 0.04
68 0.03 0.03
69 0.03 0.03
70–84 0.02 0.02
85 & above — —
Table 10 Schedule of Retired Members Added to and Removed from Medicare Part A Premium Rolls1
Table 9 Schedule of Medicare Part A Enrollment Rates
MEDICARE PREMIUM PAYMENT (MPP) PROGRAM AND SCHEDULES

171ACTUARIAL
Aggregate Accrued Liabilities for Funding of Liabilities
Valuation Date
(as of June 30)1,2
(1)
Active Member
Contributions
on Deposit
(2)
Future Benefit
to Benefit
Recipients
(3)
Service Already
Rendered by
Active Members
Actuarial Value
of Assets3(1) (2) (3)
2006 $ — $527.6 $ — $527.6 — % 100.0% — %
2008 — 629.7 — 629.7 — 100.0 —
2010 — 601.8 — 601.8 — 100.0 —
2012 — 424.2 — 424.2 — 100.0 —
2014 — 341.7 — 341.7 — 100.0 —
2016 — 314.9 — 314.9 — 100.0 —
2017 — 302.2 — 302.2 — 100.0 —
Table 11
Reporting as of June 301
2017 2016
Actuarial Obligation at June 30
Expected Changes:
Eligibility Extended not calculated not calculated
Benefits Paid ($29.0) ($30.0)
Interest not calculated not calculated
Expected Actuarial Obligation at June 30 not calculated not calculated
Expected Actuarial Value of Assets at June 30 not calculated not calculated
Expected Unfunded Actuarial Obligation at June 30 not calculated not calculated
Actuarial (Gains) / Losses
(Gain) on Medical Trend Assumption not calculated not calculated
(Gain) on Premium/Penalty not calculated not calculated
(Gain) on Part B Premium for higher earners not calculated not calculated
(Gain) Other Sources not calculated not calculated
Total Actuarial Gains / Losses not calculated not calculated
Unfunded Actuarial Obligation at June 302 — —
Funded Ratio2
1 Actuarial valuation results as of June 30, 2018, are expected to be available by May 2019.2 Based on the Actuarial Value of Assets. For funding purposes, the MPP Program assets are valued as the allocated value of DB Program assets, which are equal to the actuarial obligation of the
MPP Program benefits.
MEDICARE PREMIUM PAYMENT (MPP) PROGRAM AND SCHEDULES
Table 12 Analysis of Financial Experience (Gains and losses in unfunded actuarial obligation resulting from differences between assumed and actual experience) (Dollars in Millions)
Solvency Test (Dollars in Millions)
1 This is a 10-year schedule. However, the information in this schedule is not available for periods prior to fiscal year 2005–06. Years will be added to this schedule in future fiscal years until 10 years information is available.
2 Actuarial valuation results as of June 30, 2018, are expected to be available by May 2019.3 For funding purposes, the assets are valued as the allocated value of DB Program assets. This figure is equal to the actuarial obligation of the MPP Program benefits.
100.0% 100.0%

172 CALSTRS COMPREHENSIVE ANNUAL FINANCIAL REPORT 2018
MEDICARE PREMIUM PAYMENT (MPP) PROGRAM AND SCHEDULES
Table 13 Schedule of Funding Progress (Dollars in Millions)
Actuarial Valuation
Date as of June 301,2
Actuarial Value of
Assets3
(a)
Actuarial Accrued
Liability (AAL)
(b)
Unfunded AAL
(Funding Excess)
(UAAL)
(b-a)
Funded Ratio
(a/b)
2006 $527.6 $527.6 $ — 100%
2008 629.7 629.7 — 100
2010 601.8 601.8 — 100
2012 424.2 424.2 — 100
2014 341.7 341.7 — 100
2016 314.9 314.9 — 100
2017 302.2 302.2 — 100
1 This is a 10-year schedule. However, the information in this schedule is not available for periods prior to fiscal year 2005–06. Years will be added to this schedule in future fiscal years until 10 years of information is available.
2 Actuarial valuation results as of June 30, 2018, are expected to be available by May 2019.3 For funding purposes, the assets are valued as the allocated value of DB Program assets. This figure is equal to the actuarial obligation of the MPP Program benefits.

173STATISTICAL
175 Statistical Overview
State Teachers’ Retirement Plan Schedules
177 Table 1 Changes in Fiduciary Net Position for the State Teachers’ Retirement Plan
178 Table 2 Benefit and Refund Deductions from Fiduciary Net Position by Type
Defined Benefit Program Schedules
179 Table 1 Active Member Characteristics
179 Table 2 Members Retired for Service During Fiscal Year 2017–18, Classified by Unmodified Allowance
180 Table 3 Members Retired for Service During Fiscal Year 2017–18, Classified by Age and Joint & Survivor Option Elected
181 Table 4 Characteristics of Members Going on Disability During Target Fiscal Year
181 Table 5 Total Number of Benefit Recipients by Type of Benefit
182 Table 6 Members Retired for Service Characteristics by Year of Retirement
185 Table 7 Members Retired for Service Characteristics
186 Table 8 Retired Members by Type of Benefit and Option Elected
187 Table 9 Principal Participating Defined Benefit and Defined Benefit Supplement Employers for Current Year and Nine Years Ago
188 Table 10 Average Allowance Purchasing Power for Fiscal Year 2017–18
190 Table 11 Restoration of Allowance Purchasing Power Through Supplemental Benefit Payments
Defined Benefit Supplement Program Schedules
191 Table 1 Members Retired for Service During Fiscal Year 2017–18, Classified by Age and Option Elected
192 Table 2 Characteristics of All Members Retired for Service and Receiving an Annuity
192 Table 3 Characteristics of All Members Retired for Disability and Receiving an Annuity
193 Table 4 Retired Members by Type of Benefit and Option Elected
In fiscal year 2017–18, CalSTRS members, on average, retired at age 63 after about 25 years of service with a pension replacing less than 60 percent of
their highest salary.
STATISTICAL

174 CALSTRS COMPREHENSIVE ANNUAL FINANCIAL REPORT 2018
STATISTICAL
Cash Balance Benefit Program Schedules
194 Table 1 Participants Retired for Service During the 2017–18 Fiscal Year Classified by Age and Type of Annuity Elected
195 Table 2 Characteristics of All Members Retired for Service and Receiving an Annuity
195 Table 3 All Participants Receiving an Annuity by Type of Benefit and Type of Annuity Elected
196 Table 4 Principal Participating Employers for the Cash Balance Benefit Program, Current Year and Nine Years Ago
Programs Administered or Overseen by the Retirement System (Pension2)
197 Table 1A Changes in Fiduciary Net Position for the Pension2 IRC 403(b) Plan
197 Table 1B Changes in Fiduciary Net Position for the Pension2 IRC 457(b) Plan
198 Table 2 Largest Participating Employers for CalSTRS Pension2, Current Year and Nine Years Ago
Medicare Premium Payment Program
199 Table 1 Changes in Fiduciary Net Position for the Medicare Premium Payment Program
199 Table 2 Benefit and Refund Deductions from Changes in Fiduciary Net Position by Type
200 Table 3 Retired Members Enrolled in Medicare Premium Payment Program During Fiscal Year 2017–18 Classified by Age at Retirement
200 Table 4 Characteristics of All Retired Members Enrolled in Medicare Premium Payment Program
Teachers’ Deferred Compensation Fund
201 Table 1 Changes in Fiduciary Net Position for the Teachers’ Deferred Compensation Fund

175STATISTICAL
The Statistical Section presents additional detailed information to assist users of the basic financial statements, notes to the basic financial statements and required supplementary information in assessing the economic condition of CalSTRS. The section provides financial trend information for the State Teachers’ Retirement Plan (STRP), which includes Defined Benefit (DB), Defined Benefit Supplement (DBS), Cash Balance Benefit (CBB) and Replacement Benefits programs, as well as operating information for the Pension2, Medicare Premium Payment (MPP) Program and Teachers’ Deferred Compensation Fund. Financial trend information for the DB, DBS and CBB programs has been consolidated and presented as the STRP to be consistent with the basic financial statements. Operating information for STRP programs continues to be presented separately because consolidation would not provide meaningful information due to the unique characteristics of those programs.
The financial trend schedules assist users in understanding and assessing how the system’s financial position has changed over time and include:
• Changes in Fiduciary Net Position
• Benefit and Refund Deductions From Net Position by Type
The operating information schedules provide data about the system’s operations and resources to assist users in understanding CalSTRS benefits and services and include:
• Members and Benefit Recipient Statistics
• Participating Employers Statistics
The information in this section was derived from the Financial Section and the CalSTRS pension administration system, START, except where noted.
Notes:
Supplemental statistical tables are available on request by calling CalSTRS at 800-228-5453.
STATISTICAL OVERVIEW

176 CALSTRS COMPREHENSIVE ANNUAL FINANCIAL REPORT 2018
This page intentionally left blank.

177STATISTICAL
Fiscal Year
Ending
June 30
2018 2017 2016 2015 2014 2013 2012 2011 2010 2009
Additions
Member Contributions
$3,496 $3,441 $2,958 $2,510 $2,264 $2,337 $2,280 $2,356 $2,332 $2,501
Employer Contributions
4,867 4,173 3,391 2,678 2,272 2,283 2,238 2,310 2,286 2,464
State of California Contributions1
2,797 2,478 1,940 1,426 1,384 1,328 1,303 1,193 1,222 1,140
Net Investment Income
18,674 25,165 2,305 7,612 30,402 20,682 1,071 30,030 15,089 (40,358)
Other Income 105 72 42 4 2 1 4 7 8 8
Total
Additions$29,939 $35,329 $10,636 $14,230 $36,324 $26,631 $6,896 $35,896 $20,937 ($34,245)
Deductions
Benefit Payments to Members2
$14,271 $13,626 $12,892 $12,284 $11,725 $11,133 $10,443 $9,855 $9,085 $8,256
Purchasing Power Benefits
162 161 172 193 202 222 235 238 273 348
Refunds of Member Contributions
104 116 84 88 108 105 108 116 100 106
Administrative Expenses
216 182 180 145 154 137 138 110 140 113
Borrowing Costs3 94 58 — — — — — — — —
Other Expenses
2 10 15 9 9 4 — — — —
Total
Deductions$14,849 $14,153 $13,343 $12,719 $12,198 $11,601 $10,924 $10,319 $9,598 $8,823
Change in
Fiduciary Net
Position
$15,090 $21,176 ($2,707) $1,511 $24,126 $15,030 ($4,028) $25,577 $11,339 ($43,068)
There may be immaterial rounding differences between the figures presented in this table and in the Statement of Changes in Fiduciary Net Position.1 Includes SBMA contributions and school lands revenue.2 Includes member elected administrative transfers to purchase service credit in the Defined Benefit program.3 Borrowing costs associated with the master facility credit portfolio, which were previously reported in Net Investment Income, were reclassified to deductions for financial reporting purposes.
Table 1 Changes in Fiduciary Net Position for the State Teachers’ Retirement Plan
(Dollars in Millions)
STATE TEACHERS’ RETIREMENT PLAN SCHEDULES

178 CALSTRS COMPREHENSIVE ANNUAL FINANCIAL REPORT 2018
Fiscal Year
Ending June 302018 2017 2016 2015 2014 2013 2012 2011 2010 2009
Type of Benefit
Age & Service
Benefits
Retired Members1 $13,121 $12,538 $11,869 $11,306 $10,821 $10,281 $9,704 $9,167 $8,357 $7,609
Survivors 732 686 634 591 547 528 503 465 504 444
Death 72 66 63 76 57 74 31 35 43 37
Purchasing Power Benefits
162 161 172 193 202 222 235 238 273 348
Disability Benefits
Retired Members 346 336 326 311 300 251 205 187 182 167
Total Benefits $14,433 $13,787 $13,064 $12,477 $11,927 $11,356 $10,678 $10,092 $9,359 $8,605
Type of Refund
Separation $104 $116 $84 $88 $108 $105 $108 $116 $100 $106
Total Refunds $104 $116 $84 $88 $108 $105 $108 $116 $100 $106
There may be immaterial rounding differences between the figures presented in this table and in the Statement of Changes in Fiduciary Net Position.1 Includes member elected administrative transfers to purchase service credit in the Defined Benefit program.
Table 2 Benefit and Refund Deductions from Fiduciary Net Position by Type
(Dollars in Millions)
STATE TEACHERS’ RETIREMENT PLAN SCHEDULES

179STATISTICAL
Fiscal Year
Ending June 30 Count
Average
Earnable Compensation1Average Age
Average
Service Credit
Average Service
Projected to Age 60
2009 459,009 $64,044 44.8 11.0 26.2
2010 441,544 64,156 45.1 11.3 26.3
2011 429,600 64,069 45.3 11.7 26.3
2012 421,499 64,743 45.5 11.9 26.5
2013 416,643 65,571 45.6 12.2 26.6
2014 420,887 67,276 45.6 12.3 26.6
2015 429,460 69,597 45.5 12.2 26.7
2016 438,537 72,550 45.4 12.1 26.7
2017 445,935 74,346 45.3 12.1 26.8
2018 449,595 75,604 45.2 12.1 26.9
1 Average salary that would be paid if members worked on a full-time basis.
Table 1 Active Member Characteristics
Monthly Unmodified
AllowanceCount
Average Age
at Retirement3
Average
Service Credit3
Average Final
Compensation3,4
Average
Allowance Payable3,5
Less than $500 426 63.4 5.068 $3,915 $320
500–1000 652 63.2 8.847 4,428 716
1000–1500 535 62.6 11.905 5,462 1,208
1500–2000 563 62.5 14.812 6,005 1,690
2000–2500 677 62.7 16.938 6,605 2,181
2500–3000 811 63.0 18.858 7,021 2,660
3000–3500 1,007 63.1 20.988 7,325 3,126
3500–4000 1,077 63.7 22.530 7,579 3,603
4000–4500 1,020 63.4 24.599 7,924 4,095
4500–5000 929 63.4 26.713 8,062 4,557
5000–5500 861 63.6 28.509 8,153 5,055
5500–6000 938 63.3 30.189 8,338 5,499
6000 & Greater 3,282 63.7 34.270 9,688 7,452
Total 12,778 63.3 24.264 $7,729 $4,323
1 Does not include formerly disabled members.2 Unmodified allowance includes longevity bonus.3 Overall averages.4 Excludes new retirees with no final compensation data.5 Includes cumulative application of annual 2 percent benefit improvement factor.
Table 2 Members Retired for Service During Fiscal Year 2017–18, Classified by Unmodified Allowance1,2
DEFINED BENEFIT PROGRAM SCHEDULES

180 CALSTRS COMPREHENSIVE ANNUAL FINANCIAL REPORT 2018
Option types
Age Total Unmodified 2 3 4 5 6 7 8 9
Under 55 17 11 — — — — 2 3 — 1
55 445 298 — — — — 73 37 11 26
56 286 183 — — — — 51 29 3 20
57 327 194 — — — — 59 41 9 24
58 453 271 — — — — 83 62 2 35
59 528 302 — — — — 103 68 7 48
60 1,055 570 — — — — 209 149 16 111
61 1,420 707 — — — — 281 205 30 197
62 1,537 795 — — — — 314 227 28 173
63 1,553 873 — — — — 278 214 24 164
64 996 523 — — — — 182 143 20 128
65 958 554 — — — — 170 132 13 89
66 820 487 2 — — — 142 90 18 81
67 600 329 3 — — — 107 83 22 56
68 422 249 6 — — — 64 54 16 33
69 347 215 2 — — — 56 41 9 24
70 279 183 — — — — 44 28 3 21
71 213 126 3 — — — 35 24 6 19
72 128 84 1 — — — 20 9 2 12
73 108 77 2 — 1 — 11 10 1 6
74 75 39 3 1 — — 13 7 7 5
75 and over 211 136 2 1 — — 33 19 8 12
Total 12,778 7,206 24 2 1 — 2,330 1,675 255 1,285
% of Total 100.0% 56.4% 0.2% 0.0% 0.0% 0.0% 18.2% 13.1% 2.0% 10.1%
1 Does not include formerly disabled members.2 Option Elected:
Option 2 - Beneficiary receives 100 percent of member’s modified allowance.
Option 3 - Beneficiary receives 50 percent of member’s modified allowance.
Option 4 - Beneficiary receives 2/3 of member’s modified allowance.
Option 5 - Survivors receive 50 percent of member’s modified allowance, upon death of either member or beneficiary.
Option 6 - Beneficiary receives 100 percent of member’s modified allowance. If beneficiary pre-deceases the member, the allowance pops up to the unmodified amount.
Option 7 - Beneficiary receives 50 percent of member’s modified allowance. If beneficiary pre-deceases the member, the allowance pops up to the unmodified amount.
Option 8 - Compound option that allows the member to provide for more than one beneficiary.
Option 9 - Beneficiary receives 75 percent of member’s modified allowance. If beneficiary pre-deceases the member, the allowance pops up to the unmodified amount.
Table 3 Members Retired for Service During Fiscal Year 2017–181, Classifed by Age and Joint & Survivor Option Elected2
DEFINED BENEFIT PROGRAM SCHEDULES

181STATISTICAL
Fiscal Year
Ending June 30Count
Average Disability
Allowance PayableAverage Service Credit
Average Final
Compensation
Average Age
at Disability
2009 511 $2,728 13.9 $5,567 53.8
2010 498 2,825 14.5 5,827 55.3
2011 504 2,784 14.3 5,781 55.0
2012 488 2,825 14.3 5,823 55.4
2013 571 2,788 14.8 5,742 54.9
2014 494 2,875 15.0 5,967 55.1
2015 503 2,899 15.2 6,002 54.3
2016 455 2,936 14.9 6,081 54.1
2017 394 3,056 16.0 6,365 54.4
2018 381 3,144 16.4 6,512 54.9
Fiscal Year
Ending June 30
Service
Retirement
Disability
Benefits
Benefits for
Survivors
Total Benefit
Recipients1
2009 203,649 8,380 20,588 232,617
2010 213,952 8,581 21,263 243,796
2011 222,222 8,813 22,006 253,041
2012 230,278 9,036 22,724 262,038
2013 236,487 9,374 23,413 269,274
2014 241,920 9,604 24,103 275,627
2015 247,353 9,848 24,899 282,100
2016 252,672 9,940 25,583 288,195
2017 258,550 10,023 26,301 294,874
2018 264,780 10,089 26,990 301,859
Table 4 Characteristics of Members Going on Disability During Target Fiscal Year
Table 5 Total Number of Benefit Recipients by Type of Benefit
DEFINED BENEFIT PROGRAM SCHEDULES
1 Benefit recipients reported in this section will differ from those reported in the financial section due to timing of when membership numbers were pulled.

182 CALSTRS COMPREHENSIVE ANNUAL FINANCIAL REPORT 2018
1 Does not include formerly disabled members.2 The average unmodified allowance for this fiscal year includes the longevity bonus.
Table 6 Members Retired for Service Characteristics by Year of Retirement1
Effective Date of Retirement
by Service Credit
Number of
Retirements
Average
Service Credit
Average Unmodified
Allowance
Average Final
Compensation
Average Age
at Retirement
DEFINED BENEFIT PROGRAM SCHEDULES
7/1/2008 thru 6/30/20092
0–5 126 2.4 $291 $5,814 62.4
5–10 1,022 7.4 668 4,236 62.8
10–15 1,145 12.4 1,336 5,140 62.1
15–20 1,323 17.7 2,235 5,995 61.8
20–25 1,535 22.3 3,116 6,537 62.1
25–30 1,406 27.1 4,125 7,076 62.2
30–35 3,161 32.4 5,687 7,506 61.1
35–40 2,574 37.2 7,122 7,866 61.7
40 & over 461 42.2 8,594 8,316 64.9
Total 12,753 26.3 $4,396 $6,796 61.6
7/1/2009 thru 6/30/20102
0–5 148 2.3 $289 $5,535 61.4
5–10 1,356 7.4 686 4,287 63.0
10–15 1,436 12.6 1,446 5,385 62.4
15–20 1,663 17.6 2,326 6,138 62.3
20–25 2,323 22.4 3,236 6,658 62.4
25–30 1,885 27.1 4,231 7,165 62.5
30–35 3,620 32.4 5,665 7,478 61.2
35–40 2,481 37.2 7,228 7,999 61.6
40 & over 581 42.3 8,759 8,409 65.4
Total 15,493 25.5 $4,256 $6,800 62.2
7/1/2010 thru 6/30/20112
0–5 194 2.4 $305 $6,182 62.0
5–10 1,388 7.3 663 4,187 62.9
10–15 1,506 12.5 1,487 5,491 62.7
15–20 1,571 17.5 2,320 6,191 62.2
20–25 2,005 22.4 3,278 6,729 62.5
25–30 1,834 27.1 4,237 7,186 62.4
30–35 2,874 32.4 5,693 7,508 61.3
35–40 2,068 37.2 7,313 8,091 61.8
40 & over 456 42.3 9,037 8,738 65.6
Total 13,896 24.5 $4,088 $6,763 62.3

183STATISTICAL
1 Does not include formerly disabled members.2 The average unmodified allowance for this fiscal year includes the longevity bonus.
Table 6 Members Retired for Service Characteristics by Year of Retirement (continued)1
Effective Date of
Retirement by Service Credit
Number of
Retirements
Average
Service Credit
Average Unmodified
Allowance
Average Final
Compensation
Average Age
at Retirement
DEFINED BENEFIT PROGRAM SCHEDULES
7/1/2011 thru 6/30/20122
0–5 167 2.4 $310 $6,013 63.0
5–10 1,497 7.3 676 4,224 63.2
10–15 1,659 12.5 1,437 5,315 62.7
15–20 1,743 17.4 2,316 6,122 62.7
20–25 1,962 22.5 3,350 6,788 62.6
25–30 1,878 27.1 4,318 7,212 62.8
30–35 2,547 32.5 5,750 7,550 61.4
35–40 1,770 37.2 7,364 8,093 61.9
40 & over 396 42.1 9,487 9,113 65.2
Total 13,619 23.7 $3,936 $6,670 62.5
7/1/2012 thru 6/30/20132
0–5 132 2.5 $311 $6,092 62.8
5–10 1,017 7.2 710 4,540 63.1
10–15 1,298 12.6 1,521 5,528 63.1
15–20 1,678 17.4 2,392 6,272 63.0
20–25 1,760 22.6 3,367 6,802 62.8
25–30 1,817 27.2 4,319 7,169 62.7
30–35 2,150 32.5 5,700 7,528 61.6
35–40 1,522 37.2 7,329 8,038 61.8
40 & over 271 42.3 8,924 8,439 65.6
Total 11,645 24.1 $3,980 $6,769 62.6
7/1/2013 thru 6/30/2014²
0–5 144 2.2 $268 $5,994 62.9
5–10 950 7.4 721 4,463 63.2
10–15 1,176 12.6 1,533 5,553 63.1
15–20 1,604 17.4 2,425 6,286 63.2
20–25 1,593 22.4 3,334 6,743 62.9
25–30 1,845 27.2 4,443 7,367 63.0
30–35 1,814 32.3 5,607 7,532 61.6
35–40 1,374 37.2 7,295 7,973 61.9
40 & over 236 42.2 9,197 8,741 65.5
Total 10,736 23.8 $3,939 $6,774 62.7

184 CALSTRS COMPREHENSIVE ANNUAL FINANCIAL REPORT 2018
1 Does not include formerly disabled members.2 The average unmodified allowance for this fiscal year includes the longevity bonus.3 Excludes retirees with no final compensation data.
Table 6 Members Retired for Service Characteristics by Year of Retirement (continued)1
Effective Date of
Retirement by Service Credit
Number of
Retirements
Average
Service Credit
Average Unmodified
Allowance
Average Final
Compensation
Average Age
at Retirement
DEFINED BENEFIT PROGRAMDEFINED BENEFIT PROGRAM SCHEDULES
7/1/2014 thru 6/30/20152
0–5 168 2.2 $275 $6,195 62.6
5–10 855 7.4 736 4,517 63.7
10–15 1,125 12.6 1,554 5,597 63.4
15–20 1,764 17.6 2,520 6,467 63.4
20–25 1,585 22.4 3,415 6,883 63.0
25–30 2,069 27.2 4,603 7,576 63.3
30–35 1,948 32.1 5,709 7,787 62.0
35–40 1,482 37.1 7,490 8,207 62.2
40 & over 282 42.4 9,539 9,166 65.8
Total 11,278 24.2 $4,142 $7,013 63.0
7/1/2015 thru 6/30/20162,3
0–5 170 2.4 $314 $6,438 62.7
5–10 793 7.4 754 4,637 63.9
10–15 1,046 12.6 1,608 5,792 63.5
15–20 1,751 17.6 2,612 6,664 63.6
20–25 1,652 22.2 3,534 7,149 63.4
25–30 2,152 27.3 4,861 7,928 63.4
30–35 2,034 32.1 5,899 8,108 62.0
35–40 1,467 37.2 7,836 8,624 62.4
40 & over 309 42.5 9,666 9,215 66.4
Total 11,374 24.5 $4,369 $7,329 63.2
7/1/2016 thru 6/30/20172,3
0–5 155 2.2 $306 $6,402 63.6
5–10 837 7.4 773 4,709 63.9
10–15 1,075 12.6 1,628 5,861 63.5
15–20 1,836 17.7 2,701 6,857 63.7
20–25 1,932 22.2 3,628 7,326 63.6
25–30 2,246 27.3 4,955 8,082 63.5
30–35 2,423 32.2 6,126 8,438 62.1
35–40 1,414 37.3 7,807 8,711 62.4
40 & over 329 42.6 10,267 9,986 66.4
Total 12,247 24.6 $4,475 $7,527 63.3

185STATISTICAL
Fiscal Year
Ending June 30
Average Age
at Retirement
Average Years of
Service Credit
Average Final
Compensation
Average Current
Allowance Payable
2009 60.8 26.4 $4,798 $3,164
2010 60.9 26.3 4,983 3,302
2011 61.0 26.3 5,138 3,417
2012 61.1 26.2 5,271 3,517
2013 61.1 26.1 5,385 3,609
2014 61.2 26.0 5,487 3,694
2015 61.3 25.9 5,597 3,786
2016 61.3 25.8 5,716 3,884
2017 61.4 25.7 5,846 3,985
2018 61.5 25.6 5,981 4,086
1 Does not include formerly disabled members.
1 Does not include formerly disabled members.2 The average unmodified allowance for this fiscal year includes the longevity bonus.3 Excludes retirees with no final compensation data.
Effective Date of
Retirement by Service Credit
Number of
Retirements
Average
Service Credit
Average Unmodified
Allowance
Average Final
Compensation3
Average Age
at Retirement
Table 6 Members Retired for Service Characteristics by Year of Retirement (continued)1
Table 7 Members Retired for Service Characteristics1
DEFINED BENEFIT PROGRAM SCHEDULES
7/1/2017 thru 6/30/20182,3
0–5 190 2.5 $335 $6,521 63.2
5–10 877 7.34 787 4,830 63.8
10–15 1,091 12.6 1,676 5,955 63.7
15–20 1,855 17.7 2,817 7,110 63.8
20–25 2,362 22.3 3,832 7,645 63.9
25–30 2,368 27.5 5,123 8,379 63.4
30–35 2,530 32.2 6,308 8,642 62.0
35–40 1,262 37.1 8,049 9,057 62.7
40 & over 243 43.2 10,476 9,956 68.1
Total 12,778 24.3 $4,512 $7,729 63.3

186 CALSTRS COMPREHENSIVE ANNUAL FINANCIAL REPORT 2018
Type of Benefit1 Option Elected2
Monthly
Unmodified
Allowance3 Total 14 2 3 Unmodified 2 3 4 5 6 7 8 9
Less than $500 16,951 14,608 65 2,278 12,298 1,134 364 56 71 1,903 662 212 251
500–1000 24,617 21,417 497 2,703 16,660 1,573 775 97 95 3,176 1,519 143 579
1000–1500 25,126 21,044 868 3,214 14,935 2,011 1,068 172 140 3,607 2,287 134 772
1500–2000 27,433 22,526 1,500 3,407 15,313 2,060 901 388 163 3,994 3,419 163 1,032
2000–2500 28,735 23,066 2,166 3,503 15,064 2,011 840 345 184 4,682 4,167 219 1,223
2500–3000 26,530 21,449 2,107 2,974 13,497 1,633 564 254 120 4,836 4,102 233 1,291
3000–3500 23,450 19,410 1,791 2,249 11,877 1,209 370 227 64 4,424 3,673 250 1,356
3500–4000 19,019 16,800 730 1,489 9,364 866 269 155 52 3,698 3,195 208 1,212
4000–4500 17,396 16,021 223 1,152 8,303 762 227 96 38 3,398 3,156 256 1,160
4500–5000 16,772 15,675 76 1,021 7,683 709 205 63 29 3,581 3,061 270 1,171
5000–5500 16,533 15,653 36 844 7,430 670 174 65 20 3,588 3,029 270 1,287
5500–6000 14,836 14,195 12 629 6,542 583 147 58 16 3,323 2,656 250 1,261
6000 & Greater 44,461 42,916 18 1,527 17,183 2,102 339 144 44 11,386 7,490 1,264 4,509
Total 301,8595 264,780 10,089 26,990 156,149 17,323 6,243 2,120 1,036 55,596 42,416 3,872 17,104
1 Type of Benefit: 1) Service Retirement 2) Disability Benefits 3) Survivor Benefits2 Option Selected: Option 2 - Beneficiary receives 100 percent of member’s modified allowance.
Option 3 - Beneficiary receives 50 percent of member’s modified allowance. Option 4 - Beneficiary receives 2/3 of member’s modified allowance. Option 5 - Survivors receive 50 percent of member’s modified allowance, upon death of either member of beneficiary. Option 6 - Beneficiary receives 100 percent of member’s modified allowance. If beneficiary pre-deceases the member, the allowance increases up to the unmodified amount. Option 7 - Beneficiary receives 50 percent of member’s modified allowance. If beneficiary pre-deceases the member, the allowance increases up to the unmodified amount. Option 8 - Compound option that allows the member to provide for more than one beneficiary. Option 9 - Beneficiary receives 75 percent of member’s modified allowance. If beneficiary pre-deceases the member, the allowance increases up to the unmodified amount.
3 Unmodified allowance includes longevity bonus.4 Does not include formerly disabled members.5 Benefit recipients reported in this section will differ from those reported in the financial section due to the timing of when membership numbers were pulled.
Table 8 Retired Members by Type of Benefit and Option Elected
DEFINED BENEFIT PROGRAM SCHEDULES

187STATISTICAL
2017–2018
Rank Participating Employers *Covered
Employees
Percentage of
Total System
1 Los Angeles Unified School District 37,443 7.26%
2 San Diego Unified School District 7,978 1.55
3 Fresno Unified School District 6,385 1.24
4 Long Beach Unified School District 5,754 1.12
5 San Francisco Unified School District 5,222 1.01
6 Elk Grove Unified School District 4,344 0.84
7 San Bernardino City Unified School District 3,861 0.75
8 Oakland Unified School District 3,467 0.67
9 Corona-Norco Unified School District 3,432 0.66
10 Los Angeles Community College District 3,207 0.62
Top 10 Total 81,093 15.72
All Other 434,745 84.28
Total Covered Employees 515,838 100.00
Table 9 Principal Participating Defined Benefit and Defined Benefit Supplement Employers for Current Year and Nine Years Ago
2008–2009
Rank Participating Employers Covered
Employees
Percentage of
Total System
1 Los Angeles Unified School District 48,206 9.09%
2 San Diego Unified School District 10,641 2.01
3 Long Beach Unified School District 6,596 1.24
4 Fresno Unified School District 5,711 1.08
5 San Francisco Unified School District 5,140 0.97
6 Elk Grove Unified School District 4,411 0.83
7 San Bernardino City Unified School District 4,215 0.79
8 Sacramento City Unified School District 3,927 0.74
9 San Juan Unified School District 3,725 0.70
10 Garden Grove Unified School District 3,586 0.68
Top 10 Total 96,158 18.13
All Other 434,275 81.87
Total Covered Employees 530,433 100.00
* Covered employees are calculated as all employees for whom an employer reports service credit during the fiscal year. Covered employees in this table are counted more than once if they are reported by multiple employers. They are also counted if their employer reports service credit for a retired employee from prior fiscal years. Therefore, the total number of covered employees in this table is higher than the number of active members shown in Table 10 of the Actuarial Section under the DB Program.
DEFINED BENEFIT PROGRAM SCHEDULES

188 CALSTRS COMPREHENSIVE ANNUAL FINANCIAL REPORT 2018
Calendar Year of
Benefit Effective
Date
CCPI Increases
Since Benefit
Effective Date
Average Allowance
Increases Since
Benefit Effective
Date
Average
Purchasing
Power of Current
Allowance
Average Increase
Needed to Restore
Full Purchasing
Power
Average Annual
Supplemental
Increase
(1) (2) (3) (4) (5) (6)
Prior to 1956 920.6% 284.9% 37.7% 165.2% $4,277
1956 901.1% 303.6% 40.3% 148.0% $4,651
1957 867.8% 207.6% 31.8% 214.6% $4,941
1958No retiree with benefit effective date in calendar years 1958 & 1959
1959
1960 801.3% 132.7% 25.8% 287.3% $6,587
1961 789.1% 134.5% 26.4% 279.1% $5,302
1962 774.3% 125.2% 25.8% 288.2% $9,318
1963 768.5% 135.3% 27.1% 269.1% $5,370
1964 751.6% 92.3% 22.6% 342.8% $5,882
1965 730.0% 113.2% 25.7% 289.3% $6,521
1966 717.1% 115.9% 26.4% 278.5% $5,517
1967 697.2% 111.3% 26.5% 277.3% $8,057
1968 664.7% 105.1% 26.8% 272.8% $7,709
1969 628.6% 109.0% 28.7% 248.6% $8,420
1970 592.0% 97.3% 28.5% 250.7% $7,627
1971 565.7% 105.1% 30.8% 224.6% $7,205
1972 547.6% 105.2% 31.7% 215.6% $11,660
1973 514.3% 104.7% 33.3% 200.1% $13,403
1974 456.9% 95.1% 35.0% 185.4% $11,906
1975 404.4% 93.0% 38.3% 161.3% $11,566
1976 375.2% 88.0% 39.6% 152.8% $11,057
1977 340.8% 84.5% 41.8% 138.9% $10,954
1978 306.0% 81.6% 44.7% 123.6% $10,363
1979 269.4% 79.0% 48.5% 106.4% $9,559
1980 214.9% 76.1% 55.9% 78.8% $7,115
1981 191.1% 73.3% 59.5% 68.0% $6,303
1982 166.3% 70.7% 64.1% 56.0% $5,460
1983 164.7% 68.9% 63.8% 56.7% $6,043
1984 153.2% 66.8% 65.9% 51.8% $5,628
1985 142.0% 64.1% 67.8% 47.5% $5,301
1986 133.8% 61.5% 69.1% 44.8% $5,325
Explanation of source and/or calculation of data in columns 3, 4 and 5:
Column 3—Increases from all sources as a percentage of initial allowance. Obtained by dividing total current allowance by total initial allowance and adjusting to a percentage.
Column 4—Purchasing power as of June 2017. Obtained by dividing total current allowance payable by full CCPI adjusted allowance. Based on totals for all benefit types by calendar year of effective date.
Column 5—Percentage increase in current allowance payable required to restore full 100 percent purchasing power as of June 2017. Obtained by dividing the fully adjusted CCPI allowance factor (column 2) by the percentage increase to date (column 3) and adjusting to a percentage.
Example: (920.6 + 100) / (284.9 + 100) = 2.652 x 100 = 265.2 – 100 = 165.2 percent.
Table 10 Average Allowance Purchasing Power for Fiscal Year 2017–18
DEFINED BENEFIT PROGRAM SCHEDULES

189STATISTICAL
Explanation of source and/or calculation of data in columns 3, 4 and 5:
Column 3—Increases from all sources as a percentage of initial allowance. Obtained by dividing total current allowance by total initial allowance and adjusting to a percentage.
Column 4—Purchasing power as of June 2017. Obtained by dividing total current allowance payable by full CCPI adjusted allowance. Based on totals for all benefit types by calendar year of effective date.
Column 5—Percentage increase in current allowance payable required to restore full 100 percent purchasing power as of June 2017. Obtained by dividing the fully adjusted CCPI allowance factor (column 2) by the percentage increase to date (column 3) and adjusting to a percentage.
Example: (920.6 + 100) / (284.9 + 100) = 2.652 x 100 = 265.2 – 100 = 165.2 percent.
Calendar Year of
Benefit Effective
Date
CCPI Increases
Since Benefit
Effective Date
Average Allowance
Increases Since
Benefit Effective
Date
Average
Purchasing
Power of Current
Allowance
Average Increase
Needed to Restore
Full Purchasing
Power
Average Annual
Supplemental
Increase
(1) (2) (3) (4) (5) (6)
1987 125.5% 59.6% 70.8% 41.3% $5,140
1988 115.5% 57.4% 73.0% 36.9% $4,381
1989 104.6% 55.9% 76.2% 31.2% $3,255
1990 95.3% 54.1% 78.9% 26.7% $2,318
1991 87.2% 53.5% 82.0% 22.0% $1,211
1992 80.6% 51.3% 83.8% 19.4% $490
1993 76.1% 49.2% 84.7% 18.0% $103
1994 74.0% 47.5% 84.8% 18.0% $89
1995 70.1% 45.4% 85.5% 17.0% —
1996 67.5% 43.2% 85.5% 17.0% —
1997 63.9% 41.4% 86.2% 15.9% —
1998 60.3% 39.7% 87.1% 14.7% —
1999 56.3% 36.9% 87.6% 14.2% —
2000 50.7% 34.9% 89.5% 11.7% —
2001 43.2% 34.8% 94.1% 6.2% —
2002 41.1% 32.4% 93.8% 6.6% —
2003 38.1% 30.2% 94.3% 6.1% —
2004 34.0% 27.8% 95.4% 4.9% —
2005 30.3% 25.7% 96.5% 3.7% —
2006 24.4% 23.5% 99.3% 0.7% —
2007 20.6% 21.3% 100.6% (0.6%) —
2008 14.9% 19.1% 103.6% (3.5%) —
2009 16.6% 16.9% 100.2% (0.3%) —
2010 15.5% 14.6% 99.2% 0.8% —
2011 12.4% 12.4% 100.0% 0.0% —
2012 10.3% 10.2% 99.9% 0.1% —
2013 8.4% 8.1% 99.7% 0.3% —
2014 6.1% 6.0% 100.0% 0.1% —
2015 4.7% 4.0% 99.3% 0.7% —
2016 2.6% 1.9% 99.3% 0.7% —
2017 0.0% 0.0% 100.0% 0.0% —
Table 10 Average Allowance Purchasing Power for Fiscal Year 2017–18 (continued)
DEFINED BENEFIT PROGRAM SCHEDULES

190 CALSTRS COMPREHENSIVE ANNUAL FINANCIAL REPORT 2018
Retirees’ Purchasing Power Protection Account Payments
Income Source
Year Purchasing Power Count Total $ Paid School Lands Investment Earnings General Fund
83–84 58.4% 35,654 $21,394,183 $n/a $894,183 $20,500,000
84–85 62.4 57,189 54,306,976 10,119,124 2,426,456 41,761,396
85–86 65.5 56,811 85,675,243 7,770,757 3,994,458 73,910,028
86–87 68.2 57,343 122,275,289 4,167,970 5,511,448 112,595,871
87–88 68.2 59,092 128,231,357 6,083,374 5,317,456 116,830,527
88–89 68.2 58,037 143,061,285 4,479,266 5,956,019 132,626,000
89–90 68.2 55,971 158,274,048 2,751,075 n/a 155,522,9731
Supplemental Benefit Payments
Income Source
Year Purchasing Power Count Total $ Paid School Lands Teachers’ Retirement Fund SBMA
90–91 68.2% 52,199 $168,922,827 $2,964,211 $111,103,596 $54,855,020
91–92 68.2 48,650 178,057,887 2,913,338 56,985,521 118,159,028
92–93 68.2 54,029 184,551,442 6,658,800 — 177,892,642
93–94 68.2 49,113 178,886,980 4,225,808 — 174,661,172
94–95 68.2 46,459 168,359,918 4,973,687 — 163,386,231
95–96 68.2 41,703 168,517,183 1,171,779 — 167,345,404
96–97 68.2 38,939 159,786,521 1,870,825 — 157,915,696
97–98 68.22/75.0 44,887 179,308,000 2,586,920 — 176,721,080
98–99 75.0 42,624 197,860,324 4,168,363 — 193,691,961
99–00 75.0 41,048 190,478,334 2,704,171 — 187,774,163
00–01 75.0 44,699 189,388,495 4,023,007 — 185,365,488
01–023 80.0 60,428 256,976,204 7,967,992 — 249,008,212
02–03 80.0 58,591 233,814,578 3,543,362 — 230,271,216
03–04 80.0 55,779 223,501,415 2,922,844 — 220,578,571
04–05 80.0 57,079 221,271,470 3,318,095 — 217,953,375
05–06 80.0 54,360 215,257,813 4,301,959 — 210,955,854
06–07 80.0 56,002 230,336,754 6,205,860 — 224,130,894
07–08 80.0 53,122 229,860,349 6,522,856 — 223,337,493
08–09 85.04 89,142 348,105,380 7,036,201 — 341,069,179
09–10 85.0 63,949 272,579,522 6,334,670 — 266,244,852
10–11 85.0 53,870 237,572,962 1,929,606 — 235,643,356
11–12 85.0 57,337 234,612,294 5,227,046 — 229,385,248
12–13 85.0 54,847 221,451,056 10,277,064 — 211,173,992
13–14 85.0 50,331 202,231,778 10,297,864 — 191,933,914
14–15 85.0 52,474 192,831,167 4,386,099 — 188,445,068
15–16 85.0 47,764 172,292,148 5,256,886 — 167,035,262
16–17 85.0 49,519 160,729,280 4,675,196 — 156,054,084
17–18 85.0 61,476 161,932,385 4,409,980 — 157,522,405
1 The 1989–90 appropriation was from the Teachers’ Retirement Fund. This amount plus regular interest was repaid from General Fund contributions to the SBMA.
2 Percentage changed to 75 percent effective January 1, 1998, and payable April 1, 1998 (Chapter 939, Statutes of 1997).
3 Percentage changed to 80 percent effective January 1, 2002, and payable October 1, 2001 (Chapter 840, Statutes of 2001). 4 Percentage changed to 85 percent effective September 30, 2008, and payable October 1, 2008 (Chapter 751, Statutes of 2008).
Table 11 Restoration of Allowance Purchasing Power Through Supplemental Benefit Payments
DEFINED BENEFIT PROGRAM SCHEDULES

191STATISTICAL
Regular Annuity Period Certain
Age Total Single
Life with
Cash
100%
Joint and
Survivor
75%
Joint and
Survivor
50%
Joint and
Survivor
10
Years
9
Years
8
Years
7
Years
6
Years
5
Years
4
Years
3
Years
Under 55 14 7 1 1 1 2 — — 1 — — — 1
55 302 102 46 5 8 53 4 3 5 6 38 9 23
56 149 44 16 3 8 30 2 2 2 4 15 5 18
57 204 57 22 5 8 46 2 8 4 7 12 9 24
58 300 76 45 1 17 57 7 4 16 13 33 10 21
59 377 102 41 4 19 82 9 5 15 19 51 9 21
60 645 153 70 20 31 152 10 4 14 22 100 17 52
61 936 217 137 32 62 196 26 13 19 23 109 41 61
62 870 243 112 27 62 160 7 19 19 17 96 31 77
63 765 211 87 17 44 158 13 8 38 23 86 19 61
64 563 150 70 29 42 105 5 3 9 26 76 11 37
65 541 169 78 8 28 102 7 — 14 8 74 18 35
66 410 133 55 14 27 78 8 3 3 12 37 11 29
67 313 77 29 18 21 76 3 2 8 2 30 9 38
68 232 75 31 2 10 51 1 4 7 3 26 3 19
69 181 50 18 4 12 49 2 2 4 4 18 5 13
70 152 46 16 10 7 36 3 1 1 2 18 5 7
71 102 33 9 2 8 27 1 3 1 1 7 1 9
72 69 24 6 — 5 13 1 1 3 1 10 1 4
73 51 13 5 1 4 7 2 — 1 2 6 2 8
74 47 13 4 1 3 18 — — — 3 2 — 3
75 and over 97 30 12 6 6 14 1 1 3 2 11 2 9
Total 7,320 2,025 910 210 433 1,512 114 86 187 200 855 218 570
1 Does not include formerly disabled members.
Table 1 Members Retired for Service During Fiscal Year 2017–181, Classified by Age and Option Elected
DEFINED BENEFIT SUPPLEMENT PROGRAM SCHEDULES

192 CALSTRS COMPREHENSIVE ANNUAL FINANCIAL REPORT 2018
Fiscal Year
Ending June 30Count
Average Monthly
Retirement Annuity
Average Accumulated
Credits1
Average Age
at Retirement
2009 22,474 $203 $9,019 61.6
2010 29,261 227 10,651 61.7
2011 34,917 241 12,004 61.9
2012 40,493 250 13,133 62.0
2013 45,110 254 14,088 62.1
2014 48,745 255 14,848 62.2
2015 52,335 259 15,659 62.3
2016 56,238 269 16,590 62.4
2017 60,505 280 23,873 62.5
2018 64,796 289 24,883 62.6
Fiscal Year
Ending June 30Count
Average Monthly
Disability Annuity
Average Accumulated
Credits1
Average Age
at Retirement
2009 236 $163 $6,308 54.8
2010 336 201 7,673 55.6
2011 575 239 9,436 55.4
2012 747 239 10,404 55.5
2013 977 244 11,495 55.6
2014 1,123 239 12,407 55.8
2015 1,263 245 13,237 55.6
2016 1,340 239 13,953 55.5
2017 1,428 246 19,793 55.3
2018 1,464 244 20,232 55.2
1 Neither service credit nor final compensation are factors in determining a benefit from the DBS Program and, therefore, are not included in this table.
1 Neither service credit nor final compensation are factors in determining a benefit from the DBS Program and, therefore, are not included in this table.
Table 2 Characteristics of All Members Retired for Service and Receiving an Annuity
Table 3 Characteristics of All Members Retired for Disability and Receiving an Annuity
DEFINED BENEFIT SUPPLEMENT PROGRAM SCHEDULES

193STATISTICAL
Table 4 Retired Members by Type of Benefit and Option Elected (as of June 30, 2018)
Monthly Unmodified Allowance
Type of Benefit Less than $250 $250–$500 $500–$750 $750–$1,000 $1,000 & Greater Total
Retirement 37,920 17,752 5,666 1,929 1,529 64,796
Disability 1,006 320 91 30 17 1,464
Survivors 1,116 328 115 45 54 1,658
Total 40,042 18,400 5,872 2,004 1,600 67,918
Type of Payment
Regular Annuity
Single Life Without Cash 1,053 1 — — — 1,054
Single Life With Cash 19,175 3,347 378 116 56 23,072
100% J&S 9,904 2,168 300 74 60 12,506
75% J&S 1,469 420 72 10 16 1,987
50% J&S 3,376 836 129 35 17 4,393
Period Certain Annuity
10 Year 4,086 7,861 1,445 379 275 14,046
9 Year 181 613 141 33 36 1,004
8 Year 80 395 117 25 28 645
7 Year 88 615 288 66 54 1,111
6 Year 76 444 404 77 57 1,058
5 Year 329 1,261 1,877 522 327 4,316
4 Year 61 163 389 169 118 900
3 Year 164 276 332 498 556 1,826
Total 40,042 18,400 5,872 2,004 1,600 67,918
DEFINED BENEFIT SUPPLEMENT PROGRAM SCHEDULES

194 CALSTRS COMPREHENSIVE ANNUAL FINANCIAL REPORT 2018
Regular Annuity Period Certain Annuity
Age
Total
Participant
Only1
100%
Beneficiary2
75%
Beneficiary3
50%
Beneficiary4
10
Years
9
Years
8
Years
7
Years
6
Years
5
Years
4
Years
3
Years
Under 55 0 — — — — — — — — — — — —
55 2 — — — — — — — — — 2 — —
56 0 — — — — — — — — — — — —
57 0 — — — — — — — — — — — —
58 0 — — — — — — — — — — — —
59 4 1 — — — 1 — — — — 1 — 1
60 2 — 1 1 — — — — — — — — —
61 2 1 — — — — — — — — — 1 —
62 4 1 — — — 1 — — — 1 — — 1
63 4 1 — — — — — — — — — 1 2
64 2 1 — — — — — — — — 1 — —
65 3 2 — — — — — — — — 1 — —
66 5 3 — 1 — 1 — — — — — — —
67 3 1 — — — 1 1 — — — — — —
68 3 1 1 — — — — — — — — — 1
69 8 5 — — — — — — 1 — — 1 1
70 8 1 1 — — — — — 1 — 2 1 2
71 8 1 1 1 — 1 — — — — 2 — 2
72 2 — — — — 1 — — — — — — 1
73 1 1 — — — — — — — — — — —
74 2 — — — — 1 — — — — — — 1
75 & Over 18 6 — 1 — 1 — — 1 — 3 — 6
Total 81 26 4 4 0 8 1 0 3 1 12 4 18
1 Formerly known as the Single Life Annuity with Cash Refund.2 Formerly known as the 100 percent Joint and Survivor Annuity.3 New option available for selection effective January 1, 2007.4 Formerly known as the 50 percent Joint and Survivor Annuity.
Table 1 Participants Retired for Service During the 2017–18 Fiscal Year Classified by Age and Type of Annuity Elected1
CASH BALANCE BENEFIT PROGRAM SCHEDULES

195STATISTICAL
Fiscal Year Ending June 30 Average Age At Retirement Average Annuitant Reserve Average Monthly Annuity
2009 67.3 $13,054 $201
2010 68.1 12,701 204
2011 67.8 13,388 215
2012 67.7 15,945 233
2013 67.1 18,442 263
2014 67.5 20,365 281
2015 67.6 20,815 251
2016 67.9 21,700 270
2017 68.0 26,501 308
2018 68.2 27,790 331
Monthly Unmodified Allowance
Type of Benefit Less than $250 $250–$500 $500–$750 $750–$1,000 $1,000 & Greater Total
Retirement 203 79 38 15 17 352
Disability — 1 — — 1 2
Survivors 8 4 — 3 1 16
Total 211 84 38 18 19 370
Type of Payment
Regular Annuity
Single Life With Cash 1 — — — — 1
Single Life Without Cash 2 — — — — 2
Participant Only 97 34 12 3 1 147
100% Beneficiary Annuity 38 4 1 1 1 45
75% Beneficiary Annuity 5 1 1 — — 7
50% Beneficiary Annuity 7 4 1 — 1 13
Period-Certain Annuity
10 Year 36 12 7 1 — 56
9 Year 1 3 — 1 — 5
8 Year 2 2 — — — 4
7 Year 1 3 3 — — 7
6 Year — 2 2 — 1 5
5 Year 8 6 4 7 1 26
4 Year 4 3 1 3 1 12
3 Year 9 10 6 2 13 40
Total 211 84 38 18 19 370
Table 2 Characteristics of All Members Retired for Service and Receiving an Annuity
Table 3 All Participants Receiving an Annuity by Type of Benefit and Type of Annuity Elected
CASH BALANCE BENEFIT PROGRAM SCHEDULES

196 CALSTRS COMPREHENSIVE ANNUAL FINANCIAL REPORT 2018
Table 4 Principal Participating Employers for the Cash Balance Benefit Program, Current Year and Nine Years Ago
2008–2009
Rank Participating Employers Covered
Employees
Percentage of Total
System
1 Los Angeles Community College District 3,759 12.05%
2 Contra Costa Community College District 2,158 6.92
3 Peralta Community College District 2,068 6.63
4 West Contra Costa Unified School District 2,024 6.49
5 City College of San Francisco 1,867 5.98
6 Chabot-Las Positas Community College District 1,609 5.16
7 San Jose/Evergreen Community College District 1,600 5.13
8 Santa Rosa Junior College 1,342 4.30
9 Glendale Community College District 1,230 3.94
10 Ventura Community College District 1,178 3.78
Top 10 Total 18,835 60.36
All Other 12,368 39.64
Total Covered Employees 31,203 100.00%
2017–2018
Rank Participating Employers *Covered
Employees
Percentage of Total
System
1 Los Angeles Community College District 6,001 14.47%
2 Contra Costa Community College District 2,695 6.50
3 Peralta Community College District 2,486 5.99
4 West Contra Costa Unified School District 2,120 5.11
5 City College of San Francisco 2,066 4.98
6 San Jose/Evergreen Community College District 1,962 4.73
7 Foothill De Anza Community College District 1,875 4.52
8 Chabot-Las Positas Community College District 1,765 4.25
9 Glendale Community College District 1,718 4.14
10 Santa Rosa Junior College 1,579 3.81
Top 10 Total 24,267 58.50
All Other 17,214 41.50
Total Covered Employees 41,481 100.00%
* Covered employees are calculated as all employees for whom an employer reports service credit during the fiscal year. Covered employees in this table are counted more than once if they are reported by multiple employers. They are also counted if their employer reports service credit for a retired employee from prior fiscal years.
CASH BALANCE BENEFIT PROGRAM SCHEDULES

197STATISTICAL
Fiscal Year
Ending June 302018 2017 2016 2015 2014 2013 2012 2011 2010 2009
Additions
Participant Contributions $122,113 $121,945 $96,347 $72,042 $66,545 $57,273 $53,111 $47,181 $53,536 $42,966
Employer Contributions 369 393 377 301 151 269 188 225 — —
Net Investment Income 65,104 77,730 9,548 19,363 66,002 43,151 6,132 43,782 17,175 (28,479)
Other Income 309 141 120 91 28 — — — — —
Total Additions $187,895 $200,209 $106,392 $91,797 $132,726 $100,693 $59,431 $91,188 $70,711 $14,487
Deductions
Distributions and Withdrawals3
$48,481 $36,322 $32,936 $32,648 $22,173 $25,727 $19,978 $16,690 $11,892 $8,644
Refunds of Participant Contributions
5,614 4,657 4,965 7,753 2,523 — — — — —
Administrative Expenses 2,406 1,975 1,583 1,405 1,146 754 606 538 374 278
Total Deductions $56,501 $42,954 $39,484 $41,806 $25,842 $26,481 $20,584 $17,228 $12,266 $8,922
Change in Fiduciary
Net Position$131,394 $157,255 $66,908 $49,991 $106,884 $74,212 $38,847 $73,960 $58,445 $5,565
1 Certain reclassifications have been made to the totals for fiscal year 2008– 09.2 This table has been updated to present employer contributions separate from participant contributions dating back to fiscal year 2008-09 to conform with the presentation on the Statement of Changes in Fiduciary Net Position in the Financial Section.3 Distributions and Withdrawals reflects the Benefit Payments to Participant and Refunds of Participant Contributions combined for fiscal years 2008– 09 through 2012– 13.
Table 1A Changes in Fiduciary Net Position for the Pension2 IRC 403(b) Plan1,2 (Dollars in Thousands)
Fiscal Year Ending June 30 2018 2017 2016 2015 2014 2013 2012 2011 2010 2009
Additions
Participant Contributions $7,038 $6,516 $4,898 $4,025 $3,230 $2,591 $6,877 $1,289 $674 $37
Employer Contributions 85 44 77 71 51 37 37 42 — —
Net Investment Income 2,555 3,338 426 547 1,934 1,081 219 155 60 1
Other Income 11 8 4 2 — — — — — —
Total Additions $9,689 $9,906 $5,405 $4,645 $5,215 $3,709 $7,133 $1,486 $734 $38
Deductions
Distributions and Withdrawals2 $1,411 $769 $905 $807 $358 $530 $19 $82 $ — $ —
Refunds of Participant Contributions 88 36 266 — 45 — — — — —
Administrative Expenses 100 79 56 47 36 22 8 2 — —
Total Deductions $1,599 $884 $1,227 $854 $439 $552 $27 $84 $ — $ —
Change in Fiduciary Net Position $8,090 $9,022 $4,178 $3,791 $4,776 $3,157 $7,106 $1,402 $734 $38
1 This table has been updated to present employer contributions separate from participant contributions dating back to fiscal year 2008-09 to conform with the presentation on the Statement of Changes in Fiduciary Net Position in the Financial Section.2 Distributions and Withdrawals reflects the Benefit Payments to Participant and Refunds of Participant Contributions combined for fiscal years 2008– 09 through 2012– 13.
Table 1B Changes in Fiduciary Net Position for the Pension2 IRC 457(b) Plan1 (Dollars in Thousands)
PROGRAMS ADMINISTERED OR OVERSEEN BY THE RETIREMENT SYSTEM (PENSION2)

198 CALSTRS COMPREHENSIVE ANNUAL FINANCIAL REPORT 2018
Table 2 Largest Participating Employers for CalSTRS Pension2, Current Year and Nine Years Ago
2017–2018
Rank Participating Employers Covered
Employees
Percentage
1 Los Angeles Unified School District 3,397 13.46%
2 Los Angeles Community College District 548 2.17
3 San Diego Unified School District 526 2.08
4 San Francisco Unified School District 357 1.41
5 Fremont Unified School District 337 1.33
6 Elk Grove Unified School District 331 1.31
7 Los Rios Community College District 262 1.04
8 City College of San Francisco 247 0.98
9 Long Beach Unified School District 247 0.98
10 Sacramento Unified School District 223 0.88
Top 10 Total 6,475 25.65
All Other 18,771 74.35
Total (1,122 Employers)* 25,246 100.00%
* If employers offer a 403(b) or 457(b), they are counted twice; totals also include all accounts with or without balances.
2008–2009
Rank Participating Employers Covered
Employees
Percentage
1 Los Angeles Unified School District 1,230 21.53%
2 San Diego Unified School District 154 2.70
3 Long Beach Unified School District 95 1.66
4 San Juan Unified School District 72 1.26
5 Sacramento City Unified School District 70 1.23
6 San Diego Community College District 68 1.19
7 City College of San Francisco 65 1.14
8 Los Angeles Community College District 60 1.05
9 San Francisco Unified School District 58 1.02
10 Capistrano Unified School District 55 0.96
Top 10 Total 1,927 33.74
All Other 3,785 66.26
Total (640 Employers)* 5,712 100.00%
PROGRAMS ADMINISTERED OR OVERSEEN BY THE RETIREMENT SYSTEM (PENSION2)

199STATISTICAL
Fiscal Year
Ending June 302018 2017 2016 2015 2014 2013 2012 2011 2010 2009
Additions
Employer Contributions $28,218 $29,117 $29,982 $30,527 $33,395 $35,022 $34,614 $36,145 $31,749 $29,962
Net Investment Income 18 11 9 — 10 6 8 10 33 106
Total Additions $28,236 $29,128 $29,991 $30,527 $33,405 $35,028 $34,622 $36,155 $31,782 $30,068
Deductions
Premiums Paid $28,036 $28,929 $29,661 $30,615 $32,632 $34,702 $34,412 $35,785 $35,421 $29,415
Administrative Expenses 578 168 380 360 327 340 370 345 309 316
Total Deductions $28,614 $29,097 $30,041 $30,975 $32,959 $35,042 $34,782 $36,130 $35,730 $29,731
Change in Fiduciary
Net Position
($378) $31 ($50) ($448) $446 ($14) ($160) $25 ($3,948) $337
Table 1 Changes in Fiduciary Net Position for the Medicare Premium Payment Program (Dollars in Thousands)
Fiscal Year
Ending June 302018 2017 2016 2015 2014 2013 2012 2011 2010 2009
Type of Benefit
Age & Service Benefits
Retired Members $28,036 $28,929 $29,661 $30,615 $32,632 $34,702 $34,412 $35,785 $35,421 $29,415
Total Benefits $28,036 $28,929 $29,661 $30,615 $32,632 $34,702 $34,412 $35,785 $35,421 $29,415
Table 2 Benefit and Refund Deductions from Changes in Fiduciary Net Position by Type (Dollars in Thousands)
MEDICARE PREMIUM PAYMENT PROGRAM

200 CALSTRS COMPREHENSIVE ANNUAL FINANCIAL REPORT 2018
Age Total
<55 34
55–56 13
56–57 8
57–58 16
58–59 16
59–60 15
60–61 11
61–62 3
62–63 2
63–64 1
64–75 —
>75 —
GrandTotal 119
Fiscal Year
Ending June 30
Average Age
at Retirement
Average Monthly
Medicare Premium
2009 60.3 $464
2010 60.3 438
2011 60.3 431
2012 60.3 417
2013 60.3 413
2014 60.3 400
2015 60.2 383
2016 60.2 374
2017 60.2 376
2018 60.1 380
Table 3 Retired Members Enrolled in Medicare Premium Payment Program During Fiscal Year 2017–18 Classified by Age at Retirement
Table 4 Characteristics of All Retired Members Enrolled in Medicare Premium Payment Program
MEDICARE PREMIUM PAYMENT PROGRAM

201STATISTICAL
Fiscal Year
Ending June 302018 2017 2016 2015 2014 2013 2012 1 2011 1 2010 2009
Additions
Net Investment Income $17 $9 $6 $1 $4 $3 $3 $4 $5 $16
Other Income 1,607 1,453 1,339 1,072 1,241 563 767 497 539 386
Total Additions $1,624 $1,462 $1,345 $1,073 $1,245 $566 $770 $501 $544 $402
Deductions
Administrative Expenses $2,198 $1,542 $1,433 $996 $874 $600 $698 $569 $414 $532
Other Expenses — 22 14 14 15 30 — — — —
Total Deductions $2,198 $1,564 $1,447 $1,010 $889 $630 $698 $569 $414 $532
Change in Fiduciary
Net Position
($574) ($102) ($102) $63 $356 ($64) $72 ($68) $130 ($130)
Table 1 Changes in Fiduciary Net Position for the Teachers’ Deferred Compensation Fund (Dollars in Thousands)
TEACHERS’ DEFERRED COMPENSATION FUND
1 Certain reclassifications have been made to the additions for fiscal years 2010–11 and 2011–12.

This page intentionally left blank.

APPENDIX B
INDEPENDENT AUDITOR’S REPORT, BASIC FINANCIAL STATEMENTS, REQUIRED SUPPLEMENTARY INFORMATION AND OTHER SUPPLEMENTARY INFORMATION FOR
THE FISCAL YEAR ENDED JUNE 30, 2019

[THIS PAGE INTENTIONALLY LEFT BLANK]

California State Teachers’Retirement System(A Component Unit of the State of California)
Independent Auditor’s Report,Basic Financial Statements,Required Supplementary Information, andOther Supplementary Information
For the Fiscal Year Ended June 30, 2019

Table of Contents
Independent Auditor’s Report ...............................................................................................................................1
Management’s Discussion and Analysis (Unaudited) ......................................................................................4
Basic Financial Statements
Statement of Fiduciary Net Position ...............................................................................................................22
Statement of Changes in Fiduciary Net Position ...........................................................................................23
Notes to the Basic Financial Statements
1. Significant Provisions of CalSTRS Plans and Programs ...........................................................................24
2. Summary of Significant Accounting Policies .............................................................................................32
3. Net Pension Liability of Employers and Nonemployer Contributing Entity ............................................36
4. Net Other Postemployment Benefit (OPEB) Liability of Employers ........................................................37
5. Deposits and Investments ............................................................................................................................39
6. Fair Value Measurements .............................................................................................................................56
7. Contingencies .................................................................................................................................................61
8. Commitments ................................................................................................................................................61
9. New Accounting Pronouncements ..............................................................................................................62
Required Supplementary Information (Unaudited)
Schedule of Changes in Net Pension Liability of Employers and Nonemployer Contributing Entity ......63
Schedule of Net Pension Liability of Employers and Nonemployer Contributing Entity ...........................64
Schedule of Pension Contributions from Employers and Nonemployer Contributing Entity ....................65
Schedule of Money-Weighted Investment Returns for State Teachers’ Retirement
Plan and Medicare Premium Payment Program ...........................................................................................66
Schedule of Changes in Net OPEB Liability of Employers ............................................................................67
Schedule of Net OPEB Liability of Employers ................................................................................................68
Other Supplementary Information
Schedule of Administrative Expenses .............................................................................................................69
Schedule of Investment Expenses ...................................................................................................................70
Schedule of Consultant and Professional Services Expenses ......................................................................74

Crowe LLPIndependent Member Crowe Global
INDEPENDENT AUDITOR'S REPORT
Teachers’ Retirement Board of the CaliforniaState Teachers’ Retirement System
West Sacramento, California
Report on the Financial Statements
We have audited the accompanying financial statements of California State Teachers’ Retirement System (“System” or “CalSTRS”), a component unit of the State of California, as of and for the year ended June 30, 2019, and the related notes to the financial statements, which collectively comprise the System’s basic financial statements as listed in the table of contents.
Management’s Responsibility for the Financial Statements
Management is responsible for the preparation and fair presentation of these financial statements in accordance with accounting principles generally accepted in the United States of America; this includes the design, implementation, and maintenance of internal control relevant to the preparation and fair presentation of financial statements that are free from material misstatement, whether due to fraud or error.
Auditor’s Responsibility
Our responsibility is to express an opinion on these financial statements based on our audit. We conducted our audit in accordance with auditing standards generally accepted in the United States of America and the standards applicable to financial audits contained in Government Auditing Standards, issued by the Comptroller General of the United States. Those standards require that we plan and perform the audit to obtain reasonable assurance about whether the financial statements are free from material misstatement. An audit involves performing procedures to obtain audit evidence about the amounts and disclosures in the financial statements. The procedures selected depend on the auditor’s judgment, including the assessment of the risks of material misstatement of the financial statements, whether due to fraud or error. In making those risk assessments, the auditor considers internal control relevant to the System’s preparation and fair presentation of the financial statements in order to design audit procedures that are appropriate in the circumstances, but not for the purpose of expressing an opinion on the effectiveness of the System’s internal control. Accordingly, we express no such opinion. An audit also includes evaluating the appropriateness of accounting policies used and the reasonableness of significant accounting estimates made by management, as well as evaluating the overall presentation of the financial statements.
We believe that the audit evidence we have obtained is sufficient and appropriate to provide a basis for our audit opinion.
Opinion
In our opinion, the financial statements referred to above present fairly, in all material respects, the fiduciary net position of California State Teachers’ Retirement System as of June 30, 2019, and the changes in fiduciary net position for the year then ended in accordance with accounting principles generally accepted in the United States of America.
1FINANCIAL

Emphasis of Matters
Net Pension Liability of Employers and Nonemployer Contributing Entity
As described in Note 3, based on the most recent actuarial valuation as of June 30, 2018, the System’s independent actuaries determined that, at June 30, 2019, the value of the State Teachers’ Retirement Plan (STRP) total pension liability exceeded the STRP fiduciary net position by $ 90.3 billion. The actuarial valuation is sensitive to the underlying actuarial assumptions, including investment rate of return of 7.1%,consumer price inflation of 2.75%, wage growth of 3.5% and custom mortality tables based on CalSTRS most recent Experience Analysis. Our opinion is not modified with respect to this matter.
Fair Value of Investments
As described in Notes 5 and 6, the financial statements include investments valued at approximately $76.6billion as of June 30, 2019, for which fair value has been estimated by general partners and investment advisors, and reviewed and approved by the System’s management, in the absence of readily ascertainable market values. Because of the inherent uncertainty of valuation, the estimate of values may differ from the values that would have been used had a ready market existed for the investment securities, and the differences could be material. Our opinion is not modified with respect to this matter.
Other Matters
Required Supplementary Information
Accounting principles generally accepted in the United States of America require that Management’s Discussion and Analysis on pages 4 - 21 and the Schedule of Changes in Net Pension Liability of Employers and Nonemployer Contributing Entity, Schedule of Net Pension Liability of Employers and Nonemployer Contributing Entity, Schedule of Pension Contributions from Employers and Nonemployer Contributing Entity, Schedule of Money-Weighted Investment Returns for State Teachers’ Retirement Plan and Medicare Premium Payment Program, Schedule of Changes in Net OPEB Liability of Employers and Schedule of Net OPEB Liability of Employers on pages 63 - 68 be presented to supplement the basic financial statements. Such information, although not a part of the basic financial statements, is required by Governmental Accounting Standards Board who considers it to be an essential part of financial reporting for placing the basic financial statements in an appropriate operational, economic, or historical context. We have applied certain limited procedures to the required supplementary information in accordance with auditing standards generally accepted in the United States of America, which consisted of inquiries of management about the methods of preparing the information and comparing the information for consistency with management’s responses to our inquiries, the basic financial statements, and other knowledge we obtained during our audit of the basic financial statements. We do not express an opinion or provide any assurance on the information because the limited procedures do not provide us with sufficient evidence to express an opinion or provide any assurance.
Supplementary Information
Our audit was conducted for the purpose of forming an opinion on the financial statements that collectively comprise the System’s basic financial statements. The Schedule of Administrative Expenses, Schedule of Investment Expenses and Schedule of Consultant and Professional Services Expenses are presented for purposes of additional analysis and are not a required part of the basic financial statements.
The Schedule of Administrative Expenses, Schedule of Investment Expenses and Schedule of Consultant and Professional Services Expenses are the responsibility of management and were derived from and relate directly to the underlying accounting and other records used to prepare the basic financial statements. Such information has been subjected to the auditing procedures applied in the audit of the basic financial statements and certain additional procedures, including comparing and reconciling such information directly to the underlying accounting and other records used to prepare the basic financial statements or to the basic financial statements themselves, and other additional procedures in accordance with auditing standards generally accepted in the United States of America. In our opinion, the Schedule of Administrative Expenses, Schedule of Investment Expenses and Schedule of Consultant and Professional Services Expenses are fairly stated, in all material respects, in relation to the basic financial statements as a whole.
2 FINANCIAL

Other Reporting Required by Government Auditing Standards
In accordance with Government Auditing Standards, we have also issued our report dated October 14, 2019 on our consideration of California State Teachers’ Retirement System’s internal control over financialreporting and on our tests of its compliance with certain provisions of laws, regulations, contracts, and other matters. The purpose of that report is to describe the scope of our testing of internal control over financial reporting and compliance and the results of that testing, and not to provide an opinion on internal control over financial reporting or on compliance. That report is an integral part of an audit performed in accordance with Government Auditing Standards in considering California State Teachers’ Retirement System’s internal control over financial reporting and compliance.
Crowe LLP
Sacramento, CaliforniaOctober 14, 2019
3FINANCIAL

4 FINANCIAL
Management’s Discussion and Analysis (Unaudited)
Introduction Management’s discussion and analysis of the California State Teachers’ Retirement System’s (CalSTRS, system, our or we) financial performance is intended to fairly and transparently provide an overview of activities for the fiscal year ended June 30, 2019. The discussion and analysis focuses on business events and resulting changes for fiscal year 2018–19. This discussion is more meaningful when read in conjunction with CalSTRS’ basic financial statements and accompanying notes.
CalSTRS’ actual results, performance and achievements expressed or implied in these statements are subject to changes in interest rates, securities markets, general economic conditions, legislation, regulations and other factors.
Mission Over the past 106 years, CalSTRS’ mission has remained the same—securing the financial future and sustaining the trust of California’s educators. Since CalSTRS was founded in 1913, we have grown from no assets and about 15,000 members to net assets of approximately $240.0 billion serving 964,572 members and beneficiaries as of June 30, 2019. In 1913, the annual benefit was $500; today, the average annual member-only benefit is approximately $49,000. Today, CalSTRS is the largest educator-only pension fund in the world and the second largest pension fund in the U.S.
Year in Review The paragraphs that follow discuss significant events, changes and updates on ongoing efforts for fiscal year 2018−19 that affect CalSTRS operations.
Teachers’ Retirement Board Update During fiscal year 2018−19, CalSTRS announced three member-elected individuals representing current educators to the Teachers’ Retirement Board (the board), who will each serve a four-year term beginning on January 1, 2020.
Harry M. Keiley and Sharon Hendricks, who have served on the board since 2007 and 2011, respectively, were re-elected. Denise Bradford was elected and will succeed Dana Dillon, who has been on the board since January 1, 2004. Ms. Dillon will vacate her seat when her term expires on December 31, 2019.
In addition, Sharon Hendricks and Harry M. Keiley were elected to serve as board chair and vice-chair, respectively, at the May 2019 board meeting, with the positions effective immediately.
The board also has three new members resulting from the California statewide election and governor appointment as follows:
In November 2018, Fiona Ma was elected as Treasurer of the State of California and Tony Thurmond was elected as State Superintendent of Public Instruction. By virtue of their elections, both Treasurer Ma and Superintendent Thurmond currently serve as ex-officio members of the board. In March 2019, Governor Gavin Newsom appointed William Prezant as a public representative to the board, whose term will run through December 31, 2022.

5FINANCIAL
Supplemental General Fund ContributionsOn June 27, 2019, California Senate Bill 90 (SB 90) was signed into law and appropriated approximately $2.2 billion in fiscal year 2018–19 from the General Fund of the State of California (the state) as contributions to CalSTRS on behalf of employers of the Defined Benefit (DB) Program. The bill allocates portions of the contribution to pay in advance, on behalf of employers, 1.03 and 0.70 percentage points of the contributions required from DB employers for fiscal years 2019–20 and 2020–21, respectively. The remaining portion of the contribution is allocated to reduce the employers’ share of the unfunded actuarial obligation of the DB Program.
In addition, the bill appropriates future supplemental contributions based on excess General Fund revenue, pursuant to the requirements of California Proposition 2, the Rainy Day Budget Stabilization Fund Act, passed in 2014. When received, these supplemental payments will reduce the state’s portion of the unfunded actuarial obligation of the DB Program in fiscal years 2019–20 through 2022–23.
Headquarters Expansion ProjectIn November 2018, the board approved the construction of an expansion to CalSTRS’ West Sacramento headquarters utilizing bond financing at a cost not to exceed $300 million, excluding the cost of financing. The expansion will allow the organization to meet the long-term space needs resulting from the increase in size and complexity of the system. CalSTRS will finance the project through conduit tax-exempt lease revenue bonds issued by the California Infrastructure Economic Development Bank. The sale of the bonds is expected to close in December 2019.
CalSTRS’ vision and guiding beliefs support advancing sustainability. As such, the headquarters expansion is being designed to support sustainable green building practices, including green technologies, sustainable construction, energy conservation and whole-building integrated energy
Management’s Discussion and Analysis (Unaudited)
efficiency measures as well as employee wellness goals. These efforts are intended to qualify the tax-exempt lease revenue bonds to be classified as Green Bonds, which identify to investors that the bond proceeds will be used specifically for sustainable projects that will have a positive impact on the environment. Construction for the expansion is set to begin in late 2019 with completion expected sometime in early 2022.
Pension Solution ProjectThe Pension Solution Project is an ongoing effort by CalSTRS to modernize the legacy pension administration system. In July 2018, the board approved a revised timeline for completion of the project. CalSTRS staff and CGI Group, Inc., the vendor contracted to configure and implement the new system, continue to work closely to mitigate certain challenges and risks. The project is currently on track with the revised timeline, and is anticipated to be completed by February 2022.
CalSTRS Collaborative ModelDuring fiscal year 2018–19, CalSTRS staff presented information and recommendations to the board’s Investment Committee on the CalSTRS Collaborative Model. This approach embraces partnerships and collaboration by expanding direct investment opportunities through various investment structures, including peer partnerships, joint ventures, co-investments and passive and controlling stakes in investment companies, while building additional direct investing capabilities. Continued implementation efforts of the CalSTRS Collaborative Model will involve resources across four enterprise-wide Pillars: Human Resources, Procurement, Travel and Other (such as Legal, Technology, Financial Services and Communications). Full implementation will be measurable, span multiple years and be reported to the Investment Committee. At its May 2019 meeting, the board approved a budget and staffing augmentation to provide the Investments Branch additional resources for the 2019–20 fiscal year to continue implementation of the CalSTRS Collaborative Model.

6 FINANCIAL
Management’s Discussion and Analysis (Unaudited)
Fiduciary Net Position(Dollars in Thousands)
Assets and Deferred Outflows of Resources 2019 2018 % Change
Investment Assets1 $ 261,270,852 $247,370,532 5.6%
Cash 321,051 153,256 109.5%
Investment Receivables 4,763,939 3,076,620 54.8%
Member, Employer, State and Other Receivables 5,830,354 3,468,656 68.1%
Capital and Other Assets 317,418 276,245 14.9%
Total Assets 272,503,614 254,345,309 7.1%
Deferred Outflows of Resources 68,561 117,457 (41.6%)
Total Assets and Deferred Outflows of Resources 272,572,175 254,462,766 7.1%
Liabilities and Deferred Inflows of Resources
Investment Liabilities 123,852 140,070 (11.6%)
Investments Purchased Payable 5,194,433 3,346,989 55.2%
Loans Payable 2,787,387 2,731,737 2.0%
Benefits in Process of Payment 1,513,766 263,254 475.0%
Net Pension and OPEB Liabilities 816,327 835,204 (2.3%)
Securities Lending Obligation 22,786,907 21,917,706 4.0%
Other 369,832 303,893 21.7%
Total Liabilities 33,592,504 29,538,853 13.7%
Deferred Inflows of Resources 117,783 55,278 113.1%
Total Liabilities and Deferred Inflows of Resources 33,710,287 29,594,131 13.9%
NET POSITION RESTRICTED FOR PENSIONS $238,861,888 $224,868,635 6.2%
1 Includes securities lending collateral of $22.8 billion and $21.9 billion as of June 30, 2019, and June 30, 2018, respectively.
Financial HighlightsThis section discusses major changes in account balances for the State Teachers’ Retirement Plan (STRP), CalSTRS Pension2 Programs (Pension2), Medicare Premium Payment (MPP) Program and the Teachers’ Deferred Compensation Fund (TDCF). Comparative financial statement information is presented for the STRP through condensed versions of the Statement of Fiduciary Net Position and Statement of Changes in Fiduciary Net Position as of and for the fiscal years ended June 30, 2019, and June 30, 2018.
State Teachers’ Retirement PlanThe STRP is a multiple-employer, cost-sharing defined benefit plan composed of four programs: the DB Program, Defined Benefit Supplement (DBS) Program, Cash Balance Benefit (CBB) Program and Replacement Benefits Program. The STRP holds assets for the exclusive purpose of providing benefits to members of these programs and their beneficiaries.
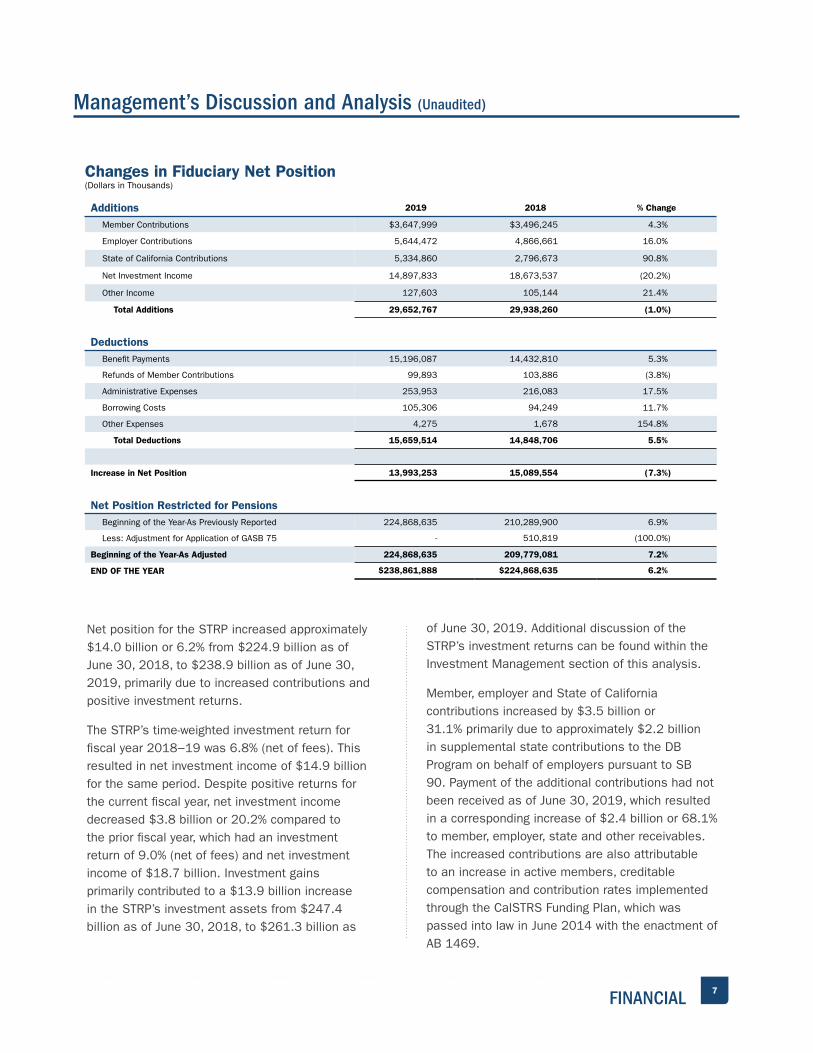
7FINANCIAL
Management’s Discussion and Analysis (Unaudited)
Net position for the STRP increased approximately $14.0 billion or 6.2% from $224.9 billion as of June 30, 2018, to $238.9 billion as of June 30, 2019, primarily due to increased contributions and positive investment returns.
The STRP’s time-weighted investment return for fiscal year 2018−19 was 6.8% (net of fees). This resulted in net investment income of $14.9 billion for the same period. Despite positive returns for the current fiscal year, net investment income decreased $3.8 billion or 20.2% compared to the prior fiscal year, which had an investment return of 9.0% (net of fees) and net investment income of $18.7 billion. Investment gains primarily contributed to a $13.9 billion increase in the STRP’s investment assets from $247.4 billion as of June 30, 2018, to $261.3 billion as
Changes in Fiduciary Net Position(Dollars in Thousands)
Additions 2019 2018 % Change
Member Contributions $3,647,999 $3,496,245 4.3%
Employer Contributions 5,644,472 4,866,661 16.0%
State of California Contributions 5,334,860 2,796,673 90.8%
Net Investment Income 14,897,833 18,673,537 (20.2%)
Other Income 127,603 105,144 21.4%
Total Additions 29,652,767 29,938,260 (1.0%)
Deductions
Benefit Payments 15,196,087 14,432,810 5.3%
Refunds of Member Contributions 99,893 103,886 (3.8%)
Administrative Expenses 253,953 216,083 17.5%
Borrowing Costs 105,306 94,249 11.7%
Other Expenses 4,275 1,678 154.8%
Total Deductions 15,659,514 14,848,706 5.5%
Increase in Net Position 13,993,253 15,089,554 (7.3%)
Net Position Restricted for Pensions
Beginning of the Year-As Previously Reported 224,868,635 210,289,900 6.9%
Less: Adjustment for Application of GASB 75 - 510,819 (100.0%)
Beginning of the Year-As Adjusted 224,868,635 209,779,081 7.2%
END OF THE YEAR $238,861,888 $224,868,635 6.2%
of June 30, 2019. Additional discussion of the STRP’s investment returns can be found within the Investment Management section of this analysis.
Member, employer and State of California contributions increased by $3.5 billion or 31.1% primarily due to approximately $2.2 billion in supplemental state contributions to the DB Program on behalf of employers pursuant to SB 90. Payment of the additional contributions had not been received as of June 30, 2019, which resulted in a corresponding increase of $2.4 billion or 68.1% to member, employer, state and other receivables. The increased contributions are also attributable to an increase in active members, creditable compensation and contribution rates implemented through the CalSTRS Funding Plan, which was passed into law in June 2014 with the enactment of AB 1469.

8 FINANCIAL
Management’s Discussion and Analysis (Unaudited)
Benefit payments for fiscal year 2018−19 were $15.2 billion, which is an increase of $0.8 billion or 5.3% compared to June 30, 2018. This is due to an increase in the STRP’s retirees and beneficiaries and a cost-of-living adjustment added to benefit allowances. Benefits in process of payment increased $1.3 billion due to timing, as the June 2019 monthly benefit payments were disbursed on July 1, 2019, in accordance with the annual pay dates calendar.
Investment receivables increased $1.7 billion and investments purchased payable increased $1.8 billion due to the timing of settlement of investment purchases and sales.
Other Programs and FundsIn addition to the STRP, CalSTRS administers two defined contribution plans within the CalSTRS Pension2 Program, a postemployment benefit plan known as the MPP Program and the TDCF which accounts for ancillary activities associated with the various deferred compensation plans and programs. The following discussion provides noteworthy changes for each of these programs and funds.
Pension2 403(b) Plan
CalSTRS Pension2 403(b) Plan is a voluntary defined contribution program that offers low-cost and tax-deferred 403(b) and Roth 403(b) plans for additional retirement savings.
Net position for the Pension2 403(b) Plan increased $0.2 billion or 16.1% to $1.1 billion as of June 30, 2019, primarily due to positive net investment income and increased member contributions, which are voluntary for the 403(b) Plan.
Pension2 457(b) Plan
CalSTRS Pension2 457(b) Plan is a voluntary defined contribution program that offers low-cost and tax-deferred 457(b) and Roth 457(b) plans for additional retirement savings.
Net position for the Pension2 457(b) Plan increased $9.9 million or 23.5% to $52.2 million as of June 30, 2019, primarily due to positive net investment income and increased member contributions, which are voluntary for the 457(b) Plan.

9FINANCIAL
Management’s Discussion and Analysis (Unaudited)
Medicare Premium Payment Program
CalSTRS administers the MPP Program through the Teachers’ Health Benefit Fund. The MPP Program pays Medicare Part A premiums and Medicare Parts A and B late enrollment surcharges for retired members of the DB Program who meet certain eligibility criteria. Members who retire on or after July 1, 2012, are not eligible for coverage under the MPP Program.
The MPP Program has reflected a net deficit for the past two years primarily resulting from the implementation of Governmental Accounting Standards Board (GASB) Statement No. 68, Accounting and Financial Reporting for Pensions—an Amendment of GASB Statement No. 27, in fiscal year 2014–15 and GASB Statement No. 75, Accounting and Financial Reporting for Postemployment Benefits Other Than Pensions, in fiscal year 2017–18. The implementation of these standards resulted in the program incurring increased administrative expenses from the recognition of its share of the state’s net pension liability (NPL) and net other postemployment benefits (OPEB) liability. The amounts recognized represent long-term liabilities reported on an accrual basis and do not adversely impact the viability of the fund or its ability to meet current obligations.
Operationally, the MPP Program is funded on a pay-as-you-go basis, with contributions generally being made at the same time and in the same amount as benefit payments and expenses coming due. The current net deficit of the MPP Program increased to approximately $3.0 million as of June 30, 2019, primarily due to an increase in the MPP Program’s proportionate share of the state’s OPEB expense.
Teachers’ Deferred Compensation Fund
The TDCF is a trust fund established to account for ancillary activities associated with various deferred compensation plans and programs offered by CalSTRS, such as the 403(b) and 457(b) plans.
The TDCF has reflected a net deficit for the past five years primarily resulting from the implementation of GASB Statement No. 68 in fiscal year 2014–15 and GASB Statement No. 75 in fiscal year 2017–18. The implementation of these standards resulted in the TDCF incurring increased administrative expenses resulting from the recognition of its share of the state’s NPL and net OPEB liability. The amounts recognized represent long-term liabilities reported on an accrual basis and do not adversely impact the viability of the fund or its ability to meet current obligations.
The current net deficit of the TDCF improved slightly to approximately $4.7 million as of June 30, 2019, due to a reduction of administrative expenses incurred and higher administrative fees earned.

10 FINANCIAL
Management’s Discussion and Analysis (Unaudited)
Overview of Financial StatementsThe Management’s Discussion and Analysis section is also an introduction to CalSTRS’ basic financial statements. CalSTRS’ financial statements include the following components:
• Statement of Fiduciary Net Position
• Statement of Changes in Fiduciary Net Position
• Notes to the Basic Financial Statements
• Required Supplementary Information (Unaudited)
• Other Supplementary Information
Statement of Fiduciary Net PositionThe Statement of Fiduciary Net Position presents information on all of CalSTRS’ assets and liabilities, with the difference between the two reported as net position. Over time, the increase or decrease in net position serves as an indicator of CalSTRS’ financial condition and our ability to fund future benefit payments.
Statement of Changes in Fiduciary Net PositionThe Statement of Changes in Fiduciary Net Position reflects how CalSTRS’ net position changed during the fiscal year and presents contributions earned, benefit payments made, investment returns and the costs of plan administration.
Notes to the Basic Financial Statements The Notes to the Basic Financial Statements provide information essential to a full understanding of the basic financial statements. The type of information provided in each note is as follows:
• Note 1 provides a summary of information on the significant provisions of CalSTRS’ plans and programs.
• Note 2 provides a summary of significant accounting policies, including the basis of accounting for CalSTRS, management’s use of estimates, cash and investment accounting policies and other significant accounting policies.
• Note 3 provides information regarding the NPL of employers and nonemployer contributing entity for the STRP, including the actuarial assumptions and methods used to determine the total pension liability.
• Note 4 provides information regarding the net OPEB liability of employers for the MPP Program including the actuarial assumptions and methods used to determine the total OPEB liability.
• Note 5 provides information related to deposits, investments and risks (credit, interest rate and foreign currency) in addition to a Schedule of Investments that discloses the types of investments within each broad investment category.
• Note 6 provides information related to the fair value measurement of investments.
• Note 7 provides potential contingencies of CalSTRS.
• Note 8 provides a summary of CalSTRS’ significant commitments.
• Note 9 provides a summary of new accounting and financial reporting pronouncements that have a material impact on CalSTRS’ basic financial statements.

11FINANCIAL
Management’s Discussion and Analysis (Unaudited)
Required Supplementary InformationThe Required Supplementary Information section consists of six schedules intended to assist readers in understanding the NPL of the STRP and the net OPEB liability of the MPP Program. The information available in this section includes:
• Schedule I – Schedule of Changes in Net Pension Liability of Employers and Nonemployer Contributing Entity
• Schedule II – Schedule of Net Pension Liability of Employers and Nonemployer Contributing Entity
• Schedule III – Schedule of Pension Contributions from Employers and Nonemployer Contributing Entity
• Schedule IV – Schedule of Money-Weighted Investment Returns for State Teachers’ Retirement Plan and Medicare Premium Payment Program
• Schedule V – Schedule of Changes in Net OPEB Liability of Employers
• Schedule VI – Schedule of Net OPEB Liability of Employers
Other Supplementary InformationOther Supplementary Information includes details on administrative expenses, investment expenses, and consultant and professional services expenses. The schedules available in the Other Supplementary Information section include:
• Schedule VII – Schedule of Administrative Expenses
• Schedule VIII – Schedule of Investment Expenses
• Schedule IX – Schedule of Consultant and Professional Services Expenses
Major Business Components The sections that follow describe the activities and results of CalSTRS’ major business components (investment management and pension administration) for fiscal year 2018–19.
Investment ManagementCalSTRS’ primary goal is to maintain a financially sound retirement system. Our investment philosophy is “long-term patient capital”—investing for long-term net cash flows and capital gain potential at a reasonable price.
CalSTRS’ investment beliefs serve as the foundation for our investment policies and describe the authority, responsibility and fiduciary duty CalSTRS has in executing our investment process. The eight investment beliefs are:
1. Diversification strengthens the fund.
2. The global public investment markets are largely, but not completely, efficient.
3. Managing investment costs yields long-term benefits.
4. Internal management is a critical capability.
5. CalSTRS can potentially capture an illiquidity risk premium.
6. Managing short-term draw down risk can positively impact CalSTRS’ ability to meet its long-term financial obligations.
7. Responsible corporate governance, including the management of environmental, social and governance (ESG) factors, can benefit long-term investors like CalSTRS.
8. Alignment of financial interests between CalSTRS and its advisors is critical.

12 FINANCIAL
CalSTRS uses a time-weighted return to evaluate returns for portfolio performance purposes, and the discussion of investment performance that follows is based on the time-weighted methodology. CalSTRS also prepares and discloses a money-weighted return for financial reporting purposes in accordance with GASB Statement No. 67, Financial Reporting for Pension Plans—an Amendment of GASB Statement No. 25, and GASB Statement No. 74, Financial Reporting for Postemployment Benefit Plans Other Than Pension Plans. Additional detail and discussion of money-weighted returns can be found in Note 5 of the Notes to the Basic Financial Statements.
For the fiscal year ended June 30, 2019, CalSTRS’ time-weighted return was approximately 6.8% calculated on a net-of-fees basis, which was below
the actuarially assumed 7.00% rate of return used for funding purposes. CalSTRS’ returns (net of fees) reflect the following longer-term performance:
• 9.7% over 3 years
• 6.9% over 5 years
• 10.1% over 10 years
• 6.2% over 20 years
Sources of Investment Income
The graph below displays a detailed view of the sources of investment income for the STRP (excluding securities lending income), based on the Statement of Changes in Fiduciary Net Position as of June 30, 2019.
Management’s Discussion and Analysis (Unaudited)
Investment Income (Gross of Expenses)
$ in
Bill
ions
Dividend Income Interest Income Other Income Net Appreciation(Depreciation) in Fair Value of Investments
9.7
1.11.4
3.0
10
9
8
7
6
5
4
3
2
1
0

13FINANCIAL
CalSTRS’ investments earn income in the form of interest and dividends from holding fixed income securities and various types of equity interests in public companies, limited partnerships and co-investments. Other income consists primarily of distributed income from alternative investments (such as rent), term loans and securities litigation. Net appreciation (depreciation) in fair value of investments consists of realized gains (losses) and unrealized appreciation (depreciation). Realized gains and losses are generally a result of investment sales, write-offs and re-organizations. Unrealized appreciation and depreciation is generated by period-over-period valuation fluctuations in all types of investments.
Asset Allocation and Performance
The graph below presents net investments of the STRP (excluding securities lending collateral and obligations) allocated based on investment classifications within the Statement of Fiduciary Net Position as of June 30, 2019.
Management’s Discussion and Analysis (Unaudited)
Allocation of Investments Based on the Statement of Fiduciary Net Position1
1 This chart only represents investments of the STRP as investment assets of the STRP are managed by CalSTRS. While CalSTRS offers investment strategies for the Pension2 programs, investment assets of the 403(b) and 457(b) plans are not actively managed by CalSTRS. Additionally, investment assets in the MPP Program and the TDCF are invested in the Surplus Money Investment Fund, which is a pooled investment program administered by the California State Treasurer.
2 Derivative instruments are reported on a net basis in the chart above. Please refer to the Schedule of Investments in the Note 5 of the Notes to the Basic Financial Statements for more information.
Equity Securities
48.11%
Debt Securities
19.74%
Derivative Instruments2
0.02%Alternative Investments
32.13%

14 FINANCIAL
Management’s Discussion and Analysis (Unaudited)
Equity Securities
Representing 50.5% of total investments as of June 30, 2019, the Global Equity asset class is comprised of equity securities within the U.S., non-U.S. developed countries and emerging markets. Sustainable Investment and Stewardship Strategies (SISS) funds (formerly known as Corporate Governance funds) are included within the Global Equity asset class but are classified as Alternative Investments on the financial statements
as reflected in the table above. Approximately 61% of the Global Equity assets are managed internally by CalSTRS’ investment staff, while the remaining 39% are managed by external investment managers.
As of June 30, 2019, the STRP held $114.7 billion in equity securities across all portfolios, a decrease of 0.6% compared to the prior year.
The following table displays the distribution of net investments based on the portfolio allocation as compared to the classification within the Statement of Fiduciary Net Position as of June 30, 2019.
Portfolio Allocation Versus Financial Statement Classification
Portfolio Allocation Financial Statement Classification
Asset Class/Strategy Asset Allocation Investments % of Asset Class
Global Equity 50.5%
Equity Securities 95.7%
Alternative Investments 2.7%
Debt Securities 1.5%
Other1 0.1%
Fixed Income 12.3%Debt Securities 100.1%
Other1 (0.1%)
Real Estate 13.7%Alternative Investments 99.6%
Equity Securities 0.4%
Private Equity 9.2%Alternative Investments 99.9%
Equity Securities 0.1%
Cash / Liquidity 2.1% Debt Securities 100.0%
Inflation Sensitive 2.5%
Alternative Investments 70.9%
Debt Securities 34.4%
Derivative Instruments 0.3%
Other1 (5.6%)
Risk Mitigating Strategies 9.4%
Alternative Investments 59.3%
Debt Securities 40.4%
Other1 0.3%
Innovative Strategies 0.3% Alternative Investments 100.0%
Strategic Overlay 0.0%2
Debt Securities (0.4%)
Derivative Instruments (49.6%)
Equity Securities (1.1%)
Other1 151.1%
Total Fund 100.0%
1 Other consists of cash, payables and receivables that are reflected as such on the Statement of Fiduciary Net Position as well as any investment categories less than 0.1%.2 As of June 30, 2019, the net asset value for Strategic Overlay was ($6.7) million, which rounds to less than 0.1% of the total asset allocation.

15FINANCIAL
Management’s Discussion and Analysis (Unaudited)
Performance was volatile for global equities throughout the fiscal year. Domestic and international equities produced solid returns in the first quarter of the reporting period. Tax cuts passed in the previous year contributed to a rise in corporate earnings and were a driving factor for first quarter performance; however, equity markets took a downturn in the second quarter. Rising interest rates and trade tensions between the U.S. and China caused a sharp sell-off in October and declined even further in December as global growth concerns and the partial U.S. government shutdown weighed heavily on investor sentiment. International and emerging markets also decreased amid political uncertainty and falling oil prices.
Equity markets recovered the majority of their losses in the second half of the fiscal year despite a sharp decline in May due to continued concerns of a trade war between the U.S. and China. The Federal Reserve’s decision to hold rates steady and expectations of possible rate cuts eased investor concerns and boosted markets. International and emerging markets advanced as central banks around the world also took a dovish turn to improve the slowing economy. U.K. stocks lagged the overall market amid ongoing Brexit uncertainty and the resignation of Prime Minister Theresa May.
Debt Securities
The Fixed Income asset class is composed of U.S. and non-U.S. dollar-based investment grade and non-investment grade securities. Approximately 86% of the asset class is managed internally by CalSTRS staff, while the remaining 14% is managed by external investment managers.
Debt securities within Fixed Income and other asset classes increased $3.0 billion or 7.0% to $47.0 billion at June 30, 2019.
Fixed income assets appreciated reflecting positive returns despite market performance being mixed throughout the fiscal year. In the first quarter of fiscal year 2018–19, U.S. Treasury yields increased, which lowered bond prices. Positive economic growth and
an increase in interest rates reduced demand for safe-haven investments. However, in November and December, demand increased as less risky investments became more attractive amid the volatile equity markets. As the Federal Reserve and other central banks left rates unchanged, investor expectations of more accommodative monetary policies contributed to the rise in bond prices during the second half of the fiscal year.
Alternative Investments
Alternative investments include private investments in Private Equity, Real Estate, Inflation Sensitive, SISS, Innovative Strategies and Risk Mitigating Strategies (RMS). Alternative investments increased $10.7 billion or 16.2% to $76.6 billion as of June 30, 2019. The increase was primarily due to an increase in privately held equities attributed to new investments within Private Equity and RMS.
RMS represented 9.4% of total STRP investments as of June 30, 2019. This asset class was introduced as a result of the 2015 Asset Liability Management (ALM) study and seeks to construct a portfolio of strategies that provide protection to the STRP during deep and extended equity market downturns. These strategies include trend following, long-duration U.S. Treasuries, global macro and systematic risk premia. RMS generated positive returns for the fiscal year as trend following, long-duration U.S. Treasuries and global macro all contributed to performance.
The Private Equity asset class is composed of limited partnerships and co-investments focusing on commitments to domestic and international partnerships. Types of investment strategies include leveraged buyouts, venture capital and debt-related investments. Emphasis is placed on returns (net of fees), as well as negotiating and monitoring costs associated with limited partnership investments in the Private Equity asset class.

16 FINANCIAL
Management’s Discussion and Analysis (Unaudited)
The Private Equity asset class posted positive returns for the fiscal year ended June 30, 2019. For the industry, performance remained strong but has gradually decreased amid various global market concerns. Fundraising and the number of funds closed have declined compared to previous years as capital raised remains concentrated among a small number of large funds. Unfunded commitments have also remained at record levels. Capital called exceeded distributions during the current fiscal year primarily due to an increase in commitments to new Private Equity investments.
The Real Estate asset class is composed of investments in directly held real estate, such as wholly owned properties and joint venture investments and non-directly held real estate, which consists primarily of commingled funds and co-investments. Emphasis is placed on negotiating, monitoring and managing the costs associated with each real estate investment to more closely align the interest of CalSTRS and the real estate managers.
The Real Estate asset class generated positive returns for the fiscal year. Demand exceeded supply in the commercial property space as new construction activity for all property types declined. Low vacancy rates and rent growth contributed to rising net operating income and higher valuations. In private real estate, the number of funds available in the market increased and fundraising levels remained healthy over the fiscal year.
Asset Liability Management Study
CalSTRS conducts an ALM study every four years, which is a critical process for pension funds that drives the performance of the investment portfolio. Investment returns are expected to be the largest contributor to CalSTRS’ ability to pay benefits and reach full funding over the next 30 years and beyond.
CalSTRS commenced a new ALM study in January 2019 with the first of six presentations to the board’s Investment Committee. To date, the Investment Committee has been presented with a high-level overview of the project, education on the asset allocation process, a historical perspective on asset allocation at CalSTRS, assumptions of the ALM study and a discussion of CalSTRS’ strategic asset classes and their roles. Future presentations will include the following items:
• Key decision factors: metrics that the Investment Committee members can use to weigh the merits of different portfolio options.
• A presentation of preliminary portfolios that span a wide range of risk and return.
• Detailed analysis of portfolios selected by the Investment Committee for a desired level of risk. Analysis will include growth regimes and sensitivity analyses.
Presentations on the ALM study to the Investment Committee are set to conclude in November 2019 with the goal of formally adopting a new long-term asset allocation. If selected and approved, CalSTRS staff will return to the board in February 2020 with an implementation plan for the new asset allocation.
Detailed information regarding the current study and presentations to the board can be found at CalSTRS.com.

17FINANCIAL
Management’s Discussion and Analysis (Unaudited)
Investment Cost Report
The 2017 calendar year investment cost report presented to the board in January 2019 provided a comprehensive view of investment costs across asset classes and investment strategies. The report includes two views of the cost information: internal and external management costs and public and private market costs. Enhancements to the report include a 3-year trend analysis ratio and capture ratios. Total investment cost remained relatively stable over the past three years as basis points (bps) excluding carried interest for calendar years 2015, 2016 and 2017 were 51.8 bps, 50.0 bps and 50.7 bps, respectively.
The 2017 calendar year investment cost report also presented a comparison of CalSTRS’ investment costs to 14 global peers whose assets under management ranged from $79 billion to $548 billion. CalSTRS’ investment strategies saved approximately $132 million compared to our peers (adjusting for asset mix). These comparisons were compiled by a third-party cost measurement service provider using various customized methodologies. CalSTRS will continue to develop standardized cost reporting practices to enhance the investment management reporting. A copy of the report is available at CalSTRS.com.
Pension AdministrationAs a provider of pension and other postemployment benefits, CalSTRS must ensure that the contributions we receive and investment income we earn will fund current and future benefits owed to our members and their beneficiaries. Actuarial valuation reports are prepared on an annual basis to help assess the funded status of our programs and are integral to our administration of benefits. As a result of requirements set forth by GASB standards, CalSTRS prepares separate actuarial valuations for financial reporting purposes and funding purposes.
Pension System Financial Reporting Actuarial
Valuation
The actuarial valuation for financial reporting focuses on the obligation an employer incurs on behalf of employees through the employment-exchange process. The primary purpose of the valuation for financial reporting is to provide a consistent, standardized methodology that allows comparability of data and increased transparency of the pension liability across plans. To achieve this, GASB requires a different approach for determining the reported NPL as compared to the Unfunded Actuarial Accrued Liability (UAAL).
The UAAL is derived through a separate actuarial valuation used for funding purposes, and is one of many necessary elements of a funding valuation to make a comprehensive assessment of the health of the pension plan. The primary purpose of a funding valuation is to assess both the funding levels and sufficiency of existing assets and future contributions to fund promised benefits. The UAAL is assessed separately for each program administered by CalSTRS based on actuarial assumptions specific to each program. The NPL, which pertains to the STRP as a whole, is a GASB required measure that reflects benefits earned by plan members as of a certain date net of pension plan assets.
CalSTRS does not project a depletion of assets with the provision of additional member, employer and state contributions resulting from the enactment of the CalSTRS Funding Plan in June 2014. CalSTRS discounted all future obligations for the STRP using the long-term assumed rate of return on plan assets gross of administrative costs (currently 7.10%). Based on that assumption, the STRP has an NPL of $90.3 billion as of June 30, 2019.

18 FINANCIAL
Management’s Discussion and Analysis (Unaudited)
Pension System Funding Actuarial Valuation
The purpose of the actuarial valuations for funding the programs within the STRP is to guide decisions regarding the long-term viability of the programs. Specifically, the purpose is to analyze the sufficiency of future contributions from members, employers and the state to meet current and future obligations. Historically, CalSTRS’ investment income has comprised 61.1% of the total inflows to the STRP, with member, employer and state contributions comprising the remaining 14.5%, 15.5% and 8.9%, respectively. These percentages change over time due to fluctuating net investment income as well as the adjustments to required member, employer and state contribution rates under the CalSTRS Funding Plan.
Separate funding actuarial valuations are performed for the DB Program, DBS Program and CBB Program. An actuarial projection is performed for the Supplemental Benefit Maintenance Account (SBMA), which is a special account in the STRP that provides inflation protection to CalSTRS members whose current purchasing power has fallen below 85% of the purchasing power of their initial benefit. The assets in the SBMA are credited each year at the rate of investment return assumed for the DB Program. Currently, the investment rate of return and discount rate assumption (net of investment and administrative expenses) for funding actuarial valuations is 7.00% (6.50% for CBB Program). The investment return assumption, according to actuarial principles, should be based on an estimated long-term investment yield for the STRP with consideration given to the nature and mix of current and expected plan investments and is the basis for determining the actuarial value of assets.
The investment return assumptions are developed by CalSTRS’ investment and actuarial consultants and are adopted by the board. The actuarial assumptions and methods used in the June 30, 2018, actuarial valuation were based on the 2015 actuarial experience study adopted by the board in February 2017.
The most recent actuarial funding valuation indicates that the DB Program had 64.0% of the funds needed to pay the actuarial cost of the benefits accrued as of June 30, 2018, which increased by 1.4% from the June 30, 2017, valuation. This increase is primarily attributable to increased contributions to the DB Program resulting from the enactment of the CalSTRS Funding Plan.
Additionally, the funding actuarial valuation for the DBS Program indicates that as of June 30, 2018, the DBS Program had a funded ratio of 124.6% compared to the June 30, 2017, funded ratio of 122.1%. The funding actuarial valuation for the CBB Program indicates that as of June 30, 2018, the program had a funded ratio of 121.6% compared to the June 30, 2017 funded ratio of 120.0%.
Interest is credited to the nominal DBS and CBB program accounts at the minimum guaranteed annual rate established by the board prior to each plan year, which was 2.89% for the fiscal year ended June 30, 2019. The board may credit additional earnings to members’ nominal accounts if actual investment earnings exceed the minimum guaranteed annual rate and meet criteria set out by the board.
The board granted additional earnings credit for the DBS and CBB programs totaling $393.8 million and $10.0 million, respectively. Awarding credits reduced the funded ratios cited above from 124.6% to 120.1% for the DBS Program and from 121.6% to 117.3% for the CBB Program. Refer to Note 1 for additional information.

19FINANCIAL
Other Postemployment Benefits Financial Reporting
Actuarial Valuation
The financial reporting actuarial valuation for the MPP Program is performed to determine the net OPEB liability and other required financial disclosures in accordance with GASB standards. The MPP Program pays for Medicare Part A premiums and Medicare Parts A and B late enrollment surcharges for eligible members of the DB Program. The total OPEB liability for the MPP Program was determined by applying update procedures to the financial reporting actuarial valuation as of June 30, 2018, and rolling forward the total OPEB liability to June 30, 2019. As of June 30, 2019, the net OPEB liability for the MPP Program was $372.4 million.
The MPP Program is funded on a pay-as-you-go basis, with contributions generally being made at the same time, in the same amount, as benefit payments and expenses coming due. Minimal investment assets are maintained in the fund to manage differences between estimated and actual amounts to be paid and are invested in the Surplus Money Investment Fund, which is a pooled investment program administered by the California State Treasurer. For financial reporting purposes, the plan is essentially unfunded as the fiduciary net position of the plan will not be sufficient to make the projected future benefit payments. Therefore, in accordance with GASB Statement No. 74, in instances such as this, the rate used to discount the total OPEB liability represents the yield or index rate for 20-year, tax-exempt general obligation municipal bonds with an average rating of AA/Aa or higher. The discount rate as of June 30, 2019, for the MPP Program OPEB liability is 3.50% as measured by the Bond Buyer’s 20-Bond GO Index as of June 30, 2019.
Management’s Discussion and Analysis (Unaudited)
OPEB Funding Actuarial Valuation
The MPP Program is funded on a pay-as-you-go basis from redirected contributions from the DB Program. The MPP Program funding actuarial valuation measures the value of DB Program employer contributions that will be available to fund the MPP Program benefits in future periods. This valuation differs from the actuarial valuation for financial reporting for the MPP Program, which focuses on the obligation an employer incurs on behalf of employees through the employment-exchange process.
The MPP Program funding actuarial valuation as of June 30, 2018, found that the MPP Program assets, along with MPP allocated funding from future employer contributions, are sufficient to finance the future MPP Program obligations of $285.8 million for both Part A premiums and Parts A and B surcharges. The valuation considered the most recent actuarial experience study and was based on the assumption that, on average, Medicare Part A and B premiums and surcharges will continue to annually increase at a rate of 3.7% and 4.1%, respectively.

20 FINANCIAL
Management’s Discussion and Analysis (Unaudited)
STRP Contributions and Benefit Payments
The chart below shows that prior to the enactment of the CalSTRS Funding Plan in June 2014, there had been a growing gap between contributions and benefit payments. During fiscal year 2018–19, the gap narrowed by 82.6% primarily due to the supplemental state contributions resulting from SB 90.
Contribution rates will continue to increase according to the funding plan, which has improved the long-term sustainability of the DB Program as it continues making progress toward near full funding by the year 2046. Despite this, investment volatility, longevity and membership levels pose potential risks to full funding. The experience beyond 2046 may differ.
STRP Investment Income, Benefit Payments and Contributions
The following chart is a 10-year comparison of investment income, contributions and benefit payments.
Net Investment Income Benefit Payments Contributions
35
30
25
20
15
10
5
0
$ in
Bill
ions
FY 09–10 FY 10–11 FY 11–12 FY 12–13 FY 13–14 FY 14–15 FY 15–16 FY 16–17 FY 17–18 FY 18–191
Member Contributions Employer Contributions State Contributions Benefit Payments
FY 09–10 FY 10–11 FY 11–12 FY 12–13 FY 13–14 FY 14–15 FY 15–16 FY 16–17 FY 17–18 FY 18–191
16
14
12
10
8
6
4
2
0
$ in
Bill
ions
1 State contributions include approximately $2.2 billion of one-time, supplemental contributions on behalf of employers resulting from SB 90.
1 State contributions include approximately $2.2 billion of one-time, supplemental contributions on behalf of employers resulting from SB 90.

21FINANCIAL
Management’s Discussion and Analysis (Unaudited)
Requests for Information
This financial report is designed to provide a general overview of CalSTRS’ finances. For questions concerning the information in this report or for additional information, contact CalSTRS, P.O. Box 15275, Sacramento, CA 95851–0275.
Respectfully submitted,
Julie Underwood Chief Financial Officer

22 FINANCIAL
Basic Financial Statements
The accompanying notes are an integral part of these statements.
State Teachers’
Retirement Plan
Pension2
403(b) Plan
Pension2
457(b) Plan
Medicare
Premium Payment
Program
Teachers’
Deferred
Compensation
Fund Total
Assets
Investments:
Debt Securities $47,044,526 $473,493 $19,574 $300 $1,605 $47,539,498 Equity Securities 114,667,170 600,151 31,985 – – 115,299,306 Alternative Investments 76,575,615 – – – – 76,575,615 Derivative Instruments 188,225 – – – – 188,225 Securities Lending Collateral 22,795,316 – – – – 22,795,316
Total Investment Assets 261,270,852 1,073,644 51,559 300 1,605 262,397,960
Cash 321,051 – – 1 1 321,053
Receivables:
Investments Sold 4,155,791 – – – – 4,155,791 Interest and Dividends 608,148 – – 7 10 608,165 Member, Employer and State 3,011,460 13,624 569 – – 3,025,653Loans Receivable 2,778,564 4,539 218 – – 2,783,321 Other 40,330 – – 1 159 40,490
Total Receivables 10,594,293 18,163 787 8 169 10,613,420
Other Assets:
Capital Assets, Net of Accumulated Depreciation
317,147 – – – – 317,147
Other 271 – – – – 271
Total Other Assets 317,418 – – – – 317,418
Total Assets 272,503,614 1,091,807 52,346 309 1,775 273,649,851
Deferred Outflows of Resources 68,561 – – 116 409 69,086
Total Assets and Deferred
Outflows of Resources 272,572,175 1,091,807 52,346 425 2,184 273,718,937
Liabilities
Investments:
Derivative Instruments 123,852 – – – – 123,852
Total Investment Liabilities 123,852 – – – – 123,852
Investments Purchased Payable 5,194,433 – – – – 5,194,433 Loans Payable 2,787,387 – – – – 2,787,387 Benefits in Process of Payment 1,513,766 – – – – 1,513,766 Net Pension and OPEB Liabilities 816,327 – – 2,863 5,023 824,213 Securities Lending Obligation 22,786,907 – – – – 22,786,907 Other 369,832 4,144 115 65 854 375,010
Total Liabilities 33,592,504 4,144 115 2,928 5,877 33,605,568
Deferred Inflows of Resources 117,783 – – 481 982 119,246
Total Liabilities and Deferred
Inflows of Resources 33,710,287 4,144 115 3,409 6,859 33,724,814
NET POSITION RESTRICTED FOR
PENSIONS/OPEB $238,861,888 $1,087,663 $52,231 ($2,984) ($4,675) $239,994,123
Statement of Fiduciary Net Position(Dollars in Thousands)
As of June 30, 2019

23FINANCIAL
State Teachers’
Retirement Plan
Pension2
403(b) Plan
Pension2
457(b) Plan
Medicare
Premium Payment
Program
Teachers’
Deferred
Compensation
Fund Total
Additions
Contributions:
Member $3,647,999 $174,230 $9,307 $– $– $3,831,536
Employer 5,644,472 982 110 27,977 – 5,673,541
State of California 5,334,860 – – – – 5,334,860
Total Contributions 14,627,331 175,212 9,417 27,977 – 14,839,937
Investment Income:
Net Appreciation/(Depreciation) in Fair Value of Investments
9,744,897 28,933 1,407 2 5 9,775,244
Interest, Dividends and Other 5,495,693 22,534 1,025 27 34 5,519,313
Securities Lending Income 567,667 – – – – 567,667
Investment Expenses:
Cost of Lending Securities (526,935) – – – – (526,935)
Other Investment Expenses (383,489) – – – – (383,489)
Net Investment Income 14,897,833 51,467 2,432 29 39 14,951,800
Other Income 127,603 273 10 – 1,743 129,629
Total Additions 29,652,767 226,952 11,859 28,006 1,782 29,921,366
Deductions
Retirement, Disability, Death and Survivor Benefits
15,001,620 – – – – 15,001,620
Premiums Paid – – – 27,546 – 27,546
Distributions and Withdrawals – 67,772 1,659 – – 69,431
Purchasing Power Benefits 194,467 – – – – 194,467
Refunds of Member Contributions 99,893 5,754 141 – – 105,788
Administrative Expenses 253,953 2,739 122 1,901 1,622 260,337
Borrowing Costs 105,306 – – – – 105,306
Other Expenses 4,275 – – 1 3 4,279
Total Deductions 15,659,514 76,265 1,922 29,448 1,625 15,768,774
Increase (Decrease) in Net Position 13,993,253 150,687 9,937 (1,442) 157 14,152,592
Net Position Restricted for Pensions/OPEB
Beginning of the Year 224,868,635 936,976 42,294 (1,542) (4,832) 225,841,531
END OF THE YEAR $238,861,888 $1,087,663 $52,231 ($2,984) ($4,675) $239,994,123
Basic Financial Statements
The accompanying notes are an integral part of these statements.
Statement of Changes in Fiduciary Net Position(Dollars in Thousands)
For the Fiscal Year Ended June 30, 2019

24 FINANCIAL
1. Significant Provisions of CalSTRS Plans and Programs
The California State Teachers’ Retirement System (CalSTRS, our or we) administers a hybrid retirement system consisting of a defined benefit plan, two defined contribution plans, a postemployment benefit plan and a fund used to account for ancillary activities associated with various deferred compensation plans and programs:
• State Teachers’ Retirement Plan (STRP)
• CalSTRS Pension2 403(b) Plan
• CalSTRS Pension2 457(b) Plan
• Medicare Premium Payment (MPP) Program
• Teachers’ Deferred Compensation Fund (TDCF)
CalSTRS provides pension benefits, including disability and survivor benefits, to California full-time and part-time public school teachers from pre-kindergarten through community college and certain other employees of the public school system. The Teachers’ Retirement Law (California Education Code Section 22000 et seq.), as enacted and amended by the California Legislature and the Governor, established these plans and CalSTRS as the administrator. The terms of the plans may be amended through legislation.
CalSTRS is a component unit of the State of California (the state). These financial statements include only the accounts of CalSTRS. The state includes CalSTRS’ various plans and funds as fiduciary funds in its financial statements.
The Teachers’ Retirement Board (the board) has exclusive control over the administration of the retirement system plans and the investment of funds, makes rules, sets policies and has the authority to hear and determine all facts pertaining to application for benefits under the retirement system. It is composed of 12 members:
• Five members appointed by the Governor and confirmed by the Senate for a term of four years: one school board representative, one retired CalSTRS member and three public representatives.
• Four ex-officio members who serve for the duration of their term in office: the State Superintendent of Public Instruction, the California State Treasurer, the California State Controller and the California Director of Finance (who is appointed by the Governor and confirmed by the Senate).
• Three member-elected positions representing current educators who serve for a term of four years.
Section 22209 of the California Education Code gives the board authority to appoint a Chief Executive Officer (CEO), while Section 20520 of the California Education Code gives authority to delegate any acts within the board’s power to the CEO. Pursuant to Section 22301 of the California Education Code, the CEO may delegate any act or duty to subordinates unless required by the board to act personally.
Notes to the Basic Financial Statements

25FINANCIAL
State Teachers’ Retirement Plan The STRP is a multiple-employer, cost-sharing defined benefit plan composed of four programs: Defined Benefit (DB) Program, Defined Benefit Supplement (DBS) Program, Cash Balance Benefit (CBB) Program and Replacement Benefits (RB) Program. The STRP holds assets for the exclusive purpose of providing benefits to members and their beneficiaries of these programs. CalSTRS also uses plan assets to defray reasonable expenses of administering the STRP. Although CalSTRS is the administrator of the STRP, the state is the sponsor and obligor of the trust. In addition, the state is both an employer and nonemployer contributing entity to the STRP.
STRP Defined Benefit Program
As of June 30, 2019, there were 1,778 contributing employers (school districts, community college districts, county offices of education, charter schools and regional occupational programs). Membership is mandatory for all employees meeting certain statutory requirements and optional for all other employees performing creditable service activities. The DB Program provides retirement benefits based on members’ final compensation, age and years of service credit. In addition, the program provides benefits to members upon disability and to their survivors or beneficiaries upon the death of eligible members.
As of June 30, 2019, membership consisted of:
Active Members
Vested 316,734
Nonvested 134,609
Inactive Members
Vested 41,247
Nonvested 163,460
Retirees and Beneficiaries 308,522
Total Members, Retirees and Beneficiaries 964,572
Notes to the Basic Financial Statements
The DB Program has two benefit formulas:
• CalSTRS 2% at 60: Members first hired on or before December 31, 2012, to perform service that could be creditable to CalSTRS.
• CalSTRS 2% at 62: Members first hired on or after January 1, 2013, to perform service that could be creditable to CalSTRS.
There are several differences between the two benefit formulas, which are noted below.
CalSTRS 2% at 60
• CalSTRS 2% at 60 members are eligible for normal retirement at age 60, with a minimum of five years of credited service. The normal retirement benefit is equal to a factor of 2.0% of final compensation multiplied by the number of years of credited service. Early retirement options are available at age 55 with five years of credited service or as early as age 50 with 30 years of credited service. The age factor for retirements after age 60 increases with each quarter year of age to a maximum of 2.4% at age 63 or older. Members who have 30 years or more of credited service receive an additional increase of up to 0.2% to the age factor, up to the 2.4% maximum.
• CalSTRS calculates retirement benefits based on one-year final compensation for members with 25 or more years of credited service, or for classroom teachers with fewer than 25 years of credited service if the employer entered into, extended, renewed or amended an agreement prior to January 1, 2014, to elect to pay the additional benefit cost for all of its classroom teachers. One-year final compensation is a member’s highest average annual compensation earnable for 12 consecutive months based on the creditable compensation that the member could earn in a school year while employed on a full-time basis. For most members with fewer than 25 years of credited service, final compensation is the highest average annual compensation earnable for any

26 FINANCIAL
Notes to the Basic Financial Statements
36 consecutive months based on the creditable compensation that the member could earn in a school year while employed on a full-time basis.
• For fiscal year 2018–19, the limit on compensation that can be counted toward a member’s benefit is $275,000, if hired on or after July 1, 1996, pursuant to Internal Revenue Code (IRC) section 401(a)(17). No contributions are paid by the member, employer or the state on compensation in excess of the limit, and any compensation beyond the limit is excluded from determining final compensation.
• Final compensation is based on salary and certain other types of remuneration. Other types of compensation, such as allowances, cash in lieu of fringe benefits and compensation for unused accumulated leave are not creditable compensation and do not count toward any CalSTRS benefit program. Limited-period compensation and compensation determined to have been paid to enhance a benefit are creditable to the DBS Program.
• Members who accumulated at least 30 years of credited service by December 31, 2010, receive a longevity bonus of $200, $300 or $400 per month for 30, 31 or 32 or more years of credited service, respectively.
CalSTRS 2% at 62
• CalSTRS 2% at 62 members are eligible for normal retirement at age 62, with a minimum of five years of credited service. The normal retirement benefit is equal to 2.0% of final compensation multiplied by the number of years of credited service. An early retirement option is available at age 55. The age factor for retirement after age 62 increases with each quarter year of age to 2.4% at age 65 or older.
• All CalSTRS 2% at 62 members have their final compensation based on their highest average annual compensation earnable for 36 consecutive months based on the creditable compensation that the member could earn in a school year while employed on a full-time basis.
• The limit on creditable compensation that can be counted toward a member’s benefit is adjusted each fiscal year based on changes in the Consumer Price Index. In fiscal year 2018–19, the limit was $146,230.
• Compensation paid in cash by an employer, pursuant to a publicly available written contractual agreement, for each pay period in which creditable service is performed is creditable to CalSTRS benefit programs for CalSTRS 2% at 62 members. Other compensation, such as allowances, cash in lieu of fringe benefits, limited-period compensation and compensation determined to have been paid to enhance a benefit, is not creditable to any CalSTRS benefit program.
The following provisions apply to both CalSTRS 2% at 60 and 2% at 62 members:
• After earning five years of credited service, members become vested to receive service retirement benefits.
• After five years of credited service, a member (younger than age 60 if under disability Coverage A or no age limit if under disability Coverage B) is eligible for disability benefits of 50% of final compensation plus 10% of final compensation for each eligible child, up to a maximum addition of 40%. The member must have a disability that can be expected to last continuously for at least 12 months to qualify for a benefit.
• Contributions on compensation for service in excess of one year due to overtime or working additional assignments are credited to the DBS Program at the lowest annual pay rates up to the creditable compensation limit.
• A family benefit is available if an active member dies and has at least one year of credited service.

27FINANCIAL
• Members’ accumulated contributions are refundable with interest upon separation from CalSTRS. The board determines the credited interest rate for each fiscal year. For the fiscal year ended June 30, 2019, the rate of interest credited to members’ accounts was 1.54%.
• There is a postretirement annual benefit increase of 2% per year on a simple (rather than compound) basis. This benefit is vested for members who retired in 2014 or pay the higher contribution rates resulting from the CalSTRS Funding Plan, which was passed into law in June 2014 with the enactment of AB 1469.
• The member’s benefit is reduced dollar for dollar, regardless of age, for the first 180 calendar days after retirement if the member performs activities in the public schools that could be creditable to CalSTRS, unless the governing body of the school district takes specified actions with respect to a member who is above normal retirement age.
• There is an annual limitation on earnings from activities that could be creditable to CalSTRS for retired members. The member’s benefit is reduced dollar for dollar by the amount of any earnings in excess of $45,022 in 2018–19.
• Any enhancements to the CalSTRS DB Program made on or after January 1, 2013, apply only to service performed on or after the effective date of the enhancement.
• A CalSTRS member who is convicted of committing a felony in the course of his or her official duties, including specifically a felony involving a child with whom the member had contact as part of the member’s official duties, forfeits a right to any benefits accrued commencing with the commission of the felony.
Notes to the Basic Financial Statements
Purchasing Power Protection
Purchasing power protection is provided to members of the DB Program through annual distributions (in quarterly payments) to retired and disabled members and their beneficiaries to restore purchasing power up to 85% of the initial monthly benefit. Funding for purchasing power protection is from School Lands revenue generated from the use of school lands (land granted to California by the Federal government to support schools) and in lieu lands (properties purchased with the proceeds from the sale of school lands) and from the Supplemental Benefit Maintenance Account (SBMA). Payments are made only to the extent funds are available in the SBMA and are not a vested benefit.
Public Resources Code section 6217.5 allocates School Lands revenue to the system for purchasing power protection. In addition, a continuous appropriation from the state’s General Fund is made to the SBMA in an amount equal to 2.5% of the total creditable compensation of the fiscal year ending in the immediately preceding calendar year, reduced by $72.0 million, pursuant to Education Code section 22954. For the fiscal year ended June 30, 2019, School Lands revenue and the amount contributed to the SBMA were $6.5 million and $730.4 million, respectively.
Benefit Enhancements
A school employer may provide, at the employer’s cost, an additional two years of service credit to increase the amount of the member’s monthly retirement benefit. This may be paid for by the employer in installments not to exceed eight years. If the employer chooses to pay in installments, the employer is charged interest on the unpaid balance at the actuarially assumed rate of return on investments for the DB Program (currently 7.00%). As of June 30, 2019, the outstanding balance of receivables for benefit enhancements was $11.5 million.

28 FINANCIAL
Notes to the Basic Financial Statements
Contributions
The parameters for member, employer and state contribution rates are set by the California Legislature and the Governor and detailed in the Teachers’ Retirement Law. Current contribution rates were established by the CalSTRS Funding Plan.
In June 2019, California Senate Bill 90 (SB 90) was signed into law and appropriated approximately $2.2 billion in fiscal year 2018–19 from the state’s General Fund as contributions to CalSTRS on behalf of employers. The bill requires portions of the contribution to supplant the amounts remitted by employers such that the amounts remitted will be 1.03 and 0.70 percentage points less than the statutorily required amounts due for fiscal years 2019–20 and 2020–21, respectively. The remaining portion of the contribution is allocated to reduce the employers’ share of the unfunded actuarial obligation of the DB Program.
The employer contribution rates set in statute by the CalSTRS Funding Plan were not changed by the passage of SB 90. A summary of statutory contribution rates and other sources of contributions to the DB Program pursuant to the CalSTRS Funding Plan are discussed below.
Members
Member contribution rates effective for fiscal year 2018–19 and fiscal year 2019–20 are summarized in the table below:
Effective Date 2% at 60 Members1 2% at 62 Members
July 1, 2018 10.250% 10.205%
July 1, 2019 10.250% 10.205%2
1 The contribution rate for 2% at 60 members is set in statute at 10.250%.2 According to current law, the contribution rate for CalSTRS 2% at 62 members is adjusted if the normal cost increases or decreases by more than 1% since the last time the member
contribution rate was set. Based on the June 30, 2018, valuation adopted by the board in May 2019, the increase in normal cost was less than 1%. Therefore, contribution rates for CalSTRS 2% at 62 members will not change effective July 1, 2019.
Employers
CalSTRS employer contribution rate increases effective for fiscal year 2018–19 through fiscal year 2045–46 are summarized in the table below:
Effective Date Pre-AB 1469 Rate Increase Total
July 1, 2018 8.250% 8.030% 16.280%
July 1, 2019 8.250% 9.880% 18.130%1
July 1, 2020 8.250% 10.850% 19.100%2
July 1, 2021–June 30, 2046 8.250% 3 3
July 1, 2046 8.250% Increase from prior rate ends in 2046–47
1 This rate does not reflect the reduction of employer contributions to be paid by the employer for fiscal year 2019–20 by 1.03 percentage points pursuant to SB 90.2 This rate does not reflect the reduction of employer contributions to be paid by the employer for fiscal year 2020–21 by 0.70 percentage points pursuant to SB 90.3 The CalSTRS Funding Plan authorizes the board to adjust the employer contribution rate up or down 1% each year, but no higher than 20.25% total and no lower than 8.25%.

29FINANCIAL
Notes to the Basic Financial Statements
State
As a result of the CalSTRS Funding Plan, the additional state appropriation required to fully fund the benefits in effect as of 1990 by 2046 is specified in subdivision (b) of Education Code section 22955.1. The increased contributions end as of fiscal year 2045–46. The CalSTRS state contribution rates effective for fiscal year 2018–19 and beyond are summarized in the table below.
The state’s base contribution to the DB Program is calculated based on creditable compensation from two fiscal years prior. The state rate will increase to 5.811% on July 1, 2019, to continue paying down the unfunded liabilities associated with the benefits structure that was in place in 1990 prior to certain enhancements in benefits and reductions in contributions. Additionally, the enactment of SB 90 will result in future supplemental contributions to be made by the state to pay down its portion of the unfunded actuarial obligation of the DB Program in fiscal years 2019–20 through 2022–23.
Effective Date Base RateAB 1469 Increase For 1990
Benefit Structure SBMA Funding1 Total
July 1, 2018 2.017% 5.311% 2.500% 9.828%
July 1, 2019 2.017% 5.811%2 2.500% 10.328%3
July 1, 2020–June 30, 2046 2.017% 4 2.500% 4
July 1, 2046 and thereafter 2.017% 5 2.500% 4.517%5
1 This rate does not include the $72 million reduction in accordance with Education Code section 22954. Refer to Note 1, Purchasing Power Protection section, for further discussion.2 In May 2019, the board exercised its limited authority to increase the state contribution rate by 0.5% of the creditable compensation effective July 1, 2019.3 This rate does not include the $2.2 billion supplemental state contribution on behalf of employers pursuant to SB 90. 4 The board has limited authority to adjust state contribution rates annually through June 2046 in order to eliminate the remaining unfunded actuarial obligation associated with the 1990
benefit structure. The board cannot increase the rate by more than 0.50% in a fiscal year, and if there is no unfunded actuarial obligation, the contribution rate imposed to pay for the 1990 benefit structure would be reduced to 0%.
5 From July 1, 2046, and thereafter, the rates in effect prior to July 1, 2014, are reinstated, if necessary, to address any remaining 1990 unfunded actuarial obligation.

30 FINANCIAL
STRP Defined Benefit Supplement Program
The DBS Program, established pursuant to Chapter 74, Statutes of 2000 (AB 1509), is a cash balance defined benefit pension program that operates within the STRP. All members of the DB Program who make contributions to CalSTRS on creditable compensation earned on or after January 1, 2001, have an account under the DBS Program and are eligible to receive a DBS benefit based on the amount of funds contributed to the DBS account. Membership in the DBS Program is mandatory.
Interest is credited to the nominal DBS Program accounts at the minimum guaranteed annual rate established by the board prior to each plan year, which was 2.89% for the fiscal year ended June 30, 2019. The board may credit additional earnings to members’ nominal accounts if actual investment earnings exceed the minimum guaranteed annual rate and meet criteria set out in the board policy. In May 2019, the board elected to award Additional Earnings Credits (AEC) of 4.36% of DBS members’ June 30, 2018, nominal account balances. The total value of the AEC awarded was approximately $393.8 million.
Contributions
For creditable service performed by DB members in excess of one year of service credit within one fiscal year, member contributions of either 8% (CalSTRS 2% at 60 members) or 9% (CalSTRS 2% at 62 members) and employer contributions of 8% are credited to the members’ nominal DBS Program account (up to any applicable compensation cap). For CalSTRS 2% at 60 members only, member contributions of 8% and employer contributions of 8% for compensation as a result of retirement incentives or limited term enhancements are also credited to DBS Program accounts.
STRP Cash Balance Benefit Program
The CBB Program, established under Chapter 592, Statutes of 1995 (AB 1298), and subsequently merged into the STRP by Chapter 1048, Statutes of 1998 (SB 2085), is a cash balance defined benefit
pension program. The CBB Program is designed for employees of California’s public schools who are hired to perform creditable service for less than 50% of the full-time equivalent for a position in a school district or county office of education or on a part-time or temporary basis for not more than 67% of a full-time position in a community college district. Participation in the CBB Program is optional; a school district, community college district, county office of education, charter school or regional occupational program may elect to offer the CBB Program. Under such election, the program will automatically cover each eligible employee, unless the employee elects to participate in the DB Program or an alternative plan provided by the employer within 60 days of hire or the election period determined by the employer. As of June 30, 2019, there were 29 contributing school districts and 40,652 contributing participants.
Interest is credited to nominal CBB Program accounts at the minimum guaranteed annual rate established by the board prior to each plan year, which was 2.89% for the fiscal year ended June 30, 2019. The board may credit additional earnings to members’ nominal accounts if actual investment earnings exceed the minimum guaranteed annual rate and meet criteria pursuant to the board policy. In May 2019, the board elected to award an AEC of 3.86% of CBB members’ June 30, 2018, nominal account balances. The total value of the AEC awarded was approximately $10.0 million.
Contributions
A summary of statutory contribution rates for the CBB Program is as follows:
Participants – 4.0% of applicable participant salaries
Employers – 4.0% of applicable participant salaries
Employers may enter into a collective bargaining agreement to pay different rates if certain minimum conditions are met.
Notes to the Basic Financial Statements
31FINANCIAL
Notes to the Basic Financial Statements
The 403(b) plan and the 457(b) plan had 17,205 and 1,026 plan participants and 987 and 92 participating employers, respectively, with account balances as of June 30, 2019. Pension2 is available to all full-time California pre-kindergarten through community college district and county office of education employees. Part-time employees’ eligibility is determined by their employers. Enrollment in the 457(b) plan is by employer adoption only. Employee contributions to the plans are voluntary and require no minimum limitations; however, the IRC imposes an annual maximum amount that can be contributed to the plans. Pension2 is not directly affected by the California Public Employees’ Pension Reform Act of 2013 (PEPRA). However, according to PEPRA, employers may provide a contribution to a defined contribution plan, such as Pension2, for 2% at 62 member compensation in excess of the compensation limit.
The Pension2 investments are composed of a selection of mutual funds with underlying investments that include stocks, bonds, real estate investments and guaranteed annuity contracts, which are participant directed. The Pension2 benefits are the accumulation of contributions and investment earnings credited to the members’ accounts.
Medicare Premium Payment ProgramThe MPP Program is a cost-sharing multiple-employer other postemployment benefit (OPEB) plan established pursuant to Chapter 1032, Statutes of 2000 (SB 1435). CalSTRS administers the MPP Program through the Teachers’ Health Benefit Fund. The MPP Program pays Medicare Part A premiums and Medicare Parts A and B late enrollment surcharges for eligible members of the DB Program who were retired or began receiving a disability allowance prior to July 1, 2012, and were not eligible for premium-free Medicare Part A. Members who retire on or after July 1, 2012, are not eligible for coverage under the MPP Program.
Notes to the Basic Financial Statements
STRP Replacement Benefits Program
The STRP RB Program is an excess benefits arrangement for DB Program members that is administered as a qualified excess benefit arrangement through a separate pension program apart from the other three STRP programs. It is established in accordance with IRC section 415(m). IRC section 415(b) imposes a dollar limit on the annual retirement benefits an individual may receive from a qualified defined benefit pension plan. The limit for individual CalSTRS 2% at 60 members varies based on the age at which they retire. For calendar year 2019, the federal dollar limit applicable to a CalSTRS member retiring at exactly age 65 and receiving only a single life benefit from the DB Program is $191,290. The federal dollar limit for other ages at retirement and other benefit types will differ.
Contributions that would otherwise be credited to the DB Program each month are instead credited to the RB Program to fund monthly program costs. Monthly employer contributions are received and paid to members in amounts equivalent to the benefits not paid as a result of IRC section 415(b), subject to withholding for any applicable income or employment taxes. As of June 30, 2019, there were 349 retirees, beneficiaries and non-member spouses receiving benefits from the RB Program.
CalSTRS Pension2 ProgramPursuant to Chapter 291, Statutes of 1994 (AB 3064), the CalSTRS Pension2 Program (Pension2) was established to include two tax-deferred defined contribution plans pursuant to IRC sections 403(b) and 457(b). Voya Institutional Plan Services (Voya) and the Teachers Insurance and Annuity Association (TIAA) are responsible for administrative services, including custody and record-keeping, while CalSTRS determines the investment options that are offered to plan participants.

32 FINANCIAL
Notes to the Basic Financial Statements
Use of Estimates in the Preparation of Financial Statements CalSTRS’ financial statements are prepared in conformity with accounting principles generally accepted in the U.S. as promulgated by the Governmental Accounting Standards Board (GASB). Management makes estimates and assumptions that affect certain amounts and disclosures in the accompanying financial statements, the most significant of which include estimates related to contribution revenues, total pension liability, total OPEB liability and the fair value of certain alternative investments. Refer to Notes 3, 4 and 6, respectively, for further discussion of these estimates. Actual results could differ from those estimates.
CashCash held by CalSTRS includes foreign currency, deposits with the California State Treasury and master custodian and cash held at commercial banks for operational purposes. CalSTRS maintains a targeted balance within the Surplus Money Investment Fund (SMIF) held at the California State Treasury to meet daily obligations. Cash balances in excess of needs are swept nightly into SMIF and invested in short-term assets by the State Treasurer’s Office (STO). In addition to the SMIF account, CalSTRS also operates checking accounts and zero balance accounts with various banking institutions authorized to provide services to state agencies. While zero balance accounts do not require collateralization, other non-zero balance accounts have a collateralization requirement set forth by the California Government Code 16521 and are monitored by the STO.
InvestmentsUnder the California Constitution, article 16, section 17, the board has the sole and exclusive fiduciary responsibility over the assets of the retirement system and to administer the system in a manner that will assure prompt delivery of benefits and related services to the members and
As of June 30, 2019, 5,744 retirees participated in the MPP Program. The number of retired members who will participate in the program in the future is unknown as eligibility cannot be predetermined.
The MPP Program is funded on a pay-as-you-go basis from a portion of monthly employer contributions. In accordance with California Education Code section 25930, contributions that would otherwise be credited to the DB Program each month are instead credited to the MPP Program to fund monthly program and administrative costs. Total redirections to the MPP Program are monitored to ensure that total incurred costs do not exceed the amount initially identified as the cost of the program.
Teachers’ Deferred Compensation FundThe TDCF was established pursuant to Chapter 655, Statutes of 2006 (SB 1466), and is used to account for ancillary activities associated with various deferred compensation plans and programs offered by CalSTRS to enhance the tax-deferred financial options for the members and their beneficiaries.
The TDCF is funded by the fee revenues received by CalSTRS from deferred compensation plans, a vendor registration program and an employer compliance assistance program.
2. Summary of Significant Accounting Policies
Basis of AccountingCalSTRS maintains our accounting records using the accrual basis of accounting. We recognize member, employer and state contributions in the period in which the contributions are required by statute. Also, CalSTRS recognizes benefits when due and payable in accordance with our retirement and benefits programs. Purchases and sales of investments are recorded on the trade date. Interest income is recorded on an accrual basis. Dividends are recorded on the ex-dividend date.

33FINANCIAL
Notes to the Basic Financial Statements
their beneficiaries. As an administrator of public pension funds, CalSTRS is not subject to the Employee Retirement Income Security Act (ERISA), which governs corporate pension plans. However, the CalSTRS investment decision-making criteria are based on the “prudent investor” standard, for which the ERISA standards serve as a basis.
Additionally, the California Constitution, article 16, section 17, and the California Education Code, part 13, chapter 4, section 22250 require the diversification of investments so as to minimize the risk of loss and maximize the rate of return, unless, under the circumstances, it is clearly not prudent to do so. The CalSTRS Investment Policy and Management Plan is established, and may be amended, by a majority vote of the board. It allows for investments consisting of debt and equity securities, alternative investments and derivative instruments. See Note 5 for disclosures on deposits and investments.
In the Statement of Changes in Fiduciary Net Position, CalSTRS presents the net appreciation (depreciation) in the fair value of its investments, which consists of the realized gains and losses on securities sold and the unrealized appreciation (depreciation) on those investments still held in the portfolio.
The value and performance of CalSTRS’ investments are subject to various risks, including credit risk, interest rate risk, concentration of credit risk, custodial credit risk and foreign currency risk, which are in turn affected by economic and market factors impacting certain industries, sectors or geographies. See Note 5 for disclosures related to these risks.
Most investments are reported at fair value. The diversity of the investment types held by CalSTRS requires a wide range of valuation techniques to determine fair value. See Note 6 for disclosures related to fair value.
Investment Risk Management
CalSTRS enters into currency forwards and option contracts to protect the value of non-U.S. investments against foreign currency fluctuation. CalSTRS could be exposed to risk if the counterparties to the forward and option contracts are unable to meet the terms of their contracts. CalSTRS also enters into futures contracts, swaps and options to hedge risks in the equity and fixed income markets. CalSTRS seeks to minimize risk from counterparties by establishing minimum credit quality standards and through the use of master trading agreements, which require a daily exchange of collateral that is marked to market as required to help offset counterparty risk. See Note 5 for disclosures related to these risks.
Capital AssetsCapital assets held by CalSTRS, which consist of land, building, equipment and intangible assets, are recorded at cost and reflected on the Statement of Fiduciary Net Position, net of accumulated depreciation/amortization. The capitalization threshold is $1.0 million. Depreciation/amortization is charged to operations using the straight-line method on the estimated useful life of the related asset and is included in administrative expenses on the Statement of Changes in Fiduciary Net Position. Estimated useful lives range from a minimum of five years for equipment and amortizable intangible assets to 40 years for buildings. As of June 30, 2019, accumulated depreciation/amortization was $90.0 million, and depreciation/amortization expense was $5.3 million for the fiscal year ended June 30, 2019.
CalSTRS reviews our capital assets for impairment whenever events or changes in circumstances indicate that the carrying value of an asset may not be recoverable. As of June 30, 2019, there has been no impairment of capital assets.

34 FINANCIAL
Notes to the Basic Financial Statements
Administrative ExpensesThe cost of administering the CalSTRS system is financed through contributions and investment earnings. The Schedule of Administrative Expenses in the Other Supplementary Information section of this report provides a listing of administrative expenses by type.
Income TaxesThe STRP and MPP Program are organized as tax-exempt retirement plans under the IRC. Pension2, which includes IRC 403(b) and 457(b) plans, is organized as a tax-deferred supplemental program under the IRC. The TDCF is also organized as a tax-deferred supplemental program under the IRC. CalSTRS management believes that it has operated these funds and programs within the constraints imposed by federal tax law.
Investment ExpensesExpenses directly associated with investment management, operations and servicing, as well as foreign taxes, have been included as Other Investment Expenses in the Statement of Changes in Fiduciary Net Position. The Schedule of Investment Expenses in the Other Supplementary Information section of this report provides a listing of investment expenses by type. Broker commissions for securities trades and private asset fees are capitalized, with the exception of certain equity and derivative securities for which they are expensed.
Securities Lending TransactionsCalSTRS reports securities lent, reinvested cash collateral and the related liabilities resulting from securities lending transactions on the Statement of Fiduciary Net Position. CalSTRS also reports the income earned and costs of lending securities as investment income and expenses on the Statement of Changes in Fiduciary Net Position.
ReservesCalSTRS maintains accounts within the net position restricted for pensions and OPEB as reserve accounts for various operating purposes. These include four reserve accounts for the DBS Program, four reserve accounts for the CBB Program, one reserve account for the SBMA and other reserves not legally required for disclosure.
Defined Benefit Supplement Contribution,
Accumulated Interest and Annuitant Reserves
Section 25002 of the Education Code formed the DBS Annuitant Reserve to establish and maintain a segregated account for expenditures on annuities payable under the DBS Program. The DBS Program is a cash balance defined benefit pension program that provides a supplemental benefit in addition to the regular DB Program benefit. During a member’s career, credits and interest accumulate in the DBS Program’s Contribution and Accumulated Interest reserves, respectively. When a member retires, the reserve funds are either paid out as a lump sum or transferred to the DBS Annuitant Reserve if the participant elects to receive their benefit as an annuity.
Defined Benefit Supplement Gain and Loss Reserve
Section 25001 of the Education Code establishes the DBS Gain and Loss Reserve, which represents a segregated account that may be used to: 1) credit interest to member DBS accounts at the minimum interest rate for plan years in which the obligation cannot be met from the plan’s investment earnings, 2) make additional earnings credits to DBS accounts upon a decision by the board to allocate excess investment earnings, or 3) provide additions to the DBS Annuitant Reserve for annuities payable under the DBS Program.

35FINANCIAL
Cash Balance Benefit Active Contribution,
Accumulated Interest and Annuitant Reserves
Section 26204 of the Education Code establishes the CBB Annuitant Reserve for the payment of monthly annuities with respect to the CBB Program. The CBB Program is an optional cash balance pension plan for part-time certificated educators available to CalSTRS employers as an alternative to the DB Program, Social Security and other retirement plans. During a participant’s career, credits and interest accumulate in the Cash Balance Benefit Active Contribution and Accumulated Interest reserves. When a participant retires, the reserve funds are either paid out as a lump sum or transferred to the Cash Balance Benefit Annuitant Reserve if the participant elects to receive their benefit as an annuity.
Cash Balance Benefit Gain and Loss Reserve
Section 26202 of the Education Code establishes the CBB Gain and Loss Reserve, which may be used to: 1) credit interest to participants’ accounts at the minimum interest rate during years in which CalSTRS’ investment earnings with respect to the CBB Program are not sufficient for that purpose, 2) make additional earnings credits to participants’
accounts upon a decision by the board to allocate excess investment earnings, or 3) provide additions to the CBB Annuitant Reserve for monthly annuity payments.
Supplemental Benefit Maintenance Account
Reserve
Section 22400 of the Education Code establishes the SBMA to separately maintain and manage the annual supplemental payments disbursed in quarterly installments to all benefit recipients whose purchasing power has fallen below 85% of the purchasing power of the initial benefit, as long as funds are available. The SBMA is primarily funded by contributions from the state, School Lands monies and the interest earned on the SBMA reserve balance credited at the actuarially assumed interest rate.
Other Reserves Not Legally Required For
Disclosure
These reserves represent accumulated changes in operations reflecting contributions earned, benefit payments made, investment returns and the costs of plan administration for the STRP, Pension2, MPP Program and TDCF.
Reserve TypeReserve Balance (Dollars in Thousands)
Defined Benefit Supplement Contribution Reserve $7,013,717
Defined Benefit Supplement Accumulated Interest Reserve 2,577,923
Defined Benefit Supplement Annuitant Reserve 681,094
Defined Benefit Supplement Gain and (Loss) Reserve 3,572,564
Cash Balance Benefit Active Contribution Reserve 221,329
Cash Balance Benefit Accumulated Interest Reserve 67,297
Cash Balance Benefit Annuitant Reserve 7,021
Cash Balance Benefit Gain and (Loss) Reserve 60,294
Supplemental Benefit Maintenance Account Reserve 17,382,807
Other Reserves Not Legally Required for Disclosure 208,410,077
TOTAL $239,994,123
The reserve balances as of June 30, 2019, are summarized in the table below:
Notes to the Basic Financial Statements

36 FINANCIAL
3. Net Pension Liability of Employers and Nonemployer Contributing Entity
The components of the net pension liability (NPL) of the STRP for participating employers and the state (nonemployer contributing entity) as of June 30, 2019, are as follows:
June 30, 2019
(Dollars in Millions)
Total Pension Liability $329,178
Less: STRP Fiduciary Net Position 238,862
NPL of Employers and the State of California 90,316
STRP Fiduciary Net Position as a %
of the Total Pension Liability 72.6%
Actuarial Methods and Assumptions The total pension liability for the STRP was determined by applying update procedures to the financial reporting actuarial valuation as of June 30, 2018, and rolling forward the total pension liability to June 30, 2019. In determining the total pension liability, the financial reporting actuarial valuation used the following actuarial methods and assumptions:
June 30, 2019
Valuation Date June 30, 2018
Experience Study July 1, 2010 through June 30, 2015
Actuarial Cost Method Entry age normal
Investment Rate of Return1 7.10%
Consumer Price Inflation 2.75%
Wage Growth 3.50%
Postretirement Benefit Increases
2% simple for DB (annually) Maintain 85% purchasing power level for DB Not applicable for DBS/CBB
1 Net of investment expenses but gross of administrative expenses.
CalSTRS uses a generational mortality assumption, which involves the use of a base mortality table and projection scales to reflect expected annual reductions in mortality rates at each age, resulting
in increases in life expectancies each year into the future. The base mortality tables are CalSTRS custom tables derived to best fit the patterns of mortality among our members. The projection scale was set equal to 110% of the ultimate improvement factor from the Mortality Improvement Scale (MP–2016) table issued by the Society of Actuaries.
The long-term investment rate of return on pension plan investments was determined using a building-block method in which best-estimate ranges of expected future real rates of return (expected returns, net of pension plan investment expense and inflation) are developed for each major asset class. The best-estimate ranges were developed using capital market assumptions from CalSTRS’ general investment consultant (Pension Consulting Alliance) as inputs to the process.
The actuarial investment rate of return assumption was adopted by the board in February 2017 in conjunction with the most recent experience study. For each future valuation, CalSTRS’ independent consulting actuary (Milliman) reviews the return assumption for reasonableness based on the most current capital market assumptions. Best estimates of expected 20-year geometrically linked real rates of return and the assumed asset allocation for each major asset class as of June 30, 2019, are summarized in the following table:
Asset Class
Assumed Asset
Allocation
Long-Term
Expected Real
Rate of Return1
Global Equity 47.0% 4.8%
Fixed Income 12.0% 1.3%
Real Estate 13.0% 3.6%
Private Equity 13.0% 6.3%
Risk Mitigating Strategies
9.0% 1.8%
Inflation Sensitive 4.0% 3.3%
Cash/Liquidity 2.0% (0.4%)
1 20-year average.
Notes to the Basic Financial Statements

37FINANCIAL
Discount RateThe discount rate used to measure the total pension liability was 7.10%. The projection of cash flows used to determine the discount rate assumed that contributions from plan members and employers are made at statutory contribution rates in accordance with the rate increases as disclosed in Note 1. Projected inflows from investment earnings were calculated using the long-term assumed investment rate of return (7.10%) and assuming that contributions, benefit payments and administrative expenses occur midyear. Based on those assumptions, the STRP’s fiduciary net position was projected to be available to make all projected future benefit payments to current plan members. Therefore, the long-term assumed investment rate of return was applied to all periods of projected benefit payments to determine the total pension liability.
Sensitivity of the NPL to Changes in the
Discount Rate
Presented below is the NPL of employers and the state using the current discount rate of 7.10%, as well as what the NPL would be if it were calculated using a discount rate that is 1% to 3% lower or 1% to 3% higher than the current rate:
Discount Rate
NPL of Employers and
Nonemployer Contributing Entity (Dollars in Millions)
3% Decrease (4.10%) $254,006
2% Decrease (5.10%) 188,236
1% Decrease (6.10%) 134,488
Current Discount Rate (7.10%) 90,316
1% Increase (8.10%) 53,689
2% Increase (9.10%) 23,061
3% Increase (10.10%) (2,665)1
1 Net Pension Asset.
Notes to the Basic Financial Statements
4. Net Other Postemployment Benefit (OPEB) Liability of Employers
The components of the net OPEB liability of the MPP Program for participating employers as of June 30, 2019, are as follows:
June 30, 2019
(Dollars in Thousands)
Total OPEB Liability $369,413
Less: MPP Program Fiduciary Net Position (2,984)
Net OPEB Liability of Employers 372,397
MPP Program Fiduciary Net Position as a %
of the Total OPEB Liability(0.81%)
Actuarial Methods and Assumptions
The total OPEB liability for the MPP Program as of June 30, 2019, was determined by applying update procedures to the financial reporting actuarial valuation as of June 30, 2018, and rolling forward the total OPEB liability to June 30, 2019, using the assumptions listed below.
June 30, 2019
Valuation Date June 30, 2018
Experience StudyJuly 1, 2010 through June 30, 2015
Actuarial Cost Method Entry age normal
Investment Rate of Return 3.50%
Medicare Part A Premium Costs Trend Rate1 3.7%
Medicare Part B Premium Costs Trend Rate1 4.1%
1 The assumed increases in the Medicare Part A and Part B Cost Trend Rates vary by year; however, the increases are approximately equivalent to a 3.7% and 4.1% increase each year for Medicare Part A and Part B, respectively.
In addition, assumptions were made about future participation (enrollment) into the MPP Program as CalSTRS is unable to determine which members not currently participating meet all eligibility criteria for enrollment in the future. Assumed enrollment rates were derived based on past experience and are stratified by age with the probability of enrollment diminishing as the members’ ages increase. This estimated enrollment rate was then applied to the population of members who may meet criteria

38 FINANCIAL
Notes to the Basic Financial Statements
necessary for eligibility and are not currently enrolled in the MPP Program. Based on this, the estimated number of future enrollments used in the financial reporting valuation was 380 or an average of 0.23% of the potentially eligible population of 165,422.
CalSTRS uses a generational mortality assumption, which involves the use of a base mortality table and projection scales to reflect expected annual reductions in mortality rates at each age, resulting in increases in life expectancies each year into the future. The base mortality tables are CalSTRS custom tables derived to best fit the patterns of mortality among our members. The projection scale was set equal to 110% of the ultimate improvement factor from the Mortality Improvement Scale (MP–2016) table issued by the Society of Actuaries.
Discount RateThe MPP Program is funded on a pay-as-you-go basis with contributions generally being made at the same time and in the same amount as benefit payments and expenses coming due. Any funds within the MPP Program as of June 30, 2019, were to manage differences between estimated and actual amounts to be paid and were invested in the Surplus Money Investment Fund, which is a pooled investment program administered by the California State Treasurer.
The discount rate used to measure the total OPEB liability was 3.50%. The MPP Program is funded on a pay-as-you-go basis as previously noted, and under the pay-as-you-go method, the OPEB plan’s fiduciary net position was not projected to be sufficient to make projected future benefit payments. Therefore, a discount rate of 3.50%, which is the Bond Buyer’s 20-Bond GO Index from Bondbuyer.com as of June 30, 2019, was applied to all periods of projected benefit payments to measure the total OPEB liability. The discount rate decreased 0.37% from 3.87% as of June 30, 2018.
Presented below is the net OPEB liability of employers using the current discount rate as well as what the net OPEB liability would be if it were calculated using a discount rate that is 1% lower or 1% higher than the current rate:
Discount Rate
Net OPEB Liability of Employers
(Dollars in Thousands)
1% Decrease (2.50%) $406,370
Current Discount Rate (3.50%) 372,397
1% Increase (4.50%) 341,160
Medicare Costs Trend Rate
The June 30, 2018, valuation uses the 2019 Medicare Part A and Part B premiums as the basis for future premium calculations. Future premiums are assumed to increase with a medical trend rate that varies by year, as shown in the following table:
Trend Assumption
Assumed Annual Increase
Years1 Part A Part B
2017–2026 3.4% 4.0%
2027–2036 4.6% 5.2%
2037–2046 4.1% 4.7%
2047 & Later 3.9% 4.5%
1 Trend rates indicate medical inflation in the specific year and, therefore, affect the premiums for the following years. For example, the projected 2020 premium is the 2019 premium increased by the assumed 2019 trend rate.
The Part A trend is approximately equivalent to assuming a fixed 3.7% increase each year. The Part B trend is approximately equivalent to assuming a fixed 4.1% increase each year.

39FINANCIAL
Presented below is the net OPEB liability of employers using the current Medicare costs trend rates, as well as what the net OPEB liability would be if it were calculated using Medicare costs trend rates that are 1% lower and 1% higher than the current rate:
Medicare Costs
Trend Rate
Net OPEB Liability of Employers
(Dollars in Thousands)
1% Decrease (2.7% Part A and 3.1% Part B)
$339,339
Current Rates (3.7% Part A and 4.1% Part B)
372,397
1% Increase (4.7% Part A and 5.1% Part B)
410,282
Actuarial valuations of an ongoing plan involve estimates of the value of reported amounts (for example, Medicare premiums) and assumptions about the probability of occurrence of events far into the future (for example, mortality, disabilities and retirees eligible for the program). Actuarially determined amounts are subject to continual review and potential modifications, as actual results are compared with past expectations and new estimates are made about the future.
Projections of benefits for financial reporting purposes are based on the substantive plan and include the types of benefits provided at the time of each valuation and the historical pattern of benefit costs. The projection of benefits for financial reporting purposes does not explicitly incorporate the potential effects of legal or contractual funding limitations.
Actuarial calculations reflect a long-term perspective and take into account the premiums and surcharges paid after termination of employment until the death of the employee. In many cases, actuarial calculations reflect several decades of payments after termination of employment.
5. Deposits and Investments
Money-Weighted Rate of ReturnFor the fiscal year ended June 30, 2019, the money-weighted rate of return on STRP investments, net of pension plan investment expenses, was 6.6%. While the MPP Program is funded on a pay-as-you-go basis, any excess funds are held in the Surplus Money Investment Fund. The money-weighted rate of return on MPP Program investments, net of OPEB plan investment expenses, was 2.2%. The money-weighted rate of return expresses investment performance, taking into account the impact of cash infusion into and disbursements from the pension or OPEB plan.
Schedule of Investments CalSTRS is authorized to invest and reinvest the monies of the system to meet the objectives of the Investment Policy and Management Plan as established by the board.
The table that follows represents the detailed investments by type within debt securities, equity securities, alternative investments and derivative instruments presented in the Statement of Fiduciary Net Position.
Notes to the Basic Financial Statements
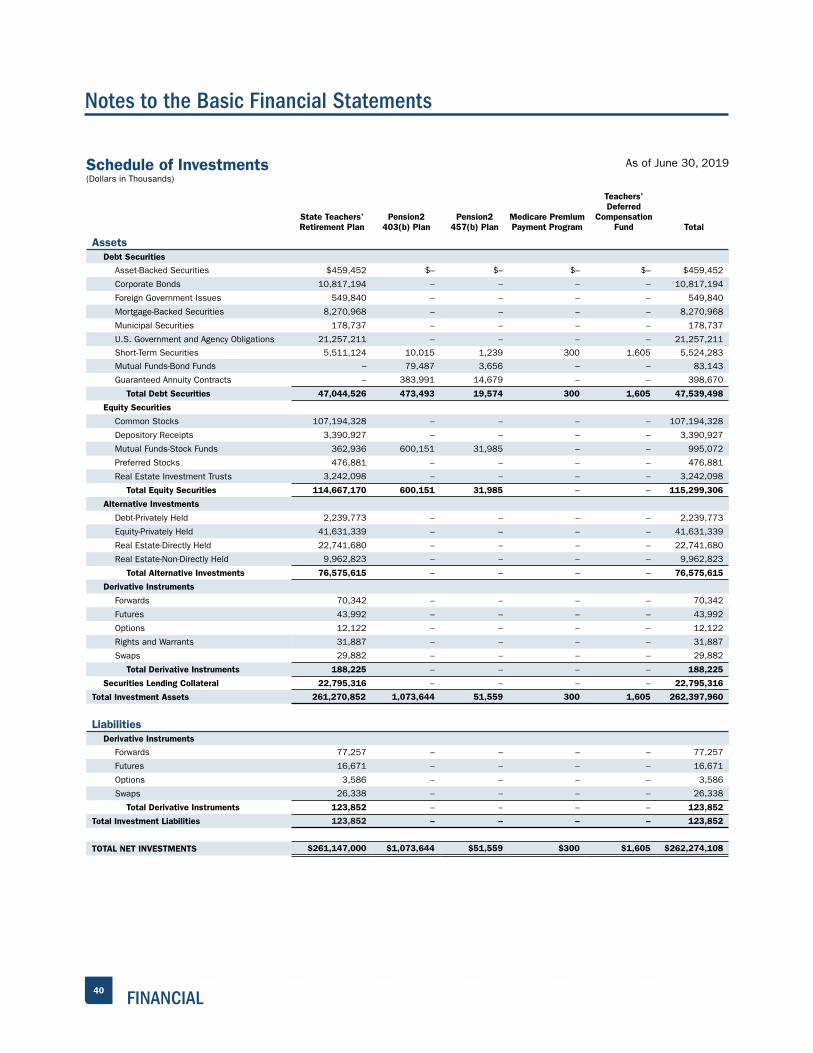
40 FINANCIAL
Notes to the Basic Financial Statements
Schedule of Investments (Dollars in Thousands)
As of June 30, 2019
State Teachers’
Retirement Plan
Pension2
403(b) Plan
Pension2
457(b) Plan
Medicare Premium
Payment Program
Teachers’
Deferred
Compensation
Fund Total
Assets
Debt Securities
Asset-Backed Securities $459,452 $– $– $– $– $459,452
Corporate Bonds 10,817,194 – – – – 10,817,194
Foreign Government Issues 549,840 – – – – 549,840
Mortgage-Backed Securities 8,270,968 – – – – 8,270,968
Municipal Securities 178,737 – – – – 178,737
U.S. Government and Agency Obligations 21,257,211 – – – – 21,257,211
Short-Term Securities 5,511,124 10,015 1,239 300 1,605 5,524,283
Mutual Funds-Bond Funds – 79,487 3,656 – – 83,143
Guaranteed Annuity Contracts – 383,991 14,679 – – 398,670
Total Debt Securities 47,044,526 473,493 19,574 300 1,605 47,539,498
Equity Securities
Common Stocks 107,194,328 – – – – 107,194,328
Depository Receipts 3,390,927 – – – – 3,390,927
Mutual Funds-Stock Funds 362,936 600,151 31,985 – – 995,072
Preferred Stocks 476,881 – – – – 476,881
Real Estate Investment Trusts 3,242,098 – – – – 3,242,098
Total Equity Securities 114,667,170 600,151 31,985 – – 115,299,306
Alternative Investments
Debt-Privately Held 2,239,773 – – – – 2,239,773
Equity-Privately Held 41,631,339 – – – – 41,631,339
Real Estate-Directly Held 22,741,680 – – – – 22,741,680
Real Estate-Non-Directly Held 9,962,823 – – – – 9,962,823
Total Alternative Investments 76,575,615 – – – – 76,575,615
Derivative Instruments
Forwards 70,342 – – – – 70,342
Futures 43,992 – – – – 43,992
Options 12,122 – – – – 12,122
Rights and Warrants 31,887 – – – – 31,887
Swaps 29,882 – – – – 29,882
Total Derivative Instruments 188,225 – – – – 188,225
Securities Lending Collateral 22,795,316 – – – – 22,795,316
Total Investment Assets 261,270,852 1,073,644 51,559 300 1,605 262,397,960
Liabilities
Derivative Instruments
Forwards 77,257 – – – – 77,257
Futures 16,671 – – – – 16,671
Options 3,586 – – – – 3,586
Swaps 26,338 – – – – 26,338
Total Derivative Instruments 123,852 – – – – 123,852
Total Investment Liabilities 123,852 – – – – 123,852
TOTAL NET INVESTMENTS $261,147,000 $1,073,644 $51,559 $300 $1,605 $262,274,108

41FINANCIAL
Notes to the Basic Financial Statements
Debt Securities Debt securities consist primarily of long-term investments issued by the U.S. government and U.S. government-sponsored agencies, municipal securities, foreign governments, corporations, securitized offerings backed by residential and commercial mortgages, and inflation-indexed bonds (also known as inflation-linked bonds). Debt securities also consist of short-term securities that by definition typically have maturities of less than one year. Debt securities in Pension2 include securities such as bond mutual funds and guaranteed annuity contracts.
Short-term investments consist of money market funds, certificates of deposits and similar instruments with maturities and/or holding periods generally of less than one year. Deposits in the Pooled Money Investment Account (classified under short-term securities), administered by the California State Treasurer, represent various investments with approximately 173 average days to maturity. The California State Treasury pools these monies with those of other state agencies for investing in short-term securities. The monies are available for withdrawal at any time. Deposits in the Short-Term Investment Fund, administered by State Street Bank and Trust Company (State Street Bank), represent various investments with approximately 42 average days to maturity.
Pension2 offers bond mutual funds and annuity contracts to individual participants. The annuity contracts offered guarantee a specified minimum interest rate, which is subject to change at any time.
Equity Securities Equity securities consist primarily of domestic and international common stocks, preferred stocks, depository receipts, real estate investment trusts (REITs), exchange-traded funds (ETFs) and stock mutual funds.
Alternative Investments Alternative investments consist primarily of limited partnership structures invested in privately held debt or privately held equity, including venture capital, leveraged buyouts and co-investments, as well as investments in real estate, infrastructure, agriculture and timberland. They include investments held within Private Equity, Real Estate, Global Equity, Risk Mitigating Strategies, Inflation Sensitive and Innovative Strategies.
Alternative investments are generally long-term and illiquid in nature. As a result, investors are subject to redemption restrictions, which generally limit distributions and restrict the ability of limited partners to exit a partnership investment prior to its dissolution.
Investments in real estate directly held assets are in separate accounts and joint ventures, which are primarily composed of retail, office, industrial and multi-family properties. Certain real estate investments are leveraged through partnerships using a combination of equity contributions from CalSTRS and other investors and through the utilization of debt. CalSTRS engages real estate advisors and operating partners who are responsible for managing a portfolio’s day-to-day activities, performance and reporting. Real estate non-directly held investments primarily include commingled limited partnership investments in which CalSTRS does not have a controlling interest.

42 FINANCIAL
Notes to the Basic Financial Statements
While Sustainable Investment and Stewardship Strategies (SISS) funds (formerly known as Corporate Governance funds) are included in the Global Equity asset class, they are classified as alternative investments on the financial statements due to their structure. These funds employ specific investment strategies and co-investments, including, but not limited to, publicly traded equity securities of companies on U.S., Asian, Canadian and European exchanges.
Derivative Instruments CalSTRS holds investments in futures, foreign currency forward contracts, options, swaps, rights and warrants.
A futures contract is an exchange-traded contract whereby the purchaser agrees to buy an asset at a stated price on a specific future date. A foreign currency forward contract is a customized, bilateral agreement to exchange a specified currency at a specified future settlement date at a forward price agreed to on the trade date.
CalSTRS invests in exchange-traded options and over-the-counter options. An option is a contract that entitles the holder to purchase or sell a specific amount of contracts or notional amount at a specified price (strike price). The underlying asset, quantity of the underlying or notional amount, expiration date and strike price are standardized for exchange-traded options and are customized for over-the-counter options.
Swaps are derivative instruments in which two parties agree to exchange one stream of cash flows against another stream or a guarantee. These streams are called the legs of the swap, and usually at least one leg has a rate that is variable. The variable leg can depend on a reference rate, the total return of an asset or an economic statistic. Cash flows are calculated based on a notional amount, which are usually not exchanged between counterparties.
Rights and warrants held by CalSTRS are typically acquired through corporate actions. A right is a privilege granted to shareholders of a corporation to subscribe to shares of a new issue of common stock before it is offered to the public. A warrant gives the holder the right, but not the obligation, to buy an underlying equity security at a given price and quantity during a specified period.
Securities Lending California statutes and board policies permit CalSTRS to make short-term, collateralized loans of its securities to broker-dealers and other entities in order to earn incremental income. CalSTRS has contracted with our custodian (State Street Bank), third-party securities lending agents and their respective custodians to lend equity and debt securities. The majority of the security loans can be terminated on demand by either CalSTRS or the borrower. The underlying securities on loan are reported as assets on the Statement of Fiduciary Net Position.

43FINANCIAL
Collateral in the form of cash or other securities is required for 102% and 105% of the fair value of domestic and international securities loaned, respectively. For non-U.S. debt securities loaned, CalSTRS follows market practice, which requires collateral of 102% of the fair value of the loaned securities. Since the majority of loans are terminable at will, their duration does not generally match the duration of the investments made with the cash collateral. As of June 30, 2019, the weighted duration difference between the investments and these loans was 30 days.
As of June 30, 2019, the fair value of the securities on loan was $24.9 billion. The securities lending cash collateral obligations were $22.8 billion. The fair value of the re-invested cash collateral was $22.8 billion, the non-cash collateral was $2.7 billion, and the calculated mark (collateral adjustment requested for the next business day) was $18.6 million. The invested collateral and corresponding obligation are reflected in the Statement of Fiduciary Net Position as assets and liabilities, respectively. The re-invested cash collateral securities in this program are typically held to maturity and are expected to mature at par.
In accordance with GASB Statement No. 28, Accounting and Financial Reporting for Securities Lending Transactions, the non-cash collateral of $2.7 billion is not reported in the Statement of Fiduciary Net Position because CalSTRS is not permitted to pledge or sell these collateral securities received unless the borrower defaults. The contracts with the securities lending agents require them to indemnify CalSTRS if the borrowers fail to return the securities (or if the collateral is not sufficient to replace the securities lent) or if the borrowers fail to pay CalSTRS for income distributions by the securities’ issuers while the securities are on loan.
Notes to the Basic Financial Statements
Master Credit Facility PortfolioCalSTRS Master Credit Facility Portfolio consists of three separate unsecured credit facilities and one unsecured loan. The proceeds from the Master Credit Facility Portfolio provide the source of funds for managing capital flows of investment strategies.
As of June 30, 2019, the total lender commitments available under the credit facilities was $3.9 billion. The principal amount of draws and repayments in fiscal year 2018–19 were $1.11 billion and $1.05 billion, respectively. At June 30, 2019, there was approximately $2.8 billion of principal outstanding under the credit facilities. The remaining amount available was approximately $1.1 billion. These credit facilities will mature between December 2019 and April 2021.
Pursuant to the terms and conditions of the loan agreements, upon an event of default, all outstanding amounts shall become immediately due, and any commitments of the lenders to fund additional borrowings shall automatically terminate if CalSTRS is unable to make the required payments. The loan agreements may also contain a subjective acceleration clause that allows the lender to accelerate payment of the principal amount to become immediately due if the lender determines, with reasonable judgment, that a material, adverse change occurs.

44 FINANCIAL
Notes to the Basic Financial Statements
Investment Risk Schedules In accordance with GASB Statement No. 40, Deposit and Investment Risk Disclosures–an amendment of GASB Statement No. 3, the following investment risk schedules disclose CalSTRS’ investments that are subject to certain types of risks, including credit risk, interest rate risk, concentration of credit risk, custodial credit risk and foreign currency risk. The policies addressing each risk, discussed in more detail below, are contained within the Investment Policy and Management Plan reviewed and approved annually by the board.
Credit Risk
Credit risk is the risk that an issuer or other counterparty to a debt instrument will not fulfill its obligations. This is measured by the assignment of ratings by nationally recognized statistical rating organizations.
CalSTRS Investment Guidelines require that, at the time of purchase, at least 95% of the fair value of the corporate securities comprising the credit portion of the core fixed income portfolio be rated investment grade as defined by the Bloomberg Barclays U.S. Aggregate Bond Index.
The ratings used to determine the quality of the individual securities in the table below are the ratings provided by S&P Global Inc. Obligations issued or guaranteed by the U.S. federal government or government-sponsored agencies are eligible without limit. Furthermore, the total position of the outstanding debt of any non-agency mortgage-backed, asset-backed and commercial mortgage-backed securities issuer shall be limited to 10% of the fair value of the portfolio, on the basis of each separate trust (pool of assets), at the time of purchase. Obligations of other issuers are not to exceed 5% per issuer, at the time of purchase, of the fair value of any individual portfolio.
The CalSTRS Investment Guidelines also include an allocation for opportunistic strategies, which allows for the purchase of bonds rated below investment grade. The amount of these investments that each investment manager may hold is negotiated on a manager-by-manager basis.
CalSTRS may invest in an unrated security if the security is comparable in quality to other rated securities that are eligible for purchase. The notation NR represents those securities that are not rated, and NA represents those securities for which the rating disclosure requirements are not applicable, such as obligations of the U.S. government and obligations explicitly guaranteed by the U.S. government.

45FINANCIAL
Debt Securities(Dollars in Thousands)
Ratings
Asset-Backed
Securities
Corporate
Bonds
Foreign
Government
Issues
Mortgage-
Backed
Securities
Municipal
Securities
U.S. Government
and Agency
Obligations
Short-Term
Securities
Mutual Funds -
Bond Funds
Guaranteed
Annuity
Contracts Total
Long-term Ratings
AAA $221,624 $228,250 $66,833 $83,924 $20,082 $– $– $– $– $620,713
AA 9,251 1,146,643 82,792 50,461 89,431 1,387,960 – 41,730 – 2,808,268
A 9,127 3,202,016 103,866 17,547 58,092 – – – – 3,390,648
BBB 633 4,149,480 194,542 7,597 11,132 – – – – 4,363,384
BB 4,468 835,475 54,960 5,918 – – – – – 900,821
B 322 769,432 14,144 1,372 – – – – – 785,270
CCC 2,457 129,351 – 4,076 – – – – – 135,884
C – 223 – – – – – – – 223
D 1,123 1,087 – – – – – – – 2,210
NR 210,447 355,237 32,703 6,476,592 – 291,327 – – 398,670 7,764,976
NA – – – 1,623,481 – 19,577,924 – 41,413 – 21,242,818
Short-term Ratings
A-1 – – – – – – 109,760 – – 109,760
NR – – – – – – 4,837,895 – – 4,837,895
NA – – – – – – 576,628 – – 576,628
TOTAL $459,452 $10,817,194 $549,840 $8,270,968 $178,737 $21,257,211 $5,524,283 $83,143 $398,670 $47,539,498
As of June 30, 2019, the credit ratings of all debt securities and securities lending collateral are as follows:
Notes to the Basic Financial Statements
Securities Lending Collateral(Dollars in Thousands)
Ratings
Asset-Backed
Securities Corporate Bonds
Mortgage-Backed
Securities
U.S. Government and
Agency Obligations
Short-Term
Securities Total
Long-term Ratings
AAA $1,927,255 $25,014 $25,048 $– $– $1,977,317
AA – 1,859,811 – 180,053 – 2,039,864
A – 3,383,443 2,038 – – 3,385,481
CC 232 – – – – 232
NA – – – 14,977 – 14,977
NR 1,057,350 285,127 53,310 – – 1,395,787
Short-term Ratings
A-1 – – – – 334,725 334,725
NA – – – – 99,122 99,122
NR – – – – 13,547,789 13,547,789
TOTAL $2,984,837 $5,553,395 $80,396 $195,030 $13,981,636 $22,795,2941
1 Cash total of $22 (in thousands) is not included in this total above but is included in the Securities Lending Collateral line item in the Statement of Fiduciary Net Position.

46 FINANCIAL
Notes to the Basic Financial Statements
Long-Term Fixed Income Duration(Dollars in Thousands)
Investment Type (by portfolio)Portfolio Net
Asset ValueEffective Duration Benchmark Duration Difference
Core Portfolio
Commercial Mortgage-Backed Securities $476,699 5.26 5.20 0.06
Credit Obligations 7,350,125 7.22 7.21 0.01
Mortgage-Backed Securities 6,681,008 2.89 2.64 0.25
U.S. Government and Agency Obligations 9,803,743 6.20 6.13 0.07
Debt Opportunistic
Corporate High Yield 1,151,178 3.22 3.28 (0.06)
Debt Core Plus 3,141,820 5.51 5.31 0.20
Leveraged Loans 507,743 0.48 0.25 0.23
Special Situations 5,915 0.00 5.34 (5.34)
TOTAL $29,118,231
The U.S. Treasury Inflation Protected Securities (TIPS), CalSTRS Home Loan Program, long-duration U.S. Treasury securities and other debt securities in non-Fixed Income portfolios are not included in the table above. The duration or weighted average to maturity for these investments are as follows:
• The U.S. TIPS had a net asset value of $828.3 million with an effective duration of 7.50 years compared to the benchmark duration of 7.48 years.
• CalSTRS Home Loan Program had a net asset value of $47.9 million with a weighted average to maturity of 20.07 years.
• The long-duration U.S. Treasury securities had a net asset value of $9.0 billion with an effective duration and benchmark duration of 17.78 years.
• Other debt securities in non-Fixed Income portfolios had a fair value of $217.6 million with a weighted average to maturity of 9.44 years.
Cash and accruals totaling ($450.9) million and swaps and other collateral totaling $16.9 million are included in the net asset value within the Fixed Income portfolios but are not included in debt securities on the Statement of Fiduciary Net Position.
Interest Rate Risk
Interest rate risk is the risk that changes in interest rates will adversely affect the fair value of an investment.
Investments may contain terms that increase the sensitivity of their fair values to increasing and decreasing interest rates. Although CalSTRS has investments that have an inherent prepayment risk as well as caps, floors and step-up features, these are mitigated through the diversification of asset classes, security selection, maturity and credit quality.
The CalSTRS Investment Guidelines allow the core long-term investment grade portfolios the discretion to deviate the average duration of the portfolio within a range of +/– 20% (80% to 120%) of the weighted average effective duration of the performance benchmark.
As of June 30, 2019, the overall weighted effective duration and benchmark of the long-term Fixed Income portfolios were 5.37 years and 5.34 years, respectively. The following table presents the net asset values, durations and associated benchmarks by investment type held in the long-term Fixed Income portfolios.

47FINANCIAL
Notes to the Basic Financial Statements
As of June 30, 2019, the segmented time distribution for the short-term securities based upon the expected maturity or first reset dates are as follows:
Short-Term Fixed Income Segmented Time Distribution(Dollars in Thousands)
Investment Type 0–30 days 31–90 days 91–120 days 121–180 days 181–365 days 366+ days Total
Asset-Backed Securities $295,670 $– $– $– $9,977 $– $305,647
Corporate Bonds 661,980 543,987 – – 25,141 25,012 1,256,120
Money Market Securities 2,730,146 1,094,139 25,504 50,071 54,018 – 3,953,878
Pooled Money Investment Account 64,850 – – – – – 64,850
Short Term Investment Fund 780,881 – – – – – 780,881
U.S. Government and Agency Obligations 946,514 206,771 – 24,952 402,741 327,346 1,908,324
TOTAL $5,480,041 $1,844,897 $25,504 $75,023 $491,877 $352,358 $8,269,700
WEIGHTINGS 66.3% 22.3% 0.3% 0.9% 5.9% 4.3% 100.0%
The primary investment objective for the short-term investments is to seek the preservation of capital and liquidity and to generate the highest possible current income consistent with a prudent level of risk. The previous table includes $2.8 billion debt securities that are managed within the short-term fixed income portfolio but may have original maturities of over a year. However, the investment guidelines of the short-term portfolio state that the average maturity of the investments shall be managed such that it will not exceed 180 days.
As of June 30, 2019, the segmented time distribution based upon the expected maturity or first reset date for the invested securities lending cash collateral are as follows:
Securities Lending Collateral Segmented Time Distribution(Dollars in Thousands)
Investment Type 0–1 days 2–6 days 7–29 days 30–59 days 60–89 days 90+ days Total
Asset-Backed Securities $– $– $2,143,903 $46,815 $47,611 $746,508 $2,984,837
Corporate Bonds – 637,265 1,501,264 1,670,927 1,538,528 205,411 5,553,395
Mortgage-Backed Securities – – 53,310 – 27,086 – 80,396
U.S. Government and Agency Obligations – – – – – 195,030 195,030
Short-Term Securities 2,442,549 1,510,663 3,511,484 2,832,573 2,056,787 1,627,580 13,981,636
TOTAL $2,442,549 $2,147,928 $7,209,961 $4,550,315 $3,670,012 $2,774,529 $22,795,2941
WEIGHTINGS 10.7% 9.4% 31.6% 20.0% 16.1% 12.2% 100.0%
1 Cash total of $22 (in thousands) is not included in the total above but is included in the Securities Lending Collateral line item in the Statement of Fiduciary Net Position.
The invested securities lending cash collateral is diversified among different investment types with the maximum remaining effective maturity of any instrument being three years at the time of purchase. The fund must remain liquid to meet collateral returns.

48 FINANCIAL
Concentration of Credit Risk
Concentration of credit risk is the risk of loss attributed to the magnitude of CalSTRS’ investment in a single issuer. As of June 30, 2019, CalSTRS has no single issuer that exceeds 5% of total investments or fiduciary net position. Investments issued or explicitly guaranteed by the U.S. government and investments in mutual funds, external investment pools and other pooled investments are excluded. The CalSTRS Investment Policy and Management Plan states that no more than 3% of the total fund shall be invested in or exposed to any one security or corporation, with the exception of U.S. Treasury or Agency Obligations.
Custodial Credit Risk
Custodial credit risk is the risk that if a depository institution or counterparty fails, CalSTRS would not be able to recover the value of our deposits, investments or collateral securities. As of June 30, 2019, all of CalSTRS non-cash investments are not exposed to custodial credit risk because they are held in CalSTRS name. Demand and time deposits held by the various financial institutions and the state banks are insured up to $250,000 by the Federal Deposit Insurance Corporation or by collateral held by the California State Treasurer’s Office or an agency of that office in the state’s name. CalSTRS does not have a general policy relating to custodial credit risk.
Notes to the Basic Financial Statements
Pension2
The primary objectives of Voya Fixed Plus III and TIAA Traditional Annuities are the guarantee of principal and a guaranteed minimum interest rate of 1.0% for the life of the contract. The interest rate guarantees under the contracts are subject to the claim-paying abilities of Voya Retirement Insurance and Annuity Company and TIAA.
As of June 30, 2019, the weighted average maturity of investments with underlying debt holdings for the Pension2 403(b) and 457(b) plans on the Statement of Fiduciary Net Position are as follows:
Pension2 Weighted Average Maturity(Dollars in Thousands)
Investment Maturity Fair Value
CREF Money Market Account 43 days $32
Federated U.S. Treasury Cash Reserves 39 days 11,222
Vanguard Inflation-Protected Securities Fund 8.2 years 41,413
Vanguard Short-Term Bond Index Fund 2.9 years 18,513
Vanguard Total Bond Market Index Fund 8.2 years 23,217
TOTAL $94,397

49FINANCIAL
Notes to the Basic Financial Statements
Foreign Currency Risk(Dollars in Thousands; In U.S. Dollar Equivalents)
Currency Name Debt Securities Equity Securities
Alternative
Investments
Derivative
Instruments Cash1 Total Exposure
Argentine Peso $842 $– $– $1,177 $126 $2,145
Australian Dollar – 2,218,609 – 1,036 39,637 2,259,282
Brazilian Real 23,191 908,865 – (1,414) 949 931,591
Canadian Dollar – 3,414,400 89,715 4,118 36,521 3,544,754
Chilean Peso – 46,276 – (5,812) 1,948 42,412
Colombian Peso – 2,284 – 558 197 3,039
Czech Koruna – 14,846 – 298 155 15,299
Danish Krone 23,869 654,553 – (207) 664 678,879
Egyptian Pound – – – (73) 11 (62)
Euro Currency 28,048 10,828,382 3,547,486 (692) 88,927 14,492,151
Hong Kong Dollar – 3,684,687 – 3,032 19,447 3,707,166
Hungarian Forint – 91,478 – 130 633 92,241
Indian Rupee – 931,733 – 1,539 4,758 938,030
Indonesian Rupiah – 311,619 – (705) 1,752 312,666
Japanese Yen – 8,114,640 – (89) 109,129 8,223,680
Kenyan Shilling – 5,788 – – – 5,788
Malaysian Ringgit – 163,992 – 1 2,157 166,150
Mexican Peso 40,665 288,038 – 1,696 2,310 332,709
New Israeli Sheqel – 150,581 – (36) 1,290 151,835
New Taiwan Dollar – 1,337,016 – (1,323) 10,979 1,346,672
New Zealand Dollar – 104,081 – (1,351) 1,022 103,752
Norwegian Krone – 320,963 – 724 626 322,313
Pakistani Rupee – 18,063 – – 339 18,402
Philippine Peso – 73,051 – 1,666 574 75,291
Polish Zloty – 92,247 – 2,444 873 95,564
Pound Sterling 15,725 5,842,519 993,160 2,632 39,745 6,893,781
Qatari Rial – 31,093 – – 338 31,431
Russian Ruble 22,926 – – 4,872 19 27,817
Singapore Dollar – 633,446 – (451) 5,436 638,431
Peruvian Nouveau Sol – – – 142 5 147
South African Rand – 653,870 – (3,236) 1,132 651,766
South Korean Won – 1,812,202 49,204 (3,068) 8,395 1,866,733
Sri Lanka Rupee – 2,175 – – – 2,175
Swedish Krona – 1,044,160 – 169 2,638 1,046,967
Swiss Franc – 2,733,765 – (3,972) 7,107 2,736,900
Thailand Baht – 276,862 – 93 5,727 282,682
Turkish Lira – 101,504 – 186 737 102,427
UAE Dirham – 59,689 – (15) 614 60,288
Yuan Renminbi 4,604 332,318 – (1,783) 13,531 348,670
TOTAL $159,870 $47,299,795 $4,679,565 $ 2,286 $410,448 $52,551,964
1 Spot contracts of $294 (in thousands) are included in the cash total above.
Foreign Currency Risk
Foreign currency risk is the risk that changes in exchange rates will adversely affect the fair value of an investment or a deposit. As of June 30, 2019, CalSTRS’ investment exposure in foreign currency risk is as follows:

50 FINANCIAL
Notes to the Basic Financial Statements
CalSTRS’ investments denominated in foreign currencies are reported within assets and liabilities on the Statement of Fiduciary Net Position.
Foreign currency is composed of international investment proceeds and income to be repatriated into U.S. dollars and funds available to purchase international securities. Foreign currency is held temporarily in foreign accounts until it is able to be repatriated or expended.
In accordance with the Investment Policy and Management Plan, CalSTRS has established a strategic allocation to non-U.S. dollar public and private equity assets (i.e. private equity investments and real estate). Considering this commitment to non-U.S. dollar assets and the impact currency fluctuations can have on the total return of dollar-based investors, CalSTRS has recognized the need to implement strategies designed to address the management of currency risk. CalSTRS believes that our Currency Management Program should emphasize the protection of the value of its non- U.S. dollar public and private equity assets against a strengthening U.S. dollar first, yet recognizes that opportunities also exist for alpha generation (the ability to derive a return in excess of a market return) within the currency markets.
CalSTRS Fixed Income staff has management and oversight responsibilities for the Currency Management Program. The position range has been designed to allow for some degree of symmetry around the underlying exposure to the foreign-denominated assets within CalSTRS in order to both protect the translation value of the assets against a strengthening U.S. dollar and to enhance returns in a declining U.S. dollar environment.
As of June 30, 2019, the Pension2 403(b) and 457(b) plans do not expose CalSTRS to foreign currency risk.
Derivative Instruments As of June 30, 2019, the derivative instruments held by CalSTRS are considered investments and not hedges for accounting purposes. The term hedging, as it is used elsewhere in the notes to these financial statements, denotes an economic activity and not an accounting method. The gains and losses arising from this activity are recognized as incurred in the Statement of Changes in Fiduciary Net Position.
All investment derivatives discussed below are included within the Investment Risk Schedules, which precede this section. Investments in derivative instruments are disclosed separately to provide a comprehensive view of this activity and its impact on the overall investment portfolio.
Derivative instrument fair values are reported as investments in the Statement of Fiduciary Net Position with changes in fair values reported as investment income (loss) in the Statement of Changes in Fiduciary Net Position.

51FINANCIAL
Notes to the Basic Financial Statements
The table below presents the related net change in fair value, fair value and notional amount of derivative instruments outstanding as of June 30, 2019.
Investment Derivatives Disclosure(Dollars in Thousands)
Derivative Instruments
Net Change in Fair Value for the
Year Ended June 30, 2019 Fair Value Notional Amount1
Forwards
Foreign Currency Forward Contracts $84,259 ($6,915) 10,049,801
Total Forwards 84,259 (6,915)
Futures
Commodity Futures Long (32,647) (2,779) 22,345
Commodity Futures Short 31,305 1,906 (36,075)
Fixed Income Futures Long 49,535 18,308 911,493
Fixed Income Futures Short (30,676) (6,944) (624,920)
Index Futures Long 333,612 16,785 369,509
Index Futures Short (99,554) 45 (101)
Total Futures 251,575 27,321
Options
Commodity Futures Options Bought (179) 2,078 350
Commodity Futures Options Written 1,030 (1,025) (3,291)
Credit Default Swap Options Bought (39) – –
Credit Default Swap Options Written (19) (4) (23,019)
Fixed Income Futures Options Bought (4,755) 785 2,750
Fixed Income Futures Options Written 3,235 (2,262) (7,905)
Foreign Currency Options Bought (53,446) 9,259 2,249,936
Foreign Currency Options Written 4,081 (295) (52,613)
Total Options (50,092) 8,536
Rights and Warrants
Rights 1,233 2,431 32,619 Units
Warrants (192) 29,456 7,775 Units
Total Rights and Warrants 1,041 31,887
Swaps
Commodity Forward Swaps 93 (12) 3,616 Units
Credit Default Swaps Bought (6,902) (6,095) 259,850
Credit Default Swaps Written 1,580 3,392 81,450
Pay-Fixed Interest Rate Swaps (20,687) (17,477) 462,866
Receive-Fixed Interest Rate Swaps 9,340 4,624 265,442
Total Return Swaps (63,576) 19,155 1,121,973
Variance Swaps (91) (43) 5,153
Total Swaps (80,243) 3,544
TOTAL DERIVATIVE INSTRUMENTS $206,540 $64,373
1 In U.S. dollars unless otherwise indicated.

52 FINANCIAL
Counterparty Credit Risk
The table below depicts the counterparty credit ratings of CalSTRS non-exchange traded investment derivative instruments outstanding and subject to loss as of June 30, 2019.
Counterparty Credit Rating(Dollars in Thousands)
S&P Rating
Commodity
Forward Swaps
Credit Default
Swaps Written
Foreign Currency
Forward
Contracts
Receive-Fixed
Interest Rate
Swaps
Total Return
Swaps
Variance
Swaps Total
AA $– $– $18,451 $– $2,256 $– $20,707
A 475 54 43,566 – 14,149 4 58,248
BBB 22 – 2,934 1,247 4,623 7 8,833
TOTAL INVESTMENTS IN ASSETS $497 $54 $64,951 $1,247 $21,028 $11 $87,788
The ratings used to determine the quality of the individual counterparty are S&P ratings. The aggregate fair value of investment derivative instruments in an asset position subject to counterparty credit risk as of June 30, 2019, was $87.8 million. This represents the maximum loss that would be recognized at the reporting date if all counterparties failed to perform as contracted. However, master agreements exist that call for daily exchange of collateral for the mark-to-market to minimize this risk.
CalSTRS may enter into a master netting arrangement with a counterparty. In the event of default or early termination, the master agreement permits the non-defaulting party the right to close-out all transactions in a single net settlement to one net amount payable by one counterparty to the other. As of June 30, 2019, there were assets of $89.6 million, including collateral held by CalSTRS, and liabilities of $67.8 million from non-exchange traded derivatives subject to master netting agreements. As of June 30, 2019, CalSTRS did not have any significant exposure to counterparty credit risk with any single party.
Custodial Credit Risk
The custodial credit risk disclosure for exchange-traded derivative instruments is made in accordance with the custodial credit risk disclosure requirements of GASB Statement No. 40. As of June 30, 2019, all of CalSTRS’ investments in derivative instruments are held in CalSTRS name or CalSTRS nominee’s name and are not exposed to custodial credit risk.
Notes to the Basic Financial Statements

53FINANCIAL
Interest Rate Risk
As of June 30, 2019, CalSTRS is exposed to interest rate risk on its derivative instruments described below by maturity period.
Investment Maturities(Dollars in Thousands)
Investment Type
Investment Maturities (in years)
Fair Value Less Than 1 1–5 6–10 More than 10
Fixed Income Futures Long $18,308 $18,081 $227 $– $–
Fixed Income Futures Short (6,944) (6,944) – – –
Fixed Income Futures Options Bought 785 785 – – –
Fixed Income Futures Options Written (2,262) (2,262) – – –
Pay-Fixed Interest Rate Swaps (17,477) – (1,171) (4,984) (11,322)
Receive-Fixed Interest Rate Swaps 4,624 1,247 443 – 2,934
Total Return Swaps 19,155 19,155 – – –
TOTAL $16,189 $30,062 ($501) ($4,984) ($8,388)
Notes to the Basic Financial Statements

54 FINANCIAL
Derivative Instruments Highly Sensitive to Interest Rate Changes(Dollars in Thousands)
Investment Type Reference Rate/Asset Fair Value
Notional
Amount
Interest Rate Swap Receive Fixed 1.85%, Pay Variable 3-month London Interbank Offered Rate $118 $37,850
Interest Rate Swap Receive Fixed 2.25%, Pay Variable 3-month London Interbank Offered Rate 501 80,150
Interest Rate Swap Receive Fixed 3.00%, Pay Variable 3-month London Interbank Offered Rate 2,976 24,366
Interest Rate Swap Receive Fixed 3.47%, Pay Variable 0-month United Kingdom Retail Price Index (42) 3,564
Interest Rate Swap Receive Fixed 7.33%, Pay Variable 1-month Mexico Interbank Equilibrium Interest Rate (8) 30,944
Interest Rate Swap Receive Fixed 7.35%, Pay Variable 1-month Mexico Interbank Equilibrium Interest Rate (168) 45,141
Interest Rate Swap Receive Fixed 8.41%, Pay Variable Brazil CDI Rate 1,247 43,427
Interest Rate Swap Receive Variable 3-month London Interbank Offered Rate, Pay Fixed 1.39% (583) 93,770
Interest Rate Swap Receive Variable 3-month London Interbank Offered Rate, Pay Fixed 1.85% (23) 8,007
Interest Rate Swap Receive Variable 3-month London Interbank Offered Rate, Pay Fixed 2.25% (1,639) 60,608
Interest Rate Swap Receive Variable 3-month London Interbank Offered Rate, Pay Fixed 2.30% (461) 81,653
Interest Rate Swap Receive Variable 3-month London Interbank Offered Rate, Pay Fixed 2.50% (2,662) 62,347
Interest Rate Swap Receive Variable 3-month London Interbank Offered Rate, Pay Fixed 2.75% (2,263) 21,313
Interest Rate Swap Receive Variable 3-month London Interbank Offered Rate, Pay Fixed 2.88% (2,427) 18,796
Interest Rate Swap Receive Variable 3-month London Interbank Offered Rate, Pay Fixed 3.00% (2,778) 18,056
Interest Rate Swap Receive Variable 3-month London Interbank Offered Rate, Pay Fixed 3.33% (3,499) 16,074
Interest Rate Swap Receive Variable 3-month London Interbank Offered Rate, Pay Fixed 3.13% (695) 15,200
Interest Rate Swap Receive Variable 3-month U.S. FEDL, Pay Fixed 1.55% 35 50,585
Interest Rate Swap Receive Variable 6-month Euro Interbank Offered Rate, Pay Fixed 1.50% (354) 1,714
Interest Rate Swap Receive Variable 6-month London Interbank Offered Rate, Pay Fixed 1.27% (128) 14,743
INTEREST RATE SWAPS TOTAL ($12,853) $728,308
Total Return Swap Receive BCOMF1T Index, Pay 3-month U.S. Treasury Bill plus 0.14% 2,868 115,274
Total Return Swap Receive BCOMTR Index, Pay 3-month U.S. Treasury Bill plus 0.12% 55 2,225
Total Return Swap Receive BCOMTR Index, Pay 3-month U.S. Treasury Bill plus 0.13% 3,326 134,872
Total Return Swap Receive BCOMTR1 Index, Pay 3-month U.S. Treasury Bill plus 0.14% 1,917 77,745
Total Return Swap Receive BCOMTR2 Index, Pay 3-month U.S. Treasury Bill plus 0.14% 3,197 129,862
Total Return Swap Receive 1-month Brazil Interbank Deposit Rate minus 0.60%, Pay MSCI Brazil Net Return Index (12) (597)
Total Return Swap Receive 1-month Johannesburg Interbank Agreed Rate minus 0.47%, Pay MSCI South Africa Net Return Index 526 (33,188)
Total Return Swap Receive 1-month London Interbank Offered Rate plus 0.22%, Pay MSCI Israel Net Return Index (5) (329)
Total Return Swap Receive MSCI China Net Return Index, Pay 1-month Hong Kong Interbank Offered Rate 1,106 34,510
Total Return Swap Receive MSCI Mexico Net Return Index, Pay 1-month Mexico Interbank Equilibrium Interest Rate plus 0.15% (17) 1,273
Total Return Swap Receive MSCI Thailand Net Return Index, Pay 1-month London Interbank Offered Rate plus 0.30% 6 649
Total Return Swap Receive RBCAECT0 Index, Pay 3-month U.S. Treasury Bill plus 0.10% 2,256 90,573
Total Return Swap Receive 1-month Singapore Interbank Offered Rate minus 0.10%, Pay MSCI Singapore Net Return Index (164) (3,242)
Total Return Swap Receive 1-month Warsaw Interbank Offered Rate minus 0.60%, Pay MSCI Poland Net Return Index (41) (3,177)
TOTAL RETURN SWAPS TOTAL $15,018 $546,450
The table below shows swaps that are highly sensitive to changes in interest rates. The table below details the reference rate, fair value and notional amount of these derivative instruments as of June 30, 2019:
Notes to the Basic Financial Statements

55FINANCIAL
Notes to the Basic Financial Statements
Asset Class / Strategy
Previous Target Allocation as
of June 30, 2018
Current Target Allocation as of
June 30, 2019 Policy Range
Actual Allocation as of
June 30, 2019
Global Equity 54.0% 51.0% +/– 6% 50.5%
Fixed Income 13.0% 13.0% +/– 3% 12.3%
Real Estate 12.0% 13.0% +/– 3% 13.7%
Private Equity 8.0% 9.0% +/– 3% 9.2%
Cash / Liquidity 2.0% 2.0% +/– 3% 2.1%
Inflation Sensitive 2.0% 3.0% +/– 3% 2.5%
Risk Mitigating Strategies 9.0% 9.0% +/– 3% 9.4%
Innovative Strategies 0.0% 0.0% +/– 3% 0.3%
Strategic Overlay 0.0% 0.0% 0.0%
TOTAL ASSET ALLOCATION 100.0% 100.0% 100.0%
Investment Allocation PolicyIn accordance with GASB Statement No. 67, Financial Reporting for Pension Plans—an Amendment of GASB Statement No. 25, and GASB Statement No. 74, Financial Reporting for Postemployment Benefit Plans Other Than Pension Plans, CalSTRS discloses investment policies pertaining to asset allocation and changes to any significant investment policies. The board approves the allocation of investment assets as described in the board policy manual. The key goal of the asset allocation process is to develop an asset allocation policy that maximizes the likelihood that the investment portfolio’s assets will, over the planning horizon, fund plan benefits. CalSTRS conducts an asset allocation study every three years, or more frequently if there is a significant change in the liabilities or assets. The
asset allocation study involves a comprehensive review of the financial condition of the plan, including the actuarial requirements of the plan, such as future benefit payments and expected cash flow of contributions. In conjunction with the long-term strategic target, a range for each asset class is established to provide flexibility designed to reduce rebalancing costs and adapt to changing market conditions. The board approved changes to asset allocation ranges effective April 1, 2019.
The following table displays the previous and current board-approved target allocation, the policy range and the actual allocation for the STRP per the portfolio allocation and management structure as of June 30, 2019.
All excess monies from the MPP Program and TDCF are invested into the Surplus Money Investment Fund, which is a pooled investment program administered by the California State Treasurer.

56 FINANCIAL
Notes to the Basic Financial Statements
6. Fair Value MeasurementsThe fair value of a financial instrument is the amount that would be received to sell an asset or paid to transfer a liability in an orderly transaction between market participants at the measurement date (the exit price). Fair value is a market-based measurement, not a CalSTRS-specific measurement; hence, valuation assumptions reflect those that market participants would use to price assets and liabilities at the measurement date.
U.S. Generally Accepted Accounting Principles (GAAP) as promulgated by GASB establish a hierarchy that prioritizes and ranks the inputs to valuation techniques used to measure fair value based on observability. Market price observability may be affected by a number of factors, including the investment type, investment-specific characteristics, state of the marketplace and existence and transparency of transactions between market participants.
CalSTRS follows the fair value measurement and disclosure guidance under U.S. GAAP, which establishes a hierarchical disclosure framework. This framework prioritizes and ranks the level of market price observability used in measuring investments at fair value. U.S. GAAP also allows investments to be valued at cost or net asset value (NAV). The Fair Value Leveling Hierarchy table that follows presents CalSTRS’ investments at their fair value level but also includes certain investments at cost or NAV.
Investments with readily available active quoted prices or for which fair value can be measured from actively quoted prices in an orderly market generally will have a higher degree of market price observability and a lesser degree of judgment used in measuring fair value. In all cases, an instrument’s level within the hierarchy is based upon the market pricing transparency of the instrument and does not necessarily correspond to CalSTRS’ perceived risk or the liquidity of the instrument.
Assets and liabilities measured at fair value are classified into one of the following categories:
Level 1 – Fair value is determined using unadjusted quoted prices in active markets for identical assets or liabilities accessible on the measurement date.
Level 2 – Fair value is determined using quoted prices in inactive markets or significant observable inputs (including, but not limited to, quoted prices for similar investments, interest rates, foreign exchange rates, volatility and credit spreads), either directly or indirectly. These inputs may be derived principally from, or corroborated by, observable market data through correlation or by other means.
Level 3 – Fair value is determined using unobservable inputs, including situations where there is little market activity, if any, for the asset or liability.
The fair value hierarchy level within which a fair value measurement falls is determined based on the lowest level input that is significant to the fair value measurement. The availability of valuation techniques and observable inputs may vary and is affected by factors such as the type of security, whether the security is established in the marketplace and market liquidity. Inputs used to measure fair value may require significant judgment or estimation, and CalSTRS may use models or other valuation methodologies to estimate fair value. Accordingly, the degree of judgment exercised by CalSTRS in estimating fair value is greatest for assets and liabilities categorized in Level 3.

57FINANCIAL
Fair Value Leveling Hierarchy(Dollars in Thousands)
Fair Value Measurements Using
Assets: June 30, 2019
Quoted Prices in Active
Markets for Identical Assets
(Level 1)
Significant Other
Observable Inputs
(Level 2)
Significant
Unobservable Inputs
(Level 3)
Investments by Fair Value Level
Debt Securities
Asset-Backed Securities $459,452 $– $456,876 $2,576
Corporate Bonds 10,817,194 – 10,810,623 6,571
Foreign Government Issues 549,840 – 549,840 –
Mortgage-Backed Securities 8,270,968 – 8,215,687 55,281
Municipal Securities 178,737 – 178,737 –
U.S. Government and Agency Obligations 21,257,211 – 21,257,211 –
Short-Term Securities 3,240,990 792,135 2,448,855 –
Mutual Funds-Bond Funds 83,143 83,143 – –
Guaranteed Annuity Contracts 398,670 – – 398,670
Total Debt Securities 45,256,205 875,278 43,917,829 463,098
Equity Securities
Common Stocks 107,194,328 107,169,355 19,677 5,296
Depository Receipts 3,390,927 3,390,869 – 58
Mutual Funds-Stock Funds 995,072 995,072 – –
Preferred Stocks 476,881 475,825 25 1,031
Real Estate Investment Trusts 3,242,098 3,222,010 20,088 –
Total Equity Securities 115,299,306 115,253,131 39,790 6,385
Alternative Investments
Debt-Privately Held 881 – – 881
Equity-Privately Held 5,204 – – 5,204
Real Estate-Directly Held 22,741,680 – – 22,741,680
Total Alternative Investments 22,747,765 – – 22,747,765
Derivative Instruments
Forwards 70,342 – 70,342 –
Futures 43,992 43,992 – –
Options 12,122 – 12,122 –
Rights and Warrants 31,887 31,840 – 47
Swaps 29,882 – 29,882 –
Total Derivative Instruments 188,225 75,832 112,346 47
Securities Lending Collateral 18,946,222 1,564,973 17,381,249 –
Total Investment Assets Recorded at Fair Value $202,437,723 $117,769,214 $61,451,214 $23,217,295
Investments Measured at Cost
Short-Term Securities 2,283,293
Securities Lending Collateral 3,849,094
Total Investments Measured at Cost 6,132,387
Investments Measured at NAV
Debt-Privately Held 2,238,892
Equity-Privately Held 41,626,135
Real Estate-Non-Directly Held 9,962,823
Total Investments Measured at NAV 53,827,850
Total Investment Assets $262,397,960
Liabilities:
Investments by Fair Value Level
Derivative Instruments
Forwards 77,257 – 77,257 –
Futures 16,671 16,671 – –
Options 3,586 – 3,586 –
Swaps 26,338 – 26,338 –
Total Derivative Instruments 123,852 16,671 107,181 –
Total Investment Liabilities Recorded at Fair Value $123,852 $16,671 $107,181 $–
TOTAL NET INVESTMENTS $262,274,108
Notes to the Basic Financial Statements

58 FINANCIAL
Level 1 measurements are generally valued at the official closing price (usually the last trade price) or the last bid price on the security’s primary exchange. Such investments generally include common stocks, REITs, depository receipts and mutual funds.
Level 2 measurements are generally valued using indicative prices from vendors, brokers or ask prices. These indicative measurements often use matrix pricing, the Black-Scholes-Merton model or a lattice model and incorporate observable inputs such as yield, prepayment speeds, credit spreads, volatility curves or currency curves. Such investments generally include debt securities, bonds and over-the-counter derivatives. Other factors such as infrequent trading, inactive market or adjusted quoted prices may also result in Level 2 measurements.
Level 3 measurements are generally valued using significant inputs that are unobservable to the marketplace. This may occur if an investment is illiquid or is internally estimated. For CalSTRS, such investments primarily include directly held real estate. Properties are appraised using discounted cash flows, income capitalization, adjusted comparable sales and replacement cost (if recent) methods. The method chosen is the one most relevant to how an investor would assess a property as a potential buyer. Additionally, debt associated with real estate properties is valued using income approach methods such as cash equivalency (gross method) or leveraged equity (net method).
Notes to the Basic Financial Statements
CalSTRS measures certain investments that do not have a readily determinable fair value using NAV as a practical expedient. These investments are generally structured as limited partnerships with an investment manager and are created by raising pools of capital from investors that will be invested according to one or more specific investment strategies. Investors commit capital to the fund, and as the investment manager identifies investment opportunities, the committed capital is called to purchase the investments.
NAV is calculated using measurement principles similar to investment companies. CalSTRS updates the NAV for cash contributions, cash distributions and changes in the fair value of the underlying investments using capital account statements and estimates if the NAV is not updated as of the reporting date. CalSTRS does not currently have any plans to sell any of these investments before their stated term.

59FINANCIAL
The following table displays information regarding investments that use NAV per share (or equivalent) as their fair value measurement:
NAV Practical Expedient(Dollars in Thousands)
Fair Value
June 30, 2019
Total Unfunded
Commitments
Redemption Frequency if
Currently Eligible
Redemption Notice
Period
Debt-Privately Held1 $2,238,892 $2,462,433 N/A N/A
Equity-Privately Held
Private Equity Funds2 23,673,680 14,622,568 N/A N/A
Risk Mitigating Strategies Funds3 13,185,292 – Monthly 2–60 days
Sustainable Investment and Stewardship Strategies Funds4 3,241,242 195,249
N/A, Monthly, Quarterly, Annually
60–120 days
Other5 1,525,921 116,000 Daily, Monthly, Quarterly 3–90 days
Real Estate-Non-Directly Held
Real Estate Funds6 6,653,435 5,001,450 N/A N/A
Other7 3,309,388 329,049 Quarterly 30–90 days
TOTAL INVESTMENTS MEASURED AT NAV $53,827,850 $22,726,749
1 This category includes private equity funds that invest in privately held debt. CalSTRS’ investment in each fund is generally not subject to redemption and is normally returned through distributions as a result of the liquidation of the underlying assets over a weighted-average period of approximately nine years as of June 30, 2019.
2 This category includes private equity funds that invest in non-marketable securities of private companies, which ultimately may become public in the future and whose strategies include leveraged buyouts, expansion capital and venture capital. Generally, CalSTRS’ investment in each fund in this category may not be subject to redemption and is normally returned through distributions as a result of the liquidation of the underlying assets over a weighted-average period of approximately nine years as of June 30, 2019.
3 This category includes funds that include investment strategies with structural aspects that provide improved diversification and potential protection in negative equity markets. Investments in this category can be redeemed monthly upon written notice.
4 This category includes funds that invest strategically in publicly traded equities of companies on U.S. and non-U.S. exchanges to achieve capital appreciation and income. The funds in this category are generally subject to a lockup period before redemption is permissible. Investments representing 7.0%, 15.2%, 13.8% and 55.8% of the value of the investments in this category can be redeemed monthly, quarterly, annually and at the end of a three-year or rolling three-year period, respectively. The remaining 8.2% of the value of the investments in this category is not subject to redemption and is normally returned through distributions as a result of the liquidation of the underlying assets.
5 This category includes funds that invest primarily in equities, fixed income securities, opportunistic and other funds. Investments representing 26.4%, 30.8% and 37.3% in this category can be redeemed daily, monthly and quarterly, respectively, upon written notice. The remaining 5.5% of the value of the investments in this category is subject to a lockup period before a one-time full redemption is permissible.
6 This category includes funds that invest directly in real estate and real estate-related assets, including retail, industrial, office, residential and hotels. Generally, CalSTRS’ investment in each fund in this category may not be subject to redemption and is normally returned through distributions as a result of the liquidation of the underlying assets over a weighted-average period of approximately six years as of June 30, 2019.
7 This category includes open-ended funds that invest directly in real estate and real estate-related assets, including retail, industrial, office, residential and hotels. Investments in this category can be redeemed quarterly upon written notice.
Notes to the Basic Financial Statements

60 FINANCIAL
Debt SecuritiesCertain debt securities have an active market for identical securities and are valued using the close or last traded price on a specific date. Debt securities that are not as actively traded are valued by pricing vendors using modeling techniques that include market observable inputs as well as unobservable inputs required to develop a fair value. Typical inputs include recent trades, yields, price quotes, cash flows, maturity, credit ratings and other assumptions based upon the specifics of the investment type.
Short-term investments are reported at fair value or at cost or amortized cost. For those investments that are reported at fair value, the investments are valued using similar methodologies as debt securities traded in active markets.
Bond mutual funds offered by Voya and TIAA are open-ended funds that are priced daily at NAV based generally upon the exchange-traded official closing price of the securities held by the funds. CalSTRS’ allocation in the Voya annuity contracts is carried at contract value, which approximates fair value.
Equity SecuritiesThe majority of equity securities held by CalSTRS are actively traded on major stock exchanges. These exchanges make information on trades of securities available daily on a last trade or official close basis. If such information is not available, other pre-established means are used to determine a price. Stock mutual funds, held in the STRP and Pension2, are open-ended funds that are priced daily at NAV by the fund sponsor based generally upon the exchange-traded official closing price of the securities held by the fund.
Notes to the Basic Financial Statements
Alternative InvestmentsPartnership interests are valued using their respective NAV calculated in accordance with the general partner’s valuation policy as of the measurement date and are audited annually. The most significant input into the NAV of such an entity is the fair value of its investment holdings, which is typically valued on a quarterly or semi-annual basis by the general partners. The valuation assumptions are based upon the nature of the investment and the underlying business. The valuation techniques vary by investment type and involve a certain degree of expert judgment.
SISS funds structured as limited partnerships have been valued using the NAV of the entity, with the most significant input into the NAV being the value of its investment holdings. The general partners obtain prices for their holdings in a manner similar to that described above for equity securities.
Investments in real estate directly held assets are subject to independent third-party appraisals performed annually in accordance with the Uniform Standards of Professional Appraisal Practice. On a quarterly basis, fair values are estimated by the third-party advisor or operating partner using general market and property-specific assumptions, which are reviewed by CalSTRS valuation consultant. Leverage may be used to enhance investment returns as set forth in the CalSTRS Real Estate Investment Policy.
Real estate investments in non-directly held limited partnership interests in commingled funds are valued by CalSTRS using the NAV of the partnership provided by the general partner. The most significant input into the NAV of such an entity is the fair value of its investment holdings. These holdings are valued using the general partners’ valuation policy on a continuous basis, audited annually and periodically appraised by an independent third party as directed by the governing document for each commingled fund investment. The valuation assumptions use both market and property-specific inputs.

61FINANCIAL
Notes to the Basic Financial Statements
Derivative InstrumentsThe fair value of exchange-traded derivative instruments such as futures, options, rights and warrants are determined based on the quoted market prices or mean prices. The fair value of derivative instruments that are not exchange-traded, such as swaps, is determined by external pricing services.
Futures contracts are exchange-traded financial instruments that derive their value from underlying securities, indices or reference rates and are marked-to-market at the end of each day. The fair value of futures are accounted for as unrealized appreciation or depreciation until the contract is closed.
The fair value of the foreign currency forward contracts is the unrealized gain or loss calculated based on the difference between the specified exchange rate and the closing forward rate as of the reporting period.
7. Contingencies CalSTRS is involved in litigation relating to various matters. In the opinion of management, after consultation with legal counsel, the outcome of these matters is not expected to have a material adverse effect on CalSTRS basic financial statements.
8. Commitments In connection with the purchase of partnership interests under various investment portfolios, CalSTRS has remaining unfunded commitments of approximately $28.5 billion at June 30, 2019.
The following table depicts the unfunded commitments by asset strategy:
Asset Class / Strategy
Unfunded Commitments
(Dollars in Thousands)
Global Equity (Sustainable Investment and Stewardship Strategies Funds)
$195,249
Inflation Sensitive 1,329,022
Innovative Strategies 870,981
Private Equity 20,213,505
Real Estate 5,857,696
TOTAL $28,466,453
These unfunded commitments include agreements for acquisitions not yet initiated, which are not included in the NAV Practical Expedient table.
Medicare Premium Payment ProgramUnder current board policy, assets are set aside from the future employer contributions to the DB Program to fund the MPP Program. Based on the funding actuarial valuation for the DB Program, as of June 30, 2018, the assets set aside are equal to the actuarial obligation of the MPP Program less the value of any assets already in the program. As of June 30, 2018, the future employer contributions committed to funding the MPP Program totaled $285.8 million, which equals the projected cost of the program.
This amount is a funding measure that assumes the value of these contributions will be available to fund the MPP Program benefits in future periods, as the assets currently in the program are not sufficient to fund the projected future benefits. This differs from the net OPEB liability as of June 30, 2019, of $372.4 million, which was measured in accordance with GASB Statement No. 74 and represents the actuarial present value of projected benefit payments that is attributable to the MPP Program participants.

62 FINANCIAL
Notes to the Basic Financial Statements
9. New Accounting Pronouncements
CalSTRS reviews the requirements of all new GASB pronouncements and assesses the potential impact to the system. CalSTRS implemented all applicable new GASB pronouncements for the fiscal year ended June 30, 2019, as required by each statement. There were no new GASB standards that materially impacted CalSTRS’ financial statements for the fiscal year ended June 30, 2019.

63FINANCIAL
State Teachers’ Retirement Plan
Year Ended June 302 2019 2018 2017 2016 2015 2014
Total Pension Liability
Service Cost $7,055 $7,142 $6,064 $5,874 $5,556 $5,338
Interest 22,458 21,496 20,227 19,332 18,556 17,822
Changes in Benefit Terms 32 – – – – –
Differences Between Expected and Actual Experience (1,847) (94) 399 (1,209) (1,312) –
Changes of Assumptions – – 19,9883 – – –
Benefit Payments, Including Refunds of Member Contributions
(15,296) (14,537) (13,903) (13,149) (12,565) (12,035)
Net Change in Total Pension Liability 12,402 14,007 32,775 10,848 10,235 11,125
Beginning Total Pension Liability 316,776 302,769 269,994 259,146 248,911 237,786
Ending Total Pension Liability (a) 329,178 316,776 302,769 269,994 259,146 248,911
Plan Fiduciary Net Position
Member Contributions 3,648 3,496 3,441 2,957 2,510 2,264
Employer Contributions 5,644 4,867 4,173 3,391 2,678 2,272
State of California Contributions 5,3354 2,797 2,478 1,940 1,426 1,383
Net Investment Income 14,898 18,674 25,165 2,305 7,612 30,402
Other Income 127 106 72 42 4 2
Benefit Payments, Including Refunds of Member Contributions
(15,296) (14,537) (13,903) (13,149) (12,565) (12,035)
Administrative Expenses (254) (216) (182) (180) (145) (154)
Borrowing Costs5 (105) (94) (58) – – –
Other Expenses (4) (2) (10) (15) (10) (9)
Net Change in Plan Fiduciary Net Position 13,993 15,091 21,176 (2,709) 1,510 24,125
Beginning Plan Fiduciary Net Position-As Previously
Reported224,869 210,289 189,113 191,822 190,474 166,349
Adjustment for Application of New GASB Statements6 – (511) – – (162) –
Beginning Plan Fiduciary Net Position-As Adjusted 224,869 209,778 189,113 191,822 190,312 166,349
Ending Plan Fiduciary Net Position (b) 238,862 224,869 210,289 189,113 191,822 190,474
ENDING NET PENSION LIABILITY
OF EMPLOYERS AND THE STATE (a) – (b)$90,316 $91,907 $92,4807 $80,881 $67,324 $58,4378
1 Some numbers in this schedule are rounded for presentation purposes and may differ slightly from those presented in the Statement of Fiduciary Net Position.2 This is a 10-year schedule. However, the information in this schedule is not available for periods prior to fiscal year 2013–14. Years will be added to this schedule in future fiscal years
until 10 years of information is available.3 The assumptions used in determining the Total Pension Liability of the State Teachers’ Retirement Plan (STRP) changed as a result of the actuarial experience study conducted for the
period July 1, 2010 through June 30, 2015. The assumption changes effective in fiscal year 2016–17 were to price inflation, wage growth, discount rate and the mortality tables.4 Includes contributions of approximately $2.2 billion related to the one-time, supplemental contributions on behalf of employers resulting from SB 90.5 Borrowing costs of $105 million, $94 million and $58 million associated with the master credit facility portfolio, which were previously recorded within net investment income, have been
reclassified for the years ended June 30, 2019, 2018 and 2017, respectively. 6 Adjustments were made to the STRP’s beginning net position in fiscal year 2017–18 and fiscal year 2014–15 due to the implementation of requirements from GASB Statement No. 75
and GASB Statement No. 68, respectively. 7 The net pension liability (NPL) for fiscal year 2016–17 does not include the $511 million reduction to the net position as a result of CalSTRS implementation of GASB Statement No. 75.8 The NPL for fiscal year 2013–14 does not include the $162 million reduction to the net position as a result of CalSTRS implementation of GASB Statement No. 68.
Required Supplementary Information (Unaudited)
Schedule of Changes in Net Pension Liability of Employers and Nonemployer Contributing Entity(Dollars in Millions)
Schedule I1

64 FINANCIAL
State Teachers’ Retirement Plan
Year Ended
June 302
(a)
Total
Pension Liability
(b)
Plan Fiduciary Net
Position
(a – b)
NPL of Employers
and the State
(b / a)
Plan Fiduciary Net
Position as a %
of Total Pension
Liability
(c)
Covered Payroll
(a – b) / c
NPL of Employers
and the State as
a % of Covered
Payroll
2019 $329,178 $238,862 $90,316 72.6% $35,805 252.2%
2018 316,776 224,869 91,907 71.0% 34,753 264.5%
2017 302,7693 210,289 92,4804 69.5% 34,126 271.0%
2016 269,994 189,113 80,881 70.0% 31,910 253.5%
2015 259,146 191,822 67,324 74.0% 32,0265 210.2%
2014 248,911 190,474 58,4376 76.5% 27,486 212.6%
1 Some numbers in this schedule are rounded for presentation purposes and may differ slightly from those presented in the Statement of Fiduciary Net Position.2 This is a 10-year schedule. However, the information in this schedule is not available for periods prior to fiscal year 2013–14. Years will be added to this schedule in future fiscal
years until 10 years of information is available. 3 The assumptions used in determining the Total Pension Liability of the STRP changed as a result of the actuarial experience study conducted for the period July 1, 2010 through
June 30, 2015. The assumption changes effective in fiscal year 2016–17 were to price inflation, wage growth, discount rate and the mortality tables.4 The net pension liability (NPL) for fiscal year 2016–17 does not include a $511 million reduction to the net position as a result of CalSTRS implementation of GASB Statement No. 75.5 In fiscal year 2013–14, CalSTRS reported pensionable compensation as part of GASB Statement No. 67 implementation. In fiscal year 2014–15, GASB clarified the requirement to
be covered-employee payroll, which includes both pensionable and non-pensionable compensation. In fiscal year 2015–16, GASB Statement No. 82 was issued, which amended GASB Statements No. 67 and 68, to instead require the presentation of covered payroll, which is pensionable compensation. The amount reported in the schedule above for fiscal year 2014–15 includes pensionable and non-pensionable compensation; however, the covered payroll amount for fiscal year 2014–15 is $30.5 billion.
6 The NPL for fiscal year 2013–14 does not include a $162 million reduction to the net position as a result of CalSTRS’ implementation of GASB Statement No. 68.
Required Supplementary Information (Unaudited)
Schedule of Net Pension Liability of Employers and Nonemployer Contributing Entity(Dollars in Millions)
Schedule II1

65FINANCIAL
The information presented in this schedule for the STRP is required for defined benefit pension plans.
State Teachers’ Retirement Plan
Year Ended
June 301
(a)
Actuarially
Determined
Contributions
Legally Required
Contributions for
Employers and
the State
(b)
Employer
Contributions2,3
(c)
State
Contributions4
(b + c)
Total
Contributions
a – (b + c)
Contribution
Deficiency
(Excess)
(d)
Covered
Payroll
(b + c) / d
Contributions
as a % of
Covered
Payroll
2019 $10,790 $10,968 $5,633 $5,335 $10,968 ($178) $35,805 30.6%
2018 9,577 7,654 4,857 2,797 7,654 1,923 34,753 22.0%
2017 7,959 6,638 4,160 2,478 6,638 1,321 34,126 19.5%
2016 7,748 5,318 3,378 1,940 5,318 2,430 31,910 16.7%
2015 7,707 4,093 2,667 1,426 4,093 3,614 32,0265 12.8%
2014 7,158 3,641 2,258 1,383 3,641 3,517 27,486 13.2%
1 This is a 10-year schedule. However, the information in this schedule is not available for periods prior to fiscal year 2013–14. Years will be added to this schedule in future fiscal years until 10 years of information is available.
2 Excludes $10.7 million, $10.3 million, $13.3 million, $13.5 million, $11.2 million and $14.5 million for fiscal years 2018–19, 2017–18, 2016–17, 2015–16, 2014–15 and 2013–14, respectively, in contributions to separately finance specific liabilities, such as benefit enhancements, of an individual employer.
3 Includes employer contributions under Education Code sections 22711, 22713, 22905, 22950, 22950.5, 22951, 24260, 26503 and 26504.4 Includes state contributions under Education Code sections 22954, 22955 and 22955.1, as well as Public Resources Code section 6217. Additionally, 2019 state contributions
include the one-time, supplemental contributions resulting from SB 90.5 In fiscal year 2013–14, CalSTRS reported pensionable compensation as part of GASB Statement No. 67 implementation. In fiscal year 2014–15, GASB clarified the requirement to be
covered-employee payroll, which includes both pensionable and non-pensionable compensation. In fiscal year 2015–16, GASB Statement No. 82 was issued, which amended GASB Statements No. 67 and 68, to instead require the presentation of covered payroll, which is pensionable compensation. The amount reported in the schedule above for fiscal year 2014–15 includes pensionable and non-pensionable compensation; however, the covered payroll amount for fiscal year 2014–15 is $30.5 billion.
Methods and Assumptions Used in Calculations of Actuarially Determined Contributions
The actuarially determined contribution (ADC) for the STRP for 2019 presented in this Schedule of Pension Contributions from Employers and Nonemployer Contributing Entity was determined based on the assumptions used in the June 30, 2017, actuarial valuation. The following actuarial methods and assumptions were used to determine the ADC:
State Teachers' Retirement Plan1
Actuarial Cost Method Entry Age Normal
Amortization Method Level Percent of Payroll Basis
Amortization Period Closed/Open2
Remaining Amortization Period 30 years
Asset Valuation Method Adjustment to market value
Actuarial Assumptions:
Investment Rate of Return 7.00%3
Interest on Accounts 3.00%
Wage Growth 3.50%
Consumer Price Inflation 2.75%
Postretirement Benefit Increases 2.00% simple
1 The assumptions shown above are for the ADC of the Defined Benefit (DB) Program. The ADC for the year ending June 30, 2019, is the statutory contribution rate as of the June 30, 2017, actuarial valuation applied to actual DB Program payroll for the fiscal year ended June 30, 2019. For the Defined Benefit Supplement (DBS), Cash Balance Benefit (CBB) and Supplemental Benefit Maintenance Account programs, the ADC reflects the contributions recognized on an accrual basis for the fiscal year ended June 30, 2019.
2 The actuarial gains/losses and the unfunded actuarial obligation are amortized over a closed period for the DB Program, in contrast to the use of an open amortization period for the DBS and CBB programs.
3 The actuarially determined contribution for the fiscal year ending June 30, 2019, was calculated based on the economic and demographic assumptions in place for the funding actuarial valuation as of June 30, 2017. This valuation was performed using a 7.00% assumed investment rate of return, net of investment and administrative expenses. For financial reporting purposes, the NPL (shown in Note 3 of the basic financial statements) was calculated using actuarial assumptions adopted in 2017, which included an assumed rate of return of 7.10%, net of investment expenses but gross of administrative expenses.
Required Supplementary Information (Unaudited)
Schedule of Pension Contributions from Employers and Nonemployer Contributing Entity(Dollars in Millions)
Schedule III

66 FINANCIAL
State Teachers’ Retirement Plan
Year Ended June 301 Money-Weighted Rate of Return, Net of
Investment Expenses
2019 6.6%
2018 8.9%
2017 13.4%
2016 1.2%
2015 4.1%
2014 18.6%
1 This is a 10-year schedule. However, the information in this schedule is not available for periods prior to fiscal year 2013–14. Years will be added to this schedule in future fiscal years until 10 years of information is available.
Medicare Premium Payment Program1
Year Ended June 302 Money-Weighted Rate of Return, Net of
Investment Expenses
2019 2.2%
2018 1.3%
2017 0.9%
1 The funds within the Medicare Premium Payment (MPP) Program as of June 30, 2019, were to manage differences between estimated and actual amounts to be paid and were invested in the Surplus Money Investment Fund, which is a pooled investment program administered by the California State Treasurer.
2 This is a 10-year schedule. However, the information in this schedule is not available for periods prior to fiscal year 2016–17. Years will be added to this schedule in future fiscal years until 10 years of information is available.
Required Supplementary Information (Unaudited)
Schedule of Money-Weighted Investment Returns for State Teachers’ Retirement Plan and Medicare Premium Payment Program
Schedule IV

67FINANCIAL
Medicare Premium Payment Program
Year Ended June 301 2019 2018 2017
Total OPEB Liability
Interest $14,225 $14,567 $12,928
Differences Between Expected and Actual Experience (10,605) (15,759) (41)
Changes of Assumptions 12,111 (10,293) (31,240)
Premiums Paid (27,546) (28,036) (28,929)
Net Change in Total OPEB Liability (11,815) (39,521) (47,282)
Beginning Total OPEB Liability 381,228 420,749 468,031
Ending Total OPEB Liability (a) 369,413 381,228 420,749
Plan Fiduciary Net Position
Employer Contributions 27,977 28,218 29,117
Net Investment Income 29 18 11
Premiums Paid (27,546) (28,036) (28,929)
Administrative Expenses (1,901) (578) (168)
Other Expenses (1) – –
Net Change in Plan Fiduciary Net Position (1,442) (378) 31
Beginning Plan Fiduciary Net Position-As Previously Reported (1,542) 41 10
Adjustment for Application of New GASB Statements2 – (1,205) –
Beginning Plan Fiduciary Net Position-As Adjusted (1,542) (1,164) 10
Ending Plan Fiduciary Net Position (b) (2,984) (1,542) 41
ENDING NET OPEB LIABILITY OF EMPLOYERS (a) – (b) $372,397 $382,770 $420,7083
1 This is a 10-year schedule. However, the information in this schedule is not available for periods prior to fiscal year 2016–17. Years will be added to this schedule in future fiscal years until 10 years of information is available.
2 An adjustment was made to the MPP Program’s beginning net position in fiscal year 2017–18 due to the implementation of requirements from GASB Statement No. 75.3 The net OPEB liability for fiscal year 2016–17 does not include the $1.2 million reduction to the net position as a result of CalSTRS implementation of GASB Statement No. 75.
Required Supplementary Information (Unaudited)
Schedule of Changes in Net OPEB Liability of Employers(Dollars in Thousands)
Schedule V

68 FINANCIAL
Medicare Premium Payment Program
Year Ended
June 301
(a)
Total OPEB
Liability
(b)
Plan Fiduciary
Net Position
(a – b)
Net OPEB Liability
of Employers
(b / a)
Plan Fiduciary Net Position
as a % of Total OPEB
Liability
2019 $369,413 ($2,984) $372,397 (0.81%)
2018 381,228 (1,542) 382,770 (0.40%)
2017 420,749 41 420,708 0.01%
1 This is a 10-year schedule. However, the information in this schedule is not available for periods prior to fiscal year 2016–17. Years will be added to this schedule in future fiscal years until 10 years of information is available.
Required Supplementary Information (Unaudited)
Schedule of Net OPEB Liability of Employers(Dollars in Thousands)
Schedule VI
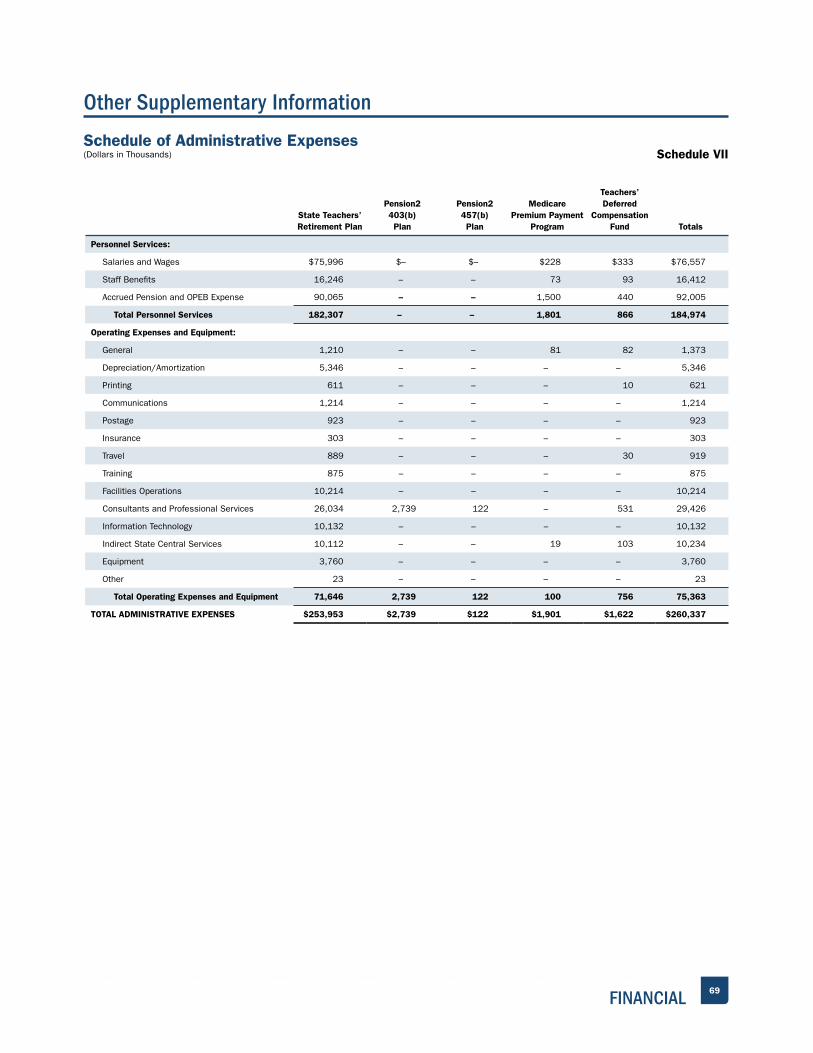
69FINANCIAL
State Teachers’
Retirement Plan
Pension2
403(b)
Plan
Pension2
457(b)
Plan
Medicare
Premium Payment
Program
Teachers’
Deferred
Compensation
Fund Totals
Personnel Services:
Salaries and Wages $75,996 $– $– $228 $333 $76,557
Staff Benefits 16,246 – – 73 93 16,412
Accrued Pension and OPEB Expense 90,065 – – 1,500 440 92,005
Total Personnel Services 182,307 – – 1,801 866 184,974
Operating Expenses and Equipment:
General 1,210 – – 81 82 1,373
Depreciation/Amortization 5,346 – – – – 5,346
Printing 611 – – – 10 621
Communications 1,214 – – – – 1,214
Postage 923 – – – – 923
Insurance 303 – – – – 303
Travel 889 – – – 30 919
Training 875 – – – – 875
Facilities Operations 10,214 – – – – 10,214
Consultants and Professional Services 26,034 2,739 122 – 531 29,426
Information Technology 10,132 – – – – 10,132
Indirect State Central Services 10,112 – – 19 103 10,234
Equipment 3,760 – – – – 3,760
Other 23 – – – – 23
Total Operating Expenses and Equipment 71,646 2,739 122 100 756 75,363
TOTAL ADMINISTRATIVE EXPENSES $253,953 $2,739 $122 $1,901 $1,622 $260,337
Other Supplementary Information
Schedule of Administrative Expenses(Dollars in Thousands) Schedule VII

70 FINANCIAL
Contract Start Date Amount
Investment Management Fees
Aberdeen Standard Investments, Inc. 12/15/06 $1,730
Acadian Asset Management, LLC 2/1/18 636
AGF Investments America, Inc. 3/19/07 1,132
AQR Capital Management Holdings, LLC 12/1/14 21,169
Arrowstreet Capital, Ltd. 8/1/15 8,493
Baillie Gifford Overseas, Ltd. 1/15/06 7,298
Bivium Capital Partners, LLC 2/15/08 2,315
BlackRock Financial Management, Inc. 5/12/99 5,001
BlackRock Institutional Trust, N.A. 10/27/98 3,560
Columbia Management Investment Advisers, LLC 10/1/11 592
Credit Suisse Asset Management, LLC 9/1/11 1,490
Fidelity Institutional Asset Management Co. 2/1/00 2,671
First Quadrant, LP 11/1/98 162
FIS Group, Inc. 2/27/04 3,145
Generation Investment Management 3/19/07 17,799
Hermes Investment Managers, Ltd. 2/1/19 37
Hotchkis and Wiley Capital Management, LLC 10/1/18 466
Impax Asset Management Limited 2/1/19 112
JP Morgan Investment Management, Inc. 1/1/14 8,881
Lazard Asset Management, LLC 5/18/99 12,570
Leading Edge Investment Advisors, LLC 2/15/08 2,684
Lee Overlay Partners, Ltd. 10/15/09 2,888
LM Capital Group, LLC 10/30/06 785
Lyxor Asset Management, Inc. 8/1/16 6,076
Macquarie Investment Management 11/1/98 2,480
Millennium Global Investments, Ltd. 7/1/10 3,229
Mondrian Investment Partners, Ltd. 5/13/99 16,068
PanAgora Asset Management, Inc. 11/01/18 741
PIMCO 2/28/17 1,444
Post Advisory Group, LLC 1/31/02 446
Principal Global Investors, LLC 1/1/14 2,924
Progress Investment Management 2/15/08 2,246
Pyrford International Limited 8/15/18 1,622
Pzena Investment Management, LLC 7/1/15 3,575
Robeco Institutional Asset Management 2/1/18 793
Sasco Capital, Inc. 10/30/98 15
Schroder Investment Management 9/1/14 7,459
Silvercrest Asset Management 7/1/11 1,578
State Street Global Advisors Trust Company 12/1/00 7,931
Sterling Capital Management, LLC 3/11/04 673
T. Rowe Price Associates, Inc. 1/15/06 7,374
Templeton Asset Management, Ltd. 5/18/99 3,483
Western Asset Management Co. 10/30/06 1,630
Total Investment Management Fees 177,403
Other Supplementary Information
Schedule of Investment Expenses(Dollars in Thousands) Schedule VIII

71FINANCIAL
Other Supplementary Information
Contract Start Date Amount
Advisors and Consultants
Altus Group U.S., Inc. 7/1/15 $812
Bard Consulting, LLC 9/20/07 865
Bickmore Risk Services and Consulting 12/1/16 118
Callan Associates 9/20/07 82
Cambridge Associates, LLC 5/31/14 2,673
Colmore, Inc 4/1/19 24
Crosswater Realty Advisors, LLC 6/1/16 185
Ernst & Young U.S. LLP 1/1/16 169
Hamilton Lane Advisors, LLC 9/20/07 29
Lyxor Asset Management, Inc. 8/1/16 300
Meketa Investment Group, Inc. 1/1/12 1,201
Pavilion Alternatives Group, LLC 1/1/12 958
Pension Consulting Alliance, LLC 6/1/14 1,085
Principal Global Investors, LLC 1/1/14 647
RCLCO Fund Advisors, LLC 1/15/18 380
RERC, LLC 9/20/07 3,975
StepStone Group Real Estate LP 9/20/07 61
Valuation Research Corporation 8/1/01 220
Miscellaneous N/A 5
Total Advisors and Consultants 13,789
External Services–Legal and Attorney Fees
Berman DeValerio 4/19/11 343
BLA Schwartz, PC 11/1/13 593
Chapman and Cutler, LLP 8/9/12 16
Covington & Burling, LLP 4/20/11 12
Cox, Castle & Nicholson, LLP 11/30/09 2,874
DLA Piper LLP (US) 3/1/18 796
Grant & Eisenhofer 9/1/10 11
Morgan, Lewis & Bockius, LLP 12/9/10 982
Proskauer, LLP 3/9/11 852
Reed Smith, LLP 7/1/15 172
Steptoe & Johnson, LLP 3/1/17 25
Miscellaneous N/A 9
Total External Services–Legal and Attorney Fees 6,685
Master Custodian
State Street Bank & Trust Co. 7/1/01 3,226
Total Master Custodian 3,226
Research and Rating Services
Abel Noser Holdings, LLC 4/1/18 46
Accounting Research & Analytics, LLC 1/1/19 27
Activist Insight, Ltd. 9/1/18 18
AlternativeSoft AG 10/1/18 26
CEM Benchmarking, Inc. 12/4/17 70
Schedule of Investment Expenses (continued)(Dollars in Thousands) Schedule VIII

72 FINANCIAL
Other Supplementary Information
Contract Start Date Amount
Cornerstone Macro, LP 1/1/19 $70
CPR & CDR Alpha, LLC 3/1/19 60
Creditsights, Inc. 12/30/18 40
Equilar, Inc. 7/1/18 45
eVestment Alliance, LLC 8/1/18 42
FactSet Research System, Inc. 7/1/17 820
Glass Lewis & Co., LLC 6/1/18 255
Global Financial Data, Inc. 5/9/19 28
GNA Services, LLC 1/1/19 25
ICE Benchmark Administration 7/1/18 16
Informa Investment Solutions 1/12/18 27
Institutional Shareholder Services 7/1/18 106
KDP Investment Advisors, Inc. 10/1/18 37
London Stock Exchange PLC 1/1/18 34
Management CV, Inc. 2/1/19 16
Moody's Investors Service 1/1/19 387
MSCI ESG Research, Inc. 1/1/19 135
MSCI, Inc. 1/1/18 968
Nomura Research Institute 12/31/18 18
Preqin Limited 5/31/18 29
Refinitiv US, LLC 7/1/18 145
Russell Investment Group 7/1/17 303
Standard & Poor's 1/1/19 514
StarCompliance Operating, LLC 3/31/19 55
Strategas Securities, LLC 7/1/18 67
Sustainable Investments Institute 7/1/18 32
Sustainalytics U.S., Inc. 1/1/19 11
Technical Analysis Group, LLC 2/3/19 35
Trepp, LLC 1/1/18 71
Miscellaneous N/A 20
Total Research and Rating Services 4,598
Risk Management Systems
Barclays Bank PLC 4/1/18 100
BlackRock Financial Management, Inc. 7/1/06 7,253
MSCI, Inc. d/b/a Barra, LLC 4/1/19 143
Total Risk Management Systems 7,496
Trading Systems
Bloomberg, LP 12/6/16 940
Fixed Income Clearing Corp 7/1/17 12
Intex Solutions, Inc. 9/1/18 168
Market Axess Corporation 10/1/17 16
Markit N.America Inc. / Markit Group 10/14/18 35
Omgeo, LLC 7/1/17 27
Miscellaneous N/A 12
Total Trading Systems 1,210
Schedule of Investment Expenses (continued)(Dollars in Thousands) Schedule VIII

73FINANCIAL
Other Supplementary Information
Contract Start Date Amount
Operating Expenses
Administrative Costs $61,317
Aon Risk Insurance 1,592
Council of Institutional Investors 37
Total Operating Expenses 62,946
Subtotal 277,353
Other Investment Expenses
Foreign Tax Withheld 74,445
Real Estate 469
Broker Commissions 21,813
Miscellaneous 9,409
Total Other Investment Expenses 106,136
TOTAL INVESTMENT EXPENSES $383,489
Schedule of Investment Expenses (continued)(Dollars in Thousands) Schedule VIII

74 FINANCIAL
Individual or Firm Commission/Fee
State Teachers’ Retirement Plan
Actuarial Services
Milliman, Inc. $535
Total Actuarial Services 535
Auditing Services
Crowe LLP 1,998
Grant Thornton, LLP 245
KPMG, LLP 368
State Personnel Board 37
Total Auditing Services 2,648
Consulting and Other Professional Services
22nd Century Technologies, Inc. 43
Abacus Data Systems, Inc. 31
Accuity, Inc. 88
Acuity Technical Solutions 338
Agile Global Solutions, Inc. 176
Avante Solutions, Inc. 192
Background Profiles, Inc. 12
Bank of America Merrill Lynch, N.A. 13
Business Advantage Consulting, Inc. 556
Capio Group 194
CEB, Inc. 112
CEM Benchmarking, Inc. 50
CGI Technologies and Solutions, Inc. 27,397
Cloud Services Integrators, Inc. 12
Daniel J. Edelman, Inc. 116
Deloitte Consulting, LLP 2,436
Department Of Forestry and Fire Protection 23
Department Of Human Resources 45
Digital Deployment, Inc. 161
EFL Associates, Inc 31
Entisys 360, Inc. 160
Estrada Consulting, Inc. 320
Eventus Solutions Group, LLC 214
ExamWorks, Inc. 41
Forrester Research, Inc. 95
Gartner, Inc. 282
Global Governance Advisors, LLC 165
GoldLink Pacific, Inc. 1,176
Government Operations Agency 226
Grant Thornton, LLP 515
Other Supplementary Information
Schedule of Consultant and Professional Services Expenses(Dollars in Thousands) Schedule IX

75FINANCIAL
Other Supplementary Information
Individual or Firm Commission/Fee
Hogan Lovells US, LLP $240
IMPLAN Group, LLC 13
Infinite Solutions, Inc. 159
InfoCap Networks, LLC 119
Infojini, Inc. 48
Integrated Consulting and Management 165
IntelliSurvey 19
International Network Consulting 519
Jaykumar Maistry 168
Kanini Infotech Consultants 116
LexisNexis 24
Linea Solutions, Inc. 712
Lucas Public Affairs 44
Mailing Systems, Inc. 45
Matthew Bender & Company, Inc. 17
MaritzCX Research, LLC 40
Maximus Human Services, Inc. 2,313
McLagan Partners, Inc. 66
Menlo Technologies, Inc. 39
MG Systems and Software, LLC 469
Microsoft Corporation 363
Montague DeRose and Associates, LLC 53
Montridge Consulting 161
Mosaic Governance Advisors, LLC 117
Natl Disability Evaluations, Inc. 56
NTT DATA, Inc. 2,161
Oak Technical Services, LLC 417
OnCore Consulting, LLC 474
Pension Benefit Information, LLC 65
Performance Technology Partners, LLC 50
Pinnacle Consulting 250
Providence Technology Group 803
QualApps, Inc. 37
R Systems, Inc. 154
Radian Solutions, LLC 89
ResilienSoft 54
Ridge Capital, Inc. 8,108
Robert J. Yetman 172
Sierra Metrics, Inc. 142
Signal Perfection, Ltd. 85
Solutions Simplified 61
State Controller's Office 1,918
SupportFocus, Inc. 650
Schedule of Consultant and Professional Services Expenses (continued)(Dollars in Thousands) Schedule IX

76 FINANCIAL
Other Supplementary Information
Individual or Firm Commission/Fee
System Solutions DVBE, Inc. $31
Taborda Solutions, Inc. 378
Technology Management Solutions 201
The Highlands Consulting Group, LLC 143
Thomas V. Ennis Consulting 182
Thomas/Ferrous, Inc. 126
University Enterprises, Inc. 390
Vasquez & Company, LLP 17
Vector Consulting, Inc. 122
Visionary Integration Professionals 1,466
Total Consulting and Other Professional Services 60,051
Legal Services
California Department of Justice 20
Department of General Services 263
Klinedinst, PC 445
Nossaman, LLP 20
Olson Hagel Fishburn, LLP 17
Pillsbury Winthrop Shaw Pittman, LLP 264
Reed Smith, LLP 184
Shaw Law Group, PC 55
Sheppard Mullin Richter & Hampton 406
Total Legal Services 1,674
Regional Counseling Services
Fresno County Office Of Education 31
Humboldt County Office Of Education 70
Kern County Office of Education 167
Santa Barbara County Office of Education 176
Santa Cruz County Office of Education 104
Total Regional Counseling 548
Various Services Under $10K
Others 88
Total Various Services Under $10K 88
Gross Consulting and Professional Services 65,544
Less: Amounts Capitalized1 39,510
TOTAL STATE TEACHERS’ RETIREMENT PLAN — CONSULTING AND PROFESSIONAL SERVICES NET OF AMOUNTS CAPITALIZED $26,034
1 Vendor costs that meet the CalSTRS capitalization criteria are backed out from gross consultant and professional services expenses. Refer to Note 2 for discussion of CalSTRS’
treatment of capital assets.
Schedule of Consultant and Professional Services Expenses (continued)(Dollars in Thousands) Schedule IX

77FINANCIAL
Other Supplementary Information
Individual or Firm Commission/Fee
Pension2 – IRC 403(b) Plan
Administrative Services
TIAA $14
Voya Institutional Plan 2,725
Total Administrative Services 2,739
TOTAL PENSION2–IRC 403(b) PLAN — CONSULTING AND PROFESSIONAL SERVICES $2,739
Pension2 – IRC 457(b) Plan
Administrative Services
Voya Institutional Plan 122
Total Administrative Services 122
TOTAL PENSION2–IRC 457(b) PLAN — CONSULTING AND PROFESSIONAL SERVICES $122
Teachers’ Deferred Compensation Fund
Consulting Services
JNT Resource Partners, LP 437
Morningstar, Inc 85
Meridian Wealth Management 9
Total Consulting Services 531
TOTAL TEACHERS’ DEFERRED COMPENSATION FUND — CONSULTING AND PROFESSIONAL SERVICES $531
Schedule of Consultant and Professional Services Expenses (continued)(Dollars in Thousands) Schedule IX

[THIS PAGE INTENTIONALLY LEFT BLANK]

APPENDIX C
2019 REPORT TO LEGISLATURE ON THE PROGRESS OF THE CALSTRS FUNDING PLAN

[THIS PAGE INTENTIONALLY LEFT BLANK]

June 2019
Report to Legislature on the Progress of the CalSTRS Funding Plan
California State Teachers’ Retirement System100 Waterfront Place
West Sacramento, CA 95605


1EXECUTIVE SUMMARY
EXECUTIVE SUMMARY
In June 2014, Assembly Bill 1469 (Bonta) created a specific plan to fully fund the California State Teachers’ Retirement System’s Defined Benefit Program by 2046. The CalSTRS Funding Plan reflects a shared commitment by members, employers and the state to incrementally increase contributions to CalSTRS in a predictable manner to fully fund the Defined Benefit Program and ensure the long-term sustainability of CalSTRS.
The funding plan was enacted by the California State Legislature and Governor in 2014 and requires CalSTRS to provide a report to the Legislature every five years on the progress of the plan. The first report to the Legislature is due July 1, 2019. Existing statute requires that the first report compare the funding levels and projected contribution rates at the time the funding plan was enacted to those based on the June 30, 2018, actuarial valuation. The report must also indicate whether additional contributions are needed to reach full funding by 2046.
The purpose of this report is to fulfill this legislative requirement and assist stakeholders, policymakers and the public in assessing the soundness and sustainability of the Defined Benefit Program. This report is also intended to promote a better understanding of how the funding plan operates and how it is expected to achieve its goal of full funding over the next few decades.
It is important to note that full funding is the most financially prudent way to provide benefits to past, present and future California educators. While proposals with a target of less than full funding may result in lower employer and state contribution rates in the near term, such proposals would increase total costs and decrease benefit security for CalSTRS members. For examples of the risks involved in such an approach, national news is often filled with stories of other states where low funding levels for retirement systems were the result of inadequate contributions.
As adopted, the funding plan lays out a measured schedule of contribution increases for both the state and employers, which balances the need for greater contributions with the need to adjust and prepare employer and state budgets for the financial impact of increased contributions. The funding plan also provides the Teachers’ Retirement Board with limited authority to further increase or decrease both the state and employer contribution rates to ensure the plan remains on track and is able to respond, as necessary, to unexpected changes in CalSTRS’ economic and demographic situation. These are important design features that have helped put CalSTRS in a much stronger position. Prior to the funding plan, the board had only a very limited ability to change the state contribution rate and no ability to adjust the employer contribution rate.
As shown throughout this report, the funding plan is working. Prior to the adoption of the funding plan, the Defined Benefit Program was expected to run out of assets by 2046. Today, it is expected to reach 99.9 percent funded by 2046.
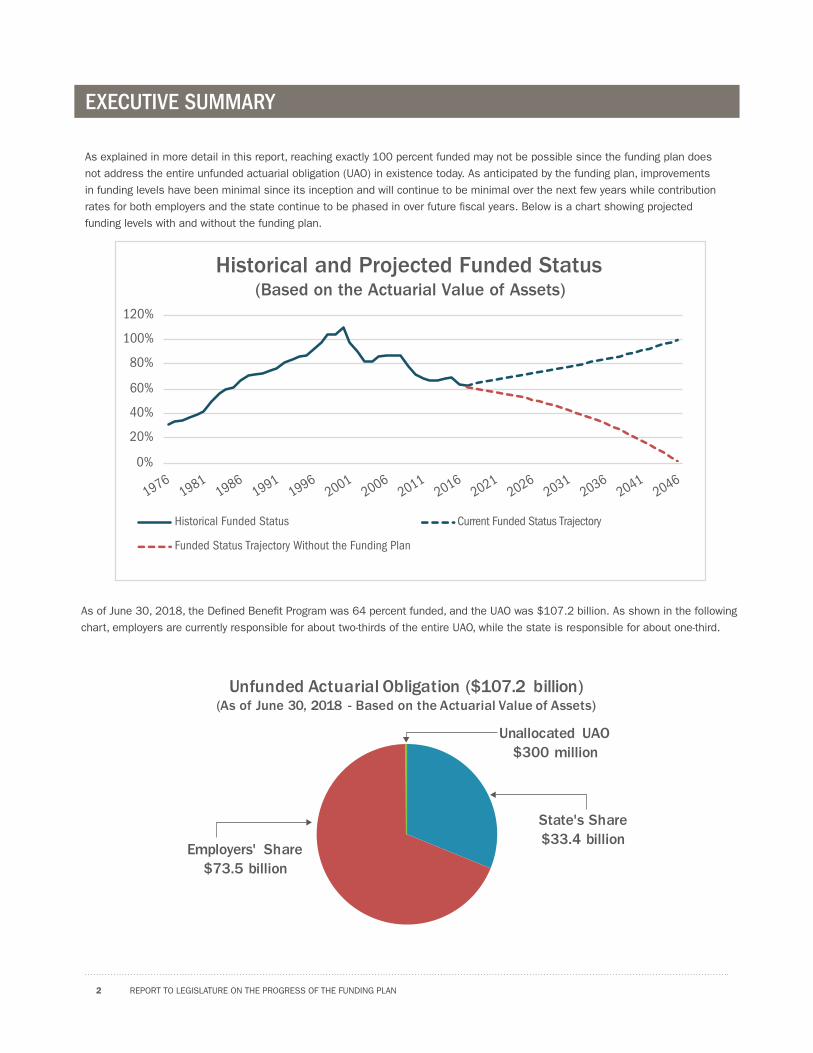
2 REPORT TO LEGISLATURE ON THE PROGRESS OF THE FUNDING PLAN
As of June 30, 2018, the Defined Benefit Program was 64 percent funded, and the UAO was $107.2 billion. As shown in the following chart, employers are currently responsible for about two-thirds of the entire UAO, while the state is responsible for about one-third.
EXECUTIVE SUMMARY
As explained in more detail in this report, reaching exactly 100 percent funded may not be possible since the funding plan does not address the entire unfunded actuarial obligation (UAO) in existence today. As anticipated by the funding plan, improvements in funding levels have been minimal since its inception and will continue to be minimal over the next few years while contribution rates for both employers and the state continue to be phased in over future fiscal years. Below is a chart showing projected funding levels with and without the funding plan.
0%
20%
40%
60%
80%
100%
120%
19761981
19861991
19962001
20062011
20162021
20262031
20362041
2046
Historical and Projected Funded Status(Based on the Actuarial Value of Assets)
Historical Funded Status Current Funded Status Trajectory
Funded Status Trajectory Without the Funding Plan
State's Share$33.4 billion
Employers' Share$73.5 billion
Unallocated UAO$300 million
Unfunded Actuarial Obligation ($107.2 billion)(As of June 30, 2018 - Based on the Actuarial Value of Assets)
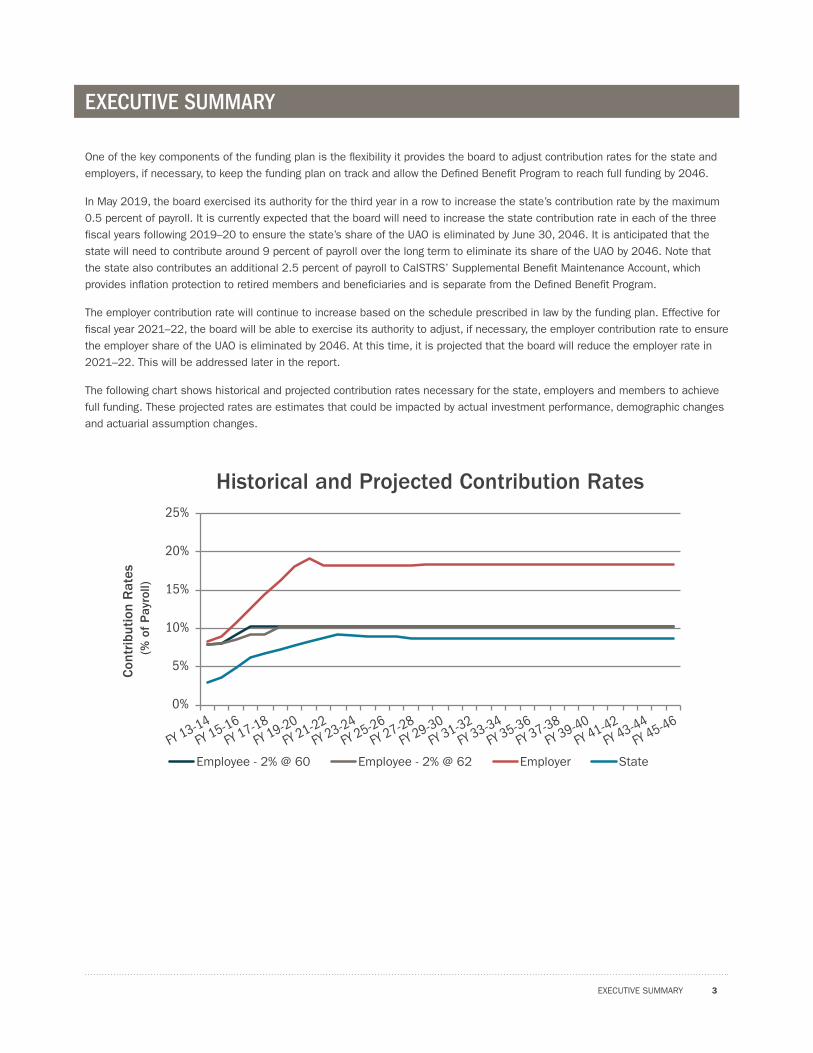
3EXECUTIVE SUMMARY
One of the key components of the funding plan is the flexibility it provides the board to adjust contribution rates for the state and employers, if necessary, to keep the funding plan on track and allow the Defined Benefit Program to reach full funding by 2046.
In May 2019, the board exercised its authority for the third year in a row to increase the state’s contribution rate by the maximum 0.5 percent of payroll. It is currently expected that the board will need to increase the state contribution rate in each of the three fiscal years following 2019–20 to ensure the state’s share of the UAO is eliminated by June 30, 2046. It is anticipated that the state will need to contribute around 9 percent of payroll over the long term to eliminate its share of the UAO by 2046. Note that the state also contributes an additional 2.5 percent of payroll to CalSTRS’ Supplemental Benefit Maintenance Account, which provides inflation protection to retired members and beneficiaries and is separate from the Defined Benefit Program.
The employer contribution rate will continue to increase based on the schedule prescribed in law by the funding plan. Effective for fiscal year 2021–22, the board will be able to exercise its authority to adjust, if necessary, the employer contribution rate to ensure the employer share of the UAO is eliminated by 2046. At this time, it is projected that the board will reduce the employer rate in 2021–22. This will be addressed later in the report.
The following chart shows historical and projected contribution rates necessary for the state, employers and members to achieve full funding. These projected rates are estimates that could be impacted by actual investment performance, demographic changes and actuarial assumption changes.
EXECUTIVE SUMMARY
0%
5%
10%
15%
20%
25%
FY 13-14
FY 15-16
FY 17-18
FY 19-20
FY 21-22
FY 23-24
FY 25-26
FY 27-28
FY 29-30
FY 31-32
FY 33-34
FY 35-36
FY 37-38
FY 39-40
FY 41-42
FY 43-44
FY 45-46
Historical and Projected Contribution Rates
Employee - 2% @ 60 Employee - 2% @ 62 Employer State
Con
trib
utio
n R
ates
(% o
f P
ayro
ll)

4 REPORT TO LEGISLATURE ON THE PROGRESS OF THE FUNDING PLAN
EXECUTIVE SUMMARY
Note that this report does not reflect the impact of the supplemental payments to CalSTRS included in the 2019–20 state budget to reduce the UAO of the system and reduce the contribution rates for employers and the state.
Key highlights of the funding plan explained in more detail in this report include:
• The funding plan is working. The Defined Benefit Program is expected to reach near full funding by 2046. The risk of a low-funded status or even running out of money has been considerably reduced with the adoption of the funding plan.
• The state bears most of the risk and financial responsibility for changes in the UAO caused by investment performance, demographic changes and actuarial assumption changes.
• The employer contribution rate is minimally impacted by investment performance, and when impacted, it generally moves in the opposite direction of the state contribution rate.
• The funding plan does not address the entire UAO in existence today. As explained in this report, a small portion of the existing UAO is currently unallocated.
• A recession resulting in both a decline in active
membership and a period of lower investment returns would put significant strain on the state and employers and would challenge CalSTRS’ ability to achieve full funding.
The next formal report on the progress of the funding plan will be provided to the Legislature in 2024, based on the June 30, 2023, actuarial valuation. Until then, CalSTRS will continue to monitor the funding plan and its progress every year through CalSTRS’ annual actuarial valuation process in the spring and again in the fall through the board’s annual Review of CalSTRS Funding Levels and Risks report.
Continuous monitoring of the funding plan is important to identify and address trends that could impact the long-term funding of the system in a timely manner. If a situation were to develop under which the funding plan was no longer expected to allow the Defined Benefit Program to achieve full funding, it would be extremely important to act quickly to minimize long-term costs to members, employers and the state.

5INTRODUCTION
INTRODUCTION
This is the first statutorily-required report by CalSTRS to the Legislature on the progress of the funding plan, and going forward, a report is due to the Legislature every five years. This report is intended to assist the Legislature, stakeholders and the public in assessing the soundness and sustainability of the Defined Benefit Program, to promote a better understanding of how the funding plan operates, and to outline how the funding plan is expected to achieve its goal of full funding over the next few decades.
This report is based on the June 30, 2018, annual actuarial valuation and does not reflect year-to-date investment experience for fiscal year 2018–19. At the time of the writing of this report, the year-to-date return for fiscal year 2019–20 was below 7 percent, which is CalSTRS’ assumed rate of return on trust assets. A return below 7 percent would likely result in a reduction in funding levels in the short term and require higher state contribution rates over the long term to achieve full funding by 2046. This report also does not reflect the impact of the 2019–20 state budget, which includes supplemental payments to CalSTRS to reduce the UAO of the system and contribution rates for employers and the state.
This report will focus on the following:
• Background on the Defined Benefit Program and the history of its funding.
• Details on how the funding plan operates.
• Changes in contribution rates and funding levels since 2014.
• Current projections of funding levels and contribution rates.
• Risks that could prevent CalSTRS from reaching full funding.
• Information on the importance of acting quickly if it is determined that another solution is needed to reach full funding.

6 REPORT TO LEGISLATURE ON THE PROGRESS OF THE FUNDING PLAN

7HISTORY OF THE DEFINED BENEFIT PROGRAM AND ITS FUNDING STRUCTURE
HISTORY OF THE DEFINED BENEFIT PROGRAM AND ITS FUNDING STRUCTURE
The membership and the funding of the Defined Benefit Program has changed substantially in the more than 100 years since CalSTRS was established by law in 1913. When CalSTRS was founded, it had 120 retired members and 15,000 active members. Over time, the total membership has grown to about 950,000 members and their beneficiaries.
Today, CalSTRS is the largest educator-only pension fund in the world and the second largest pension fund in the United States. CalSTRS provides retirement, disability and survivor benefits for full-time and part-time California public school educators through a hybrid retirement system consisting of the Defined Benefit, Defined Benefit Supplement, and Cash Balance Benefit programs, as well as a voluntary defined contribution plan called CalSTRS Pension2®.
In 1913, what is now the Defined Benefit Program had only two sources of contributions: a $12 annual contribution from each active member and a state contribution equal to 5 percent of the revenue generated by the state’s inheritance tax. Employers did not make contributions to CalSTRS until 1935 when they began to make a $12 annual contribution per active member. The members’ contribution increased to $24 per year at the same time.
The next significant change in the funding structure occurred nine years later, in 1944, when the member contribution amount changed from a flat dollar amount to a percentage of compensation, which also varied depending on the age and gender of the member. The member contribution rate ranged between 2.53 and 4.85 percent of compensation. At the same time, the state’s contribution changed from a percentage of inheritance tax revenue to a pay-as-you-go payment, with the state paying the difference between the resources available and the cost of benefits in a given year. The member’s contribution rate continued to be based on the member’s age and gender and was adjusted several times between 1944 and 1972.
In 1956, the employer contribution of $12 per member per year was augmented by a 3 percent of salary contribution, with a limitation that contributions could not exceed specified percentages of the assessed value of properties within the school district. In 1971, the employer contribution rate averaged about 2 percent of salary.
Until 1972, the funding structure did not allow CalSTRS to prefund the retirement benefits promised to California educators and was instead funded using a pay-as-you-go approach, with the state responsible for bridging any shortfalls.
The funding structure changed to a prefunding basis in 1972 with the adoption of the E. Richard Barnes Act. The member contribution rate, which averaged 7.4 percent, was changed to a fixed 8 percent of salary. The member contribution rate stayed at this level until the adoption of the funding plan in 2014. The employer contribution rate was also increased in 1972. Increases were phased in over time. The rate was initially set to a flat 3.2 percent of earnings effective with fiscal year 1972–73 and was increased gradually over the balance of the decade until it reached 8 percent in 1978–79, matching the contribution rate paid by members.
The payment made by the state also changed in 1972. Instead of being responsible for bridging the funding gap on a pay-as-you-go basis, the state started contributing a flat dollar amount of $135 million per year, which was intended to bridge the funding shortfall in place at the time over a 30-year period. This flat dollar amount was modified a few times throughout the 1970s as CalSTRS’ funding situation also changed. By 1990, the state’s annual contribution had increased to about $400 million. Additional state contributions, based on a percentage of pay, were also enacted in the 1980s to fund specific benefit enhancements.
In 1986, the financial responsibility of funding the crediting of unused sick leave service credit was transferred from the state to employers, resulting in an increase of 0.25 percent of salary in the employer contribution rate. This increase brought the total employer contribution rate to 8.25 percent of salary. This rate remained unchanged for employers until the passage of the funding plan in 2014.
The next significant change in program funding occurred in 1990 with the passage of Senate Bill 1370 (Green), the Elder State Teachers’ Retirement Full Funding Act. The flat dollar contribution paid by the state was replaced with a contribution rate equal to 4.3 percent of a member’s compensation to eliminate the funding shortfall in place at the time over the next 40 years.
8 REPORT TO LEGISLATURE ON THE PROGRESS OF THE FUNDING PLAN
HISTORY OF THE DEFINED BENEFIT PROGRAM AND ITS FUNDING STRUCTURE
As CalSTRS’ funding situation improved in the late 1990s and early 2000s, the state’s contribution rate was modified several times to adjust for the improved funding levels. By 2003, the state’s base contribution rate was 2.017 percent of creditable compensation of the fiscal year ending in the prior calendar year. The board was also given the ability to set a supplemental contribution rate for the state above the base contribution rate to eliminate any unfunded liability associated with the 1990 benefit structure. State law limited the annual increase for the supplemental state contribution rate to 0.25 percent with a maximum supplemental rate of 1.505 percent.
Following the financial crisis and market downturn of 2008, the funding situation of the Defined Benefit Program deteriorated to the point that contributions were not enough to prevent it from running out of assets in about 30 years. A different funding structure was needed to address the situation.
Guided by its board, CalSTRS committed to promote the development of a comprehensive strategy to address the long-term funding needs of the system. After years of focused discussions, stakeholder outreach, legislative visits and hearings, the Legislature adopted AB 1469 in June 2014, creating the CalSTRS Funding Plan.

9CalSTRS FUNDING PLAN
CALSTRS FUNDING PLAN
The funding plan, enacted by AB 1469 in 2014, put the Defined Benefit Program on the path to full funding by 2046 through incremental contribution increases shared among the program’s three contributors: CalSTRS members, employers and the state.
Member Contribution IncreasesAB 1469 increased member contributions on compensation that is creditable to the Defined Benefit Program. The member contribution rate had not increased beyond 8 percent since 1972. Below is a table showing the increases in the member contribution rate from 2014 through 2018.
Effective Date
Pre-CalSTRS Funding Plan Member Contribution Rate
Post-CalSTRS Funding Plan Member Contribution Rate
2% at 60 Members1
2% at 62 Members
2% at 60 Members1
2% at 62 Members1
July 1, 2014 8% 8% 8.15% 8.15%
July 1, 2015 8% 8% 9.20% 8.56%
July 1, 2016 8% 8% 10.25% 9.205%
July 1, 2017 8% 8% 10.25% 9.205%
July 1, 2018 & thereafter 8% 9% 10.25% 10.205%
In exchange for increased contributions to the Defined Benefit Program as part of the funding plan, CalSTRS members who performed creditable service on or after January 1, 2014, are now guaranteed a 2 percent annual benefit adjustment, also referred to as the improvement factor. The 2 percent improvement factor is provided to members once they have been retired for at least one year and is a component of the purchasing power protections within the plan. Prior to the funding plan, the improvement factor was not guaranteed for any member. For members who retired prior to January 1, 2014, the improvement factor is not guaranteed since the Legislature reserved the right to adjust the improvement factor as economic conditions dictate, as it had with regards to all members prior to the enactment of the funding plan.
In 2012, the Legislature enacted Assembly Bill 340 (Furutani), the Public Employees’ Pension Reform Act (PEPRA), which was effective on January 1, 2013. PEPRA requires that members subject to the 2% at 62 benefit formula must pay at least one-half of the normal cost of their benefit and that their contribution rate be adjusted if the plan’s normal cost changes by more than 1 percent of salary. Effective July 1, 2018, CalSTRS 2% at 62 members were required to contribute an additional 1 percent of creditable compensation to CalSTRS as a result of an increase in the plan’s normal cost. This increase was driven by a change in actuarial assumptions adopted by the board to reflect longer life expectancies for CalSTRS members and lower investment return expectations in the future.
1 The contribution rate for CalSTRS 2% at 62 members is based, in part, on the normal cost of benefits and may increase or decrease in future years. The contribution rate for 2% at 60 members is set in statute.

10 REPORT TO LEGISLATURE ON THE PROGRESS OF THE FUNDING PLAN
CALSTRS FUNDING PLAN
Employer Contribution IncreasesThe funding plan provided for increases in the employer contribution rate, which are being phased in over seven years. These supplemental contributions were intended to eliminate the employers’ share of the UAO by 2046. Prior to the funding plan, the employer contribution rate had not increased since 1986. Below is a table showing the increases in the employer contribution rate from 2014 through 2020.
Effective Date
Base Employer
Contribution Rate Post-CalSTRS Funding Plan Contributions
Employer Supplemental
Contribution Rate1 Total Employer Rate2
July 1, 2014 8.25% 0.63% 8.88%
July 1, 2015 8.25% 2.48% 10.73%
July 1, 2016 8.25% 4.33% 12.58%
July 1, 2017 8.25% 6.18% 14.43%
July 1, 2018 8.25% 8.03% 16.28%
July 1, 2019 8.25% 9.88% 18.13%
July 1, 2020 8.25% 10.85% 19.10%
Starting in 2021–22, the funding plan provides the board limited authority to adjust the employer supplemental contribution rate, if necessary, to fully fund the employers’ share of the UAO by 2046. Those adjustments are limited to 1 percent annually. Also, the total employer contribution rate cannot exceed 20.25 percent of creditable compensation.
State Contribution IncreasesAs described earlier in this report, prior to the adoption of the funding plan, the board had the ability to set a supplemental contribution rate for the state, in addition to the base rate of 2.017 percent, to eliminate any UAO associated with the 1990 benefit structure. State law limited the annual increase for the supplemental state contribution rate to 0.25 percent with a maximum supplemental rate of 1.505 percent.
The funding plan maintained the state’s base contribution rate of 2.017 percent to the Defined Benefit Program. The funding plan increased the supplemental rate dedicated to paying for the 1990 benefit structure. The increases in the
state supplemental rate were phased in over three years, reaching 4.311 percent of payroll effective July 1, 2016, for a total contribution rate of 6.328 percent to the Defined Benefit Program. This contribution rate was anticipated to eliminate the state’s share of the unfunded liability by 2046.
The funding plan also provided the board limited authority to adjust the state’s contribution rate to eliminate the state’s share of the unfunded liability by 2046, with increases limited to 0.5 percent each year. In May 2019, the board exercised its authority to increase the state supplemental contribution rate by 0.5 percent of payroll for the third time since the adoption of the funding plan.
1 The funding plan included a set schedule of employer supplemental rate increases through fiscal year 2020–21.2 The total employer rate does not reflect the supplemental pension payments in the 2019–20 state budget.

11CalSTRS FUNDING PLAN
CALSTRS FUNDING PLAN
Below is a table showing the state contribution rate to the Defined Benefit Program from 2014 through 2019.
Effective Date
Base State
Contribution Rate
Pre-CalSTRS
Funding Plan State
Supplemental
Contribution Rate
Post-CalSTRS Funding Plan Contributions
State Supplemental
Contribution Rate Total State Rate
July 1, 2014 2.017% 1.024% 1.437%1 3.454%
July 1, 2015 2.017% 1.274% 2.874%1 4.891%
July 1, 2016 2.017% 1.505% 4.311%1 6.328%
July 1, 2017 2.017% 1.505% 4.811%2 6.828%
July 1, 2018 2.017% 1.505% 5.311%3 7.328%
July 1, 2019 2.017% 1.505% 5.811%4 7.828%
1 The funding plan included a set schedule of state supplemental rate increases through fiscal year 2016–17. 2 Adopted by the board in April 2017. 3 Adopted by the board in May 2018. 4 Adopted by the board in May 2019.
To eliminate the state’s share of the UAO by 2046, additional increases in the state supplemental contribution rate of 0.5 percent of payroll, beyond those shown in the above table, are currently expected for three additional fiscal years. Note that future investment and demographic experience could impact this estimate.
In addition to the contribution rate to the Defined Benefit Program, the state also contributes 2.5 percent of payroll toward the Supplemental Benefit Maintenance Account, CalSTRS’ inflation protection program.

12 REPORT TO LEGISLATURE ON THE PROGRESS OF THE FUNDING PLAN

13UNDERSTANDING HOW THE CalSTRS FUNDING PLAN OPERATES
UNDERSTANDING HOW THE CALSTRS FUNDING PLAN OPERATES
Although the funding plan is working as designed and the Defined Benefit Program is projected to reach full funding, the funding plan is a complex funding structure with many intricacies that often lead to counterintuitive results. Understanding these intricacies is important to be able to recognize the types of events and factors that could impact contribution rates and potential situations that could impact CalSTRS’ ability to reach full funding.
A key element of this complexity is the structure established to pay down the UAO. Specifically, the funding plan contains rules that are used to determine how much of the UAO is allocated to the state and employers. The UAO is not allocated to members. The state is responsible for any
UAO related to CalSTRS benefits that were in effect on July 1, 1990, which for this report, is referred to as the 1990 benefit structure. This responsibility applies to all service performed by CalSTRS members. The employers are responsible for any UAO that can be attributed to benefit changes that occurred on or after July 1, 1990, which for this report, is referred to as the post-1990 benefit structure. The employers’ responsibility is limited to service accrued by members before July 1, 2014.
As of June 30, 2018, the rules of the funding plan have resulted in the following allocation of the UAO for the Defined Benefit Program.
As illustrated above, employers are currently responsible for about two-thirds of the entire UAO for the Defined Benefit Program. This is the main reason why the employer contribution rate is projected to be the highest among the three contributors. The state is responsible for about one-third of the existing UAO. Finally, the funding plan does not address the entire UAO in existence today. The remaining portion of the UAO that is not allocated between the employers or the state is referred as the unallocated UAO.
State's Share$33.4 billion
Employers' Share$73.5 billion
Unallocated UAO$300 million
Unfunded Actuarial Obligation ($107.2 billion)(As of June 30, 2018 - Based on the Actuarial Value of Assets)

14 REPORT TO LEGISLATURE ON THE PROGRESS OF THE FUNDING PLAN
UNDERSTANDING HOW THE CALSTRS FUNDING PLAN OPERATES
Even though employers are responsible for the greatest share of the existing UAO, the state’s share of the UAO is most likely to materially increase or decrease as a result of economic and demographic experience. To understand why the state’s share is more sensitive, it is helpful to further look into the UAO. The UAO for a pension plan is the difference between the actuarial obligation for the plan and the actuarial value of assets. Understanding the relative sizes of the actuarial obligation and the actuarial value of assets for the 1990 benefit structure, the post-1990 benefit structure and the unallocated will help illustrate the expected sensitivity.
Below is a chart showing the breakdown of the actuarial obligation as of June 30, 2018.
The state is responsible for funding the UAO for the 1990 benefit structure. Since the UAO is the difference between the actuarial obligation for the plan and the actuarial value of assets, changes in the actuarial obligation caused by demographic experience or changes in actuarial assumptions will result in changes in the UAO.
As shown above, the actuarial obligation for the 1990 benefit structure represents more than 80 percent of the total actuarial obligation for the Defined Benefit Program. This means that, even though employers are responsible for the largest share of the existing UAO, the state’s share
$0
$50
$100
$150
$200
$250
$300
Total Actuarial Obligation Post-1990 Benefit StructureService Prior to July 1, 2014
(Employers)
Post-1990 Benefit StructureService After July 1, 2014
(Unallocated)
Breakdown of Actuarial Obligation(Defined Benefit Program Only - as of June 30, 2018)
($ in
bill
ions
)
(State)1990 Benefit Structure
of the UAO and the state contribution rate will be most impacted by future changes in actuarial assumptions or demographic experience.
Based on the current breakdown of the actuarial obligation, the state contribution rate would be expected to be about five times more sensitive to changes in actuarial assumptions and demographic experience than the employer contribution rate. This explains why the state’s share of the UAO and the state contribution rate were the most impacted by the change in actuarial assumptions adopted by the board in February 2017.

15UNDERSTANDING HOW THE CalSTRS FUNDING PLAN OPERATES
UNDERSTANDING HOW THE CALSTRS FUNDING PLAN OPERATES
Next is a chart showing the breakdown of the assets for the Defined Benefit Program. The breakdown of the assets involves the calculation of a hypothetical asset value of the 1990 benefit structure as per rules set in the funding plan.
As can be seen in the above chart, the assets dedicated to the state to fund the 1990 benefit structure represent the largest share of the total assets needed to fund the Defined Benefit Program. In fact, the rules set in the funding plan result in the state having a share of the total assets that exceeds the actual assets on hand today. This is caused in part by the fact that the hypothetical asset value for the 1990 benefit structure is calculated based on the expectation that past benefit payments would have been lower under the 1990 benefit structure. The hypothetical asset value also ignores the member contribution of 2 percent of salary that was diverted from the Defined Benefit Program into the Defined Benefit Supplement Program for a period of 10 years.
Since the hypothetical asset value for the 1990 benefit structure is greater than the current Defined Benefit Program asset, when returns are greater or lower than the assumed 7 percent, the actuarial gains or losses are greater on the
hypothetical asset value than on the actual assets of the Defined Benefit Program. As a result, the state’s share of the UAO and the state’s contribution rate are both extremely sensitive to investment volatility.
Since the state’s share of the assets is greater than the actual total Defined Benefit Program assets, the employer’s share is effectively a negative number. It is also much smaller relative to the state’s share of the assets. As a result, the employer contribution rate is minimally impacted by investment volatility, and when it does change, it generally reacts in the opposite direction from that of the state. The employer contribution rate is expected to increase when the plan experiences investment returns greater than assumed and to decrease when the returns are less than assumed. This is a counterintuitive outcome resulting from the complex allocation structure of the funding plan.
-$50
$0
$50
$100
$150
$200
$250
$300
Total Assets 1990 Benefit Structure(State)
Post-1990 Benefit
After July 1, 2014(Unallocated)
Breakdown of Actuarial Value of Assets(Defined Benefit Program Only - as of June 30, 2018)
($ in
bill
ions
)
Post-1990 BenefitStructure Service
Prior to July 1, 2014 (Employers)
Structure Service

16 REPORT TO LEGISLATURE ON THE PROGRESS OF THE FUNDING PLAN
-$6
-$4
-$2
$0
$2
$4
$6
Return 2% Below Assumption
Return 2% Above Assumption
Cha
nge
in U
AO
($
in b
illio
ns)
Estimated Impact of Investment Performance on Share of the Unfunded Actuarial Obligation
State's Share of UAO Employers' Share of UAO
UNDERSTANDING HOW THE CALSTRS FUNDING PLAN OPERATES
To help illustrate this counterintuitive interaction and the greater volatility expected for the state contribution rate, the following two charts show the impact on the share of the UAO and long-term contribution rates for both the state and the employers, assuming the investment return for the Defined Benefit Program was 2 percent above or below the current 7 percent investment return assumption.
As displayed above, an investment return of 5 percent in a fiscal year, 2 percent below the 7 percent return assumption, would result in an increase in the state’s share of the UAO, while the employers’ share would decrease. The increase in the state’s share of the UAO would also be much larger than the decrease in the employers’ share, leading to more contribution volatility in the state contribution rate as shown in the following chart.
-1.5%
-1.0%
-0.5%
0.0%
0.5%
1.0%
1.5%
Return 2% Below Assumption
Return 2% Above Assumption
Estimated Impact of Investment Performance on Long-Term Contribution Rates
State Contribution Rate Employer Contribution Rate

17UNDERSTANDING HOW THE CalSTRS FUNDING PLAN OPERATES
UNDERSTANDING HOW THE CALSTRS FUNDING PLAN OPERATES
Consistent with the change in the share of the UAO, an investment return of 5 percent in a fiscal year, 2 percent below the 7 percent return assumption, would result in the need to increase the state contribution rate by about 1 percent of payroll long term, while the same investment return would result in the need to reduce the employer contribution rate by about 0.1 percent of payroll long term. An investment return of 9 percent would have the opposite effect for both the state and employer contribution rates.
As stated above, a portion of the UAO is not allocated to either employers or the state. It is referred to as the unallocated UAO. The funding plan assigned the responsibility to fund any shortfalls related to the post-1990 benefit structure to employers but limited that responsibility to service earned prior to July 1, 2014. No one group was assigned the responsibility for funding shortfall related to service earned after July 1, 2014, for the post-1990 benefit structure. The unallocated UAO increases or decreases depending on investment experience, and there is no mechanism within the funding plan to systematically eliminate this portion of the UAO.
When the funding plan was adopted, there was no unallocated UAO. However, the unallocated UAO is currently estimated to be about $300 million as of June 30, 2018, based on the actuarial value of assets. Without a mechanism for funding the unallocated UAO, it is expected to grow to about $500 million by 2046. The unallocated UAO could increase significantly if investment returns fall well below the assumed 7 percent. Similarly, it could be eliminated if investment returns exceed 7 percent over the long term. If the unallocated UAO were to be funded on an actuarial basis with a funding target of June 30, 2046, additional contributions of 0.04 percent of payroll would be required effective July 1, 2019.

18 REPORT TO LEGISLATURE ON THE PROGRESS OF THE FUNDING PLAN

19CHANGES SINCE THE PASSAGE OF THE CALSTRS FUNDING PLAN
CHANGES SINCE THE PASSAGE OF THE CALSTRS FUNDING PLAN
When the funding plan was adopted by the Legislature in 2014, it was based on CalSTRS annual actuarial valuation as of June 30, 2013, which was the most recent actuarial valuation available at the time. It is important to remember that the funding plan was developed based on the actuarial assumptions in place at that time, which included a long-term investment return assumption of 7.5 percent.
Since the passage of the funding plan, the board has taken steps to further strengthen the funding of the system. In 2015, the board recognized the importance of protecting against equity market downturns by creating and investing in a Risk Mitigating Strategies asset class. In 2017, the board adopted new actuarial assumptions, reflecting lower future investment earnings and longer life expectancies. The long-term investment return assumption was lowered from 7.5 percent to 7.0 percent over a two-year period, while the assumed life expectancy of CalSTRS members was increased by two to three years through the adoption of updated mortality assumptions.
As of June 30, 2018, financial markets have provided better than assumed returns, improving projected funding levels and future projected contribution rates, while putting the system in a stronger long-term financial position. The strong economy since the adoption of the funding plan has also contributed to faster growth in CalSTRS’ membership and payroll, partially contributing to the projection of lower-than-anticipated employer rates.
These changes and events have had a mixed impact on funding levels and contribution rates. As shown in the table below, the funded status is slightly lower today than initially anticipated when the funding plan was adopted, while the UAO is slightly greater than anticipated.
Actual – Without Funding Plan
(as of June 30, 2013)
Projected – With Funding Plan
(as of June 30, 2018)
Actual – With Funding Plan
(as of June 30, 2018)
Funded Status 66.5% 64.6% 64.0%
UAO $73.7 billion $98.5 billion $107.2 billion
While the Defined Benefit Program is currently on a path to full funding, the UAO is currently in a period of growth, which is expected to end around 2027. The growth in the UAO was fully anticipated when the funding plan was adopted. When a pension plan is less than 100 percent funded, contributions must exceed the normal cost to pay down the UAO and to make progress toward full funding. To ensure the UAO does not increase on a year-to-year basis, the payments toward the UAO must be greater than the interest that will be accrued on the UAO over the same time period. Failing to contribute an amount in excess of the interest will result in an increase of the UAO from year to year. This is referred to as negative amortization. For CalSTRS to avoid negative amortization, payments toward the UAO must be more than 7 percent of the UAO.
With the phased-in rate increases established through the funding plan, it was anticipated that the contributions would not be sufficient to prevent the UAO from increasing over the first few years. Additionally, funding levels were expected to decrease slightly, as compared to the levels in place at the time the funding plan was adopted. The UAO was expected to increase from $73.7 billion on June 30, 2013, to $98.5 billion on June 30, 2018. Accordingly, the plan’s funded status was expected to decrease slightly from 66.5 percent to 64.6 percent. Due to the board’s adoption of new demographic and investment return assumptions since the passage of the funding plan, the UAO increased slightly faster than anticipated. The UAO was $107.2 billion as of June 30, 2018.

20 REPORT TO LEGISLATURE ON THE PROGRESS OF THE FUNDING PLAN
CHANGES SINCE THE PASSAGE OF THE CALSTRS FUNDING PLAN
Below is a chart illustrating the major factors that have led to the changes in the UAO, and their magnitude, between 2013 and 2018.
Contribution rates have also been affected by the same changes and events that took place in the last few years. Today, the state contribution rate is higher than projected when the funding plan was adopted. The employer rate, however, is now projected to be lower over the long term than initially anticipated in the funding plan.
As discussed earlier, the state’s share of the UAO is most impacted by any changes in actuarial assumptions, demographic experience and, most importantly, investment experience. The new actuarial assumptions adopted by the board in 2017 combined with the impact of negative amortization have caused the state’s share of the UAO to increase from about $20 billion in 2013 to about $33 billion as of June 30, 2018. This has resulted in the need for a higher long-term state contribution rate than originally anticipated in the funding plan.
The employers’ share of the UAO has also increased since the passage of the funding plan from $54 billion to $73.5 billion, with most of the increase anticipated when the funding plan was adopted. However, the contribution rate necessary to eliminate it by 2046 is now expected to be lower than originally anticipated by the funding plan. The expected decrease in contribution rates for the employers can be attributed to the strong economy, which resulted in a faster-than-anticipated growth in CalSTRS’ active membership and total payroll in the last few years. Having a larger payroll base is expected to allow the board to be able to lower the employer contribution rate and still collect the amount of money needed to eliminate the employers’ share of the UAO by 2046.
The next section provides more details on projected funding levels and the contribution rates needed to eliminate both the state’s share and the employers’ share of the UAO.
-$15
-$10
-$5
$0
$5
$10
$15
$20
$25
$30
Cha
nges
in U
AO
($
in b
illio
ns)
Changes in the Unfunded Actuarial Obligation Since the Passage of the CalSTRS Funding Plan
Negative Amortization Changes in ActuarialAssumption
Investment Performance Growth in Payroll andActive Memberhsip

21CURRENT PROJECTED FUNDING LEVELS AND CONTRIBUTION RATES
CURRENT PROJECTED FUNDING LEVELS AND CONTRIBUTION RATES
A key component of CalSTRS’ mission is to ensure a financially sound retirement system for California’s educators. Progress toward this goal was made possible in 2014 with the passage of the funding plan, which provided limited authority to the board to adjust the employer and state rates to ensure funding of the plan remains on schedule.
Even if the current UAO is slightly greater than originally anticipated when the funding plan was adopted, the limited rate-setting authority currently allows both the state’s share and the employers’ share of the UAO to be eliminated by 2046. However, as discussed earlier in this report, the unallocated UAO is expected to remain in 2046. By 2046, the Defined Benefit Program is expected to be 99.9 percent funded with a remaining unallocated UAO of about $500 million. If the unallocated UAO were to be funded on an actuarial basis with a funding target of June 30, 2046, additional contributions of 0.04 percent of payroll would be required effective July 1, 2019.
Below is a chart showing both the historical and projected funded status through 2046 for the Defined Benefit Program. The funded status reported is based on the actuarial value of assets.
The chart on the next page shows how the UAO is expected to be reduced through 2046. As noted earlier in this report, contributions are not expected to be enough to prevent the UAO from increasing further until fiscal year 2026–27. Based on current projections, the UAO is expected to increase annually until reaching approximately $111 billion in 2027, at which point it will stabilize and slowly decrease to approximately $500 million by 2046.
Funding progress may appear to be slow, but it is important to remember that the existing UAO was built over decades of insufficient contributions into the system. Therefore, it will take many years to see substantial progress in the overall funding level of the system. For example, the current UAO is not expected to drop below the amount of the UAO when the funding plan was adopted until 2040, when it is expected be just below $70 billion. However, in 2040, the funded status is expected to be close to 90 percent, which is a much stronger funding situation than when the funding plan was adopted. It is also important to remember that the funding level trajectory is a much more important signal of overall plan sustainability than the raw funding level percentage.
0%
20%
40%
60%
80%
100%
120%
19761981
19861991
19962001
20062011
20162021
20262031
20362041
2046
Historical and Projected Funded StatusCalSTRS DB Program - Actuarial Value of Assets Basis
Historical Funded Status Projected Funded Status

22 REPORT TO LEGISLATURE ON THE PROGRESS OF THE FUNDING PLAN
CURRENT PROJECTED FUNDING LEVELS AND CONTRIBUTION RATES
To achieve the reduction in the UAO illustrated above, the board will need to exercise its authority to adjust contribution rates in the future.
Since the enactment of the funding plan, the authority to increase the state’s contribution rate has been exercised by the board. In May 2019, the board increased the state’s supplemental contribution rate by the maximum allowed, 0.5 percent of payroll, for the third year in a row. It is currently expected that the board will need to increase the state contribution rate for three more years to ensure the state’s share of the UAO is eliminated by 2046. It is anticipated that the state will need to contribute around 9 percent of payroll over the long term to the Defined Benefit Program to eliminate its share of the UAO by 2046. This is in addition to the 2.5 percent of payroll paid by the state toward the Supplemental Benefit Maintenance Account, the account that provides inflation protection for retired members and their beneficiaries.
The employer contribution rate will continue to increase based on the schedule laid out in the funding plan. Starting in fiscal year 2021–22, the board may adjust, if necessary,
the employer contribution rate to ensure that employers eliminate their share of the UAO by 2046. Current estimates indicate that the board would reduce the employer contribution rate to approximately 18.3 percent of payroll effective July 1, 2021.
The contribution rate for CalSTRS 2% at 60 members is set in statute at 10.25 percent of salary. The contribution rate for CalSTRS 2% at 62 members is tied to the normal cost of benefits as required by PEPRA. Effective July 1, 2018, CalSTRS 2% at 62 members were required to contribute an additional 1 percent of creditable compensation to CalSTRS as a result of an increase in the plan’s normal cost, which was driven by the changes in actuarial assumptions adopted by the board in 2017. The contribution rate for CalSTRS 2% at 62 members is currently set at 10.205 percent of salary. While the contribution rate for CalSTRS 2% at 62 members is based, in part, on the normal cost of benefits and may be subject to change based on new assumptions, CalSTRS does not anticipate this rate changing dramatically in the future. As mentioned earlier in this report, the contribution rate for CalSTRS 2% at 62 members will be impacted only if the plan’s normal cost changes by more than 1 percent.
$0
$20
$40
$60
$80
$100
$120
$140
$160
20182022
20262030
20342038
20422046
UA
O (
$ in
Bill
ions
)
Projected Unfunded Actuarial Obligation
Employer Portion State Portion Unallocated Portion

23CURRENT PROJECTED FUNDING LEVELS AND CONTRIBUTION RATES
CURRENT PROJECTED FUNDING LEVELS AND CONTRIBUTION RATES
Below is a chart showing historical and projected contribution rates for the state, employers and members necessary for CalSTRS to achieve full funding. The projected rates are estimates that could be impacted by actual investment performance, demographic changes and actuarial assumption changes.
Note that these projected rates do not reflect the impact the 2019–20 state budget, which includes supplemental payments to CalSTRS to reduce the UAO of the system and reduce contribution rates for employers and the state.
0%
5%
10%
15%
20%
25%
FY 13-14
FY 15-16
FY 17-18
FY 19-20
FY 21-22
FY 23-24
FY 25-26
FY 27-28
FY 29-30
FY 31-32
FY 33-34
FY 35-36
FY 37-38
FY 39-40
FY 41-42
FY 43-44
FY 45-46
Historical and Projected Contribution Rates
Employee - 2% @ 60 Employee - 2% @ 62 Employer State
Con
trib
utio
n R
ates
(% o
f P
ayro
ll)

24 REPORT TO LEGISLATURE ON THE PROGRESS OF THE FUNDING PLAN

25RISKS FACING THE CALSTRS FUNDING PLAN
RISKS FACING THE CALSTRS FUNDING PLAN
Defined benefit plans are a very efficient way to provide retirement security for educators. This efficiency is achieved by pooling investment, inflation and longevity risks, which has the effect of spreading the cost of adverse experience associated with these risks over a large group of people and longer periods of time than for defined contribution plans. While these risks are minimized under a defined benefit plan, they cannot be fully eliminated.
To address these risks, it is important for a retirement system to have a funding structure that targets full funding and provides enough flexibility to respond to fluctuations caused by demographic and economic experience.
With the adoption of the funding plan, CalSTRS has a funding structure in place that targets full funding and provides flexibility to respond to year-over-year changes in funding levels. As implemented, the funding plan is working and is expected to eliminate all but a small portion of the UAO by 2046. The rate-setting authority granted to the board has considerably reduced the risk of a low funded status or even running out of money.
However, risks remain that could impact CalSTRS’ ability to achieve full funding by 2046. As illustrated later in this section, there is a possibility that the funding plan may not provide the board sufficient ability to adjust contribution rates in response to demographic and economic experience. If such a situation was to develop, additional funding would need to be provided to CalSTRS or another funding solution would need to be implemented.
The three main risks facing the Defined Benefit Program are longevity risk, risk of declines in membership and investment risk.
Longevity risk is the risk that CalSTRS members will live longer than currently assumed. Compared to investment risk, in which a shock in a single year can have a significant and lasting impact, longevity risk is a slowly developing demographic phenomenon that could potentially take decades before it is recognized. Longevity improvements have historically occurred with incremental improvements in public health and advancements in medical technologies, and these changes take time to impact whole populations.
Despite the slow nature of longevity risk, it is important that it is not ignored. In February 2017, the board took
an important step by adopting actuarial assumptions that recognize that educators’ life expectancies have been increasing over time and will most likely continue to do so. CalSTRS implemented an approach to set actuarial assumptions for mortality called “generational mortality,” which anticipates future improvements in life expectancy. The board adopted the use of a mortality improvement factor of 1.1 percent in each year for most ages. With generational mortality, CalSTRS is more accurately anticipating future improvements in life expectancy in the funding of the system. This assumption has strengthened the ability of CalSTRS to reach full funding by 2046 by recognizing potential improvements in life expectancy before they materialize.
The size of CalSTRS’ active membership and overall payroll is directly related to contribution levels. When the overall payroll for CalSTRS’ active members declines, an increase in contribution rates is necessary to ensure full funding even if the UAO has remained the same. The overall amount of contributions required to eliminate the UAO is still the same in dollar terms. However, since contributions are collected as a percentage of payroll, the contribution rates must increase to collect the same dollar amount. There is a risk that a decline in active membership and payroll, combined with limited rate adjustments, could prevent contribution rates from being set at the levels necessary to ensure full funding.
A decline in CalSTRS’ active membership could occur for a number of reasons. Historically, recessions have often resulted in a reduction in the number of teachers in California as employers have been forced to make difficult decisions and, in many cases, reduce the number of teaching positions and increase class sizes. This risk could be exacerbated further if it was combined with a period of lower investment returns. A recession resulting in both a decline in active membership and a period of lower investment returns would put significant strain on the state, employers and CalSTRS’ ability to achieve full funding.
Alternatively, the state might experience a decline in the student population, reducing the necessity for as many teachers. Based on the most recent student projection prepared by the California Department of Finance, the overall student population of California is expected to slowly

26 REPORT TO LEGISLATURE ON THE PROGRESS OF THE FUNDING PLAN
RISKS FACING THE CALSTRS FUNDING PLAN
decline by a minimal amount for the next 10 years. At this time, this projected decline is not expected to have a material impact on long-term payroll projections.
In addition, a continued growth in the number of charter schools in California could also impact future membership levels since charter schools can choose whether or not they will participate in the Defined Benefit Program at the time of their creation. Although charter schools still represent a small portion of all schools in California, the recent trend of charter schools not electing to participate in CalSTRS could exacerbate this risk if it begins to materially impact the overall number of active members who participate in CalSTRS.
The most significant risk for the funding plan is investment risk—specifically, not meeting the assumed investment return. While the employer contribution rate is minimally impacted by investment returns, not meeting the assumed investment return is the biggest risk to the state contribution rate, followed by the risk of a decline in membership. Since the state contribution rate is most impacted by investment performance, returns significantly below the assumed 7 percent could result in the need for the board to increase the state’s contribution rate by the maximum 0.5 percent of payroll every year through 2046 and still not achieve full funding.
Such a situation could develop in various ways. CalSTRS could experience a sustained period of low returns or
CalSTRS could also experience another investment return “shock” like the one experienced during the 2007–2009 financial market crash. As a reminder, in 2007–08 and 2008–09, the CalSTRS investment portfolio sustained back-to-back years of negative returns of negative 4 percent and negative 25 percent. Recognizing the importance of mitigating against these types of equity market downturns, the board created and invested in a Risk Mitigating Strategies asset class starting in 2015.
Since the implementation of the funding plan, CalSTRS has regularly monitored the funding plan and these risks by providing annual updates to the board through the annual Review of Funding Levels and Risks report. The most recent report was presented in November 2018.
In addition to the risks highlighted above, another factor that could impact CalSTRS’ ability to reach full funding by 2046 is the maturity level of CalSTRS as a system, which can be measured by the ratio of active members to retirees. In general, as retirement systems become more mature, they are subject to increased volatility in the contributions needed to fully fund the benefits. The retirement of baby boomers has caused the active-to-retiree ratio to decrease over the last decade, which has increased the contribution volatility risk for CalSTRS. The volatility risk will continue to increase as the ratio continues to drop. The following chart shows the historical and projected active members-to-retirees ratio for CalSTRS.
0
1
2
3
4
5
6
7
19711977
19831989
19952001
20072013
20192025
20312037
2043
Act
ives
to
Ret
iree
s R
atio
CalSTRS Active Members-to-Retirees Ratio
Historical Projected

27RISKS FACING THE CALSTRS FUNDING PLAN
RISKS FACING THE CALSTRS FUNDING PLAN
As CalSTRS continues to mature as a retirement system, investment declines will be harder to absorb the later they occur, especially near the end of the funding plan in 2046, as there could be a very short amount of time between an investment loss and 2046.
One of the tools used to monitor these risks is CalSTRS’ asset liability management framework, which involves the use of a stochastic model to assess the impact of long-term investment performance on funding and contribution levels. Five thousand sets of Monte Carlo simulations are
performed annually based on the asset allocation and actuarial assumptions adopted by the board. For each simulation, the contribution rates, assets and liabilities for the Defined Benefit Program are projected for the next 50 years. This analysis has shown the funding plan has increased the likelihood full funding will be achieved and greatly reduced the probability of reaching low funding levels or even running out of money. The following chart shows the probability of CalSTRS running out of assets over the next 30 years.
As can be seen above, the funding plan has greatly strengthened the financial soundness of the Defined Benefit Program. Prior to the adoption of the funding plan, running out of money was a very real possibility. Today, that probability is very low. Of the 5,000 simulations that were performed, the system ran out of assets in only 2 percent of these simulations. Prior to the funding plan, the probability of running out of assets was about 50 percent. It is important to realize that the risk of running out of money may never be fully eliminated because of the maturity levels of the system, investment volatility and the board’s limited rate-setting authority. Similarly, achieving full funding by 2046 cannot be guaranteed. To illustrate this, a general idea of the range of possible future outcomes can be obtained by looking at percentiles of projected funding levels.
The chart on the next page shows the 25th, 50th and 75th percentile of the projected funded status. As can be seen, the 50th percentile for the funded status in 2046 is about 100 percent. Looking at it another way, it means the probability of reaching full funding in 2046 is about 50 percent. This has a lot to do with investment volatility. Even if the Defined Benefit Program were to be 100 percent funded in 2045, an investment return below the current assumed 7 percent in the last year before the end of the funding plan would likely prevent the Defined Benefit Program from reaching exactly full funding by 2046.
0%
10%
20%
30%
40%
50%
60%
Probability of Running out of Assets
Impact of CalSTRS Funding Plan
Current Funding Structure Prior to CalSTRS Funding Plan

28 REPORT TO LEGISLATURE ON THE PROGRESS OF THE FUNDING PLAN
RISKS FACING THE CALSTRS FUNDING PLAN
Looking at the 25th percentile, one can see how the investment volatility inherent in the asset allocation of the Defined Benefit Program could significantly impact funding levels. There is a 25 percent chance that funding levels will remain near current levels for most of the life of the funding plan and end up close to 70 percent by 2046. Similarly, looking at the 75th percentile, one can see there is also a 25 percent chance that full funding will be achieved in about 10 to 15 years with funding levels improving every year thereafter. Note that the compounded investment return over the 30-year period was about 5.5 percent for the 25th percentile and about 8.5 percent for the 75th percentile.
Once again, the three main risks facing the funding plan are longevity risk, risk of declines in membership and investment risk. It is important for a retirement system to acknowledge and understand that while the impact of these risks can be mitigated, these risks cannot be fully eliminated. As a result, it is important to have a funding structure in place that targets full funding while providing enough flexibility to respond to fluctuations caused by demographic and economic experience. While at this time, the funding plan provides such structure, if a situation were to develop that would prevent the Defined Benefit Program from reaching full funding, another funding solution may be necessary. Acting quickly will be key to minimizing potential costs long term and strengthening funding levels earlier.
0%
20%
40%
60%
80%
100%
120%
140%
20182022
20262030
20342038
20422046
Pro
ject
ed F
unde
d Sta
tus
Projected Funded Status (Based on Stochastic Modeling)
25th Percentile 50th Percentile 75th Percentile

29IMPORTANCE OF ACTING QUICKLY IF ANOTHER SOLUTION IS NEEDED
IMPORTANCE OF ACTING QUICKLY IF ANOTHER SOLUTION IS NEEDED
The funding plan was designed with the understanding that funding a pension plan involves risks. The funding plan provided the board with limited rate-setting authority as a mechanism to respond to unexpected demographic and economic events and to achieve full funding, while also providing rate stability for both employers and the state.
Although the funding plan is currently expected to provide enough rate-setting authority to achieve near-full funding by 2046, it is conceivable the system might reach a point where it is not sufficient. If such a situation develops, another solution may be necessary. Acting quickly will be key since providing additional contributions soon after a period of negative investment returns would improve the likelihood that CalSTRS is able to buy in at the bottom of the market and enjoy appreciation in asset values sooner. Acting quickly would then minimize long-term costs and strengthen funding levels sooner.
To demonstrate the importance of acting quickly, CalSTRS performed an analysis to determine where funding levels of the Defined Benefit Program would be today if contribution rates had been raised immediately following the 2008–09 financial crisis.
The analysis assumed that the employer contribution rate would have increased by 1 percent of payroll each year starting in 2009–10, and that the state contribution rate would have also increased by 0.5 percent of payroll each year starting in 2009–10. This is consistent with the existing rate-setting authority granted to the board. Member
contribution rates were kept the same and increased solely in accordance with the funding plan.
The starting point for this analysis was the June 30, 2007, annual actuarial valuation. In that valuation, on a market value of assets basis, the Defined Benefit Program was almost fully funded with a funded status of 97.1 percent. Beginning with fiscal year 2007–08, the Defined Benefit Program had two consecutive years of negative investment returns. The return in 2007–08 was negative 4 percent, while in 2008–09, the heart of the financial crisis, the investment return was negative 25 percent. As a result, funding levels dropped by almost 40 percent over two years, and the fund was projected to run out of assets within 30 years. If contribution rates had been adjusted by 1 percent per year for employers and 0.5 percent per year for the state immediately following these investment market downturns, the analysis shows that the system would be in a stronger financial position today, funded at about 70 percent instead of 64 percent.
Contribution rates for both the state and employers would also be at a level below those in place this fiscal year and would not be expected to increase any further. Today, both the state and employer contribution rates are expected to increase by at least another 2 percent of payroll over the rates in place this fiscal year. The chart on the next page compares current contribution rate projections to where they would be today had the contribution rates been adjusted immediately following the financial crisis.

30 REPORT TO LEGISLATURE ON THE PROGRESS OF THE FUNDING PLAN
IMPORTANCE OF ACTING QUICKLY IF ANOTHER SOLUTION IS NEEDED
The chart above clearly illustrates the power of compound interest and the importance of prefunding retirement benefits. By increasing contributions immediately following a decrease in funding levels, funding levels recover more quickly, and although contribution levels are higher in the short term, long-term contribution levels are lower, generating savings over time.
It also illustrates why, if a situation were to develop, acting quickly would be key to minimizing long-term costs and strengthening funding levels sooner.
0%
5%
10%
15%
20%
25%
FY 07-08
FY 09-10
FY 11-12
FY 13-14
FY 15-16
FY 17-18
FY 19-20
FY 21-22
FY 23-24
FY 25-26
FY 27-28
FY 29-30
FY 31-32
FY 33-34
FY 35-36
FY 37-38
FY 39-40
FY 41-42
FY 43-44
FY 45-46
Comparison of Projected Contribution RatesWhat If Rates Had Been Increased Starting in 2008−09
State Contribution Rate - “As-Is” State Contribution Rate - “What If”
Employer Contribution Rate - “As-Is” Employer Contribution Rate - “What If”
Funded Status as of June 30, 2018“As-Is” = 64%
“What-If” = 70%

31CONCLUSION
CONCLUSION
CalSTRS was founded in 1913 with 120 retired members and 15,000 active members. More than 100 years later, it is with steadfast focus and a sense of purpose that CalSTRS remains committed to its mission to secure the financial future of California’s educators and providing retirement, disability and survivor benefits to them and their families. These educators are found in every community throughout the state, preparing the next generation to contribute and make a difference in our society.
To ensure CalSTRS can fulfill its mission, it is important to focus on long-term sustainability. CalSTRS demonstrates its commitment to securing its members’ retirement futures and organizational sustainability in various ways. First and foremost, CalSTRS is committed to ensuring that member benefits are secure with an adequate funding structure in place.
To that end, CalSTRS has come a long way. Just five years ago, the fund was projected to run out of assets in about 30 years. Today, CalSTRS is financially stronger and better positioned to achieve full funding thanks to the adoption of the funding plan through AB 1469 in 2014.
As discussed in this report, the funding plan is working as intended. CalSTRS has a funding structure in place that is focused on full funding and provides enough flexibility to respond to fluctuations caused by demographic and economic experience. The funding plan is expected to eliminate all but a small portion of the UAO by 2046.
However, risks remain that could prevent the system from reaching full funding by 2046. While the risks related to longevity and decline in membership are real and important, the fact remains that the largest risk facing CalSTRS is the risk from investment volatility. This risk will continue to increase over time simply due to the natural maturing of the system. CalSTRS is committed to managing and monitoring these risks.
As trusted fiduciaries, CalSTRS continually monitors the financial health of the fund by assessing funding levels and
risks twice a year: once in the spring through the annual actuarial valuation process and again in the fall through the annual Review of Funding Levels and Risks report. Continuous monitoring of funding plan risks is key to being able to timely identify trends that could impact the long-term funding of the system.
Achieving long-term sustainability encompasses more than having an appropriate funding structure in place. It also means taking deliberate actions and making informed, accountable decisions that will ensure a fully sustainable organization.
Examples include implementing the CalSTRS Collaborative Model to bring more investments in-house to reduce associated fees and to model best practices in corporate governance, applying risk-mitigation policies, developing workforce succession plans, and deploying member education on retirement security. Across the spectrum of its activities, CalSTRS consistently advocates for the importance of long-term value creation. For more information on CalSTRS sustainability efforts, please refer to the CalSTRS website.
In 2019, the board will take on the very important task of reviewing the fund’s asset allocation to evaluate the most appropriate way to invest the system’s assets to best fulfill its mission. Also in 2019, CalSTRS will begin working on an experience study to review the appropriateness of the actuarial assumptions used in the funding of the system. Board decisions related to the asset allocation and actuarial assumptions are expected to occur in the fall of 2019 and winter of 2020.
This is the first report on the progress of the funding plan. As required by statute, CalSTRS will provide the next report to the Legislature no later than July 1, 2024. Until then, CalSTRS will continue to regularly educate and update stakeholders and the Legislature on the progress of the funding plan.

P.O. Box 15275Sacramento, CA 95851-0275800-228-5453CalSTRS.com06/19
Printed on recycled paper

APPENDIX D
CALSTRS 2019 REVIEW OF FUNDING LEVELS AND RISKS REPORT

[THIS PAGE INTENTIONALLY LEFT BLANK]

2019 Review of Funding Levels and Risks
Presented November 8, 2019

22019 REVIEW OF FUNDING LEVELS AND RISKS
EXECUTIVE SUMMARY
The California State Teachers’ Retirement System was founded in 1913 with 120 retired members and 15,000 active members.
More than 100 years later, CalSTRS remains committed to its mission to secure the financial future and sustain the trust of
California’s educators and provide retirement, disability and survivor benefits to them and their families.
To that end, CalSTRS has come a long way. Just five years ago, the fund was projected to run out of assets in about 30 years. Today, CalSTRS is financially stronger and better positioned to achieve full funding thanks to the 2014 adoption of the funding plan through Assembly Bill 1469.
CalSTRS continually monitors the funding plan and the financial health of the fund by assessing funding levels and risks twice a year: once in the spring through the annual actuarial valuation process and again in the fall through this annual report. As required by statute, CalSTRS is also required to provide a report to the Legislature every five years on the progress of the funding plan. The first progress report was completed and provided to the Legislature in June 2019.
The purpose of the CalSTRS Review of Funding Levels and Risks report is to assist the Teachers’ Retirement Board, stakeholders, policymakers and the public in assessing the soundness and sustainability of the CalSTRS Defined Benefit Program and to promote a better understanding of how well the funding plan is expected to achieve its goal in light of uncertainties related to investment risk, longevity risk, and risks related to payroll and membership growth.
This is the fourth annual edition of the CalSTRS Review of Funding Levels and Risks report. As shown in this year’s report, CalSTRS is slightly better positioned today
than last year thanks in part to additional supplemental contributions made by the State of California in July 2019 as part of the 2019–20 California State budget.
Key results and findings of this report include:
• Additional supplemental contributions by the state have improved projected funding levels and mitigated some of the expected increases in the state and employer contribution rates.
• The CalSTRS Defined Benefit Program continues to mature, which increases the system’s sensitivity to investment volatility, especially for the state contribution rate.
• The largest risk facing CalSTRS’ ability to reach full funding is risk from investment volatility.
• Decreases in the size of the active membership or lower than anticipated increases in future payroll could put significant strain on CalSTRS’ ability to achieve full funding, especially if combined with a period of lower investment returns.

32019 REVIEW OF FUNDING LEVELS AND RISKS
The CalSTRS Review of Funding Levels and Risk report provides the board and stakeholders information to assess the soundness
and sustainability of the system. To better understand the risks associated with funding the system, this report examines a range
of potential negative outcomes, both economic and demographic, that could endanger the long-term funding of the system and
prevent the system from reaching full funding.
INTRODUCTION
This report is based on the June 30, 2018, Annual Valuation of the Defined Benefit Program and reflects all relevant changes that have occurred since the valuation, including the 6.8 percent investment return reported for the 2018–19 fiscal year and the additional contributions made by the state as part of the 2019–20 California State budget to reduce the unfunded actuarial obligation and reduce both short- and long-term contribution rates.
In this report, the focus is on:
• Measures of plan maturity and how increasing maturity levels impact contribution rate volatility.
• The path to full funding, including a discussion of significant changes in the past year and their impact on long-term funding.
• Risks to long-term funding, including investment volatility, longevity risk and risks related to membership decline and future payroll growth.
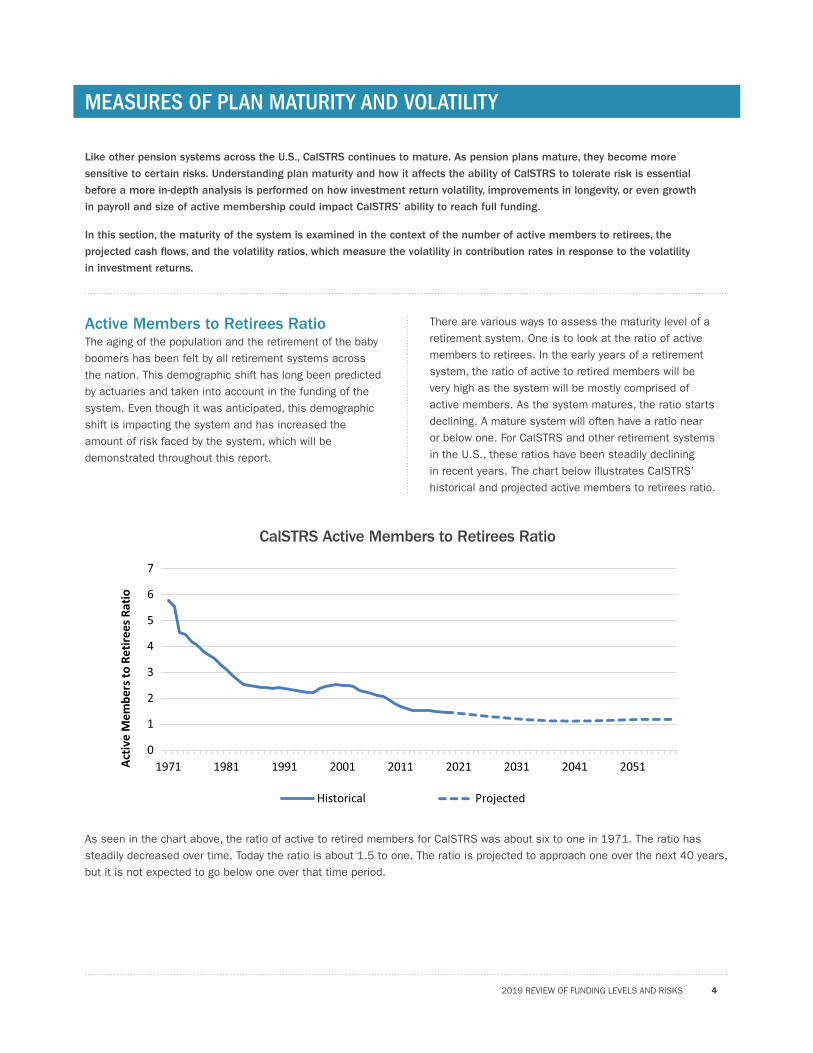
42019 REVIEW OF FUNDING LEVELS AND RISKS
MEASURES OF PLAN MATURITY AND VOLATILITY
Like other pension systems across the U.S., CalSTRS continues to mature. As pension plans mature, they become more
sensitive to certain risks. Understanding plan maturity and how it affects the ability of CalSTRS to tolerate risk is essential
before a more in-depth analysis is performed on how investment return volatility, improvements in longevity, or even growth
in payroll and size of active membership could impact CalSTRS’ ability to reach full funding.
In this section, the maturity of the system is examined in the context of the number of active members to retirees, the
projected cash flows, and the volatility ratios, which measure the volatility in contribution rates in response to the volatility
in investment returns.
Active Members to Retirees RatioThe aging of the population and the retirement of the baby boomers has been felt by all retirement systems across the nation. This demographic shift has long been predicted by actuaries and taken into account in the funding of the system. Even though it was anticipated, this demographic shift is impacting the system and has increased the amount of risk faced by the system, which will be demonstrated throughout this report.
There are various ways to assess the maturity level of a retirement system. One is to look at the ratio of active members to retirees. In the early years of a retirement system, the ratio of active to retired members will be very high as the system will be mostly comprised of active members. As the system matures, the ratio starts declining. A mature system will often have a ratio near or below one. For CalSTRS and other retirement systems in the U.S., these ratios have been steadily declining in recent years. The chart below illustrates CalSTRS’ historical and projected active members to retirees ratio.
As seen in the chart above, the ratio of active to retired members for CalSTRS was about six to one in 1971. The ratio has steadily decreased over time. Today the ratio is about 1.5 to one. The ratio is projected to approach one over the next 40 years, but it is not expected to go below one over that time period.
CalSTRS Active Members to Retirees Ratio

52019 REVIEW OF FUNDING LEVELS AND RISKS
– – – – – – – –
Note that the chart on the previous page was prepared assuming the number of active members would remain constant in the future at about 450,000. A decline in the CalSTRS active population could accelerate this trend and push the ratio below one. Similarly, if improvements in life expectancy end up being greater than the improvements currently built into the actuarial assumption, it would impact the active to retiree ratio and potentially bring the ratio closer to one over a shorter time period and even possibly below one.
Projected Cash FlowsThe cash flows for a retirement system are another good indicator of the maturity level of the system. As a pension plan matures, it is normal for benefit payments to exceed contributions coming into the system. Having negative
cash flows does not indicate the plan has been poorly managed. When pre-funding a pension plan, it is important to remember that the objective is to accumulate assets to pay benefits. Put another way, the objective of pre-funding is to ultimately create negative cash flows.
CalSTRS first experienced negative cash flows in 1999. The gap between contributions and benefits paid increased over time, peaking at about $6 billion in fiscal year 2013–14. With the passage of the funding plan and the increased contributions from members, the state and employers, the gap has narrowed the last few years. The following chart shows the projected cash flows for the CalSTRS Defined Benefit Program and Supplemental Benefit Maintenance Account combined.
MEASURES OF PLAN MATURITY AND VOLATILITY
In 2018–19, benefit payments exceeded contributions by about $3 billion. As seen on the chart above, CalSTRS is expected to have slightly positive cash flow in fiscal year 2019–20 due to the additional contributions made by the state as part of the 2019–20 Budget Act. Note that for accounting purposes, some of the additional contributions made by the state in July 2019 were recognized as 2018–19 contributions in CalSTRS financial statements. In fiscal year 2020–21, cash flows are expected to once again be negative and remain negative in perpetuity. Over time, the gap between benefits and contributions is expected to continue to increase, especially after 2046 when contribution rates for both the state and employers will revert to pre-funding plan levels.
Projected Cash Flows for CalSTRS

62019 REVIEW OF FUNDING LEVELS AND RISKS
MEASURES OF PLAN MATURITY AND VOLATILITY
The drop in the active to retiree ratio over the last decade has increased the contribution volatility risk for CalSTRS, and this volatility risk will continue to increase as the ratio continues to drop in the future.
One indicator of the contribution volatility is the Asset Volatility Ratio. The asset volatility ratio is the ratio of the market value of assets over the total payroll for active members. Plans with a high ratio will be subject to higher contribution volatility.
The asset volatility ratio for CalSTRS has increased significantly over the last 40 years. In 1975, the asset volatility ratio was at about one, meaning the assets of the plan were about the same size as the payroll. The size of the assets, when compared to payroll, has steadily increased over time. As of the most recent actuarial valuation, the asset volatility ratio was six. This is typical for a mature system like CalSTRS. This means that the contribution volatility is currently six times higher than it was in 1975. As shown on the chart below, the asset volatility ratio for CalSTRS is expected to continue to increase over time, reaching 11 by the end of the funding plan.
Even though negative cash flows are a natural state for any mature pension fund and must be taken into account as part of the asset liability management process of a pension plan, negative cash flows do not necessarily imply the system will have to sell assets to make benefit payments. Cash generated from investments such as coupons on bonds, rent on real estate, and dividends must be considered as well as the relative size of the cash flows compared to the total assets in the fund.
Today, enough cash is being generated from investment income to cover the gap. The gap between projected benefit payments and future contributions is expected to represent between 1 percent and 2 percent of the assets for the next 30 years. Cash generated by investments would have to be at least 2 percent of total assets to avoid having to sell assets to pay benefits. Over the last 30 years, cash generated by investments has averaged 2.7 percent.
Increasing VolatilityAs retirement systems become more mature, these systems are subject to increased volatility in the contribution rates needed to fully fund the benefits.
Historical and Projected Asset Volatility Ratio

72019 REVIEW OF FUNDING LEVELS AND RISKS
MEASURES OF PLAN MATURITY AND VOLATILITY
There are various reasons why the asset volatility ratio is projected to increase over time. One is expected improvements in funding levels. As of the June 30, 2018, actuarial valuation, the Defined Benefit Program was about 64 percent funded. If the system was 100 percent funded today, the asset volatility ratio would be close to 10. As additional contributions flow into the system as per the funding plan, the funded ratio will improve and move toward the target of being 100 percent funded. As a result, the asset volatility ratio will increase over time. In addition, the system has not yet reached its full maturity stage. As more members retire, we expect the asset volatility ratio to continue to increase slightly.
It is important to keep in mind that there is nothing to “fix” if the asset volatility ratio is high. A high asset volatility ratio simply indicates that there is more money invested for the plan—a good thing overall. It should, however, serve
as a reminder that the more money invested, the more of an impact investment gains and losses will have on the contribution levels needed to fully fund the system.
With the expected increases in asset volatility ratio over time, the funding risk of the system will be greater in 20 to 30 years than it is today, resulting in greater volatility in the level of contributions that would be needed to ensure the plan remains 100 percent funded over the long-term.
To help demonstrate this increased contribution volatility, the following chart displays the cost to eliminate, over a 30-year funding period, the unfunded actuarial obligation created from a 10 percent investment loss. Note that a 10 percent investment loss represents a return of –3 percent, or a return 10 percent less than the assumed 7 percent investment return. Over the last 20 years, the system has experienced a loss of this magnitude or worse on four occasions.
Estimated Increase in Contribution Rates to Fund a 10% Investment Loss
Further compounding contribution rate volatility is an aspect of the funding plan that is often overlooked. The fixed time frame for paying down the unfunded actuarial obligation by 2046 will result in a declining amortization period, increasing contribution volatility going forward. Today, the existing shortfall is amortized through 2046, over a period of 27 years. In 10 years, any remaining shortfall will be amortized over 17 years. If markets were to fall short of expectations in 20 years, the shortfall would have to be paid over a seven year period, requiring higher contributions than would normally be needed if the funding period was 30 years. As a result, the limited rate setting authority granted to the board is more likely to be insufficient in 20 years, following an economic downturn, as a result of the combined impact of the funding period shortening and maturity levels increasing

82019 REVIEW OF FUNDING LEVELS AND RISKS
PATH TO FULL FUNDING
One of CalSTRS’ main goals is to ensure a financially sound retirement system for California’s educators. Progress toward this
goal was made possible in 2014 with the passage of the CalSTRS Funding Plan. The funding plan set out a measured schedule
of contribution rate increases for members, employers and the state with the goal of achieving full funding by 2046. It also
provided the board with limited authority to adjust rates and ensure funding of the plan remains on schedule.
This section discusses the impact recent changes had on projected funding and contribution levels and highlights the reasons
why improvements in funding levels and changes in the unfunded actuarial obligation are expected to be minimal over the
next decade.
Another significant step toward full funding took place this year when additional supplemental contributions were sent to CalSTRS by the state as part of the 2019–20 California State budget. These supplemental payments were provided to CalSTRS to reduce both the state and the employers’ share of the unfunded actuarial obligation as well as to reduce the statutorily required increases in the employer contribution rate for the next two fiscal years.
Below is a table showing the additional contributions that were adopted as part of the 2019–20 California State budget.
Significant Changes in the Past YearCalSTRS took further steps toward achieving full funding in the past year. In May 2019, the board exercised its authority to increase the state contribution rate by the maximum allowed 0.5 percent of payroll. This was the third year in a row the board adopted an increase in the state contribution rate. Further increases are projected to be necessary to ensure the state’s share of the unfunded actuarial obligation is eliminated by 2046.
Fiscal Year
of Contribution
Additional Contributions for the State
($ in millions)
Additional Contributions on Behalf of Employers
($ in millions)
2019–-201 $1,117 $2,246
2020–-21 $8022 n/a
2021–-22 $61522 n/a
2022–-23 $34522 n/a
In July 2019, the state sent a payment of $2.246 billion to CalSTRS on behalf of employers. From this payment, $606 million is a pre-payment of employer contributions that will be used to lower the employer contribution rate for fiscal year 2019–20 from 18.13 percent of payroll down to 17.1 percent of payroll and to reduce the 2020–21 employer contribution rate from 19.1 percent of payroll down to 18.4 percent of payroll. The remaining $1.64 billion will be used to reduce the employers’ share of the unfunded actuarial obligation. Reducing the employers’ share of the unfunded actuarial obligation is expected to result in a lower employer contribution rate over the long term. It is estimated the additional $1.64 billion will result in an employer contribution rate that will be about 0.3 percent of payroll lower over the long term.
In July 2019, the state also contributed $1.117 billion to reduce the state’s share of the unfunded actuarial obligation. As shown in the table above, the state has indicated its intention to contribute an additional $1.762 billion over the next three years, for a total of about $2.9 billion, to reduce the state’s share of the unfunded actuarial obligation. The amount is subject
1 For accounting purposes, some of the additional contributions made by the state in 2019–20 were recognized as 2018–19 contributions in CalSTRS financial statements.
2 Estimate provided by the Department of Finance based on projected future revenues. Subject to change.

92019 REVIEW OF FUNDING LEVELS AND RISKS
PATH TO FULL FUNDING
Historical and Projected Funded StatusDefined Benefit Program—Actuarial Value of Assets Basis
to change and will be dependent on future revenues. Although the state will not see an immediate reduction in its contribution rate, the reduction in the state’s share of the unfunded actuarial obligation will translate into a lower state contribution rate over the long term. It is estimated that the additional contributions of $2.9 billion will lower the long-term state contribution rate by about 0.5 percent of payroll.
The impact of these additional contributions on both the funded status and on projected contribution rates are illustrated on the following charts and are reflected in the risk analysis performed later in this report.
Another event impacting funding levels and projected contribution rates was the investment performance for fiscal year 2018–19. In July 2019, CalSTRS reported a 6.8 percent investment return for 2018–19. As illustrated later in this report, investment performance can have a significant impact on projected contribution rates and funding levels, especially when these returns are significantly above or below the investment return assumption of 7 percent. Since the 2018–19 return
was just below the long-term assumed rate of return of 7 percent, it is expected to have a minimal impact on funding levels and projected contribution rates.
Overall, the 6.8 percent investment return for fiscal year 2018–19 is expected to decrease the June 30, 2019, funded status by about two tenths of one percent below where it was projected to be when the June 30, 2018, actuarial valuation was completed. However, the additional contributions made by the state in July 2019 will help improve funding levels. The June 30, 2019, funded status is now expected to be about one percent higher than projected when the June 30, 2018, actuarial valuation was completed. As a result, contribution rates for both the employers and the state will not have to increase as much as previously estimated.
The chart below shows the historical and projected funded status for the Defined Benefit Program which reflects the 6.8 percent return in the 2018–19 fiscal year as well as the supplemental contributions made by the state. It also assumes the fund will earn 7 percent annually thereafter.

102019 REVIEW OF FUNDING LEVELS AND RISKS
– – – – – – – – – –
PATH TO FULL FUNDING
The chart below shows the projected contribution rates that will be needed to achieve the projected funded status shown above. It also assumes the fund will earn 7 percent annually thereafter.
Projected Contribution RatesReflecting 6.8% Return in FY 2018-19 and Supplemental State Contributions
The employer contribution rate was minimally impacted by the 6.8 percent return, however the supplemental contributions made by the state on behalf of employers have directly reduced the employer contribution rates over the next two fiscal years, by 1.03 percent in 2019–20 and by 0.7 percent in 2020–21. Furthermore, the portion that went toward the employers’ share of the unfunded actuarial obligation has resulted in a decrease of about 0.3 percent of payroll in the long-term employer contribution rate compared to what was projected before the additional contributions.
For the state, the additional contributions made to pay down the state’s share of the unfunded actuarial obligation have decreased both the peak and the projected long-term state contribution rate by about 0.5 percent of payroll. However, as a result of the 6.8 percent investment return being below the assumed investment return of 7 percent, the projected state contribution rate will be about 0.1 percent of payroll greater than what it would have been had the return assumption been met. When combining the impact of both events, the projected peak and long-term state contribution rate is expected to be about 0.4 percent lower than what had been projected in May 2019 as part of the June 30, 2018, actuarial valuation.
Projected Unfunded Actuarial ObligationAlthough the system is currently on a path to full funding, it is important to understand how the unfunded actuarial obligation is expected to change over time.
When pension plans are less than 100 percent funded, contributions in excess of the normal cost are needed in order to pay down the unfunded actuarial obligation and to make progress toward being 100 percent funded. In order to ensure the unfunded actuarial obligation does not increase on a year-to-year basis, the payments toward the unfunded actuarial obligation have to be greater than the interest that will be accrued on the unfunded actuarial obligation. Failing to contribute an amount in excess of the interest will result in the unfunded actuarial obligation increasing from year to year. This is referred to as negative amortization. For CalSTRS, in order to avoid negative amortization, the payment toward the unfunded actuarial obligation has to be more than 7 percent of the unfunded actuarial obligation.
In fiscal year 2019–20, the contributions toward paying down the unfunded actuarial obligation were originally expected to represent 4.8 percent of the total unfunded actuarial obligation. With the addition of the state’s

112019 REVIEW OF FUNDING LEVELS AND RISKS
supplemental contributions, the total contributions toward the unfunded actuarial obligation are now expected to represent about 8 percent of the total unfunded actuarial obligation. As a result, the unfunded actuarial obligation is expected to slightly decrease next year. Below is a chart showing the projected unfunded actuarial obligation.
PATH TO FULL FUNDING
As shown above, the unfunded actuarial obligation is initially going to slightly decrease from $107 billion to about $106 billion as a result of the additional contributions made by the state as part of the 2019–20 California State budget. It is expected to continue to slightly decrease just below $106 billion for the following four years as the additional scheduled supplemental contributions toward the state’s share of the unfunded actuarial obligation are received. Once all the additional contributions have been provided to CalSTRS, the unfunded actuarial obligation will slowly increase since contributions are not expected to be sufficient to exceed 7 percent of the total unfunded actuarial obligation until the 2026–27 fiscal year. The unfunded actuarial obligation is expected to increase back to just above $106 billion by 2026 when it will start decreasing again, as payments beyond 2026 are expected to be more than 7 percent of the total unfunded actuarial obligation. Previously, it was expected to peak at about $111 billion without the supplemental contributions by the state.
Despite the fact the unfunded actuarial obligation is expected to remain near current levels through 2026, the funded status is projected to improve each year as the
Projected Unfunded Actuarial Obligation
growth in the total liabilities will be faster than the growth in the unfunded actuarial obligation, thus the unfunded actuarial obligation will represent a smaller percentage of the total liability.
Note that negative amortization is fairly common among public plans and is generally the result of the funding practice. For most public plans, contribution requirements are expressed as a percentage of the payroll. Historically, this has long been the preferred approach to provide budget stability. Because payroll is expected to increase over time, contribution amounts will increase as well, even if contribution rates remain stable.
For CalSTRS, payroll is assumed to increase annually at a rate of 3.5 percent. This means that payments toward the unfunded actuarial obligation will be larger in 20 years than they are today even if the contribution rates remain the same. It is important to note that contribution rates and CalSTRS’ ability to reach full funding could be negatively impacted in the future if payroll growth is less than 3.5 percent. This risk is discussed in more detail later in this report.

122019 REVIEW OF FUNDING LEVELS AND RISKS
PATH TO FULL FUNDING
Unallocated Unfunded Actuarial ObligationWhile the funding plan has helped improve the long-term sustainability of the system, there are limitations in the plan as prescribed by statute. The constraints in the rate setting authority provided to the board, as well as other provisions in the funding plan, mean the board cannot adjust contribution rates to pay for the entire unfunded actuarial obligation in place today.
Pursuant to statute, the state is responsible for any unfunded actuarial obligation related to benefits that were in effect on July 1, 1990. This responsibility applies to all service performed by CalSTRS members. The board can increase, if necessary, the state contribution rate by 0.5 percent of payroll each year to pay down the state’s share of the unfunded actuarial obligation.
The employers are responsible for any unfunded actuarial obligation that can be attributed to the new benefit structure, that is, any benefit increases on or after July 1, 1990—but that responsibility is limited to service accrued before July 1, 2014. Effective with fiscal year 2021–22, the board will be able, if necessary, to adjust the employer contribution rate by no more than 1 percent of payroll each year, never to exceed 20.25 percent of payroll, to pay down the employer’s share of the unfunded actuarial obligation.
Since the employer’s share of the unfunded actuarial obligation is limited to service earned prior to July 1, 2014, the board cannot adjust contribution rates for any unfunded
actuarial obligation that may develop for the new benefit structure and service accrued on or after July 1, 2014. The unfunded actuarial obligation related to post-1990 benefit increases and post-July 1, 2014, service is referred to as the unallocated unfunded actuarial obligation.
Since the start of the funding plan, a small unallocated unfunded actuarial obligation has developed resulting mostly from a combination of investment experience and changes made to the actuarial assumptions that were adopted by the board in February 2017. The size of the unallocated unfunded actuarial obligation is very small relative to the overall unfunded actuarial obligation since it is only for service after July 1, 2014. It was estimated to be $300 million as of June 30, 2018. Since the board cannot adjust contribution rates to pay for the unallocated unfunded actuarial obligation, it is projected to increase to almost $600 million by 2046 due to interest alone. Because of the unallocated unfunded actuarial obligation and the constraints around the board’s rate setting authority, the system is projected to be 99.9 percent funded by 2046.
The unallocated unfunded actuarial obligation could increase significantly if investment returns fall well below the assumed 7 percent. Similarly, it could be eliminated if investment returns exceed 7 percent over the long term. If the unallocated unfunded actuarial obligation were to be funded on an actuarial basis with a funding target of June 30, 2046, additional contributions of 0.04 percent of payroll would be required effective July 1, 2019.

132019 REVIEW OF FUNDING LEVELS AND RISKS
THE RISK ENVIRONMENT
Investment Risk
Investment return volatility is the greatest risk facing CalSTRS today. As the system continues to mature over time, investment returns will have a greater impact on the funding of the system than they currently do. When investment returns are below expectations, the unfunded actuarial obligation increases and additional contributions are needed to bridge the gap. With the passage of the funding plan, the board can increase contribution rates for the state and employers within the limitations established in statute in order to eliminate the unfunded actuarial obligation by 2046.
As one looks at investment risk, it is important to understand that even though employers are responsible for the greatest share of the existing unfunded actuarial obligation, the state’s share of the unfunded actuarial obligation is most likely to materially increase or decrease as a result of economic and demographic experience. This is a direct result of the rules set in the funding plan. As per these rules, the state is currently responsible for about 80 percent of CalSTRS’ overall actuarial obligation and the assets that support them. As a result, CalSTRS’ ability to reach full funding following a period of low investment return will be directly related to the ability of the board to increase the state contribution rate to the necessary levels.
In May 2019, the CalSTRS Investment Committee approved a new set of capital market assumptions. This was a key step in the larger Asset Liability Study, which is conducted every four years, and is expected to result in the selection of a new asset allocation in November 2019. Updating the capital market assumptions allows CalSTRS to better reflect changes in the investment environment and recalibrate the CalSTRS Asset Liability Management
Framework to be in line with future expectations. These new capital market assumptions are reflected in the analysis presented in this section.
This section updates several of the stress tests and risk measures related to investment return volatility that were performed in last year’s 2018 report. In general, the analysis shows slight improvements in both the capacity to withstand stress and the risk measures, which reflects the improved funded status due primarily to the supplemental contribution made by the state as part of the 2019–20 California State budget. It is important to emphasize that over the long term, as the expiration of the funding plan approaches, CalSTRS’ capacity to withstand economic stresses will be limited despite expected increases in funding levels.
Risk of Sustained Low ReturnsThe first stress test determines how the funding of the system would be impacted by a sustained period of investment returns below the expected return. Specifically, this analysis examines the impact of earning a 10th percentile compounded return over a 5-year, 10-year and 15-year period.
Since 1985, the worst five year compounded return the system has ever earned was the period from 2007 through 2012 when the compounded return over that period was 0.1%. During the period between 2000 through 2010, the portfolio returned its worst 10-year compounded return which was about 2.4 percent. The worst 15-year period occurred from 2000 through 2015 when the average compounded return was 5.5 percent. Based on the current asset allocation and the capital market assumptions adopted by the board in May 2019, the 10th percentile return over a 5-year period is 0.5 percent. For a 10-year period, the 10th percentile return is about 2.5 percent and for a 15-year period it is about 3.25 percent.
This section examines several risks—investment risk, membership and payroll growth risk, and longevity risk—that could pose
challenges to CalSTRS’ ability to reach full funding by 2046. In order to understand the extent of the risks faced, several stress
tests were performed to determine the impact on funding levels and the ability of the funding plan to withstand and recover from
these stress scenarios. It is important to note that although each risk was examined in isolation, the system has the potential to
face these challenges in combination, which could have a compounding effect.

142019 REVIEW OF FUNDING LEVELS AND RISKS
The following chart shows the projected impact on the funded status of the system following a period of sustained low investment returns based on the 10th percentile return. For each scenario it was assumed that the board would exercise its authority to increase contribution rates in response to the investment experience.
As seen in the chart above, in all three scenarios the sustained periods of low returns would prevent the system from reaching full funding by 2046. This analysis illustrates one of the key risks inherent with the funding plan—the fact that the plan expires after 2046. In all three scenarios, the system improves funding levels and recovers from the lowest funding level but each time falls short of full funding by 2046.
Since the state bears most of the responsibility when it comes to having to contribute more following investment performance below expectations, in all three scenarios the state contribution rate would have to increase each year by the maximum 0.5 percent of payroll allowed to a peak rate of 20.8 percent in fiscal year 2045–46. Even with these increases, funding levels do not fully recover by 2046. In these three test scenarios, higher contributions or a longer funding period would be needed to achieve full funding.
Risk of a “Shock” in a Single YearFollowing the financial market crash in 2008–09, the funded status of the system dropped by more than 30 percent in a single year, resulting in the need for the funding plan to avoid a future depletion in assets.
CalSTRS remains at risk if another investment return shock were to occur in the future. The impact of a decline will also depend greatly on the timing. As the system continues to mature, investment declines will be harder to absorb the later they occur in the duration of the funding plan. Over the next decade with funding levels expected to remain below 70 percent, a large shock could have a drastic impact on the long-term funding of the system, which brings additional risks, including a political risk of low funding levels.
THE RISK ENVIRONMENT
Impact of Sustained Low Returns on Funded Status(Based on the 10th Percentile Return)

152019 REVIEW OF FUNDING LEVELS AND RISKS
−7.5 % Shock Return −21% Shock Return
Timing of Shock Funded Status After Shock Funded Status in 2046 Funded Status After Shock Funded Status in 2046
In 5 Years 51% 91% 51% 78%
In 10 Years 65% 88% 54% 71%
In 20 Years 75% 84% 61% 67%
Based on the current asset allocation and the capital market assumptions adopted by the board in May 2019, there is a 5 percent probability that in any given year the investment return will be –12 percent or worse. The following chart shows the impact a –12 percent investment return in a single year would have on the system if it were to occur 5, 10 or 20 years from now. To conduct this stress test, it was assumed that the fund would earn 7 percent in every year except for the year of the shock. Once again, the funded status was projected assuming the board exercises its authority to increase contribution rates.
THE RISK ENVIRONMENT
Once again, the above projections assumed financial markets would provide a return of 7 percent in all other years. It is also worth highlighting that if funding levels are at or below 70 percent in 2046, the system would once again be projected to run out of assets over the following 30 to 40 years. To avoid this situation, the resulting unfunded liability would need to be addressed, through higher contributions or through a longer funding period.
Impact of an Investment Shock on Funded Status(Impact of a −12% Return)
As shown in the chart above, the timing of the shock greatly influences the funded status at the end of the funding plan. If the shock were to occur five years from now, funding levels would drop to just below 60 percent but would have time to increase back to almost 90 percent by 2046. If the shock were to occur 20 years from now when funding levels are almost 90 percent, funding levels would drop to close to 70 percent but would not have time to recover as much and would be below 80 percent by 2046. The chart also shows that in all three cases, following the end of the funding plan, the funding levels would be expected to slightly decline each year in the future. The impact of shocks with a 1 percent and 10 percent probability were also analyzed. Based on the current asset allocation, there is a 10 percent probability that returns in a single year will be −7.5 percent or lower and a 1 percent probability the returns will be −21 percent or lower. The following table shows the projected funded status in the year following the shock as well as the projected funded status in 2046.

162019 REVIEW OF FUNDING LEVELS AND RISKS
THE RISK ENVIRONMENT
Impact of Long-Term Investment PerformanceThe analyses above focused on deterministic scenarios in which the expected return of 7 percent was met in most years. In practice, it is unlikely that the system will have a return of exactly 7 percent in any year due to year-to-year volatility. To better understand this volatility, a stochastic model was used to generate 5,000 sets of Monte Carlo simulations based on the current asset allocation and the capital market assumptions adopted in May 2019.
Each of these 5,000 simulations represent a hypothetical future set of returns that are reasonable given the assumptions. For each simulation, the assets and liabilities for the system were projected for the next 30 years. With this information it is possible to assess the impact of long-term investment performance and volatility on the funding levels.
The following chart shows the 25th, 50th and 75th percentile of the projected funded status for the Defined Benefit Program. Note that the compounded investment return over the 30-year period was just under 5.75 percent for the 25th percentile and just above 8.7 percent for the 75th percentile.
The goal of these stochastic simulations is to provide a realistic estimate of the range of possible future outcomes. In this report, projected funding levels have improved slightly from what was expected in the previous report due to the supplemental contribution by the state as part of the 2019–20 California State budget. As such, the projected funded status has improved from the previous report, reaching slightly above 100 percent by 2046 under the 50th percentile.
The stochastic analysis also shows that the range between the 25th and 75th percentiles is quite large, illustrating the volatility expected in funding the system. Ideally, this range would be tightly bound around a scenario reaching 100 percent by 2046. The size of this range is heavily influenced by both the structure of the funding plan, in particular how quickly contributions can be increased to make up for shortfalls, as well as the volatility of the simulated investment return scenarios.
Projected Funded Status(Based on Stochastic Analysis)

172019 REVIEW OF FUNDING LEVELS AND RISKS
THE RISK ENVIRONMENT
Risk MeasuresThe previous funding levels and risk reports introduced a series of risk measures that focus on risks related to funding levels and contribution levels. These measures were re-assessed for this report using the same 5,000 Monte Carlo simulations described earlier and reflecting changes that took place in the last year. These measures are intended to assess three main risks:
• Ability of achieving full funding
• Risk of low funding levels
• Risk of high state contribution rates
Although achieving 100 percent funding is the long-term goal, it is important to ensure progress toward being fully funded is always made. With the board’s ability to adjust contribution rates under the funding plan, it is expected that the system will make progress toward full funding, even if investment returns are below expectations. To that end, the chart above also shows the probability that the system will attain either an 80 percent or 90 percent funding level by 2046.
Probability of Achieving Full FundingThe first risk measure studied in this report is the probability of achieving a 100 percent funded status by 2046, the target set in the funding plan. As a result of the volatility inherent in CalSTRS’ asset allocation, there is a chance that the system may not achieve full funding by 2046 due to the possibility of having long-term investment performance below the assumed 7 percent.
The impact of investment volatility on the ability for the system to achieve full funding is illustrated in the following chart. For comparison, the chart also shows the probabilities of achieving full funding from last year’s 2018 report as well as assuming the funding plan had never been adopted. As the chart illustrates, the system has experienced small improvements in this risk measure over the last year due primarily to the supplemental contribution made by the state. In fact, the Defined Benefit Program is now projected to achieve full funding by 2046 in over half of the 5,000 hypothetical scenarios.
Probability of Achieving Higher Funding Levels by 2046

182019 REVIEW OF FUNDING LEVELS AND RISKS
As shown in the chart on the previous page, the funding plan has greatly reduced the funding risk facing the system with probabilities of reaching higher funding levels having more than tripled with the passage of the funding plan. Although the probabilities have improved greatly, the probabilities are less than 100 percent. It is important to realize these probabilities are not expected to ever reach 100 percent as a result of the investment volatility inherent in an asset allocation with an expected return of 7 percent and the board’s limited rate setting authority.
THE RISK ENVIRONMENT
The chart above shows the probability of the system running out of money, that is, dropping to zero percent funded. Before the passage of the funding plan, running out of assets was a very likely scenario. Today, that probability is very low. Of the 5,000 simulations that were performed, the system ran out of assets in less than 2 percent of these simulations. Without the funding plan, the probability of running out of assets would be more than 50 percent.
Although improved slightly from the prior year, the probability of falling below 60 percent or even 50 percent funded is still quite large. This is driven mostly by the current funding level of the system and the fact short-term contributions toward the unfunded actuarial obligation are not expected to be sufficient to cover the interest on the unfunded actuarial obligation, as was discussed earlier in the report. In May, the board was informed that the funded status was 64 percent as of June 30, 2018. Although the supplemental contribution made by the state has increased funding levels by about one percent, it would take only one or two years of lower than expected returns in the near term to push the funded status below 60 percent or even below 50 percent.
Probability of Low Funding LevelsThe second risk measure being studied is the probability of the system reaching low funding levels or even running out of money. The risk has been reduced considerably with the adoption of the funding plan. However, that risk has not been eliminated and may never be fully eliminated as a result of the maturity level of the system, investment volatility and the board’s limited rate setting authority.
The following chart shows the probability of low funding levels over the next 30 years.
Probability of Low Funded Status Over the Next 30 Years

192019 REVIEW OF FUNDING LEVELS AND RISKS
THE RISK ENVIRONMENT
Probability of High Contribution RatesThe last risk measure relates to the probability of seeing high contribution rates for the state. Because of the 20.25 percent cap on the employer contribution rate and the fact that the state’s share of the unfunded actuarial obligation is most likely to materially increase or decrease as a result of economic and demographic experience, only the state contribution rate is being analyzed in this section.
The state contribution rate can increase each year by no more than 0.5 percent of payroll with no limit on the actual rate. In May 2019, the board exercised its authority to increase the state’s supplemental rate by 0.5 percent to 5.811 percent of payroll for the 2019–20 fiscal year. This supplemental rate is in addition to the state base rate of 2.017 percent of payroll to fund Defined Benefit Program benefits. The state also contributes an additional 2.5 percent of payroll to fund the Supplemental Benefit Maintenance Account, CalSTRS’ inflation protection program.
In fiscal year 2019–20, the state pays 7.828 percent of payroll to fund its share of the unfunded actuarial obligation of the Defined Benefit Program and 2.5 percent to SBMA. For each future fiscal year through 2045–46, the board will have the ability to adjust the Defined Benefit Program contribution rate by up to 0.5 percent each year if needed to eliminate the state’s share of the unfunded actuarial obligation by 2046. As a result, the highest rate the state could be required to pay to the Defined Benefit Program is a rate of 20.828 percent of payroll in fiscal year 2045–46.
The following chart provides probabilities for the state contribution rate to reach certain levels as a percentage of payroll over the next 30 years. For context, the state’s contribution rate is currently projected to peak at 8.8 percent of payroll. The rates do not include the 2.5 percent toward SBMA.
Probability of High State Contribution RateOver the Next 30 Years

202019 REVIEW OF FUNDING LEVELS AND RISKS
THE RISK ENVIRONMENT
Membership and Payroll Growth RiskOne of the key actuarial assumptions in the funding of the system is the assumed growth in payroll. The current payroll growth assumption adopted by the board is 3.5 percent annually. Implicit in this assumption is that the number of active members in the system will remain stable over time. Note that even if the number of active working teachers remains stable over time, CalSTRS’ total membership is expected to continue to grow. In fact, as the ratio of active members to retirees continues to drop, CalSTRS’ total membership is expected to increase by at least 150,000 members over the next 30 years.
Contribution rates and projected funding levels could be impacted if there was a sudden material shift in CalSTRS active membership or if payroll growth increased at a rate lower than assumed. When the payroll of CalSTRS active members either declines or increases slower than anticipated, it requires increases in contribution rates to ensure full funding, even if the unfunded actuarial obligation has remained the same. The overall cost to fund retirement benefits is not increasing and the contributions required to eliminate the unfunded actuarial obligation are still the same in dollar terms. However, since contributions are collected as a percentage of payroll, contribution rates need to increase to collect the same dollar amount. There is a risk that the rate setting limitations combined with declines in payroll could prevent the board from being able to set contribution rates to the levels necessary to ensure full funding.
Similarly, faster than expected growth in payroll and active membership could help the long-term funding of the system, resulting in lower contribution rates. When the funding plan was adopted by the Legislature in June 2014, the June 30, 2013, actuarial valuation was used as the basis for determining the contribution rates needed to
achieve full funding. At the time, the payroll was projected to increase at a rate of 3.75 percent per year. Since the passage of the funding plan, total payroll has increased at a rate of about 4.6 percent per year, resulting in a total payroll that is greater than projected back in 2014. This is the main reason why the employer contribution rate is projected to be lower long term than originally anticipated in the funding plan.
Future payroll growth could be lower than anticipated for various reasons. In the past, recessions have generally resulted in either slower payroll growth or reductions in payroll. Declines in the California student population could result in a reduction in the number of teachers. Based on the most recent student projection prepared by the California Department of Finance, the overall student population of California is expected to slowly decline by a minimal amount for the next 10 years. A continued growth in the number of charter schools in California could also impact future membership levels since charter schools can elect whether or not to participate in the CalSTRS Defined Benefit Program at the time of their creation. Another possibility is a shift in technology and the way education is delivered in California. For example, increased offering of online courses could potentially decrease the need for teachers in the classroom, especially at the community college level.
Of the above risks, a slower growth than anticipated in the total payroll could have the most impact on the ability of CalSTRS to reach full funding, especially if caused by a recession that combines both declines in payroll and lower investment returns. Although charter schools still represent a small portion of all schools in California and do not yet pose an issue, recent trends in charter schools not electing CalSTRS could eventually pose an issue. These two risks are discussed in further detail below.

212019 REVIEW OF FUNDING LEVELS AND RISKS
THE RISK ENVIRONMENT
The above table shows the impact of a long-term slower growth in payroll. Payroll is still increasing year after year but at a slower rate than assumed. The ability to reach full funding could be further impacted if payroll decreased. Historically, payroll has often declined over a short time period when staffing levels in schools were reduced during periods of severe and prolonged fiscal troubles. For example, following the 2008–09 global financial crisis, the number of active CalSTRS members decreased by about 45,000 over a five-year span. Today, the number of active members in the system has yet to recover to the levels seen in 2008.
If a similar decline were to occur once again following a recession, contribution rates would have to increase for both employers and the state simply to be able to keep collecting the same amount of contributions to eliminate the unfunded actuarial obligation by 2046. Depending on how quickly a reduction in staffing occurred and how large it would be, the rate setting authority granted to the board may be insufficient to reach full funding by 2046. In addition, increases in the supplemental rate during a time when employers and the state are attempting to cut costs could lead to a further decrease in staff, potentially exacerbating the problem further.
Future Payroll GrowthLong-Term State
Contribution RateLong-Term Employer Contribution Rate
2046 Funded Status
3.50% 8.3% 18.0% 100%3
3.25% 8.4% 18.4% 100%3
3.00% 8.5% 18.9% 100%3
Risk Related to Payroll Growth and Decline in Active MembershipThe current payroll growth assumption adopted by the board is 3.5 percent annually. To the extent future growth is lower, contribution rates will have to increase to reach full funding by 2046. Below is a table comparing the long-term contribution rates that are expected to be needed to eliminate both the state and employers’ share of the unfunded actuarial obligation by 2046 assuming future payroll growth is 3.5 percent, 3.25 percent and 3 percent.
3 Due to the unallocated unfunded actuarial obligation, the Defined Benefit Program is expected to be 99.9 percent funded in 2046.

222019 REVIEW OF FUNDING LEVELS AND RISKS
THE RISK ENVIRONMENT
Scenario (Projection of Active Membership)
Decrease in Membership
Average Investment Return Over the Time Period
2046 Funded Status
No reduction in active population 0 7% for all years 100%4
2% reduction per year for 5 years 45,000 3.5% for next 5 years, followed by 7% 89%
5% reduction per year for 5 years 101,000 3.5% for next 5 years, followed by 7% 74%
2% reduction per year for 10 years 85,000 5.0% for next 10 years, followed by 7% 80%
Scenario (Projection of Active Membership) Decrease in Membership 2046 Funded Status
No reduction in active population 0 100%4
2% reduction per year for 5 years 45,000 99%
5% reduction per year for 5 years 101,000 92%
2% reduction per year for 10 years 85,000 97%
The following table shows how various decreases in active membership would impact the ability for CalSTRS to reach full funding by 2046. For the purposes of these projections, the number of active members was assumed to remain stable following the initial decline.
As can be seen in the table above, a sustained period of decreases in membership combined with lower investment returns would greatly impact CalSTRS’ ability to reach full funding. If such a scenario were to occur, only a strong economic recovery or additional contributions would allow CalSTRS to reach full funding by 2046.
Recent Growth in Charter Schools Not Electing CalSTRSWhen a charter school is created, it must decide as part of the chartering process whether or not to provide CalSTRS benefits to its employees. Since the passage of the funding
In each of the above scenarios where the active population decreases, the limitations imposed by statute would prevent the board from increasing the employer contribution rate to the levels necessary to pay down the employers’ share of the unfunded liability by 2046. The same issue does not exist for the state contribution rate since it does not have an upper bound. The board would have sufficient authority in each of the scenarios to raise the state contribution rate to levels high enough to eliminate the state’s share of the unfunded liability by 2046, despite the decreases in payroll.
Once again, it is important to emphasize that if CalSTRS active membership were to significantly decline, it would not increase the unfunded actuarial obligation. It would simply reduce CalSTRS’ ability to fund that obligation and potentially prevent CalSTRS from reaching full funding by 2046.
Note that the above table reflects only the anticipated impact of a decline in active membership. During recessions, investment returns are often lower than in periods of economic growth. Having lower investment performance combined with a decline in active membership would compound the impact of these events, making it even harder for CalSTRS to reach full funding, unless an economic recovery occurred shortly thereafter, returning membership and payroll levels to be in line with what they are today.
Below is a table showing the impact of both a decline in membership and lower investment returns. Investment returns averaging 3.5 percent over five years and 5 percent over 10 years were selected for this analysis.
4 Due to the unallocated unfunded actuarial obligation, the Defined Benefit Program is expected to be 99.9 percent funded in 2046.
plan, the percentage of newly created charter schools not electing CalSTRS has been above historical levels. Prior to the funding plan, about 90 percent of all charter schools had elected CalSTRS. Since the passage of the funding plan, the percent of charter schools not electing CalSTRS has increased, reaching a peak of 40 percent in 2017–18.

232019 REVIEW OF FUNDING LEVELS AND RISKS
– – – – – – – – – –
THE RISK ENVIRONMENT
The following chart shows the percentage of charter schools that elected to participate and not participate in CalSTRS for the last 10 years.
Note that in last year’s 2018 report, it was reported that more than 50 percent of new charter schools had not elected CalSTRS in fiscal year 2017–18. In an attempt to have a more accurate and comprehensive database of information on charter schools, in 2018–19 CalSTRS took steps to formalize its collaboration with the California Department of Education to better understand their process and the data elements available. CalSTRS staff also partnered directly with charter school administrators in order to collect more details regarding the types of retirement benefits offered by all charter schools in California. With the completion of this effort, CalSTRS has developed a more comprehensive database of information on charter schools, providing CalSTRS a better understanding of the chartering process and the selection of retirement benefits made by each charter schools. The chart above reflects the most up-to-date information available to CalSTRS.
As of June 2019, there were 1,278 charter schools in operation in California. Of these, 1,121, or about 88 percent, had elected CalSTRS while 157 charter schools, or about 12 percent, had not elected CalSTRS. Based on the most recent information available from the California Department of Education, charter school employees were estimated to number about 34,000.
Selection of Retirement Benefits by New Charter Schools
Of these, about 30,000 currently participate in CalSTRS while about 4,000 do not participate in CalSTRS. Overall, teachers and administrators working for charter schools not covered by CalSTRS represent a population that is equivalent to about 1 percent of CalSTRS active membership.
If all these charter schools had instead elected to provide CalSTRS benefits to their employees, the payroll for CalSTRS active members would probably be 1 percent higher today. If the total payroll was 1 percent higher, contribution rates required for both the state and the employers to fully fund their share of the unfunded actuarial obligation by 2046 would be projected to be lower. For employers, the contribution rate would be lower by about 0.17 percent of payroll starting in fiscal year 2021–22. For the state, the contribution rate would be lower by about 0.08 percent of payroll. Note that for the state, the amount needed to eliminate their share of the existing unfunded actuarial obligation would not be impacted and the dollar impact on the overall state’s budget would be unchanged.
CalSTRS will continue to monitor this risk and will provide updates on the charter school population annually as part of this report.

242019 REVIEW OF FUNDING LEVELS AND RISKS
THE RISK ENVIRONMENT
Longevity RiskLongevity risk refers to the risk borne by the system from increasing life expectancy of its members. Compared to investment risk, in which a shock in a single year can have a significant and lasting impact, longevity risk is a slowly developing demographic phenomenon that will potentially take decades before it is recognized. Longevity improvements historically have occurred with incremental improvements in public health and advancement in medical technology, and these changes take time to impact whole populations.
Despite the slow nature of longevity risk, it is important that it is not ignored. In February 2017, the board took an important step by adopting assumptions that recognize
that teachers’ life expectancies have been increasing over time and will most likely continue to do so in the future. CalSTRS adopted the use of generational mortality using a mortality improvement factor of 1.1 percent in each year for most ages.
The chart below shows how life expectancy for a CalSTRS member retiring at age 62 has changed over time. These life expectancies are a static snapshot of mortality for each year and do not consider any future improvements in mortality. As shown below, over the past 30 years, the life expectancy for a 62 year old retiree has improved by over two years for both male and female.
How Has Life Expectency Changed?
With the adoption of generational mortality, CalSTRS is anticipating future improvements in life expectancy in the funding of the system. This assumption has strengthened the ability of CalSTRS to reach full funding by 2046 by recognizing ahead of time potential improvements in life expectancy. The following chart illustrates the impact generational mortality has on life expectancy. The first pair of bars illustrate the life expectancy for an age 62 retired member, for both male and female, under the most recent static mortality table. Without consideration for future improvements in life expectancy, males are expected to live to about age 86 and females to age 89. The middle bars illustrate the improvements in life expectancy that are expected through the use of generational mortality. As shown below, by assuming improvements in mortality going forward it is anticipated that an age 62 retiree will live an additional two years for both males and females. Looking ahead into the future, as mortality continues to improve, it is anticipated that by 2046 a retiree who is 62 in that year will be expected to live to almost 93 for females and over 90 for males, a full two years more than someone retiring today.

252019 REVIEW OF FUNDING LEVELS AND RISKS
THE RISK ENVIRONMENT
How Does Generational Mortality Impact Life Expectancy?
When considering that CalSTRS paid over $15 billion in benefits in fiscal year 2018–19, one can see how improvements in life expectancy have a direct impact on long term cost. A member retiring at age 62 today is expected to collect benefits for four to five years longer than someone who retired at age 62 in 1990. In terms of benefits paid by CalSTRS today, this is equivalent to an additional $60 billion to $75 billion in benefits. A member retiring at age 62 in 2046 is projected to live two to three years longer than someone retiring at age 62 today.
Monitoring life expectancy of CalSTRS members is extremely important for the long-term sustainability of the system, and CalSTRS actuarial staff monitors changes on an annual basis. In addition, a full review of all actuarial assumptions is performed every four years through the experience study. The next experience study is expected to be completed and presented to the board in January 2020.
Note that in recent years, CalSTRS has experienced a slowdown in mortality improvement, particularly among its male members. Life expectancy is still improving but not as fast as assumed. It is important not to read too much into short term trends. Over the past 30 years, periods in which mortality improvements slowed down were often followed by periods of faster improvements. Over the last 30 years, the average mortality improvement for CalSTRS members has been over 1.3 percent per year. Over the last century,
mortality rates have improved on average at a rate of about 1 percent per year for the U.S. population, consistent with the assumption of 1.1 percent adopted by the board.
If mortality rates improve faster than assumed, costs will increase over time, and the improvements may also impact CalSTRS’ ability to reach full funding by 2046. Currently, it is estimated that the funding plan has enough flexibility to sustain mortality improvements of up to 2 percent per year on average.
CalSTRS has developed a stochastic mortality model in an attempt to understand how likely it is that mortality rates will improve above the current assumptions given the historical data. Initial results from this model suggest that CalSTRS would have less than a 5 percent chance that mortality rates would improve by more than 2 percent per year, each year into the future.
Although it appears that the likelihood of not being able to reach full funding is low when looking at longevity risk alone, a combination of faster than expected increases in longevity combined with a sustained period of decline in membership and low investment returns could have an undesirable impact on the long-term funding of the system. CalSTRS will continue to monitor mortality improvements annually and report back its findings as part of this report.

262019 REVIEW OF FUNDING LEVELS AND RISKS
CONCLUSION
CalSTRS has several ways to manage and monitor these risks.
CalSTRS continually monitors these risks and reports to the board twice a year on the funding progress of the system: once in the spring through the annual actuarial valuation process and again in the fall through this report. Monitoring these risks is important to identify trends that could impact the long-term funding of the system early and to ensure they are understood by the board and CalSTRS stakeholders.
In 2017–18, CalSTRS created an internal Asset Liability Management team and implemented an ALM Framework that integrates assets and liabilities in order to manage
and assess funding risk. The ALM Framework was established as a tool to help guide future board decisions related to investment strategy, cash management and actuarial policies.
The board is currently in the process of reviewing the asset allocation to decide the most appropriate way to invest the assets long-term to best fulfill CalSTRS mission. Furthermore, CalSTRS’ actuarial consultant, Milliman, is working on an experience study to review the appropriateness of the actuarial assumptions used in the funding of the system. Board decisions related to the asset allocation and actuarial assumptions are expected to occur in November 2019 and January 2020.
This report discussed a variety of risks associated with the funding of the system. Even if the Defined Benefit Program is on a
path to reach full funding, significant risks remain that could prevent the system from reaching full funding by 2046. Although
the risks related to longevity and risks related to membership decline and future payroll growth are real and important, the fact
remains that the largest risk facing CalSTRS is risk from investment volatility. This risk will continue to increase over time simply
due to the natural maturing of the system.

APPENDIX E
DEFINED BENEFIT PROGRAM OF THE CALIFORNIA STATE TEACHERS’ RETIREMENT SYSTEM JUNE 30, 2018 ACTUARIAL VALUATION

[THIS PAGE INTENTIONALLY LEFT BLANK]

Milliman Actuarial Valuation
Issued April 23, 2019
Defined Benefit Program of the California State Teachers’ Retirement SystemJune 30, 2018 Actuarial Valuation
Prepared by:
Nick J. Collier, ASA, EA, MAAAConsulting Actuary
Mark C. Olleman, FSA, EA, MAAAConsulting Actuary
Julie D. Smith, FSA, EA, MAAAConsulting Actuary
Milliman, Inc.1301 Fifth Avenue, Suite 3800Seattle, WA 98101-2605Tel +1 206 624 7940milliman.com

This work product was prepared solely for CalSTRS for the purposes described herein and may not be appropriate to use for other purposes. Milliman does not intend to benefit and assumes no duty or liability to other parties who receive this work.
Milliman recommends that third parties be aided by their own actuary or other qualified professional when reviewing the Milliman work product.
ctrj0368.docx0003 STR 01 09 / NJC/MCO/JDS
1301 Fifth AvenueSuite 3800Seattle, WA 98101-2605USA
Tel +1 206 624 7940Fax +1 206 623 3485
milliman.com
April 23, 2019
Teachers’ Retirement BoardCalifornia State Teachers’ Retirement System
Re: Defined Benefit Program Actuarial Valuation as of June 30, 2018
Dear Members of the Board:
At your request, we have performed an actuarial valuation of the Defined Benefit (DB) Program of the State Teachers' Retirement Plan as of June 30, 2018. The major findings of the actuarial valuation are contained in the following report, which reflects the benefit provisions and contribution rates in effect as of the valuation date. This report satisfies all basic disclosure requirements under the Model Disclosure Elements for Actuarial Valuation Reports recommended by the California Actuarial Advisory Panel.
Actuarial CertificationTo the best of our knowledge and belief, this report is complete and accurate and contains sufficient information to fairly disclose the funded condition of the DB Program as of June 30, 2018.
CalSTRS funding is based on complex legislation. This valuation contains analysis based on our understanding of the relevant law based on our experience working with CalSTRS and other large public retirement systems andhas been augmented by consultation with CalSTRS staff.
In preparing this report, we relied, without audit, on information (some oral and some in writing) supplied by CalSTRS staff. This information includes, but is not limited to, statutory provisions, employee data, and financial information. In our examination of these data, we have found them to be reasonably consistent and comparable with data used for other purposes. The valuation results depend on the integrity of this information. If any of this information is inaccurate or incomplete our results may be different and our calculations may need to be revised.
All costs, liabilities, rates of interest, and other factors for CalSTRS have been determined on the basis of actuarial assumptions and methods which are individually reasonable (taking into account the experience of CalSTRS and reasonable expectations) and which, in combination, offer a reasonable estimate of anticipated experience affecting CalSTRS. Further, in our opinion, each actuarial assumption used is reasonably related to the experience of CalSTRS and to reasonable expectations which, in combination, represent a reasonable estimate of anticipated experience.
Future actuarial measurements may differ significantly from the current measurements presented in this report due to such factors as the following: plan experience differing from that anticipated by the economic or demographic assumptions; changes in economic or demographic assumptions; increases or decreases expected as part of the natural operation of the methodology used for these measurements (such as the end of an amortization period or additional cost or contribution requirements based on the Plan's funded status); and changes in plan provisions or applicable law. Due to the limited scope of our assignment, we did not perform an

Teachers’ Retirement BoardApril 23, 2019
Page 2
This work product was prepared solely for CalSTRS for the purposes described herein and may not be appropriate to use for other purposes. Milliman does not intend to benefit and assumes no duty or liability to other parties who receive this work.
Milliman recommends that third parties be aided by their own actuary or other qualified professional when reviewing the Milliman work product.
ctrj0368.docx0003 STR 01 09 / NJC/MCO/JDS
analysis of the potential range of future measurements. The Teachers’ Retirement Board has sole authority to determine the actuarial assumptions and methods used for the valuation of the DB Program. The board adopted the actuarial methods and assumptions used in the 2018 valuation.
Actuarial computations presented in this report are for purposes of assessing the funding levels of CalSTRS and calculating contribution rates under CalSTRS valuation policy. The calculations in the enclosed report have been made on a basis consistent with our understanding of CalSTRS funding structure. Determinations for other purposes, such as for financial reporting in accordance with GASB standards, may be significantly different from the results contained in this report. Accordingly, additional determinations may be needed for other purposes.
This valuation report is only an estimate of the System’s financial condition as of a single date. It can neither predict the System’s future condition nor guarantee future financial soundness. Actuarial valuations do not affect the ultimate cost of System benefits, only the timing of System contributions. While the valuation is based on an array of individually reasonable assumptions, other assumption sets may also be reasonable and valuation results based on those assumptions would be different. No one set of assumptions is uniquely correct. Determining results using alternative assumptions is outside the scope of our engagement.
Milliman’s work is prepared solely for the internal business use of CalSTRS. To the extent that Milliman's work is not subject to disclosure under applicable public records laws, Milliman’s work may not be provided to third parties without Milliman's prior written consent. Milliman does not intend to benefit or create a legal duty to any third party recipient of its work product. Milliman’s consent to release its work product to any third party may be conditioned on the third party signing a Release, subject to the following exceptions:
(a) CalSTRS may provide a copy of Milliman’s work, in its entirety, to CalSTRS professional service advisors who are subject to a duty of confidentiality and who agree to not use Milliman’s work for any purpose other than to benefit CalSTRS.
(b) CalSTRS may provide a copy of Milliman’s work, in its entirety, to other governmental entities, as required by law.
No third party recipient of Milliman's work product should rely upon Milliman's work product. Such recipients should engage qualified professionals for advice appropriate to their own specific needs.
The consultants who worked on this assignment are retirement actuaries. Milliman’s advice is not intended to be a substitute for qualified legal or accounting counsel.
The signing actuaries are independent of the plan sponsor. We are not aware of any relationship that would impair the objectivity of our work.
On the basis of the foregoing, we hereby certify that, to the best of our knowledge and belief, this report is complete and accurate and has been prepared in accordance with generally recognized and accepted actuarial principles and practices, including the relevant Actuarial Standards of Practice. We are members of the American Academy of Actuaries and meet the Qualification Standards of the American Academy of Actuaries to render the actuarial opinion contained herein.
We would like to express our appreciation to the CalSTRS staff who gave substantial assistance in supplying the data on which this report is based.

Teachers’ Retirement BoardApril 23, 2019
Page 3
This work product was prepared solely for CalSTRS for the purposes described herein and may not be appropriate to use for other purposes. Milliman does not intend to benefit and assumes no duty or liability to other parties who receive this work.
Milliman recommends that third parties be aided by their own actuary or other qualified professional when reviewing the Milliman work product.
ctrj0368.docx0003 STR 01 09 / NJC/MCO/JDS
We respectfully submit the following report and we look forward to discussing it with you.
Sincerely,
Nick J. Collier, ASA, EA, MAAAConsulting Actuary
Mark C. Olleman, FSA, EA, MAAAConsulting Actuary
Julie D. Smith, FSA, EA, MAAAConsulting Actuary
April 23, 2019Date

Milliman June 30, 2018 Actuarial ValuationDefined Benefit Program of theCalifornia State Teachers’ Retirement System Table of Contents
This work product was prepared solely for CalSTRS for the purposes described herein and may not be appropriate to use for other purposes. Milliman does not intend to benefit and assumes no duty or liability to other parties who receive this work. Milliman recommends that third parties be aided by their own actuary or other qualified professional when reviewing the Milliman work product.
i
ctrj0368.docx
Table of Contents
1. Summary of the Findings ..................................................................................................................................1
2. Scope of the Report ........................................................................................................................................ 12
3. Actuarial Obligation ........................................................................................................................................ 13Table 1 Normal Cost ......................................................................................................................................... 16Table 2 Actuarial Obligation .............................................................................................................................. 17
4. Valuation Assets ............................................................................................................................................. 18Table 3 Statement of Program Assets .............................................................................................................. 19Table 4 Statement of Changes in Program Assets........................................................................................... 20Table 5 Actuarial Value of Assets ..................................................................................................................... 21Table 6 History of Actuarial Value of Assets..................................................................................................... 22
5. Funded Status ................................................................................................................................................. 23Table 7 Funded Status...................................................................................................................................... 28Table 8 Actuarial Gains and Losses ................................................................................................................. 29
6. State Supplemental Contribution Rate ......................................................................................................... 30Table 9 Asset Adjustment for 1990 Benefit Structure....................................................................................... 34Table 10 Funded Status and Supplemental Contribution Rate for 1990 Benefit Structure .............................. 35
7. Employer Supplemental Contribution Rate.................................................................................................. 36Table 11 Total Assets Allocated for Pre-2014 Service(1) .................................................................................. 38Table 12 1990 Assets Allocated for Pre-2014 Service(1) .................................................................................. 39Table 13 Funded Status and Employer Supplemental Contribution Rate for Pre-2014 Service...................... 40
8. Projected Amortization and Cash Flows ...................................................................................................... 41Table 14 Amortization of Unfunded Actuarial Obligation(1) ............................................................................... 42Table 15 Projected Cash Flow.......................................................................................................................... 43
9. Risk Disclosures ............................................................................................................................................. 44

Milliman June 30, 2018 Actuarial ValuationDefined Benefit Program of theCalifornia State Teachers’ Retirement System Table of Contents
This work product was prepared solely for CalSTRS for the purposes described herein and may not be appropriate to use for other purposes. Milliman does not intend to benefit and assumes no duty or liability to other parties who receive this work. Milliman recommends that third parties be aided by their own actuary or other qualified professional when reviewing the Milliman work product.
ii
ctrj0368.docx
Appendix A Provisions of Governing Law....................................................................................................... 48
Appendix B Actuarial Methods and Assumptions .......................................................................................... 53Table B.1 List of Major Valuation Assumptions ................................................................................................ 55Table B.2 Mortality as of June 30, 2018 ........................................................................................................... 56Table B.3 Service Retirement ........................................................................................................................... 57Table B.4 Disability Retirement......................................................................................................................... 58Table B.5 Withdrawal ........................................................................................................................................ 59Table B.6 Probability of Refund ........................................................................................................................ 60Table B.7 Merit Salary Increases(1) ................................................................................................................. 61Table B.8 Supplemental Assumptions .............................................................................................................. 62Table B.9 Custom Mortality Table Key ............................................................................................................. 64
Appendix C Valuation Data................................................................................................................................ 65Table C.1 Summary of Statistical Information................................................................................................... 66Table C.2 Age and Service Distribution – Active Male Members ..................................................................... 68Table C.3 Age and Service Distribution – Active Female Members ................................................................. 69Table C.4 Age and Service Distribution – All Active Members ......................................................................... 70Table C.5 Inactive Members ............................................................................................................................. 71Table C.6 Members Retired for Service............................................................................................................ 72
Appendix D Glossary.......................................................................................................................................... 73

Milliman June 30, 2018 Actuarial ValuationDefined Benefit Program of theCalifornia State Teachers’ Retirement System
This work product was prepared solely for CalSTRS for the purposes described herein and may not be appropriate to use for other purposes. Milliman does not intend to benefit and assumes no duty or liability to other parties who receive this work. Milliman recommends that third parties be aided by their own actuary or other qualified professional when reviewing the Milliman work product.
1
1. Summary of the FindingsThe primary purpose of the actuarial valuation is to calculate the contribution rates for members, employers, and the state and analyze the sufficiency of these future contributions to meet the current and future obligations of the DB Program. By using the actuarial methods and assumptions adopted by the Teachers’ Retirement Board(TRB), this actuarial valuation provides a reasonable estimate of the long-term financing of the DB Program. The assumptions and methods were adopted at the February 2017 TRB meeting, and there have been no changes in them since the last valuation.
Under the board’s valuation policy, an increase to the state supplemental contribution rate beginning July 2019has been calculated. For the employer contribution rate, adjustments will be effective with the 2020 valuation for the fiscal year beginning July 2021. Note that the contribution rates calculated in this valuation are based on the relevant provisions of the Education Code and the board’s valuation policy and are not necessarily our opinion of what the funding level should be; however, we note that CalSTRS is projected to make progress, albeit slow progress in the short term, toward paying off the Unfunded Actuarial Obligation (UAO).
The key findings of this actuarial valuation are:
� The Funded Ratio increased from 62.6% to 64.0% primarily due to an actual investment return for the prior fiscal year of approximately 9.0% which exceeded the 7.0% assumed return, as well as the reflection of a portion of prior investment gains in the asset smoothing calculation.
� An increase in the state supplemental contribution rate of 0.500% of payroll to 5.811% of payroll has been calculated for the fiscal year beginning July 1, 2019 pursuant to the valuation policy. This increase is the maximum increment allowed under the Education Code. Current projections show increases in the state supplemental contribution rate will be needed for three additional years, assuming all actuarial assumptions are met.
� The employer supplemental contribution rate for the fiscal year beginning July 1, 2019 increases to 9.88% of payroll (currently 8.03%) as required by the Education Code, which specifies a fixed schedule of contribution increases until 2021.
� Based on this 2018 valuation, no change in the CalSTRS 2% at 62 member contribution rate isrequired for the fiscal year beginning July 1, 2019. The member contribution rate for 2% at 60 members is fixed in the Education Code, so no change is required for this group, either.
Note the governor’s proposed 2019-20 budget (January, 2019) includes additional contributions for CalSTRS and some short-term shifting of contributions between the state and the employers. For purposes of this valuation, we have only reflected the contribution rates currently specified in the Education Code.
Contribution Rates
The 2014 legislation added three subsections to the Education Code which address contribution rates. EC §22955.1 specifies graded increases in the supplemental state contribution rates. Effective with the 2016 valuation, the board has the authority to annually adjust the state contribution rate for years through June 30, 2046, so that the rate is sufficient to amortize the UAO attributable to the 1990 contribution and benefit structure. However, the maximum increase in a given year is limited to 0.5% of payroll.
EC §22950.5 specifies graded increases in the employer supplemental contribution rate. Effective July 1, 2021, the employer supplemental contribution rate will be adjusted annually based on the contribution rate necessary to amortize the UAO attributable to service prior to July 1, 2014 that is not funded by the state as part of the 1990 Benefit Structure.
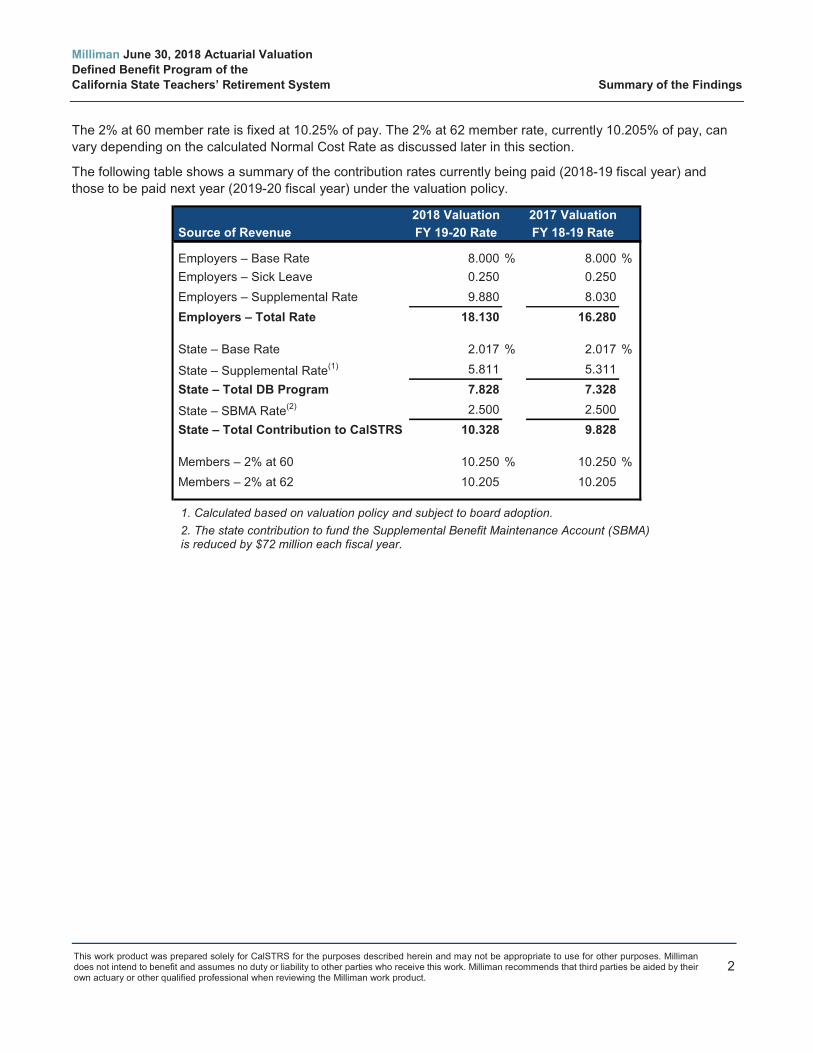
Milliman June 30, 2018 Actuarial ValuationDefined Benefit Program of theCalifornia State Teachers’ Retirement System Summary of the Findings
This work product was prepared solely for CalSTRS for the purposes described herein and may not be appropriate to use for other purposes. Milliman does not intend to benefit and assumes no duty or liability to other parties who receive this work. Milliman recommends that third parties be aided by their own actuary or other qualified professional when reviewing the Milliman work product.
2
The 2% at 60 member rate is fixed at 10.25% of pay. The 2% at 62 member rate, currently 10.205% of pay, can vary depending on the calculated Normal Cost Rate as discussed later in this section.
The following table shows a summary of the contribution rates currently being paid (2018-19 fiscal year) and those to be paid next year (2019-20 fiscal year) under the valuation policy.
1. Calculated based on valuation policy and subject to board adoption.2. The state contribution to fund the Supplemental Benefit Maintenance Account (SBMA) is reduced by $72 million each fiscal year.
2018 Valuation 2017 Valuation Source of Revenue FY 19-20 Rate FY 18-19 Rate
Employers – Base Rate 8.000 % 8.000 % Employers – Sick Leave 0.250 0.250 Employers – Supplemental Rate 9.880 8.030 Employers – Total Rate 18.130 16.280
State – Base Rate 2.017 % 2.017 %
State – Supplemental Rate(1) 5.811 5.311 State – Total DB Program 7.828 7.328 State – SBMA Rate(2) 2.500 2.500 State – Total Contribution to CalSTRS 10.328 9.828
Members – 2% at 60 10.250 % 10.250 % Members – 2% at 62 10.205 10.205

Milliman June 30, 2018 Actuarial ValuationDefined Benefit Program of theCalifornia State Teachers’ Retirement System Summary of the Findings
This work product was prepared solely for CalSTRS for the purposes described herein and may not be appropriate to use for other purposes. Milliman does not intend to benefit and assumes no duty or liability to other parties who receive this work. Milliman recommends that third parties be aided by their own actuary or other qualified professional when reviewing the Milliman work product.
3
State Supplemental Contribution Rate
For the 2018 valuation, an increase in the state supplemental contribution rate under EC §22955.1 has been calculated. The following table shows a numerical breakdown of each of the factors that caused the increase in the unconstrained (i.e., prior to the application of the minimum supplemental rate and the maximum increase) state supplemental contribution rate. The actual calculation is limited to a 0.5% increase over the prior year and cannot be less than 4.311% until the 1990 UAO has been fully paid off.
1. Calculated rate is 5.811% due to application of maximum increase.
An increase to the state supplemental contribution rate to 5.811% effective July 1, 2019 has been calculated based on the board’s valuation policy. For the current fiscal year, the state contribution rate is 5.311%, so the calculated rate for the next fiscal year represents the maximum increase allowed of 0.5% of payroll. We have shown details of the calculation of the state supplemental contribution rate in Section 6 of this report. These calculations are based on the smoothed actuarial value of assets. As shown later in this section (see “Looking Ahead”), when the deferred asset gain as of June 30, 2018 and other factors are reflected in the projected contribution rates, the total state DB Program contribution rate is projected to increase to about 9.2% (2.017% base contribution rate plus 7.2% supplemental contribution rate). In addition, the state contributes approximately 2.5% of payroll to the Supplemental Benefits Maintenance Account (SBMA).
Employer Supplemental Contribution Rate
Consistent with the Education Code, the 2018 valuation does not calculate changes in the employer supplemental contribution rate. Increases in this rate are fixed for the next two years. Effective with the 2020 valuation, we will calculate the change in the employer supplemental contribution rate starting July 1, 2021. For illustrative purposes, we have shown details of how this calculation will look in Section 7 of this report.
UAO for New Benefits, Post-2014 Service
The funding legislation included actuarial funding (within certain constraints) for most of the benefits provided by CalSTRS. The one exception is that there is no provision for the state, employers, or members to fund any UAO arising for New Benefits (i.e., those not included in the 1990 Benefit Structure) attributable to service after
TheoreticalUnconstrained State
Sources of Change Supplemental Rate
June 30, 2017 Actuarial Valuation 8.21%
Expected Year-to-Year Change 0.16%
Recognized Asset (Gain) / Loss• From Prior Years -0.26%• From Current Year -0.14%
Salary / Payroll Variation• Salary Increase < Assumed -0.29%• Payroll Increase < Assumed 0.05%
All Other Sources 0.08%
Total Change -0.40%
June 30, 2018 Actuarial Valuation 7.81% (1)
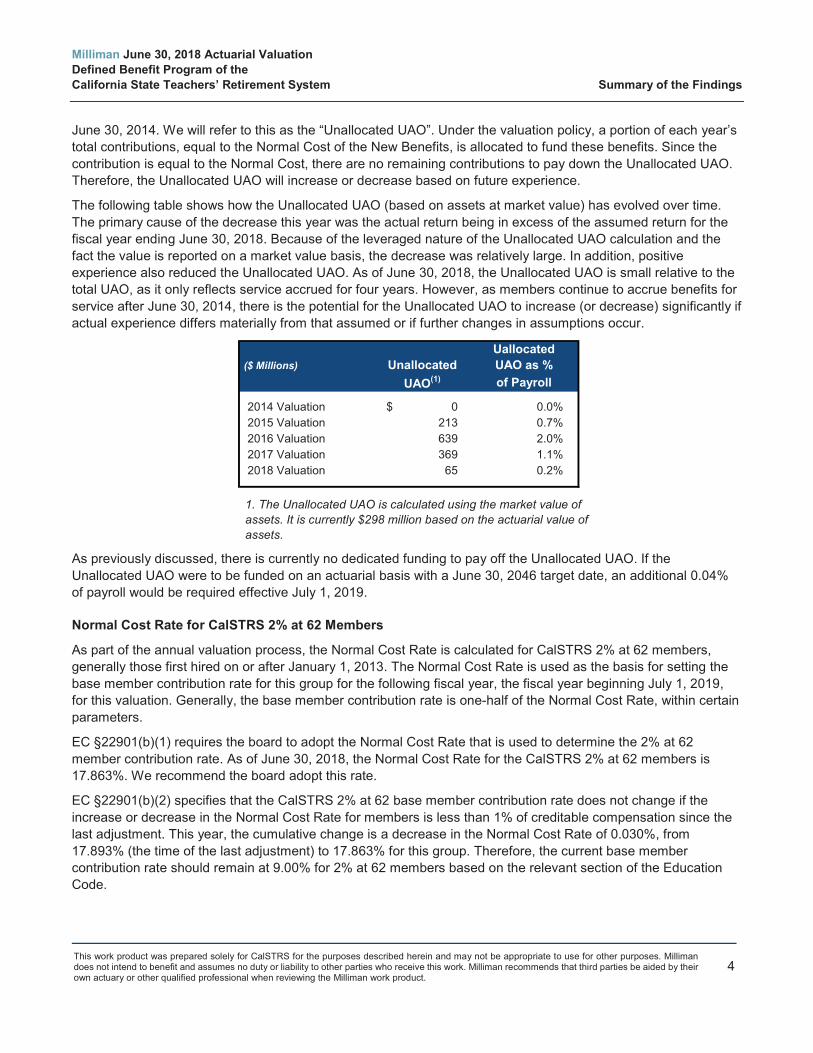
Milliman June 30, 2018 Actuarial ValuationDefined Benefit Program of theCalifornia State Teachers’ Retirement System Summary of the Findings
This work product was prepared solely for CalSTRS for the purposes described herein and may not be appropriate to use for other purposes. Milliman does not intend to benefit and assumes no duty or liability to other parties who receive this work. Milliman recommends that third parties be aided by their own actuary or other qualified professional when reviewing the Milliman work product.
4
June 30, 2014. We will refer to this as the “Unallocated UAO”. Under the valuation policy, a portion of each year’s total contributions, equal to the Normal Cost of the New Benefits, is allocated to fund these benefits. Since the contribution is equal to the Normal Cost, there are no remaining contributions to pay down the Unallocated UAO. Therefore, the Unallocated UAO will increase or decrease based on future experience.
The following table shows how the Unallocated UAO (based on assets at market value) has evolved over time. The primary cause of the decrease this year was the actual return being in excess of the assumed return for the fiscal year ending June 30, 2018. Because of the leveraged nature of the Unallocated UAO calculation and the fact the value is reported on a market value basis, the decrease was relatively large. In addition, positive experience also reduced the Unallocated UAO. As of June 30, 2018, the Unallocated UAO is small relative to the total UAO, as it only reflects service accrued for four years. However, as members continue to accrue benefits for service after June 30, 2014, there is the potential for the Unallocated UAO to increase (or decrease) significantly if actual experience differs materially from that assumed or if further changes in assumptions occur.
1. The Unallocated UAO is calculated using the market value of assets. It is currently $298 million based on the actuarial value of assets.
As previously discussed, there is currently no dedicated funding to pay off the Unallocated UAO. If the Unallocated UAO were to be funded on an actuarial basis with a June 30, 2046 target date, an additional 0.04% of payroll would be required effective July 1, 2019.
Normal Cost Rate for CalSTRS 2% at 62 Members
As part of the annual valuation process, the Normal Cost Rate is calculated for CalSTRS 2% at 62 members, generally those first hired on or after January 1, 2013. The Normal Cost Rate is used as the basis for setting the base member contribution rate for this group for the following fiscal year, the fiscal year beginning July 1, 2019,for this valuation. Generally, the base member contribution rate is one-half of the Normal Cost Rate, within certain parameters.
EC §22901(b)(1) requires the board to adopt the Normal Cost Rate that is used to determine the 2% at 62 member contribution rate. As of June 30, 2018, the Normal Cost Rate for the CalSTRS 2% at 62 members is 17.863%. We recommend the board adopt this rate.
EC §22901(b)(2) specifies that the CalSTRS 2% at 62 base member contribution rate does not change if the increase or decrease in the Normal Cost Rate for members is less than 1% of creditable compensation since the last adjustment. This year, the cumulative change is a decrease in the Normal Cost Rate of 0.030%, from 17.893% (the time of the last adjustment) to 17.863% for this group. Therefore, the current base member contribution rate should remain at 9.00% for 2% at 62 members based on the relevant section of the Education Code.
UallocatedUnallocated UAO as %
UAO(1) of Payroll
2014 Valuation $ 0 0.0% 2015 Valuation 213 0.7% 2016 Valuation 639 2.0% 2017 Valuation 369 1.1% 2018 Valuation 65 0.2%
($ Millions)

Milliman June 30, 2018 Actuarial ValuationDefined Benefit Program of theCalifornia State Teachers’ Retirement System Summary of the Findings
This work product was prepared solely for CalSTRS for the purposes described herein and may not be appropriate to use for other purposes. Milliman does not intend to benefit and assumes no duty or liability to other parties who receive this work. Milliman recommends that third parties be aided by their own actuary or other qualified professional when reviewing the Milliman work product.
5
Note that under EC §22901.7(b) 1.205% of pay is added to the base member rate. Therefore, as of July 1, 2019,the total member contribution rate for 2% at 62 members continues to be 10.205% (9.00% plus the 1.205% additional contribution rate).
Funding Progress
The UAO of a retirement plan is equal to the difference between its Actuarial Value of Assets and its Actuarial Obligation. The Funded Ratio is equal to the Actuarial Value of Assets divided by the Actuarial Obligation.
The $107.2 billion UAO compares to a projected June 30, 2018 value of $111.1 billion based on the prior valuation. The primary reasons for the decrease in the UAO and the increase in the Funded Ratio are salary increases less than assumed and actuarial asset gains recognized from the current and prior years. Additional discussion of the contributing factors in this change can be found in Section 5 under Actuarial Gains and Losses.
The following graph shows a historical perspective of the Funded Ratio for CalSTRS.
2018 2017Valuation Valuation
Actuarial Obligation $ 297,603 $ 286,950 Actuarial Value of Assets 190,451 179,689 Unfunded Actuarial Obligation $ 107,152 $ 107,261
Funded Ratio 64.0% 62.6%
($ Millions)
0%
20%
40%
60%
80%
100%
120%
1975 1980 1985 1990 1995 2000 2005 2010 2015
Historical Funded Ratio
Funded Ratio Target

Milliman June 30, 2018 Actuarial ValuationDefined Benefit Program of theCalifornia State Teachers’ Retirement System Summary of the Findings
This work product was prepared solely for CalSTRS for the purposes described herein and may not be appropriate to use for other purposes. Milliman does not intend to benefit and assumes no duty or liability to other parties who receive this work. Milliman recommends that third parties be aided by their own actuary or other qualified professional when reviewing the Milliman work product.
6
The table below shows the factors that affected the DB Program’s Funded Ratio since the last valuation. As previously discussed, the primary reasons for the increase in the Funded Ratio are salary increases less than assumed and actuarial asset gains recognized from the current and prior years.
Looking Ahead
The following projection shows the Funded Ratio if the DB Program earns 7.00% in each future year and all other assumptions are met. As shown in the graph, the DB Program is projected to reach approximately 100% funding by 2046 based on the 2018 valuation (blue line). The Funded Ratio is slightly higher than projected in the 2017valuation (green line), primarily due to the actual return for the prior year which was greater than assumed. Note that we have also shown a hypothetical projection of the funded status based on the 2018 valuation but without the 2014 funding legislation (red line). See the end of this subsection for a summary of the assumptions on which these projections are based.
Sources of Change FundedRatio
June 30, 2017 Actuarial Valuation 62.6%
Expected Year-to-Year Change 0.2%
Recognized Asset Gain/(Loss)• From Prior Years 0.5%• From Current Year 0.4%
Salary Variation 0.4%
All Other Sources -0.1%
Total Change 1.4%
June 30, 2018 Actuarial Valuation 64.0%
0.0%
20.0%
40.0%
60.0%
80.0%
100.0%
2018 2023 2028 2033 2038 2043 2048
Projected Funded Ratio
New Law (2018 Val) New Law (2017 Val) Old Law (2018 Val)

Milliman June 30, 2018 Actuarial ValuationDefined Benefit Program of theCalifornia State Teachers’ Retirement System Summary of the Findings
This work product was prepared solely for CalSTRS for the purposes described herein and may not be appropriate to use for other purposes. Milliman does not intend to benefit and assumes no duty or liability to other parties who receive this work. Milliman recommends that third parties be aided by their own actuary or other qualified professional when reviewing the Milliman work product.
7
The following graph shows the projected contribution rates for each of the stakeholder groups and in total. Note that the actual contribution rates paid in the future will vary based on experience after the valuation date. The contribution rates shown include both the base and supplemental contribution rates, but do not reflect the state contribution to the Supplemental Benefit Maintenance Account (SBMA).
Asset gains and losses will generally have the largest year-to-year impact on the total contribution rates needed, although assumption changes can cause a significant change in years when they occur. Under the legislation, as reflected in the valuation policy, the impact of asset gains and losses will tend to have a much more significant impact on the state contribution rate than the employer contribution rate. Therefore, the state contribution rate will tend to be more volatile than the employer rate, as shown in the following section (“Projections Under Alternate Return Scenarios”).
The above projection calculations are based on the following assumptions:
� All experience subsequent to the valuation date is consistent with the valuation assumptions, as described in Appendix B.
� Future changes in the state and employer supplemental contribution rates will be consistent with the board’s valuation policy. In particular, the state rate is based on funding the UAO by 2046, a year which is not defined in statute.
� Current deferred asset gains and losses (currently a net deferred gain) are reflected as they are expected to be recognized in the asset smoothing method.
� The projection assumes new members will have the same Normal Cost Rate as the current 2% at 62 members. The emerging Normal Cost Rate for the total plan will gradually decrease over time due to the lower benefits provided for 2% at 62 members.
Projections Under Alternate Return Scenarios
Actuarial valuations are based on a certain set of assumptions. The reality is that these assumptions will not be exactly met and that this will affect future valuation results. Investment returns will likely have the biggest impact on the future funding of CalSTRS. In the following graphs, we show some simple examples of the future variation
0%
5%
10%
15%
20%
25%
30%
35%
40%
2018 2023 2028 2033 2038 2043 2048
Fiscal Year Beginning
Projected Contribution Rate
Member State Employer Total
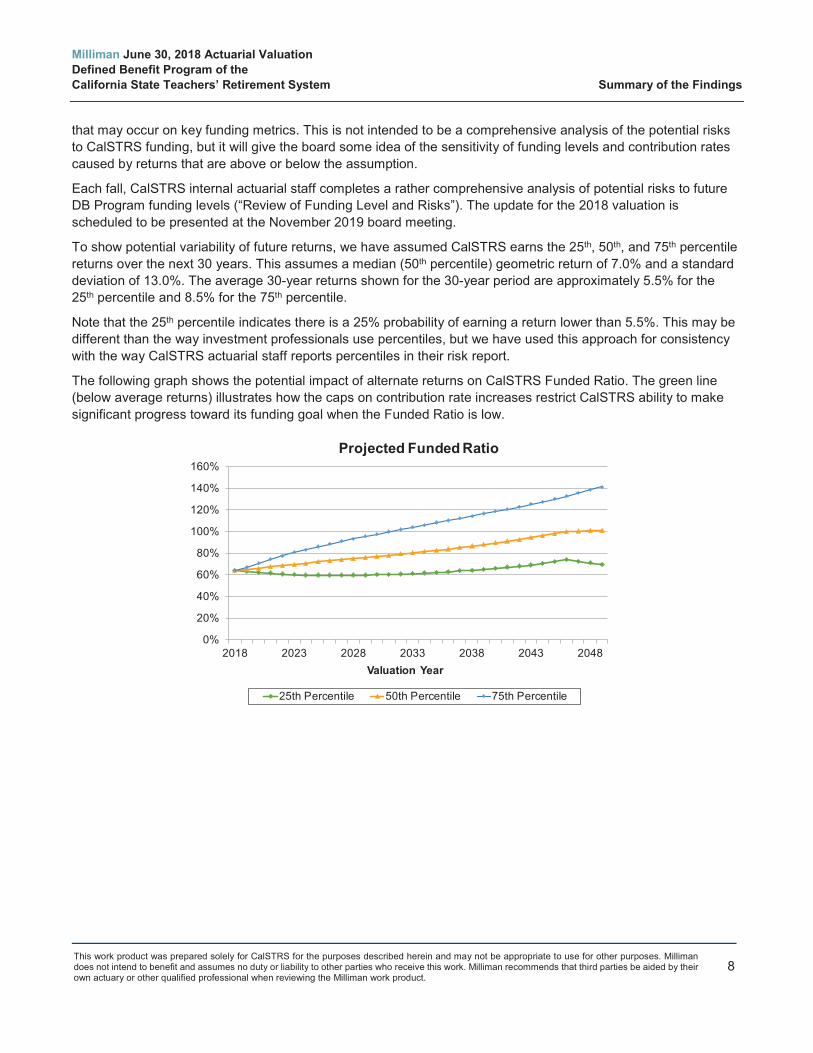
Milliman June 30, 2018 Actuarial ValuationDefined Benefit Program of theCalifornia State Teachers’ Retirement System Summary of the Findings
This work product was prepared solely for CalSTRS for the purposes described herein and may not be appropriate to use for other purposes. Milliman does not intend to benefit and assumes no duty or liability to other parties who receive this work. Milliman recommends that third parties be aided by their own actuary or other qualified professional when reviewing the Milliman work product.
8
that may occur on key funding metrics. This is not intended to be a comprehensive analysis of the potential risks to CalSTRS funding, but it will give the board some idea of the sensitivity of funding levels and contribution rates caused by returns that are above or below the assumption.
Each fall, CalSTRS internal actuarial staff completes a rather comprehensive analysis of potential risks to future DB Program funding levels (“Review of Funding Level and Risks”). The update for the 2018 valuation is scheduled to be presented at the November 2019 board meeting.
To show potential variability of future returns, we have assumed CalSTRS earns the 25th, 50th, and 75th percentile returns over the next 30 years. This assumes a median (50th percentile) geometric return of 7.0% and a standard deviation of 13.0%. The average 30-year returns shown for the 30-year period are approximately 5.5% for the 25th percentile and 8.5% for the 75th percentile.
Note that the 25th percentile indicates there is a 25% probability of earning a return lower than 5.5%. This may be different than the way investment professionals use percentiles, but we have used this approach for consistency with the way CalSTRS actuarial staff reports percentiles in their risk report.
The following graph shows the potential impact of alternate returns on CalSTRS Funded Ratio. The green line (below average returns) illustrates how the caps on contribution rate increases restrict CalSTRS ability to make significant progress toward its funding goal when the Funded Ratio is low.
0%
20%
40%
60%
80%
100%
120%
140%
160%
2018 2023 2028 2033 2038 2043 2048Valuation Year
Projected Funded Ratio
25th Percentile 50th Percentile 75th Percentile
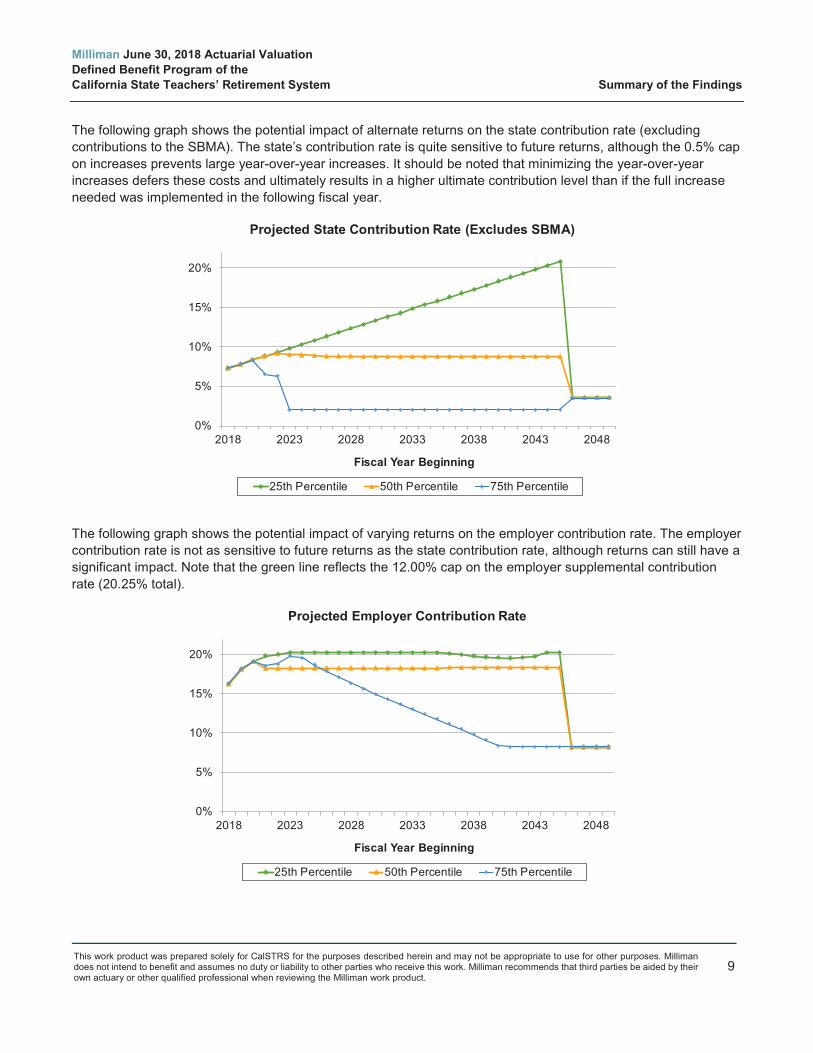
Milliman June 30, 2018 Actuarial ValuationDefined Benefit Program of theCalifornia State Teachers’ Retirement System Summary of the Findings
This work product was prepared solely for CalSTRS for the purposes described herein and may not be appropriate to use for other purposes. Milliman does not intend to benefit and assumes no duty or liability to other parties who receive this work. Milliman recommends that third parties be aided by their own actuary or other qualified professional when reviewing the Milliman work product.
9
The following graph shows the potential impact of alternate returns on the state contribution rate (excluding contributions to the SBMA). The state’s contribution rate is quite sensitive to future returns, although the 0.5% cap on increases prevents large year-over-year increases. It should be noted that minimizing the year-over-year increases defers these costs and ultimately results in a higher ultimate contribution level than if the full increase needed was implemented in the following fiscal year.
The following graph shows the potential impact of varying returns on the employer contribution rate. The employer contribution rate is not as sensitive to future returns as the state contribution rate, although returns can still have a significant impact. Note that the green line reflects the 12.00% cap on the employer supplemental contribution rate (20.25% total).
0%
5%
10%
15%
20%
2018 2023 2028 2033 2038 2043 2048
Fiscal Year Beginning
Projected State Contribution Rate (Excludes SBMA)
25th Percentile 50th Percentile 75th Percentile
0%
5%
10%
15%
20%
2018 2023 2028 2033 2038 2043 2048
Fiscal Year Beginning
Projected Employer Contribution Rate
25th Percentile 50th Percentile 75th Percentile

Milliman June 30, 2018 Actuarial ValuationDefined Benefit Program of theCalifornia State Teachers’ Retirement System Summary of the Findings
This work product was prepared solely for CalSTRS for the purposes described herein and may not be appropriate to use for other purposes. Milliman does not intend to benefit and assumes no duty or liability to other parties who receive this work. Milliman recommends that third parties be aided by their own actuary or other qualified professional when reviewing the Milliman work product.
10
Member rates are not affected by future returns; however, the 2% at 62 member contributions may be affected by changes in the investment return assumption or other assumption changes.
Further Information
Details of our findings are included in later sections of this report. The appendices include supporting documentation on the benefit and eligibility provisions used to project future benefits, the actuarial methods and assumptions used to value the projected benefits, and the underlying census data provided by CalSTRS for this valuation.
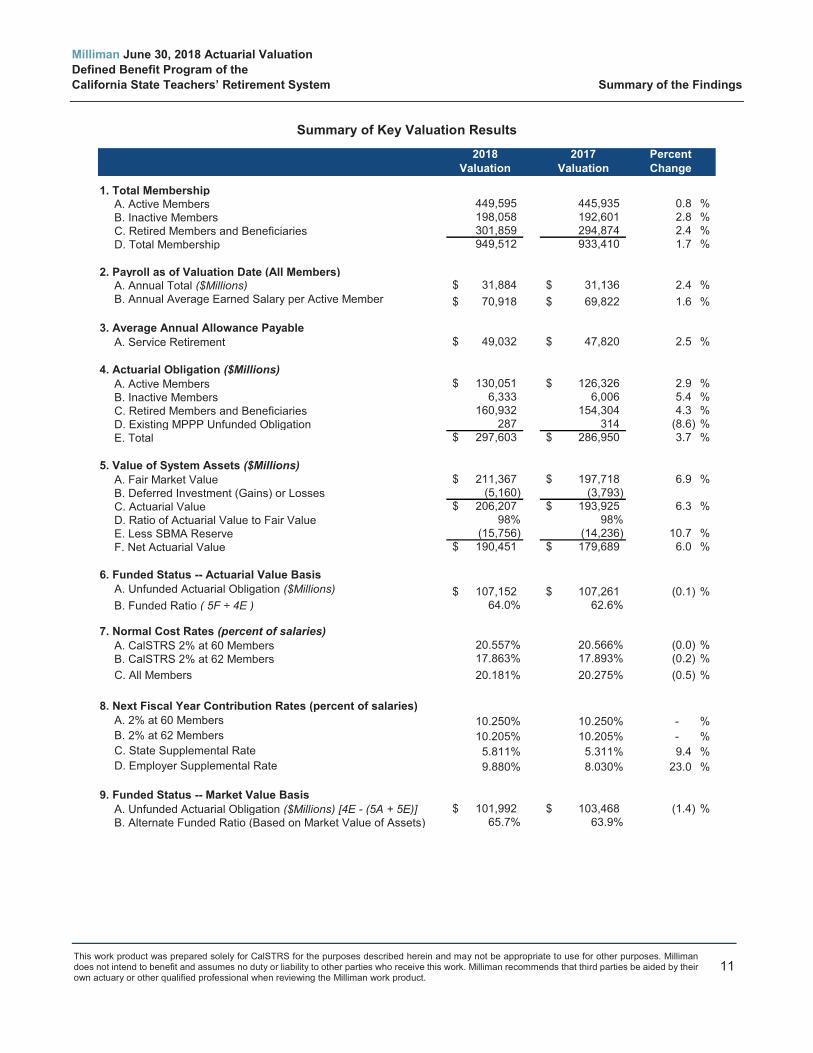
Milliman June 30, 2018 Actuarial ValuationDefined Benefit Program of theCalifornia State Teachers’ Retirement System Summary of the Findings
This work product was prepared solely for CalSTRS for the purposes described herein and may not be appropriate to use for other purposes. Milliman does not intend to benefit and assumes no duty or liability to other parties who receive this work. Milliman recommends that third parties be aided by their own actuary or other qualified professional when reviewing the Milliman work product.
11
Summary of Key Valuation Results2018 2017 Percent
Valuation Valuation Change
1. Total MembershipA. Active Members 449,595 445,935 0.8 %B. Inactive Members 198,058 192,601 2.8 %C. Retired Members and Beneficiaries 301,859 294,874 2.4 %D. Total Membership 949,512 933,410 1.7 %
2. Payroll as of Valuation Date (All Members)A. Annual Total ($Millions) 31,884$ 31,136$ 2.4 %B. Annual Average Earned Salary per Active Member 70,918$ 69,822$ 1.6 %
3. Average Annual Allowance Payable A. Service Retirement 49,032$ 47,820$ 2.5 %
4. Actuarial Obligation ($Millions)A. Active Members 130,051$ 126,326$ 2.9 %B. Inactive Members 6,333 6,006 5.4 %C. Retired Members and Beneficiaries 160,932 154,304 4.3 %D. Existing MPPP Unfunded Obligation 287 314 (8.6) %E. Total 297,603$ 286,950$ 3.7 %
5. Value of System Assets ($Millions)A. Fair Market Value 211,367$ 197,718$ 6.9 %B. Deferred Investment (Gains) or Losses (5,160) (3,793)C. Actuarial Value 206,207$ 193,925$ 6.3 %D. Ratio of Actuarial Value to Fair Value 98% 98%E. Less SBMA Reserve (15,756) (14,236) 10.7 %F. Net Actuarial Value 190,451$ 179,689$ 6.0 %
6. Funded Status -- Actuarial Value BasisA. Unfunded Actuarial Obligation ($Millions) 107,152$ 107,261$ (0.1) %B. Funded Ratio ( 5F ÷ 4E ) 64.0% 62.6%
7. Normal Cost Rates (percent of salaries)A. CalSTRS 2% at 60 Members 20.557% 20.566% (0.0) %B. CalSTRS 2% at 62 Members 17.863% 17.893% (0.2) %C. All Members 20.181% 20.275% (0.5) %
8. Next Fiscal Year Contribution Rates (percent of salaries)A. 2% at 60 Members 10.250% 10.250% - %B. 2% at 62 Members 10.205% 10.205% - %C. State Supplemental Rate 5.811% 5.311% 9.4 %D. Employer Supplemental Rate 9.880% 8.030% 23.0 %
9. Funded Status -- Market Value BasisA. Unfunded Actuarial Obligation ($Millions) [4E - (5A + 5E)] 101,992$ 103,468$ (1.4) %B. Alternate Funded Ratio (Based on Market Value of Assets) 65.7% 63.9%

Milliman June 30, 2018 Actuarial ValuationDefined Benefit Program of theCalifornia State Teachers’ Retirement System
This work product was prepared solely for CalSTRS for the purposes described herein and may not be appropriate to use for other purposes. Milliman does not intend to benefit and assumes no duty or liability to other parties who receive this work. Milliman recommends that third parties be aided by their own actuary or other qualified professional when reviewing the Milliman work product.
12
2. Scope of the ReportThis report presents the actuarial valuation of the DB Program of the State Teachers’ Retirement Plan as of June 30, 2018. A summary of the key results of this valuation is presented in the previous section. The remainder of this report is arranged as follows:
Section 3 describes the benefit obligations of CalSTRS, including the development of the Normal Cost and the Actuarial Obligation.
Section 4 outlines the Fair Market Value of Assets of the DB Program and the determination of the Actuarial Value of Assets as of June 30, 2018. All of the assets of the Program are available to finance future DB Program benefits and expenses, except those allocated for the Supplemental Benefit Maintenance Account (SBMA).
Section 5 shows the relationship between the Actuarial Value of Assets and the Actuarial Obligation, also called the Funded Ratio.
Section 6 discusses the calculations used to determine the state supplemental contribution rate in accordance with EC §22955.1(b). The key elements of this calculation pertain to an evaluation of the assets and obligations associated with the benefits in effect in 1990. An adjustment to the state supplemental rate is calculated based onthis valuation and effective with the fiscal year beginning July 1, 2019.
Section 7 discusses the calculations used to determine the employer supplemental contribution rate in accordance with EC §22950.5. The key elements of this calculation are parallel to the funding valuation, exceptthe assets and obligations are those associated with the benefits earned prior to July 1, 2014. Note that the employer supplemental rate is currently based on a fixed schedule of increases. No adjustments to the scheduled rates will be calculated until the 2020 valuation.
Section 8 shows the projected UAO payment schedule and a comparison of the projected contributions and benefit payments for the DB Program.
Section 9 provides a general discussion of the potential risks to CalSTRS funding.
This report includes several appendices:
Appendix A is a summary of the current benefit structure, as determined by the provisions of governing law onJune 30, 2018.
Appendix B is a summary of the actuarial methods and assumptions used to estimate actuarial obligations and the funding sufficiency.
In our opinion, the assumptions used in the valuation are reasonably related to the past experience of the DB Program, are internally consistent, and represent a reasonable estimate of future conditions affecting the DB Program. Nevertheless, the emerging costs of the DB Program will vary from those presented in this report to the extent that actual experience differs from that projected by the actuarial assumptions.
Appendix C includes schedules of valuation data classified by various categories of plan members. We relied upon the membership and beneficiary data supplied by CalSTRS. We compared the data for this and the priorvaluation and tested for reasonableness. Based on these tests, we believe the data to be sufficient for the purposes of our calculations.
Appendix D is a glossary of actuarial terms used in this report.

Milliman June 30, 2018 Actuarial ValuationDefined Benefit Program of theCalifornia State Teachers’ Retirement System
This work product was prepared solely for CalSTRS for the purposes described herein and may not be appropriate to use for other purposes. Milliman does not intend to benefit and assumes no duty or liability to other parties who receive this work. Milliman recommends that third parties be aided by their own actuary or other qualified professional when reviewing the Milliman work product.
13
3. Actuarial ObligationIn this section, the discussion will focus on the commitments of CalSTRS for retirement benefits, which are referred to as its Actuarial Obligation. The Actuarial Obligation, or liabilities, are compared with the actuarial value of assets. If there is a deficiency, it has to be provided by future contributions, net actuarial gains due to experience more favorable than assumed or, to some extent, net growth in the number of active members. An actuarial valuation method sets out a schedule of future contributions and determines whether they will amortize any deficiency in an orderly fashion.
Normal Cost
The Normal Cost represents the cost assigned to an average member for a given year such that it would meet the continuing costs of a particular benefit if contributed each year starting with the date of membership. The Entry Age Actuarial Cost Method is designed to produce a Normal Cost that remains a level percentage of payroll (payroll is calculated as the sum of the expected creditable compensation for the active members) and isexpressed as a rate of compensation. Normal Cost contributions are assumed to be contributed uniformly throughout the year.
The following table shows that the total DB Program Normal Cost Rate has decreased from 20.275% to 20.181% since the last valuation. This rate represents a blended average of the Normal Cost Rates for the 2% at 60 and 2% at 62 members. Table 1 provides more details on the calculation of the Normal Cost and Normal Cost Rate.
In general, the Normal Cost Rate is expected to remain fairly stable as a percentage of payroll as long as the benefit provisions are not amended, the assumptions are not changed, membership experience emerges as assumed, and the demographic characteristics of the membership remain reasonably consistent. CalSTRS can expect modest decreases in the Normal Cost Rate as current members leave active employment and are replaced by new members with lower benefit levels. The Normal Cost Rate decreased slightly since last year mainly due to the increasing membership of CalSTRS 2% at 62 members who have a lower overall Normal Cost Rate than the 2% at 60 members. We expect this trend to continue in the future.
Primarily because of the different benefit formulas, the CalSTRS 2% at 60 members have different Normal Cost Rates compared to the 2% at 62 members, as illustrated in the following table for the fiscal year beginning July 1, 2018.
($ Millions) Projected Normal NormalPayroll Cost Cost Rate
FYB July 1, 2017 $32,670 $6,624 20.275%
FYB July 1, 2018 $33,387 $6,738 20.181%
($ Millions) 2% at 60 2% at 62 ProportionMembers Members 2% at 62
Projected Payroll $29,089 $4,298 12.9%
Normal Cost $ 5,970 768 11.4%
Normal Cost Rate 20.557% 17.863% NA

Milliman June 30, 2018 Actuarial ValuationDefined Benefit Program of theCalifornia State Teachers’ Retirement System Actuarial Obligation
This work product was prepared solely for CalSTRS for the purposes described herein and may not be appropriate to use for other purposes. Milliman does not intend to benefit and assumes no duty or liability to other parties who receive this work. Milliman recommends that third parties be aided by their own actuary or other qualified professional when reviewing the Milliman work product.
14
Normal Cost Rate for CalSTRS 2% at 62 Members
As part of the annual valuation process, we determine the Normal Cost Rate for CalSTRS 2% at 62 members, generally those first hired on or after January 1, 2013. The Normal Cost Rate is used as the basis for setting the base member contribution rate for this group for the following fiscal year, the fiscal year beginning July 1, 2019,for this valuation. Generally, the base member contribution rate is one-half of the Normal Cost Rate within certain parameters.
EC §22901(b)(1) requires the board to adopt the Normal Cost Rate that is used to determine the 2% at 62 member contribution rate. As of June 30, 2018, the Normal Cost Rate for the CalSTRS 2% at 62 members is 17.863%. We recommend the board adopt this rate.
EC §22901(b)(2) specifies that the CalSTRS 2% at 62 base member contribution rate does not change if the increase or decrease in the Normal Cost Rate for members is less than 1% of creditable compensation since the last adjustment. This year, the cumulative change is a decrease in the Normal Cost Rate of 0.030%, from 17.893% (the time of the last adjustment) to 17.863% for this group. Therefore, the current base member contribution rate should remain at 9.00% for 2% at 62 members based on the relevant section of the Education Code.
Note that increases under EC §22901.7(b) are added to the base member rate. Therefore, effective July 1, 2019,the total member contribution rate for 2% at 62 members continues to be 10.205% (9.00% plus the 1.205% additional contribution rate rate).
Actuarial Obligation
The next step in the actuarial valuation process is to project all future DB Program benefit payments for current members and retirees. The level of benefits currently being paid is known, but assumptions are needed to estimate how long they will be paid, and the amount and timing of the payment of future benefits for active and inactive members who are not currently receiving payments. The summation of the discounted values of all of the projected benefit payments for all current members at the assumed rate of return is called the Actuarial Present Value of Projected Benefits.
Details are shown in Table 2 and summarized below.
2018 2017Valuation Valuation
Benefits Being Paid $ 160,932 $ 154,304 Inactive Deferred Benefits 6,333 6,006 Active Member Benefits 206,841 201,730 Existing MPPP Unfunded Obligation 287 314
Present Value of Projected Benefits $ 374,393 $ 362,354
Present Value of Future Normal Costs 76,790 75,404
Actuarial Obligation $ 297,603 $ 286,950
($ Millions)

Milliman June 30, 2018 Actuarial ValuationDefined Benefit Program of theCalifornia State Teachers’ Retirement System Actuarial Obligation
This work product was prepared solely for CalSTRS for the purposes described herein and may not be appropriate to use for other purposes. Milliman does not intend to benefit and assumes no duty or liability to other parties who receive this work. Milliman recommends that third parties be aided by their own actuary or other qualified professional when reviewing the Milliman work product.
15
The Actuarial Present Value of Future Normal Costs is the value of all remaining Normal Costs expected to be received over the future working lifetime of current active members. The Actuarial Obligation is the difference between the Actuarial Present Value of Projected Benefits and the Actuarial Present Value of Future Normal Costs. The Actuarial Obligation is equal to the assets that would exist if the current Normal Cost Rate had been paid for all members since entry into the Program, and if all experience had emerged as assumed.
Over time, 2% at 62 members will account for a larger portion of the Actuarial Obligation; however, as of this valuation, only 1.8% of the Actuarial Obligation for active members is for the 2% at 62 members.
($ Millions) 2% at 60 2% at 62 ProportionMembers Members 2% at 62
Active PVB $189,675 $17,166 8.3%
Active PVFNC 61,918 14,872 19.4%
Active AO $127,757 $2,294 1.8%

Milliman June 30, 2018 Actuarial ValuationDefined Benefit Program of theCalifornia State Teachers’ Retirement System Actuarial Obligation
This work product was prepared solely for CalSTRS for the purposes described herein and may not be appropriate to use for other purposes. Milliman does not intend to benefit and assumes no duty or liability to other parties who receive this work. Milliman recommends that third parties be aided by their own actuary or other qualified professional when reviewing the Milliman work product.
16
Table 1Normal Cost
1. Annual payroll for active members on the valuation date, excluding active members over age 75 on the valuation date who are assumed to retire immediately and therefore do not generate a Normal Cost.
($Millions) 2018 2017
Estimated Annual Earned Salaries (1) $31,871 $31,502
Present Value of Future Normal Costs for Current Active Members $76,790 $75,404
Present Value of Future Earned Salaries for Current Active Members $387,081 $377,098
Normal Cost Service Retirement $5,711 $5,685 Deferred Retirement & Refund 406 390Death 47 49Disability 268 263
Total Normal Cost $6,432 $6,387
Normal Cost RatePercent of Payroll
Service Retirement 17.919 % 18.046 %Deferred Retirement & Refund 1.274 1.238 Death 0.147 0.156 Disability 0.841 0.835
Total Normal Cost 20.181 % 20.275 %
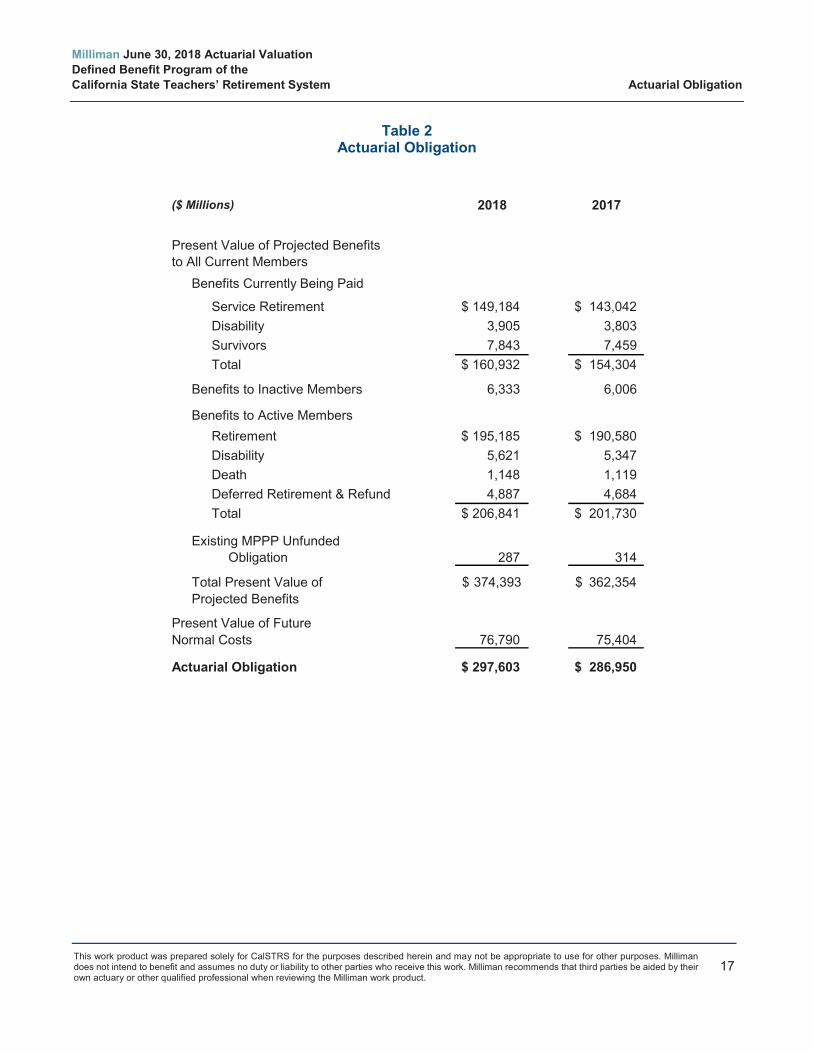
Milliman June 30, 2018 Actuarial ValuationDefined Benefit Program of theCalifornia State Teachers’ Retirement System Actuarial Obligation
This work product was prepared solely for CalSTRS for the purposes described herein and may not be appropriate to use for other purposes. Milliman does not intend to benefit and assumes no duty or liability to other parties who receive this work. Milliman recommends that third parties be aided by their own actuary or other qualified professional when reviewing the Milliman work product.
17
Table 2Actuarial Obligation
($ Millions) 2018 2017
Present Value of Projected Benefitsto All Current Members
Benefits Currently Being Paid
Service Retirement $ 149,184 $ 143,042 Disability 3,905 3,803 Survivors 7,843 7,459 Total $ 160,932 $ 154,304
Benefits to Inactive Members 6,333 6,006
Benefits to Active MembersRetirement $ 195,185 $ 190,580 Disability 5,621 5,347 Death 1,148 1,119 Deferred Retirement & Refund 4,887 4,684 Total $ 206,841 $ 201,730
Existing MPPP Unfunded Obligation 287 314
Total Present Value of 374,393$ 362,354$Projected Benefits
Present Value of FutureNormal Costs 76,790 75,404
Actuarial Obligation $ 297,603 $ 286,950
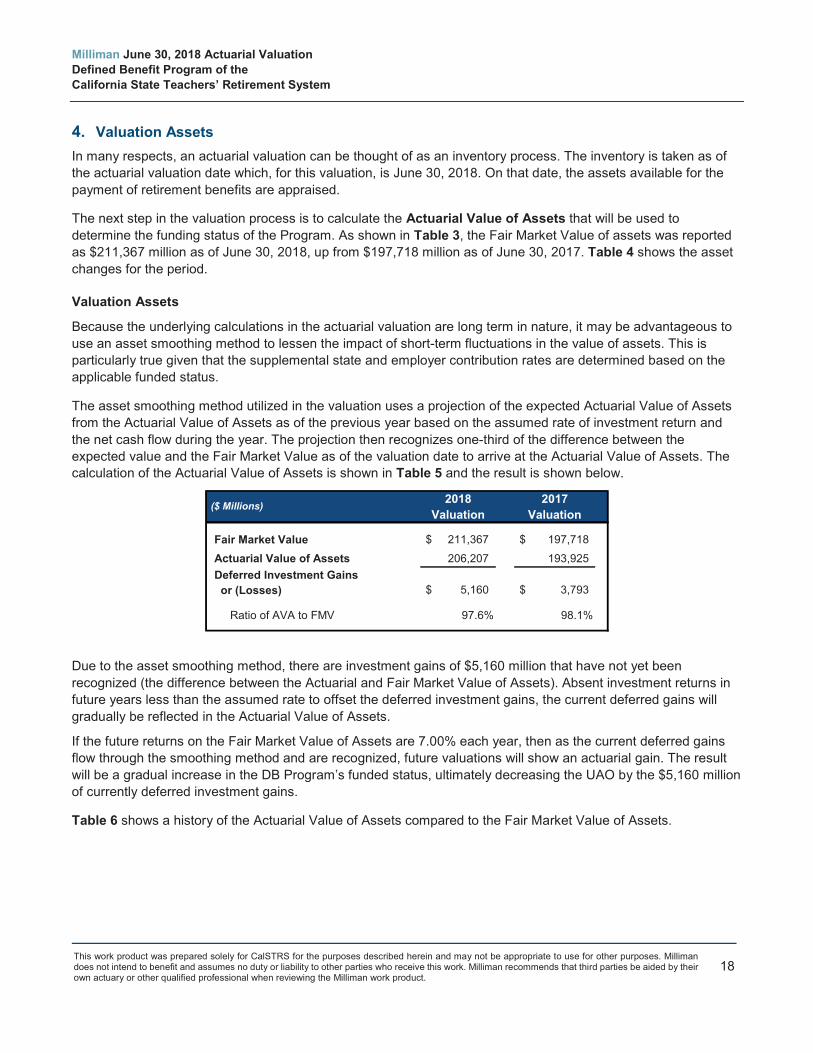
Milliman June 30, 2018 Actuarial ValuationDefined Benefit Program of theCalifornia State Teachers’ Retirement System
This work product was prepared solely for CalSTRS for the purposes described herein and may not be appropriate to use for other purposes. Milliman does not intend to benefit and assumes no duty or liability to other parties who receive this work. Milliman recommends that third parties be aided by their own actuary or other qualified professional when reviewing the Milliman work product.
18
4. Valuation AssetsIn many respects, an actuarial valuation can be thought of as an inventory process. The inventory is taken as of the actuarial valuation date which, for this valuation, is June 30, 2018. On that date, the assets available for the payment of retirement benefits are appraised.
The next step in the valuation process is to calculate the Actuarial Value of Assets that will be used to determine the funding status of the Program. As shown in Table 3, the Fair Market Value of assets was reported as $211,367 million as of June 30, 2018, up from $197,718 million as of June 30, 2017. Table 4 shows the asset changes for the period.
Valuation Assets
Because the underlying calculations in the actuarial valuation are long term in nature, it may be advantageous to use an asset smoothing method to lessen the impact of short-term fluctuations in the value of assets. This is particularly true given that the supplemental state and employer contribution rates are determined based on the applicable funded status.
The asset smoothing method utilized in the valuation uses a projection of the expected Actuarial Value of Assets from the Actuarial Value of Assets as of the previous year based on the assumed rate of investment return and the net cash flow during the year. The projection then recognizes one-third of the difference between the expected value and the Fair Market Value as of the valuation date to arrive at the Actuarial Value of Assets. The calculation of the Actuarial Value of Assets is shown in Table 5 and the result is shown below.
Due to the asset smoothing method, there are investment gains of $5,160 million that have not yet been recognized (the difference between the Actuarial and Fair Market Value of Assets). Absent investment returns in future years less than the assumed rate to offset the deferred investment gains, the current deferred gains willgradually be reflected in the Actuarial Value of Assets.
If the future returns on the Fair Market Value of Assets are 7.00% each year, then as the current deferred gainsflow through the smoothing method and are recognized, future valuations will show an actuarial gain. The result will be a gradual increase in the DB Program’s funded status, ultimately decreasing the UAO by the $5,160 million of currently deferred investment gains.
Table 6 shows a history of the Actuarial Value of Assets compared to the Fair Market Value of Assets.
2018 2017Valuation Valuation
Fair Market Value $ 211,367 $ 197,718 Actuarial Value of Assets 206,207 193,925 Deferred Investment Gains or (Losses) $ 5,160 $ 3,793
Ratio of AVA to FMV 97.6% 98.1%
($ Millions)

Milliman June 30, 2018 Actuarial ValuationDefined Benefit Program of theCalifornia State Teachers’ Retirement System Valuation Assets
This work product was prepared solely for CalSTRS for the purposes described herein and may not be appropriate to use for other purposes. Milliman does not intend to benefit and assumes no duty or liability to other parties who receive this work. Milliman recommends that third parties be aided by their own actuary or other qualified professional when reviewing the Milliman work product.
19
Table 3Statement of Program Assets
($ Millions)
Invested AssetsCash $ 404 $ 688 Debt Securities 41,288 38,856 Equity Securities 108,286 106,402 Alternative Investments 62,046 52,830 Derivative Instruments 29 -Total Investments $ 212,053 $ 198,776
Receivables 6,235 5,928
Liabilities Net of Securities Lending Collateral (6,979) (7,057)
Net Deferred (Inflows) and Outflows 58 71
Fair Market Value of Net Assets $ 211,367 $ 197,718
June 30, 2018 June 30, 2017

Milliman June 30, 2018 Actuarial ValuationDefined Benefit Program of theCalifornia State Teachers’ Retirement System Valuation Assets
This work product was prepared solely for CalSTRS for the purposes described herein and may not be appropriate to use for other purposes. Milliman does not intend to benefit and assumes no duty or liability to other parties who receive this work. Milliman recommends that third parties be aided by their own actuary or other qualified professional when reviewing the Milliman work product.
20
Table 4Statement of Changes in Program Assets
1. Estimated return on an Fair-Market-Value basis, net of all investment expenses, gross of administrative expenses, and assuming uniform cash flow throughout the year. This number may differ from the money-weighted return reported by CalSTRS.
($ Millions)
ContributionsMembers $ 3,345 $ 3,300 Employers 4,705 4,021 State of California 2,797 2,478
Total Contributions 10,847 9,799
Benefits and ExpensesRetirement, Death and Survivors (13,855) (13,226)Refunds of Member Contributions (75) (88)Purchasing Power Benefits (162) (161)Administrative & Other Expenses (205) (180)
Total Benefits and Expenses (14,297) (13,655)
Net Cash Flow $ (3,450) $ (3,856)
Investment IncomeRealized Income $ 5,350 $ 4,951 Net Appreciation 12,549 18,912 Net Securities Lending Income 49 98 Investment Expenses (473) (373)Other (Expense) Income 104 72
Net Investment Return 17,579 23,660
Net Increase (Decrease) $ 14,129 $ 19,804
Fair Market Value of Net AssetsBeginning of Year 197,718 177,914 Acounting Adjustments (GASB 75) (480) -Prior Year Fair Value Accrual Adjustment - -
End of Year 211,367$ 197,718$
Estimated Net Rate of Return (1) 9.0% 13.4%
June 30, 2018 June 30, 2017

Milliman June 30, 2018 Actuarial ValuationDefined Benefit Program of theCalifornia State Teachers’ Retirement System Valuation Assets
This work product was prepared solely for CalSTRS for the purposes described herein and may not be appropriate to use for other purposes. Milliman does not intend to benefit and assumes no duty or liability to other parties who receive this work. Milliman recommends that third parties be aided by their own actuary or other qualified professional when reviewing the Milliman work product.
21
Table 5Actuarial Value of Assets
1. Estimated return on an Actuarial-Value basis, net of all investment expenses, gross of administrative expenses, and assuming uniform cash flow throughout the year.
($ Millions)
Actuarial Value at Beginning of Year $ 193,445 $ 182,772 Contributions 10,847 9,799 Benefits (14,092) (13,655)Expected Return at 7.0% / 7.25% 13,427 13,112
Expected Actuarial Value End of of Year $ 203,627 $ 192,028
Fair Market Value 211,367 197,718
7,740$ 5,690$
Recognition Factor One-third One-third
Recognized Gain or Loss 2,580$ 1,897$
Actuarial Value at End of of Year 206,207$ 193,925$
Deferred Investment Gains or (Losses) 5,160$ 3,793$
97.559% 98.082%
Estimated Net Rate of Return (1) 8.3% 6.1%
June 30, 2018 June 30, 2017
Difference between Fair Market Value and Expected Actuarial Value
Ratio of Actuarial Value of Assets to Fair Market Value of Assets

Milliman June 30, 2018 Actuarial ValuationDefined Benefit Program of theCalifornia State Teachers’ Retirement System Valuation Assets
This work product was prepared solely for CalSTRS for the purposes described herein and may not be appropriate to use for other purposes. Milliman does not intend to benefit and assumes no duty or liability to other parties who receive this work. Milliman recommends that third parties be aided by their own actuary or other qualified professional when reviewing the Milliman work product.
22
Table 6History of Actuarial Value of Assets
($ Millions) Ratio of
June 30 Fair Market
ValueEstimatedReturn (1)
ActuarialValue
Actuarialto Market
2001 $ 102,915 (9.1) % $ 108,571 105%2002 96,028 (6.1) 109,755 1142003 99,031 3.8 111,604 1132004 113,815 16.6 117,206 1032005 126,447 12.3 125,665 992006 140,192 12.5 135,832 972007 166,903 20.9 151,827 912008 155,763 (5.5) 159,785 1032009 113,192 (25.4) 150,445 1332010 123,242 12.9 146,404 1192011 147,140 23.6 151,030 1032012 143,118 0.6 152,515 1072013 157,176 13.9 157,883 1002014 179,479 18.6 168,838 942015 180,633 3.9 177,059 982016 177,914 1.3 182,772 1032017 197,718 13.4 193,925 982018 211,367 9.0 206,207 98
1. Estimated return on an Fair-Value basis, net of all investment expenses, gross of administrative expenses, and assuming uniform cash flow throughout the year, reported on a dollar-weighted basis.
$-
$50
$100
$150
$200
$250
2004 2006 2008 2010 2012 2014 2016 2018
($ B
illio
ns)
Fair Market Value Actuarial Value

Milliman June 30, 2018 Actuarial ValuationDefined Benefit Program of theCalifornia State Teachers’ Retirement System
This work product was prepared solely for CalSTRS for the purposes described herein and may not be appropriate to use for other purposes. Milliman does not intend to benefit and assumes no duty or liability to other parties who receive this work. Milliman recommends that third parties be aided by their own actuary or other qualified professional when reviewing the Milliman work product.
23
5. Funded StatusThe Unfunded Actuarial Obligation (UAO) is the excess of the Actuarial Obligation over the Actuarial Value of Assets, which represents a liability that must be funded over time. Contributions in excess of the Normal Cost are used to amortize the UAO. An Actuarial Surplus exists if the Actuarial Value of Assets exceeds the Actuarial Obligation.
The Funded Ratio is equal to the Actuarial Value of Assets divided by the Actuarial Obligation. A Funded Ratio of 100% means the Value of Assets equals the Actuarial Obligation, and the DB Program could be financed by contributions equal to the Normal Cost, if all future experience emerged as assumed. The Funded Ratio is shown below and in Table 7.
The Funded Ratio increased by 1.4% during the past year and has decreased by approximately 23% over the past 10 years. The return on the Actuarial Value of Assets (8.3%) that exceeded the assumed return (7.0%) was the primary cause of the increase in the Funded Ratio from last year. The longer-term decrease has been primarily due to a combination of returns over the last 10 years that have, on a smoothed basis, been less than the actuarial assumption, contributions less than the actuarially calculated amount, and changes in the actuarial assumptions that have increased the Actuarial Obligation. The Alternate Funded Ratio using the Fair Market Value of assets has increased since the last valuation. This increase is due to the greater than expected return on assets during the 2017-2018 fiscal year.
Future benefits provided through the Supplemental Benefits Maintenance Account (SBMA) are not part of the projected benefits included in this valuation. Therefore, the SBMA Reserve is subtracted from the DB Program assets to arrive at the value available to support the benefits included in this valuation.
In addition, the Teachers’ Retirement Board has established a policy of allocating funds for future costs associated with the Teachers’ Health Benefits Fund (THBF). This policy was revised in April of 2009 to make a one-time credit to the THBF and “true up” the future MPPP obligations (payable from the THBF) in the funding of the DB Program. As of June 30, 2018, only a relatively small amount to cover monthly payments resides in the THBF, while the remaining unfunded amount of $287 million is added to the DB Program obligation.
($ Millions) 2018 2017Valuation Valuation
Actuarial Obligation $ 297,603 $ 286,950
Actuarial Value of Assets (AVA) From Table 5 $ 206,207 $ 193,925 Less SBMA Reserve (15,756) (14,236) Net for Funding 190,451 179,689
Unfunded Actuarial Obligation $ 107,152 $ 107,261
Funded Ratio (on AVA) 64.0% 62.6%
Alternate Funded Ratio (based on Fair Market Value) 65.7% 63.9%
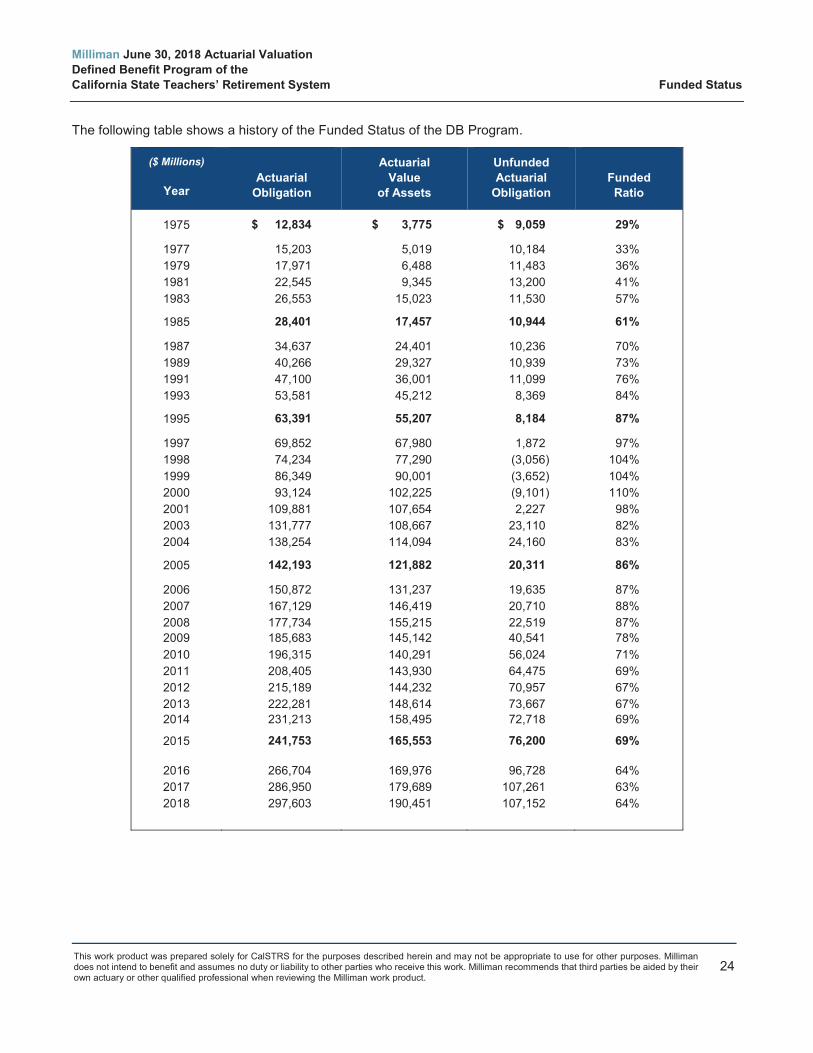
Milliman June 30, 2018 Actuarial ValuationDefined Benefit Program of theCalifornia State Teachers’ Retirement System Funded Status
This work product was prepared solely for CalSTRS for the purposes described herein and may not be appropriate to use for other purposes. Milliman does not intend to benefit and assumes no duty or liability to other parties who receive this work. Milliman recommends that third parties be aided by their own actuary or other qualified professional when reviewing the Milliman work product.
24
The following table shows a history of the Funded Status of the DB Program.
($ Millions)
YearActuarial
Obligation
ActuarialValue
of Assets
UnfundedActuarial
Obligation FundedRatio
1975 $ 12,834 $ 3,775 $ 9,059 29%
1977 15,203 5,019 10,184 33%1979 17,971 6,488 11,483 36%1981 22,545 9,345 13,200 41%1983 26,553 15,023 11,530 57%
1985 28,401 17,457 10,944 61%
1987 34,637 24,401 10,236 70%1989 40,266 29,327 10,939 73%1991 47,100 36,001 11,099 76%1993 53,581 45,212 8,369 84%
1995 63,391 55,207 8,184 87%
1997 69,852 67,980 1,872 97%1998 74,234 77,290 (3,056) 104%1999 86,349 90,001 (3,652) 104%2000 93,124 102,225 (9,101) 110%2001 109,881 107,654 2,227 98%2003 131,777 108,667 23,110 82%2004 138,254 114,094 24,160 83%
2005 142,193 121,882 20,311 86%
2006 150,872 131,237 19,635 87%2007 167,129 146,419 20,710 88%2008 177,734 155,215 22,519 87%2009 185,683 145,142 40,541 78%2010 196,315 140,291 56,024 71%2011 208,405 143,930 64,475 69%2012 215,189 144,232 70,957 67%2013 222,281 148,614 73,667 67%2014 231,213 158,495 72,718 69%
2015 241,753 165,553 76,200 69%
2016 266,704 169,976 96,728 64%2017 286,950 179,689 107,261 63%2018 297,603 190,451 107,152 64%

Milliman June 30, 2018 Actuarial ValuationDefined Benefit Program of theCalifornia State Teachers’ Retirement System Funded Status
This work product was prepared solely for CalSTRS for the purposes described herein and may not be appropriate to use for other purposes. Milliman does not intend to benefit and assumes no duty or liability to other parties who receive this work. Milliman recommends that third parties be aided by their own actuary or other qualified professional when reviewing the Milliman work product.
25
The historical Funded Ratios are shown on the following graph. In years in which a valuation was not performed, the Funded Ratio from the previous year is used.
Actuarial Gains and Losses
Comparing the UAO as of two valuation dates does not provide enough information to determine whether there were actuarial gains or losses. The correct comparison is between the UAO on the valuation date and the expected UAO projected from the prior valuation date using the actuarial assumptions in effect since the previous valuation.
The actuarial gains and losses since the last report are summarized in the following tables and shown in Table 8.
0%
20%
40%
60%
80%
100%
120%
1975 1980 1985 1990 1995 2000 2005 2010 2015
Historical Funded Ratio
Funded Ratio Target
Expected Actual (Gain) orResults Results Loss
Actuarial Obligation $ 299,465 $ 297,603 $ (1,862) Act. Value of Assets 188,320 190,451 (2,131) Unfunded Act. Oblig. $ 111,145 $ 107,152 $ (3,993)
$ 0
(2,099)
237 $ (1,862)
(2,100)
(31)
$ (2,131)
$ (3,993)
Contributions (in excess of) or less than assumed
(Gain) on the Actuarial Value of Assets
Total Actuarial (Gain)
($ Millions)
Actuarial (Gains) or Losses by Source
Change in actuarial assumptions
Salaries increased less than assumed
All other non-investment sources (Gain) on the Actuarial Obligation
Investment Return on Actuarial Value of Assets

Milliman June 30, 2018 Actuarial ValuationDefined Benefit Program of theCalifornia State Teachers’ Retirement System Funded Status
This work product was prepared solely for CalSTRS for the purposes described herein and may not be appropriate to use for other purposes. Milliman does not intend to benefit and assumes no duty or liability to other parties who receive this work. Milliman recommends that third parties be aided by their own actuary or other qualified professional when reviewing the Milliman work product.
26
($ Millions)
Actuarial (Gains) or Losseson the Actuarial Obligation
(Gain) orLoss
Percent ofActuarial
Obligation
Change in actuarial assumptionsSalaries increased less than assumed
$ 0(2,099)
0.0%(0.7)
All other non-investment sources 237 0.1
(Gain) or Loss on the Actuarial Obligation $ (1,862) (0.6)%
Actuarial (Gains) or Losseson the Actuarial Value of Assets
(Gain) orLoss
Percent ofAVA
Return on Actuarial Value of Assets $ (2,100) (1.1)%
Contributions (greater)/less than assumed (31) (0.0)
(Gain) or Loss on the Actuarial Value of Assets $ (2,131) (1.1)%
These net gains and losses are within a reasonable range for variances in a single year.
Based on the 2017 Actuarial Valuation, the UAO was expected to increase to $111,145 million. The actual UAOof $107,152 million represents a net actuarial gain of $3,993 million.
� Salaries increased less than projected by the current actuarial assumptions, causing the Actuarial Obligation to decrease by $2,099 million from the expected amount. We expect to continue to see salary increase fluctuations from year to year.
� All other non-investment experience represents only a relatively small portion of the expected Actuarial Obligation. These relatively minor net gains and losses indicate that the census is reasonably consistent from the prior period, and the actual experience tracked closely overall with the actuarial assumptions(exclusive of the asset return and salary increases)
� On the asset side, there was an asset gain based on both the actuarial value of assets and the Market Value of Assets, as the investment return on the Fair Market Value of Assets was greater than the prior valuation’s 7.00% assumption. The return on market value was estimated at 9.0%, while the return on the Actuarial Value of Assets was less (estimated at 8.3%) due to recognizing only a portion of the current year actuarial investment gain.

Milliman June 30, 2018 Actuarial ValuationDefined Benefit Program of theCalifornia State Teachers’ Retirement System Funded Status
This work product was prepared solely for CalSTRS for the purposes described herein and may not be appropriate to use for other purposes. Milliman does not intend to benefit and assumes no duty or liability to other parties who receive this work. Milliman recommends that third parties be aided by their own actuary or other qualified professional when reviewing the Milliman work product.
27
Actuarial Gain and Loss History
To get an idea of the overall trend of gains and losses, we have analyzed actuarial gains and losses since 2014.The following graph shows how changes in assumptions have increased the UAO over the last five years. It also shows the actuarial investment gains that have somewhat offset this.
* Year-to-Year Experience includes changes due to Termination, Retirement, Mortality, and Other Experience.
Over the last five years, assumptions changes have increased the UAO by over $20 billion. During that period, investment returns that have generally exceeded the assumed return and salary increases that have generally been less than assumed have caused decreases in the UAO, partially offsetting the increase due to assumptions. All other experience has had a relatively small impact.
Note that the UAO has increased by approximately $33 billion over the last 5 years. This compares to the net effect of actuarial gains and losses (including assumption changes) described above which account for approximately $11 billion of the increase in UAO. The remaining $22 billion increase is due to contributions received by CalSTRS that were less than the actuarially calculated rate. These contributions were insufficient to cover the interest on the UAO resulting in an increase in the UAO. Under the new funding law, the contributions are projected to eventually cover the interest on the UAO and reduce the principal, but this is not projected to occur for a few more years due to the graded increases in the state and employer contribution rates. Based on the baseline projections included in this report, the UAO is projected to start declining in 2027 and be lower than the current value by the year 2031.
-$15
-$10
-$5
$0
$5
$10
$15
$20
$25
2014 2015 2016 2017 2018 2014-18
Chan
ge in
$Bi
llions
Investment Return Assumptions & Methods Salary Experience Year-to-Year Experience *
(Gain) / Loss by Year 5-Year Total

Milliman June 30, 2018 Actuarial ValuationDefined Benefit Program of theCalifornia State Teachers’ Retirement System Funded Status
This work product was prepared solely for CalSTRS for the purposes described herein and may not be appropriate to use for other purposes. Milliman does not intend to benefit and assumes no duty or liability to other parties who receive this work. Milliman recommends that third parties be aided by their own actuary or other qualified professional when reviewing the Milliman work product.
28
Table 7Funded Status
($ Millions) 2018 2017
Actuarial Obligation (Table 2) $297,603 $286,950
Actuarial Value of Assets
Calculated (Table 5) $ 206,207 $ 193,925Less SBMA Reserve (15,756) (14,236)
Program Assets $ 190,451 $ 179,689
Unfunded Actuarial Obligation $ 107,152 $ 107,261
Funded Ratio 64.0% 62.6%

Milliman June 30, 2018 Actuarial ValuationDefined Benefit Program of theCalifornia State Teachers’ Retirement System Funded Status
This work product was prepared solely for CalSTRS for the purposes described herein and may not be appropriate to use for other purposes. Milliman does not intend to benefit and assumes no duty or liability to other parties who receive this work. Milliman recommends that third parties be aided by their own actuary or other qualified professional when reviewing the Milliman work product.
29
Table 8Actuarial Gains and Losses
($ Millions) Expected Actual (Gain) / Loss
Actuarial Obligation
Actuarial Obligation June 30, 2017 $286,950Normal Cost for 2017-2018 6,611Benefits Paid (Excludes Purchasing Power) (13,930)Expected Interest at 7.00% 19,835
Actuarial Obligation June 30, 2018 $299,465 $297,603 $ (1,862)
By Source:Change in actuarial assumptions 0Retiree Mortality (115)Active Member Mortality 84Service Retirements 164Disability Retirement (3)Other Terminations of Employment 211Salary increases more / (less) than assumed (2,099)All Other Non-investment Sources (104)
Total (Gain) Loss on the Actuarial Obligation $ (1,862)
Actuarial Value of Assets
Actuarial Value of Assets June 30, 2017 $179,689Expected Contributions for 2017-2018 10,116Benefits Paid (Excludes Purchasing Power) (13,930)Expected Interest at 7.00% on AVA 12,444Actuarial Value of Assets June 30, 2018 $188,319 $190,451 $ (2,132)
By Source: Investment Return on Actuarial Value of Assets (including the recognition of prior deferred investment gains and losses) $ (2,101)
Contributions (in excess of) or less than assumed(including service purchases) (31)
Total (Gain) Loss on the Actuarial Value of Assets $ (2,132)
Unfunded Actuarial Obligation $111,145 $107,152 $(3,993)

Milliman June 30, 2018 Actuarial ValuationDefined Benefit Program of theCalifornia State Teachers’ Retirement System
This work product was prepared solely for CalSTRS for the purposes described herein and may not be appropriate to use for other purposes. Milliman does not intend to benefit and assumes no duty or liability to other parties who receive this work. Milliman recommends that third parties be aided by their own actuary or other qualified professional when reviewing the Milliman work product.
30
6. State Supplemental Contribution RateUnder EC §22955.1(b), scheduled increases in the state contribution rate were required through June 30, 2017,with subsequent adjustments to the contribution rate based on actuarial funding. We will refer to this contribution as the state supplemental contribution. Note that for the state, the payroll is the second prior fiscal year payroll, so contributions made in fiscal year 2019-2020 will be based on the covered member compensation for fiscal year 2017-2018. The state supplemental rate is in addition to the base state contribution under EC §22955.1(a) of 2.017% of payroll and contributions to fund the SBMA under EC §22954.
Effective July 1, 2017, the board shall increase or decrease the state supplemental contribution rate (within certain parameters) to reflect the contribution required to eliminate the remaining UAO associated with the 1990 benefit and contribution rate structure. This will be referred to as the 1990 UAO. State supplemental contributions are included as part of the 1990 UAO. Although not specified in the law, the board’s valuation policy calls for the state supplemental contribution rate to be calculated to amortize the UAO by June 30, 2046.
Changes in the state supplemental contribution are determined annually beginning with the 2016 valuation and subject to the following conditions:
� The state supplemental contribution rate cannot increase by more than 0.5% of payroll over the prior year supplemental rate. There is no limit on decreases, except for the 4.311% floor discussed below.
� In any year when there is no UAO for the 1990 Benefit Structure, the supplemental contribution shall be reduced to zero.
� The state supplemental contribution rate shall not be reduced below 4.311% if a UAO for the 1990 Benefit Structure exists.
The state is contributing at 5.311% of pay for the current fiscal year ending June 30, 2019. In accordance with the valuation policy, this rate is increased to 5.811% for the next fiscal year as discussed in this section.
1990 Unfunded Actuarial Obligation
The 1990 Actuarial Obligation for the DB Program is calculated using the benefit provisions in place during 1990. CalSTRS provides us with supplementary information on the census data for this determination. The process has limitations since we do not know, for example, whether members would have retired earlier or later if the post-1990 benefit enhancements had not been enacted. However, we believe it is a reasonable process to estimate what the Actuarial Obligation would be if only the 1990 benefits were currently in place.
There were no benefit improvements enacted between 1990 and 1998 that had a material cost. All benefit enhancements enacted with effective dates from July 1, 1990 to December 31, 1998 have been presumed to be cost-neutral. Due to the enhanced retirement benefits enacted since 1990, a separate set of retirement probabilities is used to evaluate the 1990 Benefit Structure.

Milliman June 30, 2018 Actuarial ValuationDefined Benefit Program of theCalifornia State Teachers’ Retirement System State Supplemental Contribution Rate
This work product was prepared solely for CalSTRS for the purposes described herein and may not be appropriate to use for other purposes. Milliman does not intend to benefit and assumes no duty or liability to other parties who receive this work. Milliman recommends that third parties be aided by their own actuary or other qualified professional when reviewing the Milliman work product.
31
The Actuarial Obligation related to the 1990 Benefit Structure is $243.9 billion. This compares to the Actuarial Obligation for the DB Program of $297.6 billion.
To estimate the portion of the Actuarial Value of Assets associated with the 1990 Actuarial Obligation, the current Actuarial Value of Assets for the DB Program are adjusted for 1) contributions started after September 30, 1998 (excluding the state supplemental contributions under 22955.1(b)) as detailed below, and 2) additional benefits that have been paid over time due to the post-1990 benefit increases. Limitations exist with this approach since precise data regarding the portion or the timing of benefit payments that would be attributable to only the 1990 benefit structure is unknown.
The most significant adjustments to the assets are:
� Eliminating contributions in excess of 16.00% (except for the state supplemental contributions),� Adding back the member contributions that were directed to the DBS Program,� Adding back the post-1990 benefit enhancements that have been paid, and� Adjusting for actual investment return.
See Table 9 for the details of the asset adjustment.
For purposes of testing the funding sufficiency of the 1990 Benefit Structure, note that we did not reserve the board’s allocation of assets for future THBF costs because it was established subsequent to 1990.
2018 2017Valuation Valuation
Actuarial Obligation -- 1990 Benefit Structure
Value of Projected Benefits 311,968$ 300,895$
Value of Future Normal Costs 68,092 66,249
Actuarial Obligation 243,876$ 234,646$
($ Millions)
2018 2017Valuation Valuation
Asset Adjustment -- 1990 Benefit Structure
Actuarial Value for DB Program 190,451$ 179,689$ Adjustments per Table 9 20,039 19,616
Actuarial Value of Assets 210,490$ 199,305$
($ Millions)

Milliman June 30, 2018 Actuarial ValuationDefined Benefit Program of theCalifornia State Teachers’ Retirement System State Supplemental Contribution Rate
This work product was prepared solely for CalSTRS for the purposes described herein and may not be appropriate to use for other purposes. Milliman does not intend to benefit and assumes no duty or liability to other parties who receive this work. Milliman recommends that third parties be aided by their own actuary or other qualified professional when reviewing the Milliman work product.
32
The following table summarizes the Funded Status of the 1990 Benefit Structure as detailed in Table 10. The 1990 Benefit Structure has an actuarial deficit equal to the UAO of $33.4 billion.
State Supplemental Contributions
The statute calls for an adjustment to the state supplemental contribution to amortize the 1990 UAO effective with the 2016 and later actuarial valuations. An increase in the state supplemental contribution rate is needed effective July 1, 2019.
As shown in Table 10, a supplemental contribution rate of 7.815% of payroll is needed to amortize the 1990 UAO by June 30, 2046 based on the board’s current valuation policy. This is based on an unconstrained increase of about 2.5% of payroll from the current supplemental rate of 5.311%. However, increases in the state contribution rate are limited to 0.5%. Therefore, the state supplemental contribution rate for the fiscal year beginning July 1, 2019 should be 5.811% under EC §22955.1(b). Note that the 7.815% is based on the Actuarial Value of Assets, so it does not reflect the future recognition of currently deferred asset gains and losses, and therefore differs from the projection shown in the “Looking Ahead” subsection of Section 1.
The funded status of the 1990 Benefit Structure in future years is difficult to forecast because the Actuarial Value of Assets for the 1990 Benefit Structure includes adjustments for contributions and benefits paid in excess of those that were in place in 1990. The benefits paid may also vary considerably depending on demographic experience.
2018 2017Valuation Valuation
Funded Status -- 1990 Benefit Structure
Actuarial Obligation 243,876$ 234,646$ Actuarial Value of Assets 210,490 199,305 Unfunded Actuarial Obligation $ 33,386 $ 35,341
Funded Ratio 86.3% 84.9%
($ Millions)

Milliman June 30, 2018 Actuarial ValuationDefined Benefit Program of theCalifornia State Teachers’ Retirement System State Supplemental Contribution Rate
This work product was prepared solely for CalSTRS for the purposes described herein and may not be appropriate to use for other purposes. Milliman does not intend to benefit and assumes no duty or liability to other parties who receive this work. Milliman recommends that third parties be aided by their own actuary or other qualified professional when reviewing the Milliman work product.
33
Actuarial Gains and Losses
Similar to the total DB Program, we perform a comparison for the 1990 Benefit Structure between the UAO on the valuation date and the Expected UAO projected from the prior valuation date using the actuarial assumptions in effect since the previous valuation.
The actuarial gains and losses since the last report for the 1990 Benefit Structure are summarized in the following table. Note that projected payroll used in the 1990 Actuarial Obligation is fractionally different than in the calculation of the total Actuarial Obligation because the retirement assumption used in the calculations differ.
Expected Actual (Gain) orResults Results Loss
Actuarial Obligation $ 244,825 $ 243,876 $ (949) Act. Value of Assets 208,169 210,490 (2,321) Unfunded Act. Oblig. $ 36,656 $ 33,386 $ (3,270)
$ 0
(1,673)
724 $ (949)
(2,450)
129
$ (2,321)
$ (3,270)
Investment Return on Actuarial Value of Assets
Contributions (in excess of) or less than assumed
(Gain) on the Actuarial Value of Assets
Total Actuarial (Gain)
($ Millions)
Actuarial (Gains) or Losses by Source
Change in actuarial assumptions
Salaries increased less than assumed
All other non-investment sources (Gain) on the Actuarial Obligation

Milliman June 30, 2018 Actuarial ValuationDefined Benefit Program of theCalifornia State Teachers’ Retirement System State Supplemental Contribution Rate
This work product was prepared solely for CalSTRS for the purposes described herein and may not be appropriate to use for other purposes. Milliman does not intend to benefit and assumes no duty or liability to other parties who receive this work. Milliman recommends that third parties be aided by their own actuary or other qualified professional when reviewing the Milliman work product.
34
Table 9Asset Adjustment for 1990 Benefit Structure
1. May not add exactly, due to rounding.2. Based on Fair Market Value and uniform cash flow for contributions, benefits, and expenses. The rates of return used in these calculations were 13.44% for 2016-2017 and 8.88% for 2017-2018.3 Developed from Table 5.
($ Millions) 2018 2017
Assets Adjustment due for 1990 Structure Changes
Allocated Market Value at Beginning of Year $20,000 $18,232
Contributions During the YearEC §22901.7 at 2.250% (or 1.205%) of Earned Salaries (688) (684)
EC §22950.5 at 6.180% / 4.330% of Earned Salaries (2,015) (1,384)EC §22951 at 0.250% of Earned Salaries (82) (80)EC §22955 at 2.017% of second preceding fiscal year Earned Salaries (618) (581)THBF costs reallocated to DB Program 28 29
Total Adjustment to Contributions(1) (3,375) (2,700)Benefits Paid During the Year
Post-1990 Benefits Paid During the Year 2,205 2,077Post-1990 Refunds of supplemental member contributions 3 3Prior 2% DBS redirection contributions refunded (10) (10)
Total Adjustment to Benefits Paid (1) 2,198 2,070
Estimated Investment Earnings for the Year (2) 1,717 2,398
Total Allocated Market Value at End of Year $20,540 $20,000
Ratio of Actuarial Value to Market Value (3) 97.559% 98.082%
Asset Adjustment (Actuarial Value of Assets) $20,039 $19,616

Milliman June 30, 2018 Actuarial ValuationDefined Benefit Program of theCalifornia State Teachers’ Retirement System State Supplemental Contribution Rate
This work product was prepared solely for CalSTRS for the purposes described herein and may not be appropriate to use for other purposes. Milliman does not intend to benefit and assumes no duty or liability to other parties who receive this work. Milliman recommends that third parties be aided by their own actuary or other qualified professional when reviewing the Milliman work product.
35
Table 10Funded Status and Supplemental Contribution Rate for 1990 Benefit Structure
($ Millions) 2018 2017Actuarial Obligation
Present Value of Projected BenefitsBenefits Currently Being Paid 134,102$ 128,651$Benefits to Inactive Members 6,116 5,808Benefits to Active Members 171,750 166,436
Total 311,968$ 300,895$Present Value of Future Normal Costs (68,092) (66,249)Actuarial Obligation 243,876$ 234,646$
Actuarial Value of Assets
Actuarial Value of Assets (Table 7) 190,451$ 179,689$Plus, 1990 Asset Adjustment (Table 9) 20,038 19,616Theoretical AVA for 1990 Benefits 210,489$ 199,305$
Funded Status Actuarial Obligation 243,876$ 234,646$Actuarial Value of Assets 210,489 199,305Unfunded Actuarial Obligation (Surplus) 33,387$ 35,341$Funded Ratio 86.3% 84.9%
Amortization Sufficiency Under Current Contribution ScheduleRevenue for 1990 Benefits 16.000% 16.000%Normal Cost Rate for 1990 Benefits (17.613) (17.615)
(1.613%) (1.615%)
(1.726%) (1.726%)
5.311 4.811
Revenue Available for Amortization 3.585% 3.085%Revenue Needed for Amortization 6.089 6.487 Revenue Surplus / (Deficit) (2.504%) (3.402%)
Contribution Intreases Needed
Contribution Intreases Needed
Contribution Rate for Amortization of 1990 UAO without Statutory Limits 5.311% 4.811%
2.504 3.402
7.815% 8.213%
Contribution Rate for Amortization of 1990 UAO with Statutory Limits 5.311% 4.811%
0.500 0.500
5.811% 5.311%
Current EC 22955.1(b) Contribution RateIncrease / (Decrease) in State Contribution Rate for Next Fiscal Year (Increase capped at 0.5%)EC 22955.1(b) Contribution Rate for Next FY
Equivalent Normal Cost Surplus / (Deficit) Express as Percent of Employer PayrollEquivalent Normal Cost Surplus / (Deficit) Express as Percent of State PayrollLevel Equivalent Additional Revenue Under EC 22955.1(b)
Increase / (Decrease) in State Contribution Rate for Next Fiscal YearUnconstrained Contribution Rate for Next FY
Amortization Status under current contribution rate
Current EC 22955.1(b) Contribution Rate

Milliman June 30, 2018 Actuarial ValuationDefined Benefit Program of theCalifornia State Teachers’ Retirement System
This work product was prepared solely for CalSTRS for the purposes described herein and may not be appropriate to use for other purposes. Milliman does not intend to benefit and assumes no duty or liability to other parties who receive this work. Milliman recommends that third parties be aided by their own actuary or other qualified professional when reviewing the Milliman work product.
36
7. Employer Supplemental Contribution RateUnder EC §22950.5, increases in the employer contribution rate are required, reaching an ultimate increase of 10.85% of payroll as of July 1, 2020. We will refer to this contribution as the employer supplemental contribution. The employer supplemental rate is in addition to the base employer contribution under EC §22950 and §22951 of 8.25% of payroll.
Effective July 1, 2021, the board shall increase or decrease the employer supplemental contribution rate (within certain parameters) to reflect the contribution required to eliminate the remaining UAO associated with service earned prior to July 1, 2014. This will be referred to as the pre-2014 UAO.
There is an additional complexity in that the pre-2014 UAO that the employer is responsible for funding overlaps with the 1990 UAO that the state is responsible for funding. Under the board’s valuation policy, the pre-2014 UAO is split into two separate pieces: 1) the pre-2014 UAO for the 1990 Benefit Structure; and 2) the pre-2014 UAO for “new” benefits (i.e., those adopted after 1990). The employers are responsible for funding the New Benefit UAO. However, the employer supplemental contribution rate must, at a minimum, be sufficient to pay down the total Pre-2014 UAO when combined with the base employer rate and the state and member contribution rates. This is referred to as the “minimum rate.”
Changes in the employer supplemental contribution are determined annually beginning with the 2020 valuation and are subject to the following conditions:
� The employer supplemental contribution rate cannot increase or decrease by more than 1.0% of payroll over the prior year supplemental rate.
� The employer supplemental contribution rate cannot exceed 12.00%. To determine the pre-2014 UAO for New Benefits, we must determine the total UAO for pre-2014 service and subtract the 1990 UAO for pre-2014 service.
Pre-2014 Unfunded Actuarial Obligation
The pre-2014 Actuarial Obligation for the DB Program is calculated using service through June 30, 2014 and projected salaries. Since there are no future service accruals for this portion of the Actuarial Obligation, the Projected Unit Credit actuarial cost method is used, per the board’s valuation policy.
To determine the pre-2014 assets to be used in the 2018 valuation, a theoretical pre-2014 asset value is maintained based on the prior year value adjusted as follows:
� Add total contributions (excluding SBMA),� Subtract total Normal Costs for prior year,� Subtract benefit payments attributable to pre-2014 service, and� Adjust for actual investment return.
See Table 11 for the details of the asset adjustment.
Pre-2014 Unfunded Actuarial Obligation for 1990 Benefit Structure
A second calculation is done to isolate the portion of the pre-2014 UAO that is allocated to the 1990 Benefit Structure and therefore is subject to state funding. The Actuarial Obligation for this portion is calculated using the 1990 Benefit Structure, service through June 30, 2014 and projected salaries. Since there are no future service accruals, the Projected Unit Credit actuarial cost method is used.

Milliman June 30, 2018 Actuarial ValuationDefined Benefit Program of theCalifornia State Teachers’ Retirement System Employer Supplemental Contribution Rate
This work product was prepared solely for CalSTRS for the purposes described herein and may not be appropriate to use for other purposes. Milliman does not intend to benefit and assumes no duty or liability to other parties who receive this work. Milliman recommends that third parties be aided by their own actuary or other qualified professional when reviewing the Milliman work product.
37
To determine the pre-2014 assets allocated to the 1990 Structure that are to be used in the 2018 valuation, a theoretical pre-2014 asset value for the 1990 Structure is maintained based on the prior year value adjusted as follows:
� Add contributions equal to 16.00% of prior year payroll,� Add state supplemental contributions under EC §22955.1(b),� Subtract total Normal Costs for prior year attributable to 1990 Benefit Structure,� Subtract benefit payments attributable to pre-2014 service and the 1990 Benefit Structure, and� Adjust for actual investment return.
See Table 12 for the details of the asset adjustment.
Pre-2014 Unfunded Actuarial Obligation for New Benefits
The following table shows the calculation of the UAO for Pre-2014 Service attributable to New Benefits.
Employer Supplemental Contributions
The statute calls for an adjustment to the employer supplemental contribution rate to amortize the pre-2014 UAO effective with the 2020 actuarial valuation. Therefore, no adjustment to the scheduled employer supplemental contribution is required effective July 1, 2019.
For illustrative purposes, we have shown the adjustment to the employer supplemental contribution rate that would have been calculated if this were the 2020 valuation. As shown in Table 13, no increase in the employer supplemental contribution rate, above the ultimate rate of 10.85%, would be needed to amortize the pre-2014 UAO for New Benefits by June 30, 2046. However, under the minimum contribution rate requirement for the total Pre-2014 UAO, an increase would apply. Note that this is a hypothetical calculation as the employer contribution rate is still being determined under a fixed graded schedule through June 30, 2021. As shown in the projection in the “Looking Ahead” subsection of Section 1, a small decrease is projected after the ultimate supplemental contribution rate of 10.85% (19.10% total) is reached.
Pre-2014 ServiceTotal 1990 Benefits New Benefits
Funded Status -- Pre-2014 Service Actuarial Obligation 254,062$ 209,981$ 44,081$ Actuarial Value of Assets 150,356 179,743 (29,387)
Unfunded Actuarial Obligation $ 103,706 $ 30,238 $ 73,468
($ Millions)

Milliman June 30, 2018 Actuarial ValuationDefined Benefit Program of theCalifornia State Teachers’ Retirement System Employer Supplemental Contribution Rate
This work product was prepared solely for CalSTRS for the purposes described herein and may not be appropriate to use for other purposes. Milliman does not intend to benefit and assumes no duty or liability to other parties who receive this work. Milliman recommends that third parties be aided by their own actuary or other qualified professional when reviewing the Milliman work product.
38
Table 11Total Assets Allocated for Pre-2014 Service(1)
1. May not add exactly, due to rounding.2. Based on Fair Market Value excluding SBMA and uniform cash flow for contributions, benefits, and expenses. The rates of return used in these calculations were 13.93% for 2016-2017 and 9.03% for 2017-2018.
3. Developed from Table 5.
($ Millions) 2018 2017
Asset Value for Pre-2014 Service (excludes SBMA)
Allocated Market Value at Beginning of Year $151,553 $142,731
Pre-2014 Allocation of GASB 75 Adjustment (396) -
Contributions During the YearTotal Contributions (excluding SBMA) 10,146 9,146Less Normal Costs for Year with Expenses (6,612) (6,105)
Total Adjusted Contributions 3,534$ 3,041$
Benefits Paid for Pre-2014 Service (13,761) (13,382)
Estimated Investment Earnings for the Year (2) 13,188 19,163
Total Allocated Market Value at End of Year $154,118 $151,553
Ratio of Actuarial Value to Market Value (3) 97.559% 98.082%
Actuarial Value of Assets for Pre-2014 Service $150,356 $148,646

Milliman June 30, 2018 Actuarial ValuationDefined Benefit Program of theCalifornia State Teachers’ Retirement System Employer Supplemental Contribution Rate
This work product was prepared solely for CalSTRS for the purposes described herein and may not be appropriate to use for other purposes. Milliman does not intend to benefit and assumes no duty or liability to other parties who receive this work. Milliman recommends that third parties be aided by their own actuary or other qualified professional when reviewing the Milliman work product.
39
Table 121990 Assets Allocated for Pre-2014 Service(1)
1. May not add exactly, due to rounding.2. Based on Fair Market Value excluding SBMA and uniform cash flow for contributions, benefits, and expenses. The rates of return used in these calculations were 13.93% for 2016-2017 and 9.03% for 2017-2018.
3. Developed from Table 5.
($ Millions) 2018 2017
1990 Asset Value for Pre-2014 Service (excludes SBMA)
Allocated Market Value at Beginning of Year $179,603 $167,166
Pre-2014 Allocation of GASB 75 Adjustment (396) -
Contributions During the Year for 1990 StructureTotal Contributions (excluding SBMA) 6,770 6,445Less 1990 Normal Costs for Year with Expenses (5,745) (5,211)
Total Adjusted Contributions 1,025$ 1,234$
Benefits Paid for Pre-2014 Service (11,695) (11,378)
Estimated Investment Earnings for the Year (2) 15,703 22,581
Total 1990 Allocated Market Value at End of Year $184,240 $179,603
Ratio of Actuarial Value to Market Value (3) 97.559% 98.082%
1990 Actuarial Value of Assets for Pre-2014 Service $179,743 $176,158

Milliman June 30, 2018 Actuarial ValuationDefined Benefit Program of theCalifornia State Teachers’ Retirement System Employer Supplemental Contribution Rate
This work product was prepared solely for CalSTRS for the purposes described herein and may not be appropriate to use for other purposes. Milliman does not intend to benefit and assumes no duty or liability to other parties who receive this work. Milliman recommends that third parties be aided by their own actuary or other qualified professional when reviewing the Milliman work product.
40
Table 13Funded Status and Employer Supplemental Contribution Rate for Pre-2014 Service
1. Equivalent level contribution rate payable through June 30, 2046.2. Hypothetical value based on the Actuarial Value of Assets. Current projections indicate a decrease in the ultimate employercontribution rate when reflecting the future recognition of currently deferred asset gains and losses. See the “Looking Ahead” subsection of Section 1.
($ Millions) 2018 2017Funded Status
Total Unfunded Actuarial Obligation (Pre-2014 Service)Total Actuarial Obligation for Pre-2014 Service $254,062 $252,226Total AVA for Pre-2014 Service 150,356 148,646
Total UAO (pre-2014 Service) $103,706 $103,580
1990 Unfunded Actuarial Obligation (Pre-2014 Service)1990 Actuarial Obligation for Pre-2014 Service $209,981 $208,3411990 AVA for Pre-2014 Service 179,742 176,158
1990 UAO (pre-2014 Service) $30,239 $32,183
Post-1990 UAO (Pre-2014 Service) $73,467 $71,397
Amortization Sufficiency for Post-1990, Pre-2014 UAO Under Current Contribution Schedule
Revenue from Member Contributions(1) 10.227% 10.222%Revenue from Employer Contributions (22950 & 22951)(1) 8.250 8.250 Revenue from State Contributions EC 22955(a)(1) 1.888 1.888 Equivalent Normal Cost Rate for Total Benefits (19.445) (19.544) Post-1990 Normal Cost Rate (Surplus)/Deficit 2.582 2.474 Additional Revenue Under EC 22950.5(1) 10.647 10.411 Revenue Available for Amortization 14.149% 13.701%
Revenue Needed for Amortization 12.433 12.194 Revenue Surplus / (Deficit) 1.716% 1.507%
Minimum Contribution Required for Total Pre-2014 UAOTotal Preliminary Pre-2014 UAO Contribution Rate 17.136% 16.424%Total Pre-2014 UAO Contribution Rate Needed 17.566 17.705 Revenue Surplus / (Deficit) (0.430%) (1.280%)
Contribution Increase Needed
Contribution Increase Needed
Contribution Rate for Amortization of UAO for pre-2014 Service and New Benefits[Illustrative Purposes Only. Not Applicable for 2018 Valuation]
10.850% 10.850%
0.430 1.000
11.280% 11.850%
Amortization Status under current contribution rate schedule and no changes in ultimate employer rate
Adjustment in Employer Contribution Rate for Next Fiscal Year(2)
EC 22955.1(b) Contribution Rate for FYB 2021(2)
Current EC 22950.5 Contribution Rate

Milliman June 30, 2018 Actuarial ValuationDefined Benefit Program of theCalifornia State Teachers’ Retirement System
This work product was prepared solely for CalSTRS for the purposes described herein and may not be appropriate to use for other purposes. Milliman does not intend to benefit and assumes no duty or liability to other parties who receive this work. Milliman recommends that third parties be aided by their own actuary or other qualified professional when reviewing the Milliman work product.
41
8. Projected Amortization and Cash FlowsWe have previously shown graphical projections of contribution rates, the Funded Ratio, and the UAO. In this section, we show the numerical details behind those projections.
Table 14 shows the amortization of the UAO for the total DB Program on a year-by-year basis, based on 7.00% future returns, additional contribution rate increases, and the future recognition of the currently deferred asset gains. Assuming all other future experience emerges as assumed and no changes in the scheduled contribution rates, the UAO will not be amortized by June 30, 2046. However, the CalSTRS board has rate-setting authority (within certain parameters) to adjust the state and employer contribution rates to pay down the UAO. Assuming the contribution rates are adjusted in the future, the UAO is projected to be fully paid off, except for a small portion of the UAO attributable to New Benefits and Post-2014 service (the Unallocated UAO) that is not actuarially funded. It is our understanding the board does not have authority to adjust contribution rates to fund this portion of the UAO. In total, the Funded Ratio is projected to be 99.9% under the assumptions described in the “Looking Ahead” subsection of Section 1.
In Table 14, we show the contributions projected to be paid into the DB Program to fund on-going benefits and amortize the UAO. Table 15 shows a comparison of these inflows into DB Program with the outflows from the DB Program, which consist of benefit payments and expenses. The difference between these two values is the net cash flow. A negative value indicates CalSTRS is paying out more than it is receiving. Note that this projection does not account for cash received internally, such as interest and dividends on investments.
The net cash flow is currently negative and this is projected to remain at approximately the current level over the next 10 years. In future years, the cash flow is expected to become increasingly negative. This is a typical pattern for a mature retirement system where it is expected that contributions will be less than benefits and that the system will begin drawing on the fund that has been built up over prior years.

Milliman June 30, 2018 Actuarial ValuationDefined Benefit Program of theCalifornia State Teachers’ Retirement System Projected Amortization and Cash Flows
This work product was prepared solely for CalSTRS for the purposes described herein and may not be appropriate to use for other purposes. Milliman does not intend to benefit and assumes no duty or liability to other parties who receive this work. Milliman recommends that third parties be aided by their own actuary or other qualified professional when reviewing the Milliman work product. 42
Table 14Amortization of Unfunded Actuarial Obligation(1)
(Reflecting Projected Contribution Increases)(2)
1. Based on the actuarial value of assets with projected recognition of known deferred asset gains and losses. 2. Contribution rates include projected increases and decreases allowed under Education Code.
($Millions) Beginning Amortization Payment Interest Ending EndingUnfunded Contributions Available Charge Unfunded Funded
Year FYE Act. Oblig. Member Employer State Total Amtzn. at 7.00% Act. Oblig. Ratio1 2019 $107,152 $3,419 $5,435 $2,353 $11,207 $6,703 $4,504 $7,346 $108,153 65.1%2 2020 108,153 3,539 6,265 2,569 12,373 6,921 5,452 7,383 108,772 66.3%3 2021 108,772 3,662 6,831 2,781 13,274 7,148 6,126 7,403 109,113 67.5%4 2022 109,113 3,790 6,715 3,050 13,555 7,381 6,174 7,425 109,696 68.6%5 2023 109,696 3,922 6,950 3,299 14,171 7,621 6,550 7,453 110,123 69.7%6 2024 110,123 4,059 7,200 3,365 14,624 7,867 6,757 7,476 110,503 70.8%7 2025 110,503 4,200 7,457 3,447 15,104 8,121 6,983 7,495 110,773 71.8%8 2026 110,773 4,347 7,722 3,540 15,609 8,383 7,226 7,505 110,879 72.8%9 2027 110,879 4,498 7,996 3,644 16,138 8,652 7,486 7,504 110,774 73.9%
10 2028 110,774 4,655 8,278 3,757 16,690 8,928 7,762 7,487 110,412 74.9%
11 2029 110,412 4,818 8,570 3,877 17,265 9,212 8,053 7,452 109,748 76.0%12 2030 109,748 4,985 8,872 4,005 17,862 9,503 8,359 7,395 108,739 77.1%13 2031 108,739 5,159 9,184 4,139 18,482 9,802 8,680 7,313 107,340 78.1%14 2032 107,340 5,339 9,507 4,279 19,125 10,108 9,017 7,204 105,503 79.2%15 2033 105,503 5,525 9,841 4,426 19,792 10,422 9,370 7,063 103,180 80.4%16 2034 103,180 5,717 10,187 4,579 20,483 10,747 9,736 6,888 100,320 81.5%17 2035 100,320 5,917 10,545 4,736 21,198 11,083 10,115 6,674 96,871 82.7%18 2036 96,871 6,123 10,916 4,900 21,939 11,431 10,508 6,419 92,776 84.0%19 2037 92,776 6,336 11,300 5,071 22,707 11,790 10,917 6,119 87,973 85.3%20 2038 87,973 6,557 11,697 5,248 23,502 12,162 11,340 5,768 82,398 86.6%
21 2039 82,398 6,786 12,108 5,431 24,325 12,547 11,778 5,363 75,981 88.0%22 2040 75,981 7,022 12,534 5,621 25,177 12,947 12,230 4,898 68,648 89.5%23 2041 68,648 7,267 12,975 5,817 26,059 13,364 12,695 4,369 60,320 91.0%24 2042 60,320 7,521 13,432 6,020 26,973 13,797 13,176 3,769 50,913 92.6%25 2043 50,913 7,783 13,906 6,230 27,919 14,249 13,670 3,094 40,336 94.3%26 2044 40,336 8,055 14,396 6,448 28,899 14,719 14,180 2,336 28,492 96.1%27 2045 28,492 8,336 14,905 6,673 29,914 15,210 14,704 1,489 15,276 98.0%28 2046 15,276 8,627 15,436 6,906 30,969 15,723 15,246 545 575 99.9%
Normal Cost

Milliman June 30, 2018 Actuarial ValuationDefined Benefit Program of theCalifornia State Teachers’ Retirement System Projected Amortization and Cash Flows
This work product was prepared solely for CalSTRS for the purposes described herein and may not be appropriate to use for other purposes. Milliman does not intend to benefit and assumes no duty or liability to other parties who receive this work. Milliman recommends that third parties be aided by their own actuary or other qualified professional when reviewing the Milliman work product. 43
Table 15Projected Cash Flow
(Reflecting Projected Contribution Increases)(1)
1. Contribution rates include projected increases and decreases allowed under Education Code.2. Projected benefit payments include estimated administrative expenses.
($Millions) EndingBenefit Net Program Market Value Funded
Year FYE Member Employer State Total Payments(2) Cash Flow Payroll of Assets Ratio1 2019 $3,419 $5,435 $2,353 $11,207 $15,245 ($4,038) (12.1%) (2.0%) 65.1%2 2020 3,539 6,265 2,569 12,373 15,764 (3,391) (9.8%) (1.6%) 66.3%3 2021 3,662 6,831 2,781 13,274 16,454 (3,180) (8.9%) (1.4%) 67.5%4 2022 3,790 6,715 3,050 13,555 17,170 (3,615) (9.8%) (1.5%) 68.6%5 2023 3,922 6,950 3,299 14,171 17,919 (3,748) (9.8%) (1.5%) 69.7%6 2024 4,059 7,200 3,365 14,624 18,699 (4,075) (10.3%) (1.6%) 70.8%7 2025 4,200 7,457 3,447 15,104 19,513 (4,409) (10.7%) (1.6%) 71.8%8 2026 4,347 7,722 3,540 15,609 20,360 (4,751) (11.2%) (1.6%) 72.8%9 2027 4,498 7,996 3,644 16,138 21,252 (5,114) (11.6%) (1.7%) 73.9%
10 2028 4,655 8,278 3,757 16,690 22,246 (5,556) (12.2%) (1.7%) 74.9%
11 2029 4,818 8,570 3,877 17,265 23,309 (6,044) (12.8%) (1.8%) 76.0%12 2030 4,985 8,872 4,005 17,862 24,450 (6,588) (13.5%) (1.8%) 77.1%13 2031 5,159 9,184 4,139 18,482 25,681 (7,199) (14.3%) (1.9%) 78.1%14 2032 5,339 9,507 4,279 19,125 26,985 (7,860) (15.1%) (2.0%) 79.2%15 2033 5,525 9,841 4,426 19,792 28,342 (8,550) (15.8%) (2.1%) 80.4%16 2034 5,717 10,187 4,579 20,483 29,724 (9,241) (16.5%) (2.1%) 81.5%17 2035 5,917 10,545 4,736 21,198 31,129 (9,931) (17.2%) (2.2%) 82.7%18 2036 6,123 10,916 4,900 21,939 32,557 (10,618) (17.7%) (2.2%) 84.0%19 2037 6,336 11,300 5,071 22,707 34,001 (11,294) (18.2%) (2.3%) 85.3%20 2038 6,557 11,697 5,248 23,502 35,515 (12,013) (18.7%) (2.3%) 86.6%
21 2039 6,786 12,108 5,431 24,325 37,019 (12,694) (19.1%) (2.3%) 88.0%22 2040 7,022 12,534 5,621 25,177 38,502 (13,325) (19.4%) (2.3%) 89.5%23 2041 7,267 12,975 5,817 26,059 39,943 (13,884) (19.5%) (2.3%) 91.0%24 2042 7,521 13,432 6,020 26,973 41,341 (14,368) (19.5%) (2.3%) 92.6%25 2043 7,783 13,906 6,230 27,919 42,737 (14,818) (19.4%) (2.3%) 94.3%26 2044 8,055 14,396 6,448 28,899 44,079 (15,180) (19.2%) (2.2%) 96.1%27 2045 8,336 14,905 6,673 29,914 45,344 (15,430) (18.9%) (2.1%) 98.0%28 2046 8,627 15,436 6,906 30,969 46,516 (15,547) (18.4%) (2.1%) 99.9%
Cash Flow as a Percentage ofContributions(1)

Milliman June 30, 2018 Actuarial ValuationDefined Benefit Program of theCalifornia State Teachers’ Retirement System
This work product was prepared solely for CalSTRS for the purposes described herein and may not be appropriate to use for other purposes. Milliman does not intend to benefit and assumes no duty or liability to other parties who receive this work. Milliman recommends that third parties be aided by their own actuary or other qualified professional when reviewing the Milliman work product.
44
9. Risk DisclosuresThe results of any actuarial valuation are based on a set of assumptions. Although we believe the current DB Program assumptions provide a reasonable estimate of future expectations, it is almost certain that future experience will differ from the assumptions to some extent.
The following is a general discussion of the potential risks to CalSTRS funding. Additional analysis on the potential impact of future investment returns on the Funded Ratio and supplemental contribution rates is included in Section 1 (subsection “Projections Under Alternate Return Scenarios”). A more comprehensive analysis of potential risks (“Review of Funding Level and Risks”) is completed each fall by CalSTRS internal actuarial staff.
Factors Affecting Future Results
There are a number of factors that affect future valuation results. To the extent actual experience for these factors varies from the assumptions, this will likely cause either increases or decreases in the plan’s future funding level and calculated supplemental contribution rates. Examples of factors that can have a significant impact on valuation results are:
� Investment return� Payroll variation� Salary variation� Mortality (how long retirees live)� Service retirement� Termination (members leaving active employment for reasons other than death, disability or service
retirement)� Contribution limitations. The board has limited rate-setting authority. If significant contribution increases are
needed in the future, CalSTRS may receive insufficient funding due to the limitations on the board’s ability to increase contribution rates under the current law. Projections based on the valuation assumptions indicate this is not currently an issue.
Of these factors, we believe the factor with the greatest potential risk is future investment returns. Payroll variation could also have a significant impact if there was a significant decline in the active teacher population, which, for example could occur if there was a large increase in the proportion of charter schools.
As an example of these risks, if actual investment returns fall short of the current assumption of 7% per year, this will cause an increase in the total supplemental contribution rate and a decrease in the Funded Ratio for the DB Program,all other things being equal. Conversely, if returns exceed 7%, this will decrease the total supplemental contribution rate and increase the Funded Ratio.
Maturity Risk
The magnitude of any contribution rate increase or decrease is affected by the Program’s maturity level. As the DB Program becomes more mature (i.e., the number of retirees grows compared to the number of actives, and the accumulated assets grow compared to payroll), it tends to be subject to increased volatility in the contributions needed. Specifically, for CalSTRS there may be significant fluctuations in the state supplemental contribution rates (and to a lesser extent the employer contribution rates) from year to year due to the actual investment return. One way to measure maturity risk is volatility ratios.

Milliman June 30, 2018 Actuarial ValuationDefined Benefit Program of theCalifornia State Teachers’ Retirement System Risk Disclosures
This work product was prepared solely for CalSTRS for the purposes described herein and may not be appropriate to use for other purposes. Milliman does not intend to benefit and assumes no duty or liability to other parties who receive this work. Milliman recommends that third parties be aided by their own actuary or other qualified professional when reviewing the Milliman work product.
45
One indicator of this potential volatility is the Asset Volatility Ratio (AVR), which is equal to the Fair Market Value of Assets divided by total payroll. Plans with a high Asset Volatility Ratio will be subject to a greater level of contribution rate volatility. The AVR is a current measure since it is based on the current level of assets and will vary from year to year.
For CalSTRS, the current AVR is equal to 6.1, which is typical for a mature system. This means that for each 1% asset loss (in relation to the assumed investment return), there will need to be an increase in contributions equivalent to 6.1% of one-year’s payroll. Since CalSTRS is currently targeting a funding period of 27 years (the years from the next valuation date to June 30, 2046), the increase (or decrease) in the state and employer contribution rates will be spread out over 27 years, resulting in approximately a 0.34% of payroll increase (or decrease) in the total contribution rate needed for each 1% asset loss (gain). An asset loss (or gain) will primarily cause a contribution rate increase (or decrease) for the state and have a much smaller impact on the employer contribution rate.
The following graph shows how the System matured during the last 25 years of the 20th Century, as represented by the increasing AVR. Over the last decade and a half, increases in the AVR have somewhat leveled off although there continues to be year-to-year variance.
Another measure of a system’s maturity is the Liability Volatility Ratio (LVR), which is equal to the Actuarial Obligation divided by the total payroll. This ratio provides an indication of the longer-term potential for contribution rate volatility if CalSTRS becomes fully funded. In addition, this ratio provides an indication of the potential contribution rate volatility due to liability experience (gains and losses) and liability re-measurements (assumption changes). For CalSTRS, the current LVR is 9.3. Ultimately, the LVR and AVR should be equal if CalSTRS achieves 100% funding in the future.
0.0
1.0
2.0
3.0
4.0
5.0
6.0
7.0
1975 1980 1985 1990 1995 2000 2005 2010 2015
Mar
ket A
sset
s / P
ayro
ll
Historical Asset Volatility Ratio

Milliman June 30, 2018 Actuarial ValuationDefined Benefit Program of theCalifornia State Teachers’ Retirement System Risk Disclosures
This work product was prepared solely for CalSTRS for the purposes described herein and may not be appropriate to use for other purposes. Milliman does not intend to benefit and assumes no duty or liability to other parties who receive this work. Milliman recommends that third parties be aided by their own actuary or other qualified professional when reviewing the Milliman work product.
46
The following graph shows the historical LVR. It is a similar pattern to the Asset Volatility Ratio except the increase is more gradual and the year-to-year variance is significantly less, although there have been larger changes in years where assumptions changes have occurred.
Historical MeasuresOne way to assess future risks is to look at historical measurements. The following graph shows how the DB Program Funded Ratio has varied over the last 30 years. In particular, it reflects the significant impact that investment returns can have. The strong returns of the 1990’s caused a large increase in the Funded Ratio. Since 2000, actual returns have lagged the assumption and expectations of future returns have decreased. This combination has been the primary cause of the decline in the Funded Ratio since then.
0.0
1.0
2.0
3.0
4.0
5.0
6.0
7.0
8.0
9.0
10.0
1975 1980 1985 1990 1995 2000 2005 2010 2015
Actu
arial
Obl
ibat
ion /
Pay
roll
Historical Liability Volatility Ratio
0%
20%
40%
60%
80%
100%
120%
1988 1993 1998 2003 2008 2013 2018
Historical Funded Ratio

Milliman June 30, 2018 Actuarial ValuationDefined Benefit Program of theCalifornia State Teachers’ Retirement System Risk Disclosures
This work product was prepared solely for CalSTRS for the purposes described herein and may not be appropriate to use for other purposes. Milliman does not intend to benefit and assumes no duty or liability to other parties who receive this work. Milliman recommends that third parties be aided by their own actuary or other qualified professional when reviewing the Milliman work product.
47
The graph below shows the history of the actual contributions made (blue bar) as a percentage of payroll. The green line shows the actuarially calculated contribution rate based on amortizing the UAO by June 30, 2046 (for years before 2014, a 30-year amortization was used). There has been variance in both rates. As previously noted, as the DB Program continues to mature, year-to-year variance is projected to increase. Year-to-year changes in the actual contribution rate will likely be less than for the actuarially calculated rate due to the restrictions on changes in the state and employer supplemental contribution rates.
0%
5%
10%
15%
20%
25%
30%
35%
40%
2000 2005 2010 2015
Rat
e as
a %
of P
ayro
ll
Historical Aggregate DB Program Contribution Rate
Actually Contributed Actuarially Calculated

Milliman June 30, 2018 Actuarial ValuationDefined Benefit Program of theCalifornia State Teachers’ Retirement System
This work product was prepared solely for CalSTRS for the purposes described herein and may not be appropriate to use for other purposes. Milliman does not intend to benefit and assumes no duty or liability to other parties who receive this work. Milliman recommends that third parties be aided by their own actuary or other qualified professional when reviewing the Milliman work product.
48
Appendix A Provisions of Governing LawThe actuarial calculations contained in this report are based upon our understanding of the CalSTRS DB Program as contained in Part 13 of the California Education Code and augmented by consultation with CalSTRS staff. The provisions used in this valuation are summarized below for reference purposes.
Member Contributions
Base Contribution Rate:
2% at 60 Members: 8.0% of creditable compensation. 25% of this contribution was redirected to the member’s Defined Benefit Supplement account from January 1, 2001 through December 31, 2010.
The redirection of member contributions does not apply to the 1990 Benefit Structure.
2% at 62 Members: Equal to one-half of the Normal Cost Rate determined in the valuation rounded to the nearest quarter percent. Member rates only change when the Normal Cost Rate changes by 1.0% of payroll as compared to the initial Normal Cost Rate (or at the time of the last adjustment). Currently, the base member contribution rate is equal to 9.0% of creditable compensation.
Supplemental Contribution Rates:
In addition to the base contribution rates, members make additional contributions for fiscal years beginning July 1, 2016 and later:2% at 60 Members: 2.250% of creditable compensation
2% at 62 Members: 1.205% of creditable compensation
Interest Rate:
Interest is credited at the end of each fiscal year based on rates adopted by the Teachers’ Retirement Board.Currently, rates are approximately equal to two-year Treasury notes.
Normal Retirement
Eligibility Requirement:
2% at 60 Members: Age 60 with five years of credited service.
2% at 62 Members: Age 62 with five years of credited service.
Allowance:
Two percent of final compensation for each year of credited service.
Final Compensation:
2% at 60 Members: Average salary earnable for the highest three consecutive years of credited service for one position. For members with 25 years of service, the calculation is based on the highest average compensation earnable in a consecutive 12-month period.
Twelve-month highest average compensation does not apply to the 1990 Benefit Structure.

Milliman June 30, 2018 Actuarial ValuationDefined Benefit Program of the Appendix ACalifornia State Teachers’ Retirement System Provisions of Governing Law
This work product was prepared solely for CalSTRS for the purposes described herein and may not be appropriate to use for other purposes. Millimandoes not intend to benefit and assumes no duty or liability to other parties who receive this work. Milliman recommends that third parties be aided by their own actuary or other qualified professional when reviewing the Milliman work product.
49
2% at 62 Members: Final compensation is based on the highest three consecutive years of salary earnable. Compensation is limited to 120% of the Social Security Wage Base. The limit effective July 1, 2018 is $146,230 (after applying the 120% factor) and is adjusted annually based on changes to the Consumer Price Index for All Urban Consumers. The 2% at 62 members are not eligible for the one-year final compensation benefit enhancement.
Credited Service:
For each year of membership, credited service is granted based on the ratio of salary earned to full-time salary earnable for one position.
Sick Leave Service Credit:
Credited service is granted for unused sick leave at the time of retirement. Sick Leave Service Credit up to 0.2 years of Credited Service may be used for eligibility for One-Year Final Compensation or to attain the Career Factor or the Longevity Bonus.
Unused sick leave service credit does not apply to the 1990 Benefit Structure for members hired after June 30, 1980.
Career Factor:
If a member has 30 years of credited service, the age factor is increased by 0.2%. However, the maximum age factor is 2.4%.
Career factor does not apply to 2% at 62 members or the 1990 Benefit Structure.
Longevity Bonus:
For members attaining 30 years of service by January 1, 2011, a longevity bonus of $200 per month is added to the unmodified allowance. The bonus is increased to $300 per month with 31 years of service, and $400 per month with 32 or more years of service.
Longevity Bonus does not apply to 2% at 62 members or the 1990 Benefit Structure.
IRC Section 415:
Benefits are subject to limits imposed under Internal Revenue Code (IRC) Section 415. However, no limits are imposed in the valuation of the DB Program until they actually occur, in order to address the potential pay-as-you-go funding needs of the Teachers’ Replacement Benefits Program Fund.
IRC Section 401(a)(17):
Compensation is limited under IRC Section 401(a)(17) and assumed to increase at the rate of inflation for valuation purposes. Current 401(a)(17) limits do not apply to members hired before July 1, 1996.
Early Retirement
Eligibility Requirement:
2% at 60 Members: Age 55 with five years of credited service, or age 50 with 30 years of credited service.
2% at 62 Members: Age 55 with five years of credited service.

Milliman June 30, 2018 Actuarial ValuationDefined Benefit Program of the Appendix ACalifornia State Teachers’ Retirement System Provisions of Governing Law
This work product was prepared solely for CalSTRS for the purposes described herein and may not be appropriate to use for other purposes. Millimandoes not intend to benefit and assumes no duty or liability to other parties who receive this work. Milliman recommends that third parties be aided by their own actuary or other qualified professional when reviewing the Milliman work product.
50
Benefit Reduction:
2% at 60 Members: A half-percent reduction in the normal retirement allowance for each full month or partial month the member is younger than age 60, plus a reduction of a quarter percent for each full month or partial month the member is younger than age 55.
2% at 62 Members: A half-percent reduction in the normal retirement allowance for each full month or partial month the member is younger than age 62
Late Retirement
Allowance:
2% at 60 Members: Members continue to earn additional service credit after age 60. The 2% age factor increases by 0.033% for each quarter year of age that the member is over age 60, up to a maximum of 2.4%.
2% at 62 Members: Members continue to earn additional service credit after age 62. The 2% age factor increases by 0.033% for each quarter year of age that the member is over age 62, up to a maximum of 2.4%.
The late retirement adjustment does not apply to the 1990 Benefit Structure.
Deferred Retirement
Allowance:
Any time after satisfying the minimum service requirement, a member may cease active service, leave the accumulated contributions on deposit, and later retire upon attaining the minimum age requirement.
Post-Retirement Benefit Adjustment
Benefit Improvement:
2% simple increase on September 1 following the first anniversary of the effective date of the allowance, applied to all continuing allowances.
Disability Allowance - Coverage A
Eligibility Requirement Allowance:*
Member has five years of credited California service and has not attained age 60.
50% of final compensation or5% of final compensation for each year of service credit if over age 45 with less than 10 years of service credit.
Children's Benefit:
10% for each eligible dependent child, up to a maximum of 40% of final compensation. The increment for each eligible child continues until the child marries or attains age 22.
*Note that, for valuation purposes, the greater of the service retirement allowance and the disability allowance is valued if the member is eligible for service retirement.

Milliman June 30, 2018 Actuarial ValuationDefined Benefit Program of the Appendix ACalifornia State Teachers’ Retirement System Provisions of Governing Law
This work product was prepared solely for CalSTRS for the purposes described herein and may not be appropriate to use for other purposes. Millimandoes not intend to benefit and assumes no duty or liability to other parties who receive this work. Milliman recommends that third parties be aided by their own actuary or other qualified professional when reviewing the Milliman work product.
51
Offsets:
Allowance, including children's increment, is reduced by disability benefits payable under Social Security, Workers' Compensation and employer-paid income protection plan.
Disability Allowance - Coverage B (including 2% at 62 members)
Eligibility Requirement:
Member has five years of credited California service.
Allowance:*
50% of final compensation, regardless of age and service credit.
Children's Benefit:
10% for each eligible child up to four children, for a maximum of 40% of final compensation. The increment for each child continues until the child attains age 21, regardless of student, marital, or employment status.
Offsets:
The member's allowance is reduced by disability benefits payable under Workers' Compensation.
*Note that, for valuation purposes, the greater of the service retirement allowance and the disability allowance is valued if the member is eligible for service retirement.
Death Before Retirement - Coverage A
Eligibility Requirement:
One or more years of service credit for active members or members receiving a disability allowance. Ineligible members may receive a lump sum payment of their contributions with interest.
Lump Sum Payment:
$6,372 lump sum to the designated beneficiary. If there is no surviving spouse, domestic partner, or eligible children, the contributions and interest are paid to the designated beneficiary.
Allowance:
The surviving spouse or domestic partner with eligible children will receive a family benefit of 40% of final compensation for as long as there is at least one eligible child. An additional 10% of final compensation is payable for each eligible child up to a maximum benefit of 90%.
If there is no surviving spouse or domestic partner, an allowance of 10% of final compensation is payable to eligible children up to a maximum benefit of 50%.
When there are no eligible children, the spouse or domestic partner may elect to receive one-half of a 50% joint and survivor allowance projected to age 60, or take a lump sum payment of the remaining contributions and interest.

Milliman June 30, 2018 Actuarial ValuationDefined Benefit Program of the Appendix ACalifornia State Teachers’ Retirement System Provisions of Governing Law
This work product was prepared solely for CalSTRS for the purposes described herein and may not be appropriate to use for other purposes. Millimandoes not intend to benefit and assumes no duty or liability to other parties who receive this work. Milliman recommends that third parties be aided by their own actuary or other qualified professional when reviewing the Milliman work product.
52
Death Before Retirement - Coverage B (including 2% at 62 members)
Eligibility:
One or more years of service credit for active members. Ineligible members may receive a lump sum payment of their contributions with interest.
Lump Sum Payment:
$25,488 lump sum to the designated beneficiary. If there is no surviving spouse or domestic partner, the contributions and interest are paid to the designated beneficiary.
Allowance:
A lump sum payment of the contributions and interest.
or
One-half of a 50% joint and survivor allowance, beginning on the member's 60th birthday, or immediately with a reduction based on the member’s and spouse's (or domestic partner’s) ages at the time the benefit begins.
If the surviving spouse or domestic partner elects a monthly allowance, each eligible child would receive 10% of the member's final compensation, with a maximum benefit of 50%.
Death After Retirement
Lump Sum Payment:
$6,372 lump sum to the designated beneficiary.
Annuity Form:
If the retiree had elected one of the joint and survivor options, the retirement allowance would be modified in accordance with the option selected.
If no annuity option had been elected, payment of the unpaid contributions and interest, if any, remaining in the retiree's account will be made.
Termination from the Program
Refund:
Refund of contributions with interest as credited to the member's account to date of withdrawal. A refund terminates membership and all rights to future benefits from the System
Re-entry After Refund:
Former members who re-enter the System may redeposit all amounts previously refunded plus regular interest. The member must earn one year of credited service after re-entry before becoming eligible for System benefits.

Milliman June 30, 2018 Actuarial ValuationDefined Benefit Program of theCalifornia State Teachers’ Retirement System
This work product was prepared solely for CalSTRS for the purposes described herein and may not be appropriate to use for other purposes. Milliman does not intend to benefit and assumes no duty or liability to other parties who receive this work. Milliman recommends that third parties be aided by their own actuary or other qualified professional when reviewing the Milliman work product.
53
Appendix B Actuarial Methods and AssumptionsThis section of the report discloses the actuarial methods and assumptions used in this Actuarial Valuation. These methods and assumptions have been chosen on the basis of recent experience of the DB Program and on current expectations as to future economic conditions. The assumptions were reviewed and changed for the June 30, 2016 actuarial valuation as a result of the 2015 Experience Analysis. Please refer to that Experience Analysis report dated December 30, 2016 for the data and rationale used in the recommendation of each assumption.
The assumptions are intended to estimate the future experience of the members of the DB Program and of the DB Program itself in areas that affect the projected benefit flow and anticipated investment earnings. Any variations in future experience from that expected from these assumptions will result in corresponding changes in estimated costs of the DB Program's benefits.
Actuarial Cost Method
Entry Age Normal Cost Method:
The accruing costs of all benefits with future accruals are measured by the Entry Age Normal Actuarial Cost Method. For measurements where no future service is earned (i.e., those with service fixed as of June 30, 2014), the Actuarial Obligation uses the Projected Unit Credit Actuarial Cost Method.
The projected revenue in excess of the Normal Cost is tested for sufficiency to amortize the Unfunded Actuarial Obligation created by this method. Amortization is calculated on a level percentage of payroll including general wage inflation but no increase or decrease in the number of active members.
The actuarial present value of projected benefits for each individual member included in the valuation is allocated on a level basis over the earnings of the individual between entry age and assumed exit ages. The portion of this actuarial present value allocated to a valuation year is called the Normal Cost. For 2% at 60 members, the Normal Cost is based on Coverage B benefit structure. For 2% at 62 members, the Normal Cost is based on their benefit structure. The portion of this actuarial present value not provided for at a valuation date by the actuarial present value of future Normal Costs is called the Actuarial Obligation. The excess of the Actuarial Obligation over the Actuarial Value of Assets is called the Unfunded Actuarial Obligation. If the Actuarial Value of Assets exceeds the Actuarial Obligation, the difference is called the Actuarial Surplus.
Entry Age:
The ages at entry of future active members are assumed to average the same as the entry ages of the present active members they replace. If the number of active members should increase (or decrease), it is further assumed that the average entry age of the larger (or smaller) group will be the same, from an actuarial standpoint, as that of the present active group. Under these assumptions, the Normal Cost Rate will not vary significantly due to the termination of the present active membership, or with an expansion or contraction of the active membership.
Projected Unit Cost Method:
The actuarial present value of projected benefits for each individual member included in the valuation is determined based on the current service and salary projected to the age the member leaves active employment. The Normal Cost is $0 since no benefits are being earned.

Milliman June 30, 2018 Actuarial ValuationDefined Benefit Program of the Appendix BCalifornia State Teachers’ Retirement System Actuarial Methods and Assumptions
This work product was prepared solely for CalSTRS for the purposes described herein and may not be appropriate to use for other purposes. Millimandoes not intend to benefit and assumes no duty or liability to other parties who receive this work. Milliman recommends that third parties be aided by their own actuary or other qualified professional when reviewing the Milliman work product.
54
Asset Valuation Method
The assets are valued using a method that delays recognition of investment gains or losses. The expected actuarial value is the prior year’s actuarial value increased with net cash flow of funds, and all increased with interest during the past year at the expected investment return assumption. One-third of the difference between the expected actuarial value of assets and the Fair Market Value of assets is added to the expected actuarial value of assets to arrive at the Actuarial Value of Assets. The smoothing is applied on the total DB Program assets and then the SBMA is deducted to determine the net actuarial value for funding purposes.
The asset smoothing method was adopted for the 1999 Actuarial Valuation and is effective for the investment experience beginning in July of 1993.
Actuarial Assumptions
The Actuarial Standards Board has adopted Actuarial Standard of Practice No. 27, Selection of Economic Assumptions for Measuring Pension Obligations. This Standard provides guidance on selecting economic assumptions under defined benefit retirement programs such as the System. In our opinion, the economic assumptions have been developed in accordance with the Standard.
The Actuarial Standards Board has adopted Actuarial Standard of Practice No. 35, Selection of Demographic and Other Noneconomic Assumptions for Measuring Pension Obligations. This Standard provides guidance on selecting demographic assumptions under defined benefit retirement programs such as the System. In our opinion, the demographic assumptions have been developed in accordance with the Standard.
The assumptions are intended to estimate the future experience of the members of the DB Program and of the System itself in areas that affect the projected benefit flow and anticipated investment earnings. Any variations in future experience from that expected from these assumptions will result in corresponding changes in estimated costs of the Program's benefits.
The demographic assumptions are listed in Table B.1 and illustrated at selected ages and duration combinations in Tables B.2 – B.7.
Payroll Growth Assumption
The wage growth assumption is equal to 3.50%, and the active population is assumed to be stable. Thus, the DB Program payroll is assumed to increase at a rate of 3.50% each year.

Milliman June 30, 2018 Actuarial ValuationDefined Benefit Program of the Appendix BCalifornia State Teachers’ Retirement System Actuarial Methods and Assumptions
This work product was prepared solely for CalSTRS for the purposes described herein and may not be appropriate to use for other purposes. Millimandoes not intend to benefit and assumes no duty or liability to other parties who receive this work. Milliman recommends that third parties be aided by their own actuary or other qualified professional when reviewing the Milliman work product.
55
Table B.1List of Major Valuation Assumptions
Economic Assumptions
A. Investment Return 7.00%(net of investment and administrative expenses)
B. Interest on Member Accounts 3.00%
C. Wage Growth 3.50%
D. Inflation 2.75%
Demographic Assumptions
A. Mortality(1)
Active - Male RP-2014 White Collar Employee Male set back 2 years
Table B.2
- Female RP-2014 White Collar Employee Female set back 2 years
Table B.2
Retired & - MaleBeneficiary
2016 CalSTRS Retired Male Table B.2
- Female 2016 CalSTRS Retired Female Table B.2
Disabled - Male RP-2014 Disabled Retiree Male set back 2 years
Table B.2
- Female RP-2014 Disabled Retiree Female set back 2 years(select rates in first three years for both Males and Females)
Table B.2
1. The mortality assumption uses a generational mortality approach with a base year of 2016. Projected improvement is based on 110% of the MP-2016 Ultimate Projection Scale. The combined base tables and projection scale specified contain a margin for expected future mortality improvement. See Table B.9 of this report for a key to the custom mortality tables used for CalSTRS.
B. Service Retirement Experience Tables Table B.3
C. Disability Retirement Experience Tables Table B.4
D. Withdrawal Experience Tables Table B.5
E. Probability of Refund Experience Tables Table B.6
F. Merit Salary Increases Experience Tables Table B.7
G. Supplemental Assumptions Table B.8

Milliman June 30, 2018 Actuarial ValuationDefined Benefit Program of the Appendix BCalifornia State Teachers’ Retirement System Actuarial Methods and Assumptions
This work product was prepared solely for CalSTRS for the purposes described herein and may not be appropriate to use for other purposes. Millimandoes not intend to benefit and assumes no duty or liability to other parties who receive this work. Milliman recommends that third parties be aided by their own actuary or other qualified professional when reviewing the Milliman work product.
56
Table B.2Mortality as of June 30, 2018
Active Members(1)
Age Male Female25 0.034% 0.013%30 0.030 0.01635 0.033 0.02140 0.038 0.02745 0.053 0.04350 0.091 0.07355 0.154 0.11560 0.254 0.16965 0.441 0.251
Retired Members and Beneficiaries(1)
Disabled Members(After Year 3) (1)
Age Male Female Male Female50 0.238% 0.132% 1.827% 1.032%55 0.350 0.208 2.125 1.29160 0.469 0.277 2.410 1.52465 0.667 0.418 2.805 1.82070 1.068 0.689 3.478 2.36375 1.915 1.266 4.586 3.36380 3.514 2.428 6.349 4.98185 6.756 4.842 9.223 7.40190 13.026 9.847 13.983 10.93295 22.246 18.442 20.892 16.170
Select rates for disability:First year of disability 4.0% 3.0%Second year of disability 3.5 2.5Third year of disability 3.0 2.0
1. The mortality assumption uses a generational mortality approach with a base year of 2016. Projected improvement is based on 110% of the MP-2016 Ultimate Projection Scale. The rates shown reflect mortality improvement through June 30, 2018. The projection scale does not apply to the select minimum rates.

Milliman June 30, 2018 Actuarial ValuationDefined Benefit Program of the Appendix BCalifornia State Teachers’ Retirement System Actuarial Methods and Assumptions
This work product was prepared solely for CalSTRS for the purposes described herein and may not be appropriate to use for other purposes. Millimandoes not intend to benefit and assumes no duty or liability to other parties who receive this work. Milliman recommends that third parties be aided by their own actuary or other qualified professional when reviewing the Milliman work product.
57
Table B.3Service Retirement
DB Program – 2% at 60 MembersDB Program –
2% at 62 MembersOnly for the 1990Benefit Structure Under 30 Years(1) 30 or More Years All Years
Age Male Female Male Female Male Female Male Female
50 0.0% 0.0% 0.0% 0.0% 5.0% 5.0% 0.0% 0.0%51 0.0 0.0 0.0 0.0 3.0 3.0 0.0 0.052 0.0 0.0 0.0 0.0 3.0 3.0 0.0 0.053 0.0 0.0 0.0 0.0 3.0 3.0 0.0 0.054 1.5 1.5 0.0 0.0 3.0 3.0 0.0 0.055 5.8 7.0 2.7 3.5 6.0 8.0 3.0 4.056 3.9 4.5 1.8 2.5 6.0 8.0 2.0 3.057 4.9 4.5 1.8 2.5 8.0 10.0 3.0 3.558 6.8 7.0 2.7 3.5 12.0 15.0 4.0 4.059 17.5 14.0 4.5 5.0 16.0 18.0 6.0 6.060 25.0 22.0 6.3 7.0 25.0 29.0 9.0 9.061 16.5 15.0 7.0 9.0 50.0 50.0 15.0 15.062 16.5 15.0 11.0 12.5 45.0 45.0 15.0 17.063 15.0 15.0 12.0 16.0 35.0 40.0 15.0 18.064 17.5 18.0 13.0 14.0 30.0 35.0 15.0 18.065 20.0 18.0 14.0 17.0 32.5 37.5 30.0 30.066 16.0 18.0 13.0 15.0 30.0 32.0 25.0 25.067 16.0 18.0 13.0 15.0 27.0 32.0 25.0 25.068 16.0 16.0 12.0 14.0 27.0 30.0 20.0 20.069 16.0 16.0 12.0 14.0 25.0 30.0 20.0 20.070 100.0 100.0 12.0 14.0 25.0 30.0 20.0 20.071 11.0 13.5 25.0 30.0 20.0 20.072 11.0 13.5 25.0 30.0 20.0 20.073 11.0 13.5 25.0 30.0 20.0 20.074 11.0 13.5 25.0 30.0 20.0 20.075 100.0 100.0 100.0 100.0 100.0 100.0
1. If credited service is equal to or greater than 25 but less than 28 years, the assumed retirement rates shown above for members with less than 30 years of credited service are multiplied by 225%. For example, a 63-year old female member with 26 years of credited service would have a 36.0% probability of retirement (2.25 times the rate for service less than 30 years of 16.0%). For members with 28 but less than 30 years of credited service, the rates are equal to 125% of the assumed retirement rates shown above for members with less than 30 years of credited service.
The assumptions shown above are for retirement from active status. It is assumed that all vested terminated members retire atage 60 (2% at 60 members) or age 62 (2% at 62 members).

Milliman June 30, 2018 Actuarial ValuationDefined Benefit Program of the Appendix BCalifornia State Teachers’ Retirement System Actuarial Methods and Assumptions
This work product was prepared solely for CalSTRS for the purposes described herein and may not be appropriate to use for other purposes. Millimandoes not intend to benefit and assumes no duty or liability to other parties who receive this work. Milliman recommends that third parties be aided by their own actuary or other qualified professional when reviewing the Milliman work product.
58
Table B.4Disability Retirement
Coverage A
Age Male Female25 0.018% 0.018%30 0.027 0.02735 0.045 0.05440 0.072 0.08145 0.099 0.09950 0.144 0.19855 0.189 0.252
Coverage B
Age Male Female25 0.010% 0.020%30 0.020 0.02035 0.030 0.04040 0.060 0.07045 0.100 0.11050 0.140 0.18555 0.245 0.30060 0.365 0.38065 0.400 0.40070 0.400 0.400

Milliman June 30, 2018 Actuarial ValuationDefined Benefit Program of the Appendix BCalifornia State Teachers’ Retirement System Actuarial Methods and Assumptions
This work product was prepared solely for CalSTRS for the purposes described herein and may not be appropriate to use for other purposes. Millimandoes not intend to benefit and assumes no duty or liability to other parties who receive this work. Milliman recommends that third parties be aided by their own actuary or other qualified professional when reviewing the Milliman work product.
59
Table B.5Withdrawal
Year(1) Male Female
0 16.0% 15.0%
1 11.0 9.02 8.5 7.03 6.3 5.54 4.0 4.05 3.5 3.0
10 1.8 1.8
15 1.2 1.2
20 0.9 0.9
25 0.7 0.7
30 0.6 0.6
1. Based on elapsed service since membership date.

Milliman June 30, 2018 Actuarial ValuationDefined Benefit Program of the Appendix BCalifornia State Teachers’ Retirement System Actuarial Methods and Assumptions
This work product was prepared solely for CalSTRS for the purposes described herein and may not be appropriate to use for other purposes. Millimandoes not intend to benefit and assumes no duty or liability to other parties who receive this work. Milliman recommends that third parties be aided by their own actuary or other qualified professional when reviewing the Milliman work product.
60
Table B.6Probability of Refund
Entry Ages – Male
Year(1) Under 25 25 - 29 30 - 34 35 - 39 40 and UpUnder 5 100% 100% 100% 100% 100%
5 60 60 60 56 4510 46 46 38 36 3615 38 38 31 2120 31 31 1525 15 1530 10
Entry Ages – Female
Year Under 25 25 - 29 30 – 34 35 - 39 40 and UpUnder 5 100% 100% 100% 100% 100%
5 60 60 60 52 3510 34 34 32 32 2915 27 24 24 2420 19 14 1425 10 1030 10
1. Assumption applied at time of assumed termination. Based on elapsed service since membership date. Members who terminate with less than five years of credited service are assumed to have a 100% probability of refund.

Milliman June 30, 2018 Actuarial ValuationDefined Benefit Program of the Appendix BCalifornia State Teachers’ Retirement System Actuarial Methods and Assumptions
This work product was prepared solely for CalSTRS for the purposes described herein and may not be appropriate to use for other purposes. Millimandoes not intend to benefit and assumes no duty or liability to other parties who receive this work. Milliman recommends that third parties be aided by their own actuary or other qualified professional when reviewing the Milliman work product.
61
Table B.7Merit Salary Increases(1)
Entry Age - Annual Increase in Salaries Due to Merit
Year(2) Under 25 25 - 29 30 - 34 35 - 39 40 - 44 45 & up0 6.4% 5.8% 5.3% 4.8% 4.5% 3.7%1 6.4 5.8 5.3 4.8 4.5 3.72 6.0 5.5 5.0 4.5 4.3 3.53 5.6 5.3 4.8 4.3 4.1 3.34 5.4 5.0 4.5 4.1 3.9 3.05 5.2 4.8 4.3 3.9 3.8 2.8
10 3.7 3.4 3.0 2.7 2.5 1.815 1.8 1.7 1.5 1.2 1.2 0.920 1.3 1.2 1.2 0.8 0.8 0.625 1.1 1.0 0.9 0.6 0.630 0.9 0.8 0.7 0.535 0.8 0.7 0.640 0.8 0.745 0.8
1. The total expected increase in salary includes both merit (shown above) and the general wage increase assumption of 3.50% per annum. The total result is compounded rather than additive. For example, the total assumed increase for service less than one year (Year 0 above) is 10.124% (1.064 x 1.035) for members in the entry age under 25 group.
2. Based on elapsed service since membership date.

Milliman June 30, 2018 Actuarial ValuationDefined Benefit Program of the Appendix BCalifornia State Teachers’ Retirement System Actuarial Methods and Assumptions
This work product was prepared solely for CalSTRS for the purposes described herein and may not be appropriate to use for other purposes. Millimandoes not intend to benefit and assumes no duty or liability to other parties who receive this work. Milliman recommends that third parties be aided by their own actuary or other qualified professional when reviewing the Milliman work product.
62
Table B.8Supplemental Assumptions
PEPRA Coverage All members hired on or after the valuation date are assumed to be subject to the provisions of PEPRA.
Unused Sick Leave Credited Service is increased by 1.8%.
Optional Forms Active and Inactive: Based on single life annuity assumed.Retirees and Beneficiaries: Based on optional form in data.
Probability of Marriage Male: 85%Female: 65%
Male spouses are assumed to be three years older than female spouses.
Children Married members under age 60 are assumed to have the number of childrenshown in the following table. Children are assumed to receive benefits until the member would have turned age 60.
Member’s Gender
Assumed Number of Children
Male 0.65Female 0.50
Assumed Offsets No offsets to disability and survivor benefits are assumed.

Milliman June 30, 2018 Actuarial ValuationDefined Benefit Program of the Appendix BCalifornia State Teachers’ Retirement System Actuarial Methods and Assumptions
This work product was prepared solely for CalSTRS for the purposes described herein and may not be appropriate to use for other purposes. Millimandoes not intend to benefit and assumes no duty or liability to other parties who receive this work. Milliman recommends that third parties be aided by their own actuary or other qualified professional when reviewing the Milliman work product.
63
Table B.8Supplemental Assumptions
(continued)
Valuation of Inactive Members
Salary and benefit information is not available on the valuation data provided for inactive members. Therefore, we estimate the projected retirement benefits for inactive members as follows:
1) The inactive member’s earnable salary information is retrieved from when they were active by matching with a database of active valuation data back to 2001 and taking the highest earnable salary for the member during the period.
2) For those members who cannot be located on the active database (because they terminated prior to 2001 or another reason), their earnable salary is estimated based on 120% of the average earnable salary for all active members in the year the member terminated.
3) The earnable salary amount from the prior steps is treated as the member’s final compensation with two additional adjustments.a. An additional load of 5% for all inactive members is applied to their salary amount to account for potential
post-termination increases in salary due to factors such as reciprocity.b. Final compensation is increased by an additional 4.3% if the member has 25 or more years of credited
service.4) Based on the salary data described above and the birth date and credited service from the current year’s
valuation data, the projected benefit amount is calculated and valued as a deferred service retirement.5) Non-vested members who have been inactive for less than two years are assumed to take an immediate
refund of their member contributions.

Milliman June 30, 2018 Actuarial ValuationDefined Benefit Program of the Appendix BCalifornia State Teachers’ Retirement System Actuarial Methods and Assumptions
This work product was prepared solely for CalSTRS for the purposes described herein and may not be appropriate to use for other purposes. Millimandoes not intend to benefit and assumes no duty or liability to other parties who receive this work. Milliman recommends that third parties be aided by their own actuary or other qualified professional when reviewing the Milliman work product.
64
Table B.9Custom Mortality Table Key
Notes:
1. All mortality tables use 110% of the MP-2016 Ultimate Projection Scale applied generationally. Projection scale does not apply to select minimum rates.
2. All mortality tables to be used in the June 30, 2018 actuarial valuations include four years of mortality improvement from the 2014 tables shown above.
Inactives, Healthy (Service) Retirees and Beneficiaries -- Males
Current: RP-2014 Healthy Male White Collar -1 to age 70 smoothed to +1 at age 95
Inactives, Healthy (Service) Retirees and Beneficiaries -- Females
Current: RP-2014 Healthy Female White Collar -4 to age 70 smoothed to +1 at age 95
Disabled Retirees -- Males
Current: All Ages: RP-2014 Disabled Male -2(select rates in first three years, regardless of age)
Disabled Retirees -- Females
Current: All Ages: RP-2014 Disabled Female -2(select rates in first three years, regardless of age)
Active Members -- Males
Current: RP-2014 Healthy Male White Collar Employee set back 2 years
Active Members -- Females
Current: RP-2014 Healthy Female White Collar Employee set back 2 years

Milliman June 30, 2018 Actuarial ValuationDefined Benefit Program of theCalifornia State Teachers’ Retirement System
This work product was prepared solely for CalSTRS for the purposes described herein and may not be appropriate to use for other purposes. Milliman does not intend to benefit and assumes no duty or liability to other parties who receive this work. Milliman recommends that third parties be aided by their own actuary or other qualified professional when reviewing the Milliman work product.
65
Appendix C Valuation DataThe membership data for this actuarial valuation was supplied by CalSTRS. Although we did not audit this data, we compared the data for this and the prior valuation and tested for reasonableness, as well as for consistency with prior periodic reports from the CalSTRS staff. Based on these tests, we believe the data to be sufficiently accurate for the purposes of this valuation. Since the valuation results are dependent on the integrity of the data supplied, the results can be expected to differ if the underlying data is incomplete or missing. It should be noted that if any data or other information is inaccurate or incomplete, our calculations may need to be revised.
Note that CalSTRS provides two files with benefit recipients. The benefit valuation file includes all service retirees, disabled retirees, and most surviving beneficiaries. The family benefit valuation file includes other survivors, including child beneficiaries and survivors deferring their benefit. Information from the family benefit valuation file is included with the survivor information shown in this section, except for average ages and benefit amounts.
Tables C.1-C.6 summarize the census data used in this valuation.

Milliman June 30, 2018 Actuarial ValuationDefined Benefit Program of the Appendix CCalifornia State Teachers’ Retirement System Valuation Data
This work product was prepared solely for CalSTRS for the purposes described herein and may not be appropriate to use for other purposes. Millimandoes not intend to benefit and assumes no duty or liability to other parties who receive this work. Milliman recommends that third parties be aided by their own actuary or other qualified professional when reviewing the Milliman work product.
66
Table C.1Summary of Statistical Information
June 30, 2018 June 30, 2017
Number of MembersActive Members (1)
Inactive Members (1)
Retirees and BeneficiariesService RetireesDisabled RetireesSurvivorsTotal Benefit Recipients
Total Membership in Valuation
449,595198,058
264,78010,08926,990
301,859
949,512
445,935192,601
258,55010,02326,301
294,874
933,410
Active Member StatisticsEarned Salaries (2)
Average Earned SalaryAverage AgeAverage Service
$ 31,884 million$ 70,91845.2 years12.1 years
$ 31,136 million$ 69,82245.3 years12.1 years
1. Some active members were reported with no Earnable Salaries, in which case their liabilities, if any, were included with inactive members.2. Total of prior year Earned Salaries for all active members. This may differ from the payroll amounts shown elsewhere which may include other adjustments.
Retired Member Statistics(3) June 30, 2018 June 30, 2017Average Age
Service Retiree 73.7 73.5Disabled Retiree 66.2 66.0Survivors 77.6 77.5
All Benefit Recipients 73.7 73.5
Average Monthly BenefitService Retirees $ 4,086 $ 3,985Disabled Retirees 2,833 2,762Survivors 2,624 2,538
All Benefit Recipients $ 3,930 $ 3,831
3. Average retiree ages shown here are current ages; average retiree ages shown elsewhere in this Appendix are age at retirement. Survivors from family benefit valuation file are excluded from averages.
Inactive Member Statistics June 30, 2018 June 30, 2017
Average Age 49.7 49.4Average Account Balance $ 12,257 $ 12,072

Milliman June 30, 2018 Actuarial ValuationDefined Benefit Program of the Appendix CCalifornia State Teachers’ Retirement System Valuation Data
This work product was prepared solely for CalSTRS for the purposes described herein and may not be appropriate to use for other purposes. Millimandoes not intend to benefit and assumes no duty or liability to other parties who receive this work. Milliman recommends that third parties be aided by their own actuary or other qualified professional when reviewing the Milliman work product.
67
Table C.1 Summary of Statistical Information
(Continued)
Active Member Statistics by Benefit Formula (1)
NumberEarned Salaries (2)
Average Earned SalaryAverage AgeAverage Service
2% at 60Members
349,181$ 27,637 million
$ 79,14748.3 years15.0 years
2% at 62 Members
100,414$ 4,248 million
$ 42,30134.4 years2.0 years
Retired Member Statistics by BenefitStructure(3)
1990 Benefit Total Benefit
Average Monthly Benefit
Service Retirees $ 3,383 $ 4,086
Disabled Retirees 2,803 2,833
Survivors 2,458 2,624All Benefit Recipients $ 3,292 $ 3,930
Pre-2014 Total
Pre-2014 StatisticsActive Member Average ServiceInactive Member Average Account Balance
Average Monthly Benefit for AllBenefit Recipients
8.9 years
$ 10,998
$ 3,892
12.1 years
$ 12,257
$ 3,930
1. Some active members were reported with no Earnable Salaries, in which case their liabilities, if any, were included with inactive members.2. Total of prior year Earned Salaries for all active members. This differs from the payroll amounts shown elsewhere in this report which reflect annualized amounts for members who were hired part way through the prior year.

Milliman June 30, 2018 Actuarial ValuationDefined Benefit Program of the Appendix CCalifornia State Teachers’ Retirement System Valuation Data
This work product was prepared solely for CalSTRS for the purposes described herein and may not be appropriate to use for other purposes. Millimandoes not intend to benefit and assumes no duty or liability to other parties who receive this work. Milliman recommends that third parties be aided by their own actuary or other qualified professional when reviewing the Milliman work product.
68
Table C.2Age and Service Distribution – Active Male Members
Age 1 & UnderGreater than 1
& Under 5 5-9 10-14 15-19 20-24Less than 25 1199 350
25 to 30 3,398 5,430 498 30 to 35 2,089 5,696 3,950 660 35 to 40 1,566 3,982 4,147 5,529 871 1 40 to 45 1,166 2,747 2,595 4,887 6,337 928 45 to 50 1,047 2,150 1,873 3,261 6,130 5,906 50 to 55 741 1,643 1,393 2,095 3,500 4,663 55 to 60 639 1,323 1,089 1,522 2,457 2,736 60 to 65 389 1,012 865 1,183 1,597 1,576 65 to 70 258 587 487 549 716 625
70 and over 161 425 314 298 268 194Age Unknown - - - - - -
Total 12,653 25,345 17,211 19,984 21,876 16,629
Age 25-29 30-34 35-39 40-44 45 & Over TotalLess than 25 1549
25 to 30 9,326 30 to 35 12,395 35 to 40 16,096 40 to 45 3 18,663 45 to 50 368 2 20,737 50 to 55 2,926 213 17,174 55 to 60 2,879 1,968 136 1 14,750 60 to 65 1,385 913 466 23 9,409 65 to 70 399 242 115 70 3 4,051
70 and over 127 80 56 42 50 2,015Age Unknown - - - - - -
Total 8,087 3,418 773 136 53 126,165
Years of Service
Years of ServiceMale

Milliman June 30, 2018 Actuarial ValuationDefined Benefit Program of the Appendix CCalifornia State Teachers’ Retirement System Valuation Data
This work product was prepared solely for CalSTRS for the purposes described herein and may not be appropriate to use for other purposes. Millimandoes not intend to benefit and assumes no duty or liability to other parties who receive this work. Milliman recommends that third parties be aided by their own actuary or other qualified professional when reviewing the Milliman work product.
69
Table C.3Age and Service Distribution – Active Female Members
Age 1 & UnderGreater than 1
& Under 5 5-9 10-14 15-19 20-24Less than 25 4,126 1,600 2
25 to 30 8,264 18,639 2,381 30 to 35 4,406 15,199 13,527 2,563 2 35 to 40 3,499 9,687 11,392 18,249 2,806 2 40 to 45 2,735 7,117 7,362 13,244 17,510 2,258 45 to 50 2,151 5,759 5,955 8,582 13,418 12,949 50 to 55 1,455 4,012 4,187 5,883 8,100 8,788 55 to 60 1,064 2,937 3,121 4,776 6,483 6,453 60 to 65 584 1,794 1,963 2,952 4,236 4,151 65 to 70 278 821 845 1,052 1,528 1,418
70 and over 149 417 398 360 439 362Age Unknown - - - - - -
Total 28,711 67,982 51,133 57,661 54,522 36,381
Age 25-29 30-34 35-39 40-44 45 & Over TotalLess than 25 5,728
25 to 30 29,284 30 to 35 35,697 35 to 40 45,635 40 to 45 2 50,228 45 to 50 885 1 49,700 50 to 55 6,506 756 3 39,690 55 to 60 5,784 4,671 376 3 35,668 60 to 65 2,929 1,841 974 48 21,472 65 to 70 837 390 211 139 18 7,537
70 and over 265 186 87 57 71 2,791Age Unknown - - - - - -
Total 17,208 7,845 1,651 247 89 323,430
Years of Service
FemaleYears of Service

Milliman June 30, 2018 Actuarial ValuationDefined Benefit Program of the Appendix CCalifornia State Teachers’ Retirement System Valuation Data
This work product was prepared solely for CalSTRS for the purposes described herein and may not be appropriate to use for other purposes. Millimandoes not intend to benefit and assumes no duty or liability to other parties who receive this work. Milliman recommends that third parties be aided by their own actuary or other qualified professional when reviewing the Milliman work product.
70
Table C.4Age and Service Distribution – All Active Members
Age 1 & UnderGreater than 1
& Under 5 5-9 10-14 15-19 20-24Less than 25 5,325 1,950 2
25 to 30 11,662 24,069 2,879 30 to 35 6,495 20,895 17,477 3,223 2 35 to 40 5,065 13,669 15,539 23,778 3,677 3 40 to 45 3,901 9,864 9,957 18,131 23,847 3,186 45 to 50 3,198 7,909 7,828 11,843 19,548 18,855 50 to 55 2,196 5,655 5,580 7,978 11,600 13,451 55 to 60 1,703 4,260 4,210 6,298 8,940 9,189 60 to 65 973 2,806 2,828 4,135 5,833 5,727 65 to 70 536 1,408 1,332 1,601 2,244 2,043
70 and over 310 842 712 658 707 556Age Unknown - - - - - -
Total 41,364 93,327 68,344 77,645 76,398 53,010
Age 25-29 30-34 35-39 40-44 45 & Over TotalLess than 25 7,277
25 to 30 38,610 30 to 35 48,092 35 to 40 61,731 40 to 45 5 68,891 45 to 50 1,253 3 70,437 50 to 55 9,432 969 3 56,864 55 to 60 8,663 6,639 512 4 50,418 60 to 65 4,314 2,754 1,440 71 30,881 65 to 70 1,236 632 326 209 21 11,588
70 and over 392 266 143 99 121 4,806Age Unknown - - - - - -
Total 25,295 11,263 2,424 383 142 449,595
Years of Service
TotalYears of Service

Milliman June 30, 2018 Actuarial ValuationDefined Benefit Program of the Appendix CCalifornia State Teachers’ Retirement System Valuation Data
This work product was prepared solely for CalSTRS for the purposes described herein and may not be appropriate to use for other purposes. Millimandoes not intend to benefit and assumes no duty or liability to other parties who receive this work. Milliman recommends that third parties be aided by their own actuary or other qualified professional when reviewing the Milliman work product.
71
Table C.5Inactive Members
Fiscal Year Ending June 30
NumberVested
TotalNumber
Male% of Total
Female% of Total
2004 22,511 116,128 28.7% 71.3%2005 24,113 124,394 28.8 71.22006 26,733 133,601 28.8 71.22007 28,922 141,450 28.9 71.12008 30,370 147,997 29.0 71.02009 31,661 156,207 29.0 71.02010 33,036 166,976 29.2 70.82011 33,976 173,719 29.1 70.92012 34,848 178,655 29.1 70.92013 35,883 182,576 29.1 70.92014 36,344 182,815 29.2 70.82015 36,953 184,396 29.3 70.72016 38,014 187,722 29.4 70.62017 38,955 192,601 29.5 70.52018 39,942 198,058 29.6 70.4
Fiscal Year EndingJune 30
Average Account
on DepositAverage
Age
Average ServiceCredit
AverageYears
Inactive
2004 $12,418 45.8 2.9 7.32005 12,177 45.9 2.9 7.42006 12,282 45.9 2.9 7.52007 12,440 46.0 3.0 7.72008 12,698 46.3 2.9 8.02009 12,717 46.5 2.9 8.22010 12,334 46.7 2.8 8.32011 12,035 46.8 2.8 8.62012 11,818 47.2 2.8 8.92013 11,771 47.6 2.8 9.42014 11,815 48.1 2.8 9.92015 11,825 48.7 2.9 10.42016 11,953 49.1 2.9 10.82017 12,072 49.4 2.9 11.12018 12,257 49.7 2.9 11.4

Milliman June 30, 2018 Actuarial ValuationDefined Benefit Program of the Appendix CCalifornia State Teachers’ Retirement System Valuation Data
This work product was prepared solely for CalSTRS for the purposes described herein and may not be appropriate to use for other purposes. Millimandoes not intend to benefit and assumes no duty or liability to other parties who receive this work. Milliman recommends that third parties be aided by their own actuary or other qualified professional when reviewing the Milliman work product.
72
Table C.6Members Retired for Service
Fiscal Year Ending June 30 Total
Male% of Total
Female% of Total
2004 169,022 37.2% 62.8%2005 176,008 36.9 63.12006 181,833 36.5 63.52007 188,659 36.1 63.92008 195,960 35.7 64.32009 203,649 35.3 64.72010 213,952 34.9 65.12011 222,222 34.4 65.62012 230,278 34.0 66.02013 236,487 33.6 66.42014 241,920 33.1 66.92015 247,353 32.7 67.32016 252,672 32.3 67.72017 258,550 31.9 68.12018 264,780 31.5 68.5
Fiscal Year EndingJune 30
Average Age at
Retirement
Average Years of Service Credit
Final Average
Compensation
Average Current
Allowance Payable
2004 60.7 26.0 $3,931 $2,4882005 60.8 26.1 4,103 2,6172006 60.8 26.2 4,264 2,7412007 60.8 26.3 4,437 2,8782008 60.8 26.3 4,620 3,0212009 60.8 26.4 4,798 3,1642010 60.9 26.3 4,983 3,3022011 61.0 26.3 5,138 3,4172012 61.1 26.2 5,271 3,5172013 61.1 26.1 5,385 3,6092014 61.2 26.0 5,487 3,6942015 61.3 25.9 5,597 3,7862016 61.3 25.8 5,716 3,8842017 61.4 25.7 5,846 3,9852018 61.5 25.6 5,981 4,086

Milliman June 30, 2018 Actuarial ValuationDefined Benefit Program of theCalifornia State Teachers’ Retirement System
This work product was prepared solely for CalSTRS for the purposes described herein and may not be appropriate to use for other purposes. Milliman does not intend to benefit and assumes no duty or liability to other parties who receive this work. Milliman recommends that third parties be aided by their own actuary or other qualified professional when reviewing the Milliman work product.
73
Appendix D GlossaryThe following definitions are largely excerpts from a list adopted by the major actuarial organizations in the United States. In some cases, the definitions have been modified for specific applicability to the CalSTRS DB Program. Defined terms are capitalized throughout this Appendix.
Actuarial Assumptions
Assumptions as to the occurrence of future events affecting pension costs, such as mortality, withdrawal, disablement and retirement, changes in compensation, rates of investment earnings and asset appreciation or depreciation, and procedures used to determine other relevant items.
Actuarial Cost Method
A procedure for determining the Actuarial Present Value of pension plan benefits and expenses and for developing an actuarially equivalent allocation of such value to time periods, usually in the form of a Normal Cost and an Actuarial Obligation.
Actuarial Equivalent
Of equal Actuarial Present Value, determined as of a given date with each value based on the same set of Actuarial Assumptions.
Actuarial Gain or Loss
A measure of the difference between actual experience and that expected based upon a set of Actuarial Assumptions during the period between two actuarial valuation dates, as determined in accordance with a particular Actuarial Cost Method.
Actuarial Obligation
That portion, as determined by a particular Actuarial Cost Method, of the Actuarial Present Value of pension plan benefits and expenses which is not provided for by future Normal Costs.
Actuarial Present Value
The value of an amount or series of amounts payable or receivable at various times, determined as of a given date by the application of a particular set of Actuarial Assumptions.
Actuarial Surplus
The excess, if any, of the Actuarial Value of Assets over the Actuarial Obligation.
Actuarial Valuation
The determination, as of a Valuation Date, of the Normal Cost, Actuarial Obligation, Actuarial Value of Assets and related Actuarial Present Values for a pension plan.
Actuarial Value of Assets
The value of cash, investments and other property belonging to a pension plan, as used by the actuary for the purpose of an actuarial valuation.
Milliman June 30, 2018 Actuarial ValuationDefined Benefit Program of the Appendix DCalifornia State Teachers’ Retirement System Glossary
This work product was prepared solely for CalSTRS for the purposes described herein and may not be appropriate to use for other purposes. Millimandoes not intend to benefit and assumes no duty or liability to other parties who receive this work. Milliman recommends that third parties be aided by their own actuary or other qualified professional when reviewing the Milliman work product.
74
Entry Age Cost Method
An Actuarial Cost Method under which the Actuarial Present Value of Projected Benefits of each individual included in the actuarial valuation is allocated on a level basis over the earnings of the individual between entryage and assumed exit ages. The portion of this Actuarial Present Value allocated to a valuation year is called the Normal Cost. The portion of this Actuarial Present Value not provided for at a Valuation Date by the Actuarial Present Value of future Normal Costs is called the Actuarial Obligation.
Normal Cost
The portion of the Actuarial Present Value of Projected Benefits which is allocated to a valuation year by the Actuarial Cost Method.
Projected Unit Credit Cost Method
An Actuarial Cost Method under which the Actuarial Obligation is equal to the portion of the Actuarial Present Value of Projected Benefits of each individual included in the actuarial valuation is attributable to service credit that has been earned to date (past service). Since this cost method is only used in this valuation for cases where the service is fixed as of June 30, 2014, the Actuarial Obligation is equal to the portion of the Actuarial Present Value of Projected Benefits for the DB Program, and there is no Normal Cost.
Unfunded Actuarial Obligation
The excess, if any, of the Actuarial Obligation over the Actuarial Value of Assets.
Valuation Date
June 30, 2018.

F-1
APPENDIX F
SUMMARY OF CERTAIN PROVISIONS OF THE PRINCIPAL LEGAL DOCUMENTS
Certain provisions of the Facility Lease, Site Lease and the Trust Agreement, not previously discussed in this Official Statement, are summarized below. These summaries do not purport to be complete or definitive and are qualified in their entirety by reference to the full terms of the documents.
CERTAIN DEFINITIONS
The following are definitions of certain of the terms defined in the Facility Lease or the Trust Agreement, to which reference is hereby made. The following definitions are equally applicable to both the singular and plural forms of the terms defined herein. Capitalized terms not otherwise defined herein will have the meaning assigned to such term in the Trust Agreement or, if not defined therein, in the Facility Lease.
“Act” means the Bergeson-Peace Infrastructure and Economic Development Bank Act (being Title 6.7 of the California Government Code, Section 63000 and following) and all laws amendatory thereof or supplemental thereto.
“Additional Bonds” means all bonds of IBank authorized by and at any time Outstanding pursuant to the Trust Agreement and executed, issued and delivered in accordance with the Trust Agreement.
“Additional Payments” means all amounts payable by CalSTRS to IBank or the Trustee or any other person as Additional Payments pursuant to the Facility Lease.
“Base Rental Payments” means all amounts payable to IBank from CalSTRS as base rental payments pursuant to the Facility Lease in order to pay the principal of and interest on the Bonds.
“Bonds” means the Series 2019 Bonds and all Additional Bonds.
“Business Day” means any day other than a Saturday or Sunday or day upon which the Trustee, State of California offices or banking institutions in the State of California are authorized by law to remain closed.
“Certificate of CalSTRS” means an instrument in writing signed by the Chief Executive Officer, or by such officers’ duly appointed designee, or by any other officer of CalSTRS duly authorized by CalSTRS for that purpose.
“Certificate of the IBank” means an instrument in writing signed by IBank’s Executive Director, or his or her designee, or by any other officer of IBank duly authorized by IBank for that purpose.
“Code” means the Internal Revenue Code of 1986, as amended.
“Costs of Issuance” means all items of expense directly or indirectly payable by or reimbursable to CalSTRS or IBank and related to the authorization, execution and delivery of the Site Lease, the Facility Lease, the Trust Agreement and the sale of the Bonds, including, but not limited to, costs of preparation and reproduction of documents, costs of rating agencies and costs to provide information required by rating agencies, premiums for bond insurance, if any, filing and recording fees, initial fees and charges of the Trustee, legal fees and charges, fees and disbursements of consultants and professionals,, fees and expenses of the underwriter, fees and charges for preparation, execution and safekeeping of the Bonds, fees and charges of IBank and the State Treasurer’s Office, and any other cost, charge or fee in connection with the original execution and delivery of the Bonds.
“Date of Issuance” means December 19, 2019.

F-2
“Debt Service” means, for any Fiscal Year or other period, the sum of (1) the interest accruing during such Fiscal Year or period on all Outstanding Bonds, assuming that all Outstanding Serial Bonds are retired as scheduled and that all Outstanding Term Bonds are redeemed or paid from Mandatory Sinking Account Payments as scheduled (except to the extent that such interest is to be paid from the proceeds of sale of any Bonds), (2) that portion of the principal amount of all Outstanding Serial Bonds maturing on the next succeeding principal payment date that would have accrued during such Fiscal Year or period if such principal amount were deemed to accrue daily in equal amounts from the next preceding principal payment date or during the year preceding the first principal payment date, as the case may be, and (3) that portion of the principal amount of all Outstanding Term Bonds required to be redeemed or paid on the next succeeding redemption date (together with the redemption premiums, if any, thereon) that would have accrued during such Fiscal Year or period if such principal amount (and redemption premiums) were deemed to accrue daily in equal amounts from the next preceding redemption date or during the year preceding the first redemption date, as the case may be.
“Demised Premises” means IBank’s interest in the Site created under the Site Lease and, upon commencement of construction thereof, the Project, including any Substituted Property.
“Event of Default” will have the meaning specified in the Trust Agreement. See “Trust Agreement – Defaults and Remedies.”
“Fiscal Year” means the twelve month period terminating on June 30 of each year, or any other annual accounting period hereafter selected and designated by CalSTRS as its Fiscal Year in accordance with applicable law.
“Fitch” means Fitch Ratings, Inc. and its successors and assigns, except that if such corporation will be dissolved or liquidated or will no longer perform the functions of a securities rating agency, then the term “Fitch” will be deemed to refer to any other nationally recognized securities rating agency selected by CalSTRS.
“IBank” or “Infrastructure Bank” means the California Infrastructure and Economic Development Bank, a public instrumentality of the State of California.
“Interest Payment Date” means a date on which interest is due on the Bonds, being February 1 and August 1 of each year to which reference is made, commencing on February 1, 2020.
“Mandatory Sinking Account Payments” means the payments set forth in the Trust Agreement.
“Moody’s Investors Service” or “Moody’s” means Moody’s Investors Service, Inc., a corporation duly organized and existing under and by virtue of the laws of the State of Delaware, and its successors and assigns, except that if such corporation will be dissolved or liquidated or will no longer perform the functions of a securities rating agency, then the term “Moody’s Investors Service” or “Moody’s” will be deemed to refer to any other nationally recognized securities rating agency selected by CalSTRS.
“Opinion of Counsel” means a written opinion of counsel of recognized national standing in the field of law relating to municipal bonds, appointed by IBank and paid for by CalSTRS.
“Outstanding,” when used as of any particular time with reference to Bonds, means (subject to the provisions of the Trust Agreement) all Bonds except
(1) Bonds theretofore cancelled by the Trustee or surrendered to the Trustee for cancellation;
(2) Bonds paid or deemed to have been paid within the meaning of the defeasance section of the Trust Agreement; and
(3) Bonds in lieu of or in substitution for which other Bonds will have been executed, issued and delivered by IBank pursuant to the Trust Agreement.

F-3
“Permitted Encumbrances” means (1) liens for general ad valorem taxes and assessments, if any, not then delinquent, or which CalSTRS may, pursuant to the Facility Lease, permit to remain unpaid; (2) easements, rights of way, mineral rights, drilling rights and other rights, reservations, covenants, conditions or restrictions which exist of record as of the date of the Trust Agreement and which CalSTRS certifies in writing will not materially impair the use of the Demised Premises; (3) the Site Lease, as it may be amended from time to time; (4) the Facility Lease, as it may be amended from time to time; (5) the Trust Agreement, as it may be amended from time to time; (6) any right or claim of any mechanic, laborer, materialman, supplier or vendor not filed or perfected in the manner prescribed by law; (7) easements, rights of way, mineral rights, drilling rights and other rights, reservations, covenants, conditions or restrictions to which IBank and CalSTRS consent in writing; and (8) liens relating to special assessments levied with respect to the Demised Premises.
“Permitted Investments” means any of the following which at the time are legal investments under the laws of the State for moneys held under the Trust Agreement and then proposed to be invested therein:
(i) bonds or interest-bearing notes or obligations of the United States, or those for which the
faith and credit of the United States are pledged for the payment of principal and interest;
(ii) bonds or interest-bearing notes or obligations that are guaranteed as to principal and interest by a federal agency of the United States;
(iii) bonds of the State or bonds for which the faith and credit of the State are pledged for the payment of principal and interest;
(iv) bonds, consolidated bonds, collateral trust debentures, consolidated debentures or other obligations issued by general land banks or federal intermediate credit banks established under the Federal Farm Loan Act, as amended, debentures and consolidated debentures issued by the Central Bank for Cooperatives and banks for cooperatives established under the Farm Credit Act of 1933, as amended, bonds or debentures of the Federal Home Loan Bank Board established under the Federal Home Loan Bank Act, stocks, bonds, debentures and other obligations of the Federal National Mortgage Association established under the National Housing Act, as amended, and the bonds of any federal home loan bank established under said act, obligations of the Federal Home Loan Mortgage Corporation;
(v) (1) commercial paper of “prime” quality as defined by no less than two Rating Agencies. Eligible paper is further limited to issuing corporations or trusts approved by the Pooled Money Investment Board created by Section 16480.1 of the California Government Code that meet the conditions in either subparagraph (A) or subparagraph (B):
(A) both of the following:
(i) organized and operating within the United States.
(ii) having total assets in excess of five hundred million dollars ($500,000,000).
(B) both of the following:
(i) organized within the United States as a special purpose corporation or trust.
(ii) having program-wide credit enhancements, including, but not limited to, overcollateralization, letters of credit, or surety bond.
(2) purchases of eligible commercial paper may not exceed 180 days' maturity, represent more than 5% of the outstanding paper of an issuing corporation or trust, nor exceed 30% of the resources of an investment program;

F-4
(vi) bills of exchange or time drafts drawn on and accepted by a commercial bank the general obligations of which are rated within the top two rating categories by no less than two Rating Agencies, otherwise known as banker’s acceptances, which are eligible for purchase by the Federal Reserve System;
(vii) negotiable certificates of deposit issued by a federally or state-chartered bank or savings and loan association or by a state-licensed branch of a foreign bank, or a federally or state-chartered credit union, which, to the extent they are not insured by federal deposit insurance, are issued by an institution the general obligations of which are rated in one of the top two rating categories by no less than two Rating Agencies;
(viii) bonds, debentures and notes issued by corporations organized and operating within the United States which securities are rated in one of the top two rating categories by no less than two Rating Agencies;
(ix) interest-bearing accounts in state or national banks or in state or federal savings and loan associations having principal offices in the State, the deposits of which will be secured at all times and in the same manner as state moneys are by law required to be secured;
(x) deposits in the Pooled Money Investment Account of the State of California;
(xi) repurchase agreements or reverse repurchase agreements, as such terms are defined in and pursuant to the terms of Section 16480.4 of the California Government Code;
(xii) uncollateralized investment agreements or other contractual arrangements with corporations, financial institutions or national associations within the United States, provided that the senior long-term debt of such corporations, institutions or associations is rated within the top two rating categories by no less than two Rating Agencies;
(xiii) collateralized investment agreements, repurchase agreements or other contractual arrangements with banks, corporations, financial institutions or national associations within the United States, provided that upon settlement of the collateralized investment agreements, repurchase agreements or other contractual arrangements the senior long-term debt of such banks, corporations, financial institutions or associations, or a guarantor thereof, is rated within the top three rating categories (regardless of modifiers) by no less than two Rating Agencies;
(xiv) money market funds that invest solely in obligations described in clause (i) of this definition; or
(xv) such other investments as may be authorized by a Supplemental Indenture, provided that prior written notice thereof has been provided to each Rating Agency.
“Project” means the CalSTRS headquarters expansion project to be acquired, designed, constructed and equipped with proceeds of the Series 2019 Bonds, together with site development, landscaping, utilities, fixtures, furnishings, equipment, improvements and appurtenant and related facilities, situated on the Site, and any Substituted Property.
“Rating Agencies” means Standard & Poor’s, Moody’s Investors Service and Fitch.
“Revenues” means all Base Rental Payments received by the Trustee pursuant to the Facility Lease (but not Additional Payments) and all interest or other income from any investment of any money in the Revenue Fund.
“Serial Bonds” means Bonds, maturing in specified years for which no Mandatory Sinking Account Payments are provided.
“Series,” whenever used in the Trust Agreement with respect to Bonds, means all of the Bonds designated as being of the same series, authenticated and delivered in a simultaneous transaction, regardless of

F-5
variations in maturity, interest rate, redemption and other provisions, and any Bonds thereafter authenticated and delivered upon transfer or exchange of or in lieu of or in substitution for (but not to refund) such Bonds as provided in the Trust Agreement.
“Series 2019 Bonds” means the California Infrastructure and Economic Development Bank Lease Revenue Bonds (California State Teachers’ Retirement System Headquarters Expansion) Series 2019 (Green Bonds – Climate Bond Certified), authorized by and at any time Outstanding pursuant to the Trust Agreement.
“Site” means the real property described in Exhibit A to the Site Lease, together with all property subsequently added thereto, or any property substituted for all or any portion of the Site in accordance with the Trust Agreement and the Site Lease.
“Standard & Poor’s” or “S&P” means Standard & Poor’s Credit Market Services, a division of The McGraw Hill Companies, Inc., a corporation duly organized and existing under and by virtue of the laws of the State of New York, and its successors and assigns, except that if such corporation will be dissolved or liquidated or will no longer perform the functions of a securities rating agency, then the term “Standard & Poor’s” or “S&P” will be deemed to refer to any other nationally recognized securities rating agency selected by CalSTRS.
“State” means the State of California.
“Substituted Property” means the property substituted for all or a portion of the Demised Premises pursuant to the Facility Lease.
“Supplemental Trust Agreement” means any supplement or amendment to the Trust Agreement hereafter duly authorized and entered into between IBank and the Trustee in accordance with the provisions of the Trust Agreement.
“Tax Certificate” means the Tax Certificate delivered by IBank and CalSTRS at the time of the issuance and delivery of a Series of Bonds, as the same may be amended or supplemented in accordance with its terms.
“Term Bonds” means Bonds payable at or before their specified maturity date or dates from Mandatory Sinking Account Payments established for that purpose and calculated to retire such Bonds on or before their specified maturity date or dates.
“Written Request of CalSTRS” means an instrument in writing signed by the Chief Executive Officer or by any such officers duly appointed designee, or by any other officer or employee of CalSTRS duly authorized by CalSTRS for that purpose.
“Written Request of IBank” means an instrument in writing signed by the Executive Director of IBank or his or her designee or by any other officer of IBank duly authorized by IBank for that purpose.
FACILITY LEASE
Lease of Demised Premises
IBank leases to CalSTRS and CalSTRS leases from IBank the Demised Premises, subject, however, to all easements, encumbrances, and restrictions that exist, whether or not filed in the Office of the County Recorder of Yolo County, and whether or not known, actually or constructively, to CalSTRS, at the time of the commencement of the term of the Facility Lease.
The leasing by CalSTRS to the IBank of the Site will not effect or result in a merger of CalSTRS’ leasehold estate pursuant to the Facility Lease and its fee estate as lessor under the Site Lease, and IBank will continue to have and hold a leasehold estate in the Site pursuant to the Site Lease throughout the term thereof and

F-6
the term of the Facility Lease. As to said Demised Premises, the Facility Lease will be deemed and constitute a sublease.
CalSTRS represents that the Project is essential for CalSTRS to undertake its obligation set forth in the State Constitution to administer its system in a manner that will assure prompt delivery of benefits and related services to CalSTRS’ members and their beneficiaries.
Term; Occupancy
The term of the Facility Lease will commence on the date of recordation of the Facility Lease in the office of the County Recorder of Yolo County, State of California, or on December 31, 2019, whichever is earlier, and will end on August 1, 2049, unless such term is extended or sooner terminated as provided in the Facility Lease. If on August 1, 2049, the Bonds will not be fully paid, or if the Base Rental payable under the Facility Lease will have been abated at any time and for any reason, then the term of the Facility Lease will be extended until ten (10) days after all Bonds will be fully paid, except that the term of the Facility Lease will in no event be extended beyond August 1, 2059. If prior to August 1, 2049 all Bonds will be fully paid, or provision therefor made pursuant to the defeasance section of the Trust Agreement, the term of the Facility Lease will end without prior notice and without the subsequent recordation or filing of any instrument or document ten (10) days thereafter.
It is contemplated that CalSTRS will take possession of the Project and each and every part thereof on or before February 1, 2023 and the obligation to pay Base Rental Payments will commence on such date. If the Project or any part thereof will be substantially completed before February 1, 2023, CalSTRS may take possession of the Project or such part thereof upon such substantial completion. IBank covenants that it will cause the Project to be acquired, designed, constructed, and equipped with all practicable dispatch, but solely through IBank’s appointment of CalSTRS as IBank’s agent for such purposes pursuant to the Facility Lease. CalSTRS acknowledges and agrees that as IBank’s agent it will be solely responsible for the acquisition, design, construction, and equipping of the Project, and all other tasks or activities necessary or desirable to construct a fully functional Project usable by CalSTRS for its intended purpose.
If IBank, through its appointment of CalSTRS as IBank’s agent pursuant to the Facility Lease, for any reason whatsoever cannot deliver possession of the Project or any part thereof to CalSTRS on February 1, 2023, the Facility Lease will not be void or voidable, nor will IBank be liable to CalSTRS for any loss or damages resulting therefrom; but in that event the Base Rental Payments payable under the Facility Lease will be abated proportionately in the proportion on which the acquisition, design, construction, and equipping costs of the part or parts of the Project not yet delivered to CalSTRS bears to the acquisition, design, construction, and equipping costs of the entire Project with respect to the period between February 1, 2023, and the time when IBank delivers possession of such part.
Purpose of Lease
CalSTRS covenants that during the term of the Facility Lease, except as provided in the Facility Lease, (a) it will not vacate or abandon the Project or any part thereof, and (b) it will not make any use of the Site and the Project which would jeopardize in any way the insurance coverage required to be maintained pursuant to the Facility Lease.
Substitution; Release
CalSTRS and IBank may substitute or release real property as part of the Demised Premises for purposes of the Site Lease and the Facility Lease, but only after CalSTRS will have filed with IBank and the Trustee all of the following:
(a) Executed copies of the Site Lease and the Facility Lease or amendments thereto containing the amended description of the Demised Premises, including the legal description of the Site as modified if necessary.

F-7
(b) A Certificate of CalSTRS, evidencing that the annual fair rental value (which may be based on, but not limited to, the construction or acquisition cost or replacement cost of the Project) of the Demised Premises after such substitution or release will be at least equal to 100% of the maximum amount of Base Rental Payments becoming due in the then current year ending August 1 and in any subsequent year ending August 1.
(c) With respect to a substitution of property, leasehold owner's policy or policies or a commitment for such policy or policies or an amendment or endorsement to an existing policy or policies resulting in title insurance with respect to the Demised Premises after such substitution in an amount at least equal to the outstanding principal amount of the Bonds; each such insurance instrument, when issued, will name the Trustee as the insured, and will insure the leasehold estate of IBank in such substituted property subject only to such exceptions as do not substantially interfere with CalSTRS' right to use and occupy such substituted property and as will not result in an abatement of Base Rental Payments payable by CalSTRS under the Facility Lease.
(d) A Certificate of CalSTRS stating that the substitution or withdrawal, as applicable, does not adversely affect CalSTRS’ beneficial use and occupancy of the Demised Premises.
(e) An Opinion of Counsel (as such term is defined in the Trust Agreement) stating that such amendment or modification (i) is authorized or permitted under the Facility Lease; (ii) is in accordance with the Facility Lease, the Site Lease, the Trust Agreement, and the Tax Certificate; (iii) will, upon the execution and delivery thereof, be valid and binding upon IBank and CalSTRS and (iv) will not adversely affect the exclusion of interest on the Bonds from gross income for federal income tax purposes.
Base Rental Payments
Base Rental Payments. CalSTRS agrees to pay to IBank, as Base Rental Payments for the use and occupancy of the Project and the Site (subject to the provisions of the Facility Lease) in semiannual settlements, all in accordance with the Base Rental Payment Schedule attached to the Facility Lease. Each Base Rental Payment installment will be payable at least three Business Days in advance of its due date. Each annual payment of Base Rental Payments will be for the use of the Site and the Project following completion of construction of the Project.
If the term of the Facility Lease will have been extended pursuant to the terms thereof, Base Rental Payment installments will continue to be due on February 1 and August 1 in each year, and payable as described in the Facility Lease, continuing to and including the date of termination of the Facility Lease, in an amount equal to the amount of Base Rental Payments payable for the twelve-month period commencing August 1, 2048.
Additional Payments
CalSTRS will also pay such amounts (collectively, the “Additional Payments”) as additional rental for the occupancy of the Demised Premises, as will be required by IBank for the payment of all costs and expenses incurred by IBank in connection with the execution, performance or enforcement of the Facility Lease or any assignment thereof, the Trust Agreement, the Site Lease, its interest in the Demised Premises and the lease of the Demised Premises to CalSTRS, including but not limited to payment of all fees, costs and expenses and all administrative costs of IBank related to the Demised Premises, including, without limiting the generality of the foregoing, salaries and wages of employees, all expenses, compensation and indemnification of the Trustee payable by IBank under the Trust Agreement, fees of auditors, accountants, attorneys (including IBank’s in-house attorneys or the attorneys for the California Attorney General’s Office when acting on behalf of IBank) or architects, and all other necessary administrative costs of IBank or charges required to be paid by it in order to maintain its existence or to comply with the terms of the Bonds or of the Trust Agreement or of the Facility Lease; but not including any Base Rental Payments.
Fair Rental Value
Such payments of Base Rental Payments and Additional Payments for each rental period during the term of the Facility Lease will constitute the total rental for said rental period and will be paid by CalSTRS in

F-8
each rental payment period for and in consideration of the right of use and occupancy of, and continued quiet use and enjoyment of, the Site and, following completion of construction, the Project during each such period for which said rental is to be paid. The parties to the Facility Lease have agreed and determined that such total rental payable for each twelve-month period beginning August 1 represents no more than the fair rental value of the Demised Premises for each such period. In making such determination, consideration has been given to costs of acquisition, design, construction and equipping of the Project, other obligations of the parties under the Facility Lease, the uses and purposes which may be served by the Project and Site, the expected revenues, if any, to be generated by the Project, and the benefits therefrom which will accrue to CalSTRS and the general public.
Rental Abatement
The Base Rental Payments and Additional Payments will be abated proportionately, during any period in which by reason of any damage or destruction (other than by condemnation as described under “Prepayment” below) there is substantial interference with the use and occupancy of the Project by CalSTRS, in the proportion in which the initial cost of that portion of the Project rendered unusable bears to the initial cost of the whole of the Project. Such abatement will continue for the period commencing with such damage or destruction and ending when such use and occupancy are restored. In the event of any such damage or destruction, the Facility Lease will continue in full force and effect and CalSTRS waives any right to terminate the Facility Lease by virtue of any such damage or destruction.
Appropriations Covenant
CalSTRS represents that the Base Rental Payments and Additional Payments due under the Facility Lease are continuously appropriated under existing law without regard to fiscal years from the Teachers’ Retirement Fund. The authority to approve budgeted expenditure of resources for the Base Rental Payments will not be subject to either the CalSTRS or State’s annual budget process or require approval via the State Budget. Notwithstanding the foregoing, CalSTRS covenants to take such action, if any, as may be necessary to include all such Base Rental Payments and Additional Payments due under the Facility Lease in its annual budgets, and to make necessary annual appropriations for all such Base Rental Payments and Additional Payments.
Maintenance and Utilities
During such time as CalSTRS is in possession of the Demised Premises, or any part thereof, all maintenance and repair, both ordinary and extraordinary, of the Project will be the responsibility of CalSTRS. At times when CalSTRS is not in possession of the Demised Premises, CalSTRS will either maintain or otherwise arrange for the maintenance of the Project in first class condition, and CalSTRS will pay for or otherwise arrange for the payment of all utility services supplied to the Project, which may include, without limitation, janitorial service, security, power, gas, telephone, light, heating, ventilation, air conditioning, water and all other utility services, and will pay for or otherwise arrange for payment of the cost of the repair and replacement of the Project resulting from ordinary wear and tear or want of care on the part of CalSTRS or any assignee or sublessee thereof or any other cause and will pay for or otherwise arrange for the payment of all insurance policies required to be maintained with respect to the Demised Premises. In exchange for the Base Rental Payments and Additional Payments provided in the Facility Lease, IBank agrees only to lease the Demised Premises to CalSTRS as provided in the Facility Lease.
Changes to the Project
CalSTRS will, at its own expense, have the right to remodel the Project or to make repairs, additions, modifications and improvements to the Project. All such repairs, additions, modifications and improvements will thereafter comprise part of the Project and be subject to the provisions of the Facility Lease. Such repairs, additions, modifications and improvements will not in any way damage the Project or cause it to be used for purposes other than those authorized under the provisions of State and federal law; and the Project, upon completion of any additions, modifications and improvements made pursuant to the Facility Lease, will be of a value which is at least equal to the value of the Project immediately prior to the making of such additions, modifications and improvements.

F-9
Installation of CalSTRS’ Equipment
CalSTRS may at any time and from time to time, in its sole discretion and at its own expense, install or permit to be installed other items of equipment or other personal property in or upon the Demised Premises. All such items will remain the sole property of CalSTRS, in which neither IBank nor the Trustee will have any interest, and may be modified or removed by CalSTRS at any time provided that CalSTRS will repair and restore any and all damage to the Project resulting from the installation, modification or removal of any such items.
Insurance
CalSTRS will procure or cause to be procured and maintain or cause to be maintained, throughout the term of the Facility Lease (but during the period of construction of the Project, only if such insurance is not provided by a Contractor under a construction contract), insurance against loss or damage to any structures constituting any part of the Project by fire and lightning, with extended coverage insurance, vandalism and malicious mischief insurance and sprinkler system leakage insurance. Said extended coverage insurance will, as nearly as practicable, cover loss or damage by explosion, windstorm, riot, aircraft, vehicle damage, smoke and such other hazards as are normally covered by such insurance. Such insurance will be in an amount equal to the replacement cost (without deduction for depreciation) of all structures constituting any part of the Project, excluding the cost of excavations, of grading and filling, and of the land except that such insurance may be subject to deductible clauses for any one loss of not to exceed two hundred fifty thousand dollars ($250,000), or, in the alternative, will be in an amount and in a form sufficient, in the event of total or partial loss, to enable all Bonds then Outstanding to be redeemed. Such insurance may be part of a joint-purchase insurance program.
As an alternative to providing the insurance described in the preceding paragraph, or any portion thereof, CalSTRS may provide a self-insurance method or plan of protection if and to the extent such self-insurance method or plan of protection will afford reasonable coverage for the risks required to be insured against, in light of all circumstances, giving consideration to cost, availability and similar plans or methods of protection adopted by public entities in the State other than CalSTRS. Before such other method or plan may be provided by CalSTRS, and annually thereafter so long as such method or plan is being provided to satisfy the requirements of the Facility Lease, there will be filed with the Trustee a certificate of an actuary, insurance consultant or other qualified person (who may be an employee of CalSTRS), stating that, in the opinion of the signer, the substitute method or plan of protection is in accordance with the requirements of the Facility Lease and, when effective, would afford reasonable coverage for the risks required to be insured against. There will also be filed a certificate of CalSTRS setting forth the details of such substitute method or plan. In the event of loss covered by any such self-insurance method, the liability of CalSTRS under the Facility Lease will be limited to the amounts in the self-insurance reserve fund or funds created under such method.
CalSTRS will procure or cause to be procured and maintain or cause to be maintained commencing upon substantial completion of the Project and throughout the remaining term of the Facility Lease, rental interruption or use and occupancy insurance to cover loss, total or partial, of the rental income from or the use of the Project as the result of any of the hazards covered by the insurance required by the Facility Lease, in an amount sufficient to pay the maximum annual Base Rental Payments under the Facility Lease for any two year period. Such insurance may be part of a joint-purchase insurance program. Any proceeds of such insurance will be used by the Trustee to reimburse to CalSTRS any Base Rental Payments theretofore paid by CalSTRS under the Facility Lease attributable to such structure for a period of time during which the payment of Base Rental Payments under the Facility Lease is abated, and any proceeds of such insurance not so used will be applied as described in “Rental Periods” above to the extent required for the payment of Base Rental Payments and of Additional Payments.
Defaults and Remedies
(a) If CalSTRS will fail to pay any rental payable under the Facility Lease when the same becomes due and payable, time being expressly declared to be of the essence of the Facility Lease, or CalSTRS will fail to keep, observe or perform any other term, covenant or condition contained in the Facility Lease to be kept or performed by CalSTRS for a period of thirty (30) days after notice of the same has been given to CalSTRS by IBank or the Trustee or for such additional time as is reasonably required, in the sole discretion of the Trustee, to correct the same, but not to exceed sixty (60) days, or upon the happening of any of the events specified in the Facility

F-10
Lease (any such case above being an “Event of Default”), CalSTRS will be deemed to be in default under the Facility Lease and it will be lawful for the Trustee (subject to its rights and protections under the Trust Agreement) or IBank to exercise any and all remedies granted pursuant to the Facility Lease. Upon any such default, the Trustee or IBank, in addition to all other rights and remedies they may have at law, may do any of the following.
(1) Terminate the Facility Lease in the manner hereinafter provided on account of default by CalSTRS, notwithstanding any re-entry or re-letting of the Demised Premises as hereinafter described, and to re-enter the Demised Premises and remove all persons in possession thereof and all personal property whatsoever situated upon the Demised Premises and place such personal property in storage in any warehouse or other suitable, secured place located within the City of West Sacramento, California. In the event of such termination, CalSTRS agrees to surrender immediately possession of the Demised Premises, without let or hindrance, and to pay IBank and the Trustee all damages recoverable at law that IBank and the Trustee may incur by reason of default by CalSTRS, including, without limitation, any costs, loss or damage whatsoever arising out of, in connection with, or incident to any such re-entry upon the Demised Premises and removal and storage of such property by IBank, the Trustee, or their duly authorized agents in accordance with the provisions contained in the Facility Lease. Neither notice to pay rent or to deliver up possession of the Demised Premises given pursuant to law nor any entry or re-entry by IBank or the Trustee nor any proceeding in unlawful detainer, or otherwise, brought by IBank or the Trustee for the purpose of effecting such re-entry or obtaining possession of the Demised Premises nor the appointment of a receiver upon initiative of IBank or the Trustee to protect IBank’s or the Trustee’s interest under the Facility Lease will of itself operate to terminate the Facility Lease, and no termination of the Facility Lease on account of default by CalSTRS will be or become effective by operation of law or acts of the parties hereto, or otherwise, unless and until IBank or the Trustee will have given written notice to CalSTRS of the election on the part of IBank or the Trustee, as applicable, to terminate the Facility Lease.
(2) Without terminating the Facility Lease, (i) collect each installment of rent as it becomes due and enforce any other terms or provision hereof to be kept or performed by CalSTRS, regardless of whether or not CalSTRS has abandoned the Demised Premises, or (ii) exercise any and all rights of re-entry upon the Demised Premises. In the event IBank or the Trustee does not elect to terminate the Facility Lease in the manner provided for in subparagraph (1) hereof, CalSTRS will remain liable and agrees to keep or perform all covenants and conditions contained in the Facility Lease to be kept or performed by CalSTRS and, if the Demised Premises is not re-let, to pay the full amount of the rent to the end of the term of the Facility Lease or, in the event that the Demised Premises is re-let, to pay any deficiency in rent that results therefrom; and further agrees to pay said rent and/or rent deficiency punctually at the same time and in the same manner as hereinabove provided for the payment of rent under the Facility Lease (without acceleration), notwithstanding the fact that IBank or the Trustee may have received in previous years or may receive thereafter in subsequent years rental in excess of the rental specified in the Facility Lease, and notwithstanding any entry or re-entry by IBank or the Trustee or suit in unlawful detainer, or otherwise, brought by IBank or the Trustee for the purpose of effecting such entry or re-entry or obtaining possession of the Demised Premises. Should IBank or the Trustee elect to enter or re-enter as provided in the Facility Lease, CalSTRS irrevocably appoints IBank or the Trustee, as applicable, as the agent and attorney-in-fact of CalSTRS to re-let the Demised Premises, or any part thereof, from time to time, either in IBank’s or the Trustee’s name, as applicable, or otherwise, upon such terms and conditions and for such use and period as IBank or the Trustee may deem advisable, and to remove all persons in possession thereof and all personal property whatsoever situated upon the Demised Premises and to place such personal property in storage in any warehouse or other suitable place located in the City of West Sacramento, California, for the account of and at the expense of CalSTRS, and CalSTRS exempts and agrees to save harmless IBank and the Trustee from any costs, loss or damage whatsoever arising out of, in connection with, or incident to any such re-entry upon and re-letting of the Demised Premises and removal and storage of such property by IBank or the Trustee or either of their duly authorized agents in accordance with the provisions contained in the Facility Lease. CalSTRS agrees that the terms of the Facility Lease constitute full and sufficient notice of the right of IBank or the Trustee to re-let the Demised Premises and to do all other acts to maintain or preserve the Demised Premises as IBank or the Trustee deems necessary or desirable in the event of such re-entry without effecting a surrender of the Facility Lease, and further agrees that no acts of IBank or the Trustee in effecting such re-letting will constitute a surrender or termination of the Facility Lease irrespective of the use or the term for which such re-letting is made or the terms and conditions of such re-letting, or otherwise, but that, on the contrary, in the event of such default by CalSTRS the right to terminate the Facility Lease will vest in IBank and the Trustee to be effected in the sole and exclusive manner provided for in sub-paragraph (1) hereof. CalSTRS further waives the right to any rental obtained by IBank or the Trustee in excess of the rental specified in
F-11
the Facility Lease and conveys and releases such excess to IBank or the Trustee as compensation to IBank for its services in re-letting the Demised Premises or any part thereof.
(b) If (1) CalSTRS’ interest in the Facility Lease or any part thereof be assigned or transferred, either voluntarily or by operation of law or otherwise, without the written consent of IBank or the Trustee, as hereinafter provided for, or (2) CalSTRS’ or any assignee will file any petition or institute any proceeding under any act or acts, state or federal, dealing with or relating to the subject or subjects of bankruptcy or insolvency, or under any amendment of such act or acts, either as a bankrupt or as an insolvent, or as a debtor, or in any similar capacity, wherein or whereby CalSTRS asks or seeks to be adjudicated bankrupt, or is to be discharged from any or all of CalSTRS’ debts or obligations, or offers to CalSTRS’ creditors to effect a composition or extension of time to pay CalSTRS’ debts or asks, seeks or prays for reorganization or to effect a plan of reorganization, or for a readjustment of CalSTRS’ debts, or for any other similar relief, or if any such petition or any such proceedings of the same or similar kind or character be filed or be instituted or taken against CalSTRS, or if a receiver of the business or of the property or assets of CalSTRS will be appointed by any court, except a receiver appointed at the instance or request of IBank or the Trustee, or if CalSTRS will make a general or any assignment for the benefit of CalSTRS’ creditors, or if (3) CalSTRS will abandon or vacate the Demised Premises, then CalSTRS will be deemed to be in default under the Facility Lease.
(c) IBank will in no event be in default in the performance of any of its obligations under the Facility Lease or imposed by any statute or rule of law unless and until IBank will have failed to perform such obligations within thirty (30) days or such additional time as is reasonably required to correct any such default after notice by CalSTRS to IBank specifying wherein IBank has failed to perform any such obligation. In the event of default by IBank, CalSTRS will be entitled to pursue any remedy provided by law, but in no event will CalSTRS have the right to terminate the Facility Lease or be excused from performing its obligations under the Facility Lease.
(d) In addition to the other remedies set forth in the Facility Lease, upon the occurrence of an event of default as described in the Facility Lease, IBank and/or the Trustee will be entitled to proceed to protect and enforce the rights vested in IBank and the Trustee by the Facility Lease or by law. The provisions of the Facility Lease and the duties of CalSTRS and of its trustees, officers or employees will be enforceable by IBank and/or the Trustee by mandamus or other appropriate suit, action or proceeding in any court of competent jurisdiction. Without limiting the generality of the foregoing, IBank and/or the Trustee will have the right to bring the following actions:
(1) Accounting. An action or suit in equity to require CalSTRS and its trustees, officers and employees and its assigns to account as the trustee of an express trust.
(2) Injunction. An action or suit in equity to enjoin any acts or things which may be unlawful or in violation of the rights of IBank or the Trustee.
(3) Mandamus. A mandamus or other suit, action or proceeding at law or in equity to enforce IBank’s or the Trustee’s rights against CalSTRS (and its board and officers) and to compel CalSTRS to perform and carry out its duties and obligations under the law and its covenants and agreements with CalSTRS as provided in the Facility Lease.
Excepting as otherwise provided in the Facility Lease, each and all of the remedies given to IBank and the Trustee under the Facility Lease or by any law now or hereafter enacted are cumulative and the single or partial exercise of any right, power or privilege under the Facility Lease will not impair the right of IBank or the Trustee to other or further exercise thereof or the exercise of any or all other rights, powers or privileges. IBank expressly waives the right to receive any amount from CalSTRS pursuant to section 1951.2(a)(3) of the California Civil Code. The term “re-let” or “re-letting” as used in the Facility Lease will include, but not be limited to, re-letting by means of the operation by IBank or the Trustee of the Demised Premises. If any statute or rule of law validly will limit the remedies given to IBank or the Trustee under the Facility Lease, IBank or the Trustee nevertheless will be entitled to whatever remedies are allowable under any statute or rule of law.
In the event IBank or the Trustee will prevail in any action brought to enforce any of the terms and provisions of the Facility Lease, CalSTRS agrees to pay a reasonable amount as and for attorney’s fees incurred by IBank or the

F-12
Trustee in attempting to enforce any of the remedies available to IBank or the Trustee under the Facility Lease, whether or not a lawsuit has been filed and whether or not any lawsuit culminates in a judgment.
Eminent Domain
If the whole of the Demised Premises or so much thereof as to render the remainder unusable for the purposes for which it was used by CalSTRS will be taken under the power or threat of eminent domain, the term of the Facility Lease will cease as of the day that possession will be so taken. If less than the whole of the Demised Premises will be taken under the power or threat of eminent domain and the remainder is usable for the purposes for which it was used by CalSTRS at the time of such taking, then the Facility Lease will continue in full force and effect as to such remainder, and the parties waive the benefits of any law to the contrary, and in such event there will be a partial abatement of the rental due under the Facility Lease in an amount equivalent to the amount by which the annual payments of principal of and interest on the Bonds then Outstanding will be reduced by the application of the award in eminent domain to the redemption of Outstanding Bonds. So long as any of the Bonds will be Outstanding, any award made in eminent domain proceedings for taking the Demised Premises or any portion thereof will be paid to the Trustee and applied to the prepayment of the Base Rental Payments as provided in the Facility Lease. Any such award made after all of the Base Rental Payments and Additional Payments have been fully paid, or provision therefor made, will be paid to CalSTRS.
Prepayment
CalSTRS will prepay on any date from insurance and eminent domain proceeds, to the extent provided in the Facility Lease, and from proceeds of title insurance obtained in connection with the Demised Premises (provided, however, that in the event of partial damage to or destruction of the Project caused by perils covered by insurance, if in the judgment of the CalSTRS the insurance proceeds are sufficient to repair, reconstruct or replace the damaged or destroyed portion of the Project, such proceeds will be held by the Trustee and used to repair, reconstruct or replace the damaged or destroyed portion of the Project, pursuant to the procedure set forth in the Trust Agreement for proceeds of insurance), all or any part (in an integral multiple of $5,000) of Base Rental Payments then unpaid so that the aggregate annual debt service on the Bonds which will be payable after such prepayment date will be as nearly proportional as practicable to the aggregate annual debt service on the Bonds unpaid prior to the prepayment date, at a prepayment amount equal to the principal of and interest on the Bonds to the date of redemption.
CalSTRS may prepay, from any source of available funds, all or any portion of Base Rental Payments by depositing with the Trustee moneys or securities as provided in the Trust Agreement sufficient to make such Base Rental Payments when due; provided that CalSTRS furnishes the Trustee with an Opinion of Counsel that such deposit will not cause interest on the Bonds to be includable in gross income for federal income tax purposes. CalSTRS agrees that if following such prepayment the Project is damaged or destroyed or the Demised Premises is taken by eminent domain, it is not entitled to, and by such prepayment waives the right of, abatement of such prepaid Base Rental Payments and will not be entitled to any reimbursement of such Base Rental Payments.
When (1) there will have been deposited with the Trustee at or prior to the due dates of the Base Rental Payments or date when CalSTRS may exercise its option to purchase the Project or any portion or item thereof, in trust for the benefit of the Holders and irrevocably appropriated and set aside to the payment of the Base Rental Payments or option price, sufficient moneys and Permitted Investments satisfying the requirements of the Trust Agreement, not redeemable prior to maturity, the principal of and interest on which when due will provide money sufficient to pay all principal of and interest on the Bonds to the due date of the Bonds or date when CalSTRS may exercise its option to purchase the Project, as the case may be; and (2) an agreement will have been entered into with the Trustee for the payment of its fees and expenses so long as any of the Bonds will remain unpaid; then and in that event all or the applicable portion of the right, title and interest of IBank in the Facility Lease and the obligations of CalSTRS under the Facility Lease will thereupon cease, terminate, become void and be completely discharged and satisfied (except for the right of IBank and the obligation of CalSTRS to have such moneys and such Permitted Investments applied to the payment of the Base Rental Payments or option price) and IBank's interest in and title to the Project or applicable portion or item thereof will be transferred and conveyed to CalSTRS automatically and without recordation of any document or instrument.

F-13
Option to Purchase
CalSTRS will have the option to purchase IBank’s interest in any part of the Site and the Project upon payment of an option price consisting of moneys or securities satisfying the requirements of the Trust Agreement (not callable by the issuer thereof prior to maturity) in an amount sufficient (together with the increment, earnings and interest on such securities) to provide funds to pay the aggregate amount for the entire remaining term of the Facility Lease of the part of the total rent under the Facility Lease attributable to such part of the Project (determined by reference to the proportion which the acquisition, design and construction cost of such part of the Project bears to the acquisition, design and construction cost of all of the Project). Any such payment will be made to the Trustee and will be treated as Base Rental Payments and will be applied by the Trustee to pay the principal of and interest on the Bonds and to prepay Bonds if such Bonds are subject to prepayment pursuant to the terms of the Trust Agreement. Upon the making of such payment to the Trustee, among other things, title to such part of the Project and of the portion of the Site upon which such part of the Project is located will vest in CalSTRS and the term of the Facility Lease will end as to the portion of the Site upon which such part of the Project is located and to such part of the Project.
SITE LEASE
Site
CalSTRS leases to IBank and IBank leases from CalSTRS, on the terms and conditions set forth in the Site Lease, the real property situated in the City of West Sacramento, State of California, and described in Exhibit A attached to the Site Lease and made a part thereof, together with any additional real property added thereto by any supplement or amendment to the Site Lease, or any real property substituted for all or any portion of the Site in accordance with the Site Lease, the Facility Lease and the Trust Agreement (herein collectively called the “Site”); subject, however, to any Permitted Encumbrances (as defined in the Trust Agreement).
Purpose
IBank will use the Site solely for the purpose of financing the acquisition, design, construction and equipping of the Project, by CalSTRS as IBank’s agent for such purposes, thereon and leasing the Site, and upon completion thereof, the Project, to CalSTRS pursuant to the Facility Lease and for such purposes as may be incidental thereto; provided, that in the event of default by CalSTRS under the Facility Lease IBank may exercise the remedies provided in the Facility Lease, subject to the terms and conditions provided therein.
Assignments and Subleases
Unless CalSTRS shall be in default under the Facility Lease or unless provided for in any State or federal law enacted after the date of the Site Lease, IBank may not assign its rights under the Site Lease (except pursuant to the Trust Agreement), without the written consent of CalSTRS.
Default
In the event IBank will be in default in the performance of any obligation on its part to be performed under the terms of the Site Lease, which default continues for thirty (30) days following notice and demand for correction thereof to IBank, CalSTRS may exercise any and all remedies granted by law, except that no merger of the Site Lease and the Facility Lease will be deemed to occur as a result thereof; provided, however, that CalSTRS will have no power to terminate the Site Lease by reason of any default on the part of IBank if such termination would affect or impair any assignment or sublease of all or any part of the Site and Project then in effect between IBank and any assignee or subtenant of IBank (other than CalSTRS under the Facility Lease). So long as any such assignee or subtenant of IBank will duly perform the terms and conditions of the Site Lease and of its then existing sublease (if any), such assignee or subtenant will be deemed to be and will become the tenant of CalSTRS under the Site Lease and will be entitled to all of the rights and privileges granted under any such assignment; provided, further, that so long as any Bonds are outstanding and unpaid in accordance with the terms thereof, the rentals or any part thereof payable to the Trustee will continue to be paid to the Trustee.

F-14
TRUST AGREEMENT
The Trust Agreement provides for, among other things, the issuance, execution and delivery of the Bonds and sets forth the terms thereof, the creation of certain of the funds and accounts described herein, certain covenants of the Authority, defines events of default and remedies therefor, and sets forth the rights and responsibilities of the Trustee.
Certain provisions of the Trust Agreement setting forth the terms of the Series 2019 Bonds, the redemption provisions thereof and the use of the proceeds of the Series 2019 Bonds are set forth elsewhere in this Official Statement. See “THE BONDS.”
Pledge of Revenues; Assignment
All Revenues and any other amounts held by the Trustee in the Revenue Fund are irrevocably pledged to the payment of the interest and premium, if any, on and principal of the Bonds as provided in the Trust Agreement, and the Revenues will not be used for any other purpose while any of the Bonds remain Outstanding; provided, however, that out of the Revenues and other moneys there may be applied in such sums and for such purposes as are permitted under the Trust Agreement. This pledge will constitute a pledge of and charge and lien upon the Revenues and all other amounts in the Revenue Fund for the payment of the interest on and principal of the Bonds in accordance with the terms of the Trust Agreement.
IBank does unconditionally grant, transfer and assign to the Trustee for the benefit of the Holders without recourse all of IBank’s right, title and interest (but none of its obligations) as lessee under the Site Lease and as lessor under the Facility Lease, except excluding in all cases IBank’s right to receive Additional Payments, IBank’s rights to indemnification under the Facility Lease and the Site Lease, and IBank’s right to reports and information under the Facility Lease, including without limitation the following: (i) all its rights to receive the Base Rental Payments scheduled to be paid by CalSTRS under the Facility Lease, (ii) all rents, profits, products and proceeds from the Demised Premises to which IBank has any right or claim whatsoever under the Facility Lease, (iii) the right to take all actions and give all consents under the Site Lease or the Facility Lease, (iv) any right of access provided in the Site Lease or the Facility Lease, and (v) any and all other rights and remedies of IBank in the Site Lease as lessee thereunder and in the Facility Lease as lessor thereunder and consistent with this section.
Receipt and Deposit of Revenues in the Revenue Fund
In order to carry out and effectuate the pledge, charge and lien contained in the Trust Agreement, IBank agrees and covenants that all Revenues are assigned by IBank to the Trustee for the benefit of the Holders of the Bonds and will be transferred if, when, and as received by IBank to the Trustee for deposit in the Revenue Fund, which fund is created by the Trust Agreement and which fund will be maintained with the Trustee so long as any Bonds will be Outstanding under the Trust Agreement. All Revenues will be accounted for through and held in trust in the Revenue Fund, and IBank will have no beneficial right or interest in any of the Revenues except only as provided in Trust Agreement. All Revenues, whether received by IBank in trust or deposited with the Trustee as provided in Trust Agreement, will nevertheless be allocated, applied and disbursed solely to the purposes and uses hereinafter in this Article set forth, and will be accounted for separately and apart from all other accounts, funds, money or other resources of IBank.
Revenue Fund. All money in the Revenue Fund will be set aside by the Trustee in the following respective special accounts or funds within the Revenue Fund in the following order of priority:
(a) Interest Account. On or before each February 1 and August 1, commencing on February 1, 2020, the Trustee will set aside from the Revenue Fund and deposit in the Interest Account that amount of money which is equal to the amount of interest becoming due and payable on all Outstanding Bonds on such February 1 or August 1, as the case may be. No deposit need be made if the amount contained therein (including the Capitalized Interest Account therein) is at least equal to the aggregate amount of interest payable on all Outstanding Bonds on such date.

F-15
All money in the Interest Account will be used and withdrawn by the Trustee solely for the purpose of paying the interest on the Bonds as it will become due and payable (including accrued interest on any Bonds purchased or redeemed prior to maturity).
(b) Principal Account. On or before each August 1, the Trustee will set aside from the Revenue Fund and deposit in the Principal Account an amount of money equal to the principal amount (including the payment of principal with respect to any mandatory redemption) of all Outstanding Bonds maturing on such August 1. No deposit need be made in the Principal Account if the amount contained therein is at least equal to the aggregate amount of the principal of all Outstanding Bonds maturing by their terms on such August 1.
All money in the Principal Account will be used and withdrawn by the Trustee solely for the purpose of paying the principal of the Bonds, as they become due and payable, whether at maturity or redemption.
Application of Insurance Proceeds
In the event of any damage to or destruction of any part of the Project covered by insurance, IBank, except as provided in the Trust Agreement, will cause the proceeds of any such insurance paid over to IBank to be deposited with the Trustee, and the Trustee will hold said proceeds in a fund established by the Trustee for the purpose of repairing, reconstructing or replacing the damaged or destroyed portion of the Project, separate and apart from all other funds, to the end that such proceeds will be applied to the repair, reconstruction or replacement of the Project to at least the same good order, repair and condition as it was in prior to the damage or destruction, insofar as the same may be accomplished by the use of said proceeds. The Trustee will invest said proceeds in Permitted Investments pursuant to the Written Request of CalSTRS, as agent for IBank under the Facility Lease, and withdrawals of said proceeds will be made from time to time upon the filing with the Trustee of a Written Request of CalSTRS, stating that CalSTRS has expended moneys or incurred liabilities in an amount equal to the amount therein stated for the purpose of the repair, reconstruction or replacement of the Project, and specifying the items for which such moneys were expended, or such liabilities were incurred, in reasonable detail. CalSTRS will file a Written Request with the Trustee stating that sufficient funds from insurance proceeds or from any funds legally available to CalSTRS, or from any combination thereof, are available in the event it elects to repair, reconstruct or replace the Project. Any balance of such proceeds not required for such repair, reconstruction or replacement and the proceeds of use and occupancy insurance will be treated by the Trustee as Base Rental Payments. Alternatively, CalSTRS, at its option, if the proceeds of such insurance together with any other moneys then available for such purpose are sufficient to prepay all, in case of damage or destruction in whole of the Project, or that portion, in the case of partial damage or destruction of the Project, of the Base Rental Payments relating to the damaged or destroyed portion of the Project, may elect not to repair, reconstruct or replace the damaged or destroyed portion of the Project and thereupon will cause said proceeds to be used for the redemption of all or a portion of Outstanding Bonds pursuant to the applicable provisions of the Trust Agreement and the corresponding provisions of any Supplemental Trust Agreement. CalSTRS will not apply the proceeds of insurance as set forth in the Trust Agreement to redeem the Bonds in part due to damage or destruction of a portion of the Project unless the Trustee receives a Certificate of IBank that the Base Rental Payments on the undamaged portion of the Project will be sufficient to pay the initially-scheduled principal and interest on the Bonds remaining unpaid after such redemption; provided, however, IBank may condition its provision of such Certificate upon its receipt of an Opinion of Counsel and/or a report of an Independent Certified Public Accountant in form and content satisfactory to IBank in its sole and absolute discretion.
Investments
All money held by the Trustee in any of the accounts or funds established pursuant to Trust Agreement will be invested in Permitted Investments at the Written Request of CalSTRS.
Permitted Investments (except investment agreements or repurchase agreements) held in Trust Agreement funds and accounts established pursuant to the Trust Agreement will be valued at the market value thereof, exclusive of accrued interest. In determining market value of Permitted Investments, the Trustee may use and rely conclusively and without liability upon any generally recognized pricing information service (including brokers and dealers in securities) available to it.

F-16
The Trustee will have no obligation to invest and reinvest any cash held by it under Trust Agreement in the absence of timely and specific written investment direction from CalSTRS. In no event will the Trustee be liable for the selection of investments or for investment losses incurred thereon. The Trustee may make any and all such investments through its own investment department or that of its affiliates or subsidiaries, and may charge its ordinary and customary fees for such trades, including investment maintenance fees. Ratings of Permitted Investments will be determined at the time of purchase of such Permitted Investments and without regard to ratings subcategories. The Trustee may rely on the investment directions of CalSTRS as to both the suitability and legality of the directed investments. CalSTRS acknowledges that regulations of the Comptroller of the Currency grant CalSTRS the right to receive brokerage confirmations of the security transactions as they occur, at no additional cost. To the extent permitted by law, CalSTRS specifically waives compliance with 12C.F.R 12 and notifies the Trustee that no brokerage confirmations need to be sent relating to the security transactions as they occur.
Permitted Investments purchased with funds on deposit in the Revenue Fund will mature not later than the dates upon which such funds shall need to be expended for the payment of debt service. Permitted Investments purchased with funds on deposit in the Acquisition and Construction Fund will mature not later than the dates upon which such funds will need to be expended for such construction (or will be invested in repurchase agreements or investment agreements described in the definition of Permitted Investments).
Additional Bonds
IBank may at any time issue Additional Bonds pursuant to a Supplemental Trust Agreement, payable from the Revenues as provided in the Trust Agreement and secured by a pledge of and charge and lien upon the Revenues as provided in the Trust Agreement equal to the pledge, charge and lien securing the Outstanding Bonds theretofore issued under the Trust Agreement, and subject to the following specific conditions, which are made conditions precedent to the issuance of any such Additional Bonds:
(a) IBank will be in compliance with all agreements and covenants contained in the Trust Agreement, and no Event of Default will have occurred and be continuing.
(b) The Supplemental Trust Agreement will require that the proceeds of the sale of such Additional Bonds will be applied to the completion of the Project or other improvements to the Project, or for the refunding or repayment of any Bonds then Outstanding, including the payment of costs and expenses incident to the authorization and sale of such Additional Bonds. The Supplemental Trust Agreement may also provide that a portion of such proceeds will be applied to the payment of the interest due or to become due on said Additional Bonds during the estimated period of any construction and for a period of not to exceed twelve (12) months thereafter.
(c) The Supplemental Trust Agreement will provide, if necessary, for additional funds and accounts for the Additional Bonds. The Supplemental Trust Agreement may, but need not, establish a Reserve Account to secure payment of the principal of and interest on such Series of Bonds.
(d) The aggregate principal amount of Bonds issued and at any time Outstanding under the Trust Agreement will not exceed any limit imposed by law, by the Trust Agreement or by any Supplemental Trust Agreement.
(e) The Facility Lease will have been amended, if necessary, so that the Base Rental Payments payable by CalSTRS thereunder in each Fiscal Year will at least equal Debt Service, including Debt Service on the Additional Bonds, in each Fiscal Year.

F-17
Limitations on the Issuance of Obligations Payable from Revenues
IBank will not, so long as any of the Bonds are Outstanding, issue any obligations or securities, however denominated, payable in whole or in part from Revenues except Bonds of any Series authorized by Trust Agreement.
Covenants of the IBank
IBank covenants it will not make any pledge of or place any charge or lien upon the Revenues except as provided in the Trust Agreement, and will not issue any bonds, notes or obligations payable from the Revenues except as provided in the Trust Agreement.
Defaults and Remedies
Events of Default. Events which constitute a “Event of Default” under the Trust Agreement include:
(a) if default will be made by IBank in the due and punctual payment of the interest on any Bond when and as the same will become due and payable;
(b) if default will be made by IBank in the due and punctual payment of the principal of or redemption premium, if any, on any Bond when and as the same will become due and payable, whether at maturity as therein expressed or by proceedings for redemption;
(c) if default will be made by IBank in the performance of any of the other agreements or covenants required in the Trust Agreement to be performed by IBank, and such default will have continued for a period of thirty (30) days after IBank will have been given notice in writing of such default by the Trustee;
(d) if IBank will file a petition or answer seeking arrangement or reorganization under the federal bankruptcy laws or any other applicable law of the United States of America or any state therein, or if a court of competent jurisdiction will approve a petition filed with or without the consent of IBank seeking arrangement or reorganization under the federal bankruptcy laws or any other applicable law of the United States of America or any state therein, or if under the provisions of any other law for the relief or aid of debtors any court of competent jurisdiction will assume custody or control of IBank or of the whole or any substantial part of its property; or
(e) if an Event of Default has occurred under the Facility Lease;
Acceleration of Bonds. In each and every such case during the continuance of such Event of Default the Trustee may, upon the written request of the Holders of not less than fifty one percent (51%) in aggregate principal amount of the Bonds then Outstanding, will, by notice in writing to IBank, declare the principal of all Bonds then Outstanding and the interest accrued thereon to be due and payable immediately, and upon any such declaration the same will become due and payable, subject to the limitations of the Trust Agreement, anything contained in Trust Agreement or in the Bonds to the contrary notwithstanding. The Trustee will promptly notify all Holders of Bonds of any such event of default which is continuing.
This provision, however, is subject to the condition that if at any time after the principal of the Bonds then Outstanding will have been so declared due and payable and before any judgment or decree for the payment of the money due will have been obtained or entered IBank will deposit with the Trustee, or the Trustee will have received from CalSTRS, a sum sufficient to pay all matured interest on all the Bonds and all principal of the Bonds matured prior to such declaration, with interest at the rate borne by such Bonds on such overdue interest and principal, and the reasonable fees and expenses of the Trustee, and any and all other defaults known to the Trustee (other than in the payment of interest on and principal of the Bonds due and payable solely by reason of such declaration) will have been made good or cured to the satisfaction of the Trustee or provision deemed by the Trustee to be adequate will have been made therefor, then and in every such case the Holders of not less than fifty-one percent (51%) in aggregate principal amount of Bonds then Outstanding, by written notice to IBank and to the

F-18
Trustee, may on behalf of the Holders of all the Bonds then Outstanding rescind and annul such declaration and its consequences; but no such rescission and annulment will extend to or will affect any subsequent default or will impair or exhaust any right or power consequent thereon.
Application of Funds Upon Acceleration or Upon an Event of Default. All moneys in the accounts and funds established with respect to the Bonds held pursuant to the Trust Agreement upon the date of the declaration of acceleration or the occurrence (and only during the continuance) of an Event of Default by the Trustee as provided in the Trust Agreement, and all Revenues (other than Revenues on deposit in the Rebate Fund) thereafter received by the Trustee, or IBank under the Trust Agreement (which will be transmitted to the Trustee) will be applied by the Trustee in the following order--
First, to the payment of the fees, costs and expenses of the Trustee, if any, including such fees, costs and expenses incurred by the Trustee in carrying out its duties under the section in the Trust Agreement summarized under this heading “Defaults and Remedies,” including reasonable compensation to its accountants and counsel, and then to the payment of the costs and expenses of the Holders of Bonds in providing for the declaration of such event of default, including reasonable compensation to their accountants and counsel;
Second, upon presentation of the several Bonds, and the stamping thereon of the amount of the payment if only partially paid or upon the surrender thereof if fully paid, to the payment of the whole amount then owing and unpaid upon the Bonds for interest and principal, with (to the extent permitted by law) interest on the overdue interest and principal at the rate borne by such Bonds, and in case such money will be insufficient to pay in full the whole amount so owing and unpaid upon the Bonds, then to the payment of such interest, principal and (to the extent permitted by law) interest on overdue interest and principal without preference or priority among such interest, principal and interest on overdue interest and principal ratably to the aggregate of such interest, principal and interest on overdue interest and principal;
Third, to the payment of any due and owing Additional Payments.
Limitation on Bondholders’ Right to Sue. No Holder of any Bond issued under the Trust Agreement will have the right to institute any suit, action or proceeding at law or equity, for any remedy under or upon the Trust Agreement, unless (a) such Holder will have previously given to the Trustee written notice of the occurrence of an event of default as defined in the Trust Agreement; (b) the Holders of at least a majority in aggregate principal amount of the applicable Series of Bonds then Outstanding will have made written request upon the Trustee to exercise the powers granted by the Trust Agreement or to institute such suit, action or proceeding in its own name; (c) said Holders will have tendered to the Trustee reasonable security or indemnity against the costs, expenses and liabilities to be incurred in compliance with such request; and (d) the Trustee will have refused or omitted to comply with such request for a period of sixty (60) days after such request will have been received by, and said tender of indemnity will have been made to, the Trustee.
Amendment of Documents
Trust Agreement. The Trust Agreement and the rights and obligations of IBank and of the Holders may be amended at any time by a Supplemental Trust Agreement which will become binding when the written consents of the Holders of a majority in aggregate principal amount of the Bonds then Outstanding, exclusive of any Bonds disqualified as provided in the Trust Agreement, are filed with the Trustee. No such amendment will (1) extend the maturity of or reduce the interest rate on or amount of interest on or principal of or redemption premium, if any, on any Bond without the express written consent of the Holder of such Bond, or (2) permit the creation by IBank of any pledge of or charge or lien upon the Revenues as provided in the Trust Agreement superior to or on a parity with the pledge, charge and lien created by the Trust Agreement for the benefit of the Bonds, or (3) reduce the percentage of Bonds required for the written consent to any such amendment, or (4) modify any rights or obligations of the Trustee, IBank or CalSTRS without their prior written assent thereto, respectively.
The Trust Agreement and the rights and obligations of IBank and of the Holders may also be amended at any time by a Supplemental Trust Agreement which will become binding upon execution and delivery without the consent of any Holders, and only to the extent permitted by law, for any purpose that will not materially

F-19
adversely affect the interests of the Holders (as evidenced by the opinion delivered pursuant to the provision of the Trust Agreement summarized in the last paragraph under the heading “Amendment of Documents – Trust Agreement”), including (without limitation) for any one or more of the following purposes --
(a) to add to the agreements and covenants required in the Trust Agreement to be performed by IBank other agreements and covenants thereafter to be performed by IBank, or to surrender any right or power reserved in the Trust Agreement to or conferred in the Trust Agreement on IBank;
(b) to make such provisions for the purpose of curing any ambiguity or of correcting, curing or supplementing any defective provision contained in the Trust Agreement or in regard to questions arising under the Trust Agreement which IBank may deem desirable or necessary;
(c) to provide for the issuance of any Additional Bonds and to provide the terms of such Additional Bonds, subject to the conditions and upon compliance with the procedure set forth in the Trust Agreement (which will be deemed not to adversely affect Holders); or
(d) to add to the agreements and covenants required in the Trust Agreement, such agreements and covenants as may be necessary to qualify the Trust Agreement under the Trust Indenture Act of 1939.
In executing any Supplemental Trust Agreement permitted by the provision of the Trust Indenture summarized under the heading “Amendment of Documents – Trust Agreement,” or the modification thereby of the trusts created by the Trust Agreement, the Trustee will be entitled to receive, and will be fully protected in relying upon, an Opinion of Counsel stating that the execution of such Supplemental Trust Agreement is authorized or permitted by the Trust Agreement and complies with the terms thereof. The Trustee may, but will not be obligated to, enter into any such Supplemental Trust Agreement which affects the Trustee’s own rights, duties or immunities under the Trust Agreement or otherwise.
Facility Lease and Site Lease. (a) IBank will not supplement, amend, modify or terminate any of the terms of the Facility Lease, or consent to any such supplement, amendment, modification or termination, without the prior written consent of the Trustee. The Trustee will give such written consent if such supplement, amendment, modification or termination (a) will not materially adversely affect the interests of the Holders or result in any material impairment of the security given by the Trust Agreement for the payment of the Bonds (provided that such supplement, amendment or modification will not be deemed to have such adverse effect or to cause such material impairment solely by reason of substitution or release of real property pursuant to the Facility Lease, or solely by reason of the issuance of Additional Bonds pursuant to the Trust Agreement), (b) is to add to the agreements, conditions, covenants and terms required to be observed or performed thereunder by any party thereto, or to surrender any right or power therein reserved to IBank or CalSTRS, (c) is to cure, correct or supplement any ambiguous or defective provision contained therein, (d) is to accommodate any substitution or release in accordance with the Facility Lease, or is to provide for the issuance of Additional Bonds pursuant to the Trust Agreement, (e) is to modify the legal description of the Demised Premises to conform to the requirements of title insurance or otherwise to add or delete property descriptions to reflect accurately the description of the parcels intended or preferred to be included therein, or substituted for the Demised Premises or released from the Demised Premises pursuant to the provisions of the Facility Lease, (f) if the Trustee first obtains the written consent of the Holders of a majority in principal amount of the Bonds then Outstanding to such supplement, amendment, modification or termination.
(b) IBank will not supplement, amend, modify or terminate any of the terms of the Site Lease, or consent to any such supplement, amendment, modification or termination, without the prior written consent of the Trustee. The Trustee will give such written consent if such supplement, amendment, modification or termination (a) will not materially adversely affect the interests of the Holders or result in any material impairment of the security given for the payment of the Bonds, (b) is to add to the agreements, conditions, covenants and terms required to be observed or performed thereunder by any party thereto, or to surrender any right or power therein reserved to IBank or the CalSTRS, (c) is to cure, correct or supplement any ambiguous or defective provision contained therein, (d) is to modify the legal description of the Facilities to conform to the requirements of title insurance or otherwise to add or delete property descriptions to reflect accurately the description of the parcels intended or preferred to be included therein, or substituted for the Demised Premises or released from the Demised Premises pursuant to the provisions

F-20
of the Facility Lease, or is to provide for the issuance of Additional Bonds pursuant to the Trust Agreement, (e) if the Trustee first obtains the written consent of the Holders of a majority in principal amount of the Bonds then Outstanding to such supplement, amendment, modification or termination.
(c) The Trustee, prior to executing any such amendment to the Site Lease or the Facility Lease, will be entitled to an Opinion of Counsel to the effect that such amendment complies with the terms of the Site Lease or Facility Lease, as applicable, and the Trust Agreement.
Discharge of Trust Agreement
If IBank will pay or cause to be paid or there will otherwise be paid to the Holders of all Outstanding Bonds the interest thereon and the principal thereof and the redemption premiums, if any, thereon at the times and in the manner stipulated in the Trust Agreement and in the Bonds, and all amounts due and owing to the Trustee have been paid in full, then the Holders of such Bonds will cease to be entitled to the pledge of and charge and lien upon the Revenues as provided in the Trust Agreement, and all agreements, covenants and other obligations of IBank to the Holders of such Bonds under the Trust Agreement will thereupon cease, terminate and become void and be discharged and satisfied. In such event, the Trustee will execute and deliver to IBank all such instruments as may be deemed necessary or desirable and prepared by or on behalf of IBank or the Trustee to evidence such discharge and satisfaction, the Trustee will pay over or deliver to IBank all money or securities held by it pursuant to the Trust Agreement which are not required for the payment of the interest on and principal of and redemption premiums, if any, on such Bonds.
Any Outstanding Bond or Bonds will prior to the maturity date or redemption date thereof be deemed to have been paid within the meaning of and with the effect expressed in the Trust Agreement if (1) in case any of such Bond or Bonds are to be redeemed on any date prior to their maturity date, IBank, at the direction of CalSTRS, will have given to the Trustee in form satisfactory to it irrevocable instructions to provide notice in accordance with the Trust Agreement, (2) there will have been deposited with the Trustee either (A) money in an amount which will be sufficient or (B) Permitted Investments of the type described in clause (A) of the definition of Permitted Investments and which are not subject to redemption prior to maturity (including any such Permitted Investments issued or held in book-entry form on the books of the Treasury of the United States of America) or tax exempt obligations of a state or political subdivision thereof which have been defeased under irrevocable escrow instructions by the deposit of such money or Permitted Investments and which are then rated in the highest rating category by the Rating Agency, the interest on and principal of which when paid will provide money which, together with the money, if any, deposited with the Trustee at the same time, will be sufficient, in the opinion of an Independent Certified Public Accountant, to pay when due the interest to become due on such Bonds on and prior to the maturity date or redemption date thereof, as the case may be, and the principal of and redemption premiums, if any, on such Bonds, and (3) in the event such Bonds are not by their terms subject to redemption within the next succeeding sixty (60) days, IBank, at the direction of CalSTRS, will have given the Trustee in form satisfactory to it irrevocable instructions to mail as soon as practicable, a notice to the Holders of such Bonds that the deposit required by clause (2) above has been made with the Trustee and that such Bonds are deemed to have been paid in accordance with the Trust Agreement and stating the maturity date or redemption date upon which money is to be available for the payment of the principal of and redemption premiums, if any, on such Bonds.
In the event the Bonds are deemed to have been paid in accordance with the foregoing paragraph, the Trustee will receive an Opinion of Counsel, at the expense of CalSTRS to the effect that, in reliance upon certifications that the above conditions have been met, the Bonds are no longer Outstanding under the Trust Agreement.
The Trustee
The Bank of New York Mellon Trust Company, N.A. will serve as the Trustee for the Bonds for the purpose of receiving all money which IBank is required to deposit with the Trustee under the Trust Agreement and for the purpose of allocating, applying and using such money as provided in the Trust Agreement and for the purpose of paying the interest on and principal of and redemption premiums, if any, on the Bonds presented for payment in the corporate trust agency or operations office as designated by the Trustee with the rights and

F-21
obligations provided in the Trust Agreement. IBank agrees that it will at all times maintain a Trustee having an office in California.
IBank may upon thirty (30) days’ prior written notice, unless there exists any Event of Default as defined in the Trust Agreement, remove the Trustee initially appointed and any successor thereto and may appoint a successor or successors thereto by an instrument in writing; provided that any such successor will be a banking corporation or trust company, having a combined capital (exclusive of borrowed capital) and surplus of at least fifty million dollars ($50,000,000) and subject to supervision or examination by federal or state authorities. If such banking corporation or trust company publishes a report of condition at least annually, pursuant to law or to the requirements of any supervising or examining authority above referred to, then for the purpose of the Trust Agreement the combined capital and surplus of such bank or trust company will be deemed to be its combined capital and surplus as set forth in its most recent report of condition so published. The Trustee may at any time resign by giving written notice of such resignation to IBank and by mailing by first class mail to the Holders notice of such resignation. Upon receiving such notice of resignation, IBank will, following notice to and in consultation with CalSTRS, promptly appoint a successor Trustee by an instrument in writing. Any removal or resignation of a Trustee and appointment of a successor Trustee will become effective only upon the acceptance of appointment by the successor Trustee. If, within thirty (30) days after notice of the removal or resignation of the Trustee no successor Trustee will have been appointed and will have accepted such appointment, the removed or resigning Trustee may petition any court of competent jurisdiction for the appointment of a successor Trustee, which court may thereupon, after such notice, if any, as it may deem proper and prescribe and as may be required by law, appoint a successor Trustee having the qualifications required by the Trust Agreement.

[THIS PAGE INTENTIONALLY LEFT BLANK]

APPENDIX G
PROPOSED FORM OF BOND COUNSEL OPINION

[THIS PAGE INTENTIONALLY LEFT BLANK]

December 19, 2019
California Infrastructure and Economic Development Bank Sacramento, California
California Infrastructure and Economic Development Bank Lease Revenue Bonds
(California State Teachers’ Retirement System Headquarters Expansion), Series 2019 (Green Bonds – Climate Bond Certified)
(Final Opinion)
Ladies and Gentlemen:
We have acted as bond counsel to the California Infrastructure and Economic Development Bank (the “Infrastructure Bank”) in connection with issuance by the Infrastructure Bank of $272,605,000 aggregate principal amount of California Infrastructure and Economic Development Bank Lease Revenue Bonds (California State Teachers’ Retirement System Headquarters Expansion), Series 2019 (Green Bonds – Climate Bond Certified) (the “Bonds”), issued pursuant to a trust agreement, dated as of December 1, 2019 (the “Trust Agreement”), between the Infrastructure Bank and The Bank of New York Mellon Trust Company, N.A., as trustee (the “Trustee”). Capitalized terms not otherwise defined herein shall have the meanings ascribed thereto in the Trust Agreement.
In such connection, we have reviewed the Trust Agreement, the Facility Lease, dated as of December 1, 2019 (the “Facility Lease”), between the Infrastructure Bank, as lessor, and the California State Teachers’ Retirement System, as lessee (“CalSTRS”), the Site Lease, dated as of December 1, 2019 (the “Site Lease”), between CalSTRS, as lessor, and the Infrastructure Bank, as lessee, the Tax Certificate, dated the date hereof (the “Tax Certificate”), executed by each of the Infrastructure Bank and CalSTRS, opinions of counsel to the Infrastructure Bank, CalSTRS and the Trustee, certificates of the Infrastructure Bank, CalSTRS, the Trustee and others, and such other documents, opinions and matters to the extent we deemed necessary to render the opinions set forth herein.
The opinions expressed herein are based on an analysis of existing laws, regulations, rulings and court decisions and cover certain matters not directly addressed by such authorities. Such opinions may be affected by actions taken or omitted or events occurring after the date
G-1
California Infrastructure and Economic Development Bank December 19, 2019 Page 2
hereof. We have not undertaken to determine, or to inform any person, whether any such actions are taken or omitted or events do occur or any other matters come to our attention after the date hereof. Accordingly, this letter speaks only as of its date and is not intended to, and may not, be relied upon or otherwise used in connection with any such actions, events or matters. Our engagement with respect to the Bonds has concluded with their issuance, and we disclaim any obligation to update this letter. We have assumed the genuineness of all documents and signatures presented to us (whether as originals or as copies) and the due and legal execution and delivery thereof by, and validity against, any parties other than the Infrastructure Bank. We have assumed, without undertaking to verify, the accuracy of the factual matters represented, warranted or certified in the documents, and of the legal conclusions contained in the opinions, referred to in the second paragraph hereof. Furthermore, we have assumed compliance with all covenants and agreements contained in the Facility Lease, the Site Lease, the Trust Agreement and the Tax Certificate, including (without limitation) covenants and agreements compliance with which is necessary to assure that future actions, omissions or events will not cause interest on the Bonds to be included in gross income for federal income tax purposes.
We call attention to the fact that the rights and obligations under the Bonds, the Facility Lease, the Site Lease, the Trust Agreement and the Tax Certificate and their enforceability may be subject to bankruptcy, insolvency, receivership, reorganization, arrangement, fraudulent conveyance, moratorium and other laws relating to or affecting creditors’ rights, to the application of equitable principles, to the exercise of judicial discretion in appropriate cases and to the limitations on legal remedies against public instrumentalities and agencies in the State of California. We express no opinion with respect to any indemnification, contribution, liquidated damages, penalty (including any remedy deemed to constitute a penalty), right of set-off, arbitration, judicial reference, choice of law, choice of forum, choice of venue, non-exclusivity of remedies, waiver or severability provisions contained in the foregoing documents, nor do we express any opinion with respect to the state or quality of title to or interest in any of the real or personal property described in or as subject to the lien of the Facility Lease, the Site Lease or the Trust Agreement or the accuracy or sufficiency of the description contained therein of, or the remedies available to enforce liens on, any such property. Our services did not include financial or other non-legal advice. Finally, we undertake no responsibility for the accuracy, completeness or fairness of the Official Statement or other offering material relating to the Bonds and express no opinion with respect thereto.
Based on and subject to the foregoing, and in reliance thereon, as of the date hereof, we are of the following opinions:
G-2

California Infrastructure and Economic Development Bank December 19, 2019 Page 3
1. The Bonds constitute the valid and binding limited obligations of the Infrastructure Bank.
2. The Trust Agreement has been duly executed and delivered by, and constitutes the valid and binding obligation of, the Infrastructure Bank. The Trust Agreement creates a valid pledge, to secure the payment of the principal of and interest on the Bonds, of the Revenues and any other amounts held by the Trustee in the Revenue Fund established pursuant to the Trust Agreement, subject to the provisions of the Trust Agreement permitting the application thereof for the purposes and on the terms and conditions set forth in the Trust Agreement.
3. The Facility Lease and the Site Lease have been duly executed and delivered by, and constitute the valid and binding agreements of, the Infrastructure Bank.
4. The Bonds are not a lien or charge upon the funds or property of the Infrastructure Bank except to the extent of the aforementioned pledge. Neither the faith and credit nor the taxing powers of CalSTRS, the State of California or of any political subdivision thereof is pledged to the payment of the principal of or interest on the Bonds.
G-3

California Infrastructure and Economic Development Bank December 19, 2019 Page 4
5. Interest on the Bonds is excluded from gross income for federal income tax purposes under Section 103 of the Internal Revenue Code of 1986 and is exempt from State of California personal income taxes. Interest on the Bonds is not a specific preference item for purposes of the federal alternative minimum tax. We express no opinion regarding other tax consequences related to the ownership or disposition of, or the amount, accrual or receipt of interest on, the Bonds.
Faithfully yours,
ORRICK, HERRINGTON & SUTCLIFFE LLP
per
G-4

APPENDIX H
FORM OF CONTINUING DISCLOSURE CERTIFICATE

[THIS PAGE INTENTIONALLY LEFT BLANK]

CONTINUING DISCLOSURE CERTIFICATE
This Continuing Disclosure Certificate (this “Certificate”) is executed and delivered by the California State Teachers’ Retirement System (“CalSTRS”) in connection with the issuance of $272,605,000 California Infrastructure and Economic Development Bank Lease Revenue Bonds (California State Teachers’ Retirement System Headquarters Expansion), Series 2019 (Green Bonds - Climate Bond Certified) (the “Bonds”). The Bonds are being issued under a Trust Agreement, dated as of December 1, 2019 (the “Trust Agreement”), between the California Infrastructure and Economic Development Bank and The Bank of New York Mellon Trust Company, N.A., as trustee (the “Trustee”). Capitalized terms used but not defined herein shall have the meanings ascribed thereto in the Trust Agreement.
In consideration of the purchase of the Bonds by the Participating Underwriters (as defined below), CalSTRS covenants and agrees as follows:
Section 1. Purpose of the Certificate. This Certificate is being executed and delivered by CalSTRS for the benefit of the Holders and Beneficial Owners of the Bonds and in order to assist the Participating Underwriters in complying with Rule 15c2-12(b)(5) of the Securities and Exchange Commission (the “Rule”).
Section 2. Definitions. The following capitalized terms shall have the following meanings:
“Annual Report” means any Annual Report provided by CalSTRS pursuant to, and as described in, Sections 3 and 4 hereof.
“Beneficial Owner” means any person which (a) has or shares the power, directly or indirectly, to vote or consent with respect to, to make investment decisions concerning the ownership of, or to dispose of ownership of, any Bonds (including persons holding Bonds through nominees, depositories or other intermediaries), or (b) is treated as the owner of any Bonds for federal income tax purposes.
“Dissemination Agent” means CalSTRS, or any successor Dissemination Agent designated in writing by CalSTRS and which has filed with CalSTRS a written acceptance of such designation.
“EMMA System” means the MSRB’s Electronic Municipal Market Access system, or such other electronic system designated by the MSRB.
“Fiscal Year” means the period beginning on July 1 of each year and ending on the next succeeding June 30, or any other 12-month period hereafter selected as the official fiscal year of CalSTRS.
“Holders” means either the registered owners of the Bonds, or if the Bonds are registered in the name of The Depository Trust Company or other recognized securities depository, any applicable participant in its depository system.
“Financial Obligation” means a (i) debt obligation; (ii) derivative instrument entered into in connection with, or pledged as security or a source of payment for, an existing or planned debt obligation; or (iii) guarantee of (i) or (ii). The term Financial Obligation shall not include municipal securities as to which a final official statement has been provided to the MSRB consistent with the Rule.
“Listed Events” means any of the events listed in Sections 5(a) and 5(b) hereof.
H-1

“MSRB” means the Municipal Securities Rulemaking Board, or any successor thereto.
“Obligated Person” means CalSTRS.
“Official Statement” means the Official Statement, dated December 5, 2019, prepared and distributed in connection with the initial sale of the Bonds.
“Participating Underwriters” means the original underwriters of the Bonds required to comply with the Rule in connection with the offering of the Bonds.
“Rule” means Rule 15c2-12(b)(5) adopted by the Securities and Exchange Commission under the Securities Exchange Act of 1934, as the same may be amended from time to time.
Section 3. Provision of Annual Reports.
(a) CalSTRS shall provide, or shall cause the Dissemination Agent to provide, to the MSRB through the EMMA System (in an electronic format and accompanied by identifying information all as prescribed by the MSRB and/or the Rule) an Annual Report which is consistent with the requirements of Section 4 hereof by the first business day of February of each year. CalSTRS’ first Annual Report shall be due February 1, 2020. Not later than 15 Business Days prior to said date, CalSTRS shall provide the Annual Report to the Dissemination Agent (if other than CalSTRS). The Annual Report may be submitted as a single document or as separate documents comprising a package, and may include by reference other information as provided in Section 4 hereof. CalSTRS’ Comprehensive Annual Financial Report may be submitted separately from the balance of the Annual Report if it is not available by the date of submission, provided such financial statements are submitted by June 30 of each year. If CalSTRS’s Fiscal Year changes, CalSTRS shall give notice of such change in the same manner as for a Listed Event under Section 5(e) hereof.
(b) If by 15 Business Days prior to the date specified in subsection (a) for providing the Annual Report to the MSRB, the Dissemination Agent (if other than CalSTRS) has not received a copy of the Annual Report, the Dissemination Agent shall contact CalSTRS to determine if CalSTRS is in compliance with subsection (a).
(c) If CalSTRS is unable to provide to the MSRB or the Dissemination Agent (if other than CalSTRS), an Annual Report by the date required in subsection (a), CalSTRS shall, in a timely manner, send or cause to be sent to the MSRB a notice through the EMMA System in substantially the form attached hereto as Exhibit A.
(d) The Dissemination Agent (if other than CalSTRS) shall confirm in writing to CalSTRS that the Annual Report has been filed as required hereunder, stating the date filed.
Section 4. Content of Annual Reports.
(a) CalSTRS’s Annual Report shall contain or incorporate by reference the following, updated to incorporate information for the most recent Fiscal Year or calendar year, as applicable:
(i) CalSTRS Comprehensive Annual Financial Report for the prior Fiscal Year, prepared in accordance with generally accepted accounting principles as promulgated to apply to governmental entities from time to time by the Governmental
H-2

Accounting Standards Board. If CalSTRS’ Comprehensive Annual Financial Report is not available by the time the Annual Report is required to be filed pursuant to Section 3(a) hereof, the Annual Report shall contain unaudited basic financial statements in a format similar to the financial statements contained in Appendix B to the Official Statement, and the Comprehensive Annual Financial Report shall be filed in the same manner as the Annual Report when they become available.
(ii) the most current actuarial valuation for the Defined Benefit Program of CalSTRS available at the time of the filing of the Annual Report.
(iii) information of the type contained in the tables on pages 22 and 23 of the Official Statement titled “CalSTRS Condensed Statement of Fiduciary Net Position” and “CalSTRS Condensed Statement of Changes In Fiduciary Net Position” for the prior Fiscal Year.
(b) All or any portion of the information of the Annual Report may be incorporated in the Annual Report by cross reference to any other documents which have been filed with the MSRB.
Any or all of the items above may be included by specific reference to other documents, including official statements of debt issues of CalSTRS or related public entities, which have been submitted to the MSRB. If the document included by reference is a final official statement, it must be available from the MSRB. CalSTRS shall clearly identify each such other document so included by reference.
Section 5. Reporting of Listed Events.
(a) CalSTRS shall give, or cause to be given, notice of the occurrence of any of the following events with respect to the Bonds not later than ten (10) business days after the occurrence of the event:
1. Principal and interest payment delinquencies;
2. Unscheduled draws on debt service reserves reflecting financial difficulties;
3. Unscheduled draws on credit enhancements reflecting financial difficulties;
4. Substitution of credit or liquidity providers, or their failure to perform;
5. Adverse tax opinions or the issuance by the Internal Revenue Service of proposed or final determinations of taxability or of a Notice of Proposed Issue (IRS Form 5701 TEB) with respect to the Bonds;
6. Tender offers;
7. Defeasances;
8. Rating changes;
H-3

9. Bankruptcy, insolvency, receivership or similar event of the Obligated Person; or
10. Default, event of acceleration, termination event, modification of terms, or other similar events under the terms of a Financial Obligation, any of which reflect financial difficulties of the Obligated Person.
Note: for the purposes of the event identified in item 9, the event is considered to occur when any of the following occur: the appointment of a receiver, fiscal agent or similar officer for an Obligated Person in a proceeding under the U.S. Bankruptcy Code or in any other proceeding under state or federal law in which a court or governmental authority has assumed jurisdiction over substantially all of the assets or business of the Obligated Person, or if such jurisdiction has been assumed by leaving the existing governmental body and officials or officers in possession but subject to the supervision and orders of a court or governmental authority, or the entry of an order confirming a plan of reorganization, arrangement or liquidation by a court or governmental authority having supervision or jurisdiction over substantially all of the assets or business of the Obligated Person.
(b) CalSTRS shall give, or cause to be given, notice of the occurrence of any of the following events with respect to the Bonds, if material, not later than ten (10) business days after the occurrence of the event:
1. Unless described in Section 5(a)(5), adverse tax opinions or other notices or determinations by the Internal Revenue Service with respect to the tax status of the Bonds or other events affecting the tax status of the Bonds;
2. Modifications to rights of the Beneficial Owners or Holders of the Bonds;
3. Optional, unscheduled or contingent bond calls;
4. Release, substitution or sale of property securing repayment of the Bonds;
5. Non-payment related defaults;
6. The consummation of a merger, consolidation, or acquisition involving an Obligated Person or the sale of all or substantially all of the assets of the Obligated Person, other than in the ordinary course of business, the entry into a definitive agreement to undertake such an action or the termination of a definitive agreement relating to any such actions, other than pursuant to its terms;
7. Appointment of a successor or additional trustee/fiscal agent or the change of name of a trustee/fiscal agent; or
8. Incurrence of a Financial Obligation, or agreement to covenants, events of default, remedies, priority rights, or other similar terms of a Financial Obligation, any of which affect holders of the Bonds.
H-4

(c) Whenever CalSTRS obtains knowledge of the occurrence of a Listed Event described in Section 5(b) hereof, CalSTRS shall determine if such event would be material under applicable federal securities laws.
(d) If CalSTRS learns of an occurrence of a Listed Event described in Section 5(a) hereof, or determines that knowledge of a Listed Event described in Section 5(b) hereof would be material under applicable federal securities laws, CalSTRS shall within ten (10) business days of such occurrence file a notice of such occurrence with the MSRB through the EMMA System in electronic format, accompanied by such identifying information as is prescribed by the MSRB. Notwithstanding the foregoing, notice of the Listed Event described in Sections 5(a)(7) or 5(b)(3) need not be given under this subsection any earlier than the notice (if any) of the underlying event is given to Beneficial Owners and Holders of the affected Bonds pursuant to the Trust Agreement.
Section 6. Termination of Reporting Obligation. CalSTRS’s obligations under this Certificate shall terminate with respect to any Bonds upon the legal defeasance, prior redemption or payment of amounts fully sufficient to pay and discharge such Bonds, or upon delivery to the Dissemination Agent (if other than CalSTRS) of an opinion of nationally recognized bond counsel to the effect that continuing disclosure is no longer required.
Section 7. Dissemination Agent. From time to time, CalSTRS may appoint or engage a Dissemination Agent to assist it in carrying out its obligations under this Certificate, and may discharge any such Dissemination Agent, with or without appointing a successor Dissemination Agent. The Dissemination Agent (if other than CalSTRS) shall be entitled to reasonable compensation for its services hereunder and reimbursement of its out of pocket expenses (including, but not limited to, reasonable attorneys’ fees). The Dissemination Agent (if other than CalSTRS) shall not be responsible in any manner for the content of any notice or report prepared by CalSTRS pursuant to this Certificate.
Section 8. Amendment Waiver. Notwithstanding any other provision of this Certificate, CalSTRS may amend this Certificate, and any provision of this Certificate may be waived, provided that all of the following conditions are satisfied:
(a) If the amendment or waiver relates to the provisions of Sections 3(a), 4 or 5 hereof, it may only be made in connection with a change in circumstances that arises from a change in legal (including regulatory) requirements, change in law (including rules or regulations) or in interpretations thereof, or change in the identity, nature or status of an Obligated Person with respect to the Bonds, or the type of business conducted thereby;
(b) The undertaking, as amended or taking into account such waiver, would, in the opinion of nationally recognized bond counsel, have complied with the requirements of the Rule at the time of the original issuance of the Bonds, after taking into account any amendments or interpretations of the Rule, as well as any change in circumstances; and
(c) The amendment or waiver either (i) is approved by the Beneficial Owners of the Bonds in the same manner as provided in the Trust Agreement for amendments to the Trust Agreement with the consent of Beneficial Owners, or (ii) does not, in the opinion of nationally recognized bond counsel, materially impair the interests of the Beneficial Owners of the Bonds.
In the event of any amendment or waiver of a provision of this Certificate, CalSTRS shall describe such amendment in the next Annual Report, and shall include, as applicable, a narrative explanation of the reason for the amendment or waiver and its impact on the type (or in the case of a
H-5

change of accounting principles, on the presentation) of financial information or operating data being presented by CalSTRS. In addition, if the amendment relates to the accounting principles to be followed in preparing financial statements, (i) notice of such change shall be given in the same manner as for a Listed Event under Section 5(e) hereof, and (ii) the Annual Report for the year in which the change is made should present a comparison (in narrative form and also, if feasible, in quantitative form) between the financial statements as prepared on the basis of the new accounting principles and those prepared on the basis of the former accounting principles.
Section 9. Additional Information. Nothing in this Certificate shall be deemed to prevent CalSTRS from disseminating any other information, using the means of dissemination set forth in this Certificate or any other means of communication, or including any other information in any Annual Report or notice of occurrence of a Listed Event, in addition to that which is required by this Certificate. If CalSTRS chooses to include any information in any Annual Report or notice of occurrence of a Listed Event in addition to that which is specifically required by this Certificate, CalSTRS shall have no obligation under this Certificate to update such information or include it in any future Annual Report or notice of occurrence of a Listed Event.
Section 10. Default. In the event of a failure of CalSTRS to comply with any provision of this Certificate, any Holder or Beneficial Owner of the Bonds may take such actions as may be necessary and appropriate, including seeking mandate or specific performance by court order, to cause CalSTRS or the Dissemination Agent (if other than CalSTRS), as the case may be, to comply with its obligations under this Certificate. A default under this Certificate shall not be deemed a default under the Trust Agreement and the sole remedy under this Certificate in the event of any failure of CalSTRS or the Dissemination Agent (if other than CalSTRS) to comply with this Certificate shall be an action to compel performance. Under no circumstances shall any person or entity be entitled to recover monetary damages hereunder in the event of any failure of CalSTRS or the Dissemination Agent (if other than CalSTRS) to comply with this Certificate. No Holder or Beneficial Owner of the Bonds may institute such action, suit or proceeding to compel performance unless they shall have first delivered to CalSTRS satisfactory written evidence of their status as such, and a written notice of and request to cure such failure, and CalSTRS shall have refused to comply therewith within a reasonable time.
Section 11. Duties, Immunities and Liabilities of Dissemination Agent. The Dissemination Agent shall have only such duties as are expressly and specifically set forth in this Certificate, and CalSTRS agrees to indemnify and save the Dissemination Agent, its officers, directors, employees and agents, harmless against any claims, losses, expenses and liabilities which such Dissemination Agent may incur arising out of or in the exercise or performance of the powers and duties given to the Dissemination Agent hereunder, including the costs and expenses (including reasonable attorneys’ fees) of defending, in any manner or forum, against any claim of liability, but excluding liabilities due to the Dissemination Agent’s negligence or willful misconduct, subject to the provisions of the Trust Agreement. The obligations of CalSTRS under this Section shall survive resignation or removal of the Dissemination Agent and payment of the Bonds.
Section 12. Beneficiaries. This Certificate shall inure solely to the benefit of CalSTRS, the Dissemination Agent (if other than CalSTRS), the Participating Underwriters and the Holders and Beneficial Owners from time to time of the Bonds, and shall create no rights in any other person or entity.
Section 13. Partial Invalidity. If any one or more of the agreements or covenants or portions thereof required hereby to be performed by or on the part of CalSTRS shall be contrary to law, then such agreement or agreements, such covenant or covenants or such portions thereof shall be null and void and shall be deemed separable from the remaining agreements and covenants or portions thereof and shall in no way affect the validity hereof, and the Beneficial Owners of the Bonds shall retain all the benefits
H-6
afforded to them hereunder. CalSTRS hereby declares that it would have executed and delivered this Certificate and each and every other article, section, paragraph, subdivision, sentence, clause and phrase hereof irrespective of the fact that any one or more articles, sections, paragraphs, subdivisions, sentences, clauses or phrases hereof or the application thereof to any person or circumstance may be held to be unconstitutional, unenforceable or invalid.
Section 14. Governing Law. This Certificate shall be governed by, interpreted and enforced in accordance with the laws of the State of California, without regard to conflict of law principles. Any litigation, action or proceeding to enforce or interpret any provision of this Certificate or otherwise arising out of, or relating to this Certificate, shall be brought, commenced or prosecuted in a State or Federal court in the County of Sacramento in the State of California. By its acceptance of the benefits hereof, any person or entity bringing any such litigation, action or proceeding submits to the exclusive jurisdiction of the State of California and waives any defense of forum non conveniens.
IN WITNESS WHEREOF, the undersigned has hereunto signed and executed this Continuing Disclosure Certificate this 19th day of December, 2019.
CALIFORNIA STATE TEACHERS’ RETIREMENT SYSTEM
By Chief Financial Officer
H-7

EXHIBIT A
NOTICE TO MUNICIPAL SECURITIES RULEMAKING BOARD OF FAILURE TO FILE ANNUAL REPORT
Name of Issuer: California Infrastructure and Economic Development Bank
Name of Bond Issue: Lease Revenue Bonds (California State Teachers’ Retirement System Headquarters Expansion), Series 2019 (Green Bonds - Climate Bond Certified)
Name of Obligated Person: California State Teachers’ Retirement System
Date of Issuance: December 19, 2019
NOTICE IS HEREBY GIVEN that the California State Teachers’ Retirement System has not provided an Annual Report with respect to the above-named Bonds as required by Section 3 of the Continuing Disclosure Certificate, dated December __, 2019, by CalSTRS. CalSTRS anticipates that the Annual Report will be filed by __________, 20__.
Dated: _______________.
California State Teachers’ Retirement System
By Authorized Representative
H-8

I-1
APPENDIX I
BOOK-ENTRY ONLY SYSTEM FOR THE BONDS
Introduction
Unless otherwise noted, the information contained under the caption “—General” below has been provided by DTC. Neither CalSTRS nor the Infrastructure Bank makes any representation as to the accuracy or the completeness of such information. The Beneficial Owners of the Bonds should confirm the following information with DTC, the Direct Participants or the Indirect Participants.
NEITHER THE INFRASTRUCTURE BANK NOR THE TRUSTEE WILL HAVE ANY RESPONSIBILITY OR OBLIGATION TO DIRECT PARTICIPANTS, TO INDIRECT PARTICIPANTS, OR TO ANY BENEFICIAL OWNER WITH RESPECT TO (A) THE ACCURACY OF ANY RECORDS MAINTAINED BY DTC, ANY DIRECT PARTICIPANT, OR ANY INDIRECT PARTICIPANT; (B) ANY NOTICE THAT IS PERMITTED OR REQUIRED TO BE GIVEN TO THE OWNERS OF THE BONDS UNDER THE TRUST AGREEMENT, (C) THE SELECTION BY DTC OR ANY DIRECT PARTICIPANT OR INDIRECT PARTICIPANT OF ANY PERSON TO RECEIVE PAYMENT IN THE EVENT OF A PARTIAL REDEMPTION OF THE BONDS; (D) THE PAYMENT BY DTC OR ANY DIRECT PARTICIPANT OR INDIRECT PARTICIPANT OF ANY AMOUNT WITH RESPECT TO THE PRINCIPAL OR INTEREST DUE TO THE OWNERS OF THE BONDS; (E) ANY CONSENT GIVEN OR OTHER ACTION TAKEN BY DTC AS THE OWNERS OF BONDS; OR (F) ANY OTHER MATTER REGARDING DTC.
General
DTC will act as securities depository for the Bonds. The Bonds will be issued as fully-registered securities registered in the name of Cede & Co. (DTC’s partnership nominee) or such other name as may be requested by an authorized representative of DTC. One fully registered Bond certificate will be issued for each maturity of the Bonds, each in the aggregate principal amount of such maturity, and will be deposited with DTC.
DTC, the world’s largest securities depository, is a limited-purpose trust company organized under the New York Banking Law, a “banking organization” within the meaning of the New York Banking Law, a member of the Federal Reserve System, a “clearing corporation” within the meaning of the New York Uniform Commercial Code, and a “clearing agency” registered pursuant to the provisions of Section 17A of the Securities Exchange Act of 1934, as amended. DTC holds and provides asset servicing for over 3.5 million issues of U.S. and non-U.S. equity issues, corporate and municipal debt issues, and money market instruments (from over 100 countries) that DTC’s participants (“Direct Participants”) deposit with DTC. DTC also facilitates the post-trade settlement among Direct Participants of sales and other securities transactions in deposited securities, through electronic computerized book-entry transfers and pledges between Direct Participants’ accounts. This eliminates the need for physical movement of securities certificates. Direct Participants include both U.S. and non-U.S. securities brokers and dealers, banks, trust companies, clearing corporations, and certain other organizations. DTC is a wholly-owned subsidiary of The Depository Trust & Clearing Corporation (“DTCC”). DTCC is the holding company for DTC, National Securities Clearing Corporation and Fixed Income Clearing Corporation, all of which are registered clearing agencies. DTCC is owned by the users of its regulated subsidiaries. Access to the DTC system is also available to others such as both U.S. and non-U.S. securities brokers and dealers, banks, trust companies, and clearing corporations that clear through or maintain a custodial relationship with a Direct Participant, either directly or indirectly (“Indirect Participants”). DTC has a Standard & Poor’s rating of AA+. The DTC Rules applicable to Participants are on file with the Securities and Exchange Commission. More information about DTC can be found at www.dtcc.com.

I-2
Purchases of the Bonds under the DTC system must be made by or through Direct Participants, which will receive a credit for the Bonds on DTC’s records. The ownership interest of each actual purchaser of each Bond (“Beneficial Owner”) is in turn to be recorded on the Direct and Indirect Participants’ records. Beneficial Owners will not receive written confirmation from DTC of their purchase. Beneficial Owners are, however, expected to receive written confirmations providing details of the transaction, as well as periodic statements of their holdings, from the Direct or Indirect Participant through which the Beneficial Owner entered into the transaction. Transfers of ownership interests in the Bonds are to be accomplished by entries made on the books of Direct and Indirect Participants acting on behalf of Beneficial Owners. Beneficial Owners will not receive certificates representing their ownership interests in the Bonds, except in the event that use of the book-entry system for the Bonds is discontinued.
To facilitate subsequent transfers, all Bonds deposited by Direct Participants with DTC are registered in the name of DTC’s partnership nominee, Cede & Co. or such other name as may be requested by an authorized representative of DTC. The deposit of Bonds with DTC and their registration in the name of Cede & Co. or such other DTC nominee do not affect any change in beneficial ownership. DTC has no knowledge of the actual Beneficial Owners of the Bonds; DTC’s records reflect only the identity of the Direct Participants to whose accounts such Bonds are credited, which may or may not be the Beneficial Owners. The Direct and Indirect Participants will remain responsible for keeping account of their holdings on behalf of their customers.
Conveyance of notices and other communications by DTC to Direct Participants, by Direct Participants to Indirect Participants, and by Direct Participants and Indirect Participants to Beneficial Owners will be governed by arrangements among them, subject to any statutory or regulatory requirements as may be in effect from time to time. Beneficial Owners of Bonds may wish to take certain steps to augment the transmission to them of notices of significant events with respect to the Bonds, such as redemptions, tenders, defaults and proposed amendments to the Bond documents. For example, Beneficial Owners of Bonds may wish to ascertain that the nominee holding the Bonds for their benefit has agreed to obtain and transmit notices to Beneficial Owners. In the alternative, Beneficial Owners may wish to provide their names and addresses to the registrar and request that copies of the notices be provided directly to them.
While the Bonds are in the book-entry-only system, redemption notices will be sent to DTC. If less than all of the Bonds of a maturity are being redeemed, DTC’s practice is to determine by lot the amount of the interest of each Direct Participant in such issue to be redeemed.
Neither DTC nor Cede & Co. (nor any other DTC nominee) will consent or vote with respect to the Bonds unless authorized by a Direct Participant in accordance with DTC’s MMI Procedures. Under its usual procedures, DTC mails an Omnibus Proxy to the Infrastructure Bank as soon as possible after the record date. The Omnibus Proxy assigns Cede & Co.’s consenting or voting rights to those Direct Participants to whose accounts the Bonds are credited on the record date (identified in a listing attached to the Omnibus Proxy).
Principal and interest payments on the Bonds will be made to Cede & Co., or such other nominee as may be requested by an authorized representative of DTC. DTC’s practice is to credit Direct Participants’ accounts upon DTC’s receipt of funds and corresponding detail information from the Infrastructure Bank, the Trustee on the payable date in accordance with their respective holdings shown on DTC’s records. Payments by Participants to Beneficial Owners will be governed by standing instructions and customary practices, as is the case with securities held for the accounts of customers in bearer form or registered in “street name,” and will be the responsibility of such Participant and not of DTC, the Trustee or the Infrastructure Bank, subject to any statutory or regulatory requirements as may be in effect from time to time. Payment of principal and interest payments to Cede & Co. (or such other nominee as may be requested by an authorized representative of DTC) is the responsibility of the Infrastructure Bank or the Trustee, disbursement of such payments to Direct Participants will be the responsibility of DTC, and disbursement of such payments to the Beneficial Owners will be the responsibility of Direct and Indirect Participants.

I-3
DTC may discontinue providing its services as depository with respect to the Bonds at any time by giving reasonable notice to the Infrastructure Bank or the Trustee. Under such circumstances, in the event that a successor depository is not obtained, certificates representing the Bonds are required to be printed and delivered.
The Infrastructure Bank may decide to discontinue use of the system of book-entry-only transfers through DTC (or a successor securities depository). In that event, certificates representing the Bonds will be printed and delivered to DTC.
The information in this Appendix I concerning DTC and DTC’s book-entry system has been obtained from sources that CalSTRS and the Infrastructure Bank believe to be reliable, but CalSTRS, the Infrastructure Bank and the Underwriters do not take any responsibility for the accuracy thereof.
BENEFICIAL OWNERS WILL NOT RECEIVE PHYSICAL DELIVERY OF BONDS AND WILL NOT BE RECOGNIZED BY THE TRUSTEE AS OWNERS THEREOF, AND BENEFICIAL OWNERS WILL BE PERMITTED TO EXERCISE THE RIGHTS OF OWNERS ONLY INDIRECTLY THROUGH DTC AND THE DTC PARTICIPANTS.

[THIS PAGE INTENTIONALLY LEFT BLANK]

APPENDIX J
LETTERS SUBMITTED BY UNDERWRITERS

[THIS PAGE INTENTIONALLY LEFT BLANK]

ACADEMY�SECURITIES,�INC.�
J-1

J-2

November 8, 2019
Mr. Blake Fowler
Director, Public Finance Division
Office of the Treasurer of the State of California
915 Capitol Mall, Room 261
Sacramento, CA 95814
RE: California Infrastructure and Economic Development Bank Lease Revenue Bonds
(California State Teachers’ Retirement System Headquarters Expansion) Series 2019 (Green
Bonds – Climate Certified) Sale (the “Bonds”)
Dear Mr. Fowler:
Morgan Stanley & Co. LLC is providing the following language for inclusion in the Official
Statement.
Morgan Stanley & Co. LLC, an underwriter of the Bonds, has entered into a retail distribution
arrangement with its affiliate Morgan Stanley Smith Barney LLC. As part of this arrangement,
Morgan Stanley & Co. LLC may distribute municipal securities to retail investors through the
financial advisor network of Morgan Stanley Smith Barney LLC. As part of this arrangement,
Morgan Stanley & Co. LLC may compensate Morgan Stanley Smith Barney LLC for its
selling efforts with respect to the Bonds.
Morgan Stanley & Co. LLC
CC: Julie Underwood, California State Teachers’ Retirement System
Nancee Robles, California Infrastructure and Economic Development Bank
J-3

November 13, 2019 To: Mr. Blake Fowler
Director, Public Finance Division Office of the Treasurer of the State of California 915 Capitol Mall Sacramento, CA 95814
Re: California State Teachers' Retirement System Lease Revenue Bonds, Series 2019
Dear Mr. Fowler,
UBS Financial Services Inc. ("UBS FSI") has entered into a distribution and service agreement with its affiliate UBS Securities LLC ("UBS Securities") for the distribution of certain municipal securities offerings. UBS FSI would like to utilize this agreement in connection with the offering and sale of the California State Teachers' Retirement System Lease Revenue Bonds, Series 2019 (the "Bonds"). If utilized, UBS FSI would share a portion of its underwriting compensation with respect to the Bonds with UBS Securities. If you consent to the use of this agreement in connection with the above referenced transaction, please indicate such consent in a response to this email. UBS FSI and UBS Securities are each subsidiaries of UBS Group AG.
If your consent is provided, we would request that the following disclosure be added to the offering document for this transaction:
"UBS Financial Services Inc. ("UBS FSI"), [one of the underwriters] of the Bonds, has entered into a distribution and service agreement with its affiliate UBS Securities LLC ("UBS Securities") for the distribution of certain municipal securities offerings, including the Bonds. Pursuant to such agreement, UBS FSI will share a portion of its underwriting compensation with respect to the Bonds with UBS Securities. UBS FSI and UBS Securities are each subsidiaries of UBS Group AG."
UBS Financial Services Inc.
J-4

�
November 7, 2019
Mr. Blake Fowler
Director of Public Finance
Office of the Treasurer of the State of California
915 Capitol Mall, Room 261
Sacramento, California 95814
Regarding: CIEDB (California State Teachers’ Retirement System Headquarters Expansion) Series 2019
(Green Bonds)
Dear Mr. Fowler,
280 Securities LLC (“280”) is providing the following language for inclusion in the Official
Statement for the above referenced bond issue.
280, an underwriter of the proposed bond issue, has entered into a retail distribution agreement with
TD Ameritrade.
The agreement permits TD Ameritrade to distribute bonds underwritten by or allocated to 280.
Under the terms of the agreement, 280 will share compensation with TD Ameritrade for TD
Ameritrade’s sale of bonds.
Eureka,
280 Securities LLC
415-915-4600 575 Market St, Ste. 3800 280CapMarkets.com San Francisco, CA 94105
J-5

[THIS PAGE INTENTIONALLY LEFT BLANK]


CA
LIF
OR
NIA
INF
RA
ST
RU
CT
UR
E A
ND
EC
ON
OM
IC D
EV
EL
OP
ME
NT
BA
NK
• LE
AS
E RE
VE
NU
E BO
ND
S (CA
LIF
OR
NIA S
TA
TE T
EA
Ch
ER
S’ RE
TIR
EM
EN
T Sy
ST
EM
hE
AD
qU
AR
TE
RS E
xP
AN
SIO
N), SE
RIE
S 2019